
The Effects of Infectious Diseases on the Consequences of Interspecific Competition in Grassland Communities

1
Pratacultural College, Gansu Agricultural University, Lanzhou 730070, China
2
Key Laboratory of Grassland Ecosystem, Ministry of Education, Lanzhou 730070, China
3
Center for Quantitative Biology, College of Science, Gansu Agricultural University, Lanzhou 730070, China
4
College of Forestry, Gansu Agricultural University, Lanzhou 730070, China
5
CAS Key Laboratory of Tropical Forest Ecology, Xishuangbanna Tropical Botanical Garden, Chinese Academy of Sciences, Mengla 666303, China
*
Authors to whom correspondence should be addressed.
Diversity 2024, 16(4), 231; https://doi.org/10.3390/d16040231
Submission received: 4 February 2024
/
Revised: 7 April 2024
/
Accepted: 10 April 2024
/
Published: 12 April 2024
Abstract
:As infectious diseases have a severe impact on the individual survival and competitive ability of host species in grassland communities, competition between relevant species may have different consequences, potentially influencing the species composition of grassland communities and the functioning of grassland ecosystems. Understanding the impact of infectious diseases on competition is thus crucial for the health management of grassland ecosystems. How do infectious diseases affect the competitive coexistence of grassland plant species? In this study, by drawing on Tilman’s multispecies competition model and incorporating the spread characteristics of grassland plant diseases, we built three spatial competition models of two grass species subject to infectious diseases, and we analyzed the invasion conditions of infectious diseases and how they impact the population dynamics and competitive consequences of the species. Our model revealed the following: (1) Diseases with high transmission rates and low virulence are more likely to invade populations, while the presence of non-host species is detrimental to disease invasion. (2) Disease promotes the coexistence of competing species, breaking down the original competition–compromise trade-off mechanism for species coexistence and greatly expanding the range of parameters within which the two species can coexist. (3) Pathogen infections indirectly weaken the suppression of inferior species by dominant species, which is similar to the cascade effect seen in trophic interactions. Our findings highlight the importance of disease in species coexistence and grassland biodiversity maintenance.
1. Introduction
Grasslands are widespread worldwide, covering a total area of 52.54 million square kilometers or nearly 40% of Earth’s land surface [1]. As one of the most important terrestrial ecosystems, grasslands play an important role in biodiversity conservation, soil protection, and carbon storage [2,3,4,5]. However, in recent years, global biosecurity risks have become increasingly serious, with the frequent occurrence of major new and emerging infectious diseases and plant and animal epidemics, leading to a large-scale loss of biodiversity [6,7]. The impact of infectious diseases on grassland ecosystems is also a growing concern [8,9,10,11].
Plant pathogens (fungi, oomycetes, bacteria, and viruses) are present in all grassland ecosystems and can be transmitted horizontally within and between species by soil, air, water, and insect vectors [12] or vertically between parents and offspring through reproductive and trophic propagation [13,14]. Once a pathogen infects a plant host, it may have positive or negative impacts on their adaptations by affecting the growth, reproduction, and viability of the host species [15,16], which, in turn, causes changes in the competitive relationships between the host and other non-host species [17,18]. It may also cause the extinction or overpopulation of certain species [19], affecting the use and allocation of ecological niches in the ecosystem, thus having an impact on population density and the spatial distribution of communities [20], which, in turn, affects biodiversity maintenance, as well as ecosystem stability and functioning [21,22,23,24,25]. Therefore, understanding how infectious diseases in grasslands affect the dynamics and outcomes of competition between host and competing populations is important.
Mathematical modeling has become a powerful tool for analyzing population dynamics. Ecoepidemiological models that combine infectious disease dynamics and population dynamics are based on the classical Lotka–Volterra competition model, which examines how infectious diseases affect the interspecific competition and population dynamics of animal species in a predator–prey system [26,27,28,29]. The metapopulation model of multispecies competition proposed by Tilman in 1994 [30] is a classical and simple spatial model that predicts that an infinite number of species with different competitive abilities can coexist, and it uses spatial partitioning to explain how habitats such as grassland communities can achieve a high level of diversity through interspecific trade-offs. Therefore, a multispecies competition model that considers spatial structure is more suitable for describing the population dynamics of grassland communities. To accurately construct an ecological infectious disease model, the key is to accurately grasp the transmission characteristics of grassland infectious diseases.
In general, it is difficult for plants to recover on their own after infection [31]; therefore, it is more suitable to consider SI (susceptible–infected) epidemics. In addition, along with horizontal transmission, this study pays special attention to the vertical transmission of diseases. We found that the transmission of infectious diseases in grasslands can be broadly divided into three categories: Type I, where the infected plant is incapable of reproduction (infections that kill the host quickly are classified in this category); Type II, where the diseased plant still reproduces but does not vertically transmit the pathogen to its offspring (i.e., the offspring is healthy); and Type III, where the diseased plant vertically transmits the pathogen to its offspring (i.e., the offspring of the diseased plant is congenitally infected). For example, Alfalfadownymildew reduces the ability of diseased plants to flower or fruit and even causes death in severe cases [32]. Clover Kabatiella anthracnose reduces or even prevents the yield of Trifolium subterraneum L. [33]. Clover flower rot only infects Trifolium pratense L.; in a previous study, infected ovaries fertilized with healthy pollen produced mostly bacterial seeds, but the seeds that developed from reinfected florets that were pollinated normally remained healthy [34]. Seed-borne diseases are prevalent in grass plants, including Grasses ergot, Grasses choke, and Lupine anthracnose, among others [35]. Generally, for plants, pathogens are more likely to infect dominant species than rare species [36,37].
Based on the above background, we start with the competition between two species. While considering horizontal transmission, we combine the three types of vertical transmission mentioned above to discuss the thresholds for different types of diseases to invade the host population under the SI framework, and we answer the following question: how do different types of diseases affect the competitive relationship between host and non-host species?
2. Materials and Methods
2.1. Spatial Competition Model without Infection
In the two-species competition model proposed by Tilman in 1994 [30], which has a competitive hierarchy, it is assumed that species 1 has a higher competitive ability than species 2 and that both species live in a spatially separated patch habitat. Competition can only occur within the patch, and the superior competitor on the patch occupied by the two species always displaces the inferior competitor. Therefore, each patch can be occupied by at most one species; that is, two species cannot coexist. Patches are linked by the migration of individuals, and empty patches can be encroached upon by migrating individuals. A superior competitor can displace an inferior competitor by encroaching on the patch occupied by the inferior competitor, but the opposite cannot occur. Therefore, the classical model for the description of their interactions is
where and represent the proportion of sites occupied by the superior and inferior competitors (called abundance); and are the colonization rates; and and are the mortality (local extinction) rates, respectively. is the rate of production of the newly colonized sites of species 1. It can be seen that species 1 is completely unaffected by species 2. Additionally, species 1 can not only invade empty patches but can also occupy patches occupied by species 2 (), whereas species 2 can only colonize sites in which both it and species 1 are absent (the term ).
According to the stability analysis of Equation (1) [30], if , then there exists a stable boundary equilibrium point . At this point, the inferior competitor is excluded from the competition, leaving only the superior species to survive. Conversely, if and , then there exists a stable internal equilibrium , where the inferior competitor can invade the superior population, and the two species can coexist. Assuming that both species have the same local population extinction rate, , the coexistence condition becomes ,, i.e., then, we have [30]. This result indicates that, for species 2, which is less competitive, to achieve stable coexistence throughout the region, it must have a stronger ability to invade than species 1, which is more competitive. For the two competing species to coexist at the level of metapopulation, a trade-off between competitive and invasive abilities should occur.
2.2. Modeling Disease Infection of Species Competition
In our research, we focus on the impact of infectious diseases on the species competition system, exploring the dynamic behavior of competing species when infected by diseases. One of the basic models for studying the dynamics of infectious diseases is the SI model [38] (S and I stand for susceptible individuals and infected individuals, respectively). This model is used to describe the situation in which susceptible individuals may be infected but are unable to recover once infected, which is consistent with the transmission characteristics of grass plant diseases in general and can therefore be used to model the transmission dynamics of infectious diseases in grass plants. Next, we couple the SI epidemic models for the three transmission modes described above with the two-species spatial competition model (Equation (1)) to develop three ecological epidemic models.
Assuming that the dominant species is at risk of contracting a particular disease, both horizontal and vertical transmission can cause infections, and pathogen virulence can lead to higher mortality rates in infected individuals. Based on capturing the essence of the problem, the following important assumptions are made to keep the model simple: First, the disease is only transmissible between one species, as species 2 is immune to it. Once infected, the species has no resistance or resilience. Second, the disease weakens host competitiveness, but the infected and the inferior competitors cannot invade each other’s patches; they can only encroach on empty patches. Third, the susceptible superior competitors are unable to change the state of the patch of the infected. The state of each patch can only be one of four cases, namely, occupied by a susceptible superior competitor (abbreviated as the susceptible), occupied by an infected superior competitor (abbreviated as the infected), occupied by an inferior competitor, or an empty patch, denoted as , , , and , respectively, so that . From this, we first model the Type I model of SI (where infected individuals cannot reproduce), whose density over time can be expressed by the following differential equations:
where is the transmission rate, is the mortality rate caused by the infection (toxicity), and is the proportion of patches occupied by the infected. All the other parameters are the same as those in Equation (1). In particular, when and (i.e., no infection), Equation (2) turns back into Equation (1). If we consider the situation without vertical infection (Type II), Equation (2) can be modified as follows:
where ; this portrays the extent to which the colonization capacity of the healthy offspring of the infected is weaker than that of the offspring of the susceptible individuals. is the colonization rate of the infected offspring (the susceptible ), and is the sum of the occupancy rate of empty patches by all susceptible dominant competitors. Here, we assume that the effect of pathogen infestation on reproduction affects only the number of offspring and does not affect other aspects of the quality of the offspring (e.g., genetic characteristics and disease resistance). When , Equation (3) changes back to Equation (2). If the infected can transmit vertically (Type III), the dynamics equations are
where is the colonization rate of the infected offspring (the infected I), and is the occupancy rate of the infected in the empty patch, i.e., the reproductive rate of the vertical transmission of the infected species. It is hypothesized that infection reduces the reproductive capacity of individuals, resulting in a decrease in the number of offspring and ultimately leading to a lower colonization rate in the congenitally infected offspring than in the healthy susceptible offspring, so . In particular, when , Equation (4) changes back to Equation (2).
The three sets of models developed above, coupling the infection dynamics and the competitive processes of the two species, can be used to study the impact of pathogens on the coexistence of competing species. Next, by comparing the evolutionary dynamics of the infected populations (Equations (2)–(4)) and the uninfected populations (Equation (1)), we explore how diseases affect competition and coexistence between the two species under different modes of transmission.
3. Results
3.1. Stability Analysis
Considering the existence of non-negative equilibria and the local stability of Equations (2)–(4), the persistence results for each species are obtained as follows (for the conditions of the existence and stability of each equilibrium point, see the Appendix A):
- (1)
- The disease fails to spread and eventually disappears, at which point it is possible that the inferior competitor becomes extinct and that the superior competitor reaches its environmental carrying capacity of it is also possible that the inferior species successfully invades, so the superior and inferior species eventually coexist stably at a density of .
- (2)
- The disease successfully invades the host and eventually becomes endemic, at which point the inferior competitor may become competitively excluded and eventually bec Please confirm if the bold is unnecessary and can be removed. The following highlights are the same. ome extinct, or it may stably coexist with the susceptible and infected individuals at a density of (the steady-state values are different for each equation; see the supporting material for details).
- (3)
- Only Equation (4) has an extinction risk for the susceptible dominant species: When all hosts are infected, their numbers are close to an environmental capacity of , and the inferior competitor becomes extinct. In contrast, in Equations (2) and (3), the invasion of the pathogen does not directly lead to host extinction, and the equilibrium value for the susceptible individuals, , is always greater than zero.
3.2. Threshold for Disease Invasion
The first and foremost concerns with the issue of an infectious disease are its invasion, persistence, and spread. Based on the different modes of transmission (Equations (2)–(4)), first, we explore the conditions under which infectious diseases can successfully invade populations. This requires the number of infected to be able to increase when a small number of infections initially occur, i.e., the rate of growth of the infected per unit of individuals is greater than zero (), which is calculated as follows:
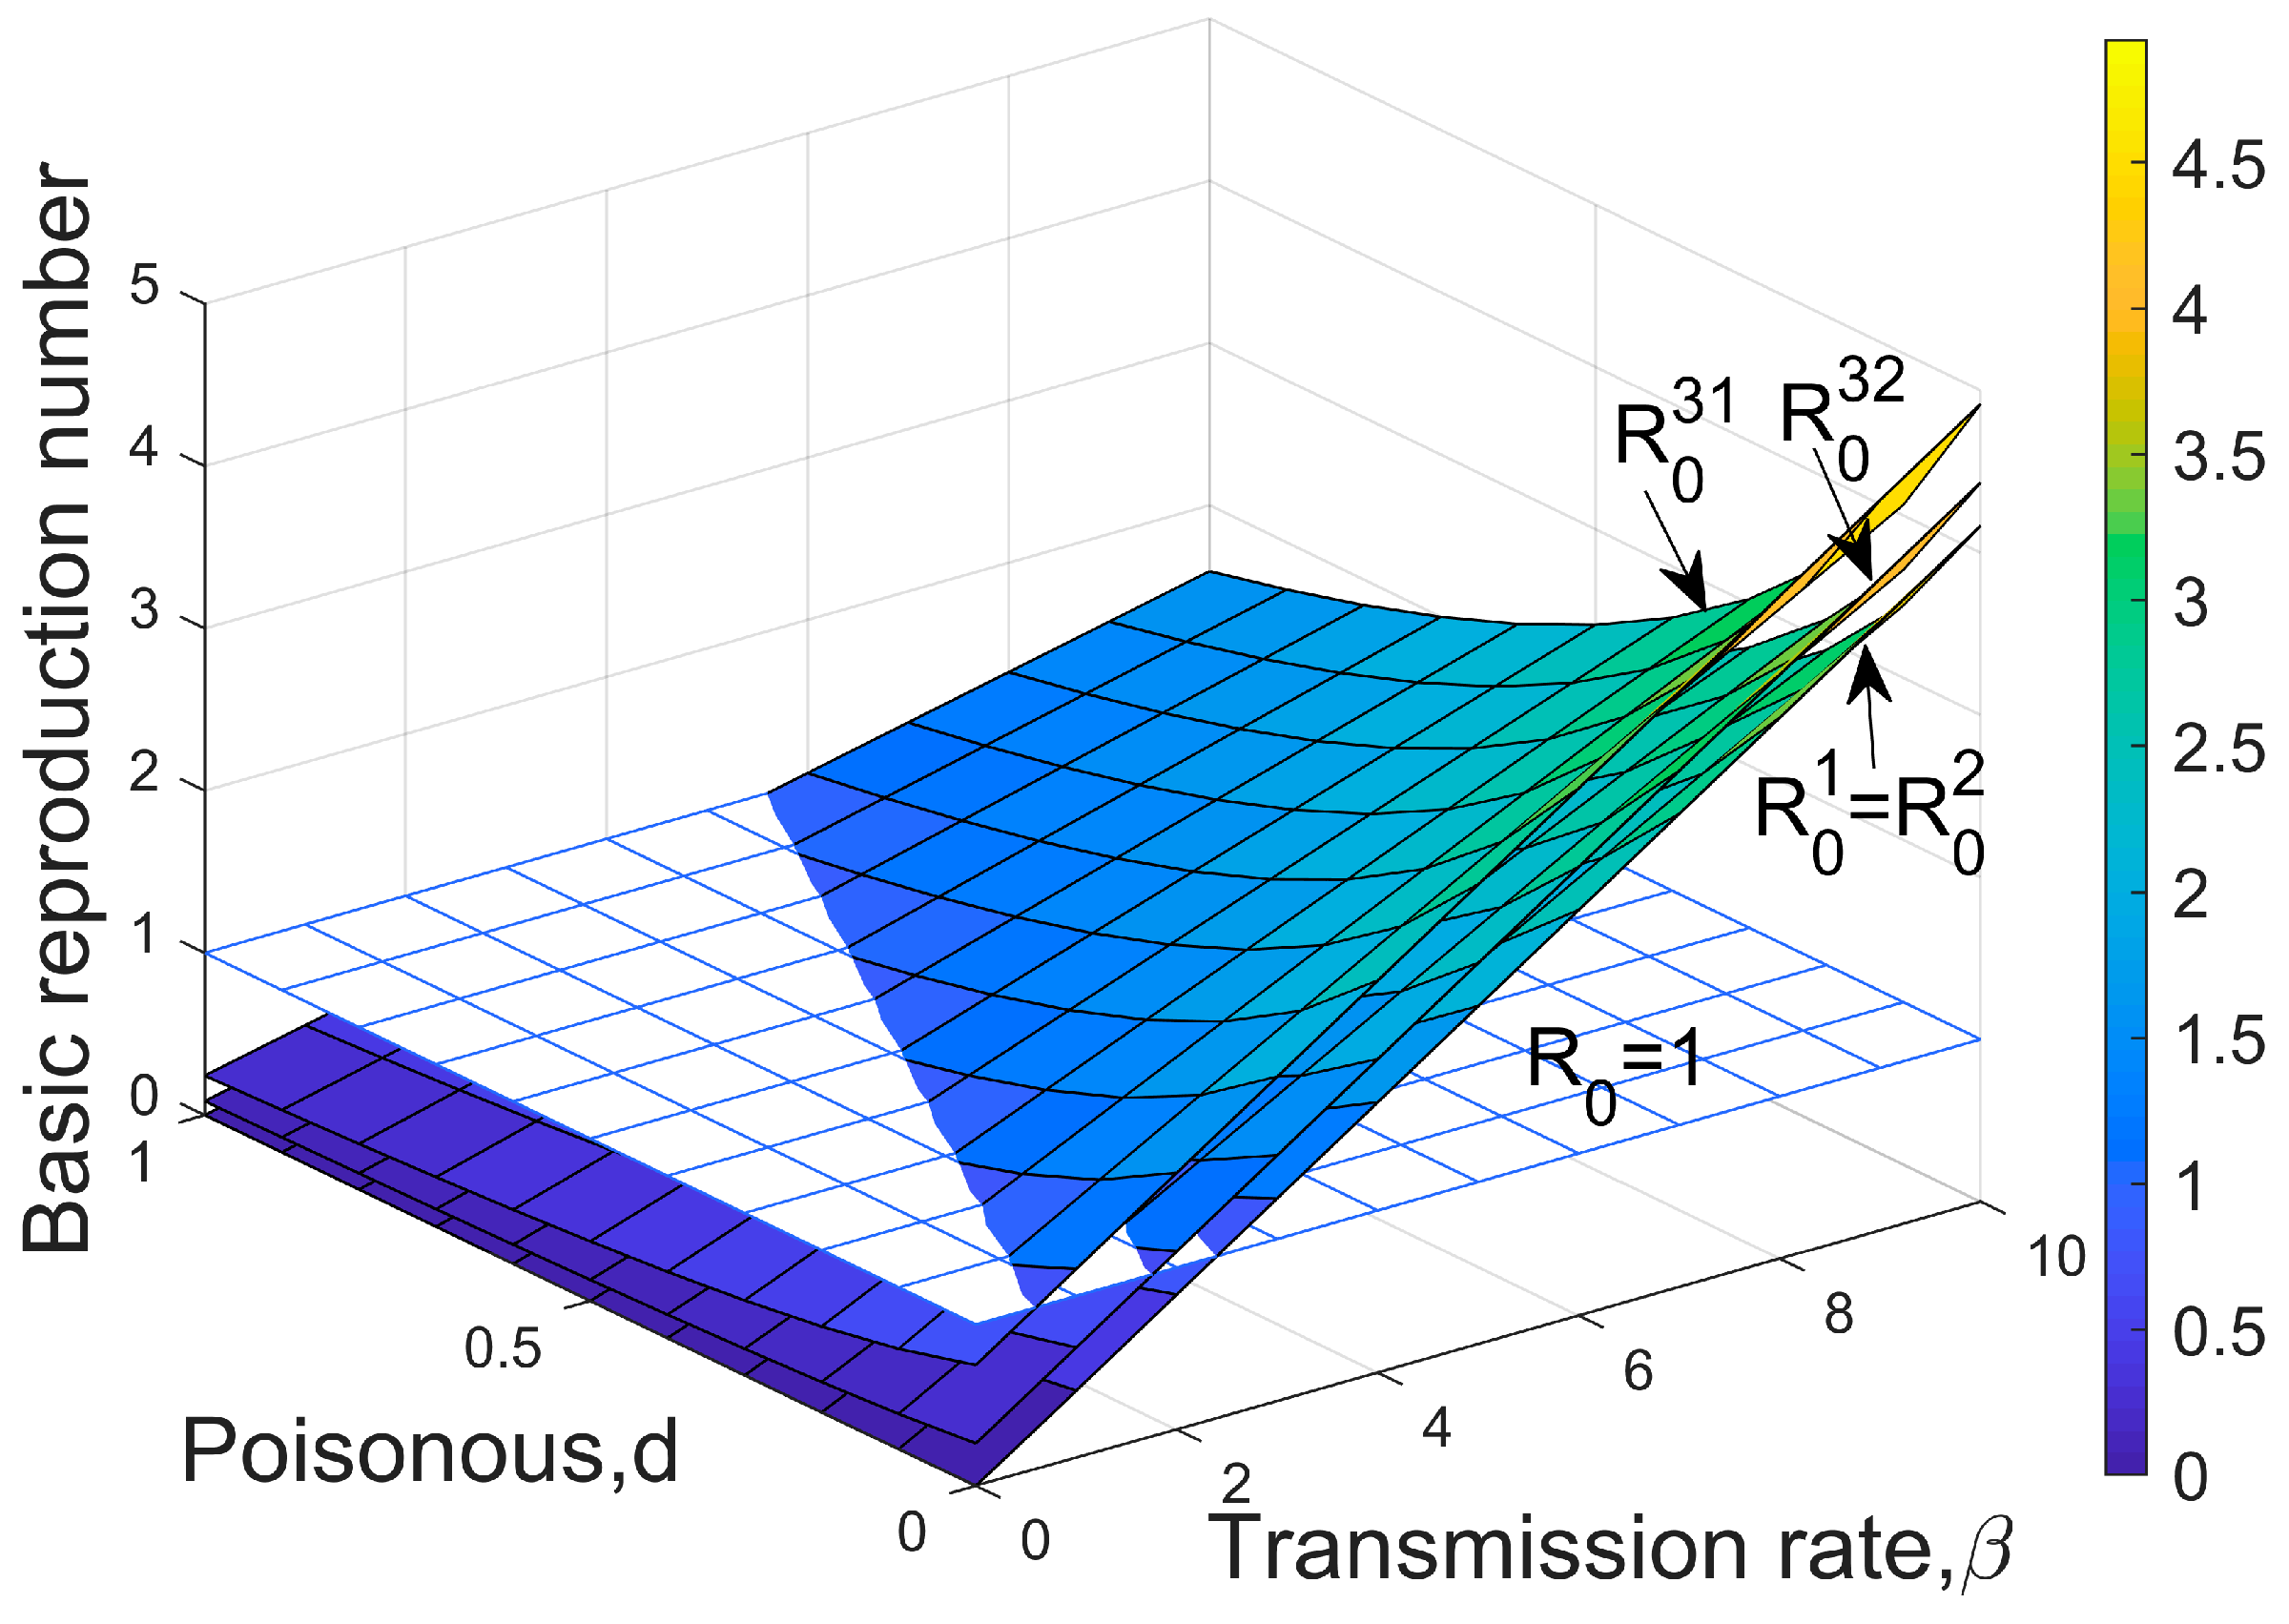
where is the density of susceptible hosts, and is the proportion of the remaining empty plaques before infection ( is the occupancy of empty plaques by congenitally infected individuals). Note that, for the Type I and Type II models, . In inequality 5, it can be seen that the threshold for disease invasion depends on the rate of transmission and the density of susceptible individuals; high transmission rates and a large number of susceptible individuals facilitate the spread of infectious diseases, whereas higher rates of extinction and greater virulence can promote disease resistance (Figure 1). represents the total rate of infection (both horizontal infection and vertical infection), while represents the rate at which the infected individuals are removed (in this case, death, as recovery is not considered in this study). Inequality 5 demonstrates that, for a pathogen to successfully invade, the average number of infected individuals per unit of time () must exceed the average number of deaths of infected individuals (). The average time for an individual to become infected () is shorter than the average length of the disease course of the infected individuals (). By transforming Equation (5) into , we can see that the left side of the inequality represents the basic reproduction number () of the dynamics of infectious diseases. This refers to the number of infections caused by an infected individual during the period of infection, so condition 5 represents the basic condition for an infectious disease outbreak, i.e., .
In Equation (1), before the invasion of the infectious disease, the initial population either consists of only hosts (inferior species have been excluded) or hosts that coexist with their competitors. Assuming that the initial population reaches the stable equilibrium state before infection, its densities are, respectively,
For Type I and Type II, the conditions of disease invasion are the same, and Equation (5) can be rewritten as follows:
where the left side of the inequality describes the number of individuals infected per unit of time through horizontal infection. Transforming inequality 6 results in the corresponding basic reproduction number of Type I and Type II, denoted as and , respectively:
For Type III, when the initial population is species 1 in a steady state, the remaining patch is , and inequality 5 becomes
Correspondingly, the basic reproduction number is denoted as :
If the initial population consists of the two coexisting species, then , and there are
The basic reproduction number is denoted as :
Clearly, the higher the colonization rate of the infected offspring and the greater the number of remaining plaques, the more favorable the spread of the disease. All three modes of transmission show that high transmission rates and low virulence are most conducive to pathogen invasion (Figure 1).
It is worth noting that when , there are , which is also the threshold for the inferior species to invade the dominant species without infection. This suggests that infectious diseases are more likely to invade when there are only hosts than when the two species coexist (Figure 1), i.e., the presence of the host’s competitor is not conducive to pathogen invasion. In addition, comparing the three types of transmission, it is evident that Type III is the most favorable for disease invasion under the same parameter conditions, while Type I and Type II require higher transmission rates or lower toxicity.
3.3. Impact of Infectious Diseases on Competitive Dynamics
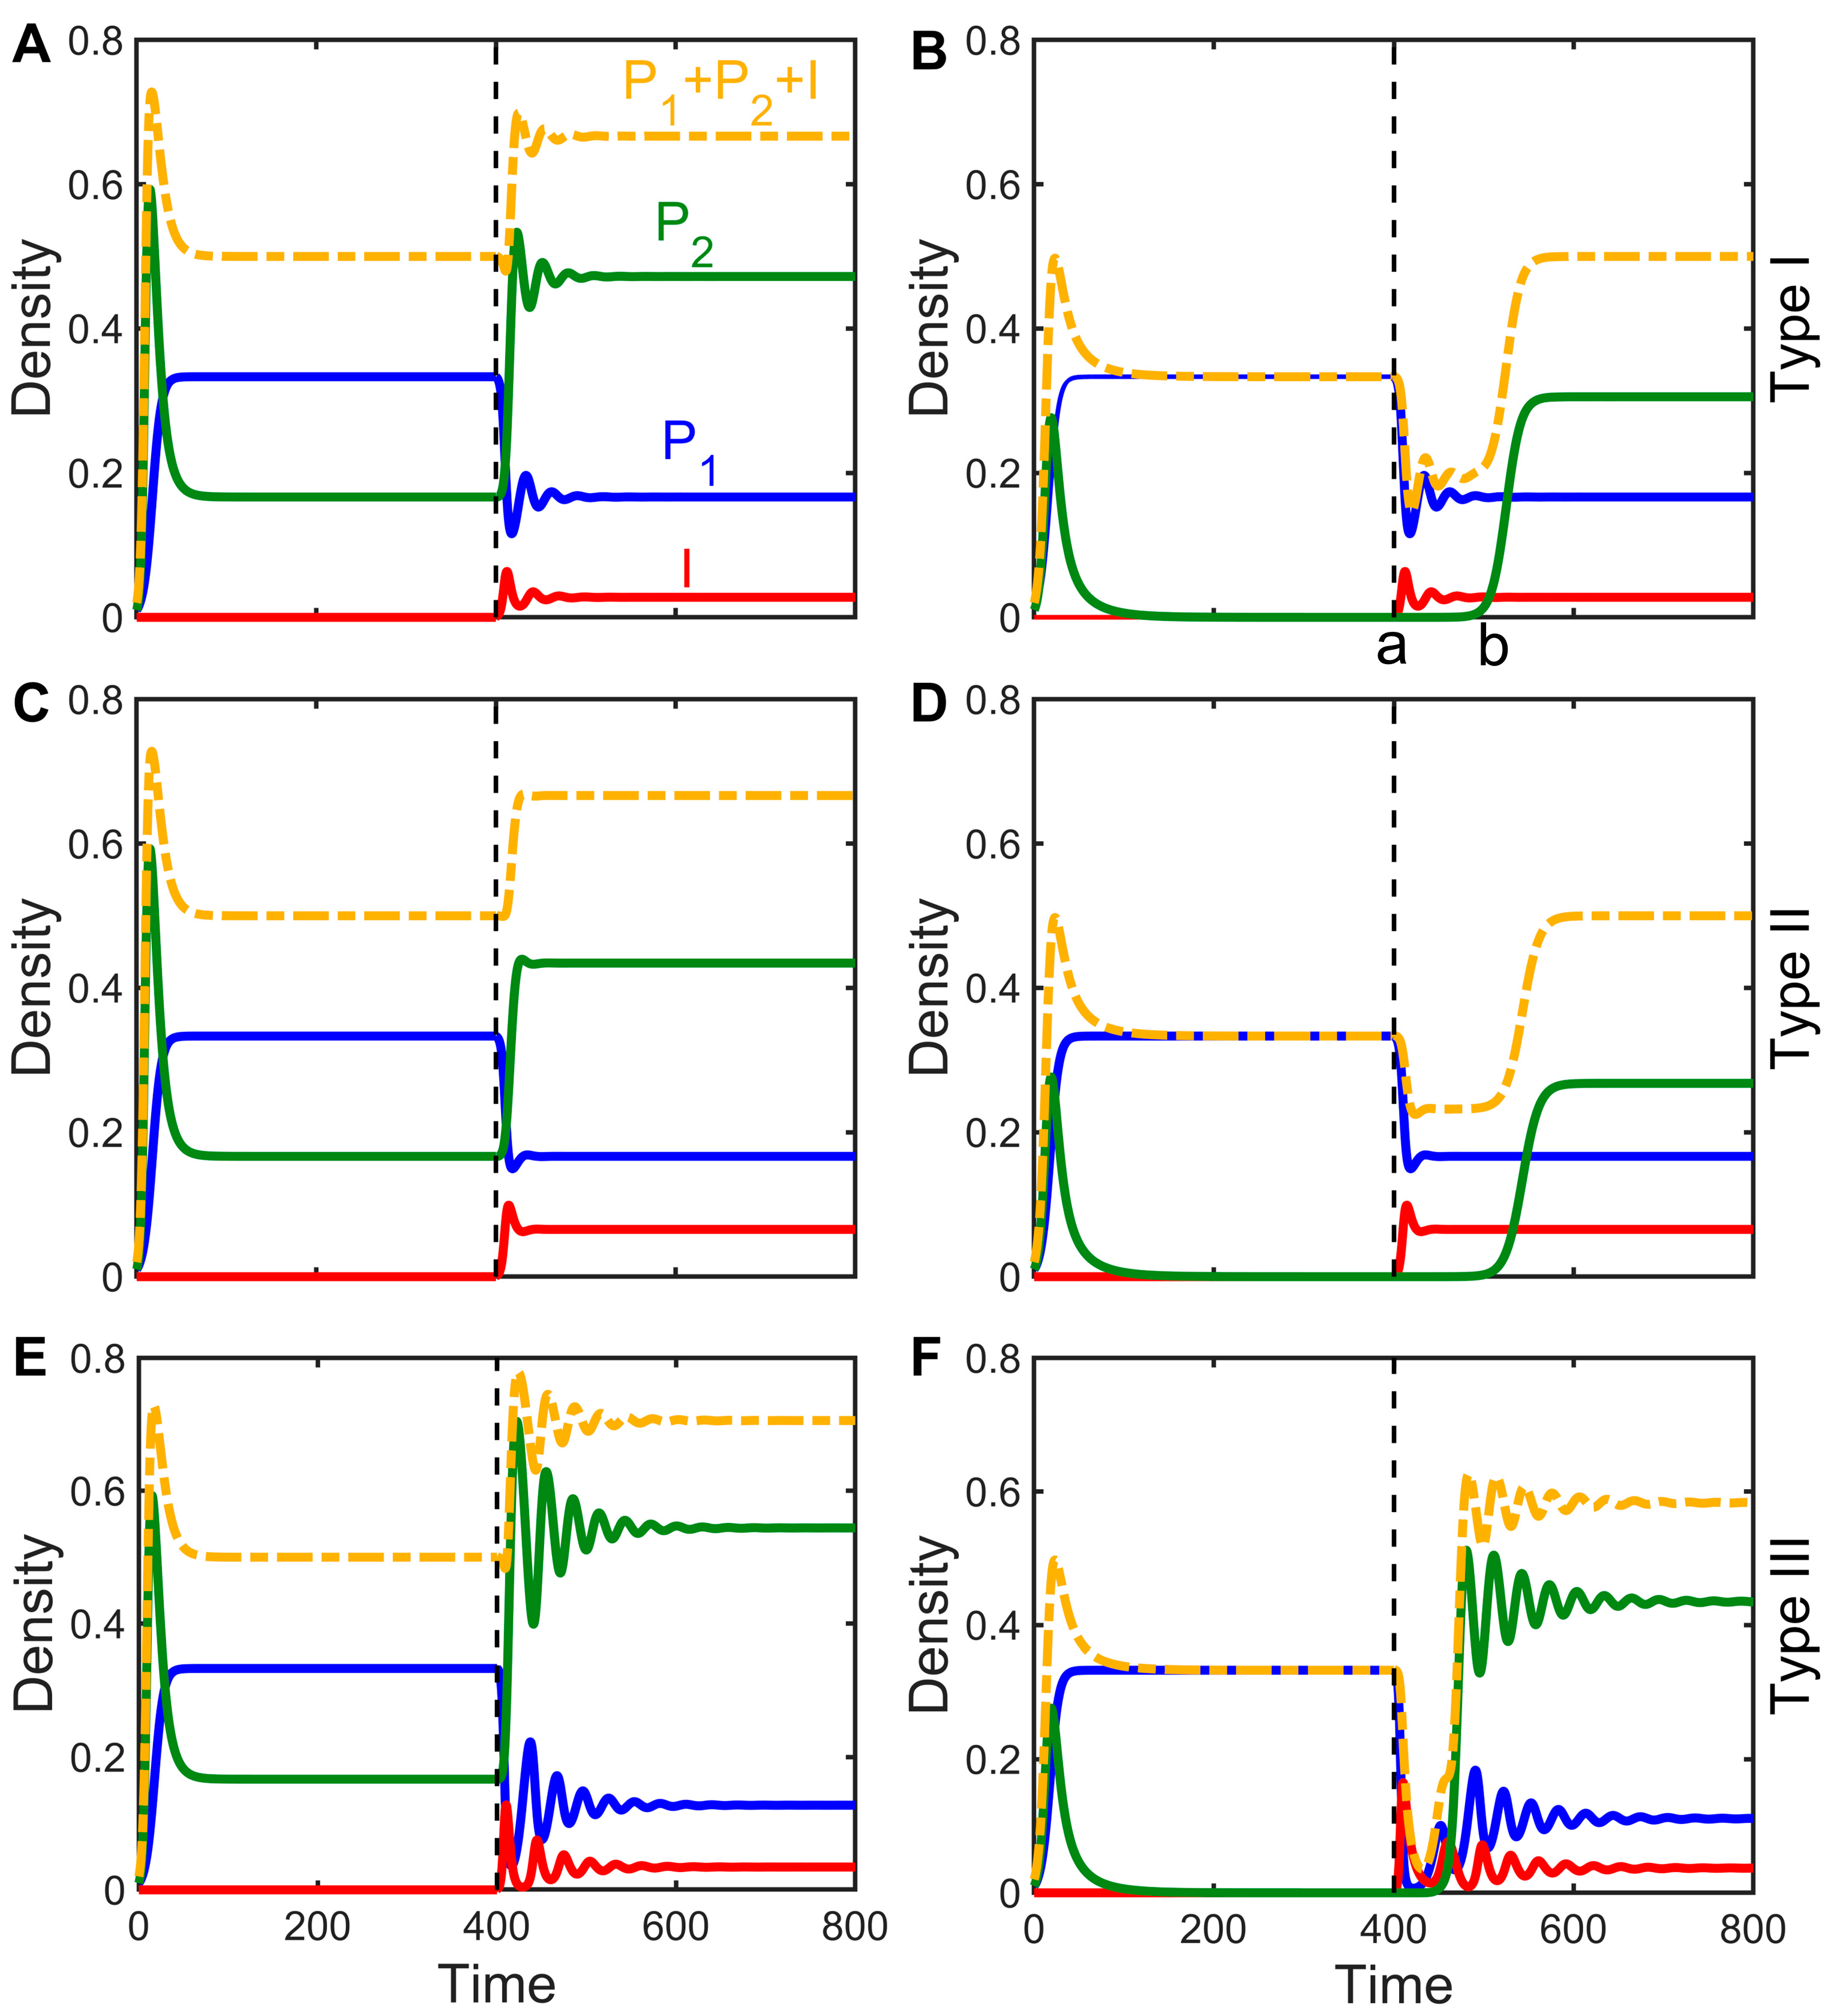
There are only two possible outcomes when a pathogen attempts to invade the host population: failure () or success (). What are the effects on interspecies competitive dynamics and outcomes when pathogens successfully invade grassland communities? According to stability analysis, there are two possible states for the two species without disease: The inferior species is rejected by the superior species, or the two competing species coexist. Through numerical simulations, we investigated the dynamics of the epidemiological model (Equations (2)–(4)) after the invasion of an infectious disease under the two initial states. The results suggest that, in general, regardless of whether the populations are in a state of exclusion or coexistence before infection and regardless of the disease transmission mode (Type I, II, or III), the spread of diseases can promote the evolution of the two species toward coexistence. There are two specific scenarios: (1) If the two species can coexist without disease, then the addition of disease will not change that coexistence (Figure 2A,C,E). (2) If inferior competitors are rejected without disease, then the infection of the dominant species may allow for the inferior species to invade, leading to coexistence (Figure 2B,D,F).
However, an infectious disease does not necessarily promote species coexistence, and there are still cases where the pathogen successfully invades the host population, but the two species are unable to coexist (Figure 2 in B from part a to part b and similarly in Figure 2D,F). As the intensity of infection increases, the effect of the pathogen on the dominant species makes it possible for the inferior species to escape competitive exclusion to achieve coexistence. Interestingly, although disease infection causes relative changes in the densities of the host and its competitors and may even reverse competitive strengths and weaknesses, with inferior competitors being in patches at greater densities and becoming more competitive species (Figure 2), the total biomass of the entire system before and after infection is hardly altered by the infection, even increasing slightly (Figure 2).
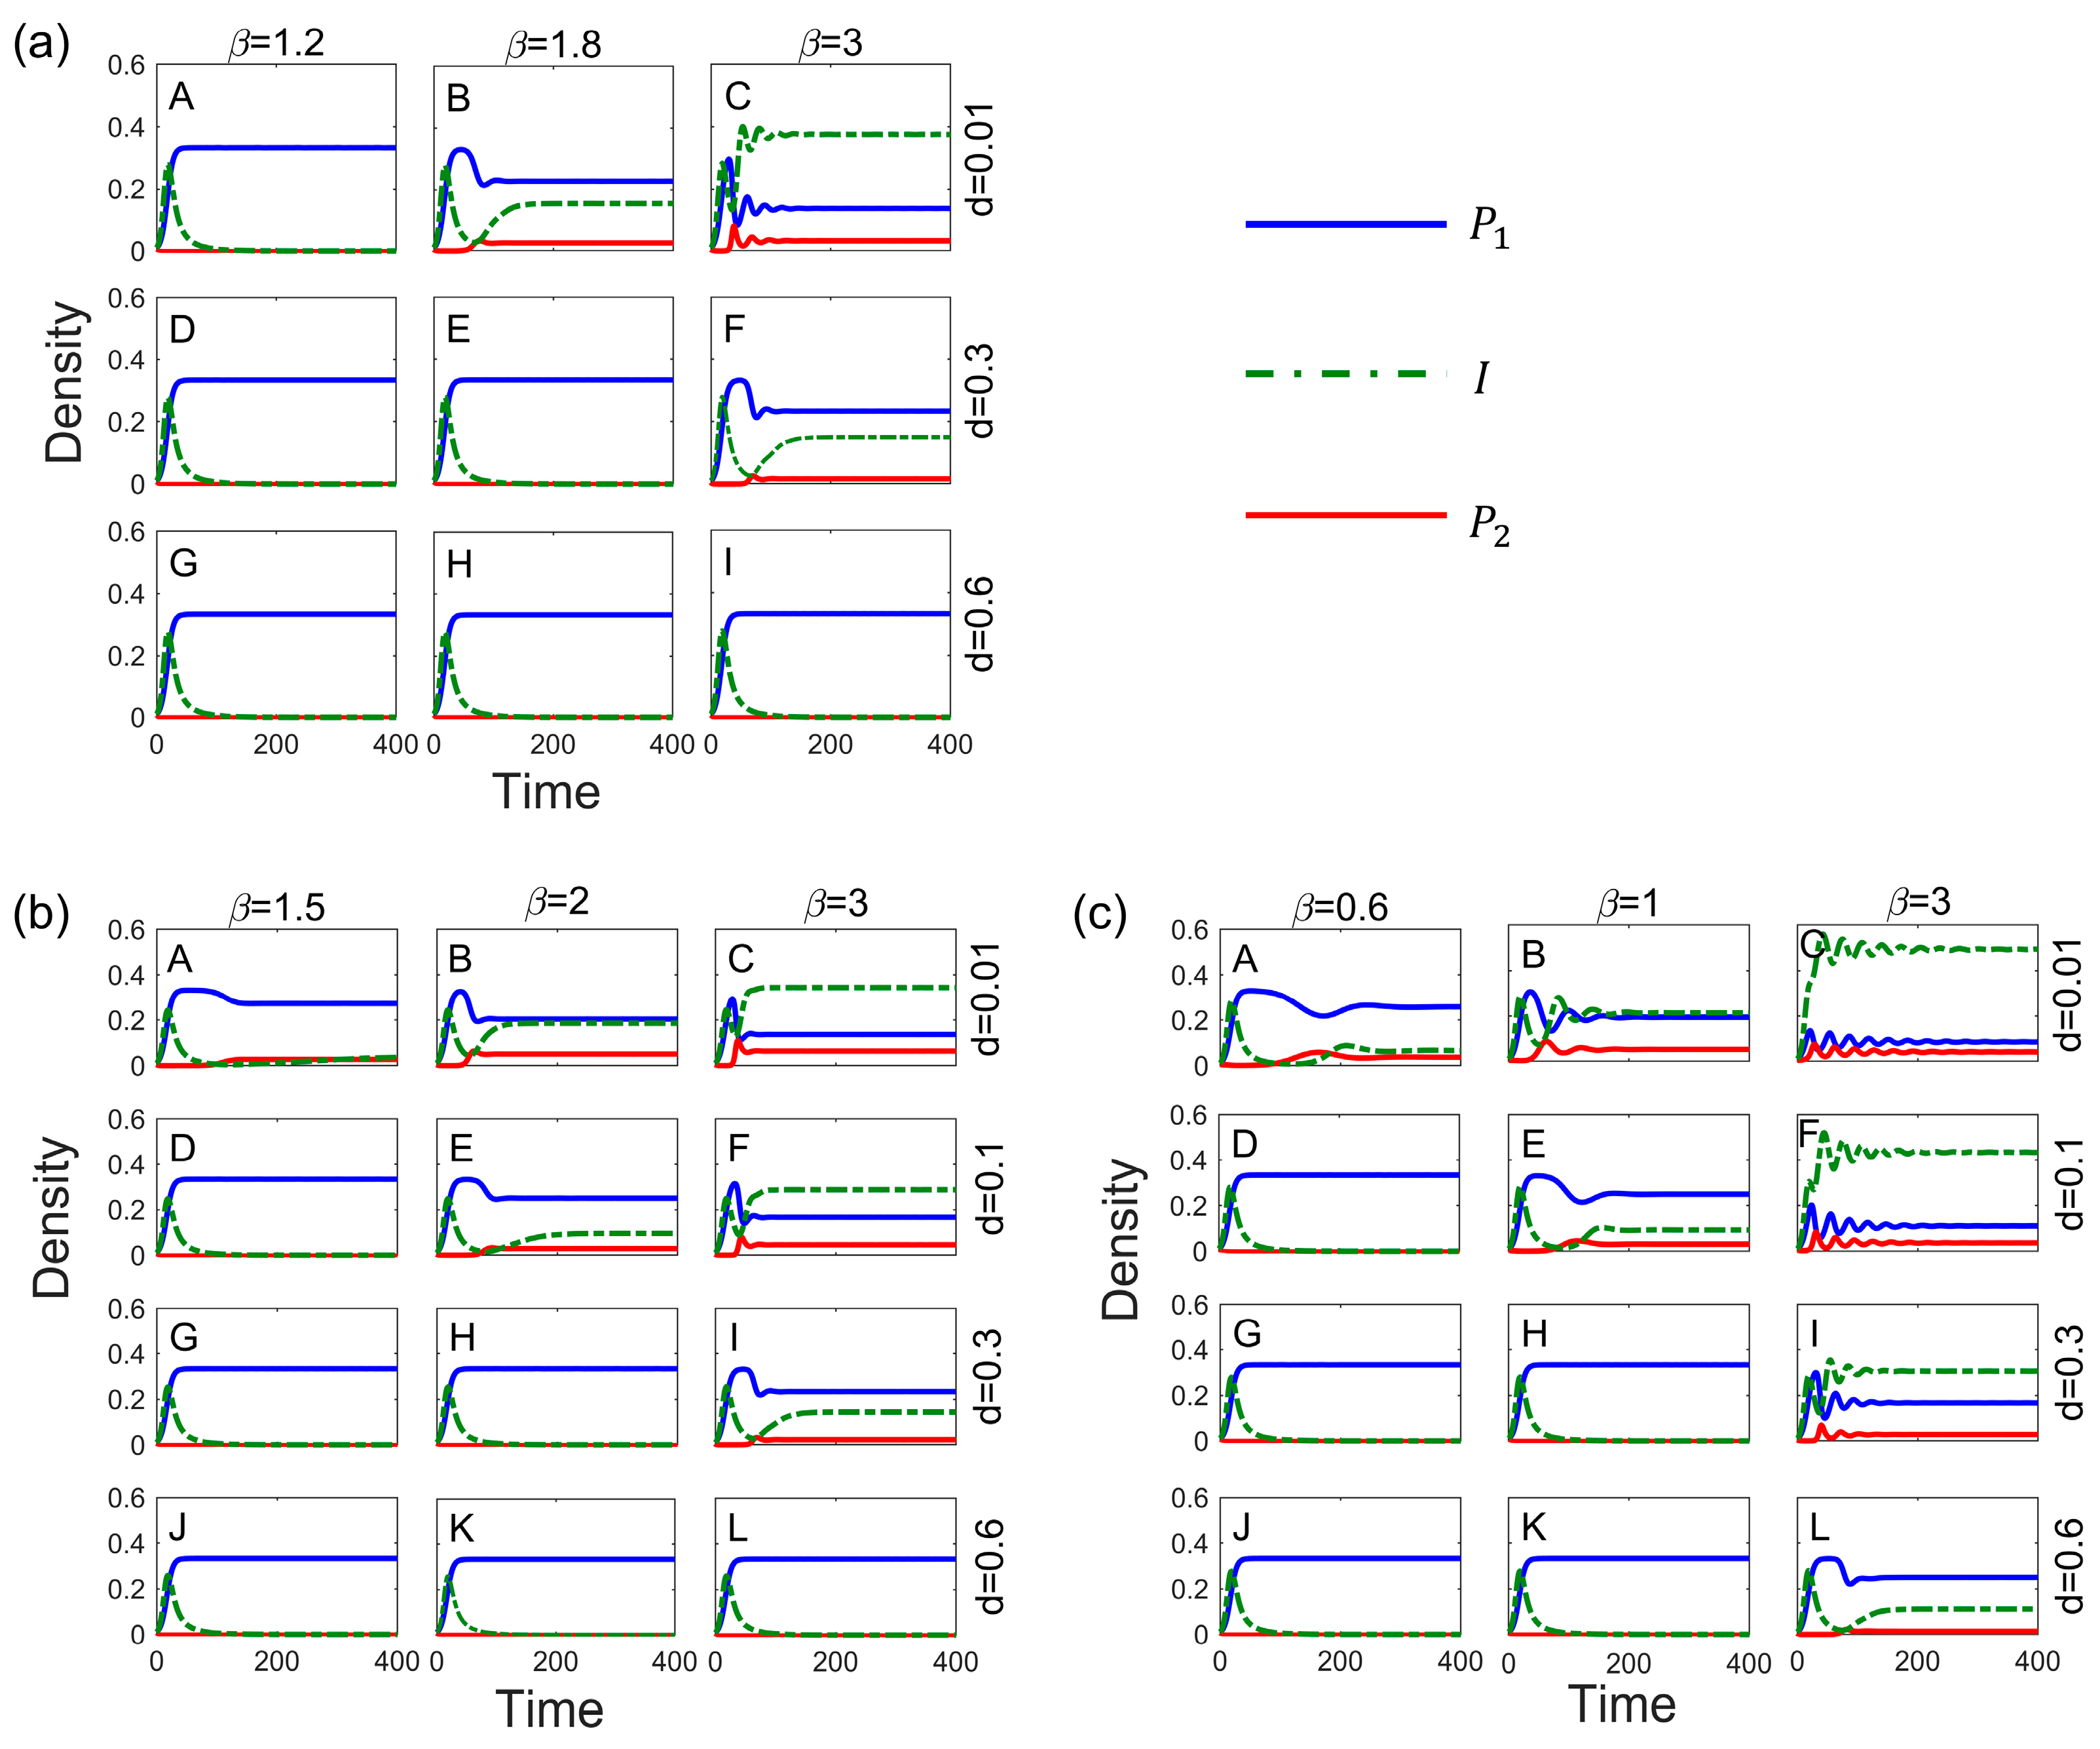
The transmission rates and virulence have a direct impact on the spread of pathogens. Further, we modeled their effects on competitive systems under pathogen stress in each of the three systems. The results show that increased transmission rates help promote species coexistence, whereas increased virulence, which weakens the effect of disease on competition, is detrimental to species coexistence (Figure 3). Low virulence facilitates the spread of pathogens, but it has less impact on the host and is not sufficient to free inferior species from competitive exclusion. By contrast, high virulence does not facilitate the spread of pathogens, makes it difficult to invade host populations, and has little effect on host competition. Therefore, pathogens with high transmission rates and low-to-moderate virulence are the most likely to promote species coexistence (Figure 3).
The method of disease transmission also affects species coexistence. Type III transmission, in comparison to Type I and Type II transmission, necessitates the lowest transmission rate for the inferior competitor to invade the superior species (Figure 2), and it also takes longer for the system to reach equilibrium (Figure 2E,F); with this transmission, it is more likely that competitive strengths and weaknesses become reversed. Vertical transmission, in which offspring is innately infected, is essentially equivalent to increased transmission rates, thus exacerbating the impact of disease on competitive relationships. The steady-state density of infected populations is significantly higher in Type II transmission than in the other two modes (Figure 2C,D). This is because the offspring of the infected is susceptible and infected at birth, which increases the number of infected individuals (Figure 4A). Additionally, in Type III transmission, excessively high transmission rates can reduce the persecution of the host by high virulence (see Figure 3c(L)), which enables the coexistence of the two species.
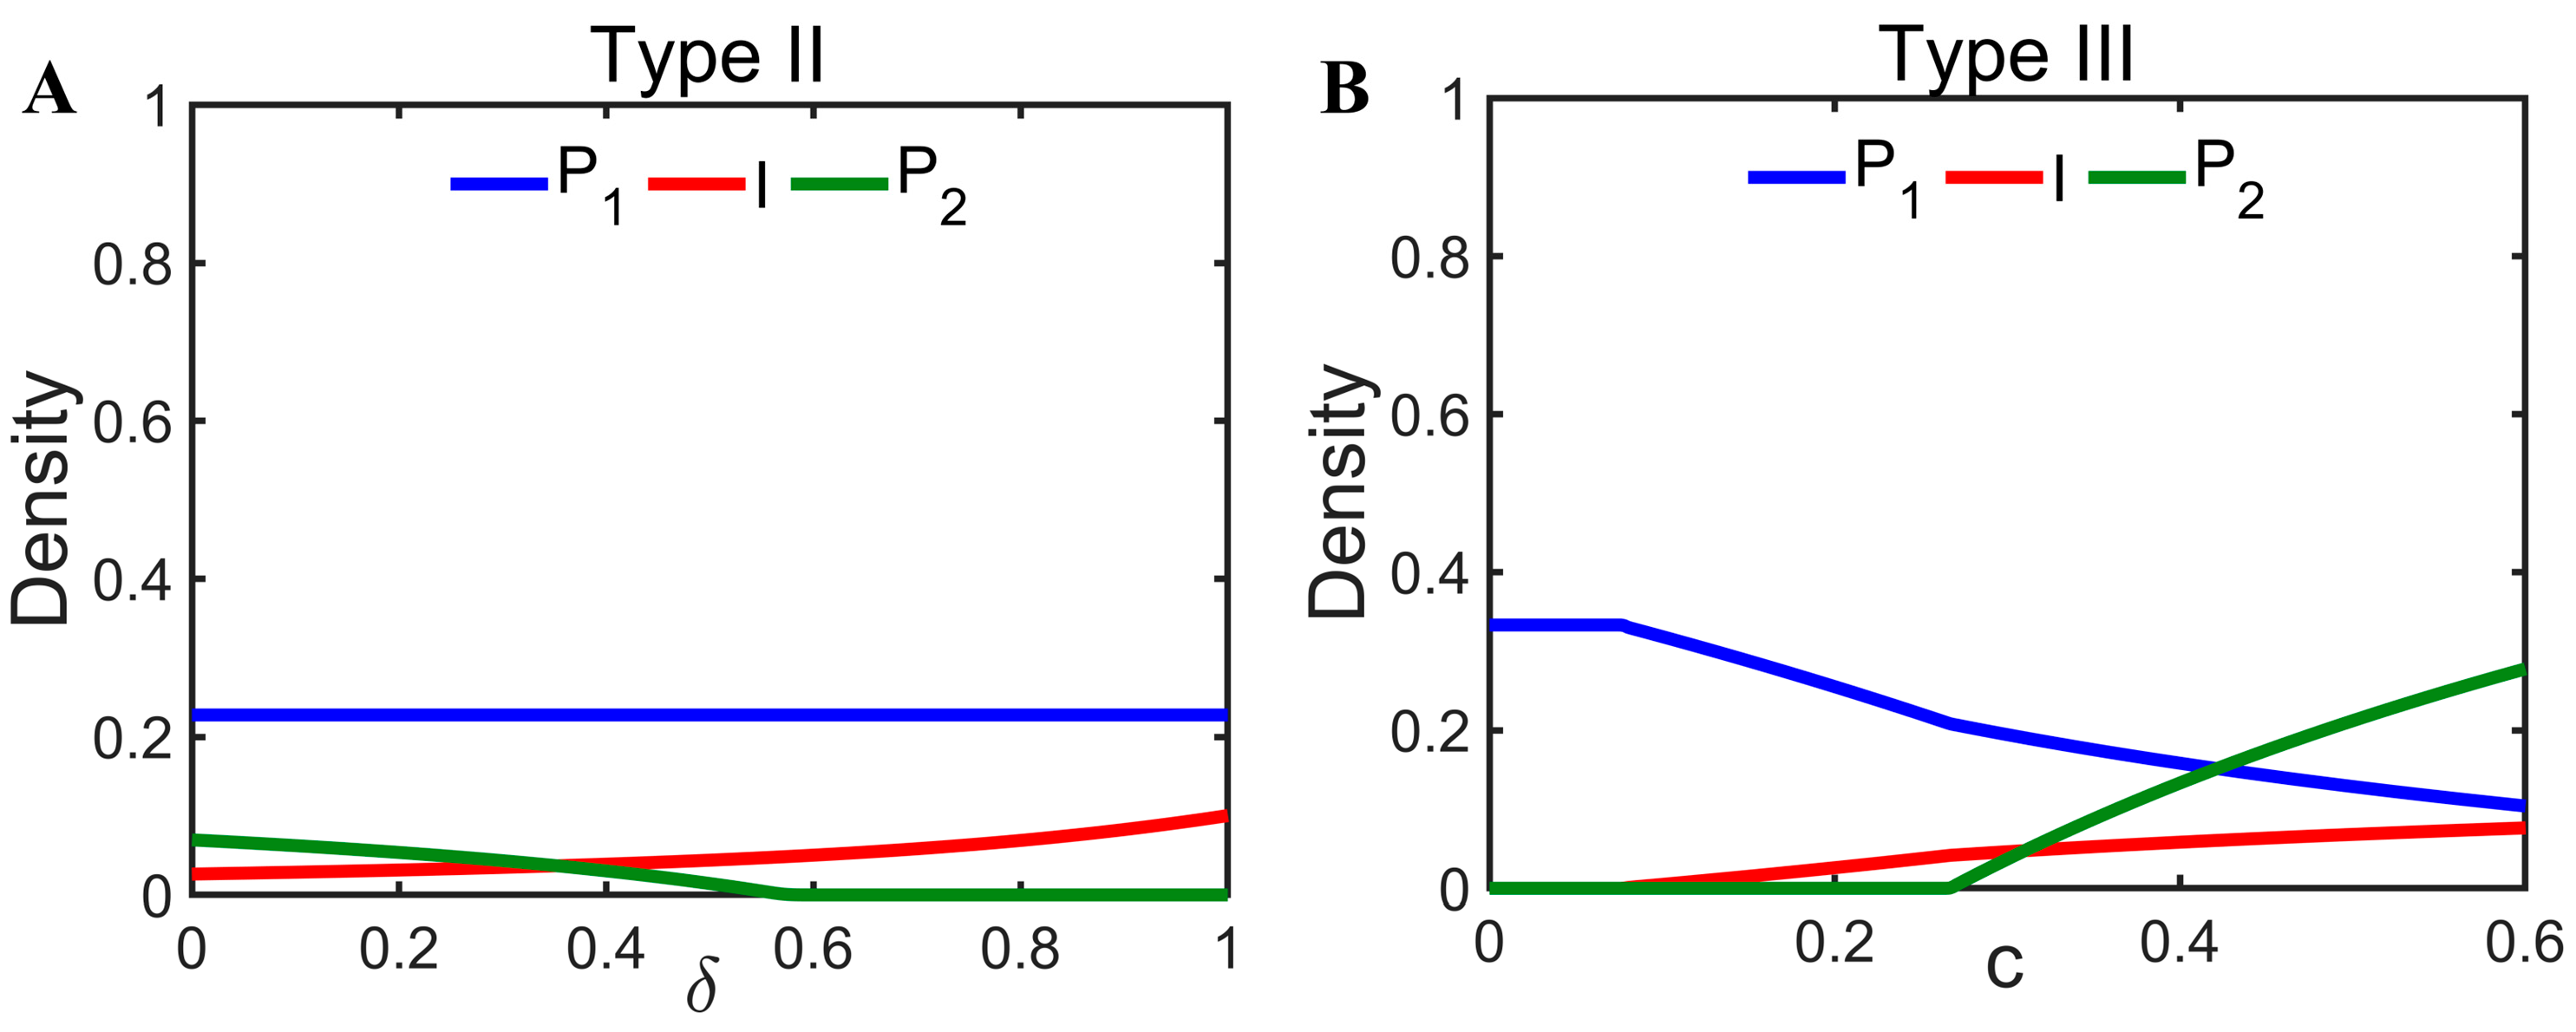
In addition to the pathogen characterization parameters having an impact on coexistence, changes in the colonization rate of the offspring of infected individuals can also have an impact on coexistence. For diseases that are not vertically transmissible (Type II), the increased colonization of healthy offspring () can promote disease transmission without impacting host density, but excessive is likely to be detrimental to interspecific coexistence (Figure 4A). However, for diseases that are vertically transmissible (Type III), the increased colonization () of naturally infected individuals has the potential to promote coexistence (Figure 4B).
3.4. Mechanisms by Which Infectious Diseases Promote Coexistence
Mutual invasion is a crucial criterion for species coexistence. The superior species can invade the inferior population as long as it meets the conditions for its continuation. Does pathogen infection make it easier for the inferior species to invade dominant competing populations? To successfully invade a dominant population that is already infected, the inferior competitor must have a per capita growth rate greater than zero () when the initial population is in equilibrium and the inferior species is very small (ignored, ). Equations (2)–(4) have the same third equation in common:
Letting the above equation be greater than zero yields the inferior competitor invasion threshold as
where is the equilibrium density of the dominant competitors and the infected.
Taking Equation (2) as an example, , and by substituting this into the above inequality, (14) can be rewritten as follows:
In the absence of disease, the inferior competitor must satisfy only to successfully invade the dominant species. Next, numerical simulations are conducted to visually demonstrate the impact of disease on the invasion of inferior species.
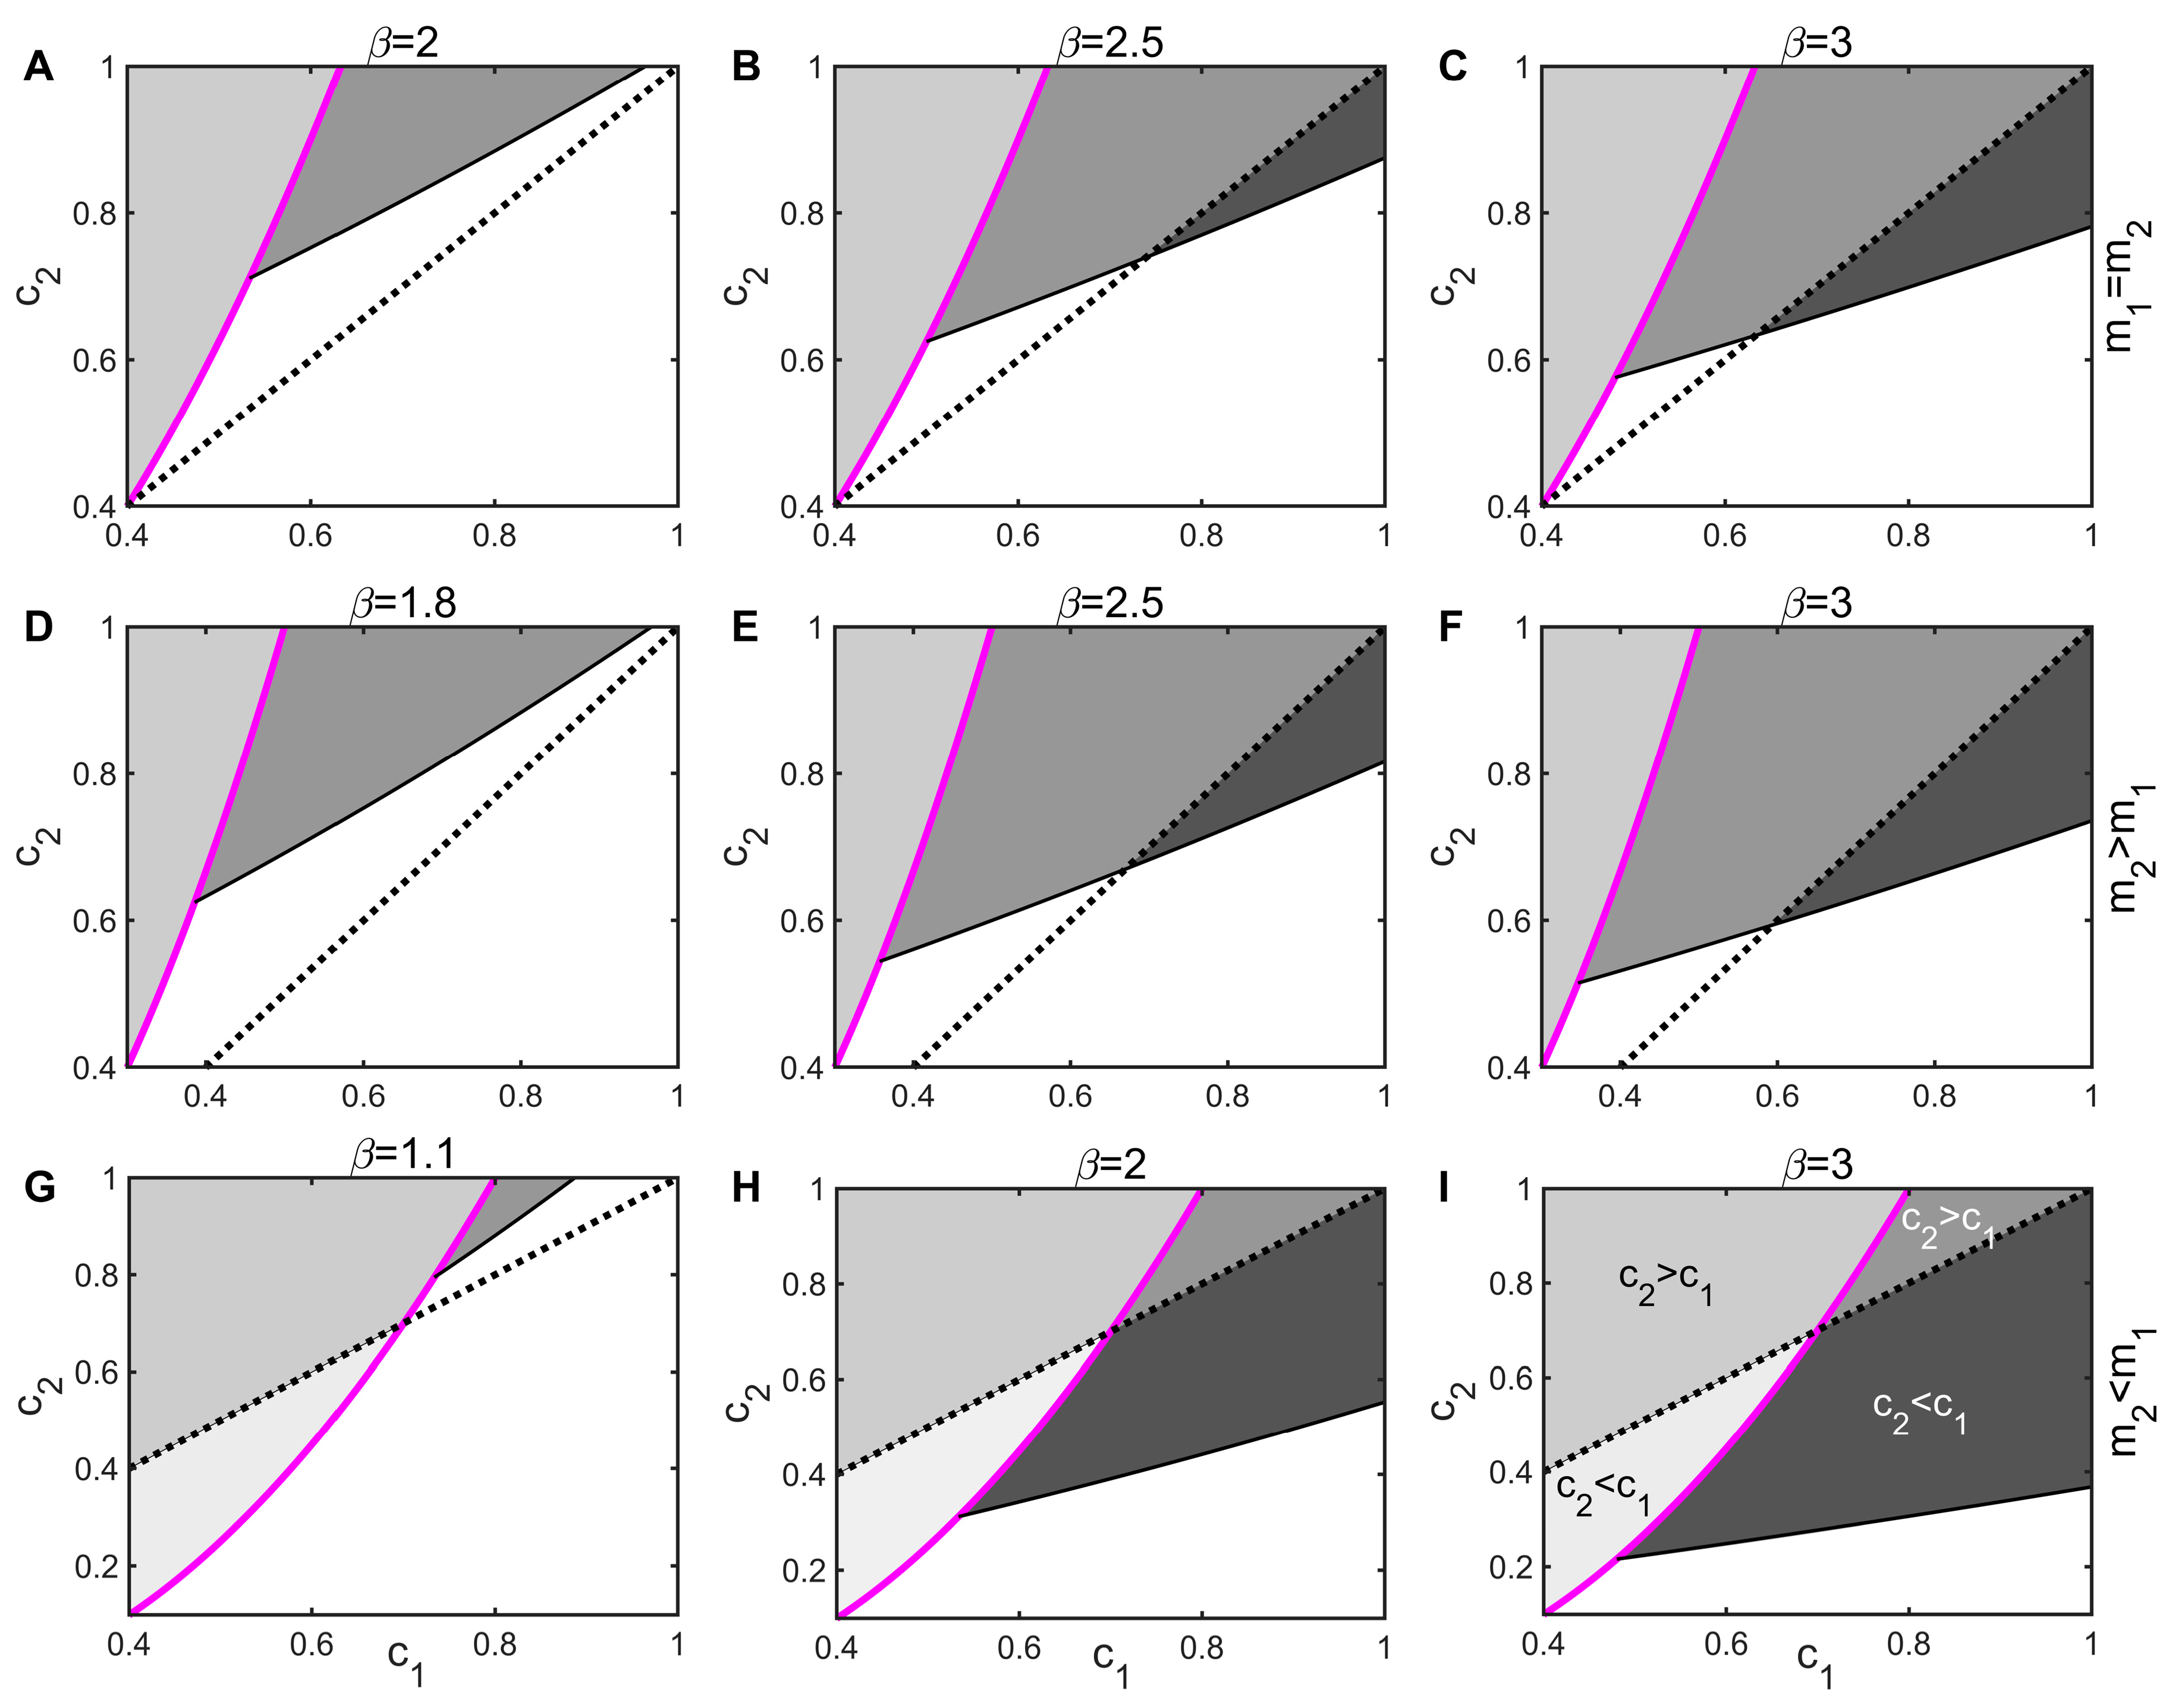
In the absence of the infection of species 1, when the extinction rate of species 2 is not lower than that of species 1 (), species 2, which is weakly competitive, must have a stronger colonization capacity () to invade species 1, which is competitively strong (the light gray areas in Figure 5A–F are all above the black dotted line). In the absence of disease, coexistence between species requires trade-offs among competitiveness, colonization capacity, and longevity. However, pathogen coercion disrupts this mechanism of competition and compromise. Even if the inferior competitor has a lower colonization rate (), it can still invade the superior population (Figure 5 has the dark gray areas of ), and the greater the transmission rate, the easier it is for the inferior species to invade. Thus, the spread of pathogens significantly reduces the invasion threshold of the inferior species, greatly expanding the range of parameters in which the two species can coexist, which contributes to the maintenance of species diversity. This is the mechanism behind disease-promoted species coexistence. The conclusions under the Type II and III modes of transmission are similar and will not be repeated.
4. Discussion
The significance of pathogens in ecosystems is often underestimated and trivialized [39,40]. However, the effects of pathogen stress can be significant, as they can affect host population dynamics, interspecific relationships, and the cycling of matter and energy flows in ecosystems, and they are important drivers of biodiversity and food web stability [38,39,40,41,42,43,44]; thus, the impact of disease on competitive relationships has also received widespread attention [45,46,47,48]. In this study, we combined the susceptible–infected (SI) infectious disease model and the species competition model and examined the effects of infectious diseases on the population dynamics and competitive outcomes of two competing species in a grassland community. The analysis reveals that diseases with high transmission rates and low virulence are more likely to be invasive. Additionally, diseases that enable strains to be vertically transmissible under the same conditions are more likely to establish and spread in grassland communities (Figure 1). If the dominant species can cause the extinction of the inferior species without disease, then disease may promote the coexistence of the two species (Figure 2, right column). This result is consistent with that of the Lotka–Volterra system [49] and the resource competition system [50] under the effect of disease. In addition, other ecoepidemic competition models allow for disease-induced coexistence removal, as in discrete-time ecoepidemiological modeling [51,52]. In contrast, for systems that could otherwise coexist, disease will not change the outcome of coexistence but may reverse competitive strengths and weaknesses (Figure 2, left column), as shown in our study, but such outcomes do not always occur. In the SIS epidemic model, Han L found that a species that would have coexisted with its competitors in the absence of infection became extinct due to infection [46]. Overall, pathogen infections disrupt the competition–compromise trade-off mechanisms that enable species to coexist and expand the conditions that promote species coexistence (Figure 5), and pathogens with large transmission rates and low-to-moderate virulence are the most likely to facilitate species coexistence (Figure 3). This has significant implications for invasion biology [53].
The mechanisms by which plant diversity is positively correlated with productivity are diverse and include reduced competition, ecosystem complementarity, selection effects, and biotic and abiotic facilitation [54,55,56]. The balance between intraspecific and interspecific competition plays a major role in the relationship between biodiversity and ecosystem functioning [57]. However, individual interference when competing also helps to enhance coexistence in species competition [58]. In this study, we demonstrate that pathogen infection can increase the total biomass of the competitive system (as shown by the elevated yellow dashed line in Figure 2 and Figure 3). This is because pathogen infection reduces the biomass of the host, which indirectly weakens the suppression of the dominant species. As a result, the biomass of the dominant species increases, compensating for or outweighing the decrease in the host species and leading to an overall increase in the productivity of the grassland community. This mechanism resembles the cascade effect of trophic interactions [59]. In food webs, the top predators cause a decrease in both intermediate predators and prey. However, the decrease in the intermediate predators indirectly reduces their consumption of prey. The asymmetric impact of the top predators on the intermediate predators and prey benefits the prey. Feng Zhang [60] demonstrated similar results for ecological gaming systems under the stress of infectious diseases, in addition to competitive systems.
In this study, we considered the scenario of infection by a dominant species based on the susceptible–infected disease (SI) model framework, not only for grassland ecosystems but also for similar sessile organism patchy habitats with high diversity (e.g., tropical forests), where our modeling and study results hold. In addition, further research is needed for the susceptible–infected–susceptible (SIS) mode of transmission, susceptible–infected–recovered (SIR) mode of transmission, etc. In this study, only the competition between two species was examined, with only one disease infecting one of them; however, the reality is much more complex, as there is more multispecies competition; one disease can infect multiple species, and multiple diseases can infect multiple species. In addition, this study only captures the main features of disease transmission for modeling, ignoring the life history of the pathogen, the incubation period of infection, etc. In fact, it is more realistic to consider these factors and model ecology in discrete-time systems, but, undoubtedly, this is more challenging.
Supplementary Materials
The following supporting information can be downloaded at: https://www.mdpi.com/article/10.3390/d16040231/s1, Mathematical Derivation of Existence and Stability of Equations (2)–(4) Partial Equilibrium Points.
Author Contributions
Conceptualization, Y.C. and F.Z.; methodology, Y.C., Y.L. and F.Z.; software, Y.C., F.Z. and Y.L.; writing—original draft preparation, Y.C.; writing—review and editing, Y.C., F.Z. and Z.Z.; supervision, F.Z. and X.L.; funding acquisition, X.L. and Z.Z. All authors have read and agreed to the published version of the manuscript.
Funding
This research was funded by the Gansu Provincial Grassland Monitoring and Evaluation Project, grant number GSZYTC-ZCJC-21010; the National Natural Science Foundation of China, grant number 32260354; and the Gansu Agricultural University Doctoral Fund, grant number GAU-KYQD-2019-12.
Institutional Review Board Statement
Not applicable.
Data Availability Statement
The original contributions presented in the study are included in the article; further inquiries can be directed to the corresponding authors.
Acknowledgments
Special thanks to Feng Zhang for his comments on the manuscript.
Conflicts of Interest
The authors declare no conflicts of interest.
Appendix A
To ensure survival all discussions are based on the premise , and taking into account the actual situation, all of the discussion in .
The results of Equations (2) and (3) are:
- (1)
- Equilibrium always exist and unstable, which means the dominant species can always invade the weaker competing population;
- (2)
- Equilibrium always exists and locally stable when , which represents the weaker species is rejected, only the dominant competitor continues to survive and reaches its environmental capacity ;
- (3)
- The disease-free equilibrium exists when , and it is locally stable if , which means the dominant and weaker species coexist stably, and the disease is not yet able to invade;
- (4)
- Equilibrium exists when , and is locally stable if , which represents the host is infected in a certain proportion, the disease persists for a long time, and the weaker species are rejected, eventually dying out.
- (5)
- When , the endemic disease equilibrium exists and is globally stable. It means that the disease becomes endemic at a certain level, while the two competing species coexist in a stable way and the equilibrium density does not change with the initial value of the population size.
Where , , , for Equation (2), the process see Supplementary Materials part I; Meanwhile for Equation (3), ,,, where ,, , , the process see Supplementary Materials part II.
For the Equation (4), there have some changes in conditions. For brevity of presentation, sign . The results are as follows,
- (1)
- Equilibrium , always exist and unstable;
- (2)
- always exists and locally stable when , ;
- (3)
- exists when , and stable if ;
- (4)
- Equilibrium exists when , and stable if , which means all hosts are infected and their numbers are close to the environmental capacity of , the inferior competitor becomes extinct.
- (5)
- exists when , and unstable if (the process see Supplementary Materials part III). where A0 = β(c1 − c + β), A1 = c1 (m1 + d) − β(c − m1 − d) − cm1, A2 = −c1 (m1 + d) + β(c1 − m1) + cm1 ;
- (6)
- exists if , , . And further, when , the equilibrium is locally asymptotically stable according to the Routh-Huriwitz criterion, where, , , , , , . The , and process see Supplementary Materials part III.
References
- Dixon, A.P.; Faber-Langendoen, D.; Josse, C.; Morrison, J.; Loucks, C.J. Distribution mapping of world grassland types. J. Biogeogr. 2014, 41, 2003–2019. [Google Scholar] [CrossRef]
- Chen, S.; Wang, W.; Xu, W.; Wang, Y.; Wan, H.; Chen, D.; Tang, Z.; Tang, X.; Zhou, G.; Xie, Z.; et al. Plant diversity enhances productivity and soil carbon storage. Proc. Natl. Acad. Sci. USA 2018, 115, 4027–4032. [Google Scholar] [CrossRef]
- Bai, Y.; Cotrufo, M.F. Grassland soil carbon sequestration: Current understanding, challenges, and solutions. Science 2022, 377, 603–608. [Google Scholar] [CrossRef]
- Bengtsson, J.; Bullock, J.M.; Egoh, B.; Everson, C.; Everson, T.; O’connor, T.; O’farrell, P.J.; Smith, H.G.; Lindborg, R. Grasslands—More important for ecosystem services than you might think. Ecosphere 2019, 10, e02582. [Google Scholar] [CrossRef]
- Zhao, Y.; Liu, Z.; Wu, J. Grassland ecosystem services: A systematic review of research advances and future directions. Landsc. Ecol. 2020, 35, 793–814. [Google Scholar] [CrossRef]
- Morens, D.M.; Folkers, G.K.; Fauci, A.S. The challenge of emerging and re-emerging infectious diseases. Nature 2004, 430, 242–249. [Google Scholar] [CrossRef]
- Pimm, S.L.; Jenkins, C.N.; Abell, R.; Brooks, T.M.; Gittleman, J.L.; Joppa, L.N.; Raven, P.H.; Roberts, C.M.; Sexton, J.O. The biodiversity of species and their rates of extinction, distribution, and protection. Science 2014, 344, 1246752. [Google Scholar] [CrossRef]
- Rúa, M.A.; McCulley, R.L.; Mitchell, C.E. Climate drivers, host identity and fungal endophyte infection determine virus prevalence in a grassland ecosystem. J. Ecol. 2014, 102, 690–699. [Google Scholar] [CrossRef]
- Jeger, M.J.; Salama, N.K.G.; Shaw, M.W.; Van Den Berg, F.; Van Den Bosch, F. Effects of plant pathogens on population dynamics and community composition in grassland ecosystems: Two case studies. Eur. J. Plant Pathol. 2014, 138, 513–527. [Google Scholar] [CrossRef]
- Semchenko, M.; Leff, J.W.; Lozano, Y.M.; Saar, S.; Davison, J.; Wilkinson, A.; Jackson, B.G.; Pritchard, W.J.; De Long, J.R.; Oakley, S.; et al. Fungal diversity regulates plant-soil feedbacks in temperate grassland. Sci. Adv. 2018, 11, eaau4578. [Google Scholar] [CrossRef]
- Prevéy, J.S.; Seastedt, T.R. Increased winter precipitation benefits the native plant pathogen Ustilago bullata that infects an invasive grass. Biol. Invasions 2015, 17, 3041–3047. [Google Scholar] [CrossRef]
- Mordecai, E.A. Pathogen impacts on plant communities: Unifying theory, concepts, and empirical work. Ecol. Monogr. 2011, 81, 429–441. [Google Scholar] [CrossRef]
- Baums, I.B.; Baker, A.C.; Davies, S.W.; Grottoli, A.G.; Kenkel, C.D.; Kitchen, S.A.; Kuffner, I.B.; LaJeunesse, T.C.; Matz, M.V.; Miller, M.W.; et al. Considerations for maximizing the adaptive potential of restored coral populations in the western Atlantic. Ecol. Appl. 2019, 29, e01978. [Google Scholar] [CrossRef] [PubMed]
- Roughgarden, J.; Gilbert, S.F.; Rosenberg, E.; Zilber-Rosenberg, I.; Lloyd, E.A. Holobionts as units of selection and a model of their population dynamics and evolution. Biol. Theor. 2018, 13, 44–65. [Google Scholar] [CrossRef]
- Barrett, L.G.; Kniskern, J.M.; Bodenhausen, N.; Zhang, W.; Bergelson, J. Continua of specificity and virulence in plant host–pathogen interactions: Causes and consequences. New Phytol. 2009, 183, 513–529. [Google Scholar] [CrossRef] [PubMed]
- Bever, J.D.; Mangan, S.A.; Alexander, H.M. Maintenance of plant species diversity by pathogens. Annu. Rev. Ecol. Evol. Syst. 2015, 46, 305–325. [Google Scholar] [CrossRef]
- Jarosz, A.M.; Davelos, A.L. Effects of disease in wild plant populations and the evolution of pathogen aggressiveness. New Phytol. 1995, 129, 371–387. [Google Scholar] [CrossRef]
- van Dijk, L.J.; Ehrlén, J.; Tack, A.J. Direct and insect-mediated effects of pathogens on plant growth and fitness. J. Ecol. 2021, 109, 2769–2779. [Google Scholar] [CrossRef]
- Lin, Z.; Liu, H. How species diversity responds to different kinds of human-caused habitat destruction. Ecol. Res. 2006, 21, 100–106. [Google Scholar] [CrossRef]
- Hirzel, A.H.; Le, L.G. Habitat suitability modelling and niche theory. J. Appl. Ecol. 2008, 45, 1372–1381. [Google Scholar] [CrossRef]
- Levine, J.M.; Bascompte, J.; Adler, P.B.; Allesina, S. Beyond pairwise mechanisms of species coexistence in complex communities. Nature 2017, 546, 56–64. [Google Scholar] [CrossRef] [PubMed]
- Buck, J.C. Indirect effects explain the role of parasites in ecosystems. Trends Parasitol. 2019, 35, 835–847. [Google Scholar] [CrossRef] [PubMed]
- Chesson, P. Mechanisms of maintenance of species diversity. Annu. Rev. Ecol. Syst. 2000, 31, 343–366. [Google Scholar] [CrossRef]
- Chen, T.; Nan, Z.B. Progress in effects of phytopathogens on plant communities: A review. Acta Ecol. Sin. 2015, 35, 177–183. [Google Scholar] [CrossRef]
- Dai, D.; Xing, H.; Yang, J.R.; Liu, Y.J.; Cai, H.M.; Liu, Y. Advances in mechanisms of rare species maintenance and plant-soil feedback in plant communities. Biodivers. Sci. 2021, 29, 1687–1699. [Google Scholar] [CrossRef]
- Souvik, B.; Maia, M. A Predator-Prey-Disease Model with Immune Response in Infected Prey. J. Math Anal. Appl. 2014, 411, 297–313. [Google Scholar]
- Herbert, W. A Predator-Prey Model with Infected Prey. Theor. Popul. Biol. 2004, 66, 259–268. [Google Scholar]
- Mainul, H. A Predator-Prey Model with Disease in the Predator Species Only. Nonlin. Anal.-Real World Appl. 2010, 11, 2224–2236. [Google Scholar]
- Xuin, G. A Predator-Prey Model with Diseases in both Prey and Predator. Physica A 2013, 392, 5898–5906. [Google Scholar]
- Tilman, D. Competition and Biodiversity in Spatially Structured Habitats. Ecology 1994, 75, 2–16. [Google Scholar] [CrossRef]
- Libál, A.; Forgács, P.; Néda, Á.; Reichhardt, C.; Hengartner, N.; Reichhardt, C.J.O. Transition from susceptible-infected to susceptible-infected-recovered dynamics in a susceptible-cleric-zombie-recovered active matter model. Phys. Rev. E 2023, 107, 024604. [Google Scholar] [CrossRef] [PubMed]
- Baloda, S.; Sehrawat, S.K.; Yadav, B.S.; Ahlawat, V.P.; Singh, S. Present status of ber production and future thrusts in India—A review. Agric. Rev. 2012, 33, 256–264. [Google Scholar]
- Barbetti, M.J. The expression of resistance in subterranean clover (Trifolium subterraneum) to races 1 and 2 of Kabatiella caulivora is affected by inoculum pressure but not by combinations of the two races. Australas. Plant Pathol. 2007, 36, 318–324. [Google Scholar] [CrossRef]
- Veltman, B.; Harpaz, D.; Melamed, S.; Tietel, Z.; Tsror, L.; Eltzov, E. Whole-cell bacterial biosensor for volatile detection from Pectobacterium-infected potatoes enables early identification of potato tuber soft rot disease. Talanta 2022, 247, 123545. [Google Scholar] [CrossRef]
- Liu, M.; Shoukouhi, P.; Bisson, K.R.; Wyka, S.A.; Broders, K.D.; Menzies, J.G. Sympatric divergence of the ergot fungus, Claviceps purpurea, populations infecting agricultural and nonagricultural grasses in North America. Ecol. Evol. 2021, 11, 273–293. [Google Scholar] [CrossRef] [PubMed]
- Lind, E.M.; Borer, E.; Seabloom, E.; Adler, P.E.; Bakker, J.B. Life-history constraints in grassland plant species: A growth-defence trade-off is the norm. Ecol. Lett. 2013, 16, 513–521. [Google Scholar] [CrossRef] [PubMed]
- Liu, X.; Chen, L.; Zhou, S. The relationship between biodiversity and infectious disease: Progress, challenge and perspective. Biodivers. Sci. 2020, 28, 1376. [Google Scholar] [CrossRef]
- Keeling, M.J.; Rohani, P. Modeling Infectious Diseases in Humans and Animals; Princeton University Press: Princeton, NJ, USA, 2008. [Google Scholar]
- Hatcher, M.J.; Dick, J.T.; Dunn, A.M. Diverse effects of parasites in ecosystems: Linking interdependent processes. Front. Ecol. Environ. 2012, 10, 186–194. [Google Scholar] [CrossRef] [PubMed]
- Hudson, P.J.; Dobson, A.P.; Lafferty, K.D. Is a healthy ecosystem one that is rich in parasites? Trends Ecol. Evolut. 2006, 21, 381–385. [Google Scholar] [CrossRef]
- Wood, C.L.; Johnson, P.T. A world without parasites: Exploring the hidden ecology of infection. Front Ecol. Environ. 2015, 13, 425–434. [Google Scholar] [CrossRef]
- Stringer, A.P.; Linklater, W. Everything in moderation: Principles of parasite control for wildlife conservation. BioScience 2014, 64, 932–937. [Google Scholar] [CrossRef]
- Lafferty, K.D.; Allesina, S.; Arim, M.; Briggs, C.J.; Leo, G.D.; Dobson, A.P.; Dunne, J.A.; Johnson, P.T.J.; Kuris, A.M.; Marcogliese, D.J.; et al. Parasites in food webs: The ultimate missing links. Ecol. Lett. 2008, 11, 533–546. [Google Scholar] [CrossRef] [PubMed]
- Tompkins, D.M.; White, A.R.; Boots, M. Ecological replacement of native red squirrels by invasive greys driven by disease. Ecol. Lett. 2003, 6, 189–196. [Google Scholar] [CrossRef]
- Bowers, R.G.; Turner, J. Community structure and the interplay between interspecific infection and competition. J. Theor. Biol. 1997, 187, 95–109. [Google Scholar] [CrossRef]
- Han, L.; Pugliese, A. Epidemics in two competing species. Nonlin. Anal.-Real World Appl. 2009, 10, 723–744. [Google Scholar] [CrossRef]
- Han, L.; Ma, Z.; Shi, T. An SIRS epidemic model of two competitive species. Math. Comput. Model. 2003, 37, 87–108. [Google Scholar] [CrossRef]
- Venturino, E. The effects of diseases on competing species. Math. Biosci. 2001, 174, 111–131. [Google Scholar] [CrossRef] [PubMed]
- Van den Driessche, P.; Zeeman, M.L. Disease Induced Oscillations between Two Competing Species. SIAM J. Appl. Dyn. Syst. 2004, 3, 601–619. [Google Scholar] [CrossRef]
- Fang, D.X.; Wan, X.; Mao, W.Q.; Zhang, F. Effect of pathogen infection on resource competition between species: A study based on resource competition theory. Acta Ecol. Sin. 2023, 43, 7109–7117. [Google Scholar]
- Bravo de la Parra, R.; Marvá, M.; Sánchez, E.; Sanz, L. Discrete models of disease and competition. Discret. Dyn. Nat. Soc. 2017, 2017, 5310837. [Google Scholar] [CrossRef]
- Bravo de la Parra, R.; Marvá, M.; Sánchez, E.; Sanz, L. A discrete model of competing species sharing a parasite. Discret. Dyn. Nat. Soc. 2017, 5, 565–569. [Google Scholar] [CrossRef]
- Torchin, M.E.; Lafferty, K.D.; Dobson, A.P.; McKenzie, V.J.; Kuris, A.M. Introduced species and their missing parasites. Nature 2003, 421, 628–630. [Google Scholar] [CrossRef]
- Assaf, T.A.; Beyschlag, W.; Isselstein, J. The relationship between plant diversity and productivity in natural and in managed grasslands. Appl. Ecol. Environ. Res. 2011, 9, 157–166. [Google Scholar] [CrossRef]
- Loreau, M.; Hector, A. Partitioning selection and complementarity in biodiversity experiments. Nature 2001, 412, 72–76. [Google Scholar] [CrossRef] [PubMed]
- Tilman, D.; Reich, P.B.; Knops, J.; Wedin, D.; Mielke, T.; Lehman, C. Diversity and productivity in a long-term grassland experiment. Science 2001, 294, 843–845. [Google Scholar] [CrossRef] [PubMed]
- Mahaut, L.; Fort, F.; Violle, C.; Freschet, G.T. Multiple facets of diversity effects on plant productivity: Species richness, functional diversity, species identity and intraspecific competition. Funct. Ecol. 2020, 34, 287–298. [Google Scholar] [CrossRef]
- Vera, M.C.; Marvá, M.; García-Garrido, V.J.; Escalante, R. The Beddington–DeAngelis Competitive Response: Intra-Species Interference Enhances Coexistence in Species Competition. Mathematics 2024, 12, 562. [Google Scholar] [CrossRef]
- Carpenter, S.R.; Kitchell, J.F.; Hodgson, J.R. Cascading trophic interactions and lake productivity. BioScience 1985, 35, 634–639. [Google Scholar] [CrossRef]
- Zhang, F.; Cao, M.; Shi, L.; Wang, R.W. Disease-Induced Cooperation Mitigates Populations Against Decline: The Cascade Effect of Cooperation Evolution. Front. Ecol. Evolut. 2022, 10, 758659. [Google Scholar] [CrossRef]
Figure 1.
Thresholds for disease to invade host populations. = is the invasion threshold for pathogens under Type I and Type II transmission modes, is the invasion threshold when the initial population consists of only the host under Type III transmission mode, and is when the host and its opponent coexist under Type III transmission mode. The value of the parameter above the surface, , ensures successful invasion; otherwise, invasion fails. Parameters: .

Figure 2.
The impact of infectious diseases on the competitive dynamics of two species in a state of coexistence (subfigures A,C,E) or exclusion (subfigures B,D,F) in Type I, Type II, and Type III models. The graph displays the densities of the superior, infected, and inferior competitors with blue, red, and green lines, respectively. The yellow dashed line represents the sum of the densities of all three groups, and the vertical dashed line indicates the time of infectious disease occurrence in the population. The parameter in the left column is ; the parameter in the right column is ; and the other parameters are taken identically as c1 = 0.6, m1 = 0.4, m2 = 0.1, β = 3, d = 0.1; additionally, is taken for (C,D), and is taken for (E,F), with initial values of being . Some parameter values are taken from Reference [26].

Figure 3.
Combined effect of transmission rate and toxicity on species coexistence under Type I (a), Type II (b), and Type III (c) modes of transmission. Parameters: .
Figure 3.
Combined effect of transmission rate and toxicity on species coexistence under Type I (a), Type II (b), and Type III (c) modes of transmission. Parameters: .

Figure 4.
Panel (A) shows the effect of on the equilibrium state of system 2. Parameters are with the same initial values as in Figure 2. Panel (B) shows the effect of on the equilibrium state of system 3. Parameters are with the same initial values as in Figure 2. Note that .

Figure 5.
Impact of disease on invasion of inferior species under Type I mode of transmission. The black dashed line represents the equal colonization rate of the two species, i.e., . The left side of the magenta line indicates that the inferior species can invade the superior species without disease, where in the light gray area, and in the white gray area; the right indicates that the dominant species invaded the infected inferior species, where in the gray area, and in the dark gray area. The parameters of the first line are ; those of the second line are ; and those of the third line are .

Disclaimer/Publisher’s Note: The statements, opinions and data contained in all publications are solely those of the individual author(s) and contributor(s) and not of MDPI and/or the editor(s). MDPI and/or the editor(s) disclaim responsibility for any injury to people or property resulting from any ideas, methods, instructions or products referred to in the content. |
© 2024 by the authors. Licensee MDPI, Basel, Switzerland. This article is an open access article distributed under the terms and conditions of the Creative Commons Attribution (CC BY) license (https://creativecommons.org/licenses/by/4.0/).
Share and Cite
MDPI and ACS Style
Chen, Y.; Liu, Y.; Liu, X.; Zhang, Z.; Zhang, F. The Effects of Infectious Diseases on the Consequences of Interspecific Competition in Grassland Communities. Diversity 2024, 16, 231. https://doi.org/10.3390/d16040231
AMA Style
Chen Y, Liu Y, Liu X, Zhang Z, Zhang F. The Effects of Infectious Diseases on the Consequences of Interspecific Competition in Grassland Communities. Diversity. 2024; 16(4):231. https://doi.org/10.3390/d16040231
Chicago/Turabian StyleChen, Yanli, Yanping Liu, Xiaoni Liu, Zhengzhong Zhang, and Feng Zhang. 2024. "The Effects of Infectious Diseases on the Consequences of Interspecific Competition in Grassland Communities" Diversity 16, no. 4: 231. https://doi.org/10.3390/d16040231
Note that from the first issue of 2016, this journal uses article numbers instead of page numbers. See further details here.