Article

Conservation Prioritization of Orthoptera Assemblages on a Mediterranean Island

by
Elli Tzirkalli
1,2,*,
Konstantina Zografou
1,
Luc Willemse
3,
Ioannis N. Vogiatzakis
2 and
Vassiliki Kati
1
1
Biodiversity Conservation Laboratory, Department of Biological Applications and Technology, University of Ioannina, 45110 Ioannina, Greece
2
Faculty of Pure and Applied Sciences, Open University of Cyprus, P.O. Box 12794, Nicosia 2252, Cyprus
3
Naturalis Biodiversity Center, P.O. Box 9517, 2300 Leiden, The Netherlands
*
Author to whom correspondence should be addressed.
Diversity 2024, 16(6), 347; https://doi.org/10.3390/d16060347
Submission received: 22 May 2024 / Revised: 12 June 2024 / Accepted: 14 June 2024 / Published: 15 June 2024
(This article belongs to the Special Issue Biodiversity Conservation Planning and Assessment)

Abstract

:
In response to the ongoing global extinction, conservationists must prioritize future conservation investments to ensure that such measures are biologically effective and economically viable. To propose an effective conservation plan for Orthoptera assemblages on Cyprus Island, we introduce the Standardized Conservation Index (StCI), a biodiversity index accounting for the conservation value (ci), presence, dispersal ability, endemism and conservation status of a species. We evaluated the effect of eleven environmental variables on StCI, ci, species richness and the Shannon–Wiener diversity index, using linear and generalized linear models. Species and environmental data were collected in 60 localities that were placed along four elevational zones and included seven habitat types. Our results revealed the importance of rural mosaics and forests for the conservation of Orthoptera. The Shannon–Wiener diversity index failed to show the importance of high-altitude forests. The Orthoptera species diversity was favored by flower heads and the soil humidity, while rock cover and high shrubs had a positive and negative effect, respectively, on the StCI and ci values. Our results underline the value of StCI in complementing traditional diversity indices, as a scale-independent index that can be used for different taxa to prioritize sites of conservation concern.

1. Introduction

The concept of conservation value has been widely used by scientists for different levels of biological organization (e.g., species, communities, habitats), spatial units (e.g., site, grid, ecosystems), and metrics (e.g., species richness, endemism) with one main goal—the prioritization of conservation efforts [1]. In addition, the global loss of biodiversity has led to an increased interest in biodiversity assessment to guide conservation planning [2]. As a result, scientists worldwide have developed several metrics in the form of conservation indices. Much of the area prioritization literature focuses on groups such as vascular plants [3], dragonflies [4,5], orthoptera [2,6] and butterflies [7]. The most common criteria that they use are geographical distribution, endemism, dispersal capacity, rarity and mobility, as well as other life-history traits. These conservation tools are used to assess specific areas of interest and species’ conservation value. Although protected areas are an effective tool for the conservation of biodiversity, there are still protected areas that host locally threatened invertebrate species, which are neglected in conservation planning and management [8]. On the other hand, some areas may contain unique biodiversity but, due to the lack of species conservation assessment, they remain unprotected.
Islands are mainly threatened by climate change, invasive species, aridity and land use change [9,10,11,12] and there is an urgent need to assess the conservation value of species, as well as sites that are not designated as protected areas, within island environments. Insular communities are characterized by high rates of endemism and are naturally more fragile and vulnerable than continental ecosystems [13]. For island species, there will be no space available to relocate to in response to climate change, while high-altitude biodiversity hotspots are predicted to experience a sharp decline in species richness [14].
Orthoptera (grasshoppers and crickets) are an ideal group to assess the biodiversity and conservation value of such vulnerable and largely changing environments, as they respond rapidly to environmental and land use changes and disturbances [15,16,17,18]. They occupy an important position in food webs, as the leading consumers of plant biomass, and play a crucial role in the functioning of ecosystem processes [19]. Although many endemic Orthoptera species occur in the Mediterranean region, there is still limited knowledge about their ecological requirements and distribution patterns, especially on islands [20].
This study was carried out in Cyprus, an island of high diversity [21], rich in flora [22] and invertebrate fauna (i.e., more than 7000 insect species, of which 10% are endemic) [23] and part of the Mediterranean Basin biodiversity hotspot [24]. However, information on the biogeography, ecology and biology of most invertebrate taxa on the island is missing. Such information is essential in developing effective conservation strategies and management plans to prevent the loss of biodiversity [25]. The protected areas on the island include forested mountain areas, whereas other mid-elevation sites with mosaic landscapes comprising open agricultural areas and natural vegetation are currently threatened by land abandonment or land transformation and suffer from a lack of protection. Cyprus hosts 73 Orthoptera species, including 18 endemic species and subspecies [26,27], as well as 10 species under threat [18], underlining its conservation importance. Apart from some studies covering the distribution patterns of Orthoptera at a national scale [26,27,28,29], no systematic research on the Orthoptera of Cyprus has ever been conducted. In this study, we sought to increase the knowledge of Cyprus’ orthopteran assemblages and develop new perspectives for their adequate conservation management by developing tools to facilitate the assessment of species’ and sites’ conservation value.
While various indices assess the conservation value of species [4,5,6,7], some are based on life-history traits [2] or subjective criteria (e.g., ecological importance) [3] and semi-quantitative species assessments [4,6,7]. In this study, we propose an index for the assessment of the conservation value of species, comprising the following objective criteria: presence, endemism, dispersal capacity and conservation status. We also explore how environmental parameters influence the composition, species richness and conservation value of orthopteran assemblages and bridge the gap between theory and practice, ultimately making meaningful contributions to the field.

2. Materials and Methods
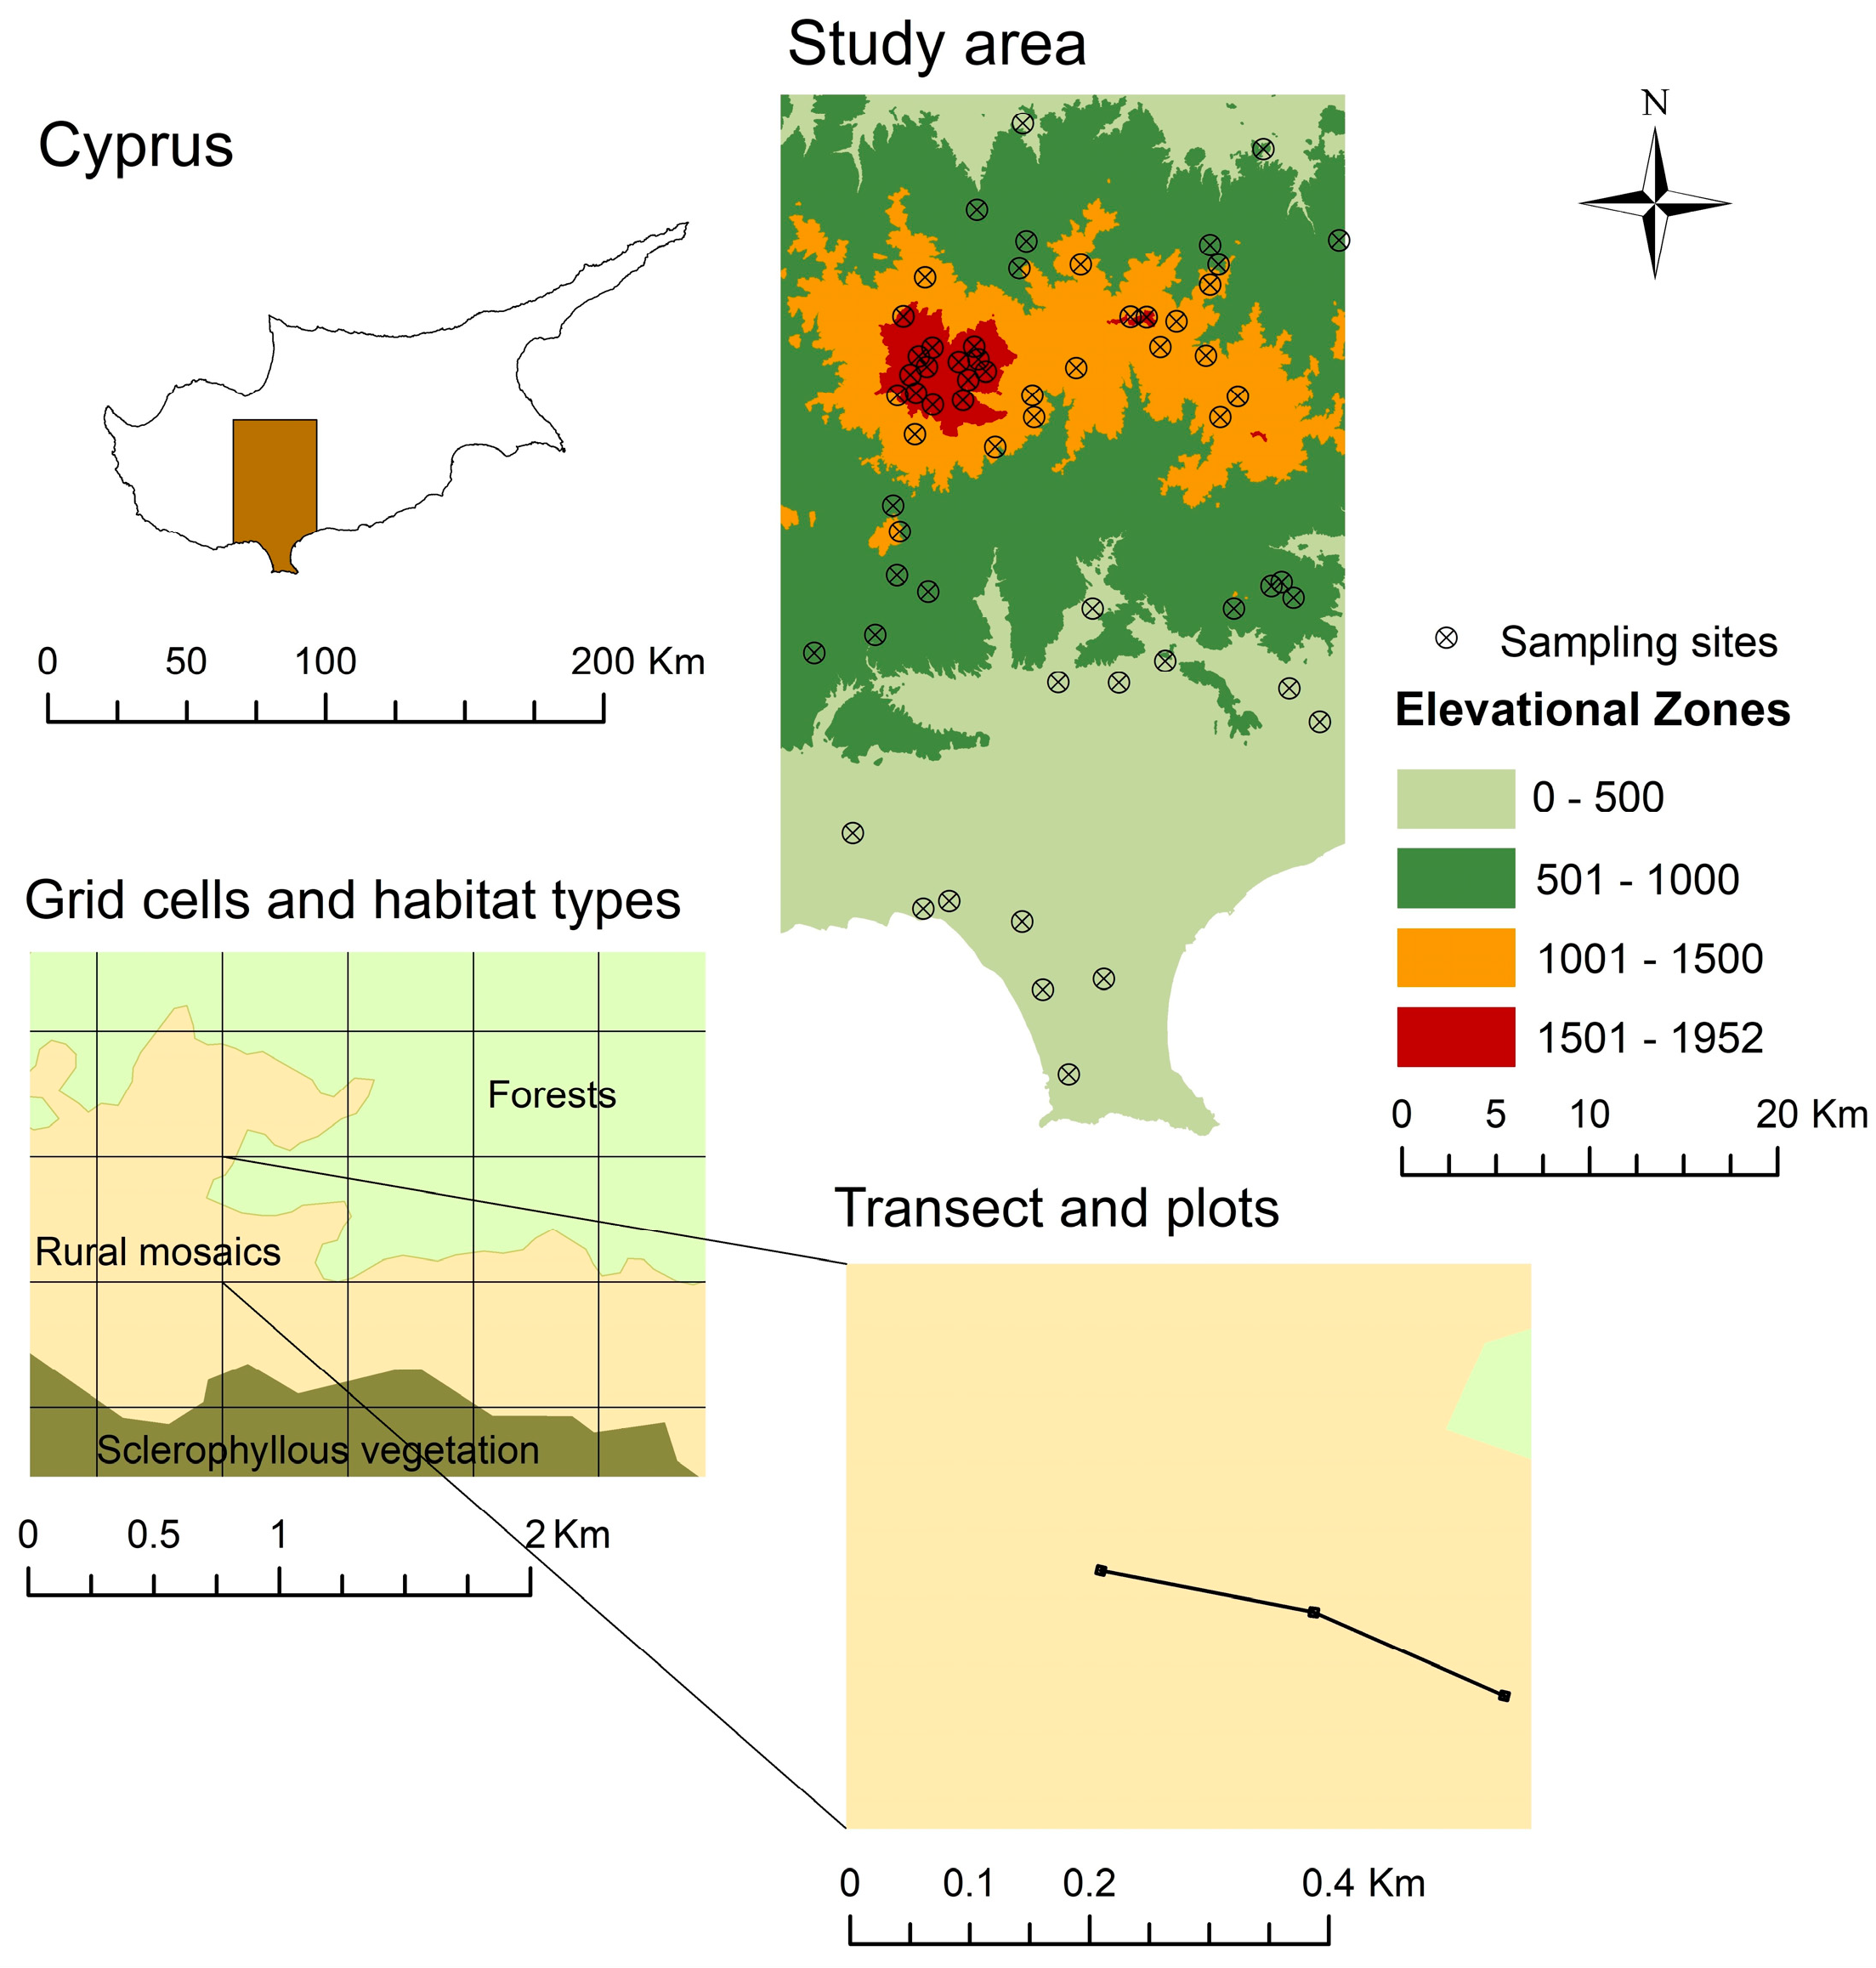
2.1. Study Area

The study area is situated in Cyprus, extending from sea level up to 1952 m, covering an area of 1400 km2 (Figure 1). The climate is Mediterranean, characterized by dry summers and mild winters, with a mean annual temperature of 18 °C and mean annual precipitation of 480 mm [30,31]. The dominant vegetation type encountered is pine forests (Pinus brutia) at higher altitudes, followed by scrubland, while, at medium altitudes, agricultural landscapes cover a great part of the area, along with natural or semi-natural vegetation. The lowlands and the coastal zone are mainly covered by annual crops and shrublands.

2.2. Site Selection

We randomly selected 60 sites of 25 ha each from the study area (Figure 1), using ArcGIS v.10 [32]. First, we divided the study area into four 500 m elevation zones (<500, 501–1000, 1001–1500, >1500) and super-imposed a standard grid of 500 m × 500 m. Within the standard grids, seven broad habitat types were considered: (1) forests; (2) sclerophyllous vegetation; (3) transitional woodland/shrubland; (4) agricultural areas; (5) heterogeneous agricultural areas (rural mosaics); (6) grasslands using the Corine Land Cover Map [33]; and (7) riparian habitats (data provided by the Department of Forests of Cyprus). Candidate grid cells (500 m × 500 m) satisfied two criteria: >70% being in one elevation zone and including >60% of the same habitat type. We then randomly selected 15 grid cells for every elevation category, representing each habitat type with at least one replicate, under the condition that they were located at a distance of at least 500 m apart (Table S1).

2.3. Sampling

Orthoptera were sampled in three plots of 5 m × 5 m, located at the beginning (0 m), middle (150 m) and end (300 m) of a 300 m transect located at each site (180 plots in total). We recorded the orthopteran species within the above plots using a hand-held net for a fixed interval of 15 min. We estimated their relative abundance in situ using a five-grade ordinary scale (1: one individual, 2: 2–5 individuals, 3: 6–10 individuals, 4: 11–50 individuals, 5: >50 individuals) [34]. Sampling was conducted twice in May–June 2012–2013, at the peak of adult Orthoptera activity. Specimens were identified in the field or in the laboratory using a stereo microscope and appropriate key [35].
For each plot (25 m2) at each site, we measured 11 environmental parameters. These were the (1) altitude, using a hand GPS; (2) slope; (3) bare ground; and (4) rocky substrate cover, using a four-grade scale (1: 0–10%, 2: 11–20%, 3: 21–35%, 4: >35%). We also recorded the temperature (5) and soil humidity (6) using a Hobo data logger and considered the sampling average values in the analysis. In addition, once, in May, we estimated the average cover of (7) low shrubs, (8) high shrubs, (9) trees, as the vertical projection of their crown area (%) and (10) herb cover (%), and the overall number of flower heads (11), using a seven-grade scale (1: <10, 2: 11–50, 3: 51–100, 4: 101–200, 5: 201–400, 6: 401–600, 7: >600) [34].

2.4. Data Analysis

We estimated the orthopteran alpha diversity for each site (pooling data from the three plots), in terms of species richness (S), endemic species richness (SE) and the Shannon–Wiener diversity index (H). We then calculated overall diversity values, as well as the average diversity value for each habitat type, assuming that the three plots corresponded to one sample unit (i.e., site). We used the five-grade ordinal scale of abundance classes of Orthoptera to estimate the above indices. We performed diversity comparisons among the elevational zones and across each of the seven habitat types using the Kruskal–Wallis test (a = 0.05) and ANOVA with Tukey’s post hoc test.

2.4.1. Orthoptera Conservation Value Assessment

To assess the conservation value of each site, we developed the Standardized Conservation Index (StCI), which was calculated based on the conservation value (ci) of the species. The StCI was created to identify sites of conservation importance that host valuable species and are in need of protection and conservation actions. Our approach builds on that applied by Matenaar et al. 2015 [6] (Grasshopper Conservation Index) and Simaika and Samways 2009 [4] (Dragonfly Biotic Index).
The StCI takes values from 1 to 100 and is applicable at all scales, regardless of the number of species or the number of sites sampled. It is the ratio of the mean value of the conservation value (ci) of all species in every site divided by the maximum value of the mean ci recorded in the whole study area:
StCIn = cimean/cimax × 100, ci = (1 − pii/N) + 2 × (v1 + v2 + …vk)/2k + 1, v = di/dmax, ei/emax, ri/rmax
StCI: Standardized Conservation Index, ci: species conservation value, pi: number of species i present, N: number of sites, v: vulnerability parameter, k: number of vulnerability parameters calculated, di: dispersal capacity, ei: endemism, ri: Red List status.
The species conservation value (ci) is a continuous variable ranging between 0 and 1 and considers the average values of the species rarity and species vulnerability parameters. Species rarity is measured based on the inverse occurrence of a species in the study area (1 − ni /N). Each parameter of species vulnerability (v) is calculated as the value that the species takes for this parameter divided by the maximum parameter value. Several vulnerability parameters can be integrated, according to the targeted taxonomic group each time.
In the case of orthopterans, species vulnerability was calculated on the basis of three parameters, namely the dispersal capacity (di), endemism (ei) and Red List status (ri). The dispersal capacity (di) of a species took a value of “1” for species with well-developed wings that are fully capable of flight, “2” for short-winged species and a maximum value of “3” for flightless species with very limited dispersal capacity, according to the categorization of Matenaar et al. 2015 [6]. For endemism, we defined three groups: “1” non-endemics; “2” near endemics, when occurring in Cyprus and in one vicinal country; and “3” endemics of Cyprus. The Red List status (ri) ranged from 1 to 5 for the species of the least concern (LC), near-threatened (NT), vulnerable (VU), endangered (EN) and critically endangered (CR) species, respectively, based on the latest Red List assessment of grasshoppers, crickets and bush crickets across Europe [20].

2.4.2. Community Composition in Relation to Environmental Variables

To investigate the relationships between the environmental parameters and community composition, we conducted a redundancy analysis (RDA), using the “vegan” package [36] in R 4.1.2 [37]. Species with less than three occurrences were removed from the analysis, while the abundance data were Hellinger-transformed to down-weight the influence of many species’ absences. Permutation tests with 999 permutations were used to assess the significance of the relationships between the community composition and the explanatory variables (variables without collinearity VIF < 5).

2.4.3. Effect of Environmental Variables on Orthoptera Diversity

We assessed the effects of the 11 environmental variables on the orthopteran species richness (S), Shannon–Wiener diversity index (H), species conservation value (ci) and Standardized Conservation Index (StCI), using linear models (LM) and generalized linear models (GLM). Prior to model fitting, we tested the explanatory variables for multicollinearity (Spearman rank coefficient r > 0.7) and one variable (temperature) was excluded (r = −0.80, p < 0.01) from further analysis. The effects of the environmental parameters on the grasshopper species richness were analyzed using a Poisson distribution for count data and Gaussian distribution GLM’s for the Shannon–Wiener diversity index. The relationships between the ci and StCI and the environmental variables were tested with linear models on log10(x + 1)-transformed data to meet the model assumptions. Model selection was based on the Akaike information criterion (AIC) with backward selection, until a minimum adequate model was obtained [38]. Model performance was checked graphically using diagnostic plots, and the normality of residuals was checked by Kolmogorov–Smirnov tests [39]. We also calculated the adjusted R-squared (linear models) and the percentage of deviance explained (D2) (GLMs) as a measure of the explanatory power of the best models. In all models, the explanatory variables were standardized to allow the comparison of model parameter estimates. LMs and GLMs were obtained using the “MASS” and “car” packages [40,41] in R 4.1.2 [37].

3. Results

A total of 34 Orthoptera species were recorded, belonging to five families and 28 genera (Table S2). We recorded 11 out of the 18 endemic species taxa of Cyprus, namely five endemic species, Exodrymadusa inornata, Isophya mavromoustakisi, Modicogryllus cyprius, Pezotettix cypria and Pyrgomorpha cypria, as well as six endemic sub-species, Truxalis eximia cypria, Chorthippus vagans cypriotus, Sphingonotus caerulans insularis, Sphingonotus eurasius cyprius, Conocephalus fuscus cyprius and Eupholidoptera cypria cypria. One of the recorded endemic species is listed among the IUCN threatened categories in Cyprus, Isophya mavromustakisi (EN). The dominant family was Acrididae with 16 species, followed by Tettigonidae with 11 species. Furthermore, species of the Acrididae family were found in all of the habitat types, while the Tridactylidae and Tetrigidae families were found only in riverine vegetation.

3.1. Diversity Indices

The most important habitat type in terms of overall species richness (S) and the Shannon–Wiener diversity index (H) was rural mosaics, with 22 species and five out of the 18 endemic species found on the island (Kruskal–Wallis X2 = 5.98, p = 0.05; ANOVA F = 11.74, df = 2, p < 0.05). Grasslands and forests were the least diverse (mean H), although forests had a great number of endemic species (Table 1).

3.2. Standardized Conservation Index (StCI)

The StCI and ci reached their highest mean values in rural mosaics, followed by forests and sclerophyllous vegetation, and their lowest values in riverine vegetation (Table 1). The importance of rural mosaics was also highlighted by the sole presence of a rare species of conservation concern, the endemic Isophya mavromoustakisi, which had the highest ci value (Table S2). Forests had relatively low species richness, with significantly higher StCI and ci values observed therein, being a consequence of the high number of endemic, rare and flightless species (Kruskal–Wallis X2 = 12.62, df = 3, p < 0.05; Kruskal–Wallis X2 = 10.29, df = 3, p < 0.05). For instance, within forests, the species with the highest ci were Exodrymadusa inornata and Modicogryllus cyprius, found mainly in pine forests at higher altitudes (Tables S3 and S4). The species with the lowest ci values were Chorthippus bornhalmi and Calliptamus barbarus (Table S2). Grasslands had a greater StCI value than agricultural areas and transitional woodland/shrubland, although they were less species-rich (Mean S) (Table 1).

3.3. Effects of Environmental Variables on Orthopteran Community Composition

We found that three environmental parameters, namely the soil humidity, altitude and low shrubs, were significantly related to the occurrence of species in orthopteran assemblages (redundancy analysis, RDA; 15.12% of variance explained, p < 0.05) (Figure 2, Table S5). The increased soil humidity affected species such as Chorthippus bornhalmi and Phanenoptera nana. Some other species preferred higher altitudes, such as Sphingonotus caerulans insularis and Chorthippus vagans cypriotus, while other species preferred areas with higher cover of low shrubs, such as Calliptamus barbarus.
The best set of models that resulted from the stepwise selection is presented in Table 2. The number of flower heads was the most important parameter, predicting the overall species richness and Shannon–Wiener diversity index, while the altitude had a significant and negative effect. The cover of trees had a negative effect on the Shannon–Wiener diversity index, ci and StCI, while high shrub cover negatively influenced ci and StCI alone. Rock cover had a positive impact on ci and StCI.

4. Discussion

4.1. Standardized Conservation Index (StCI) and Species Conservation Value (ci)

Identifying sites that host vulnerable species such as rare, endemic or threatened species is important for conservation planning decisions. Such an evaluation would be extremely useful in understudied countries that need to prioritize areas of conservation concern.
In this study, we introduce ci, which is a measure of the conservation value of a species based on its rarity, endemism and conservation status (IUCN Red List assessment), while other vulnerability parameters, i.e., generations, can be integrated into the formula, according to the targeted taxonomic group. Its main strength lies in identifying species of conservation concern. The StCI is a measure of the mean conservation value of all species present at a given site and pinpoints the sites that host rare, endemic and Red-Listed species, not influenced by the site’s species richness. Although using the Red List categories along with endemism and rarity could potentially lead to the overestimation of the StCI, the addition of other vulnerability parameters that could have a direct effect on species’ survival, such as the dispersal ability (less mobile species are more prone to threats), as well as the fact that Red List assessments are performed at a global or European level, mitigates this issue. The StCI index can be applied to prioritize sites in need of conservation actions within a network of sites at a national, regional or global scale.
The main difference between the StCI and analogous indices like the Grasshopper Conservation Index (GCIn) [6], the Dragonfly Biotic Index (DBI) [4], the modified Grasshopper Conservation Index (GCI”) [42], the Katydid Biotic Index (KBI) [2] and the Butterfly Conservation Index (BCI) [7] is that the StCI shows great flexibility in incorporating many vulnerability parameters based on the ecology of the studied taxon, as well as having objective criteria such as the species rarity parameter, which takes into account species’ occurrences in a site. The proposed index does not diminish the purpose of the latter indices but rather complements them.

4.2. Site Conservation Value

The StCI revealed the importance of forests for Orthoptera conservation, as they host highly threatened and sensitive species. The Shannon–Wiener index failed to show the ecological value of high-altitude forests, which held a high number of endemic Orthoptera species (e.g., Exodrymadusa inornata and Sphingonotus caerulans insularis).
Considering the diversity indices, we found that rural mosaics, followed by agricultural areas and riverine vegetation, were the most diverse sites after the Shannon–Wiener index, while forest and grasslands were the least diverse. A similar pattern was observed for species richness, where rural mosaics and riverine vegetation held the highest numbers of species and grassland the lowest.
Our results show the importance of rural mosaics for Orthoptera conservation. The rural landscape is characterized by a small-scale mosaic of agricultural fields and natural vegetation that includes a variety of microhabitats, which, in turn, results in a wide range of feeding resources, refuge places and sites for oviposition [43]. Our results are in line with other studies in the Mediterranean area, underlining the importance of rural mosaics as habitats that favor Orthoptera assemblages [44,45]. However, this habitat is locally decreasing in Cyprus due to agricultural land abandonment. As a result, forest encroachment reduces the open character of rural mosaics, an important factor for the conservation of other insects, such as butterflies and spiders [46,47,48].
Forests were found to be important for endemic species but not highly diverse. Closed pine tree canopy sites were species-poor due to the restricted food resources, caused by the limited understory of plants, which is covered mainly by fern species [49]. These conditions are largely unfavorable for the open-area species that dominated the Orthoptera assemblages in our study area.

4.3. Effects of Environmental Parameters on Orthoptera Community Composition

The orthopteran species were found to be greatly affected by the availability of flower heads. The flower head abundance improves the habitat’s suitability for grasshoppers, since it provides shelter from predators [50] and is a potential feeding resource for some bush cricket juveniles [51], such as Isophya mavromoustakisi and Eupholidoptera cypria cypria. Furthermore, the soil humidity was found to be an important factor influencing the orthopteran community composition; it is considered a key factor defining vascular plant communities and has a regulatory effect on grasshopper hatching and the seasonality of their life cycle [52,53,54]. As expected, the species richness, as well as the community composition, was negatively affected by the altitude [46,51], given the harsher microclimatic conditions and reduced food resources. In our study, tree cover had a negative correlation with the Shannon index, ci and StCI. Increased tree cover is probably associated with a reduction in suitable open microhabitats containing resources like food plants and oviposition sites, while it acts as a barrier for flying heliophilous species of Orthoptera [55,56,57]. Open forested sites, however, with high rock cover had a positive effect on the ci and StCI. It is well known that rocky substrates provide shelter and facilitate orthopterans’ thermoregulation, especially in mountain regions [58,59,60]. These substrates foster endemic species such as Exodrymadusa inonrata and Modicogryllus cyprius, with high ci values, providing microclimate niches in open rocky areas [60].

4.4. Implications for Conservation Management

The conservation value of the island of Cyprus in terms of orthopterans is high, hosting 18 endemic and sub-endemic species along with 10 Red-Listed species [20]. Conservation efforts should be prioritized in light of the most valuable species according to ci, whilst sites with high StCI values that lack a protection status need to be further evaluated. The StCI can be used at a national level to identify hotspots of biodiversity within a country, but the concept of the StCI could be easily adapted at a regional and global level and for different taxa.
Our study highlights the importance of open habitats for the conservation of orthopterans in Cyprus, particularly those with high structural diversity (e.g., rural mosaics) [61,62]. The maintenance of the landscape heterogeneity in agricultural lands should be a distinct target integrated into the Common Agricultural Policy [63] for the conservation of invertebrates, including orthopterans.
Our results also underline the need to preserve the open canopy of pine forests and maintain woody clearings, which are crucial for mountain endemics [64]. Over the last decade, forest encroachment has become a major threat to biodiversity [65] and it is fundamental to preserve the open character of similar habitat woodlands. Furthermore, in view of the potential effects of climatic change in the Mediterranean basin [66,67], mountainous habitats need further attention and research as they hold great endemic diversity [68], and their role as climate change refugia could prove crucial for species conservation. For example, Suggitt et al. 2012 [68] found that butterflies can shift their use of different habitats in response to year-to-year variations in climate. They concluded that the species preferred the cooler conditions provided by closed habitats such as forests in hot years but were associated with warmer, more open habitats such as grasslands in cold years. Climatic conditions play a significant role in the spatial distribution of species, such as Orthoptera, including habitat changes as they adjust to new environments [69].
Therefore, to gain further knowledge of species’ responses to climate change and the population status from year to year, conservation biologists should encourage active, targeted management actions on Cyprus Island, which would benefit from the establishment of a coordinated orthopteran monitoring scheme.

5. Conclusions

A new assessment tool was developed for site prioritization, in terms of the Standardized Conservation Index (StCI), complementing existing indices [2,6,7] and calculated based on the conservation value (ci) of species based on their rarity, dispersal ability, endemism and conservation status at a given site. The StCI index was applied to Orthoptera assemblages in Cyprus and revealed the importance of forests since they host highly threatened and endemic species. Identifying sites that host rare and endemic species is important in halting the present trajectory of habitat conversion and the degradation of Mediterranean ecosystems. In this sense, setting conservation targets to protect the extraordinary endemism of the Mediterranean [70] and prioritizing areas of conservation concern based on StCI evaluations would allow for the persistence of sensitive species and provide significant additional biodiversity gains. The StCI can be used at a national level to identify hotspots of biodiversity within a country, but the concept of the StCI could be easily adapted at a regional and global level and for a variety of other taxa.

Supplementary Materials

The following supporting information can be downloaded at: https://www.mdpi.com/article/10.3390/d16060347/s1, Table S1: Sampling sites across habitat types and elevational zones and the cover (%) of each habitat type according to the Corine land cover map comprising the overall study area; Table S2: Shannon–Wiener diversity index (H), mean species conservation value (ci) and Standardized Conservation Index (StCI) in the 60 sites of the study area; Table S3: Mean species conservation value (ci) and mean Standardized Conservation Index (StCI) across habitat types and elevational zones; Table S4: Inventory of Orthoptera species in the study area. ci: species conservation value, E/R: endemic/Red List, NT: near-threatened, EN: endangered, N: number of sites at which the species was recorded; Table S5: Orthoptera species’ codes.

Author Contributions

Conceptualization, E.T. and V.K.; Methodology, E.T. and V.K.; Investigation, E.T. and L.W.; Formal analysis, E.T.; Validation, E.T., K.Z. and V.K.; Writing—original draft preparation, E.T., K.Z. and V.K.; Writing—review and editing, E.T., K.Z., L.W., I.N.V. and V.K.; Visualization, E.T., K.Z., L.W., I.N.V. and V.K.; Supervision, V.K.; Project administration, E.T. and V.K.; Funding acquisition, E.T. and V.K. All authors have read and agreed to the published version of the manuscript.

Funding

This research was funded by the Research Promotion Foundation of Cyprus, grant number PENEK/0609/34, with co-funding from the European Union’s Structural Funds.

Institutional Review Board Statement

Not applicable. The study did not involve humans or other vertebrates.

Data Availability Statement

The data presented in this study are available on request from the corresponding author.

Acknowledgments

We are grateful to Christodoulos Makris, Klaus Siedle and Josef Tumbrinck for providing useful information on Cyprus’ Orthoptera. We would like to thank the Department of Forests and the Department of the Environment for facilitating the fieldwork. In addition, we are grateful to Olga Tzortzakaki for providing useful comments on the data analysis.

Conflicts of Interest

The authors declare no conflicts of interest.

References

  1. Capmourteres, V.; Anand, M. “Conservation value”: A review of the concept and its quantification. Ecosphere 2016, 7, e01476. [Google Scholar] [CrossRef]
  2. Thompson, A.C.; Bazelet, C.S.; Naskrecki, P.; Samways, M.J. Adapting the Dragonfly Biotic Index to a katydid (Tettigoniidae) rapid assessment technique: Case study of a biodiversity hotspot, the Cape Floristic Region, South Africa. J. Orth. Res. 2017, 26, 63–71. [Google Scholar] [CrossRef]
  3. Halmy, M.W.A.; Salem, B.B. Species conservation importance index (SCI) for comparing sites’ conservation value at landscape level. Braz. J. Bot. 2015, 38, 823–835. [Google Scholar] [CrossRef]
  4. Simaika, J.P.; Samways, M.J. An easy-to-use index of ecological integrity for prioritizing freshwater sites and for assessing habitat quality. Biodivers. Conserv. 2009, 18, 1171–1185. [Google Scholar] [CrossRef]
  5. Korbaa, M.; Ferreras-Romero, M.; Ruiz-Garcia, A.; Boumaiza, M. TSOI—A new index on Odonata populations to assess the conservation relevance of watercourses in Tunisia. Odonatologica 2018, 47, 43–72. [Google Scholar] [CrossRef]
  6. Matenaar, D.; Bazelet, C.S.; Hochkirch, A. Simple tools for the evaluation of protected areas for the conservation of grasshoppers. Biol. Conserv. 2015, 192, 192–199. [Google Scholar] [CrossRef]
  7. Joubert-van der Merwe, L.; Pryke, J.S.; Samways, M.J. Well-managed grassland heterogeneity promotes butterfly conservation in a corridor network. J. Environ. Manag. 2019, 238, 382–395. [Google Scholar] [CrossRef]
  8. D’Amen, M.; Bombi, P.; Campanaro, A.; Zapponi, L.; Bologna, M.A.; Mason, F. Po ssible directions in the protection of the neglected invertebrate biodiversity. Anim. Conserv. 2013, 16, 383–385. [Google Scholar] [CrossRef]
  9. Kostopoulou, E.; Jones, P.D. Assessment of climate extremes in the Eastern Mediterranean. Meteorol. Atmos. Phys. 2005, 89, 69–85. [Google Scholar] [CrossRef]
  10. Courchamp, F.; Hoffmann, B.D.; Russell, J.C.; Leclerc, C.; Bellard, C. Climate change, sea-level rise, and conservation: Keeping island biodiversity afloat. Trends Ecol. Evol. 2014, 29, 127–130. [Google Scholar] [CrossRef]
  11. Vogiatzakis, I.N.; Mannion, A.M.; Sarris, D. Mediterranean island biodiversity and climate change: The last 10,000 years and the future. Biodivers. Conserv. 2016, 25, 2597–2627. [Google Scholar] [CrossRef]
  12. Médail, F. The specific vulnerability of plant biodiversity and vegetation on Mediterranean islands in the face of global change. Reg. Environ. Chang. 2017, 17, 1775–1790. [Google Scholar] [CrossRef]
  13. Veron, S.; Mouchet, M.; Govaerts, R.; Haevermans, T.; Pellens, R. Vulnerability to climate change of islands worldwide and its impact on the tree of life. Sci. Rep. 2019, 9, 14471. [Google Scholar] [CrossRef] [PubMed]
  14. Kougioumoutzis, K.; Kokkoris, I.P.; Panitsa, M.; Trigas, P.; Strid, A.; Dimopoulos, P. Plant Diversity Patterns and Conservation Implications under Climate-Change Scenarios in the Mediterranean: The Case of Crete (Aegean, Greece). Diversity 2020, 12, 270. [Google Scholar] [CrossRef]
  15. Adu-Acheampong, S.; Samways, M.J.; Landmann, T.; Kyerematen, R.; Minkah, R.; Mukundamago, M.; Moshobane, C.M. Endemic grasshopper species distribution in an agro-natural landscape of the Cape Floristic Region, South Africa. Ecol. Eng. 2017, 105, 133–140. [Google Scholar] [CrossRef]
  16. Zografou, K.; Adamidis, G.C.; Grill, A.; Kati, V.; Wilson, R.J.; Halley, J.M. Who flies first?—Habitat-specific phenological shifts of butterflies and orthopterans in the light of climate change: A case study from the south-east Mediterranean. Ecol. Entomol. 2015, 40, 562–574. [Google Scholar] [CrossRef]
  17. Báldi, A.; Kisbenedek, T. Orthopteran assemblages as indicators of grassland naturalness in Hungary. Agric. Ecosyst. Environ. 1997, 66, 121–129. [Google Scholar] [CrossRef]
  18. Kati, V.; Mani, P.; von Helversen, O.; Willemse, F.; Elsner, N.; Dimopoulos, P. Human Land use Threatens Endemic Wetland Species: The Case of Chorthippus lacustris (La Greca and Messina 1975) (Orthoptera: Acrididae) in Epirus, Greece. J. Insect Conserv. 2006, 10, 65–74. [Google Scholar] [CrossRef]
  19. Schirmel, J.R.; Gerlach, R.; Buhk, C. Disentangling the role of management, vegetation structure, and plant quality for Orthoptera in lowland meadows. Insect Sci. 2019, 26, 366–378. [Google Scholar] [CrossRef] [PubMed]
  20. Hochkirch, A.; Nieto, A.; García Criado, M.; Cálix, M.; Braud, Y.; Buzzetti, F.M.; Chobanov, D.; Odé, B.; Presa Asensio, J.J.; Willemse, L.; et al. European Red List of Grasshoppers, Crickets and Bush-Crickets; Publications Office of the European Union: Luxembourg, 2016. [Google Scholar]
  21. Médail, F.; Diadema, K. Glacial refugia influence plant diversity patterns in the Mediterranean Basin. J. Biogeogr. 2009, 36, 1333–1345. [Google Scholar] [CrossRef]
  22. Christodoulou, C.S.; Griffiths, G.H.; Vogiatzakis, I.N. Using threatened plant species to identify conservation gaps and opportunities on the island of Cyprus. Biodivers. Conserv. 2018, 27, 2837–2858. [Google Scholar] [CrossRef]
  23. Kadis, K.; et al. Strategy for Biodiversity in Cyprus; Frederick University: Nicosia, Cyprus, 2012. [Google Scholar]
  24. Hewitt, G. Mediterranean Peninsulas: The Evolution of Hotspots. In Biodiversity Hotspots: Distribution and Protection of Conservation Priority Areas; Zachos, F.E., Habel, J.C., Eds.; Springer: Berlin/Heidelberg, Germany, 2011; pp. 123–147. [Google Scholar]
  25. Olson, D.M.; Dinerstein, E.; Wikramanayake, E.D.; Burgess, N.D.; Powell, G.V.N.; Underwood, E.C.; D’amico, J.A.; Itoua, I.; Strand, H.E.; Morrison, J.C.; et al. Terrestrial Ecoregions of the World: A New Map of Life on Earth: A new global map of terrestrial ecoregions provides an innovative tool for conserving biodiversity. Bioscience 2001, 51, 933–938. [Google Scholar] [CrossRef]
  26. Tumbrinck, J. An annotated checklist of the Orthoptera (Saltatoria) of Cyprus. Articulata 2006, 21, 121–159. [Google Scholar]
  27. Siedle, K.; Tumbrinck, J.; Tzirkalli, E. Orthoptera. In An Introduction to the Wildlife of Cyprus; Sparrow, D.J., John, E., Eds.; Terra Cypria: Nicosia, Cyprus, 2016; pp. 132–173. [Google Scholar]
  28. Sevgili, H.; Ciplak, B.; Heller, G.K.; Demirsoy, A. Morphology, bioacoustics and phylogeography of the Isophya major group (Orthoptera: Tettigoniidae: Phaneropterinae): A species complex occurring in Anatolia and Cyprus. Eur. J. Entomol. 2006, 103, 657–671. [Google Scholar] [CrossRef]
  29. Ünal, M. Tettigoniidae (Orthoptera) from Turkey and the Middle East II. Trans. Am. Entomol. 2012, 138, 21–54. [Google Scholar]
  30. Tsintides, T.; Hadjikyriakos, G.; Christodoulou, C. Trees and Shrubs in Cyprus; Foundation, A.G. Leventis, Cyprus Forest Association: Nicosia, Cyprus, 2002. [Google Scholar]
  31. Tsintides, T.; Christodoulou, C.S.; Delipetrou, P.; Georghiou, K. The Red Data Book of the Flora of Cyprus; Cyprus Forestry Association: Nicosia, Cyprus, 2007. [Google Scholar]
  32. ESRI ArcGIS 10; Environmental Systems Research Institute: Redlands, CA, USA, 2010.
  33. EEA. Corine Land Cover 2006. Available online: https://www.eea.europa.eu/data-and-maps/data/clc-2006-vector-data-version (accessed on 10 January 2011).
  34. Kati, V.; Zografou, K.; Tzirkalli, E.; Chitos, T.; Willemse, L. Butterfly and grasshopper diversity patterns in humid Mediterranean grasslands: The roles of disturbance and environmental factors. J. Insect Conserv. 2012, 16, 807–818. [Google Scholar] [CrossRef]
  35. Willemse, F. A Key to the Orthoptera Species of Greece; Hellenic Zoological Society: Athens, Greece, 1985. [Google Scholar]
  36. Oksanen, J.; Blanchet, F.G.; Friendly, M.; Kindt, R.; Legendre, P.; McGlinn, D.; Minchin, P.R.; O’Hara, R.B.; Simpson, G.L.; Solymos, P.; et al. vegan: Community Ecology Package. R package version 2.5–4. 2020. Available online: https://cran.r-project.org/web/packages/vegan/index.html (accessed on 3 February 2020).
  37. R Core Team. R: A Language and Environment for Statistical Computing; R Foundation for Statistical Computing: Vienna, Austria, 2020; Available online: http://www.R-project.org/ (accessed on 3 February 2020).
  38. Zuur, A.; Ieno, E.N.; Walker, N.; Saveliev, A.A.; Smith, G.M. Mixed Effects Models and Extensions in Ecology with R; Springer: New York, NY, USA, 2009. [Google Scholar]
  39. Zuur, A.F.; Ieno, E.N.; Elphick, C.S. A protocol for data exploration to avoid common statistical problems. Methods Ecol. Evol. 2010, 1, 3–14. [Google Scholar] [CrossRef]
  40. Venables, W.N.; Ripley, B.D. Modern Applied Statistics with S, 4th ed.; Springer: New York, NY, USA, 2002. [Google Scholar]
  41. Fox, J.; Weisberg, S. An {R} Companion to Applied Regression, 2nd ed.; Sage: Thousand Oaks, CA, USA, 2011. [Google Scholar]
  42. Nagy, A.; Rácz, I.A.; Arnóczkyné Jakab, D.; Szanyi, S. Setting priorities and evaluation of habitats for the conservation of orthopterans: Case study in the Aggtelek National Park (N Hungary). Biol. Futura 2023, 74, 401–412. [Google Scholar] [CrossRef]
  43. Çiplak, B. Distribution of Tettigoniinae (Orthoptera, Tettigoniidae) bush-crickets in Turkey: The importance of the Anatolian Taurus Mountains in biodiversity and implications for conservation. Biodivers. Conserv. 2003, 12, 47–64. [Google Scholar] [CrossRef]
  44. Kruess, A.; Tscharntke, T. Grazing Intensity and the Diversity of Grasshoppers, Butterflies, and Trap-Nesting Bees and Wasps. Conserv. Biol. 2002, 16, 1570–1580. [Google Scholar] [CrossRef]
  45. Kati, V.; Dufrêne, M.; Legakis, A.; Grill, A.; Lebrun, P. Conservation management for Orthoptera in the Dadia reserve, Greece. Biol. Conserv. 2004, 115, 33–44. [Google Scholar] [CrossRef]
  46. Zografou, K.; Sfenthourakis, S.; Pullin, A.; Kati, V. On the surrogate value of red-listed butterflies for butterflies and grasshoppers: A case study in Grammos site of Natura 2000, Greece. J. Insect Conserv. 2009, 13, 505–514. [Google Scholar] [CrossRef]
  47. Department of Forest; Food and Agricultural Organization. Forestry Outlook Study for Cyprus, Opportunities and Challenges towards 2020; Department of Forest, Ministry of Agriculture, Rural Development and Environment: Nicosia, Cyprus, 2005. [Google Scholar]
  48. Zakkak, S.; Radovic, A.; Nikolov, S.C.; Shumka, S.; Kakalis, L.; Kati, V. Assessing the effect of agricultural land abandonment on bird communities in southern-eastern Europe. J. Environ. Manag. 2015, 164, 171–179. [Google Scholar] [CrossRef] [PubMed]
  49. Schlegel, J.; Riesen, M. Bracken fern (Pteridium aquilinum (L.) Kuhn) overgrowth on dry Alpine grassland impedes Red List Orthoptera but supports local orthopteran beta diversity. J. Insect Conserv. 2021, 25, 657–669. [Google Scholar] [CrossRef]
  50. Gebeyehu, S.; Samways, M.J. Responses of grasshopper assemblages to long-term grazing management in a semi-arid African savanna. Agric. Ecosyst. Environ. 2003, 95, 613–622. [Google Scholar] [CrossRef]
  51. Wettstein, W.; Schmid, B. Conservation of arthropod diversity in montane wetlands: Effect of altitude, habitat quality and habitat fragmentation on butterflies and grasshoppers. J. Appl. Ecol. 1999, 36, 363–373. [Google Scholar] [CrossRef]
  52. Ingrisch, S. The plurennial life cycles of the European Tettigoniidae (Insecta: Orthoptera). Oecologia 1986, 70, 624–630. [Google Scholar] [CrossRef]
  53. Antonatos, S.; Emmanouel, N.; Fantinou, A.; Tsagkarakis, A.; Anagnostopoulos, A.; Ntampakis, D. Seasonal population fluctuation and spatial distribution of Orthoptera in two grassland areas of Attica—Greece. J. Nat. Hist. 2014, 48, 661–674. [Google Scholar] [CrossRef]
  54. Gavlas, V.; Bednár, J.; Krištín, A. A comparative study on orthopteroid assemblages along a moisture gradient in the Western Carpathians. Biologia 2007, 62, 95–102. [Google Scholar] [CrossRef]
  55. Sliacka, A.; Krištín, A.; Naďo, L. Response of Orthoptera to clear-cuts in beech forests. Eur. J. Entomol. 2013, 110, 319–326. [Google Scholar] [CrossRef]
  56. Helbing, F.; Blaeser, T.P.; Löffler, F.; Fartmann, T. Response of Orthoptera communities to succession in alluvial pine woodlands. J. Insect Conserv. 2014, 18, 215–224. [Google Scholar] [CrossRef]
  57. Pina, S.; Vasconcelos, S.; Reino, L.; Santana, J.; Beja, P.; Sánchez-Oliver, J.S.; Catry, I.; Moreira, F.; Ferreira, S. The Orthoptera of Castro Verde Special Protection Area (Southern Portugal): New data and conservation value. ZooKeys 2017, 691, 19–48. [Google Scholar] [CrossRef]
  58. Crous, C.J.; Samways, M.J.; Pryke, J.S. Grasshopper assemblage response to surface rockiness in Afro-montane grasslands. Insect Conserv. Divers. 2014, 7, 185–194. [Google Scholar] [CrossRef]
  59. Zografou, K.; Adamidis, G.C.; Komnenov, M.; Kati, V.; Sotirakopoulos, P.; Pitta, E.; Chatzaki, M. Diversity of spiders and orthopterans respond to intra-seasonal and spatial environmental changes. J. Insect Conserv. 2017, 21, 531–543. [Google Scholar] [CrossRef]
  60. Joubert-Van der Merwe, L.; Pryke, J.S. Is cattle grazing more important than landscape heterogeneity for grasshoppers in Afromontane grassland? J. Orthoptera Res. 2018, 27, 13–21. [Google Scholar] [CrossRef]
  61. Krämer, B.; Poniatowski, D.; Villar, L.; Fartmann, T. The Orthoptera communities of sub-Mediterranean dry grasslands (Aphyllanthion alliance) in the western Spanish Pyrenees. Articulata 2010, 25, 59–72. [Google Scholar]
  62. Löffler, F.; Fartmann, T. Effects of landscape and habitat quality on Orthoptera assemblages of pre-alpine calcareous grasslands. Agric. Ecosyst. Environ. 2017, 248, 71–81. [Google Scholar] [CrossRef]
  63. Pe’er, G.; Dicks, L.V.; Visconti, P.; Arlettaz, R.; Báldi, A.; Benton, T.G.; Collins, S.; Dieterich, M.; Gregory, R.D.; Hartig, F.; et al. EU agricultural reform fails on biodiversity. Science 2014, 344, 1090–1092. [Google Scholar] [CrossRef]
  64. Zakkak, S.; Chatzaki, M.; Karamalis, N.; Kati, V. Spiders in the context of agricultural land abandonment in Greek Mountains: Species responses, community structure and the need to preserve traditional agricultural landscapes. J. Insect Conserv. 2014, 18, 599–611. [Google Scholar] [CrossRef]
  65. Nogués-Bravo, D.; Araújo, M.B.; Lasanta, T.; Moreno, J.I.L. Climate Change in Mediterranean Mountains during the 21st Century. AMBIO 2008, 37, 280–285. [Google Scholar] [CrossRef]
  66. Hadjinicolaou, P.; Giannakopoulos, C.; Zerefos, C.; Lange, M.A.; Pashiardis, S.; Lelieveld, J. Mid-21st century climate and weather extremes in Cyprus as projected by six regional climate models. Reg. Environ. Chang. 2011, 11, 441–457. [Google Scholar] [CrossRef]
  67. Balleto, E.; Casale, A. Mediterranean Insect Conservation. In The Conservation of Insects and Their Habitats; Collins, N., Thomas, J., Eds.; Academic Press: London, UK, 1991; pp. 121–142. [Google Scholar]
  68. Suggitt, A.J.; Stefanescu, C.; Páramo, F.; Oliver, T.; Anderson, B.J.; Hill, J.K.; Roy, D.B.; Brereton, T.; Thomas, C.D. Habitat associations of species show consistent but weak responses to climate. Biol. Lett. 2012, 8, 590–593. [Google Scholar] [CrossRef] [PubMed]
  69. Sergeev, M.G. Distribution Patterns of Grasshoppers and Their Kin over the Eurasian Steppes. Insects 2021, 12, 77. [Google Scholar] [CrossRef] [PubMed]
  70. Blondel, J.; Aronson, J.; Bodiou, J.-Y.; Boeuf, G. The Mediterranean Region: Biological Diversity in Space and Time, 2nd ed.; Oxford University Press: New York, NY, USA, 2010. [Google Scholar]
Figure 1. Study area and sampling sites along the four elevational zones. Each grid cell is assigned to one of the habitats studied and an example is given with three of the habitat types (forests, rural mosaics, sclerophyllous vegetation) along with a sampling transect of 300 m and three plots located at each site for Orthoptera sampling.
Diversity 16 00347 g001
Figure 2. Redundancy analysis diagram (RDA) presenting the relationships between the environmental variables and orthopteran species (variation explained 15.12%, p < 0.05). shum: soil humidity, lshrubs: low shrubs. Orthoptera species’ codes can be found in Table S5.
Diversity 16 00347 g002
Table 1. Orthoptera diversity across habitat types. S: species richness, SE: endemic and sub-endemic species richness (in parentheses, number of threatened species according to the IUCN Red List assessment), Mean S: mean species richness, Mean SE: mean endemic species richness, Mean H: mean Shannon–Wiener diversity index, Mean ci: mean species conservation value, Mean StCI: mean Standardized Conservation Index, N sites: number of sites for each habitat type (in parentheses, number of plots). Habitat types are ranked by StCI.
Habitat TypesOverall DiversityAverage Site DiversityN Sites
SSEMean SMean SEMean HMean ciMean StCI
Rural mosaics225 (1)6.25 (±0.75)1.13 (±0.30)1.62 (±0.13)0.42 (±0.02)72.41 (±3.97)8 (24)
Forests1552.62 (±0.23)0.71 (±0.23)0.79 (±0.09)0.40 (±0.02)68.83 (±3.24)21 (63)
Sclerophyllous vegetation1542.89 (±0.35)0.56 (±0.18)0.89 (±0.10)0.39 (±0.02)67.12 (±3.25)9 (27)
Grasslands1133.50 (±1.19)0.75 (±0.25)0.78 (±0.32)0.39 (±0.03)66.76 (±5.54)4 (12)
Transitional woodland/shrubland1224.25 (±1.38)0.75 (±0.48)1.07 (±0.39)0.38 (±0.03)64.54 (±4.53)4 (12)
Agricultural areas1434.17 (±0.60)0.5 (±0.34)1.28 (±0.17)0.37 (±0.02)62.81 (±3.15)6 (18)
Riverine vegetation1633.88 (±0.81)0.25 (±0.16)1.07 (±0.23)0.36 (±0.02)61.83 (±2.95)8 (24)
Total34113.63 (±0.26)0.67 (±0.11)1.02 (±0.07)0.39 (±0.01)67.09 (±1.51)60
Table 2. Best LMs and GLMs for Orthopteran species richness (S), Shannon–Wiener diversity index (H), species conservation value (ci) and Standardized Conservation Index (StCI); D2: percentage of deviance explained (%), R2: adjusted R-squared explained. Statistically significant terms are shown in bold.
VariableEstimateSEz Valuep
S (D2 = 51)
 (Intercept)1.220.0716.77<0.001
 Altitude−0.250.07−3.46<0.001
 Flower heads0.200.063.16<0.05
 Slope−0.120.07−1.660.10
H (D2 = 48)
 Intercept1.020.0519.57<0.001
 Low shrubs−0.130.08−1.690.10
 Herbs−0.150.08−1.940.06
 High shrubs−0.170.09−1.950.06
 Flower heads0.190.072.71<0.05
 Tree cover−0.230.08−2.78<0.05
 Altitude−0.280.06−4.97<0.001
ci (R2 = 0.23)
 Intercept0.330.0159.97<0.001
 Slope−0.010.01−1.560.12
 High shrubs−0.020.01−2.47<0.05
 Rocks0.010.012.61<0.05
 Tree cover−0.020.01−3.51<0.001
StCI (R2 = 0.24)
 Intercept4.210.02228.88<0.001
 Slope−0.030.02−1.700.10
 High shrubs0.050.02−2.52<0.05
 Rocks−0.050.022.52<0.05
 Tree cover−0.080.02−3.67<0.001
Disclaimer/Publisher’s Note: The statements, opinions and data contained in all publications are solely those of the individual author(s) and contributor(s) and not of MDPI and/or the editor(s). MDPI and/or the editor(s) disclaim responsibility for any injury to people or property resulting from any ideas, methods, instructions or products referred to in the content.

