Article

Winds of Change: A Study on the Resource Viability of Offshore Wind Energy in Montenegro

by
Miloš Bogdanović
* and
Špiro Ivošević
Faculty of Maritime Studies Kotor, University of Montenegro, Put I Bokeljske Brigade, 85330 Kotor, Montenegro
*
Author to whom correspondence should be addressed.
Energies 2024, 17(8), 1852; https://doi.org/10.3390/en17081852
Submission received: 12 February 2024 / Revised: 18 March 2024 / Accepted: 8 April 2024 / Published: 12 April 2024
(This article belongs to the Special Issue Recent Development and Future Perspective of Wind Power Generation)

Abstract

:
The energy produced from renewable sources (solar, wind, hydro, geothermal, and biomass) provides direct access to clean and safe energy. Offshore wind energy, generated through wind farms, has traditionally relied on fixed structures, whereas innovative floating structures have been commercially applied since 2017. This study investigates offshore areas in Montenegro suitable for wind farm construction. Research on average annual wind speeds has successfully identified a surface area deemed suitable for constructing a wind farm in the Montenegrin part of the Adriatic Sea. Analysis of available bathymetric databases has pinpointed technical solutions for the supporting structures of wind turbines required to construct an offshore wind farm. Applying an assessment method to the defined surface of Montenegrin waters, seven blocks have been identified as suitable for wind farm construction. The research results indicate that wind farms can be built in Montenegrin waters with a technical potential corresponding to a total capacity of 2299.794 MW, which includes 2034.48 MW for floating structures, 126.759 MW for fixed structures, and 138.555 MW for jacket-fixed structures.

1. Introduction

The harnessing of wind power from seas and oceans is a crucial element in the transition to zero emissions, aiming to reduce harmful exhaust gases from electricity production [1]. To keep the Earth’s temperature increase below 1.5 °C by 2050, global analyses indicate the need to install 500 GW of offshore wind farms by 2030 and a total of 2500 GW by 2050 [2].
Research by Jia et al. (2022) highlights the significant impact of electricity consumption from renewable sources on economic growth, employment, and direct foreign investment [3]. Offshore wind farm projects play a vital role in the blue economy and sustainable development by utilizing the marine ecosystem to generate goods essential for humanity [4]. Furthermore, advancements in engineering within the renewable energy sector have led to a decrease in the levelized cost of energy (LCOE) for renewables, rendering them fully competitive with fossil energy sources in terms of LCOE value [5].
The United Nations Convention on the Law of the Sea (UNCLOS) ensures coastal states have, among other rights, the right to produce electrical energy using wind power. This includes the right to construct wind farms within the territorial sea and the exclusive economic zone of the coastal state [6,7].
Windmills for grinding grain appeared in Europe at the beginning of the 12th century, and the first wind generator was built in Denmark in 1891 [8]. Exactly one hundred years after the construction of the first land-based wind turbine, Denmark also saw the construction of the first offshore wind farm, Vindeby, in 1991, situated in sea depths of 2 to 5 m. This wind farm, comprising 11 turbines each with a capacity of 450 kW, generated electrical energy until 2016 [9]. The first commercial floating wind farm, Hywind Scotland, was commissioned in the UK in 2017 [10]. In 2022, several wind turbine manufacturers, including Siemens Gamesa, Vestas, and General Electric, commenced testing prototypes of 15 MW wind generators for offshore use [11]. The hub of these 15 MW wind turbines is installed at an altitude of 150 m above sea level [12].
According to Wind Europe, in 2021, the capacity factor of onshore wind farms built using modern land-based wind turbines ranged from 30% to 35%. In contrast, modern offshore wind farms exhibited a significantly higher capacity factor, ranging from 42% to 55% [13]. Diaz et al. (2022), in their research, report that the first commercially built floating wind farm achieved a capacity factor of 57.1% in 2021 [10]. Offshore wind farm sites, compared to their onshore counterparts, have access to substantially greater wind energy resources, rendering them markedly more efficient and dependable energy sources [14].
Substantial financial resources are directed toward the development of offshore wind farms. In 2020, these investments represented 12% of all investments in renewable energy sources, amounting to 41 billion USD. The figure decreased to 9%, reaching 39 billion USD in 2021, and further to 7%, totaling 34 billion USD in 2022 [15]. As of 2022, Europe sees the highest number of offshore wind farms in the United Kingdom, with 30, followed by Germany with 19, Denmark with 13, the Netherlands and Belgium with 6 each, and Sweden with 4 offshore wind farms [16]. By the end of 2022, the global total installed capacity of all offshore wind turbines reached 63 GW, with China and the United Kingdom hosting 70% of this capacity [14].
Wind and bathymetric parameter values are pivotal in evaluating the wind potential of an offshore area and in the selection of appropriate supporting structures for wind turbines [17]. Feasibility studies for wind farm construction should rely on precise data of average annual wind speeds, aiming to identify suitable locations for wind farm deployment accurately. Literature categorizes wind parameter prediction methods into four groups: physical, statistical, artificial intelligence (AI) methods, and hybrid methods [18]. The physical method calculates wind speed based on meteorological parameters (air temperature, atmospheric pressure, humidity, etc.) and terrain geomorphological characteristics (soil roughness, topography, obstacles, etc.). Statistical forecasting derives wind speed from historical data, applying mathematical models to correlate wind speed with meteorological parameter values. AI methods employ artificial intelligence to predict wind speed, utilizing statistical methods, fuzzy logic, and probability theory. Hybrid methods combine at least two of the aforementioned approaches [19].
The technical sustainability of offshore wind farm construction hinges on an average annual wind speed surpassing 7 m/s at the rotor hub altitude, as defined by ESMAP (Energy Sector Management Assistance Program), a World Bank entity [20]. The technical wind potential is calculated by multiplying the sea surface area by average annual wind speeds between 7 to 8 m/s, with values set at 3 MW/km2 [20]. In Europe in 2022, offshore wind farms exhibited an average installed capacity density ranging from 5 MW/km2 to 5.4 MW/km2 [4].
The bathymetry of an area significantly influences the choice of supporting structure for wind turbines, thereby impacting the construction costs of wind power plants [21]. In European waters, only 20% of the total wind potential lies within depths of up to 60 m [22]. Key factors determining the selection of support structures include sea depth at the construction site and soil characteristics [23]. Wind farms are constructed using fixed support structures up to 60 m deep; however, beyond this depth, floating structures become the sole feasible option [24]. Various support structures such as monopiles, tripods, tripiles, jackets, and gravity-based foundations are used for installing wind turbine towers [25]. For depths ranging from 50 to 60 m, jacket support structures are exclusively employed [26].

1.1. Literature Review of Recent Research

Research by Mathern et al. (2020) revealed that in 2019, fixed offshore wind farms globally comprised 4258 monopile structures, 301 gravity-based foundations, 468 jacket structures, 126 tripod structures, and 80 tripile structures [27]. By the end of 2023, four floating wind farms were operational worldwide, boasting individual capacities surpassing 24 MW: Hywind Scotland (UK) (30 MW), Kincardine (UK) (50 MW), Windfloat Atlantic (Portugal) (25 MW), and Hywind Tampen (Norway) (88 MW) [12,28,29]. The cumulative installed capacity of floating wind farms globally reached 211.4 MW by the end of 2023 [12,29,30]. Various types of supporting floating structures, including semi-submersible, tension leg platform (TLP), and spar, have been developed [31]. In 2022, the planned construction capacity of floating wind farms at a global scale reached 102.529 GW, marking a notable increase of 41.783 GW compared to 2021 [12].
The considerable wind power potential in oceans and seas has prompted extensive research into the feasibility of constructing wind farms in these regions. Mingxin et al. (2023) conducted an analysis of offshore wind farm potential in Malaysia, utilizing data from the Global Wind Atlas database. Wind speed and bathymetry data for Malaysia’s sea area were extracted from the Global Wind Atlas, which sources its bathymetric information from the GEBCO (General Bathymetry Chart of the Oceans) database. The researchers established a sea depth threshold of over 60 m when selecting supporting structures (fixed or floating). Analysis was performed using tools provided by the Global Wind Atlas software. However, the study did not employ GIS (Geographic Information System) and thus did not quantify Malaysia’s total technical potential in MW. Furthermore, the authors did not precisely delineate the specific surface areas with coordinates where these potentials are present [17].
Rehman et al. (2022) conducted an assessment of wind potential at 100 m above sea level for six locations in the northern part of the Suez Gulf. Utilizing the ERA5 dataset as a reference, the study provided general depth information for the six locations regarding bathymetry but did not leverage more precise bathymetric databases. Wind potentials for these areas were estimated through mathematical models. However, since the study did not utilize GIS software, it did not generate data on the overall estimated technical potentials of the areas and precise geographic coordinates [32].
Onea et al. (2021) assessed the potential of the exclusive economic zone of the Romanian part of the Black Sea. For wind analysis, the study utilized two databases: ERA5 and satellite measurements from AVISO (Archiving Validation Interpretation of Satellite Oceanographic) data. GEBCO served as the reference bathymetric database. They applied a mathematical model to process databases of mean annual wind speeds. A sea depth greater than 50 m is considered a determining factor when choosing supporting structures (fixed or floating) [33]. Yildirir et al. (2022) also assessed the wind potential of the northern part of the Romanian coast of the Black Sea. In their research, ERA5 and MERRA-2 (Modern Era Retrospective analysis for Research and Applications) databases were used for two inland locations, one coastal location, and two offshore locations. The databases were compared with values from actual measurements. The research determined that ERA5 shows better consistency with inland locations, while MERRA-2 demonstrates better consistency with coastal locations [34].
AL-Hinai et al. (2021) assessed the offshore wind potential in Oman using statistical analysis of the ERA5 database. Their research indicates that potential offshore wind generators can produce at least 1.34 times more energy than onshore wind generators. The study does not include a bathymetric analysis of Oman’s maritime area, so it does not define the support structures needed for areas of different depths [35].
Das et al. (2023) assessed barriers affecting the development of the wind energy production industry in Bangladesh, both onshore and offshore. Through a comprehensive review of existing literature, they identified 6 main barriers and 18 sub-barriers that impact wind farm development. The main barriers are categorized into technical, political, administrative, economic, social, and geographic categories. In the Multiple Criteria Decision Making (MCDM) methodology, they utilized the Analytic Hierarchy Process [36].
Castro et al. (2022) conducted a study assessing wind farm construction in the Caribbean region of Colombia using the Fuzzy Analytic Hierarchy Process (FAHP) integrated with a GIS system as part of the Multiple Criteria Decision Making (MCDM) process. Wind speeds were sourced from the International Renewable Energy Agency (IRENA), and the study delineates five feasible zones for offshore wind farm construction based on predefined criteria [21].
GIS, combined with multilevel decision-making techniques, serves as a fundamental approach in the strategic planning of offshore wind development [21]. In a study by Moltames et al. (2021), a methodology leveraging MCDM and GIS software is proposed, considering 14 layers of information in the selection of wind farm construction sites [37]. An integral step in the MCDM process involves determining the weighting criteria for each layer. Xentidis et al. (2022) enumerate various techniques for criterion determination, including the Analytic Hierarchy Process, Weighted Linear Combination, Simple Additive Weighting, Fuzzy Analytic Hierarchy Process, and Best Worst Method [38].

1.2. Montenegro Case Study

Montenegro is a small country located in Southeastern Europe with a population of about 620,000 inhabitants. It is situated along the Adriatic Sea, covering a total area of 13,883 km2, with a coastline stretching 293.5 km [39]. As per the temporary demarcation protocol between Croatia and Montenegro (azimuth 206°), Montenegro’s territorial sea encompasses approximately 2022 km2. The surface area of Montenegro’s exclusive economic zone varies from 6002 km2 (based on Montenegro’s required azimuth of 231°) to 4110 km2 (accounting for Croatia’s required azimuth of 206°) [40]. In terms of bathymetry, around 3% of Montenegro’s maritime zone lies at depths less than 50 m, while approximately 33% of the sea surface exceeds 1000 m in depth [41].
Montenegro’s power production system relies on hydroelectric power plants, wind farms, solar sources, and one coal-fired power plant. By the end of 2022, the total installed capacity of all production facilities reached 1053.044 MW, with the coal-fired power plant contributing 21.37% of the total installed capacity. In 2022, this coal-fired plant accounted for 44.95% of Montenegro’s total electricity production [42]. Montenegro is a member of the international organization Energy Community and implements a CO2 emissions taxation system (ETS system) [43]. In 2022, Montenegro’s power system generated a total of 3235.08 GWh of electricity, representing only a 4.4% increase compared to the country’s total electricity consumption for the same year [44].
Through the adoption of the Law on the Sea, Montenegro has incorporated UNCLOS into its domestic legislation, granting rights for wind farm construction within its territorial sea and exclusive economic zone [1,45].
The production of electricity from renewable energy sources in Montenegro is regulated by the Law on Energy. While the law includes articles related to renewable energy sources, upon analyzing its provisions, it is not evident that the legislator specifically considered the production of electricity by offshore wind farms [46]. To explore and extract hydrocarbons in Montenegro’s offshore regions, the government made decisions in 2011 and 2014, delineating the maritime area where Montenegro holds sovereign rights for hydrocarbon exploration and production [47,48].
Under the UNCLOS convention, the coastal state is granted rights to produce energy using wind power and exploit natural resources, including hydrocarbons, within the same area. Hence, the maritime zone designated by the Government of Montenegro for hydrocarbon exploration and production is also recognized as the area where Montenegro can harness wind energy. The zone where Montenegro has the right to produce wind energy is depicted in blue in Figure 1a [48].
In line with the decision of the Government of Montenegro, activities related to hydrocarbons are prohibited within a distance of less than 3 km from the coast [49]. The topic of oil and gas exploration in the Montenegrin offshore area was reintroduced in 2010 with the adoption of relevant legislative regulations. The first concession agreement, involving companies Eni Montenegro BV and Novatek Montenegro BV, was concluded in 2016. Subsequently, the second agreement with the company Energean Montenegro LTD. was finalized in 2017 [50]. According to official information, both contracts are terminated, and there are currently no offshore platforms or wind farms built at sea in Montenegro [42,49].
Based on the available databases of mean annual wind speeds at sea and bathymetry, this research conducted, for the first time, an assessment of the potential capacities of wind farms in Montenegrin waters, along with possible technical solutions for their construction.
The paper is organized into five sections. Section 2 details the research methodology, available databases on wind speeds and sea depth, as well as the assessment method. In Section 3, the results of the research are presented, while Section 4 discusses the obtained results in view of the possibility of applying different technical solutions. The final section provides concluding considerations and outlines directions for future research.

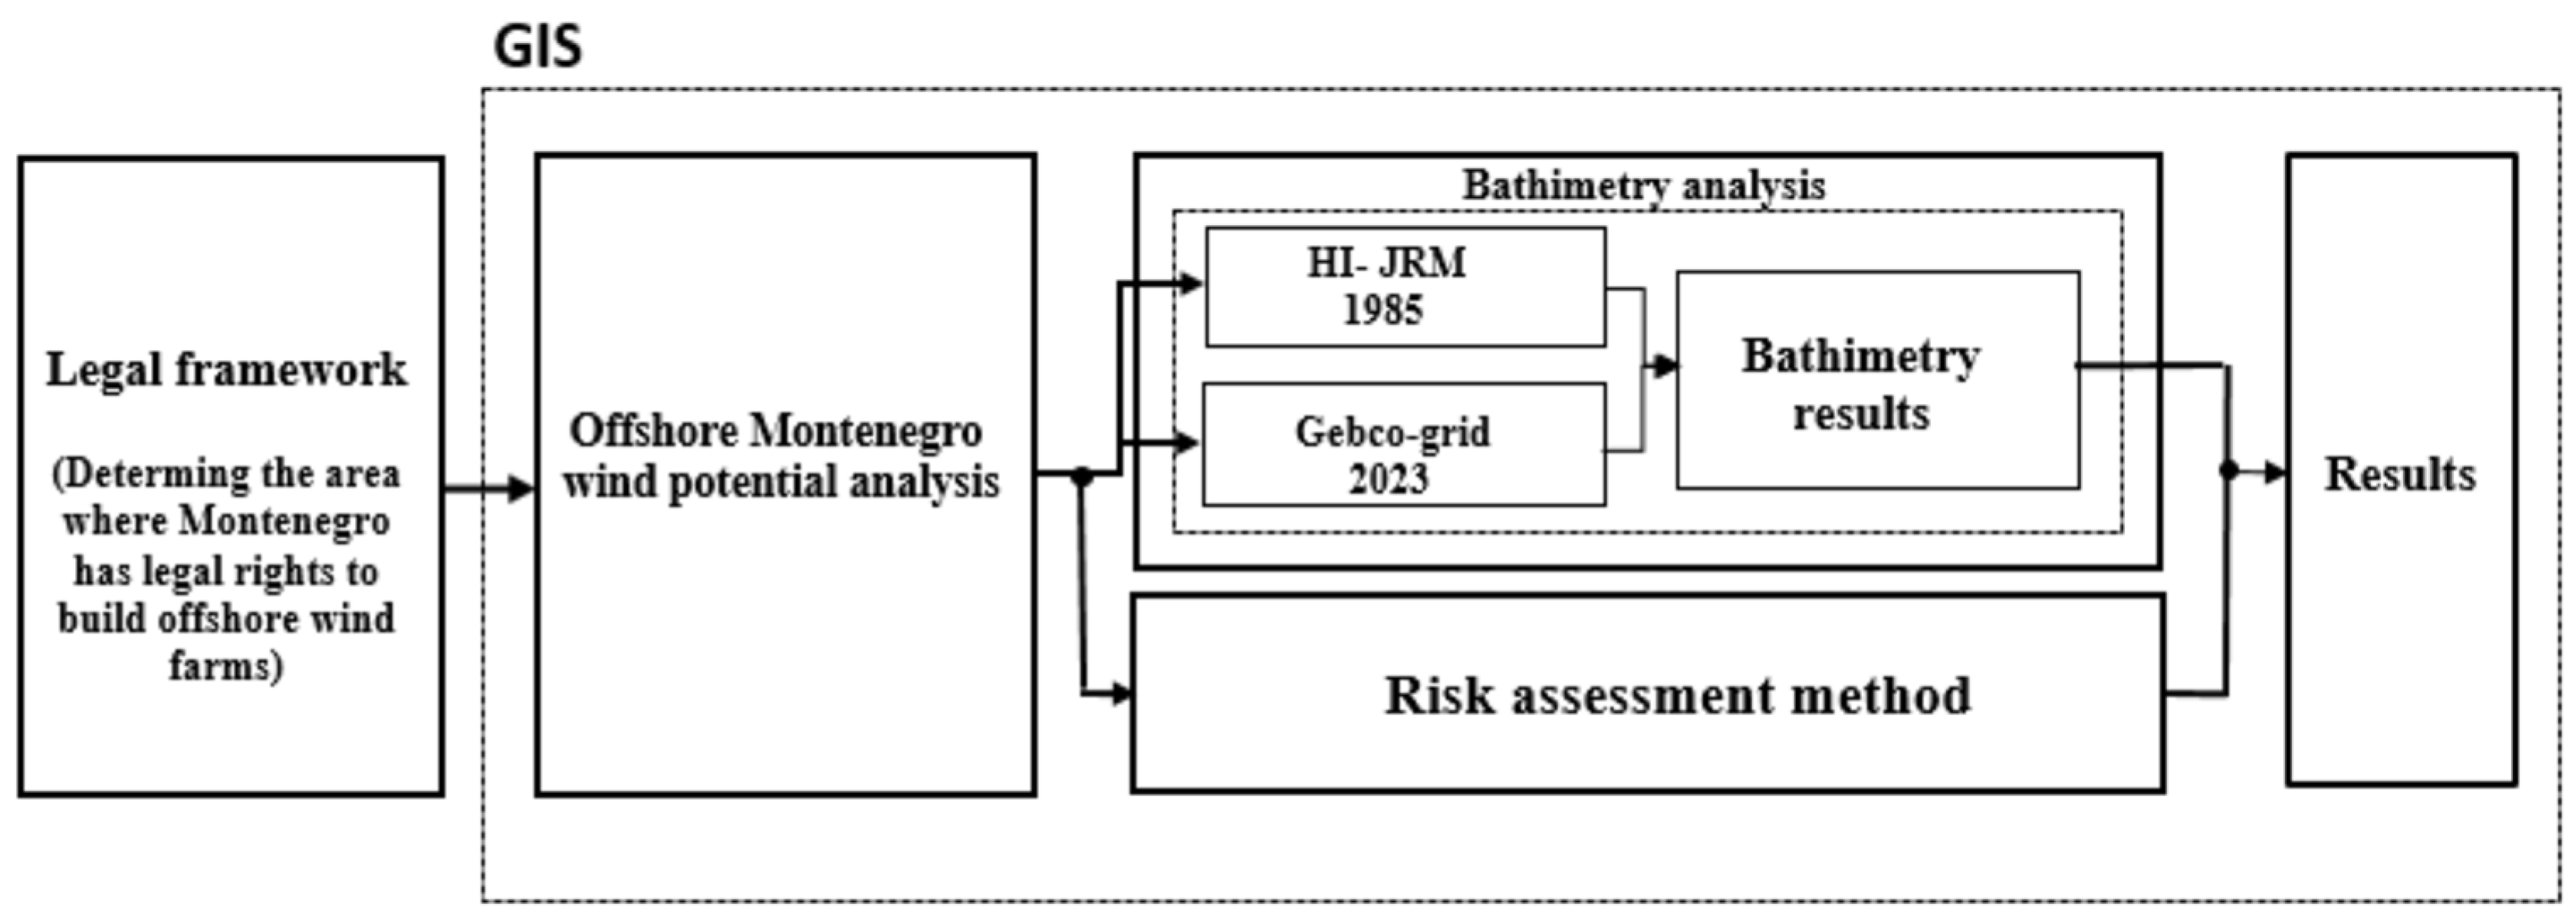
2. Materials and Methods

To identify the areas where Montenegro has the right to construct offshore wind farms, an analysis of UNCLOS, national energy legislation, and the Government of Montenegro’s decisions on the designation of blocks for hydrocarbon exploration and production was conducted [6,45,46,47,48].
Comprehensive research is conducted using GIS software for thorough analysis. Following the conceptual model outlined in Figure 2, an assessment of the wind potential was carried out for the sea surface where Montenegro has legal rights to build wind farms. This assessment involved analyzing the average annual wind speed at sea. Subsequently, relevant bathymetry databases (HI-JRM 1985 and GEBCO-grid 2023) were analyzed on surfaces with suitable average annual wind speeds for offshore wind farm construction to define technical solutions for supporting wind turbine structures. By applying the assessment method, an assessment of the potential for the construction of wind farms was made for each individual offshore block, in order to determine which blocks are suitable for the construction of wind farms. By combining the results of the analysis of mean annual wind speeds and bathymetry, the estimated overall technical potentials for the construction of offshore wind farms were defined, as well as the portion of wind potential that can be harnessed using fixed or floating support structures.
The assessment of the potential for the construction of offshore wind farms was conducted for the offshore blocks designated by the Government of Montenegro for exploration and production of hydrocarbons (Figure 1a) [47,48]. These decisions defined the blocks using a coordinate grid system with dimensions of 12 arc-minutes east-west and 10 arc-minutes north-south. The blocks are delineated within macroblocks with dimensions of 1 × 1 arc degree [47].
The analysis of the blocks to determine the limit values of the mean annual wind speed at 150 m above sea level was conducted by establishing a network of control points across the observed surface. These control points are positioned at intervals of 0.36 arc degrees east-west (approximately 500 m) and 0.36 arc degrees north-south (approximately 660 m). Due to the substantial number of control points on the observed surface, the network is presented in Figure 1b only as an illustration.

2.1. Relevant Databases of Conducted Research

The paper analyzed databases of mean annual wind speeds and bathymetry. The analysis of average annual wind speeds resulted in a precise identification of the sea area estimated to be suitable for the construction of an offshore wind farm. Utilizing assessment methods, offshore blocks with resource potential for wind power plant construction were identified. The analysis of bathymetry databases provided insights into technical solutions for supporting structures necessary for the development of an offshore wind farm.

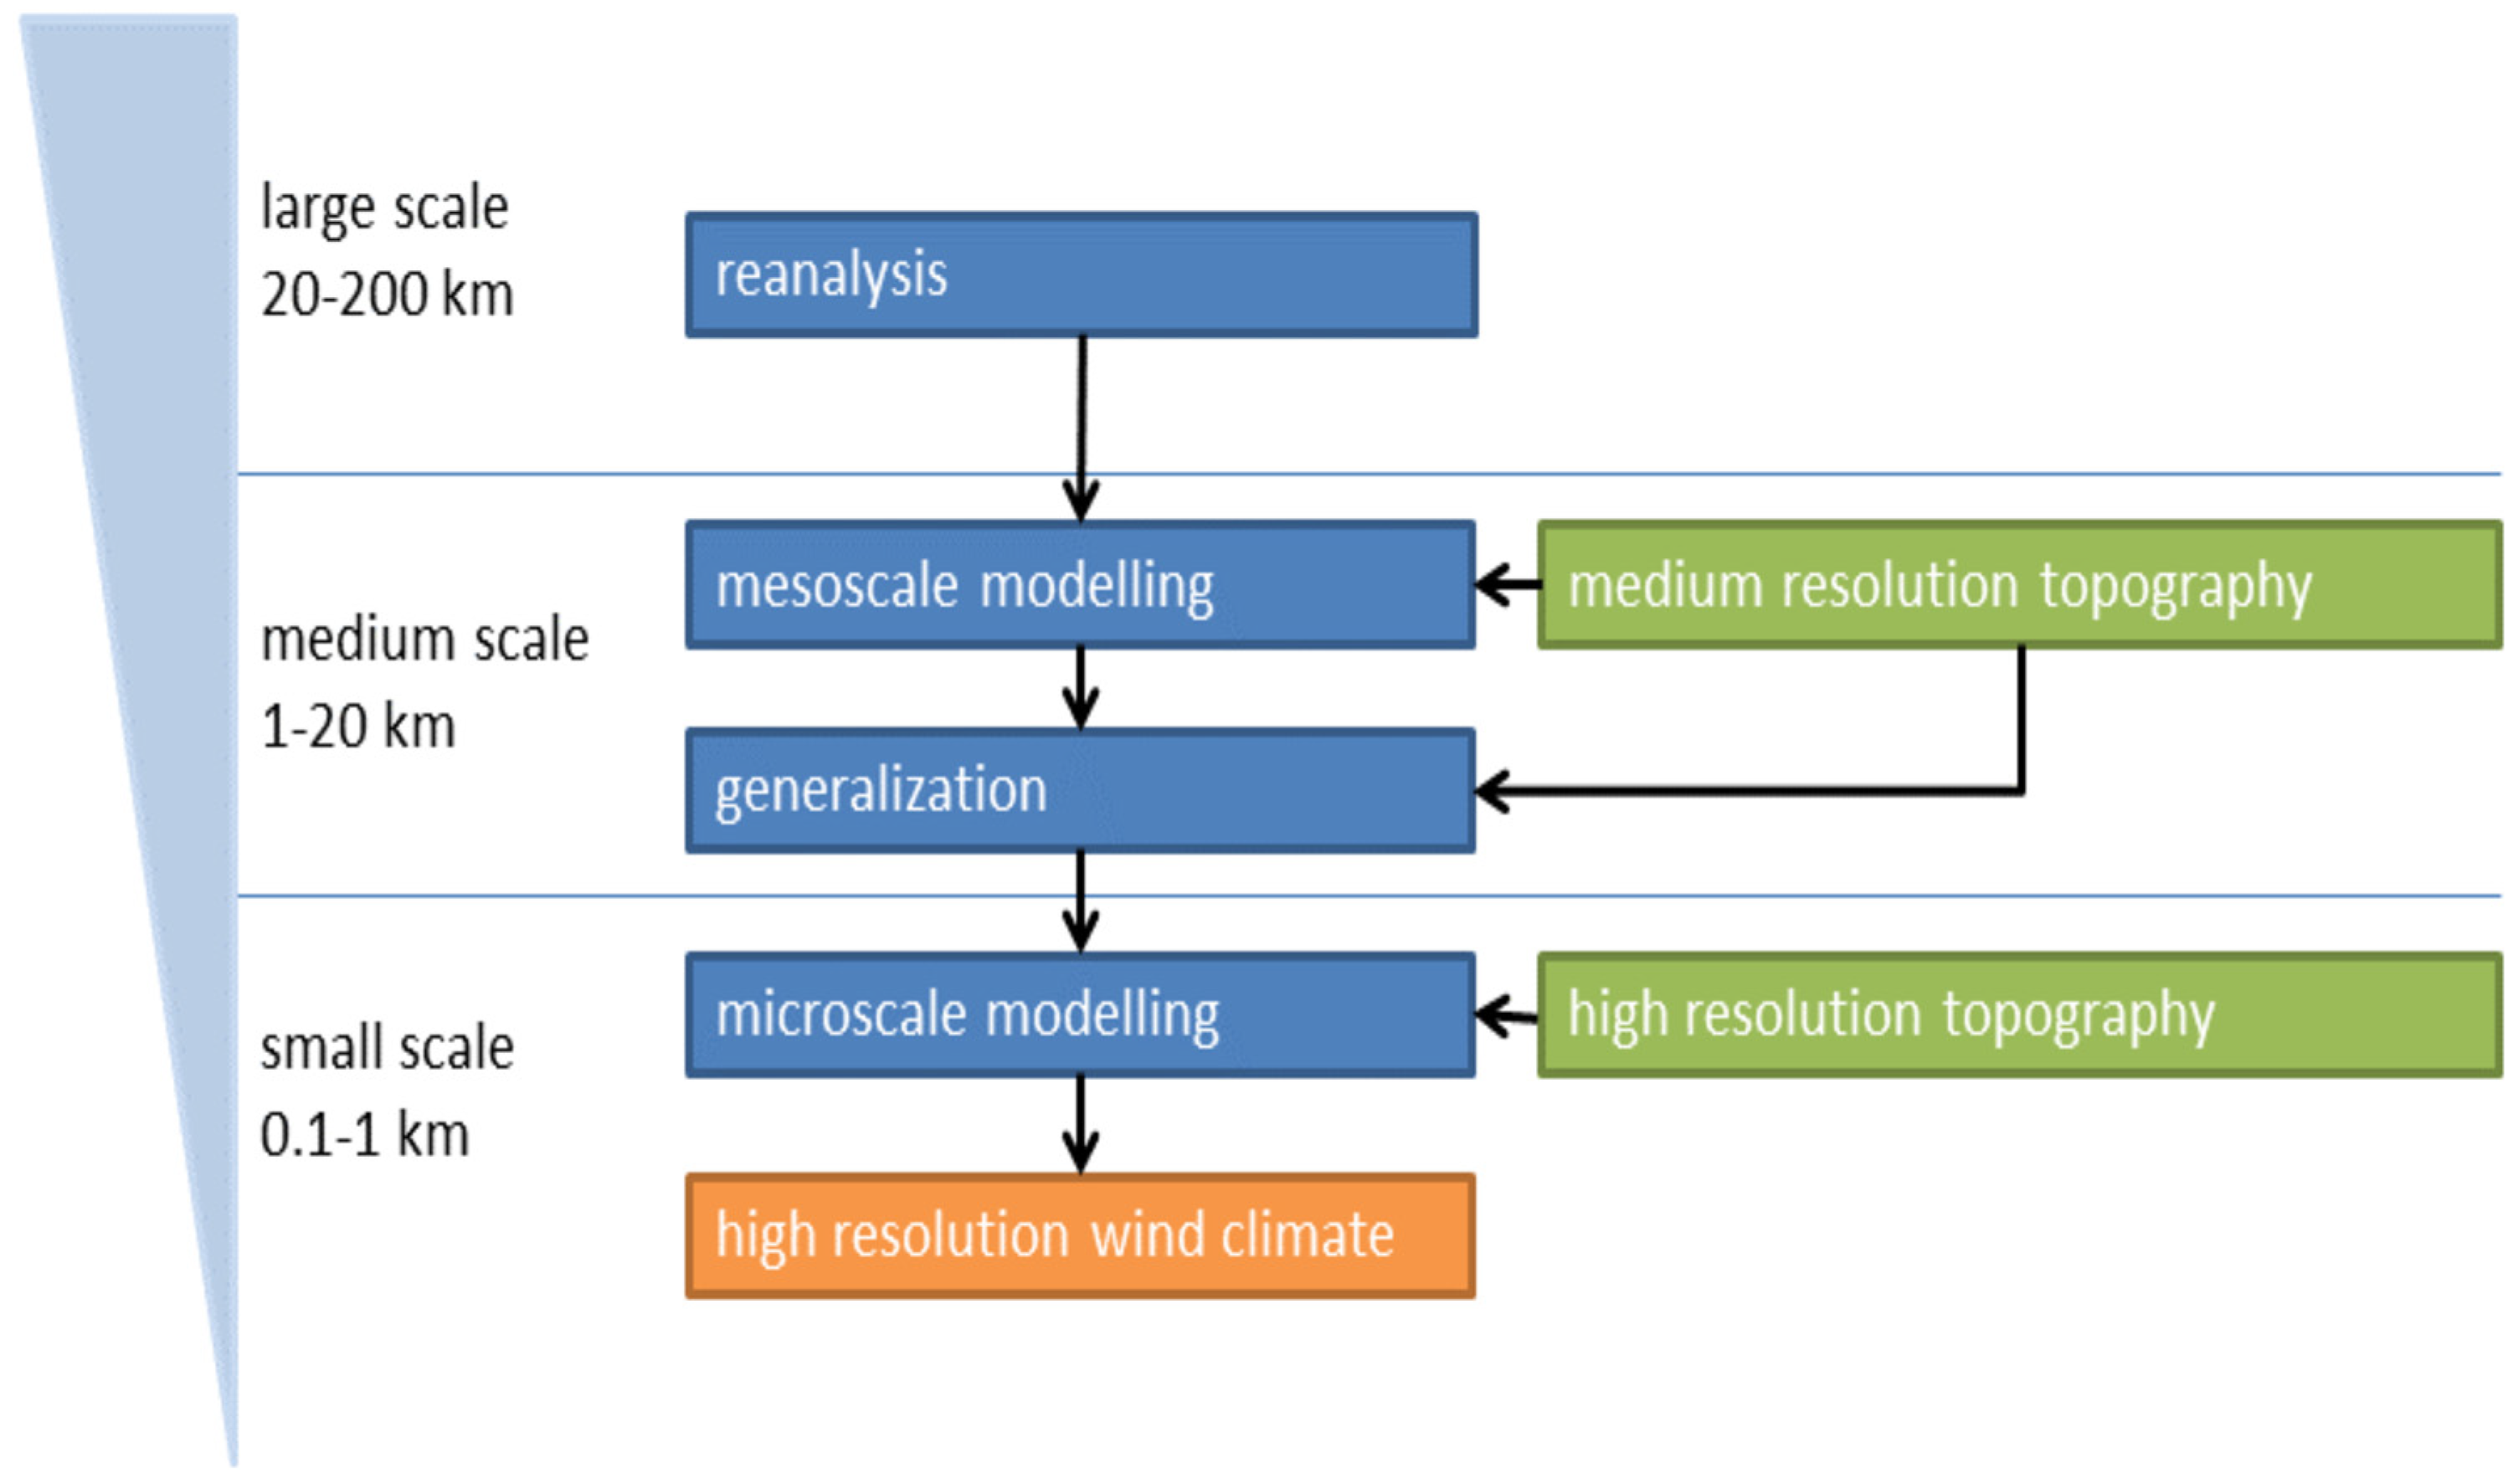
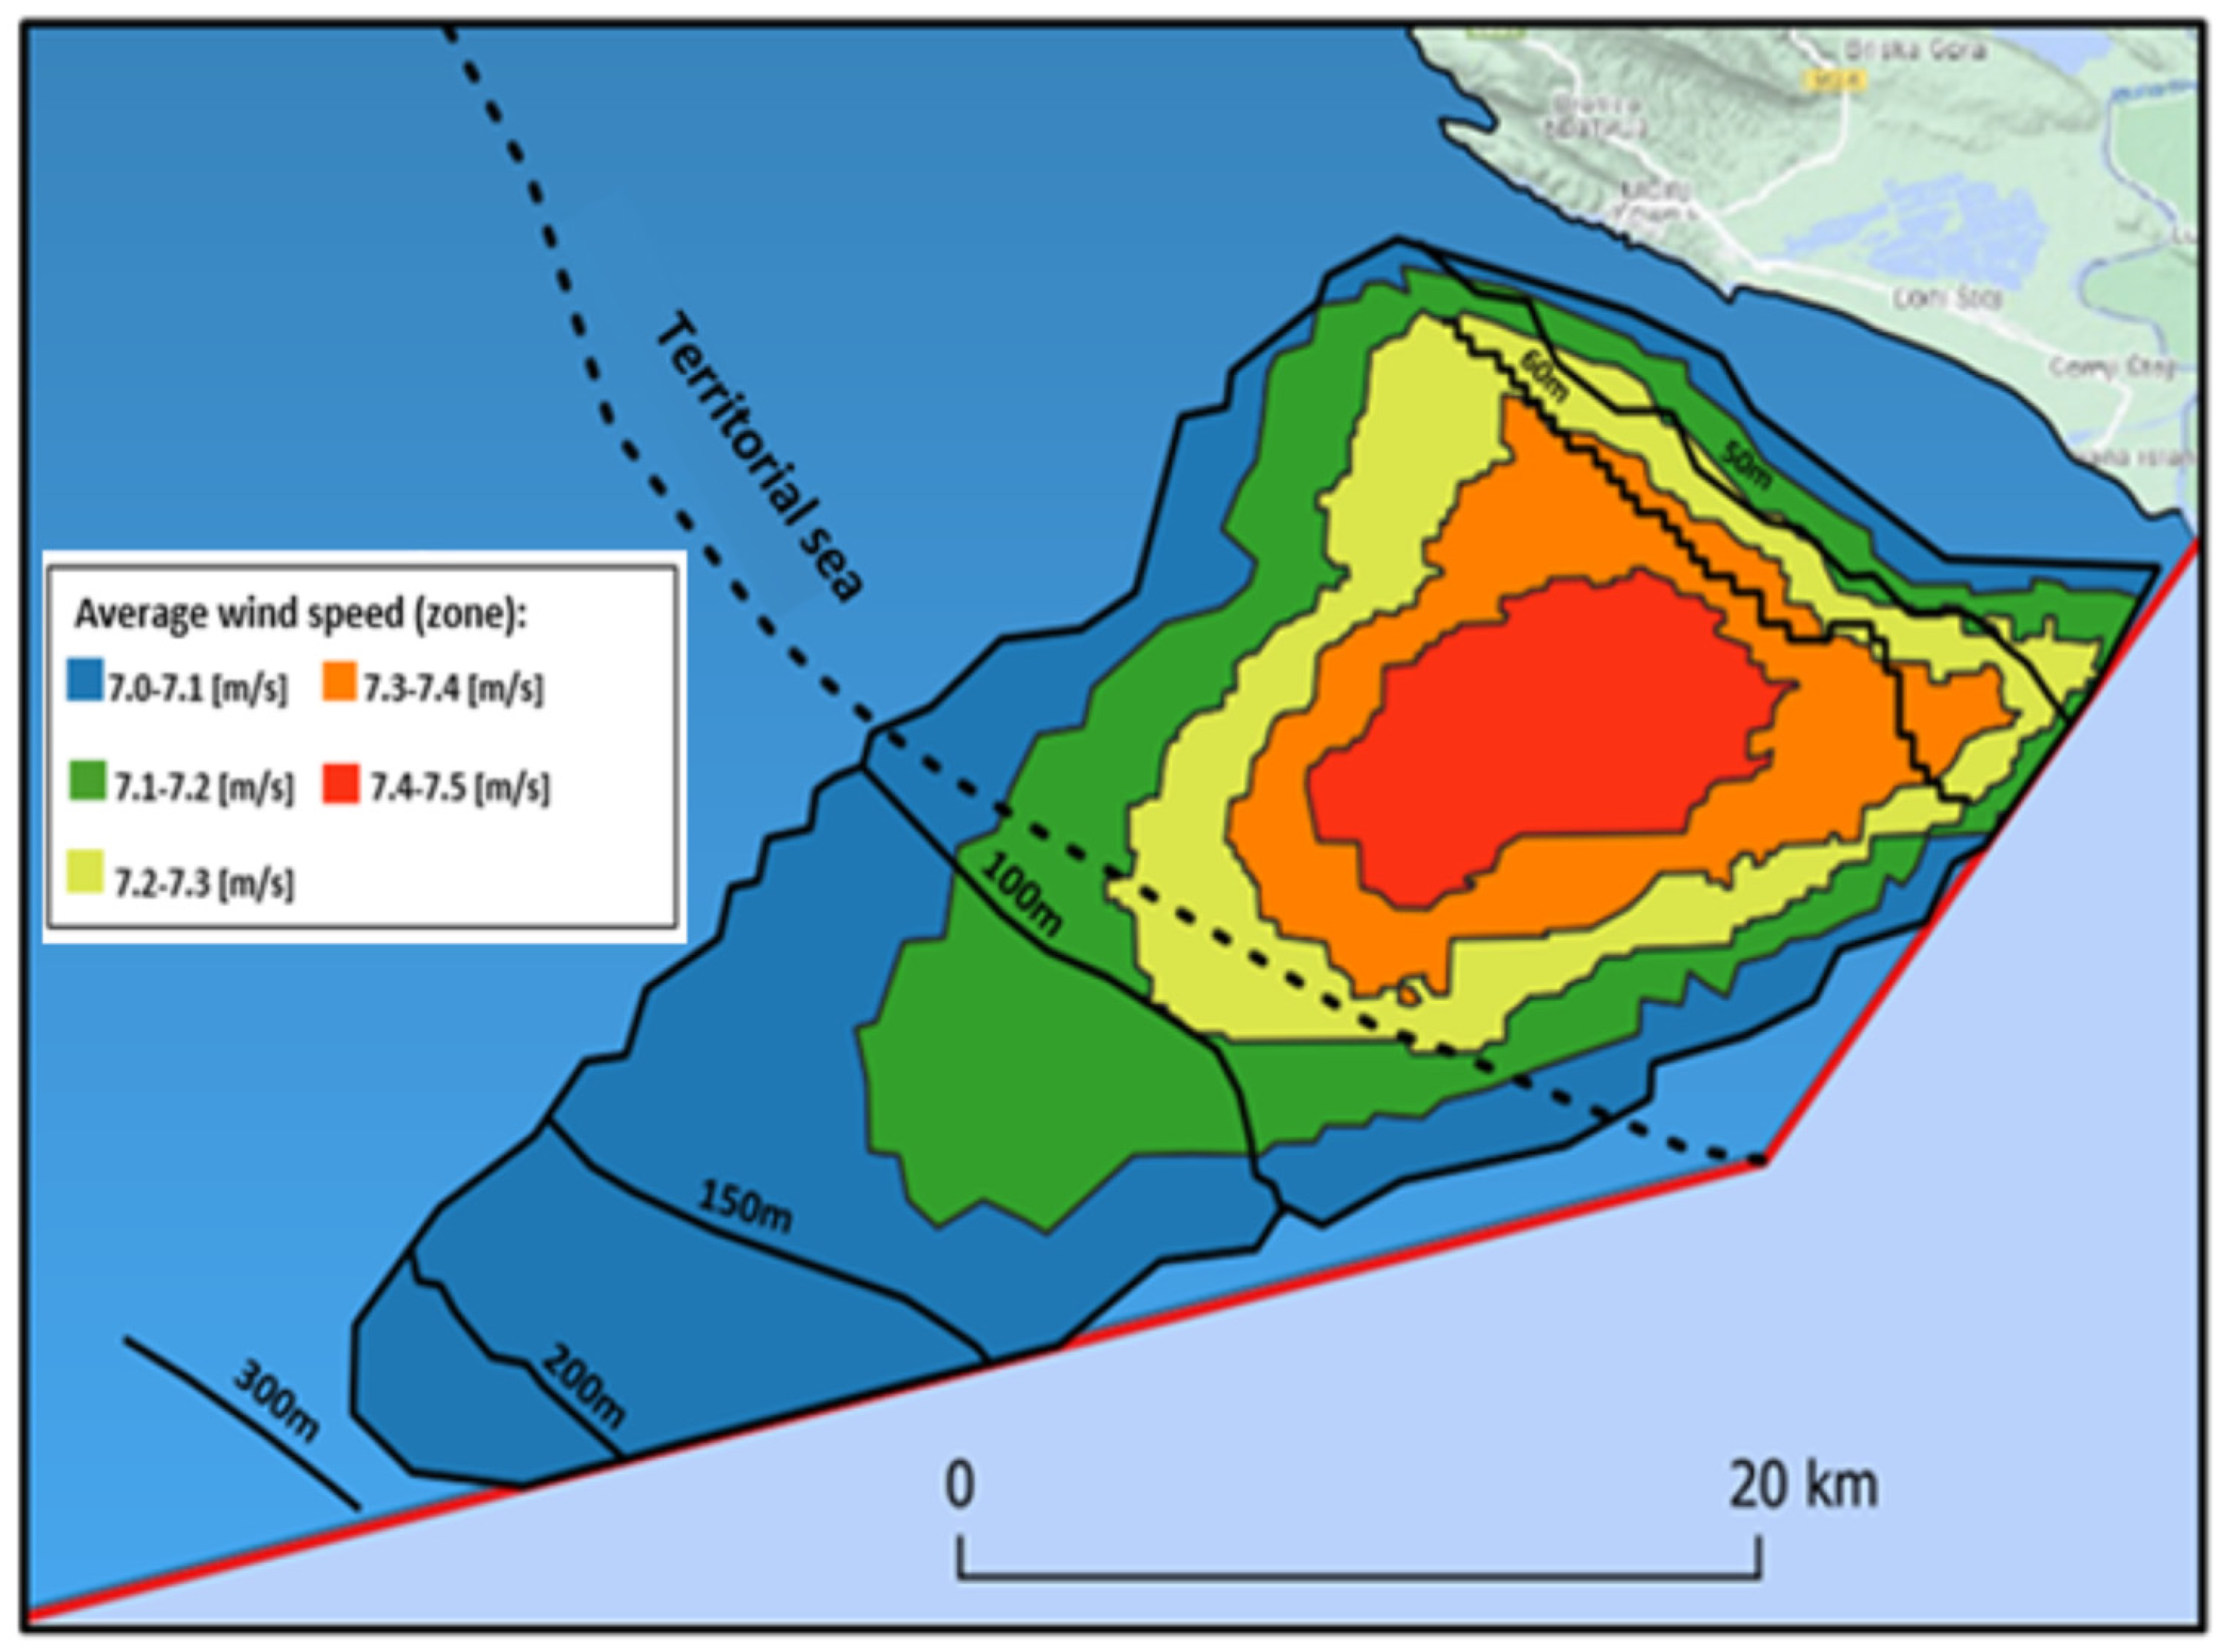
2.1.1. Database of Average Annual Wind Speeds

The research is based on the analysis of a database developed by the Technical University of Denmark (DTU Wind Energy), the World Bank, and the International Finance Corporation (IFC). This database is incorporated into the Global Wind Atlas 3.1. (GWA) software, which was released in 2019. The software allows users to access data on average annual wind speeds at five different altitudes (10, 50, 100, 150, and 200 m). GWA provides high-resolution data at 250 m intervals, integrated into a regular grid of 9 arc seconds (latitude × longitude) [51,52].
GWA is designed to facilitate preliminary calculations for identifying areas suitable for wind farm construction. The mathematical model of the GWA software scheme, illustrated in Figure 3, outlines its functionality. GWA utilizes a deductive approach, processing large-scale wind parameters to generate micro-scale wind parameters as an output [52,53].
The validation of the GWA software model was conducted at a total of 35 locations. The results of the software data validation against on-site measurements indicated the following:
  • The mean absolute bias of wind speed was 14%;
  • The mean bias of wind speed was −1% [53].

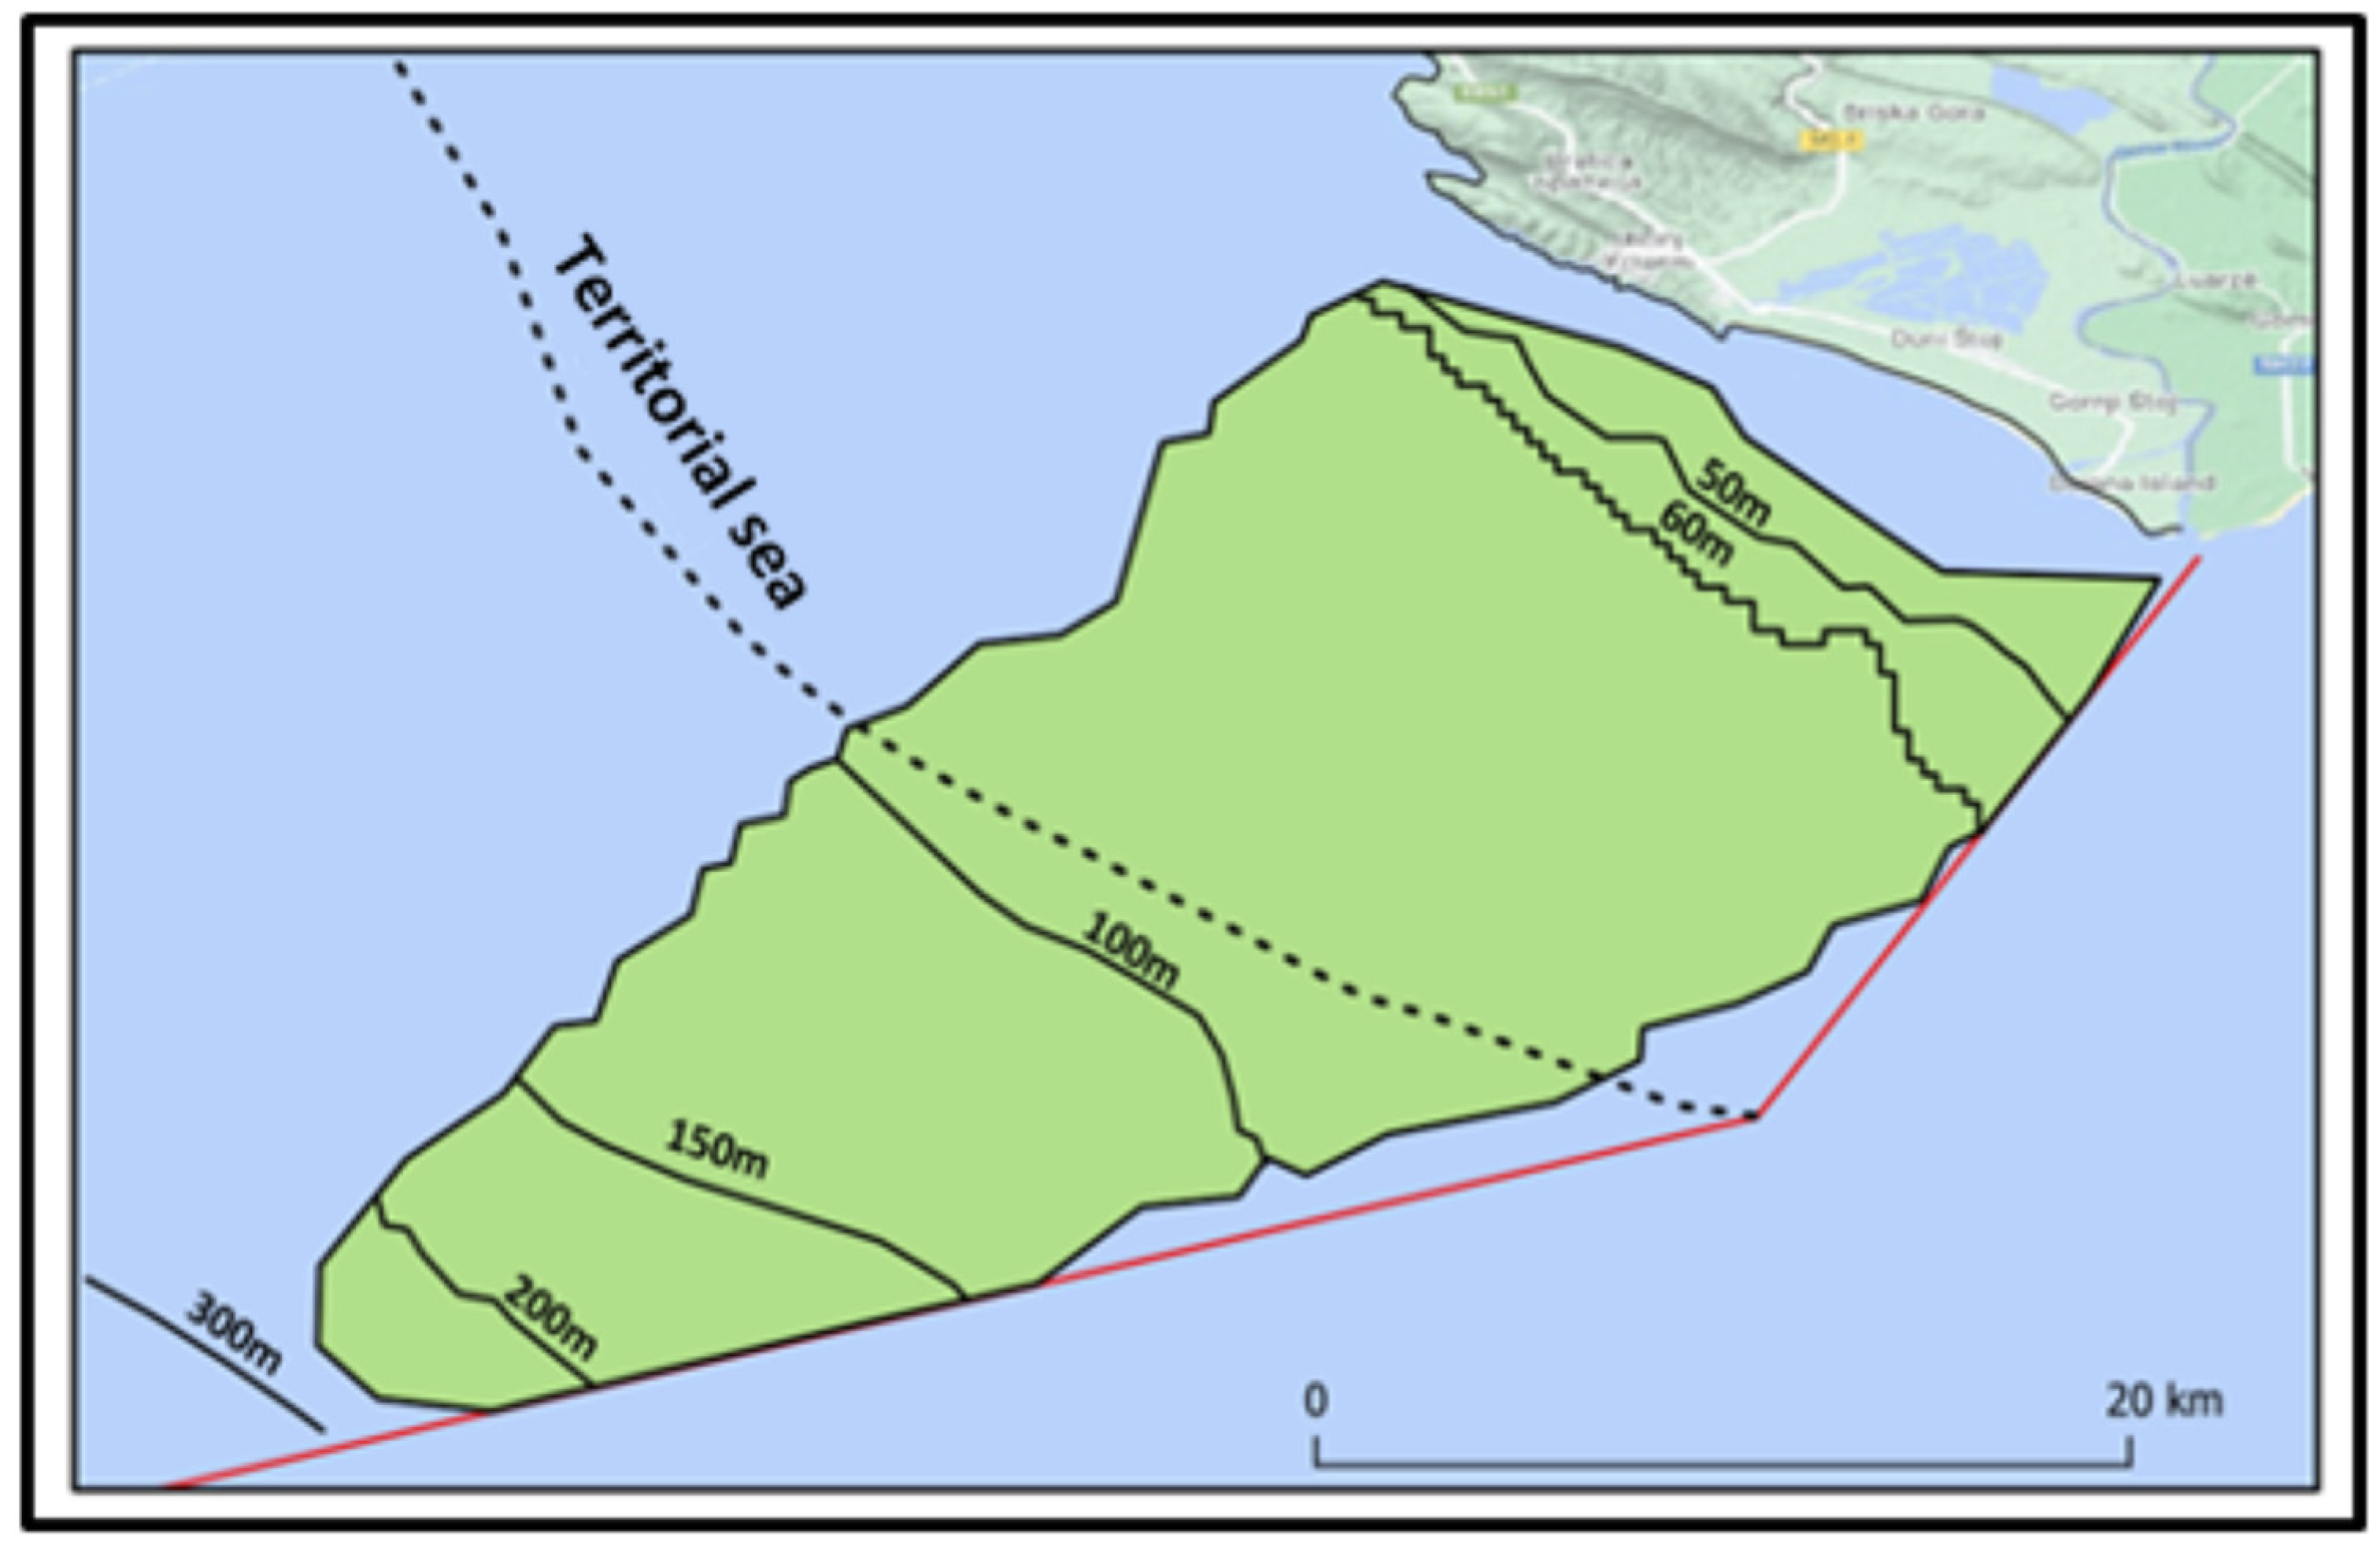
2.1.2. Bathymetry Database

The bathymetric analysis of the Montenegrin part of the Adriatic Sea was conducted by combining the results of the analysis of two databases:
  • Bathymetric chart from the Hydrographic Institute of the Yugoslav Navy in 1985 (HIJRM 1985);
  • GEBCO-grid 2023 database.
The HI-JRM 1985 chart, published in paper format in 1985 at a scale of 1:750.000, displays isobaths at depths of 50, 100, 150, 200, 300, 400, 500, 600, 700, 800, 900, 1000, 1100, and 1200 m [41].
GEBCO, founded in 1903, conducts bathymetric data acquisition and seabed mapping activities. It operates under the control of the International Hydrographic Organization (IHO) and the UNESCO Intergovernmental Oceanographic Commission (IOC) [54].
The GEBCO-grid 2023 project represents a global database of seafloor and land elevation models provided at a 15 arc-second interval [55].

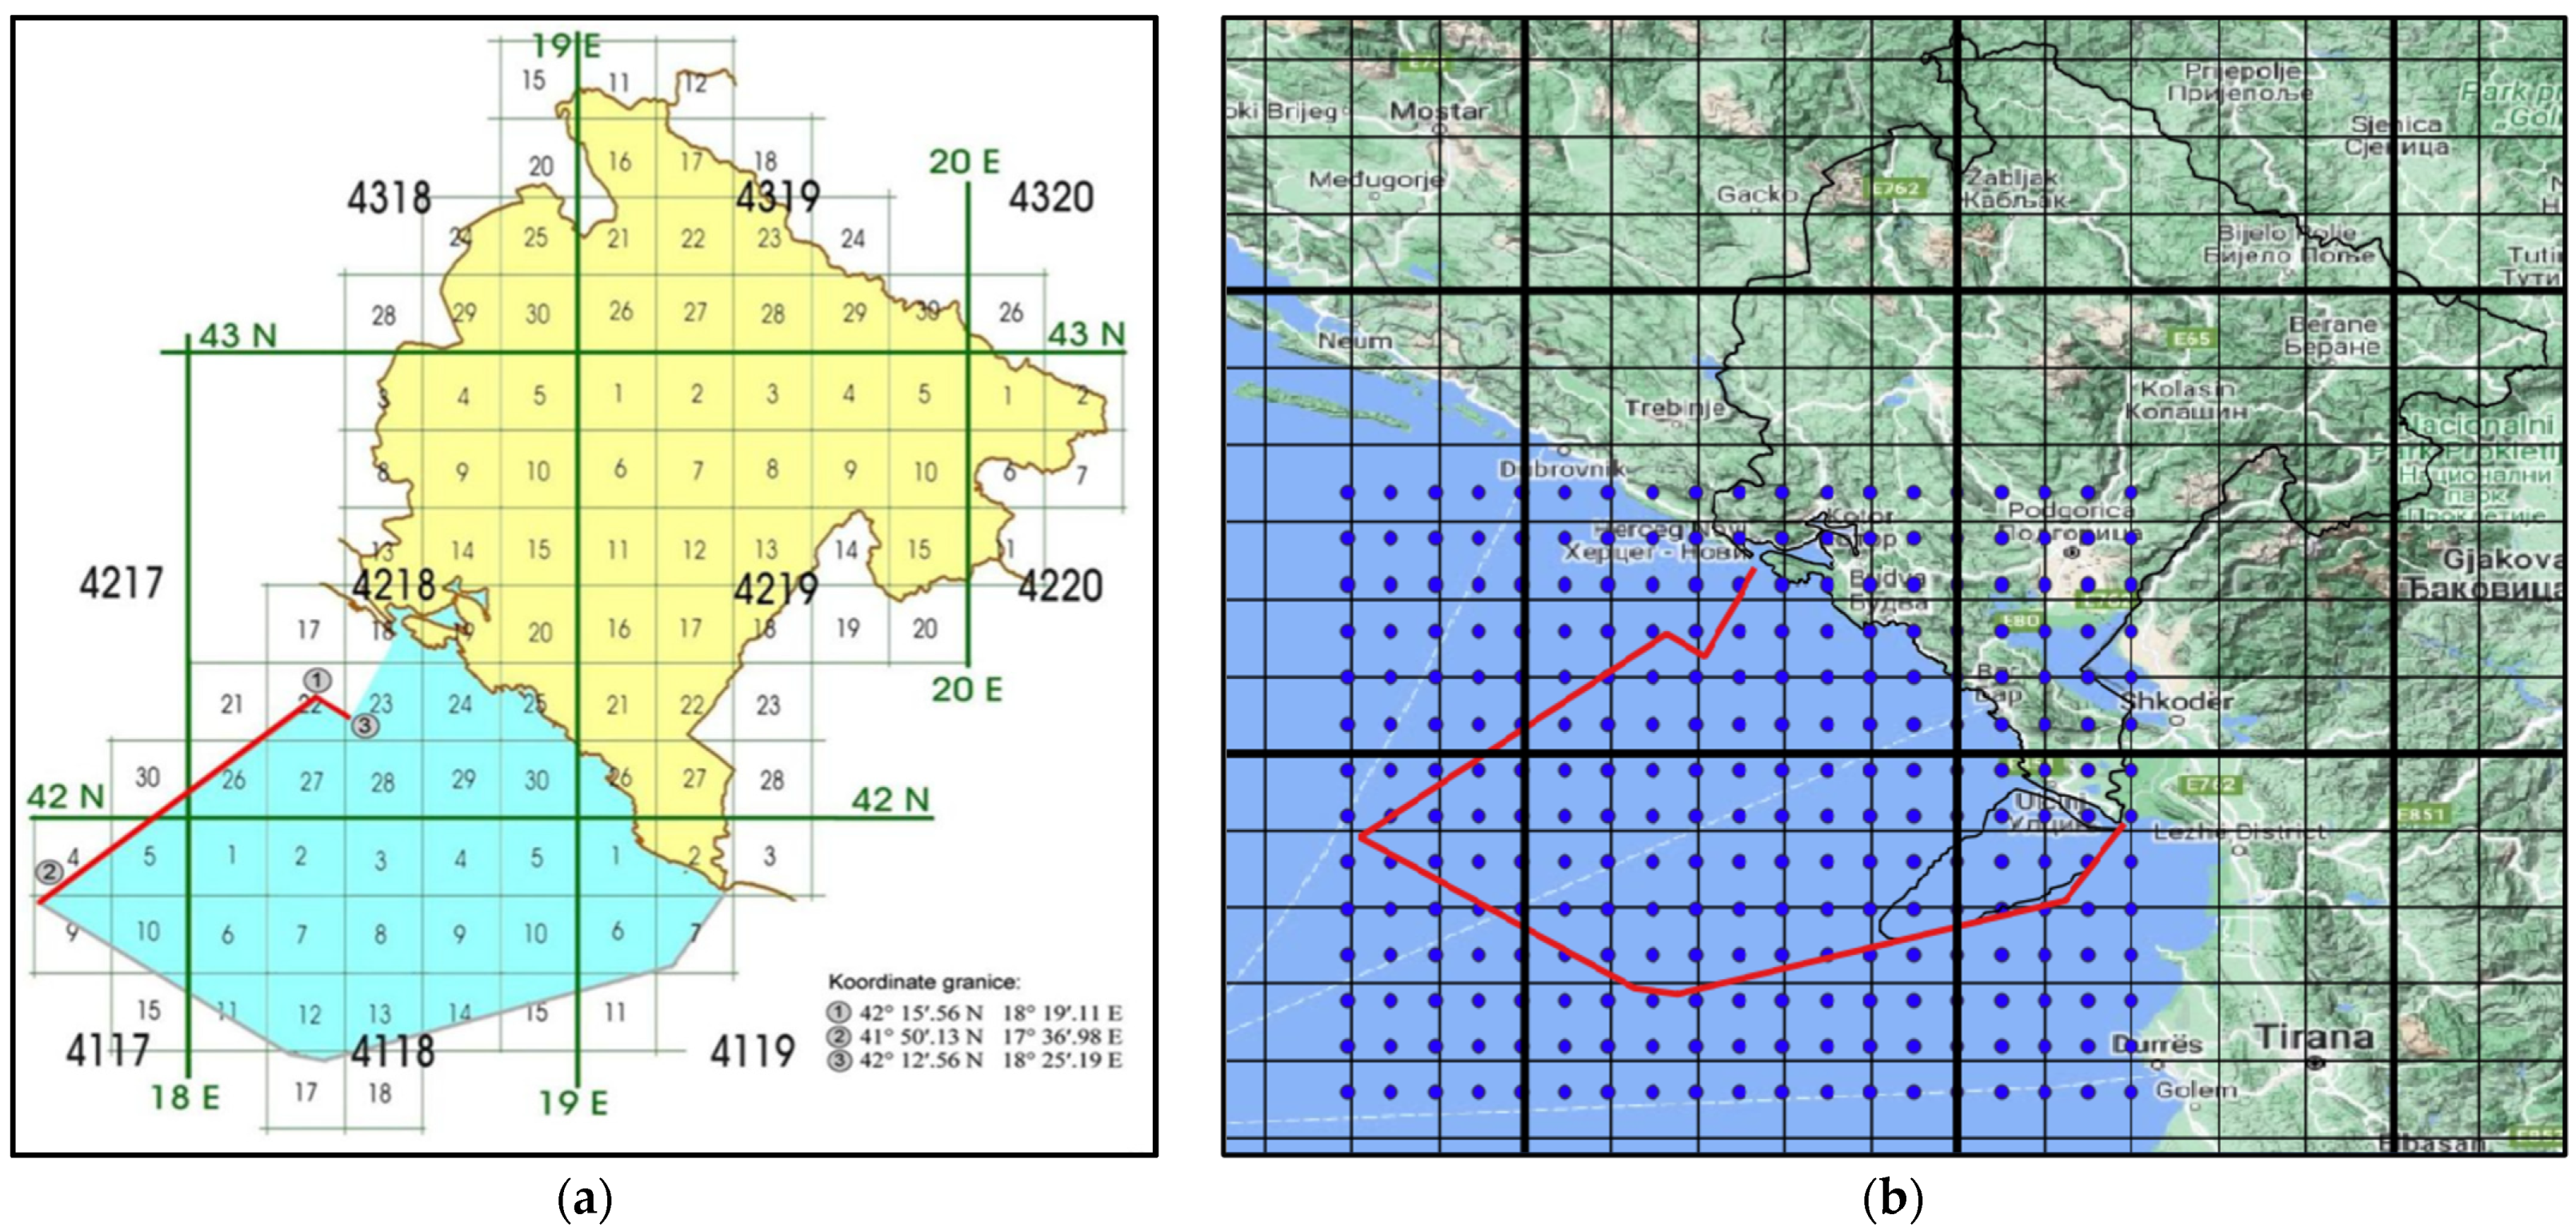
2.2. Assessment Methodology

The assessment of the potential for the construction of offshore wind farms was conducted for offshore blocks designated by the Government of Montenegro for exploration and production of hydrocarbons (Figure 1a). The evaluation utilized the assessment method to determine the resource potential necessary for constructing wind farms on offshore blocks in Montenegro. This assessment aimed to analyze the resource potential of each individual block for offshore wind farm construction and comprised four steps. The first three phases aimed to delineate, for each offshore block, the total number of control points with average annual speeds exceeding 7 m/s (frequency) at a height of 150 m and the total number of corrected control points (intensity). Blocks vary in total surface area values, and their control points exhibit different mean annual wind speed values. To qualitatively differentiate these blocks, a parameter called “corrected control point” was introduced, which is based on the mean annual wind speeds of the control points in this research. The calculation method for determining the values of corrected control points was outlined in phase 3. The fourth stage encompassed the practical assessment.
Phase No. 1—Utilizing the analytical tools of GIS software at an elevation of 150 m, the following parameters were precisely calculated for each offshore block:
  • Surface area of the offshore block (A);
  • Total number of control points within the surface area of the offshore block (B);
  • Total number of control points with average annual wind speeds less than 7 m/s within the surface area of the offshore block (C);
  • Total number of control points with average annual wind speeds greater than 7 m/s within the surface area of the offshore block (D).
Phase No. 2—Using the analytical tools of GIS software at an altitude of 150 m, the following parameters were precisely calculated for each offshore block:
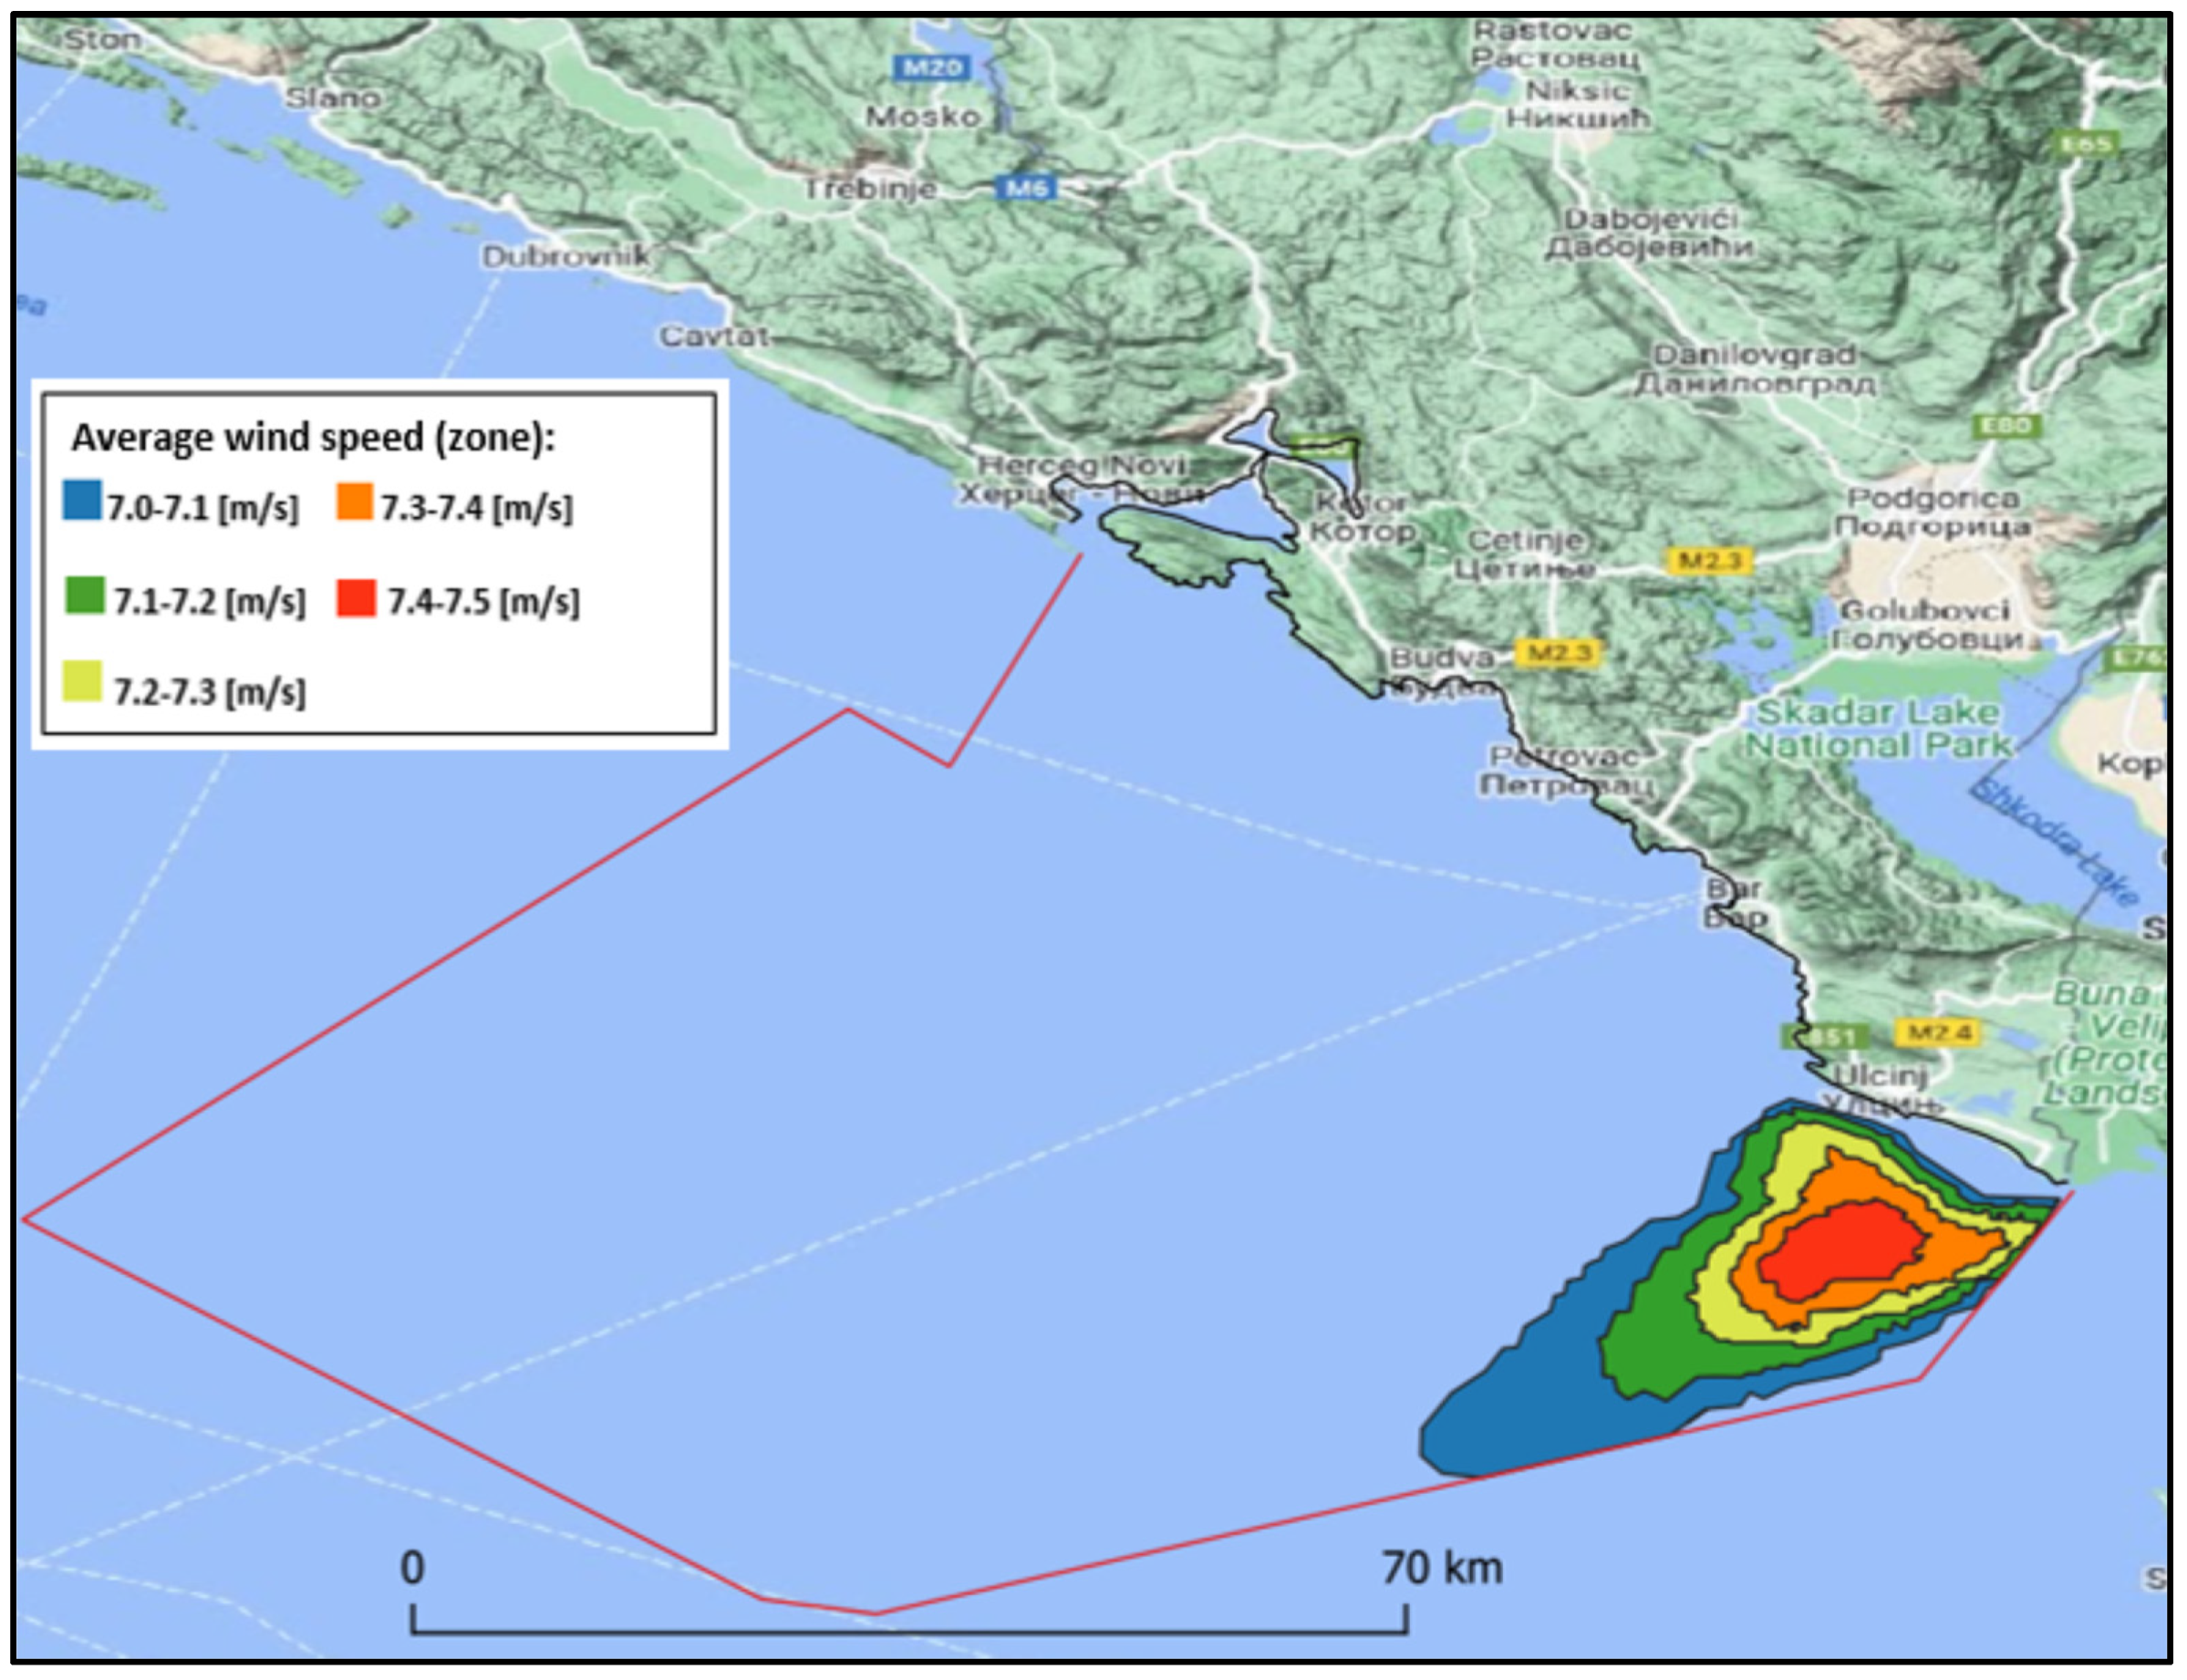
  • The total number of control points that have mean annual wind speeds ranging from 7.0 to 7.1 m/s;
  • The total number of control points that have average annual wind speeds ranging from 7.1 to 7.2 m/s;
  • The total number of control points that have average annual wind speeds ranging from 7.2 to 7.3 m/s;
  • The total number of control points that have average annual wind speeds ranging from 7.3 to 7.4 m/s;
  • The total number of control points that have average annual wind speeds ranging from 7.4 to 7.5 m/s.
Phase No. 3—The total number of corrected control points for each block was calculated by applying the correction factor. This calculation involved multiplying each individual control point by its correction factor, following the adopted criteria listed in Table 1.
The completion of the aforementioned three phases established conditions for applying the assessment method. In the analysis of the risk of accidental situations, risk is defined as the product of the probability of an unwanted event and the consequences that the unwanted event may cause [56]. This paper employs a semi-qualitative method to assess the potential for constructing offshore wind farms, utilizing a 4 × 4 field matrix. The assessment matrix includes two variables:
  • Frequency: Value in the matrix of the total number of control points that have average annual wind speeds greater than 7 m/s, at an altitude of 150 m;
  • Intensity: Value in the matrix of the total number of corrected control points per km2 block at sea.
The applied assessment matrix facilitated the identification of blocks deemed suitable for offshore wind farm construction in Montenegro, as presented in Table 2.
The assessment criteria presented in Table 2 enabled the evaluation of the block based on qualitative (intensity) and quantitative (frequency) variables, defined by control points with average annual wind speeds. As shown in Table 2, absolute parameters 0, 1, 2, and 3 are assigned to frequency values, depending on the number of control points with average annual wind speeds greater than 7 m/s. A block lacking control points with average annual wind speeds greater than 7 m/s is given an absolute parameter of 0. Absolute parameter 1 is assigned to a block with 0 to 300 control points featuring average annual wind speeds greater than 7 m/s. For a block with 300 to 600 control points showcasing average annual wind speeds exceeding 7 m/s, an absolute parameter of 2 is assigned. Absolute parameter 3 corresponds to a block with over 600 control points, each exhibiting an average annual wind speed greater than 7 m/s.
Additionally, absolute parameters 0, 1, 2, and 3 are assigned to intensity values, contingent on the number of corrected control points per km2. A block lacking any corrected control points per km2 is attributed an absolute parameter of 0. A block with an intensity ranging from 0 to 1 corrected control points per km2 is assigned an absolute parameter of 1. Absolute parameter 2 is designated for a block with an intensity between 1 and 2 corrected control points per km2. A block with an intensity surpassing 2 corrected control points per km2 is allocated an absolute parameter of 3. The multiplication of the absolute parameters of frequency and intensity yields the values indicative of the resource potential associated with each offshore block required for constructing a wind power plant.

3. Results

3.1. Offshore Montenegro Wind Potential Analysis

The analysis of offshore wind potential in Montenegro utilized GWA software to investigate wind speeds exceeding 7 m/s, which are deemed technically feasible for offshore wind energy exploitation [20]. By filtering the average wind speed data, an area of 801 km2 near the Montenegrin coast with wind speeds exceeding 7 m/s at an altitude of 150 m was identified. The portion of the identified area within Montenegro’s maritime boundaries was defined using GIS software and databases of Montenegro’s maritime borders. By confining the surface area within Montenegro’s maritime zone, with an average annual wind speed exceeding 7 m/s, an offshore area of 766.598 km2 was calculated. Further utilization of GIS software facilitated the extraction of geographical coordinates for the identified surface area of 766.598 km2, which are presented in Table 3.
A precise analysis of the distribution of mean wind speeds in the range from 7.0 to 7.5 m/s, with a step of 0.1 m/s, was performed by loading the average wind speed layers generated using the GWA software into the GIS software, as shown in Figure 4.
Within the identified wind area, individual zones of average wind speeds were isolated using GIS tools, and their surface values are presented in Table 4.

3.2. Bathymetric Results
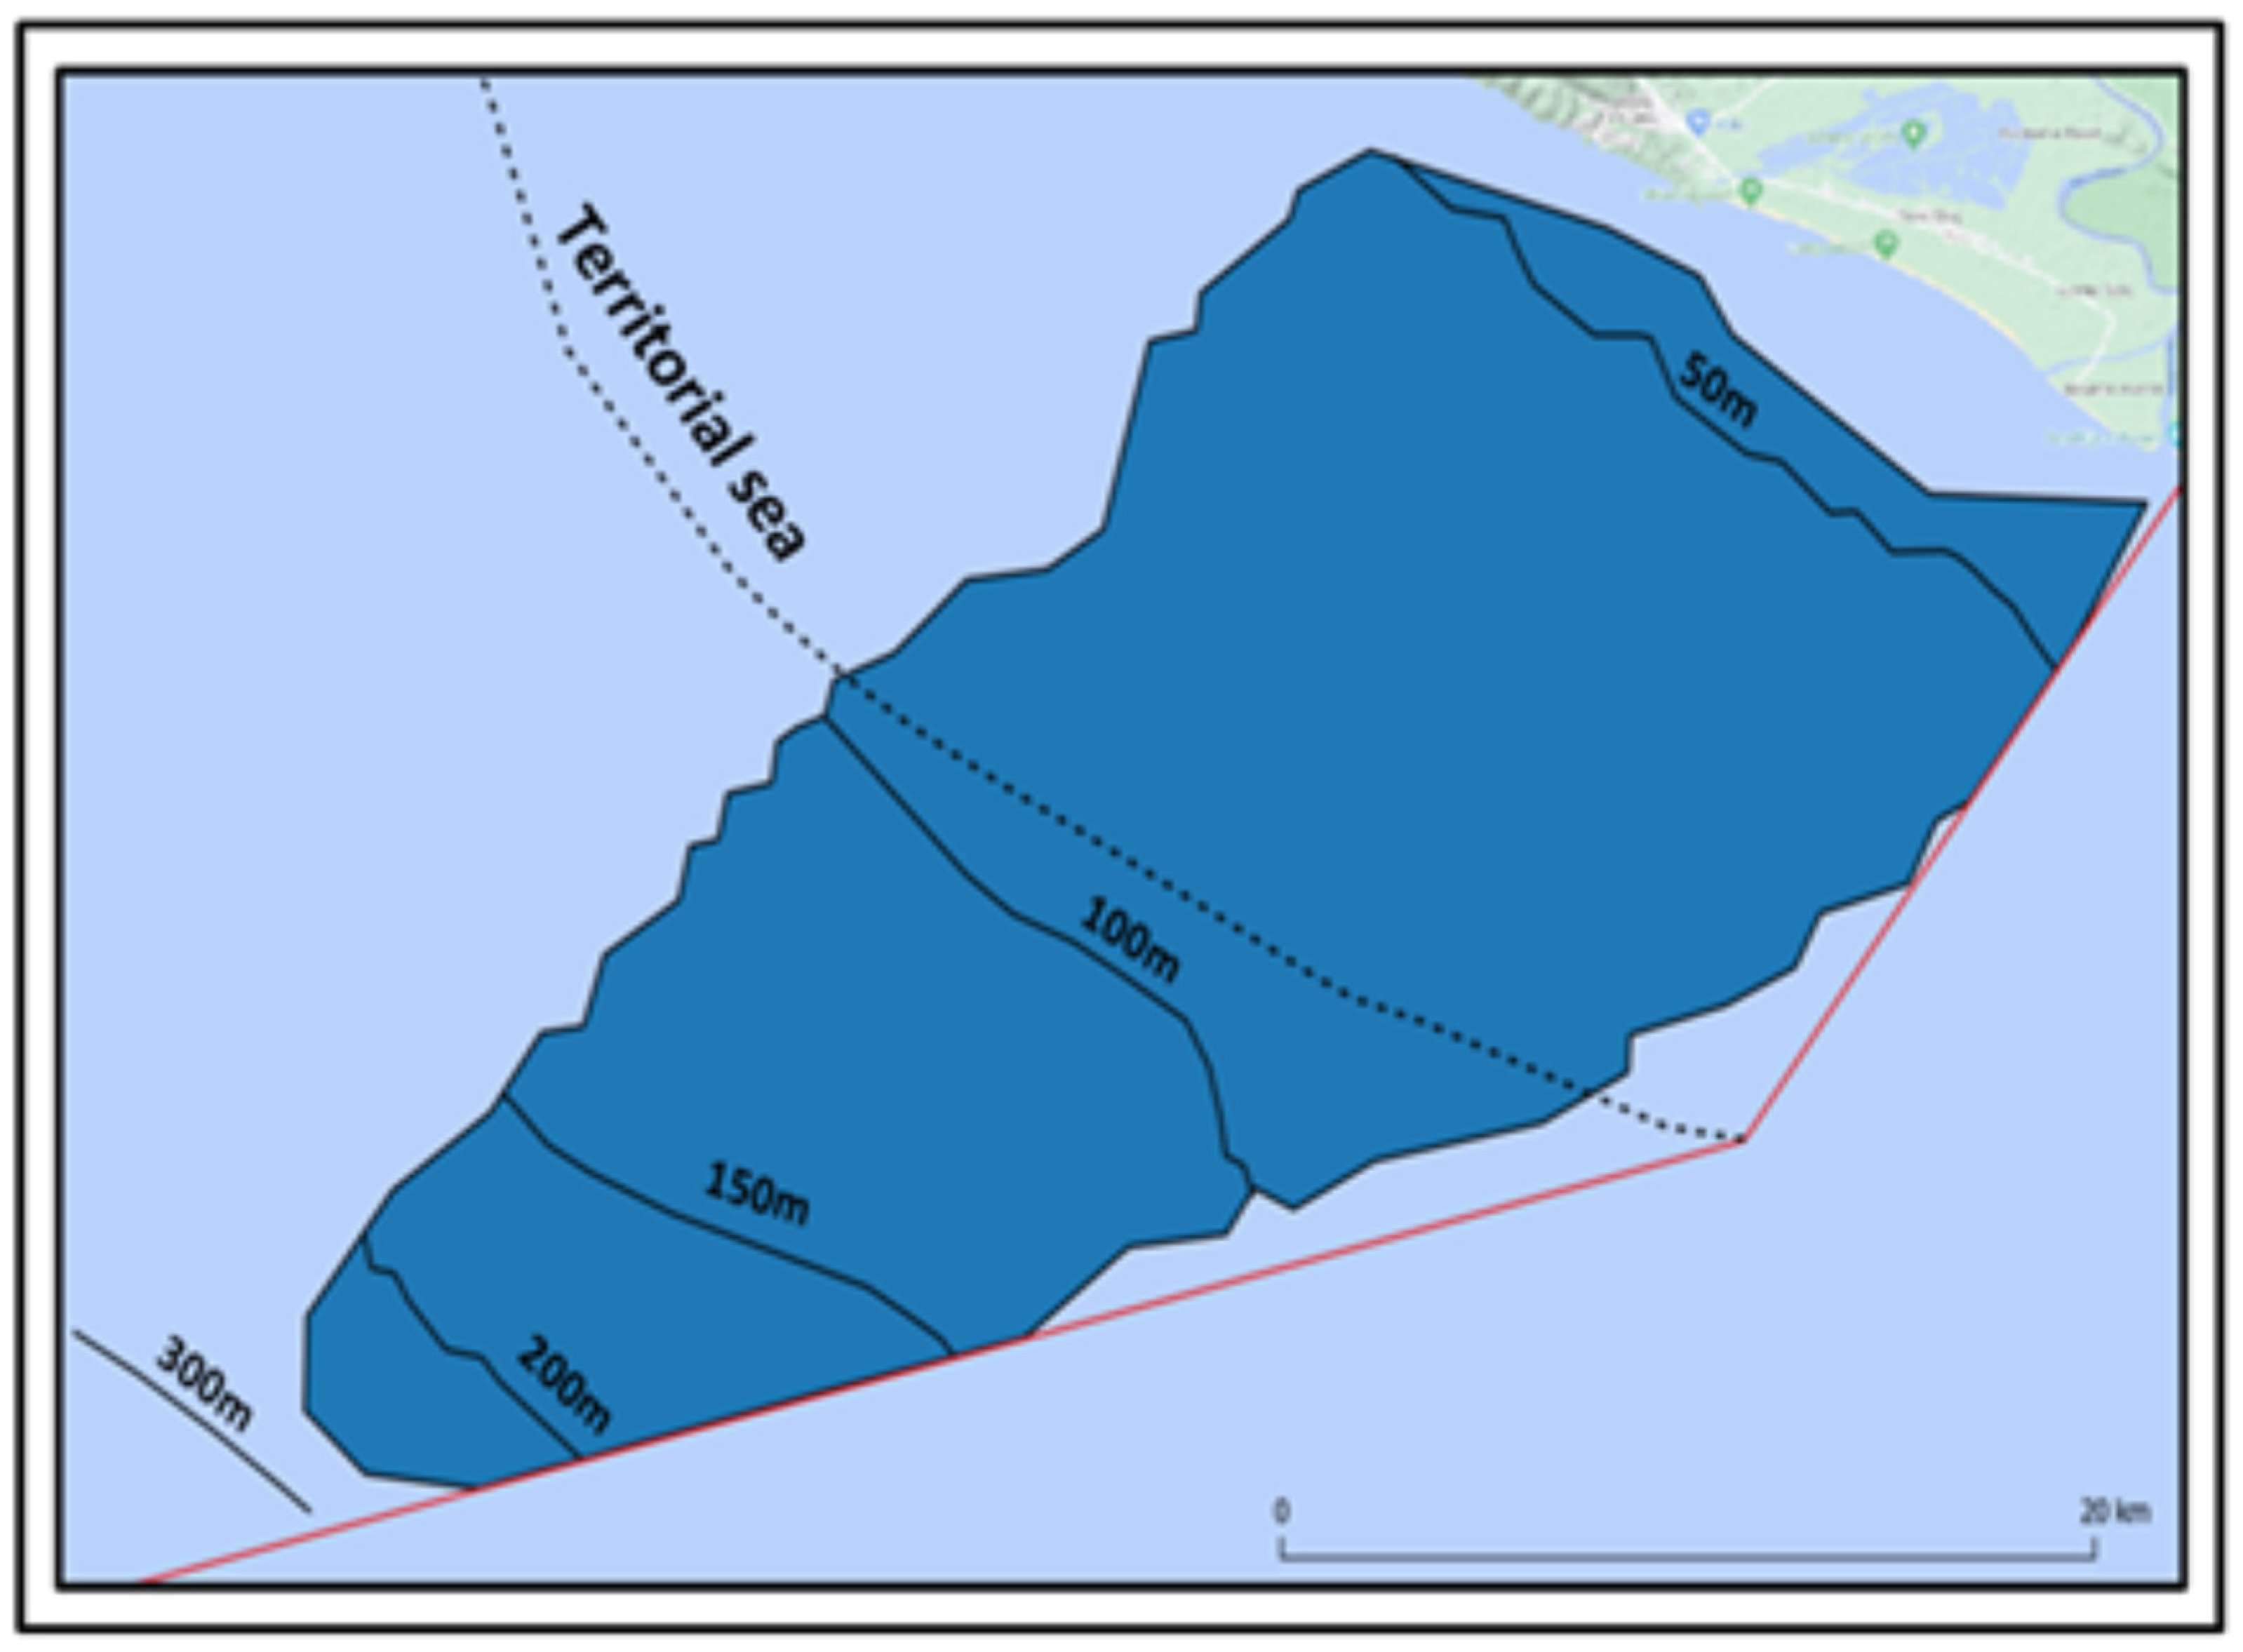
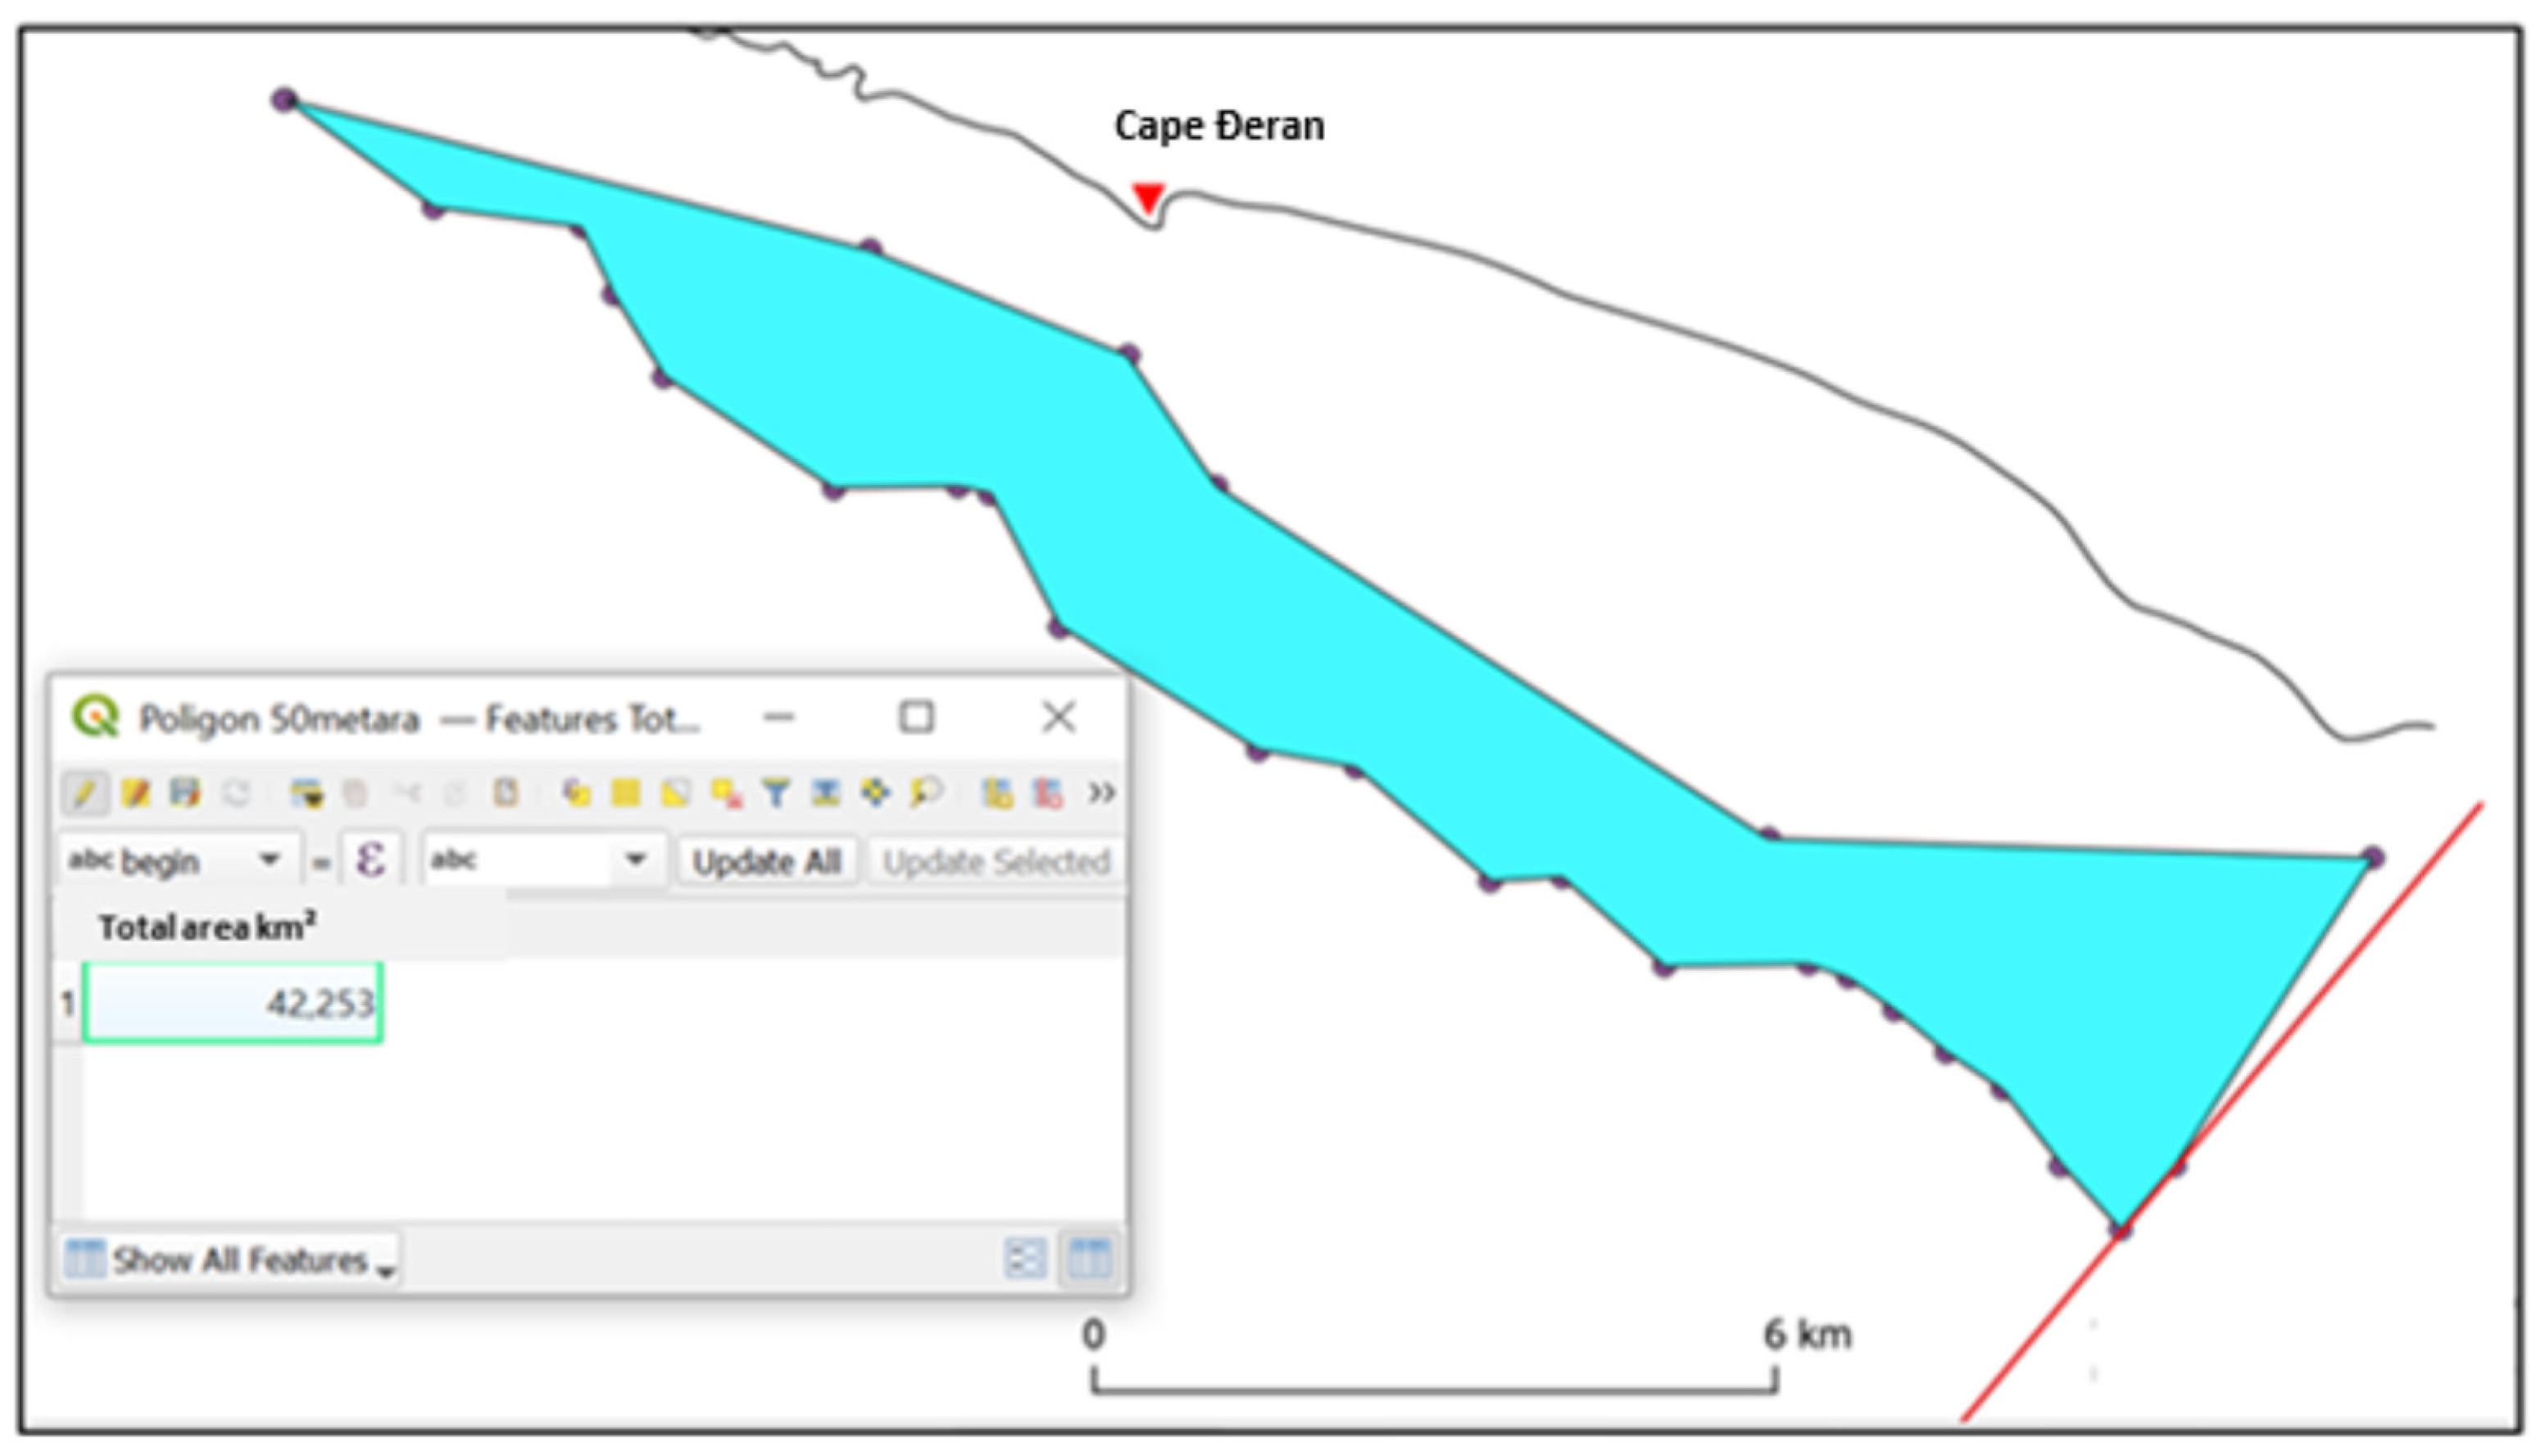
3.2.1. HI-JRM 1985

Through the use of GIS tools, the HI-JRM 1985 bathymetry map, was scanned, georeferenced, and transformed into a digital bathymetric map for the Montenegrin sea belt. While HI-JRM 1985 chart highlight isobaths at intervals of 50 and 100 m, the 60 m isobath is not included. Figure 5 provides a visual representation of the isolated southern part of the bathymetric map of the Montenegrin sea belt (HI-JRM 1985), overlapped with the offshore area featuring average annual wind speeds greater than 7 m/s.
Utilizing GIS tools, an offshore area of 42.253 km2 was calculated, emphasizing locations with an average annual wind speed greater than 7 m/s and a sea depth less than 50 m. This specific area is depicted in Figure 6.

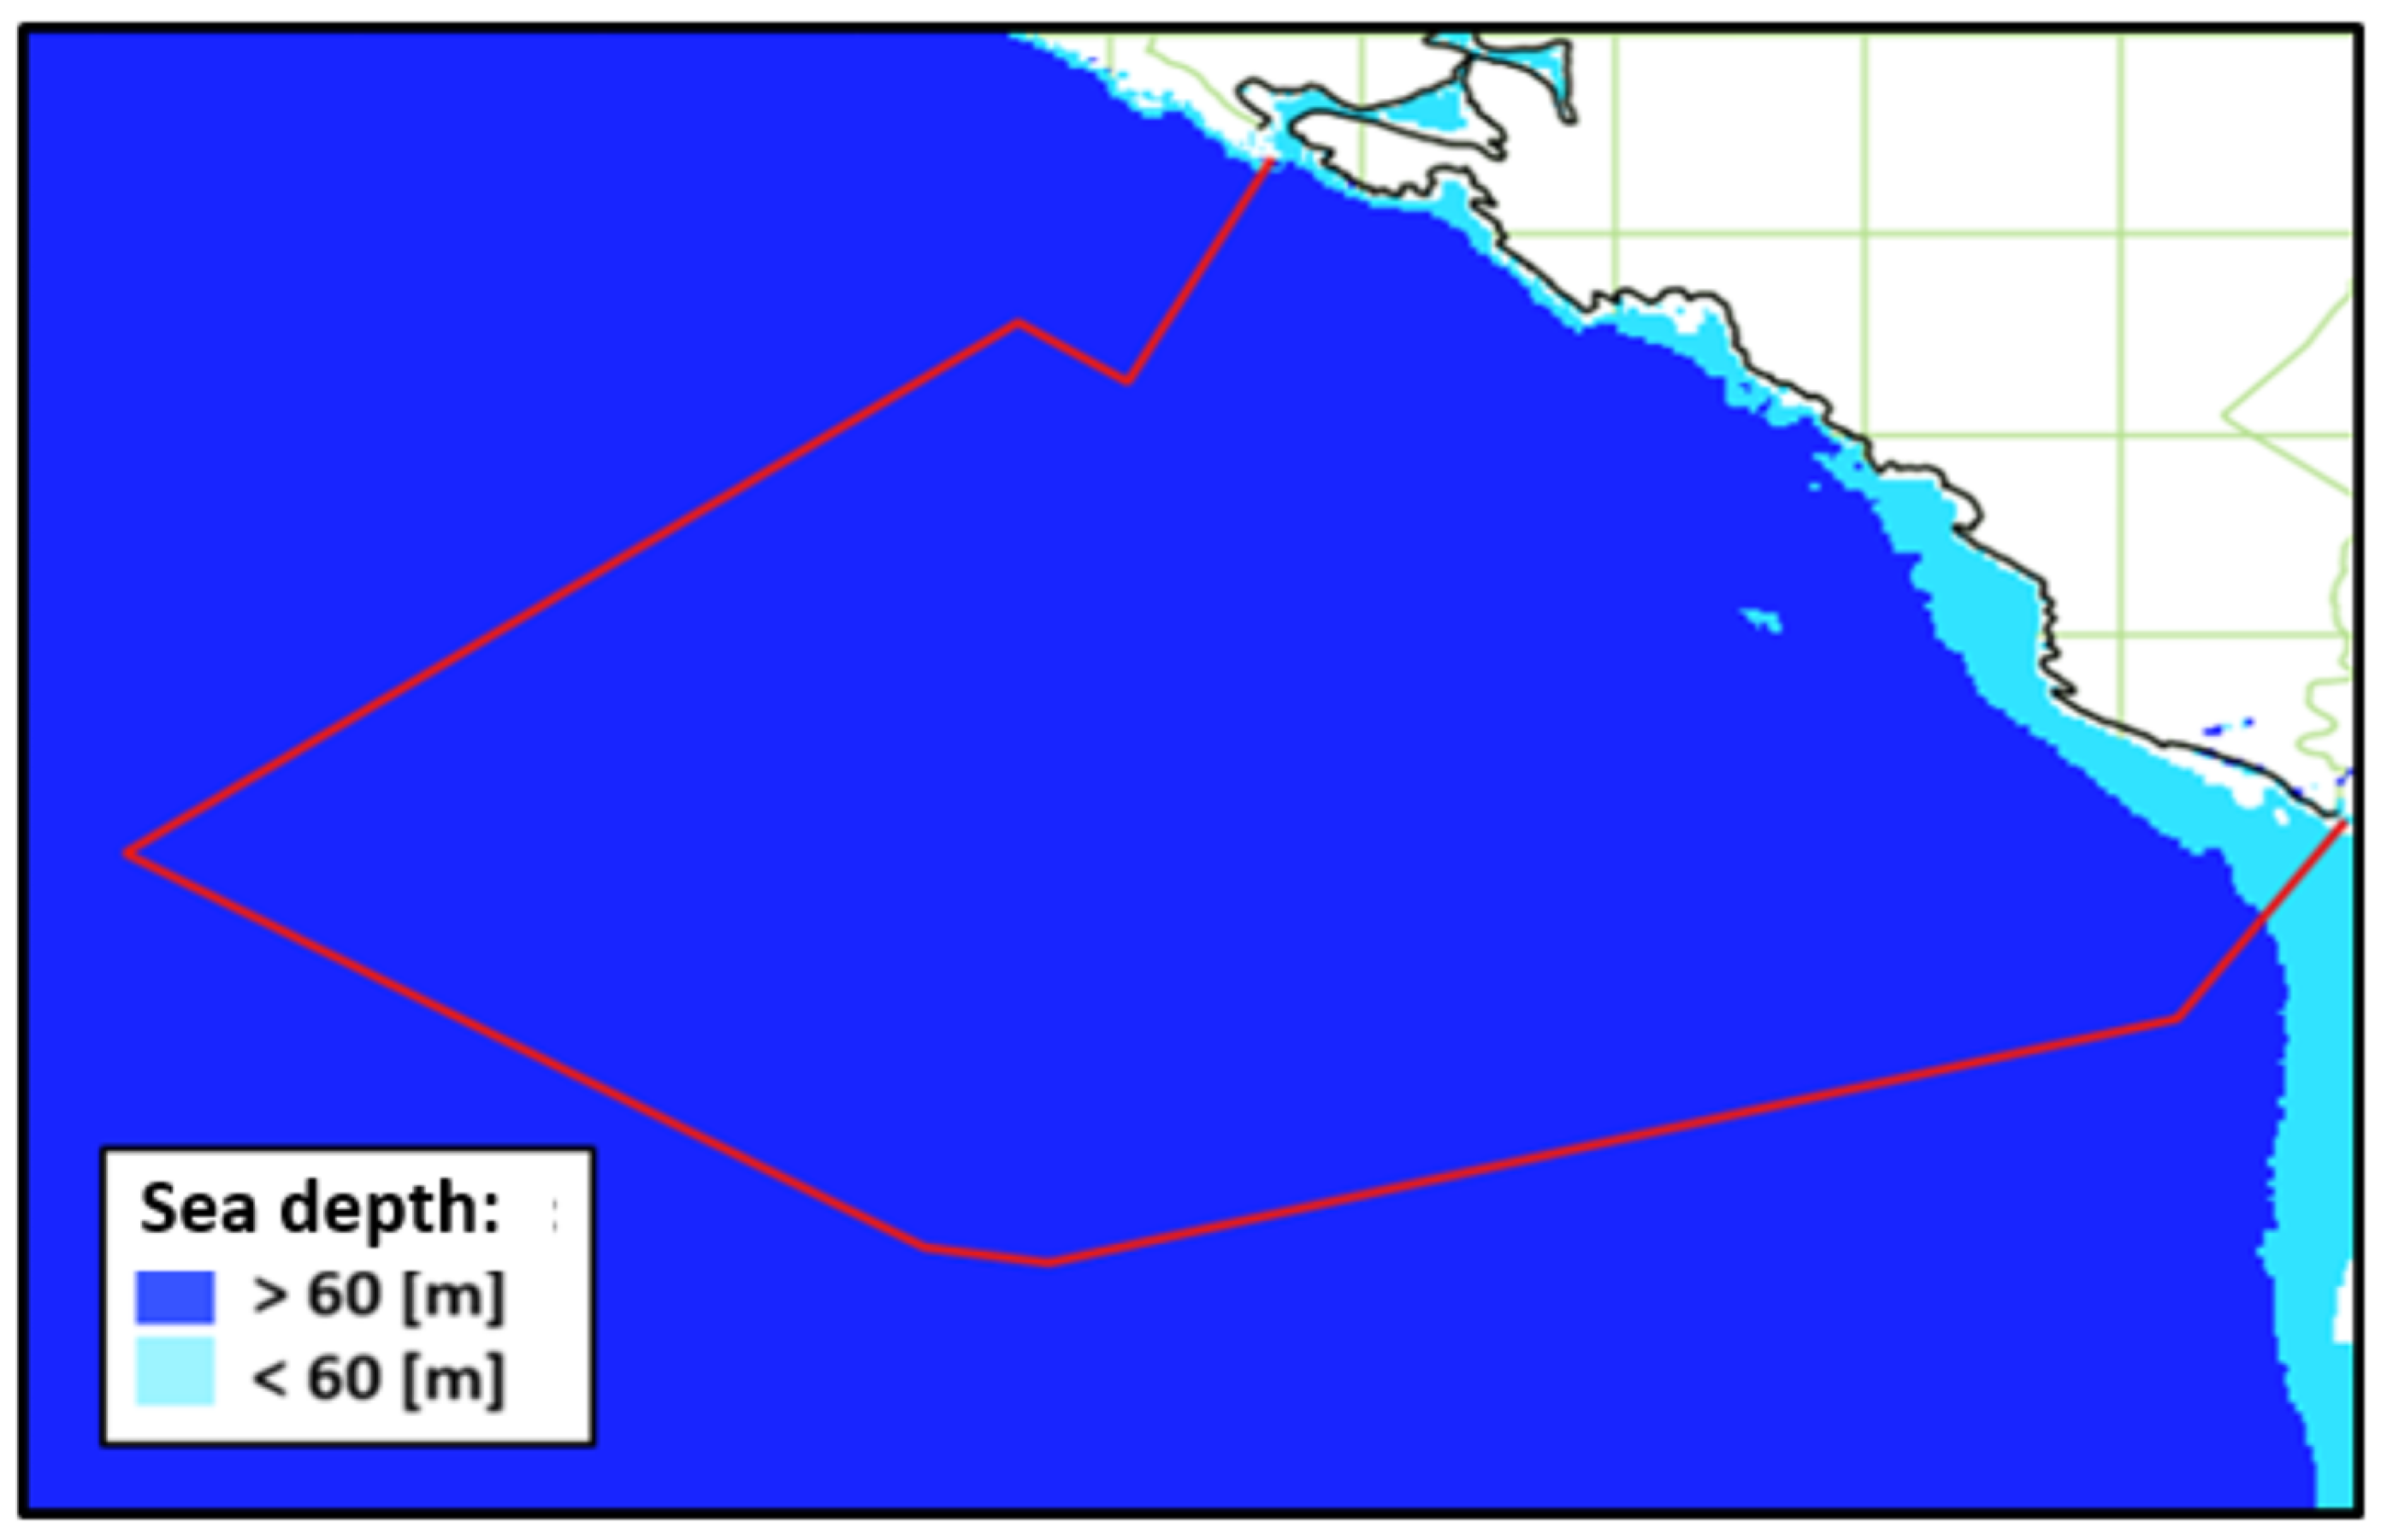
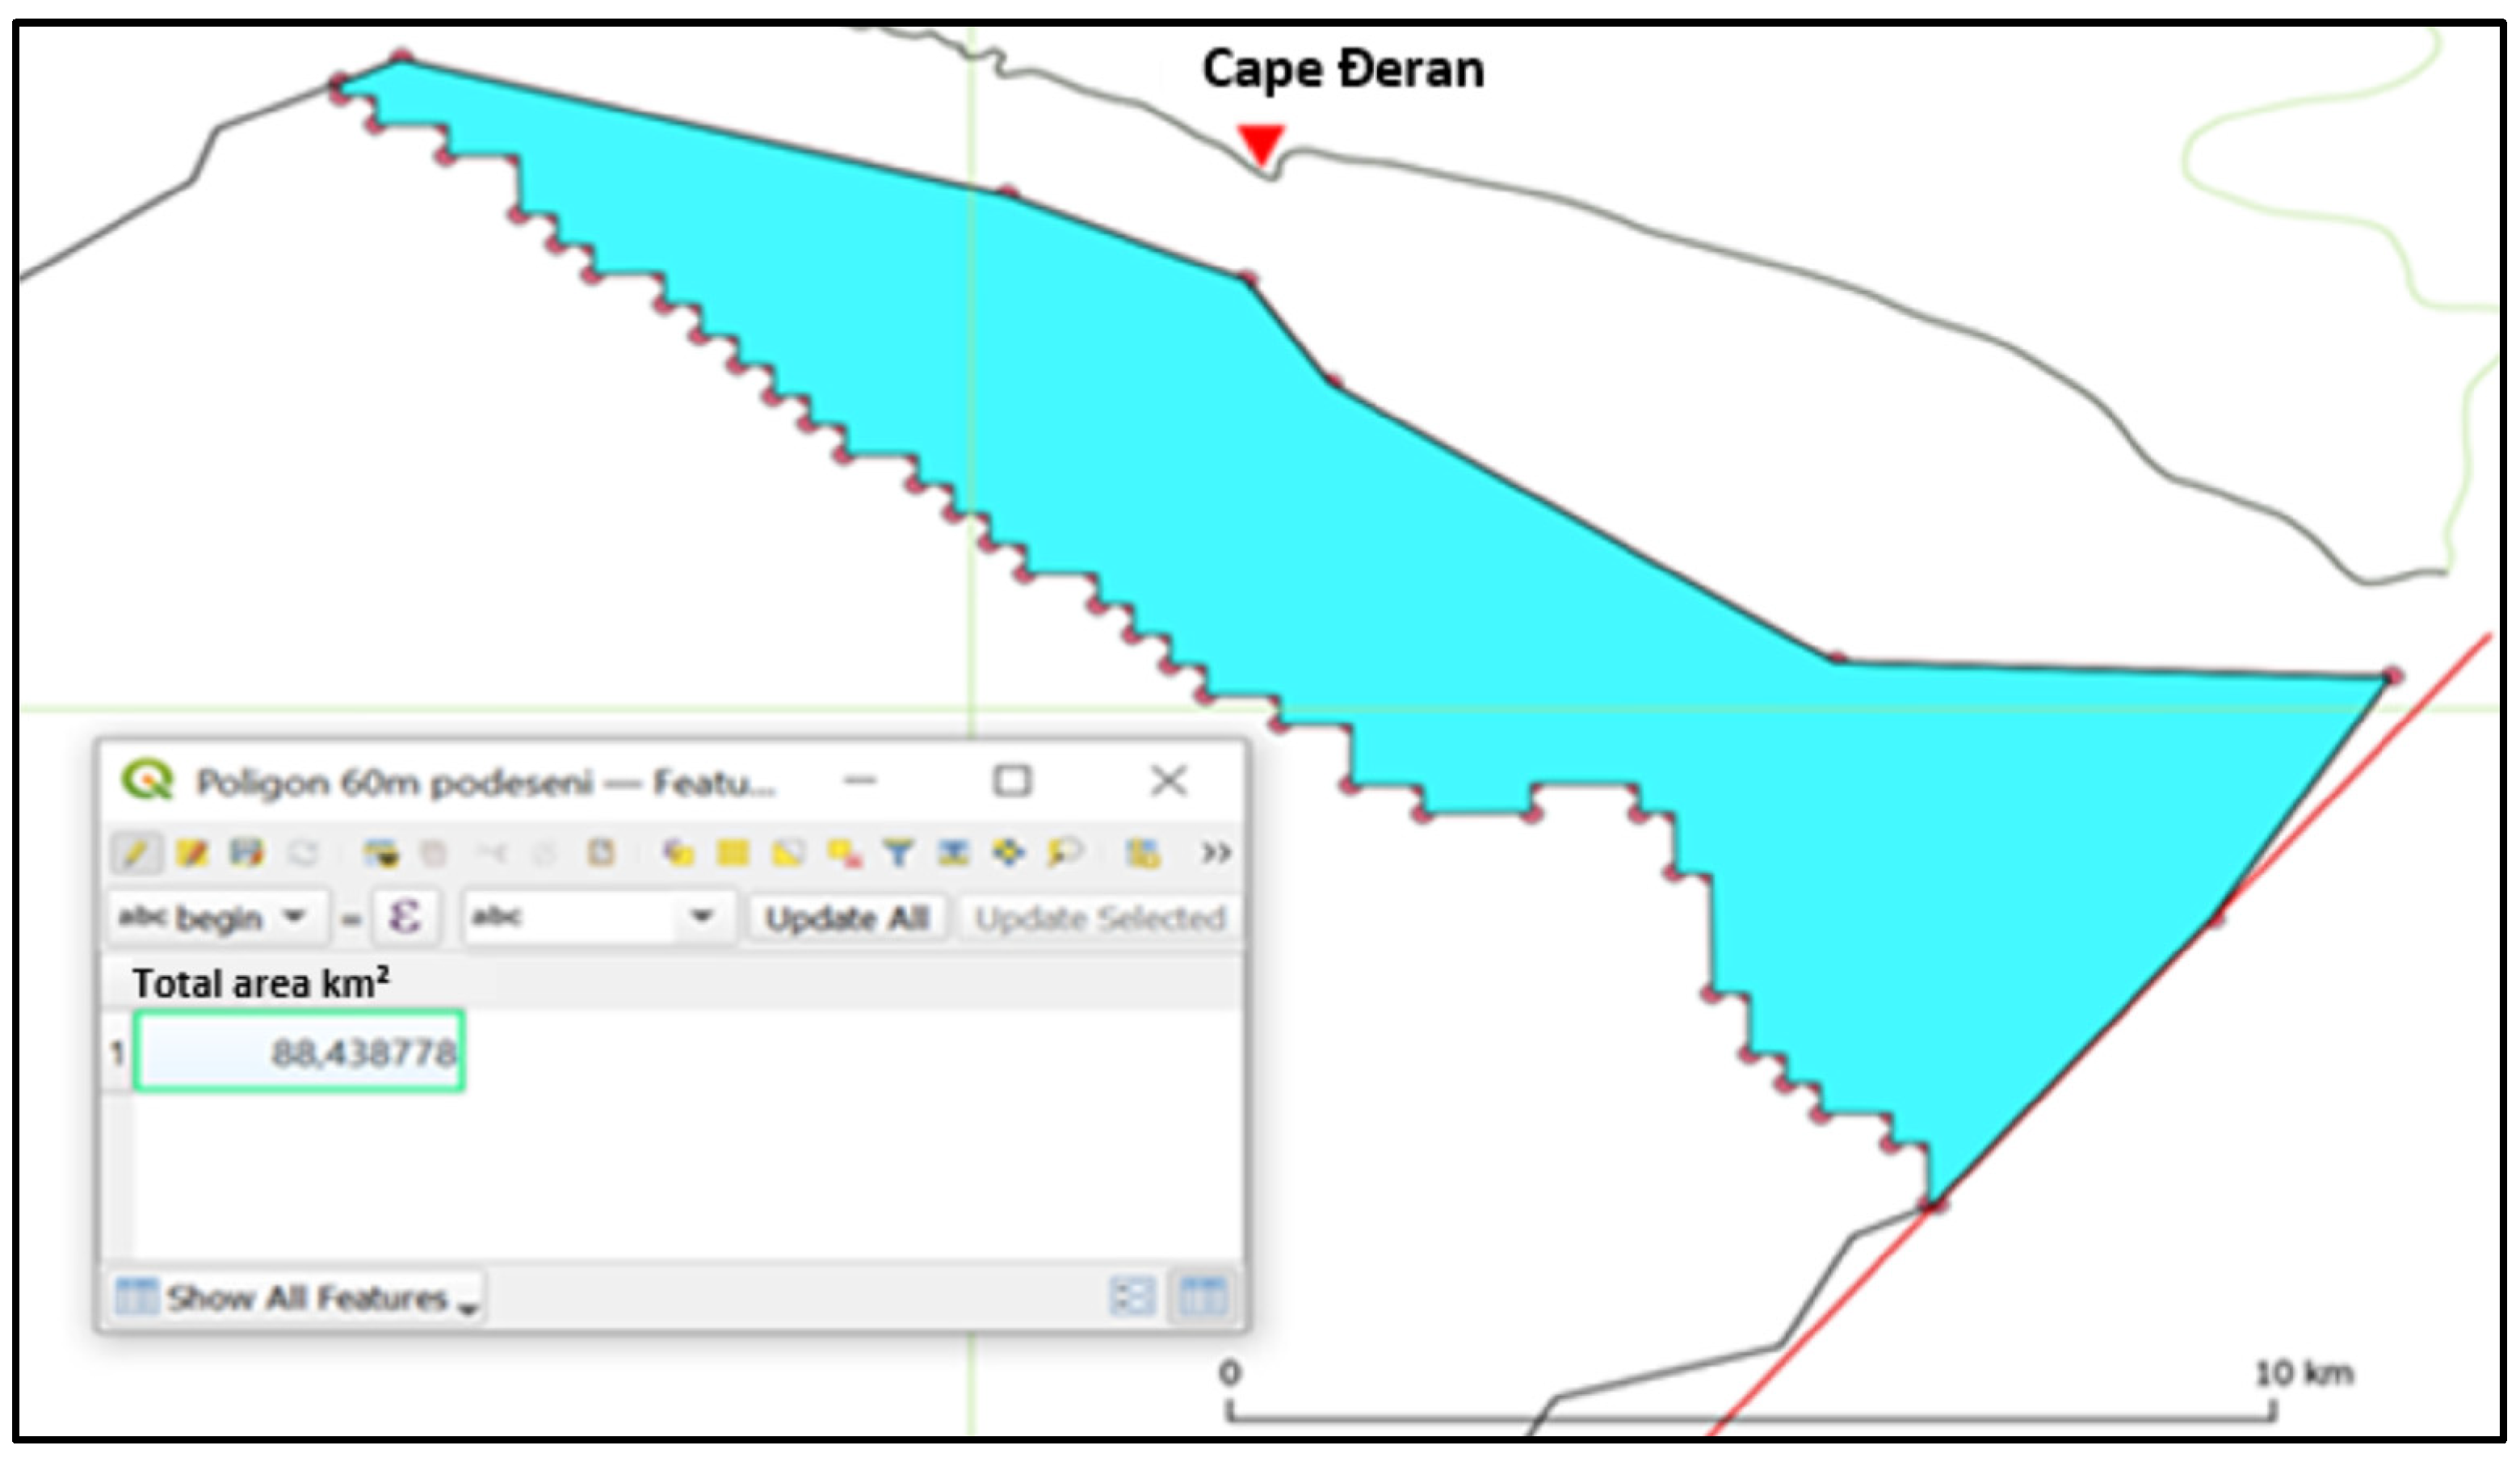
3.2.2. GEBCO-Grid 2023

GIS software was used to filter the GEBCO-grid 2023 database, accurately defining the 60 m isobath, as depicted in Figure 7.
Utilizing GIS tools to delineate areas with an average annual wind speed exceeding 7 m/s and a sea depth of less than 60 m, the calculated offshore area measures 88.438 km2. This specified region is illustrated in Figure 8.

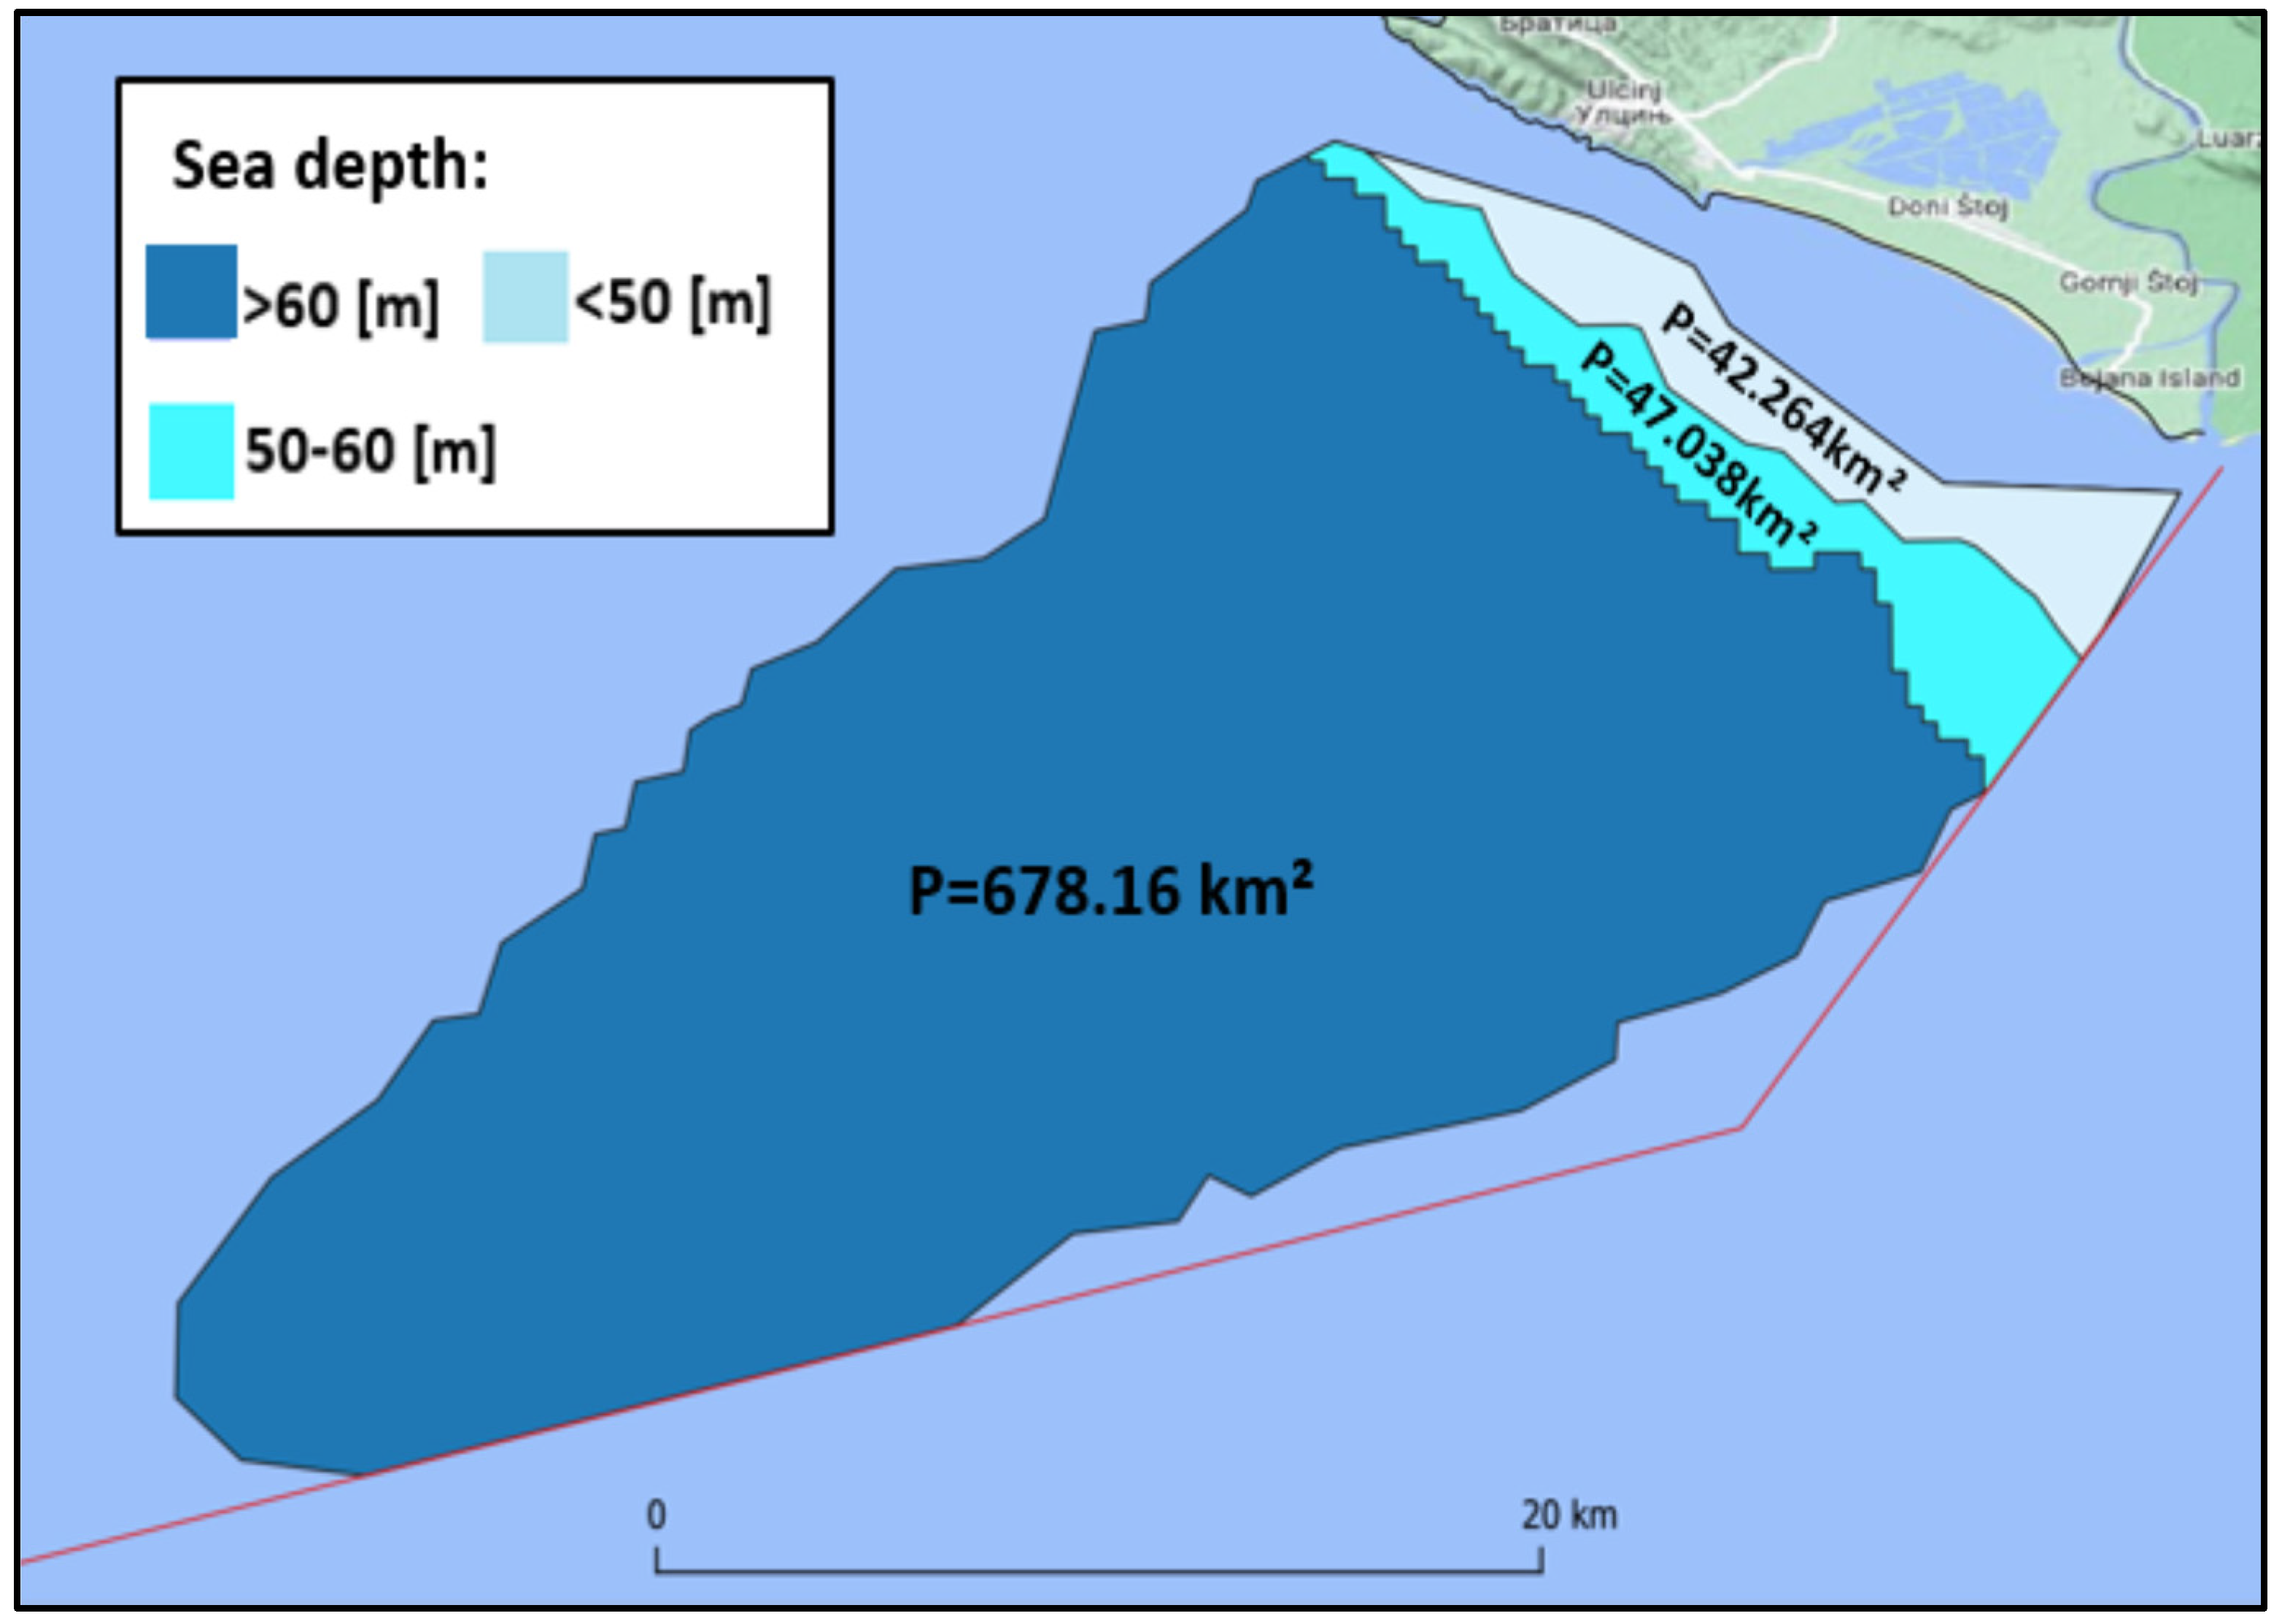
3.2.3. Bathymetry Results

Combining data from the digitized bathymetric map HI-JRM 1985 and the GEBCO-grid 2023 database yielded a bathymetric map for areas with average annual wind speeds exceeding 7 m/s. The integrated bathymetric map is shown in Figure 9.
An accurate distribution of average wind speeds at an altitude of 150 m relative to the sea depth is presented in Figure 10, utilizing GIS tools.
The extensive utilization of GIS tools unveiled that 678.16 km2 of the designated area lies at sea depths exceeding 60 m. Within the depth range of 50 to 60 m, an area of 46.185 km2 is identified, while depths shallower than 50 m cover 42.253 km2. Figure 11 illustrates the distribution of these areas relative to the 60 m and 50 m isobaths.

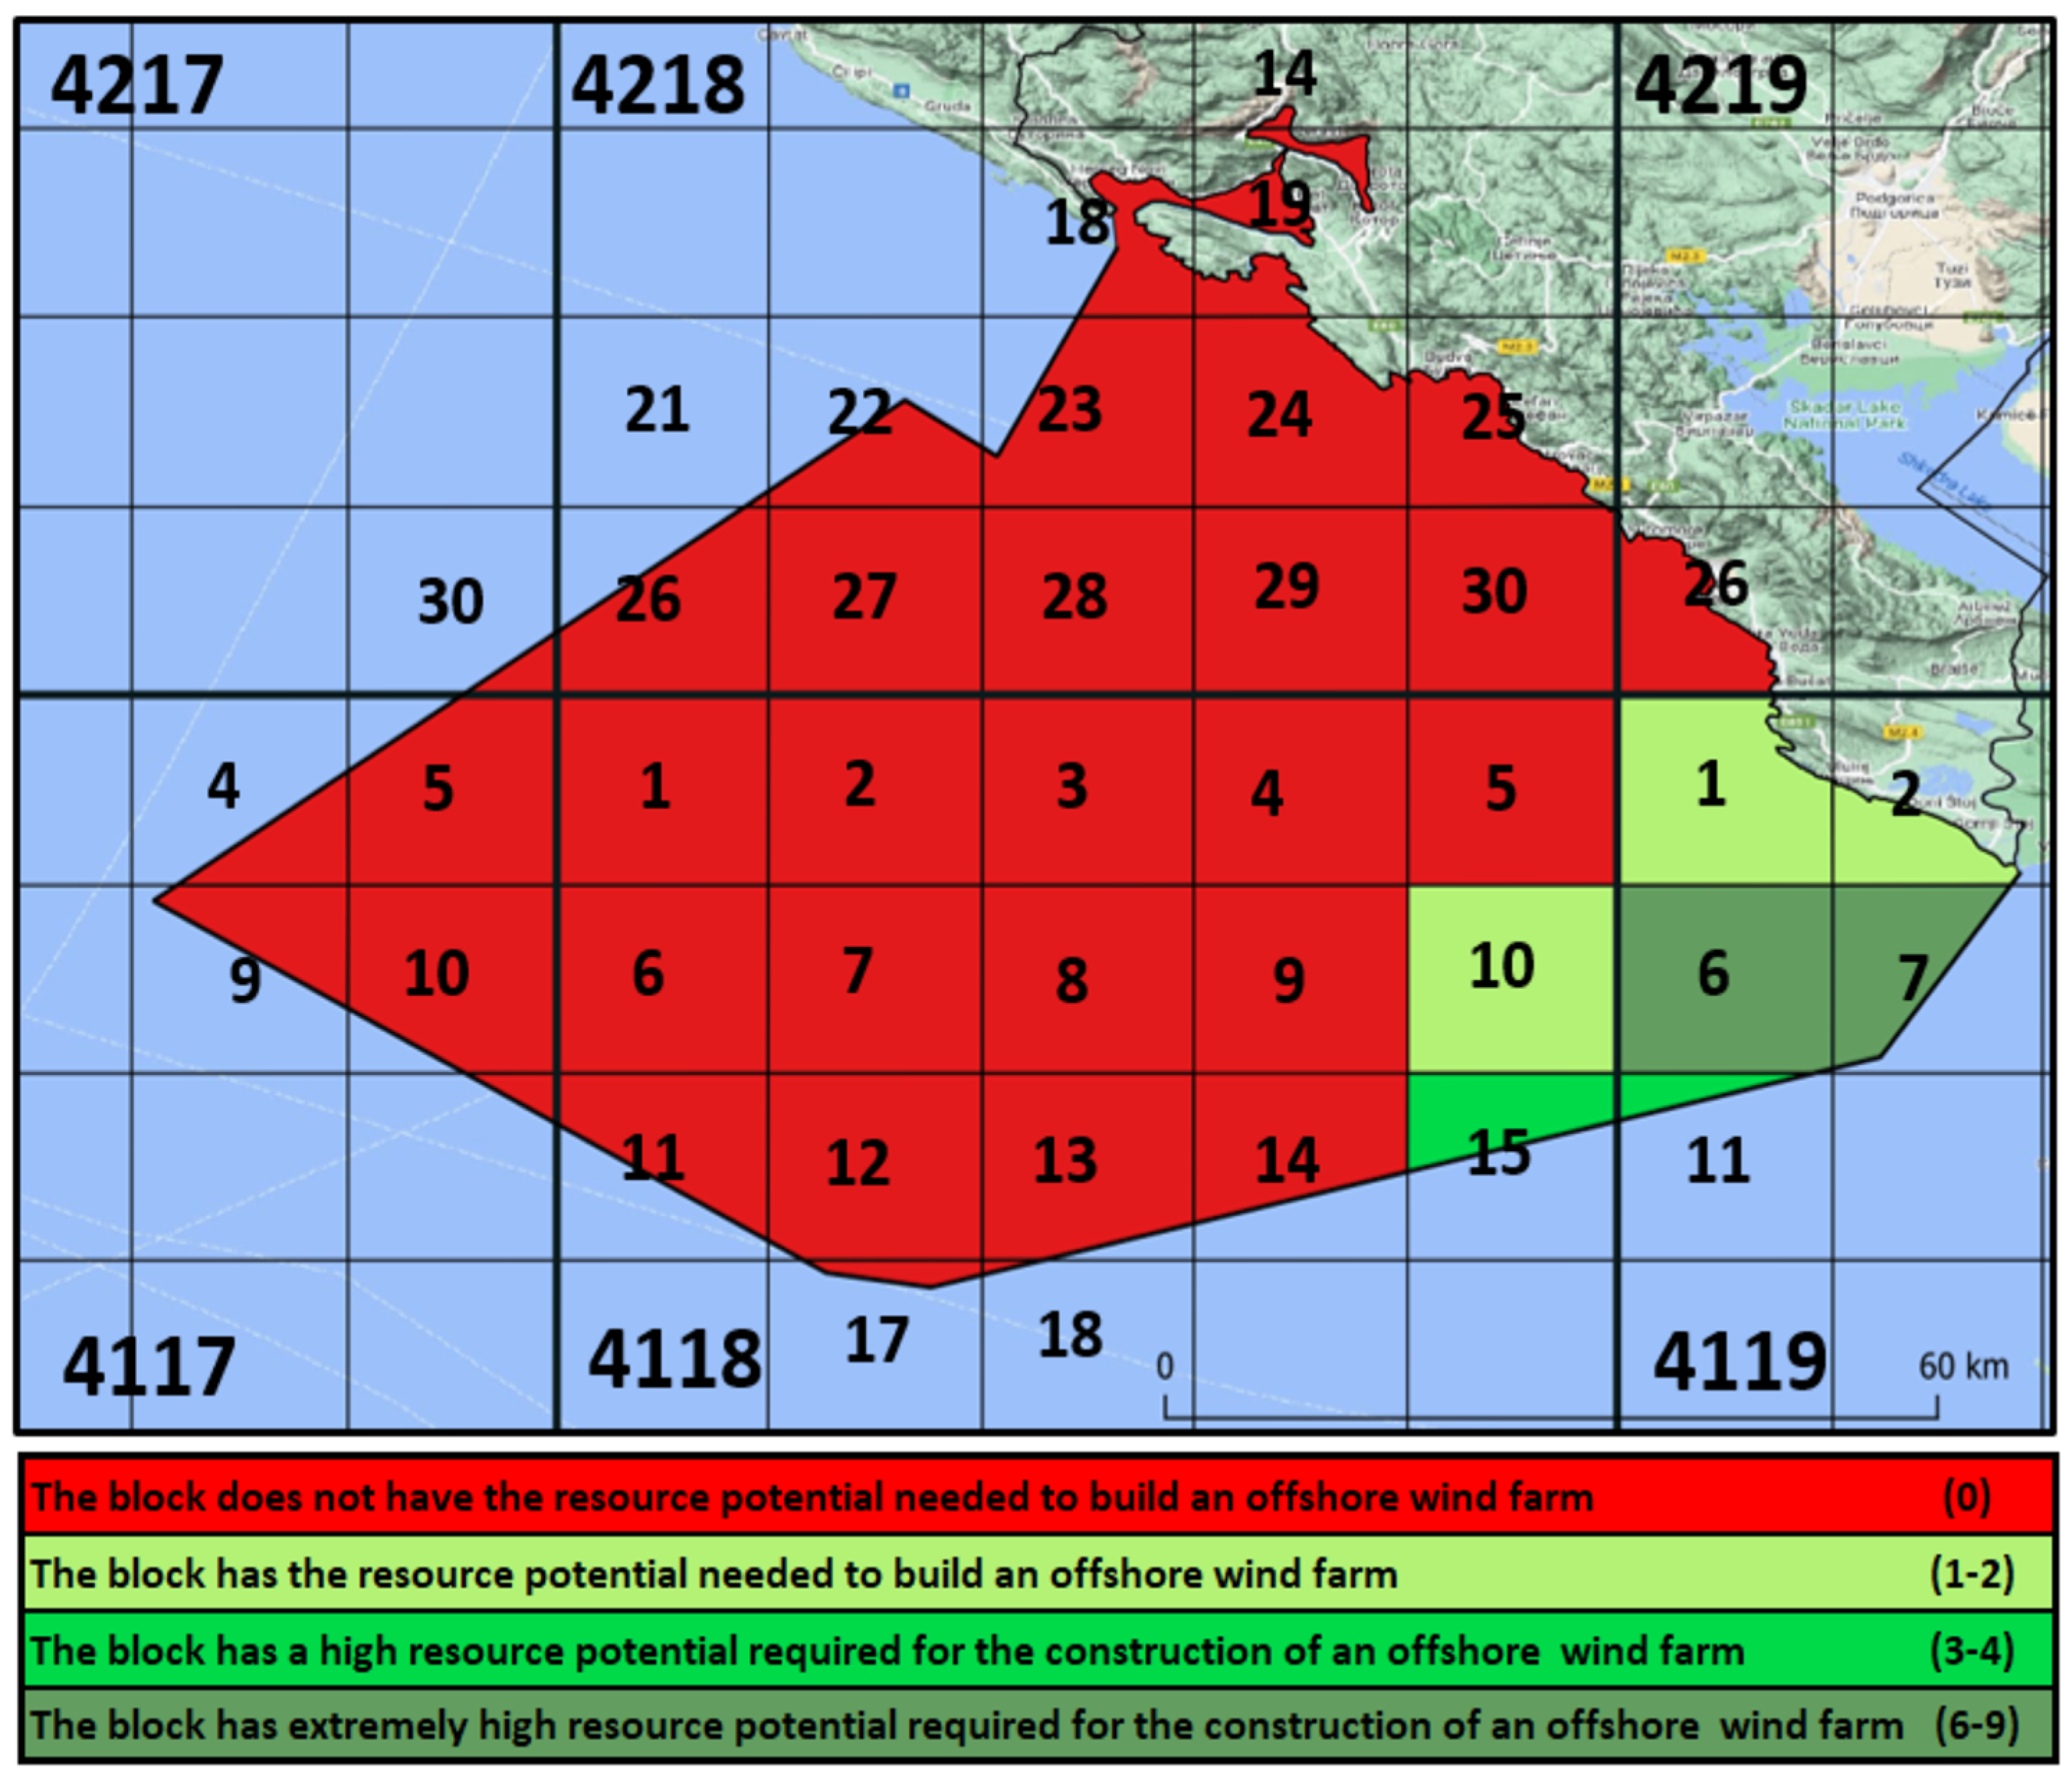
3.3. Potential of Offshore Wind Farms

The assessment of the potential for offshore wind farm construction was conducted using an assessment method, concentrating on the maritime blocks defined by the Government of Montenegro, as discussed in Section 2.2. Utilizing GIS software analytical tools at an elevation of 150 m for each maritime block, the results obtained during Phase No. 1 are outlined in Table 5.
Based on the analysis results presented in Table 5, analysis reveals control points with average annual wind speeds exceeding 7 m/s situated in the following blocks: 4118-10, 4118-15, 4119-1, 42219-2, 42119-6, 42119-7, and 42119-11.
Continuing the utilization of analytical GIS software tools at an elevation of 150 m for each offshore block, as per Phase No. 2 of this study, Table 6 presents the results.
Based on the values presented in Table 5 and Table 6, the total number of corrected control points for Phase No. 3 was calculated according to the criteria outlined in Table 2, as shown in Table 7.
Using the values from Table 5, Table 6 and Table 7, an assessment was conducted for each offshore block, aligning with the matrix in Table 2. The results regarding the presence of resource potential for wind power plant construction at sea in Montenegro are presented in Table 8.
The results of the assessment of offshore blocks, as depicted in Table 8, are visually represented in Figure 12.
Based on Figure 12, it is evident that seven blocks possess the necessary potential for the construction of offshore wind farms. These blocks are identified as follows: 4118-10, 4118-15, 4119-1, 4119-2, 4119-6, 4119-7, and 4119-11.

4. Discussion

The research results facilitated the precise identification of areas with technical potential suitable for constructing offshore wind farms in Montenegro. The technical wind potential of the area is defined as the product of the sea surface area possessing average annual wind speeds from 7 to 8 m/s and values of 3 MW/km2 [20]. During the research, it was determined that a total sea surface area of 766.598 km2 in the Montenegrin part of the Adriatic possesses an average annual wind speed from 7 to 7.5 m/s. Multiplying this surface area by the recommended/expected value of 3 MW/km2 revealed that the estimated technical potential allows for the construction of an offshore wind farm in Montenegro with a total installed capacity of 2299.794 MW.
Throughout the research, it was found that an area of 42.253 km2 of the sea surface in the Montenegrin part of the Adriatic is deemed suitable for the construction of a fixed offshore wind farm, with a total installed capacity of 126.759 MW. Additionally, an area of 46.185 km2 of the sea surface in the Montenegrin part of the Adriatic is deemed suitable for the construction of a jacket-fixed offshore wind farm, with a total installed capacity of 138.555 MW. Furthermore, an area of 678.16 km2 is deemed suitable for the construction of a floating wind farm, with a total installed capacity of 2034.48 MW. The values of the estimated technical potential and the identified areas where it is assessed that offshore wind farms can be constructed are presented in Figure 13.
The identified area is located south of the municipality of Ulcinj, along the border with the Republic of Albania. The shortest distance between the specified area and the coastline (Cape Đeran) is approximately 1.4 km, while the furthest point of the specified area is at a distance of approximately 47.8 km from Cape Đeran.
The identified area spans between the isobaths of 0 to 50 m and 200 to 300 m in depth, indicating that wind farms can be constructed on this surface using both fixed and floating structures, depending on the sea depth. Database analyses revealed that the most promising part of the identified area extends to depths from 60 to 100 m.
The entire research is based on the analysis of the GWA database, which, in addition to historical wind speed data, also utilizes mathematical models to generate output values for average annual wind speeds. Although the validation of GWA software data in 35 countries has shown a high level of reliability, it is necessary to conduct further research in the future to validate the data specifically for the Montenegrin part of the Adriatic Sea. Future research efforts should primarily focus on measuring actual average wind speeds in the observed area using anemometers installed on floating buoys to obtain accurate values of average annual wind speeds. In areas where the measured average wind speeds prove technically sufficient for offshore wind farm construction, it is necessary to conduct detailed bathymetric measurements. Precise results from measuring the depth of the observed area’s sea would enable the definition of technological solutions for supporting structures (fixed and/or floating structures) that need to be applied for the construction of wind farms in that particular area.

5. Conclusions

The conducted research in this paper has revealed the existence of sea areas in Montenegrin waters with the potential for the construction of wind farms. Furthermore, through the research, specific sea areas have been precisely identified, along with the necessary technical solutions that need to be applied for the construction of wind farms, including an assessment of the potential for clean energy production.
The conclusions of this research have shown:
  • The identified sea area extends across seven offshore blocks designated by the decisions of the Government of Montenegro for the purposes of hydrocarbon exploration and production. These blocks are as follows: 4118-10, 4118-15, 4119-1, 4119-2, 4119-6, 4119-7, and 4119-11;
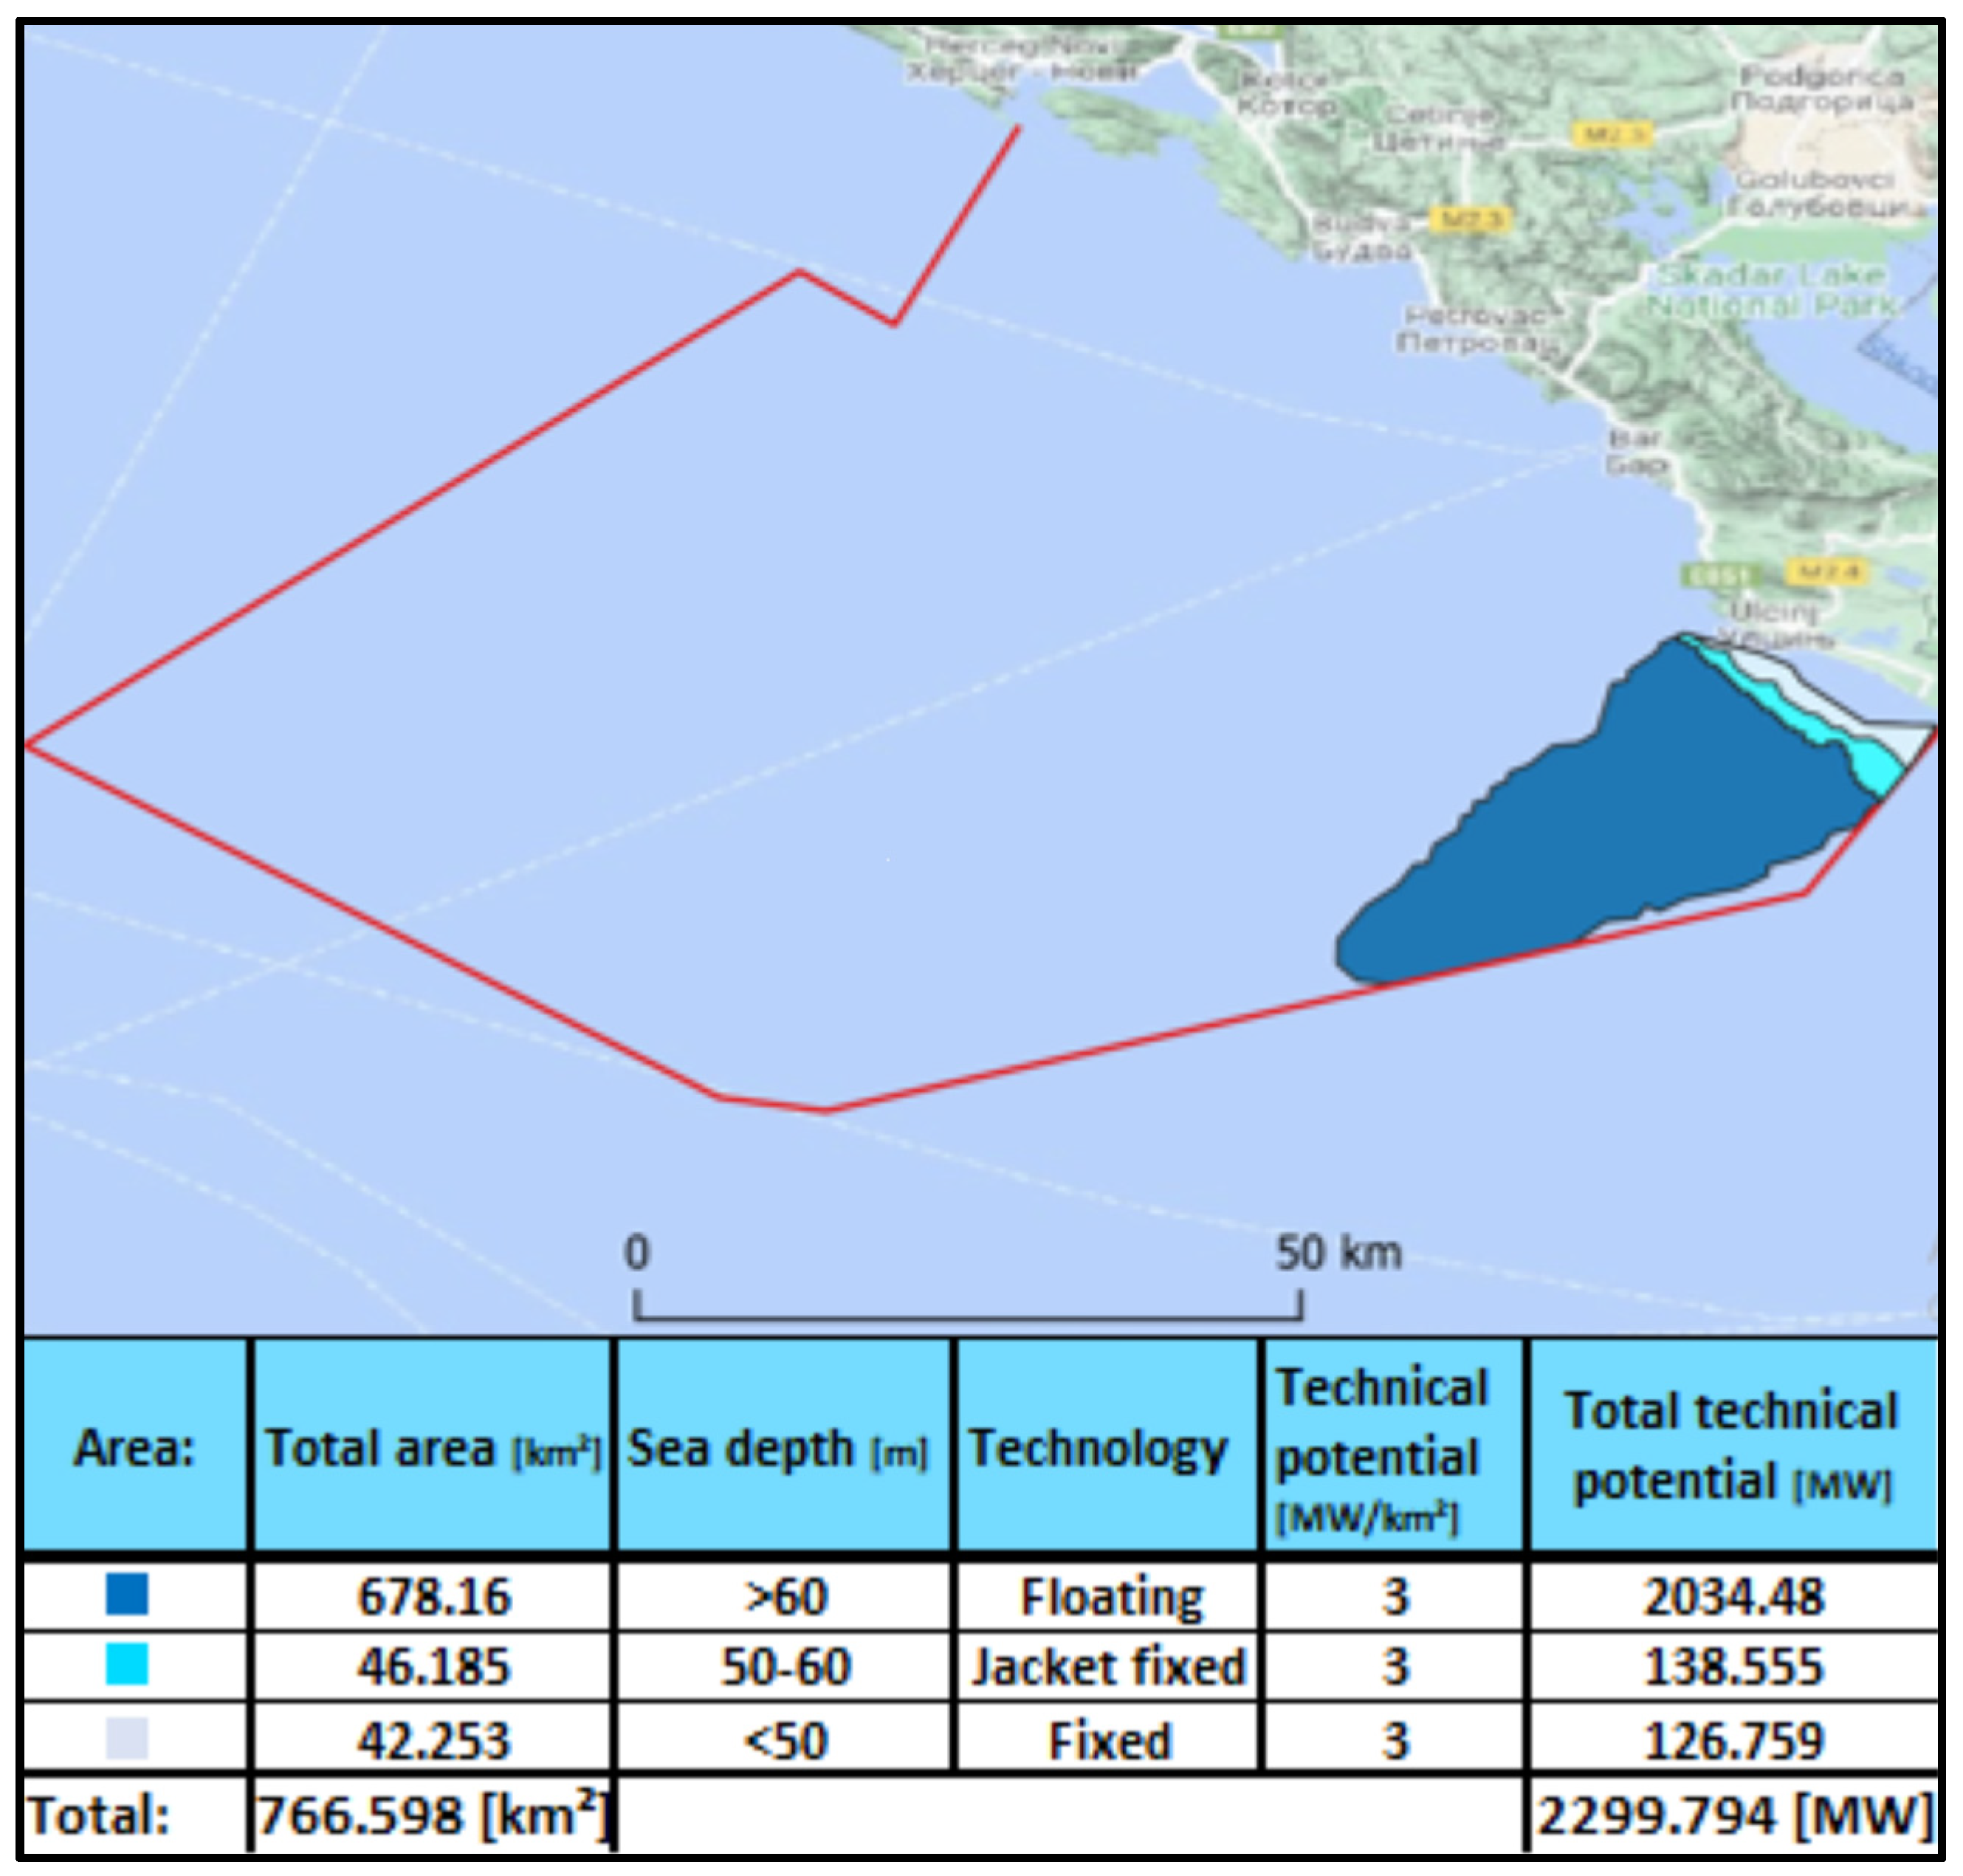
  • It is estimated that an offshore wind farm with a total capacity of 2299.794 MW can be built on the identified area, which is 2.18 times more than the total installed production capacity of Montenegro in the year 2022;
  • On the identified area up to a sea depth of 50 m, where wind farms can be built using fixed structures, there is an available potential estimated at 126.759 MW for the construction of wind farms;
  • At sea depths from 50 to 60 m, the identified areas where wind farms can be constructed using jacket-fixed structures are estimated to have the potential to build wind farms with a total capacity of 138.555 MW;
  • At sea depths greater than 60 m, where wind farms can only be constructed using floating structures, an estimated 2034.48 MW of floating wind farms can be installed.
As 88.46% of the sea area suitable for wind farm construction is located at depths greater than 60 m, innovative technological solutions, commercially introduced for the first time in 2017, are essential for this area. On the remaining surface, up to a sea depth of 60 m, wind farms can be constructed using fixed wind turbine structures, which have been successfully applied globally for more than three decades.

Author Contributions

Conceptualization, M.B. and Š.I.; methodology, M.B. and Š.I.; software, M.B.; formal analysis, M.B.; investigation, M.B.; resources, M.B. and Š.I.; writing—original draft preparation, M.B. and Š.I.; writing—review and editing, M.B. and Š.I.; visualization, M.B.; supervision, Š.I. All authors have read and agreed to the published version of the manuscript.

Funding

This research received no external funding.

Data Availability Statement

The data are contained within the article.

Conflicts of Interest

The authors declare no conflicts of interest.

References

  1. ESMAP—Energy Sector Management Assistance Program. Key Factors for Successful Development of Offshore Wind in Emerging Markets; ESMAP: Washington, DC, USA, 2021. [Google Scholar]
  2. IRENA—International Renewable Energy Agency. World Energy Transition 1.5° Pathway; IRENA: Masdar City, United Arab Emirates, 2022. [Google Scholar]
  3. Jia, H.; Fan, S.; Xia, M. The impact of renewable energy consumption on economic growth: Evidence from countries along the belt and road. Sustainability 2022, 15, 8644. [Google Scholar] [CrossRef]
  4. Herrera Anchustegui, I.; Radovich, V.S. Wind energy on the high seas: Regulatory challenges for a science fiction future. Energies 2022, 15, 9157. [Google Scholar] [CrossRef]
  5. Caputo, A.C.; Federici, A.; Pelagagge, P.M.; Salini, P. Scenario analysis of offshore wind-power systems under uncertainty. Sustainability 2022, 15, 16912. [Google Scholar] [CrossRef]
  6. United Nations. United Nations Convention on the Law of the Sea; United Nations: New York, NY, USA, 1982. [Google Scholar]
  7. Krivokapić, B. Međunarodno Javno Pravo Treće Dopunjeno Izdanje; Poslovni i Pravni Fakultet: Belgrade, Serbia, 2017. [Google Scholar]
  8. Đurišić, Ž. Vjetroelektrane; Akademska Misao: Belgrade, Serbia, 2019. [Google Scholar]
  9. Putria, R.M.; Cheynet, E.; Obhraia, C.; Jakobsen, J.B. Turbulence in a coastal environment: The case of Vindeby. Wind Energy Sci. 2022, 7, 1693–1710. [Google Scholar] [CrossRef]
  10. Díaz, H.; Serna, J.; Nieto, J.; Guedes Soares, C. Market Needs, Opportunities and Barriers for the Floating. J. Mar. Sci. Eng. 2022, 10, 934. [Google Scholar] [CrossRef]
  11. U.S. Department of Energy, Office of Energy Efficiency and Renewable Energy. Offshore Wind Market Report: 2023 Edition; U.S. Department of Energy, Office of Energy Efficiency and Renewable Energy: Washington, DC, USA, 2023.
  12. Evan, G.; Rinker, J.; Sethuraman, L.; Zahle, F.; Anderson, B.; Barter, G.; Abbas, N.; Meng, F.; Bortolotti, P.; Skrzypinski, W.; et al. Definition of the IEA 15-Megawatt Offshore Reference Wind; National Renewable Energy Laboratory: Golden, CO, USA, 2020.
  13. Wind Europe. Wind Energy in Europe—2021 Statistics and the Outlook for 2022–2026. 2022. Available online: https://windeurope.org/intelligence-platform/product/wind-energy-in-europe-2021-statistics-and-the-outlook-for-2022-2026/ (accessed on 11 February 2024).
  14. Zhou, Y.X.; Ke, Y.; Zhu, J.; Cui, W. Sustainable operation and maintenance of offshore wind farms based on the deep wind forecasting. Sustainability 2023, 16, 333. [Google Scholar] [CrossRef]
  15. Telesetsky, A. Multilateral debt relief for clean ocean energy. Sustainability 2023, 15, 14702. [Google Scholar] [CrossRef]
  16. Chen, C.; Su, N. Global trends and characteristics of offshore wind farm research over the past three decades: A bibliometric analysis. J. Mar. Sci. Eng. 2022, 10, 1339. [Google Scholar] [CrossRef]
  17. Mingxin, L.; Carroll, J.; Ahmad, A.S.; Hasan, N.S.; Zolkiffly, M.Z.; Falope, G.B.; Sabil, K.M. Potential of offshore wind energy in Malaysia: An investigation into wind and bathymetry conditions and site selection. Energies 2023, 17, 65. [Google Scholar] [CrossRef]
  18. Perera, S.M.; Putrus, G.; Conlon, M.; Narayana, M.; Sunderland, K. Wind energy harvesting and conversion systems: A technical review. Energies 2022, 15, 9299. [Google Scholar] [CrossRef]
  19. Borunda, M.; Ramírez, A.; Garduno, R.; Mijarez, R. Enhancing long-term wind power forecasting by using an intelligent statistical treatment for wind resource data. Energies 2022, 16, 7915. [Google Scholar] [CrossRef]
  20. ESMAP—Energy Sector Management Assistance Program. Going Global Expanding Offshore Wind to Emerging Markets; ESMAP: Washington, DC, USA, 2019. [Google Scholar]
  21. Castro, A.O.; Muñoz Maldonado, Y.; Cordero, A.M. Feasibility analysis of offshore wind power projects in the Caribbean region of Colombia: A case study using FAHP–GIS. Sustainability 2022, 15, 16620. [Google Scholar] [CrossRef]
  22. Wind Europe. Floating Offshore Wind Vision Statement. Wind Europe, 2017. Available online: https://windeurope.org/wp-content/uploads/files/about-wind/reports/Floating-offshore-statement.pdf (accessed on 11 February 2024).
  23. Intecsea; NOIA; NEIA. Evaluating the Technical Feasibility of Wind Energy to Electrify Oil and Gas Production Facilities Offshore Newfoundland and Labrador, Canada. 2020. Available online: https://netzeroproject.ca/report-released-evaluating-the-technical-feasibility-of-wind-energy-to-electrify-oil-and-gas-production-facilities-offshore-newfoundland-and-labrador-canada/ (accessed on 11 February 2024).
  24. U.S. Department of Energy, Office of Energy Efficiency and Renewable Energy. Offshore Wind Market Report: 2022 Edition; U.S. Department of Energy, Office of Energy Efficiency and Renewable Energy: Washington, DC, USA, 2022.
  25. Horwath, S.; Hassrick, J.; Grismala, R.; Diller, E. Comparison of Environmental Effects from Different Offshore Wind Turbine Foundations; U.S. Department of the Interior Bureau of Ocean Energy Management, Office of Renewable Energy Programs: Washington, DC, USA, 2020.
  26. Chen, J.; Moo-Hyun, K. Review of recent offshore wind turbine research and optimization methodologies in their design. J. Mar. Sci. Eng. 2022, 10, 28. [Google Scholar] [CrossRef]
  27. Mathern, A.; Marx, S. Concrete Support Structures for Offshore Wind Turbines: Current Status, Challenges, and Future Trends. Energies 2020, 14, 1995. [Google Scholar] [CrossRef]
  28. Otter, A.; Murphy, J.; Pakrashi, V.; Robertson, A.; Desmond, C. A review of modelling techniques for floating offshore wind. Wind Energy 2021, 25, 831–857. [Google Scholar] [CrossRef]
  29. Ibrion, M.; Nejad, A.R. On a road map for technology qualification, innovation and cost reduction in floating offshore wind: Learning from Hywind and Norwegian approach. J. Phys. Conf. Ser. 2023, 2507, 012008. [Google Scholar] [CrossRef]
  30. Equinor. The World’s Largest Floating Offshore Wind Farm Officially Opened. 2023. Available online: https://www.equinor.com/news/20230823-hywind-tampen-officially-opened (accessed on 23 December 2023).
  31. Harger, A.; Carmo, L.H.; Gay Neto, A.; Simos, A.N.; Franzini, G.R.; Vieira, G.H. Modal analysis of 15 MW semi-submersible floating wind turbine: Investigation on the main influences in natural vibration. Wind 2023, 3, 548–566. [Google Scholar] [CrossRef]
  32. Rehman, S.; Irshad, K.; Ibrahim, N.I.; AlShaikhi, A.; Mohandes, M.A. Offshore wind power resource assessment in the Gulf of North Suez. Sustainability 2022, 15, 15257. [Google Scholar] [CrossRef]
  33. Onea, F.; Rusu, E.; Rusu, L. Assessment of the offshore wind energy potential in the Romanian exclusive economic zone. J. Mar. Sci. Eng. 2021, 9, 531. [Google Scholar] [CrossRef]
  34. Yildirir, V.; Rusu, E.; Onea, F. Wind energy assessments in the northern Romanian coastal environment based on 20 years of data coming from different sources. Sustainability 2022, 14, 4249. [Google Scholar] [CrossRef]
  35. Al-Hinai, A.; Charabi, Y.; Aghay Kaboli, S.H. Wind energy resource assessment across the territory of Oman: A spatial-temporal data analysis. Sustainability 2020, 13, 2862. [Google Scholar] [CrossRef]
  36. Das, P.; Amin, S.M.; Lipu, M.S.; Urooj, S.; Ashique, R.H.; Al Mansur, A.; Islam, M.T. Assessment of barriers to wind energy development using analytic hierarchy process. Sustainability 2023, 15, 15774. [Google Scholar] [CrossRef]
  37. Moltames, R.; Naghavi, M.S.; Silakhori, M.; Noorollahi, Y.; Yousefi, H.; Azizimehr, B. Multi-criteria decision methods for selecting a wind farm site using a geographic information system (GIS). Sustainability 2021, 14, 14742. [Google Scholar] [CrossRef]
  38. Xenitidis, K.; Ioannou, K.; Tsantopoulos, G.; Myronidis, D. On the usage of artificial neural networks for the determination of optimal wind farms allocation. Sustainability 2022, 15, 16938. [Google Scholar] [CrossRef]
  39. Nikolić, G.; Vujović, F.; Golijanin, J.; Šiljeg, A.; Valjarević, A. Modelling of wildfire susceptibility in different climate zones in Montenegro Using GIS-MCDA. Atmosphere 2023, 14, 929. [Google Scholar] [CrossRef]
  40. Punda, V.B.; Filipović, V. Protokol o privremenom režimu uz južnu granicu između dviju država (2002) s posebnim osvrtom na odluke Vlada Republike Hrvatske i Crne Gore o istraživanju i eksploataciji ugljikovodika u Jadranu. PPP 2015, 169, 73–88. [Google Scholar]
  41. CAU; ITI; ELARD. Izvještaj o Strateškoj Procjeni na Životnu Sredinu (SPU) za Istraživanje i Proizvodnju Ugljovodonika u Podmorju Crne Gore; Ministarstvo Ekonomije (Crna Gora): Podgorica, Montenegro, 2016. [Google Scholar]
  42. REGAGEN—Regulatorna Agencija za Energetiku i Komunalne Djelatnosti. Izvještaj o Stanju Energetskog Sektora Crne Gore za 2022. Godinu; REGAGEAN: Podgorica, Montenegro, 2023. [Google Scholar]
  43. Energy Community. Energy Community CBAM-Readiness Tracker; Energy Community Secretariat: Vienna, Austria, 2023. [Google Scholar]
  44. Ministarstvo Kapitalnih Investicija. Izvještaj o Realizaciji Energetskoga Bilansa za 2022. Godinu; Ministarstvo Kapitalnih Investicija: Podgorica, Montenegro, 2023. [Google Scholar]
  45. Zakon o Moru. („Sl. List Crne Gore“, br. 17/07 od 31.12.2007, 06/08 od 25.01.2008, 40/11 od 08.08.2011). 2007. Available online: https://epa.org.me/wp-content/uploads/2017/12/zakon-o-moru.pdf (accessed on 11 February 2024).
  46. Zakon o Energetici. („Sl. List Crne Gore“, br. 5/2016, 51/2017 i 82/2020). 2020. Available online: https://wapi.gov.me/download/e731d4ca-a833-4230-8a68-527ee3e72d9e?version=1.0 (accessed on 11 February 2024).
  47. Odluka o Određivanju Blokova za Istraživanje i Proizvodnju Ugljovodonika (“Sl. List Crne Gore“, br. 41/10). 2011. Available online: https://www.gov.me/dokumenta/8433c891-0b99-4264-b674-975bc353f38b (accessed on 11 February 2024).
  48. Odluka o Izmjeni Odluke o Određivanju Blokova za Istraživanje i Proizvodnju Ugljovodonika (“Sl. List Crne Gore“, br. 41/10 i 62/13). 2014. Available online: https://www.gov.me/dokumenta/4dbd844b-4c77-4915-aaf0-df036a009a32 (accessed on 11 February 2024).
  49. Manfra, L.; Virno Lamberti, C.; Ceracchi, S.; Giorgi, G.; Berto, D.; Lipizer, M.; Giani, M.; Bajt, O.; Fafanđel, M.; Cara, M.; et al. Challenges in harmonized environmental impact assessment (EIA), monitoring and decommissioning procedures of offshore platforms in Adriatic-Ionian (ADRION) region. Water 2020, 12, 2460. [Google Scholar] [CrossRef]
  50. Nikčević, J.; Škurić, M. A Contribution to the sustainable development of maritime transport in the context of blue economy: The case of Montenegro. Sustainability 2020, 13, 3079. [Google Scholar] [CrossRef]
  51. Larsén, X.G.; Davis, N.; Hannesdoottir, A.; Kelly, M.; Svenningsen, L.; Slot, R.; Imberger, M.; Olsen, B.T.; Floors, R. The Global Atlas for Siting Parameters project: Extreme wind, turbulence, and turbine classes. Wind Energy 2022, 25, 1841–1859. [Google Scholar] [CrossRef]
  52. Global Wind Atlas 3.1. Method. 2023. Available online: https://globalwindatlas.info/en/about/method (accessed on 15 January 2024).
  53. Davis, N.; Badger, J.; Hahmann, A.; Hansen, B.; Mortensen, N.; Kelly, M.; Larsén, X.; Olsen, B.; Floors, R.; Lizcano, G.; et al. The global wind atlas, a high-resolution dataset of climatology’s and associated web-based application. Bull. Am. Meteorol. Soc. 2023, 104, E1507–E1525. [Google Scholar] [CrossRef]
  54. GEBCO (General Bathymetric Chart of the Oceans). Overview. 2023. Available online: https://www.gebco.net/about_us/overview/ (accessed on 28 December 2023).
  55. GEBCO (General Bathymetric Chart of the Oceans). Gridded Bathymetry Data. 2023. Available online: https://www.gebco.net/data_and_products/gridded_bathymetry_data/#area (accessed on 18 December 2023).
  56. Ivošević, Š. An approach to the corrosion analysis of bulk carrier hull structure. Sci. J. Pol. Nav. Acad. 2015, 56, 23–32. [Google Scholar] [CrossRef]
Figure 1. (a) Montenegro offshore blocks divisions [48]; (b) Blocks & control points mesh illustration (the control points are indicative as illustrated in following sections).
Energies 17 01852 g001
Figure 2. Conceptual research methodology.
Energies 17 01852 g002
Figure 3. GWA mathematical model [52].
Energies 17 01852 g003
Figure 4. Montenegro offshore identified wind area (zone division).
Energies 17 01852 g004
Figure 5. HI-JRM 1985 chart overlapped with identified wind area.
Energies 17 01852 g005
Figure 6. HI-JRM 1985 isobath 50 m area.
Energies 17 01852 g006
Figure 7. GEBCO-grid 2023 isobath 60 m area.
Energies 17 01852 g007
Figure 8. GEBCO-grid 2023 isobaths 60 m area.
Energies 17 01852 g008
Figure 9. Bathymetry results 1.
Energies 17 01852 g009
Figure 10. Bathymetry results 2.
Energies 17 01852 g010
Figure 11. Bathymetry results 3.
Energies 17 01852 g011
Figure 12. Montenegro offshore blocks assessment.
Energies 17 01852 g012
Figure 13. Total technical potential for offshore wind in Montenegro.
Energies 17 01852 g013
Table 1. Correction factor (used in Phase No. 3).
Mean Annual Wind Speed
at the Control Point [m/s]
<77.0–7.17.1–7.27.2–7.37.3–7.47.4–7.5
Correction factor00.10.20.30.40.5
Table 2. Assessment matrix.
Assessment
Matrix
Frequency
Intensity Total number of
control points with
average annual wind speeds greater than
7 m/s
00–300300–600>600
Total number of corrected control points per km2 blockAbsolute
parameter
0123
000000
0–110123
1–220246
>230369
Block assessment criteria:Value:
The block does not have the resource potential needed to build an offshore wind farm0
The block has the resource potential needed to build an offshore wind farm1–2
The block has a high resource potential required for the construction of an offshore wind farm3–4
The block has extremely high resource potential required for the construction of an offshore wind farm6–9
Table 3. Coordinates of identified offshore area.
PointLongitude 1Latitude 1PointLongitude 1Latitude 1
119.3036641.7583018.9095341.72521
219.2954341.742633118.931541.73853
319.2693341.735453218.9349441.75185
419.2617841.722133318.9431841.75339
519.2411841.712913418.9459241.76465
619.2130341.705733518.9589741.76722
719.2123441.69653618.9606941.7772
819.1869341.684193718.9665241.78079
919.137541.674963818.9747641.7836
1019.1134641.663173918.9775141.79231
1119.1017941.66834018.9953641.79896
1219.0935541.657014119.0070341.80868
1319.0649841.654024219.0166541.81687
1419.0332741.631384319.0406841.81943
1519.0293741.630494419.0571641.82915
1619.0275941.630144519.0708941.87519
1719.0256441.629614619.0846341.87774
1818.9907141.621724719.08641.88694
1918.9619941.615254819.1120941.90483
2018.9206841.605764919.1148441.91199
2118.8929341.599385019.1361241.92169
2218.8725441.594685119.2061641.90279
2318.8388141.59855219.2336341.89103
2418.8209541.61395319.2432441.87672
2518.8216441.6375419.301641.83785
2618.8470541.667785519.3658941.83573
2718.8758941.686765619.3452441.80213
2818.8909941.706245719.3132341.76232
2918.9033541.707785819.3036641.758
1 Coordinate system: EPSG: 4326-WGS 84.
Table 4. Average wind speed—zone division.
Average Wind Speed (Zone) [m/s]Total Area
[km2]
Average Wind Speed (Zone) [m/s]Total Area
[km2]
7.0–7.1295.0717.3–7.4104.358
7.1–7.2174.2247.4–7.571.095
7.2–7.3121.8507.0–7.5766.598
Table 5. Phase No. 1 results.
Macro BlockBlockA 1B 2C 3D 4Macro BlockBlockA 1B 2C 3D 4
4117474.53233233041191281.15863578285
5268.988278270292.82293160133
9100.9329529506308.2890939870
10270.1480880807149.5544471373
1517.34595901135.511194772
41181306.43924924042173022.5675750
2309.8392492404218143.5215150
3306.2492492401873.772142140
4309.5395295201991.792702700
5303.4868968960211.42440
6303.79891891022112.43343340
7307.46891891023247.577437430
8303.81891891024273.768398390
9306.99918918025131.123873870
10300.4386458527926213.216566560
11175.27542542027305.299249240
12303.09915915028302.069249240
13281.06855855029305.149529520
14202.25629629030299.078958950
15116.6735365288421926137.954334330
1725.1766660
183.32880
1 Total area of the block [km2]. 2 The total number of control points within the area of the offshore block. 3 The total number of control points that have average annual wind speeds of less than 7 m/s. 4 The total number of control points that have mean annual wind speeds greater than 7 m/s.
Table 6. Phase No. 2 results.
Macro BlockBlockTotal Number of Control Points with Average
Annual Wind Speeds [m/s]:
7.0–7.1 7.1–7.2 7.2–7.3 7.3–7.4 7.4–7.5 7.0–7.5
41181024534000279
4118152880000288
41191587989581285
41192403528273133
41196137309162114148870
4119743649210470373
41191170200072
Table 7. Phase No. 3 results.
Macro BlockBlockTotal Number of
Corrected Control Points
Macro BlockBlockTotal Number of
Corrected Control Points
41174041191328.5
502151.4
9061026.7
1007457
1501172.2
4118104217300
204218140
30180
40190
50210
60220
70230
80240
90250
10282.4260
110270
120280
130290
140300
152884219260
170
180
Table 8. Montenegro offshore blocks assessment.
Macro BlockBlockBlock AssessmentMacro BlockBlockBlock Assessment
411740411912
5022
9069
10076
150113
4118104217300
204218140
30180
40190
50210
60220
70230
80240
90250
101260
110270
120280
130290
140300
1534219260
170
180
Block assessment criteria: The block does not have the resource potential needed to build a wind farm (0); The block has the resource potential needed to build a wind power plant (1–2); The block has a high resource potential required for the construction of a wind power plant (3–4); The block has extremely high resource potential required for the construction of a wind power plant (6–9).
Disclaimer/Publisher’s Note: The statements, opinions and data contained in all publications are solely those of the individual author(s) and contributor(s) and not of MDPI and/or the editor(s). MDPI and/or the editor(s) disclaim responsibility for any injury to people or property resulting from any ideas, methods, instructions or products referred to in the content.

