

Methodology for Circuit Breaker Contact Diagnosis through Dynamic Resistance Measurements and Fuzzy-Logic-Based Analysis

 ,
,  , , and
Abstract
1. Introduction
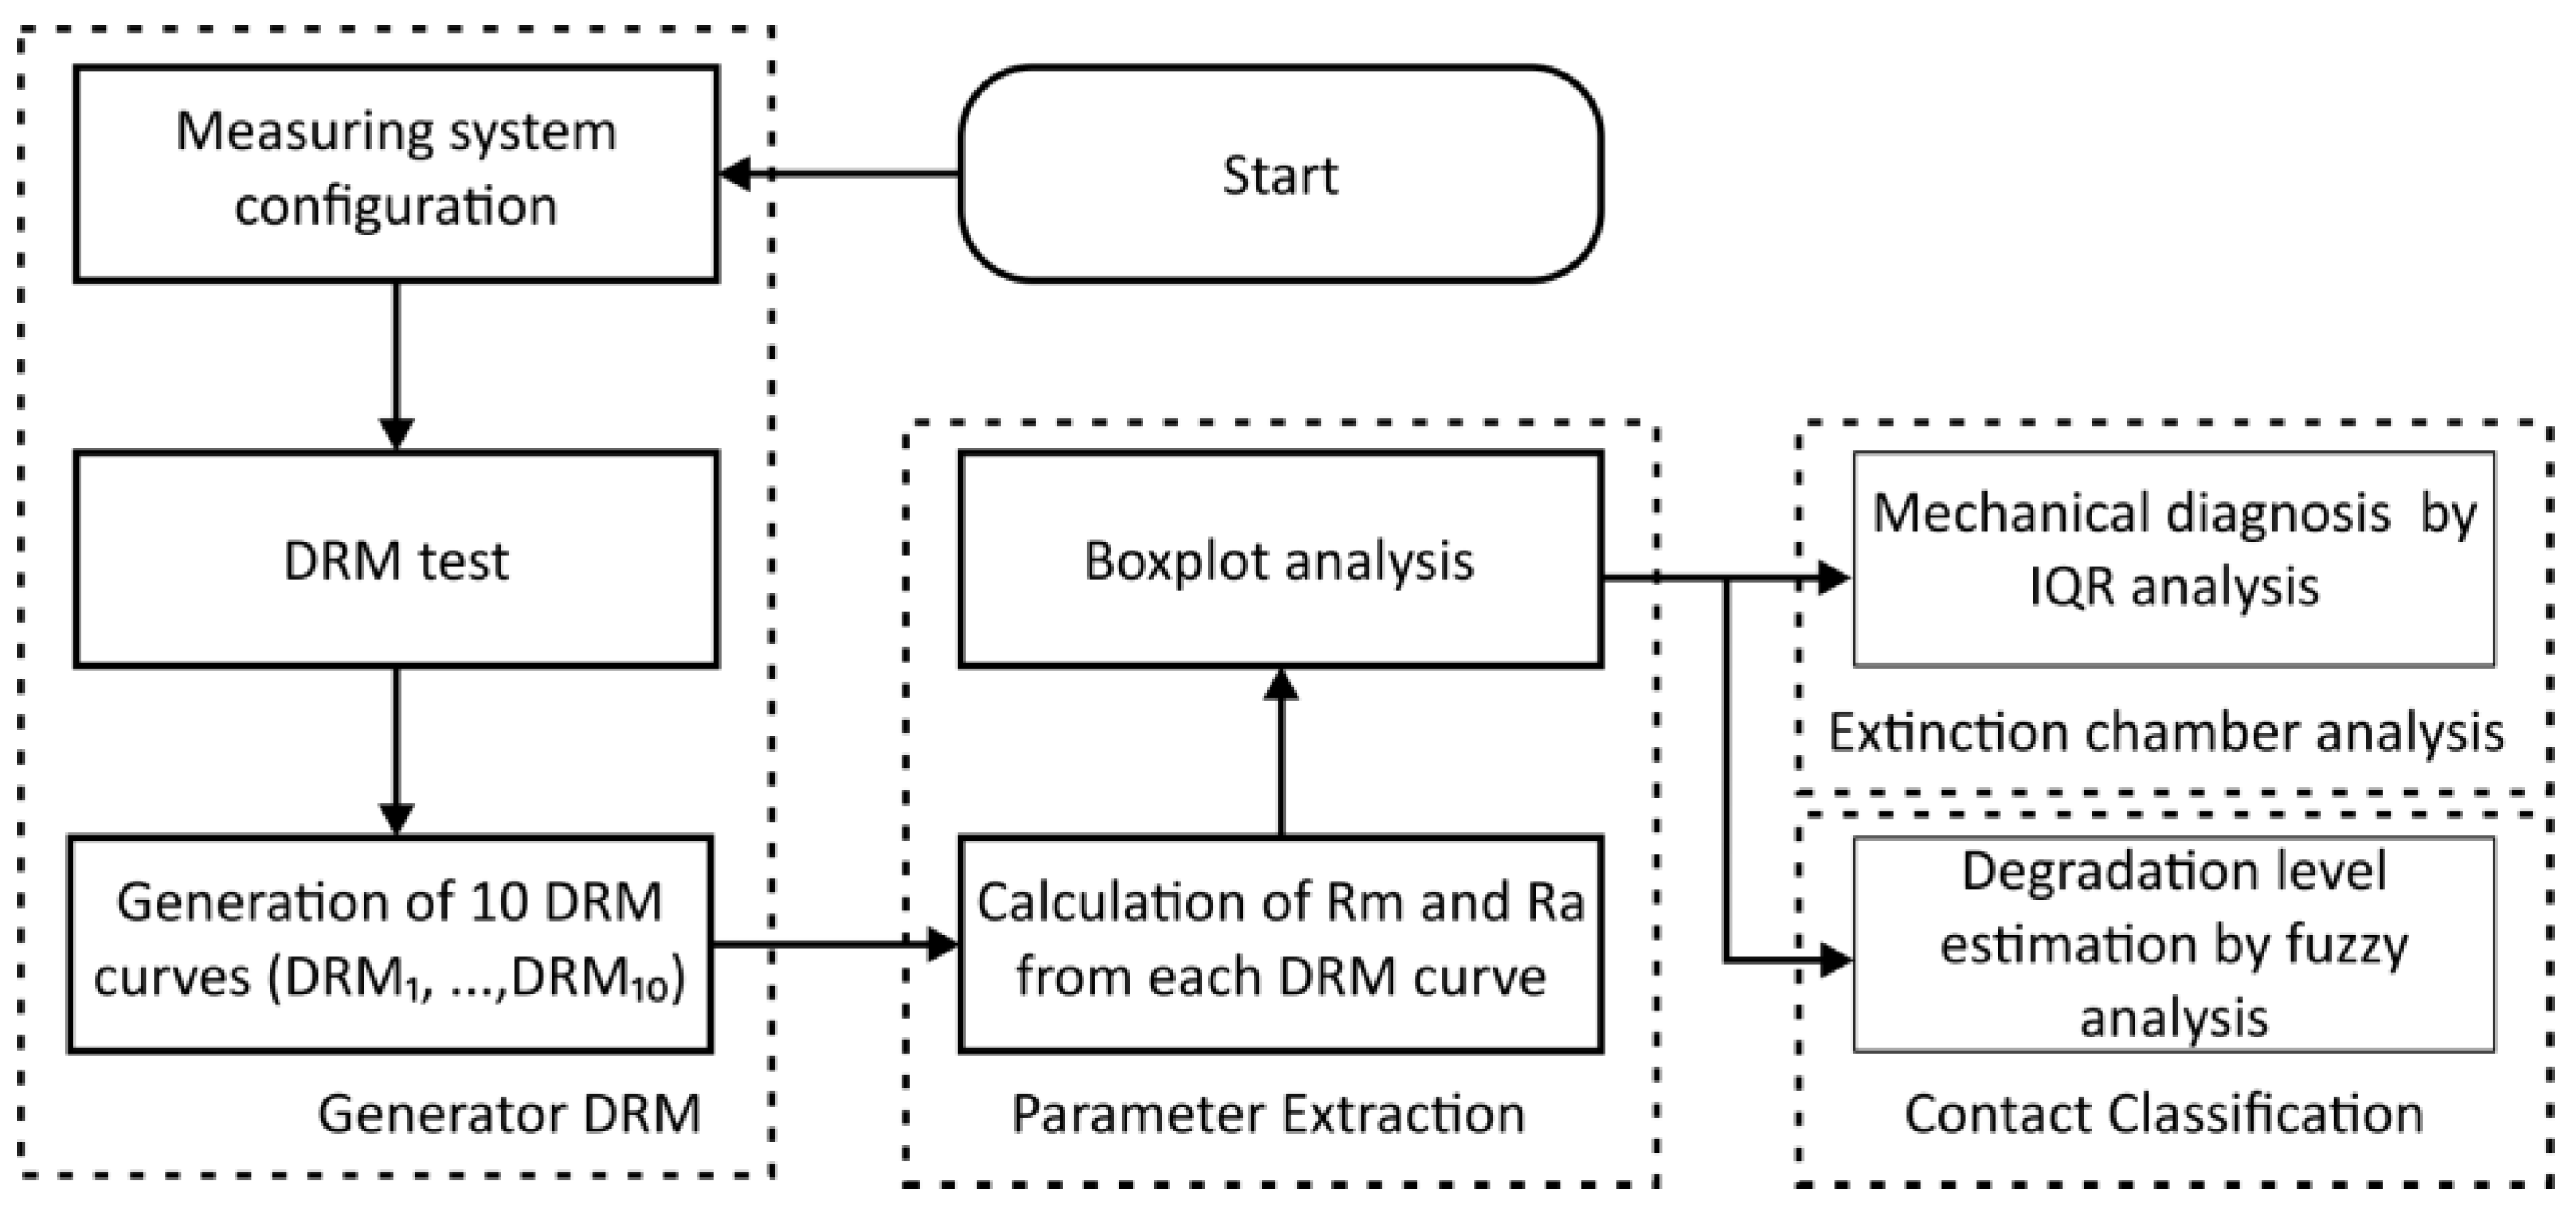
2. Proposed Technique
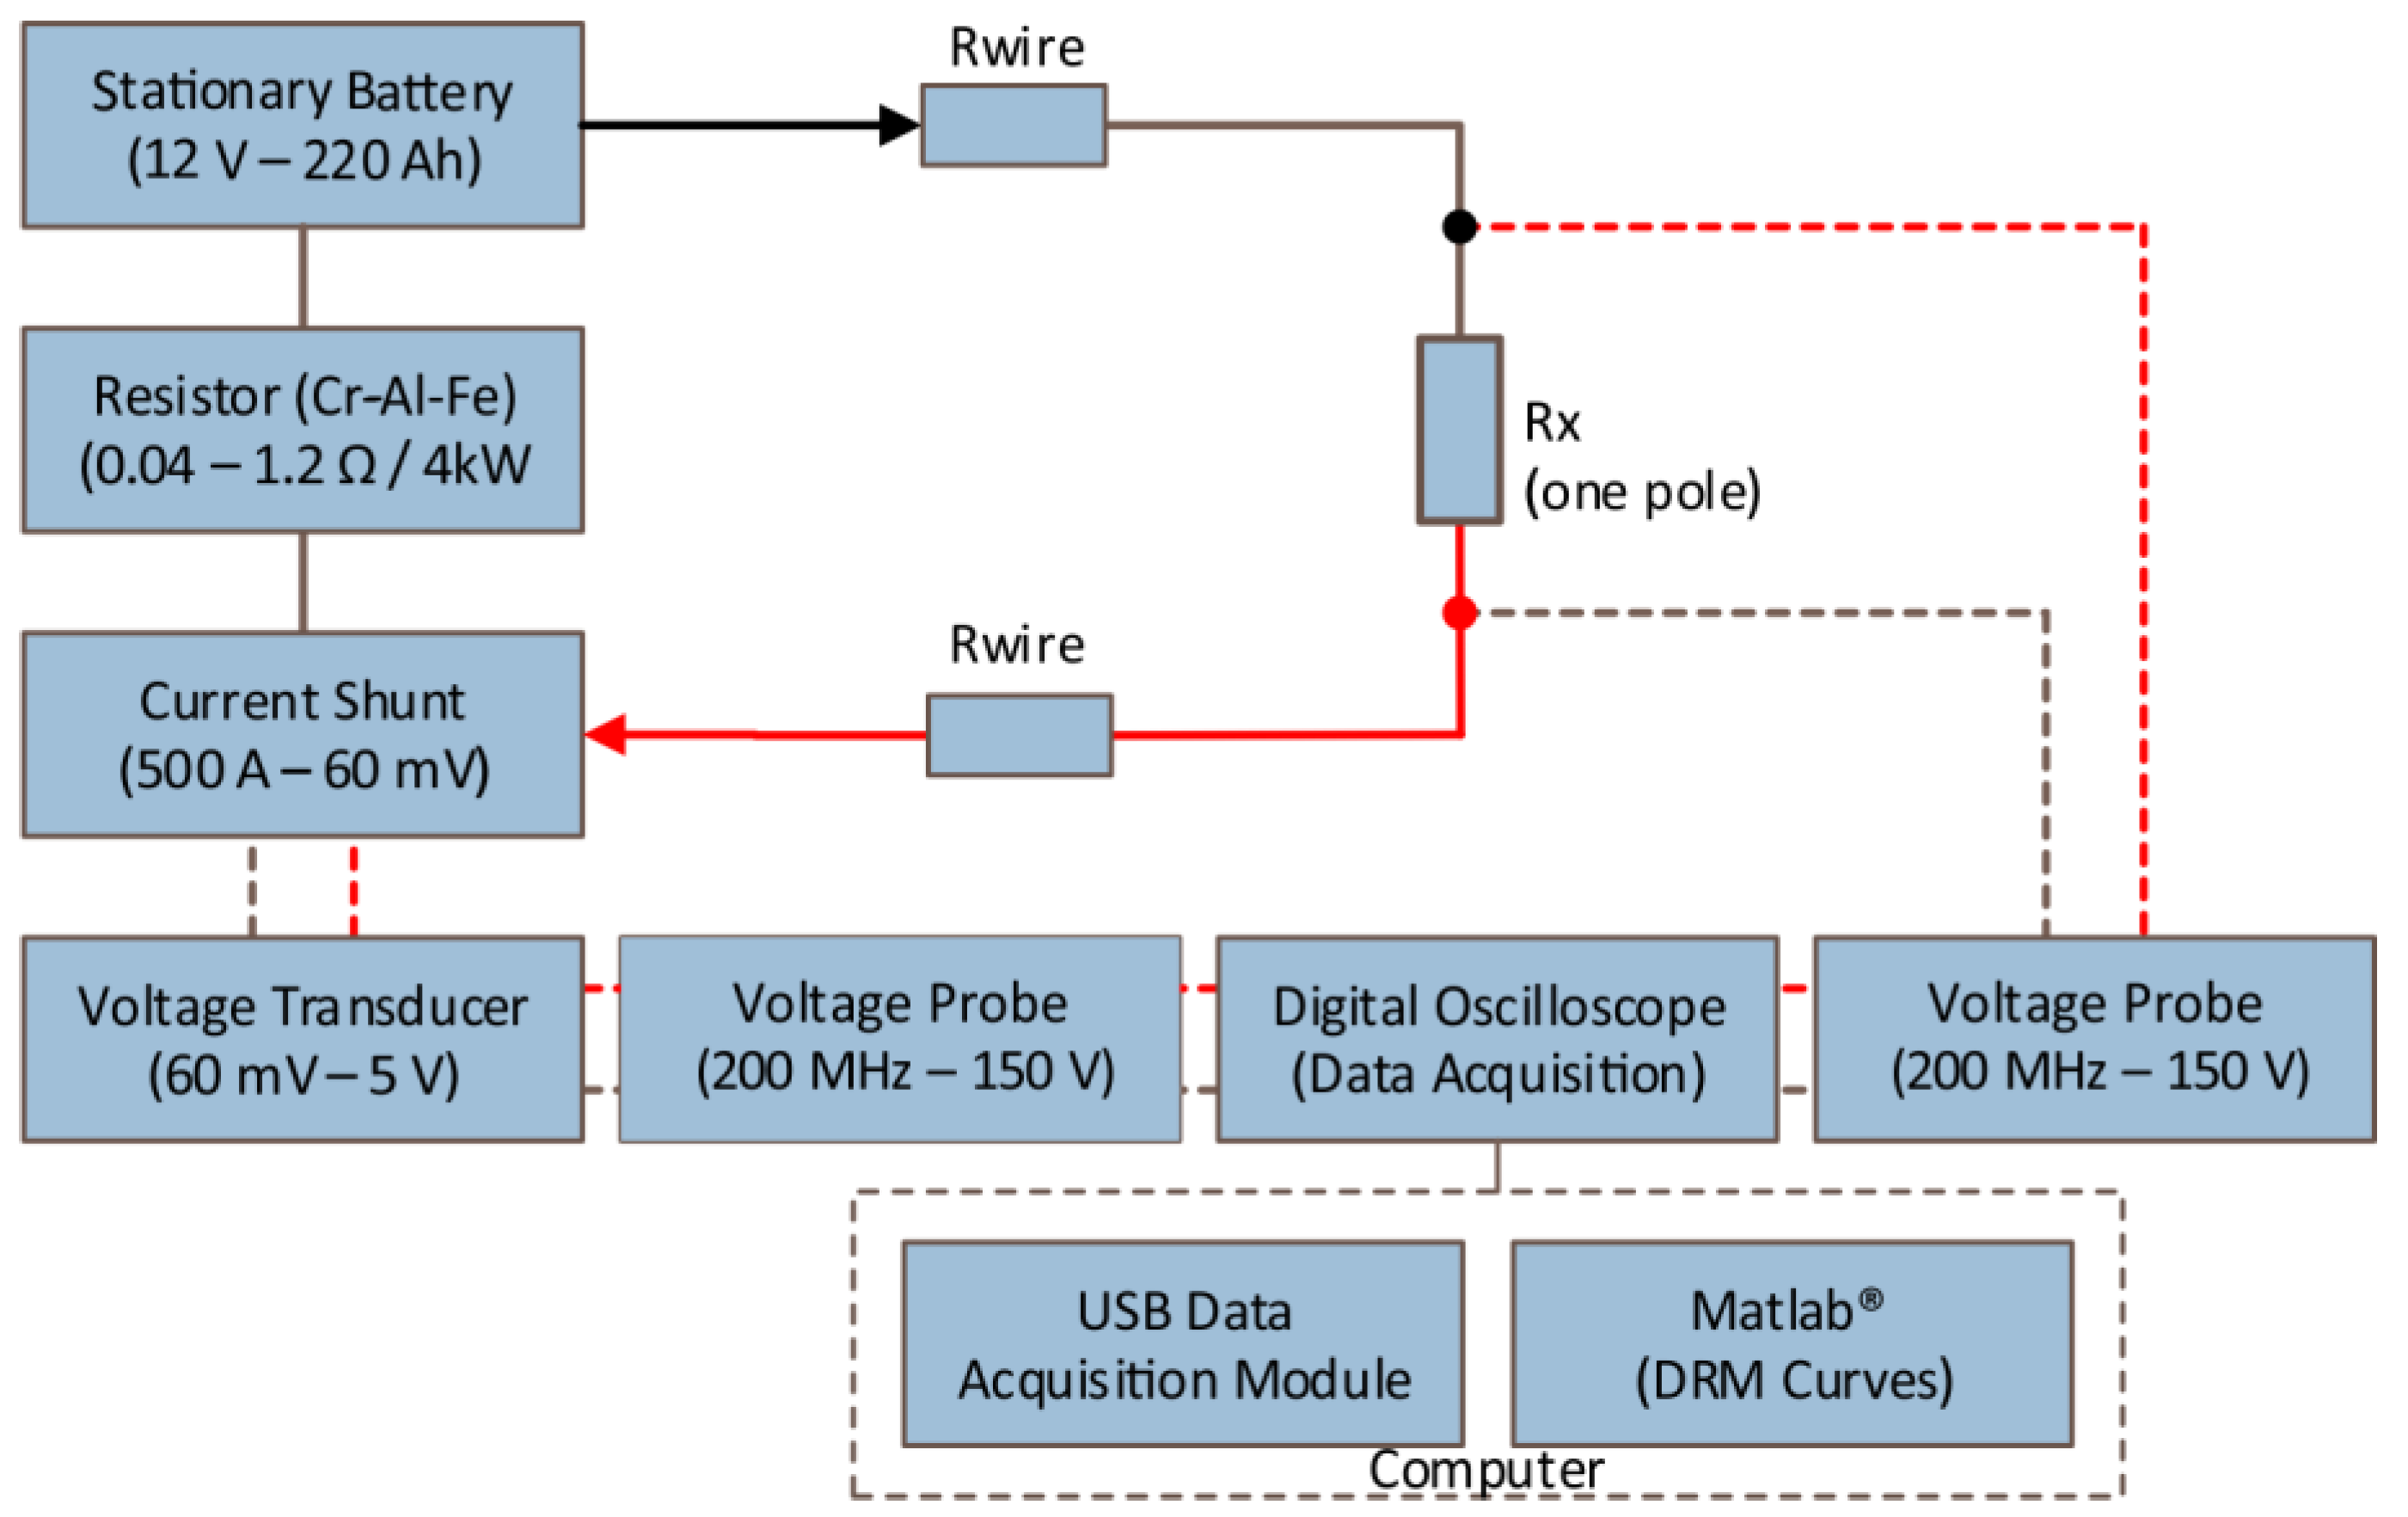
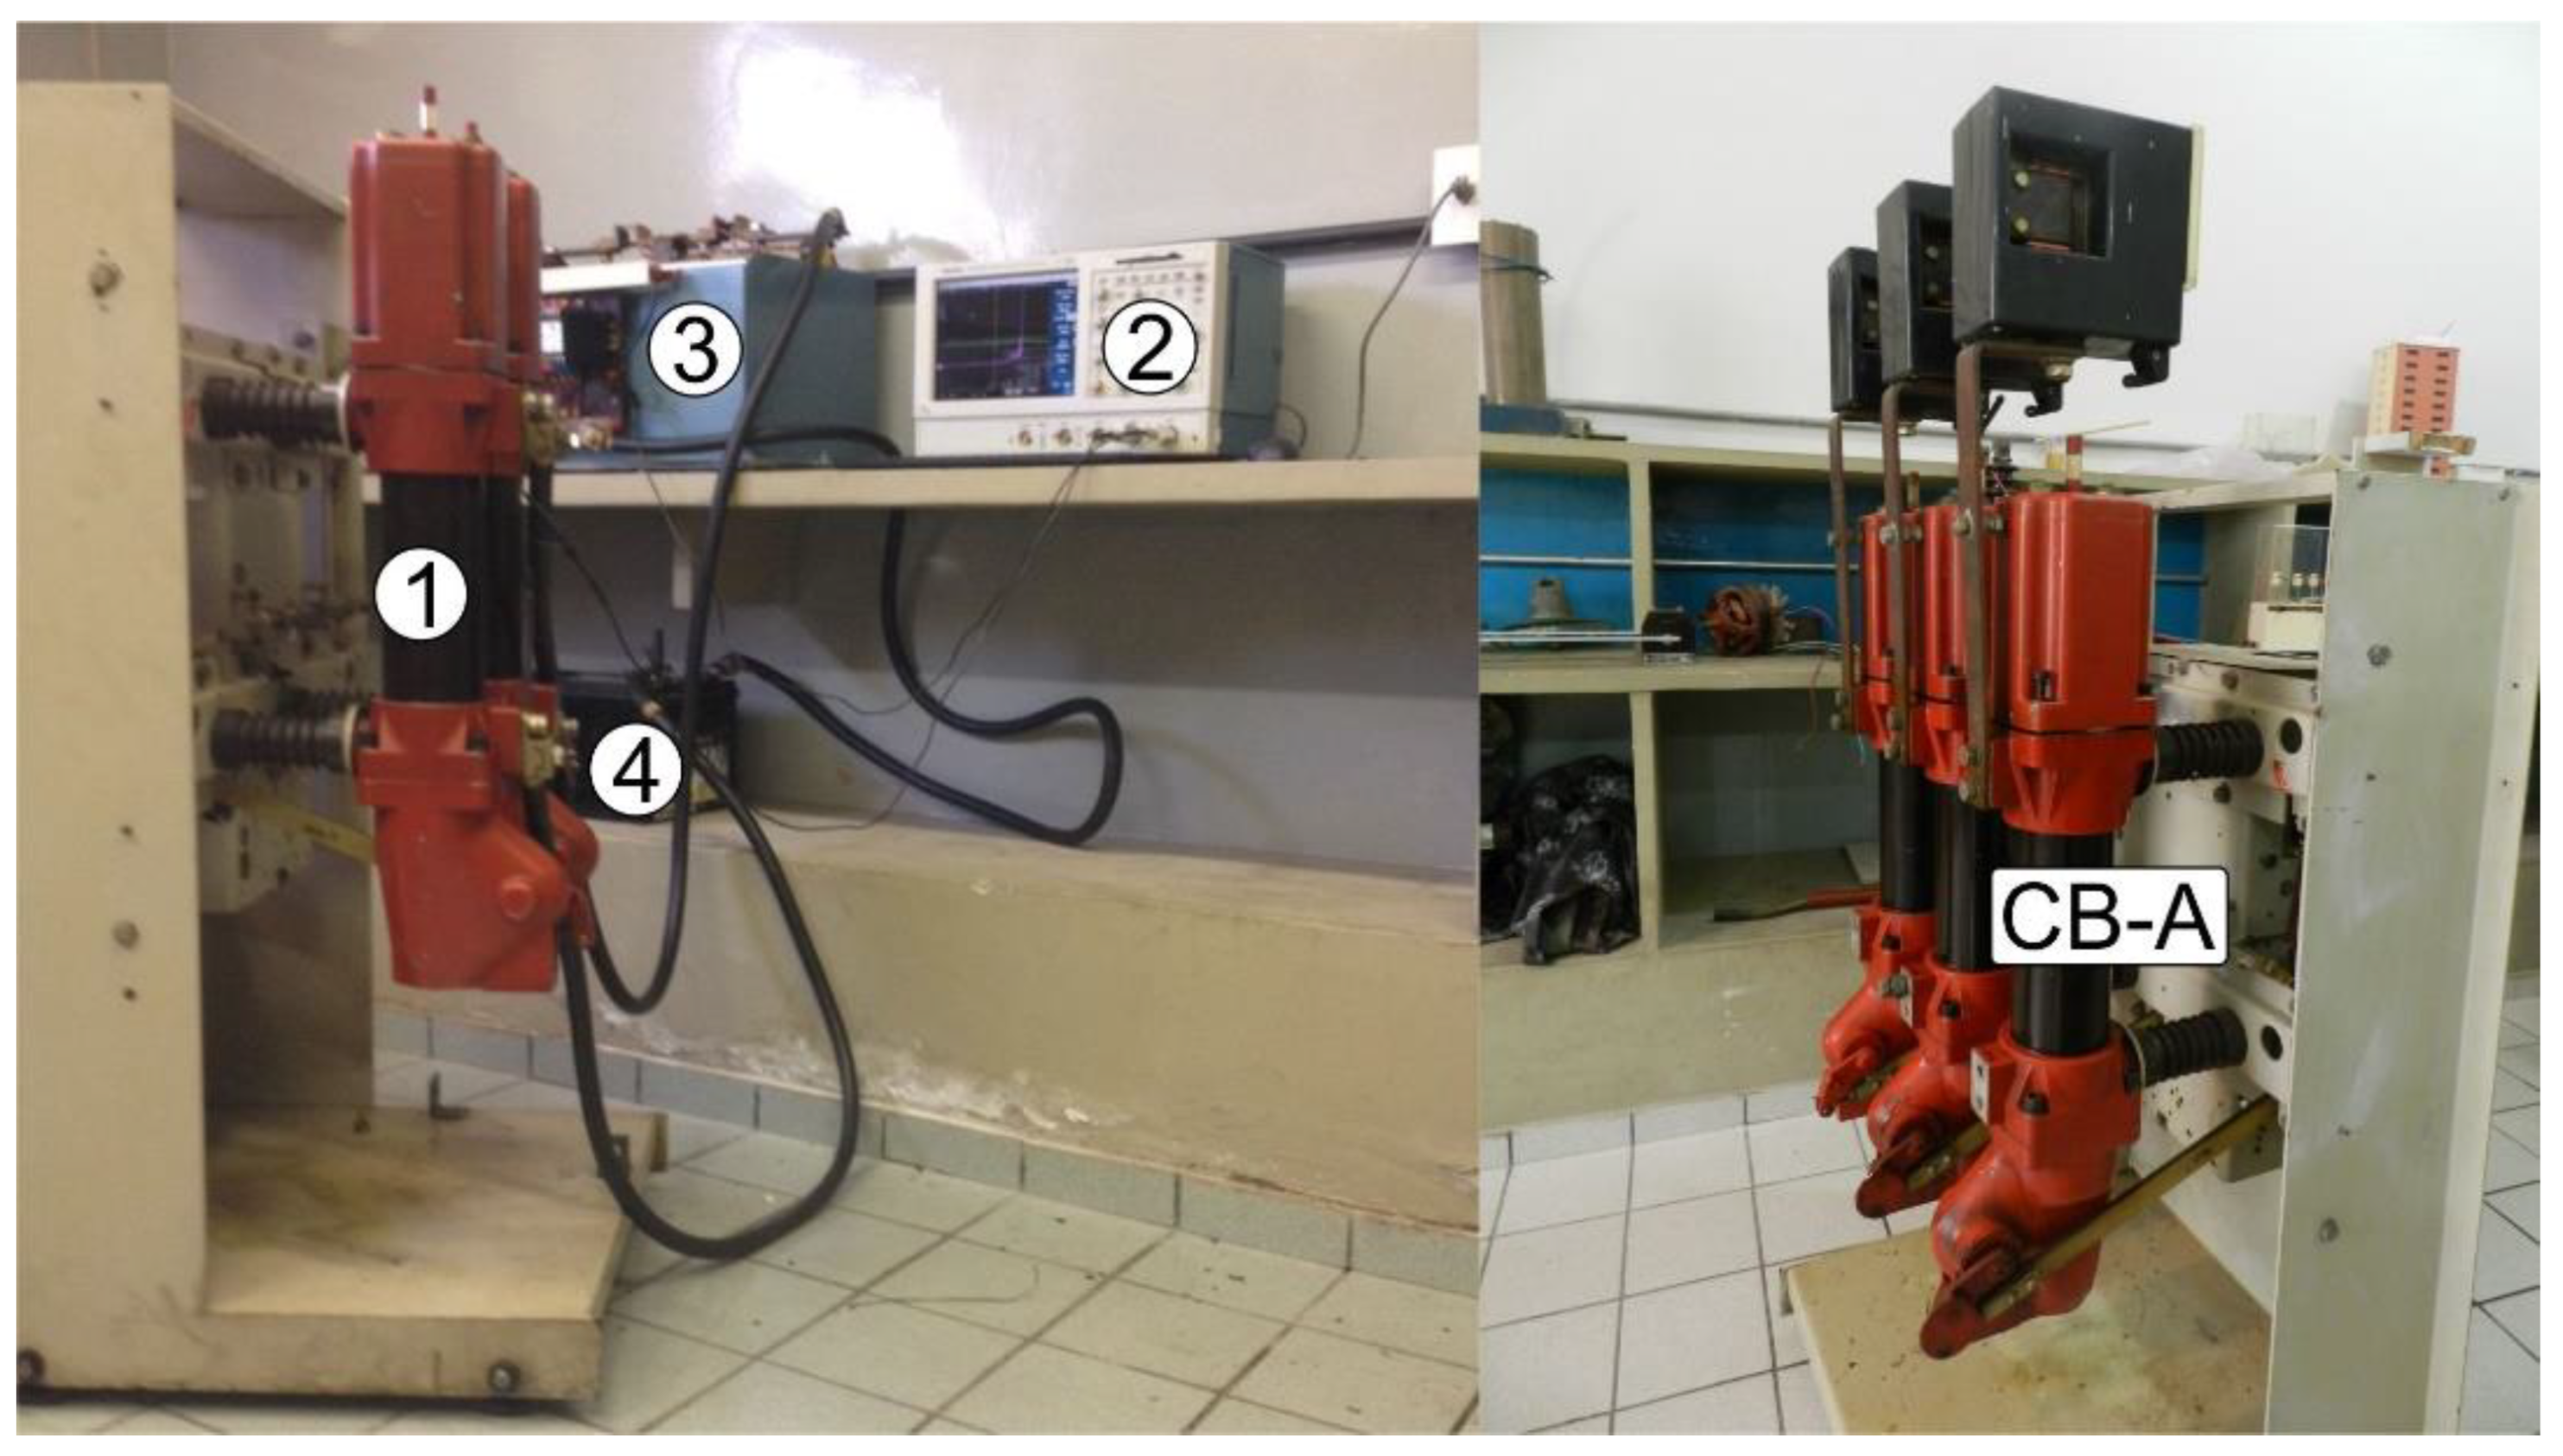
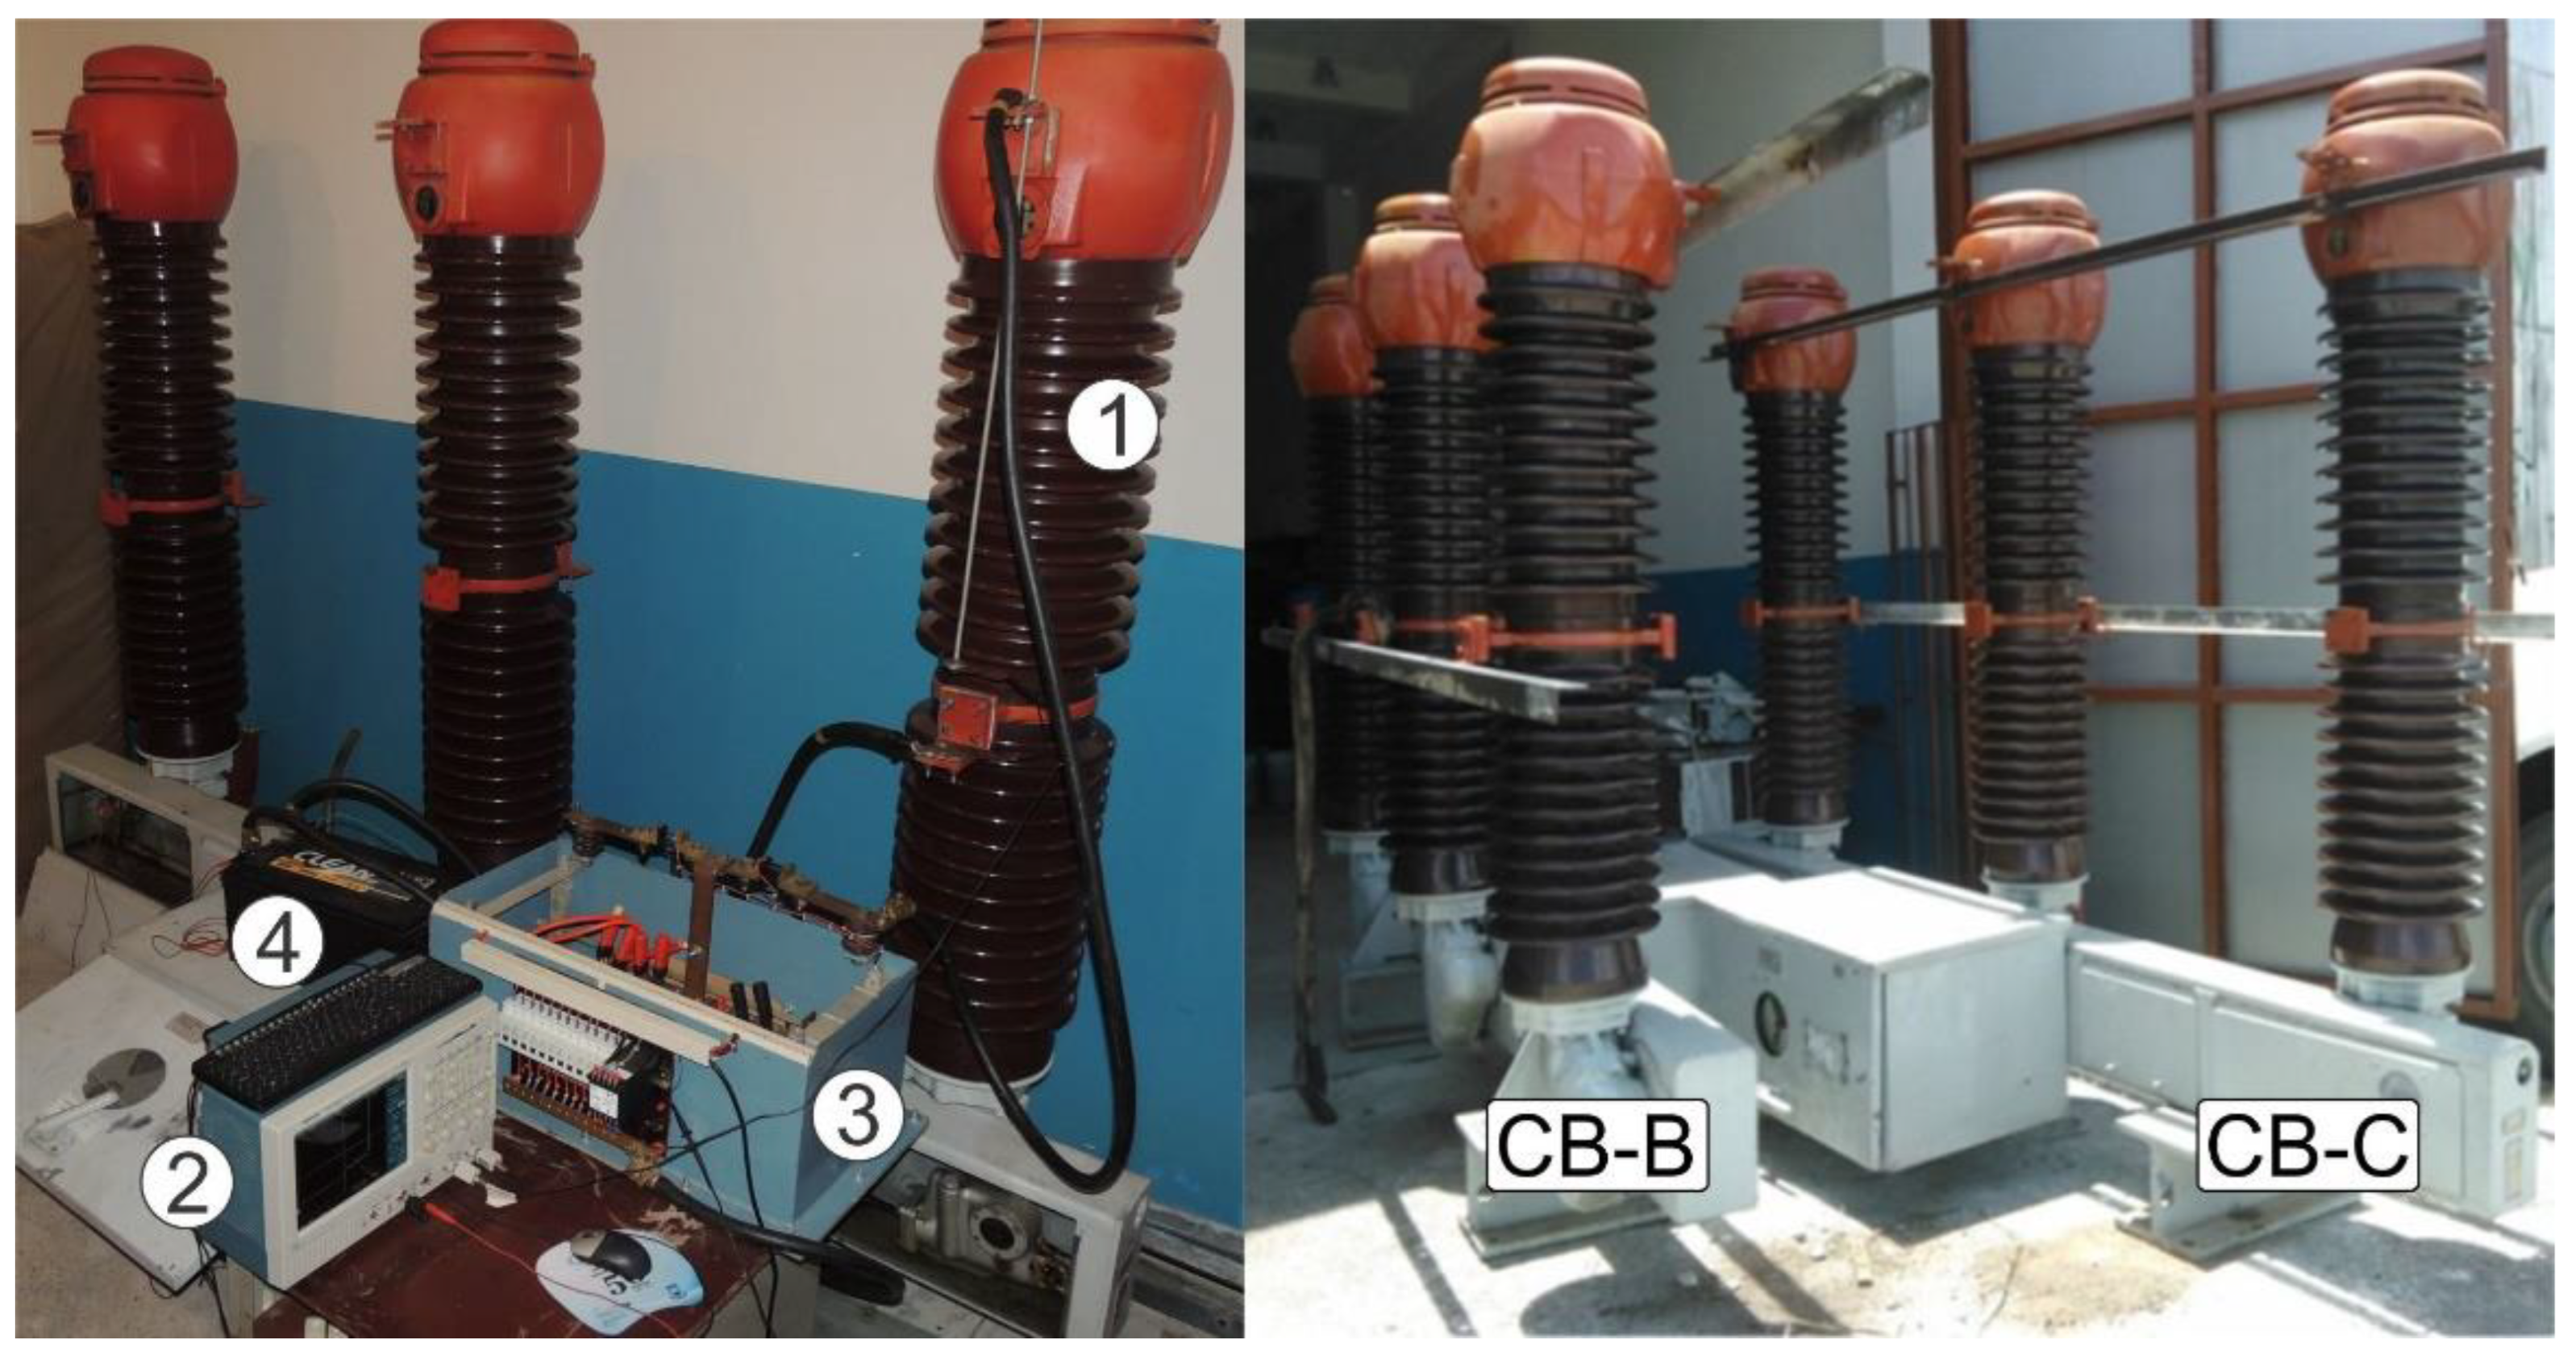
2.1. Data Acquisition
- -
- CB-A-MOCB of 800 A/15 kV/12.5 kA;
- -
- CB-B-MOCB of 2000 A/72.5 kV/31.5 kA;
- -
- CB-C-MOCB of 2000 A/72.5 kV/31.5 kA.
- -
- Direct current injection of up to 300 A (voltage source: 12 V stationary battery);
- -
- Adjustment of the battery current through Cr-Al-Fe resistor (40 mΩ–1.3 Ω/4 kW);
- -
- Measurement of the current with current shunt (500 A/60 mV) and voltage/voltage transducer (60 mV/5 V) and voltage probe;
- -
- Acquisition of the information captured in the DRM (current and voltage drop across the contacts) using voltage probes and digital oscilloscope.
- -
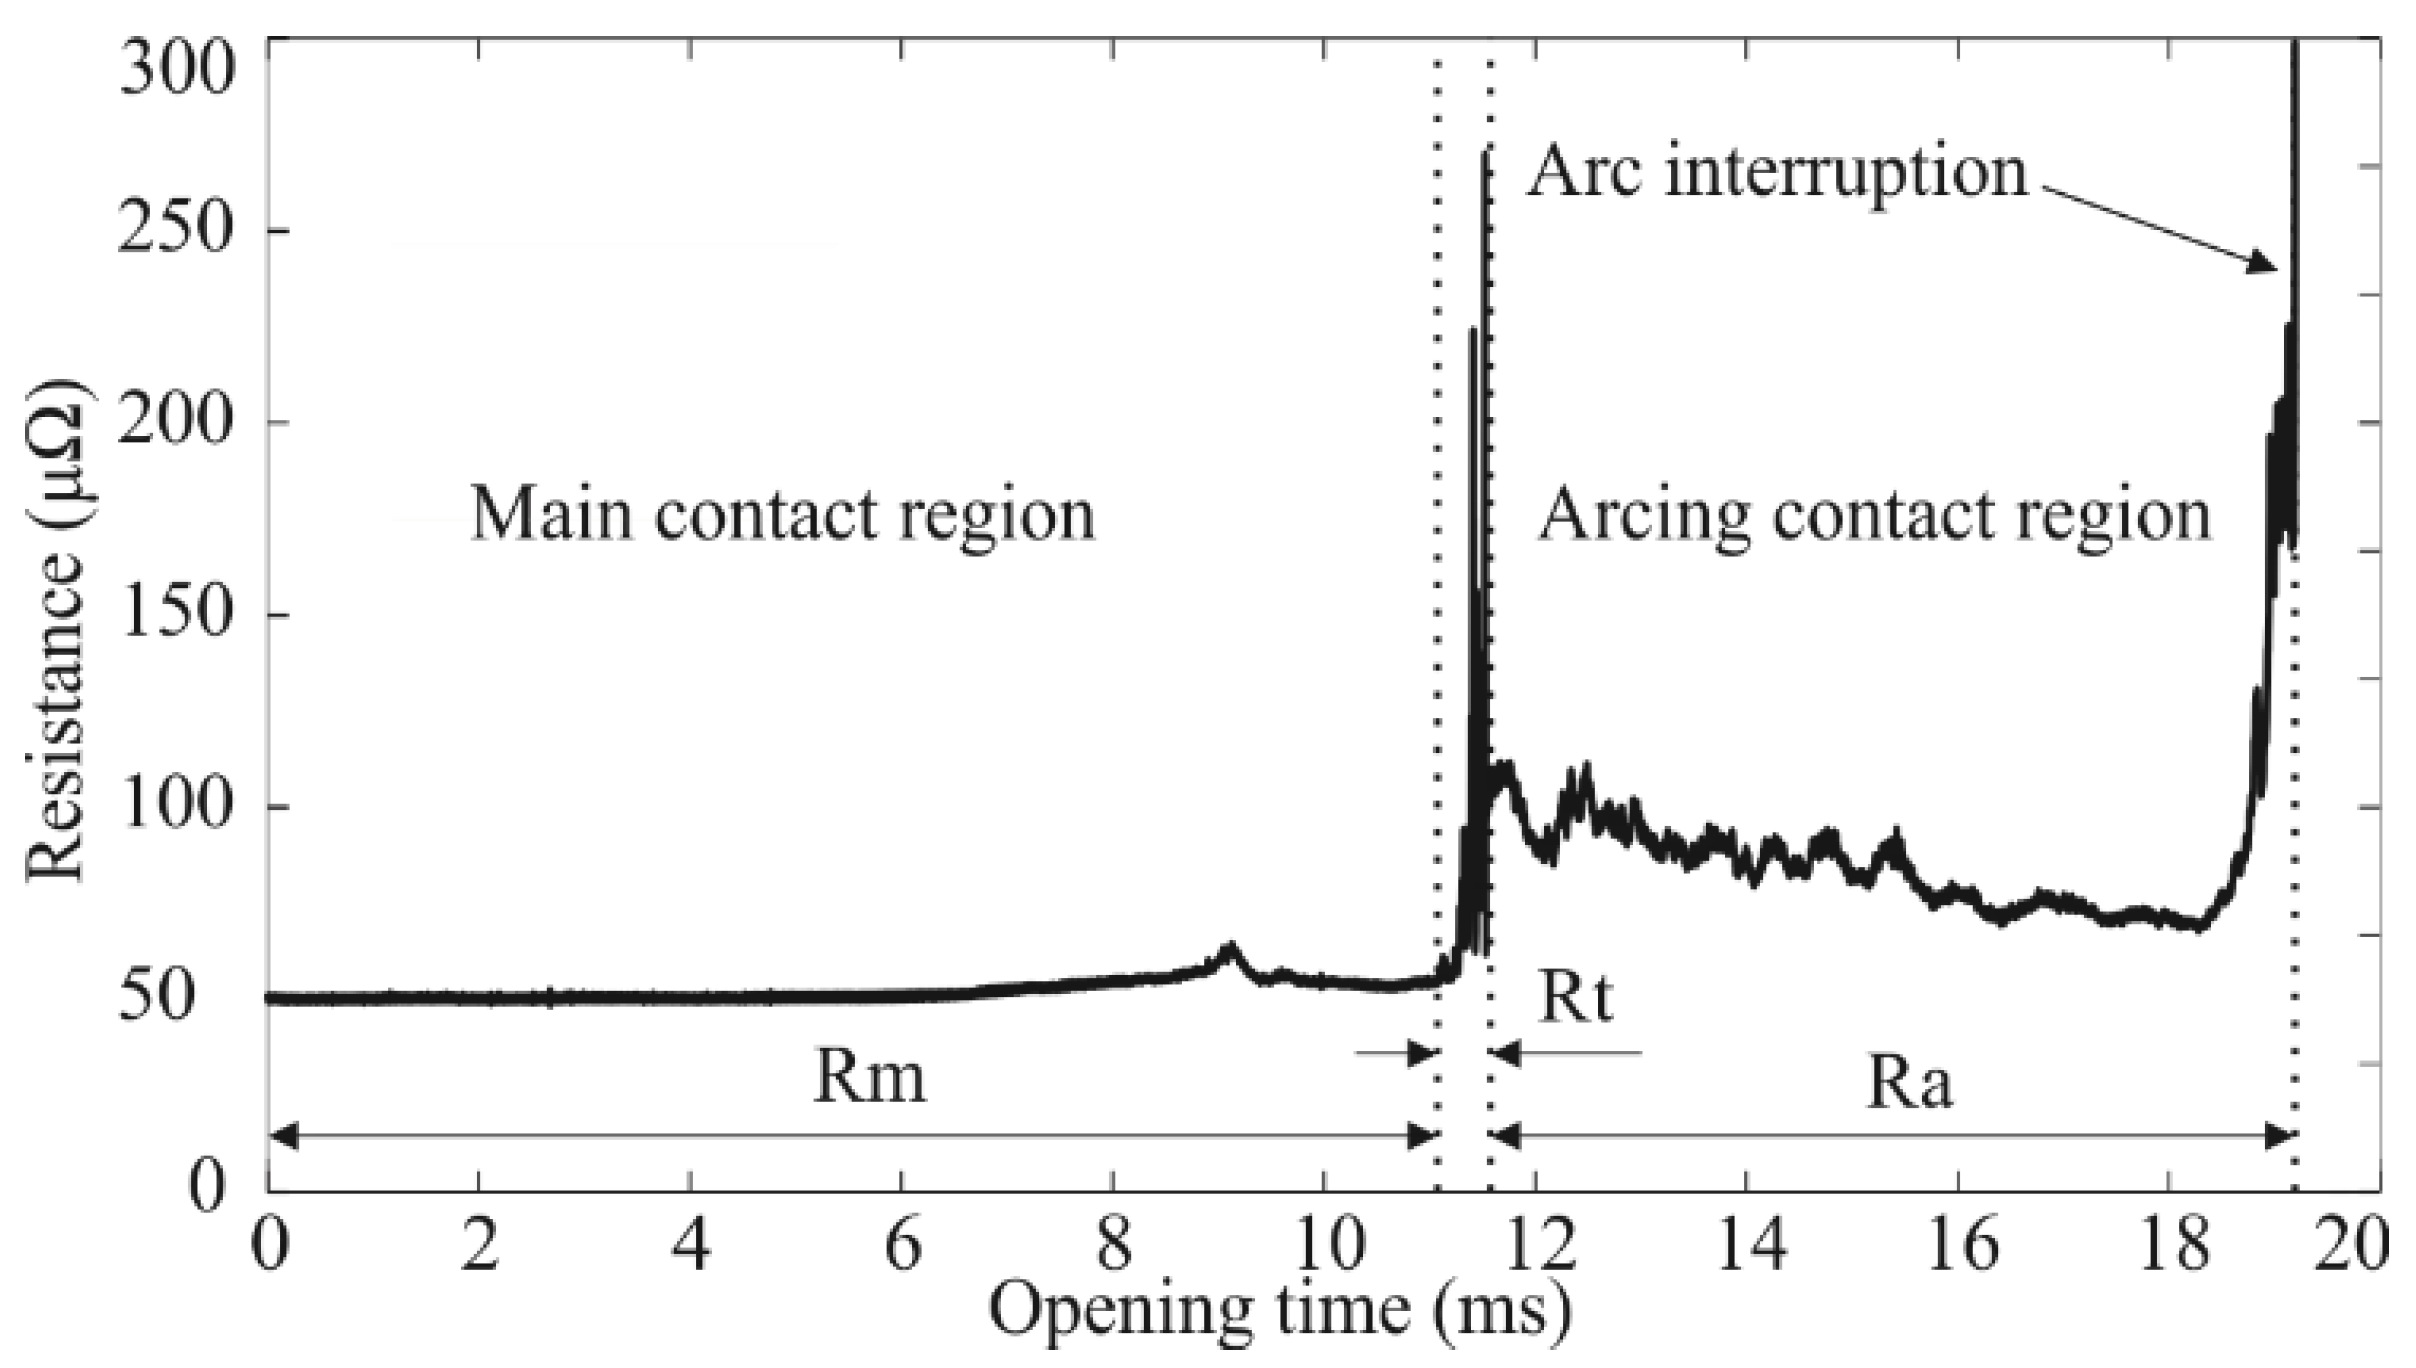
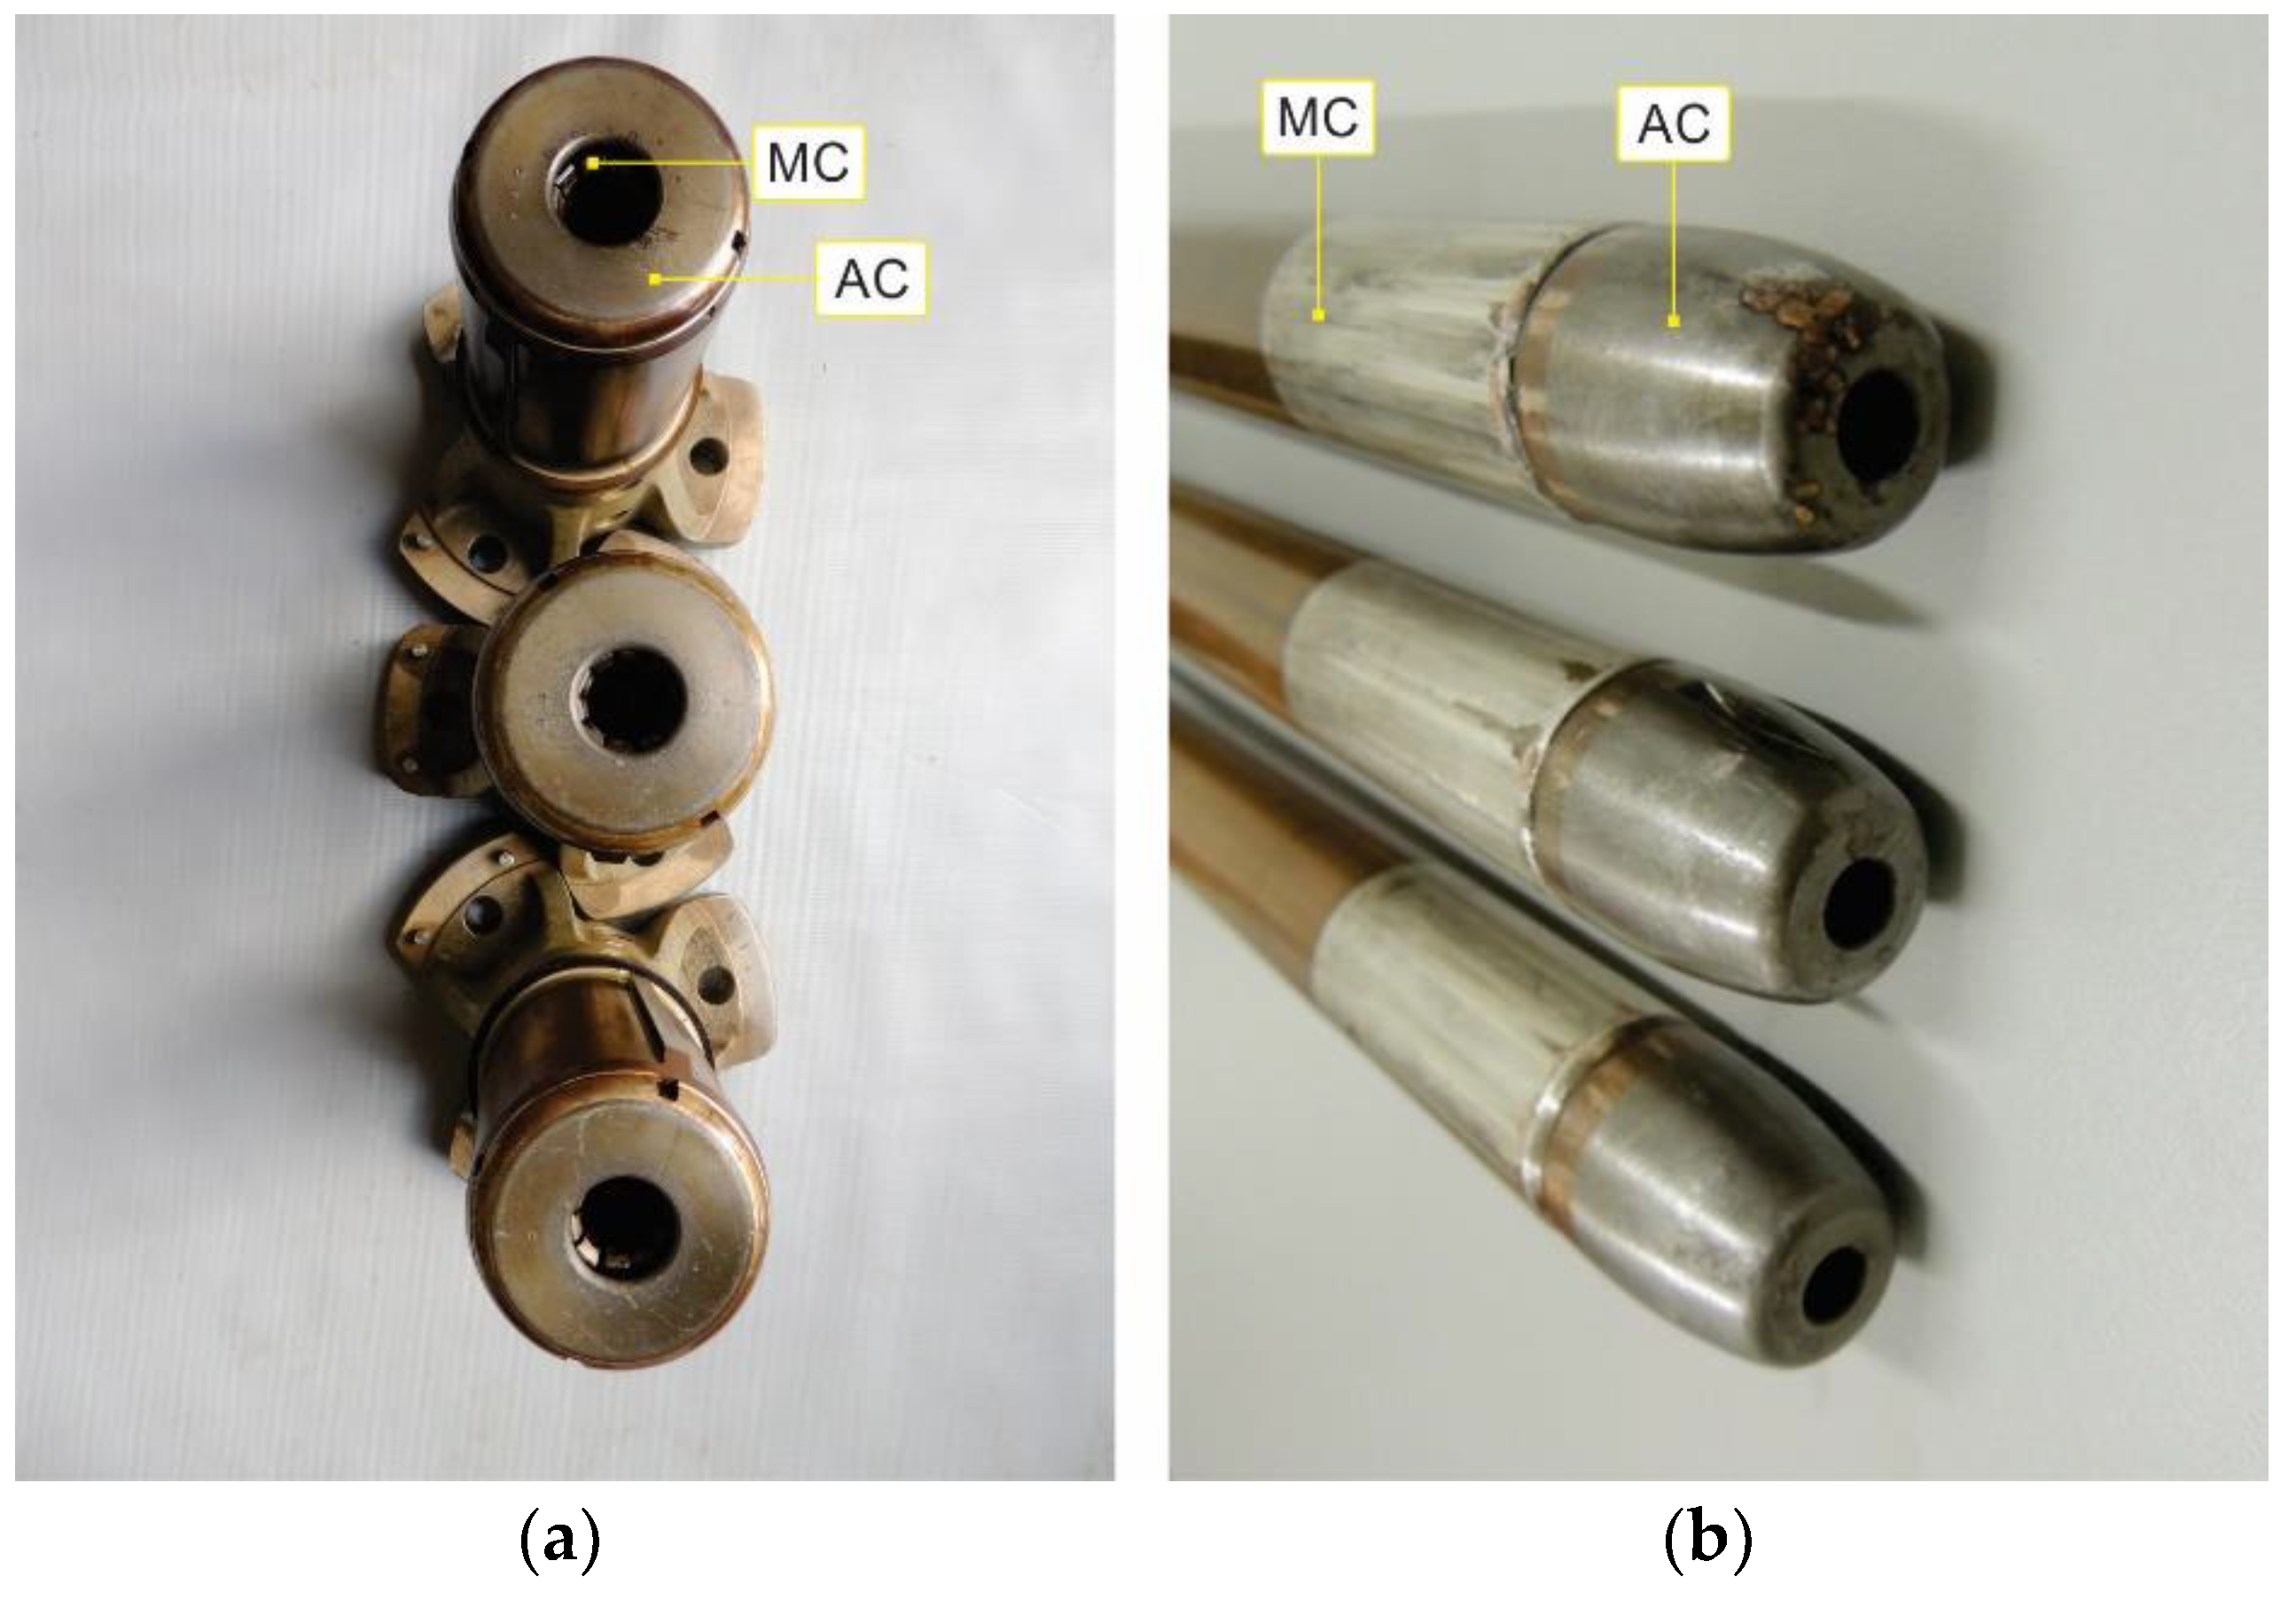
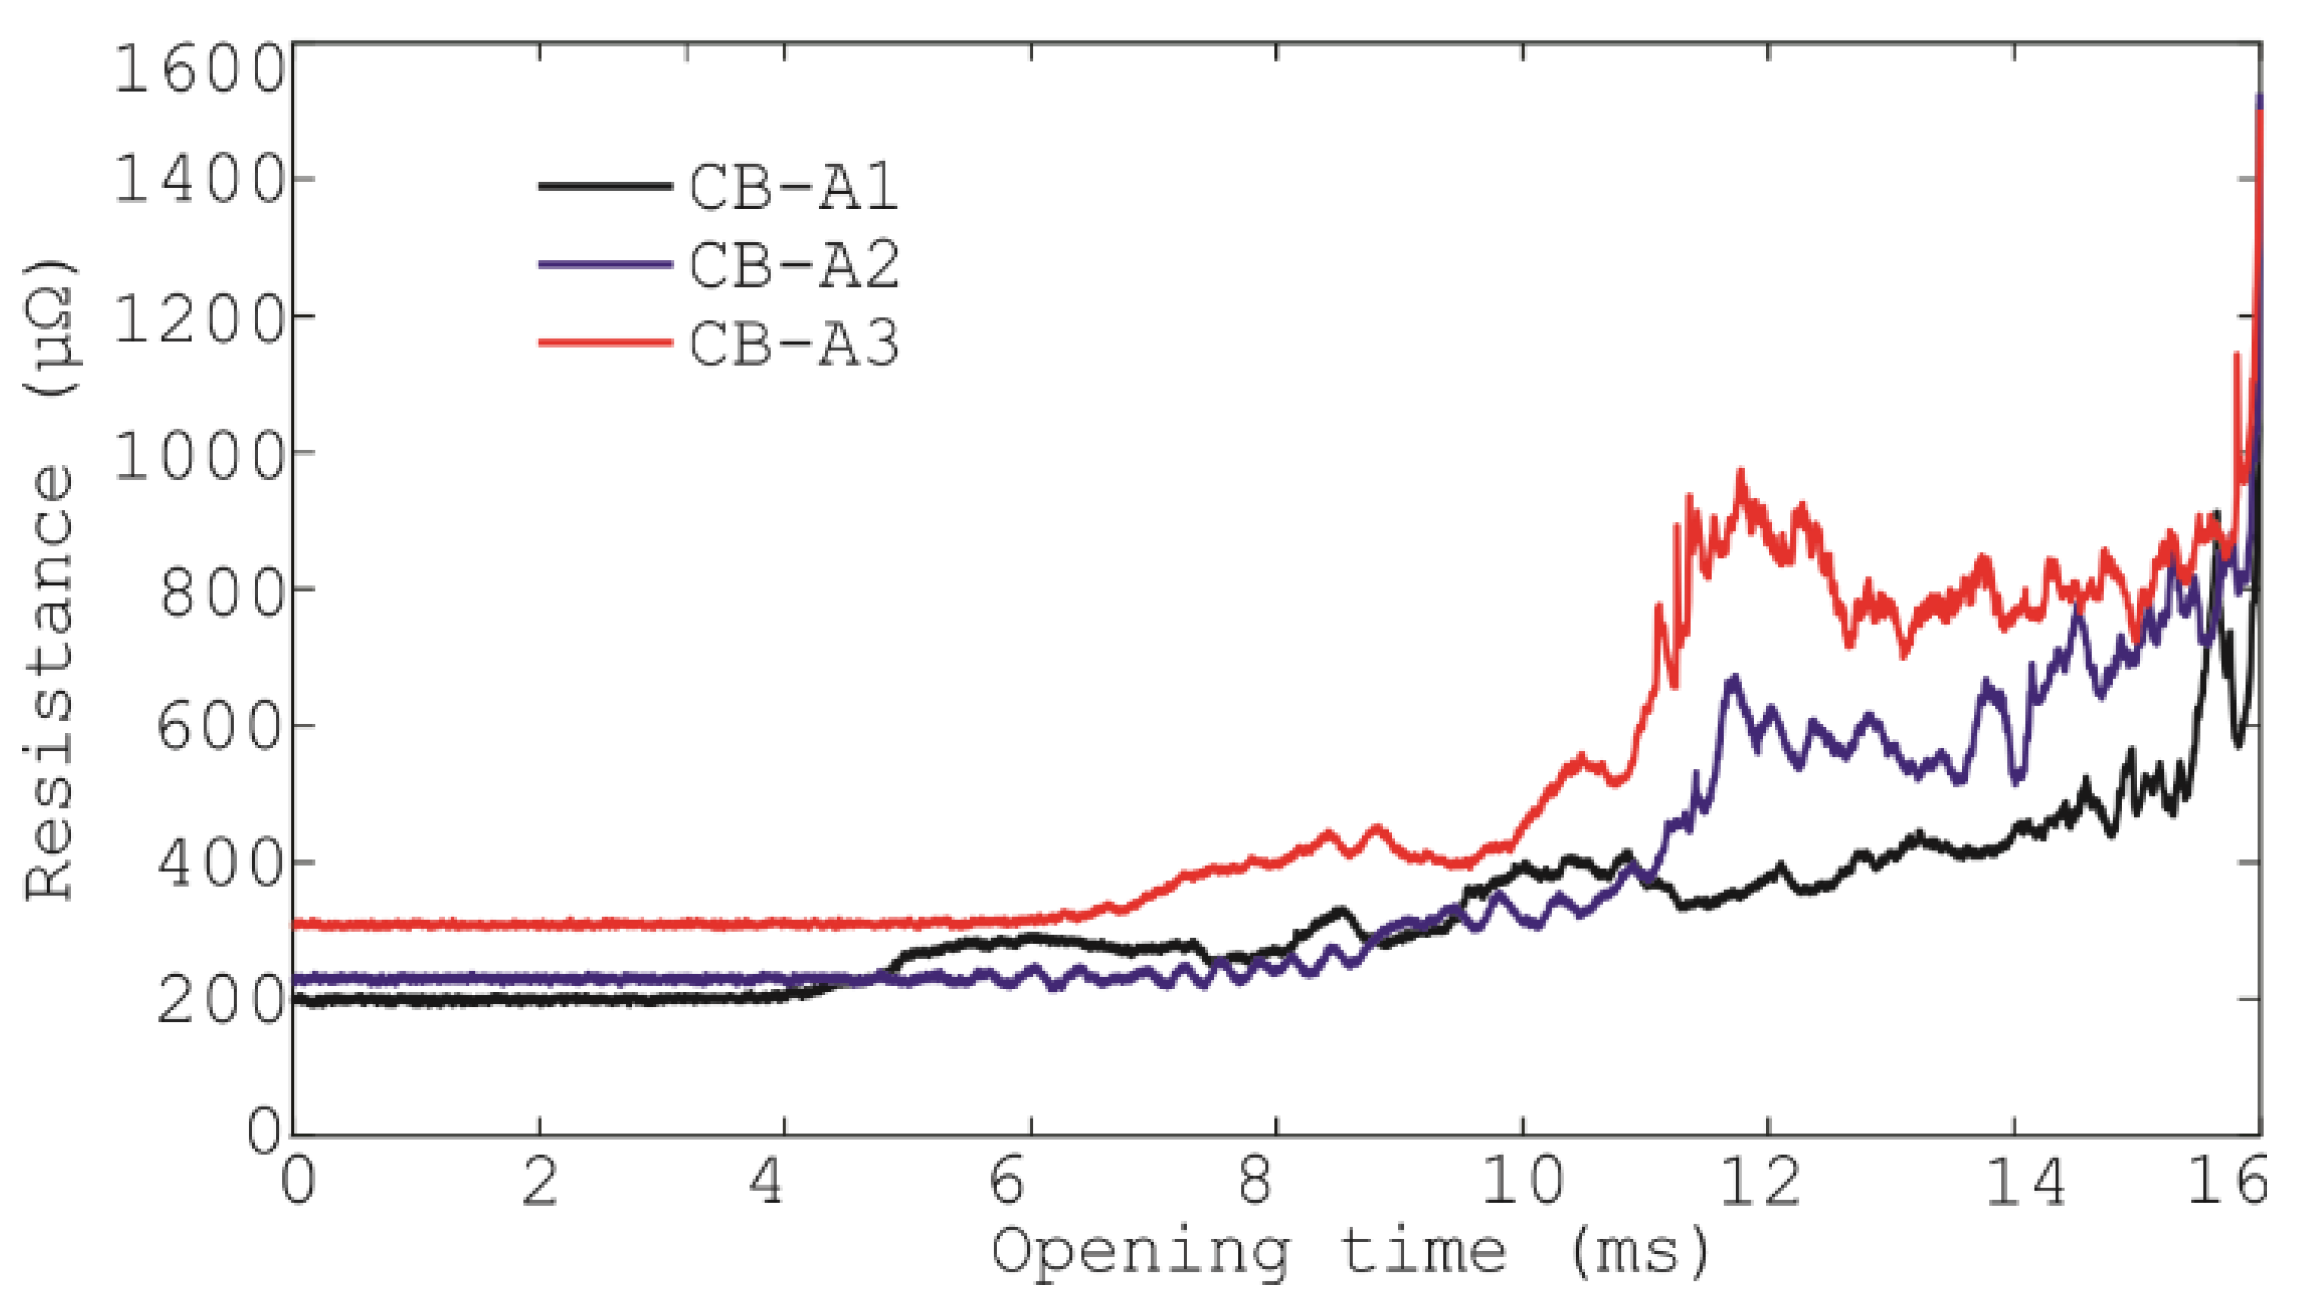
- Calculation of the mean resistance on the main contact region (Rm) considering the first 1000 samples;
- -
- Identification of the main contact separation instant by locating a resistance increase of 5% from the calculated Rm value;
- -
- Identification of the arcing contact separation instant by locating a resistance increase of 500% from the calculated Rm value;
- -
- Classification of the initial 10% of the arcing contact region as a transition zone, in which mechanical imperfections may cause measurement errors;
- -
- Calculation of the mean resistance on the arcing contact region (Ra), disregarding the transition zone.
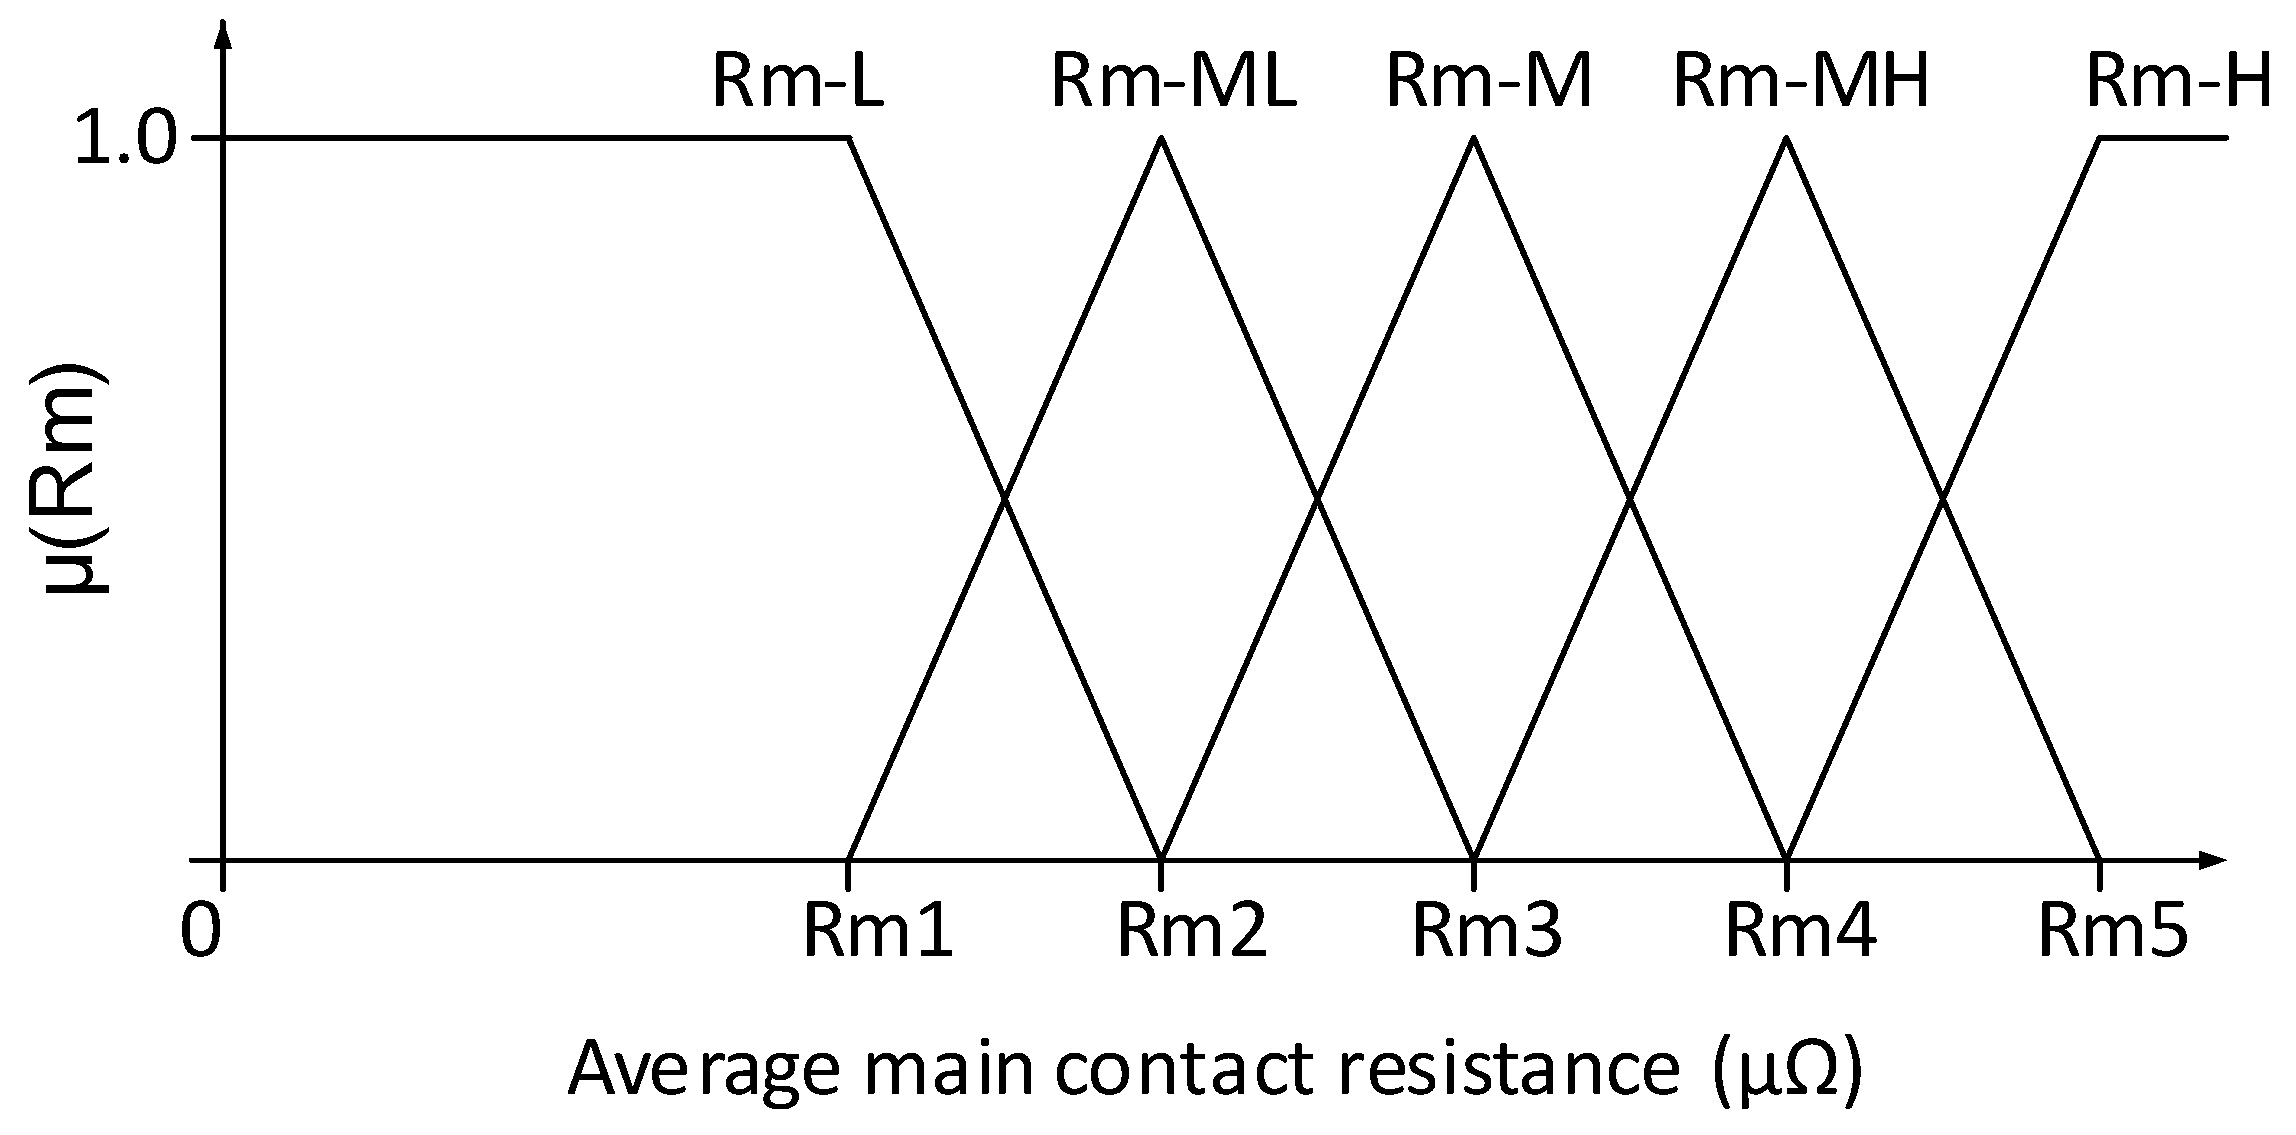
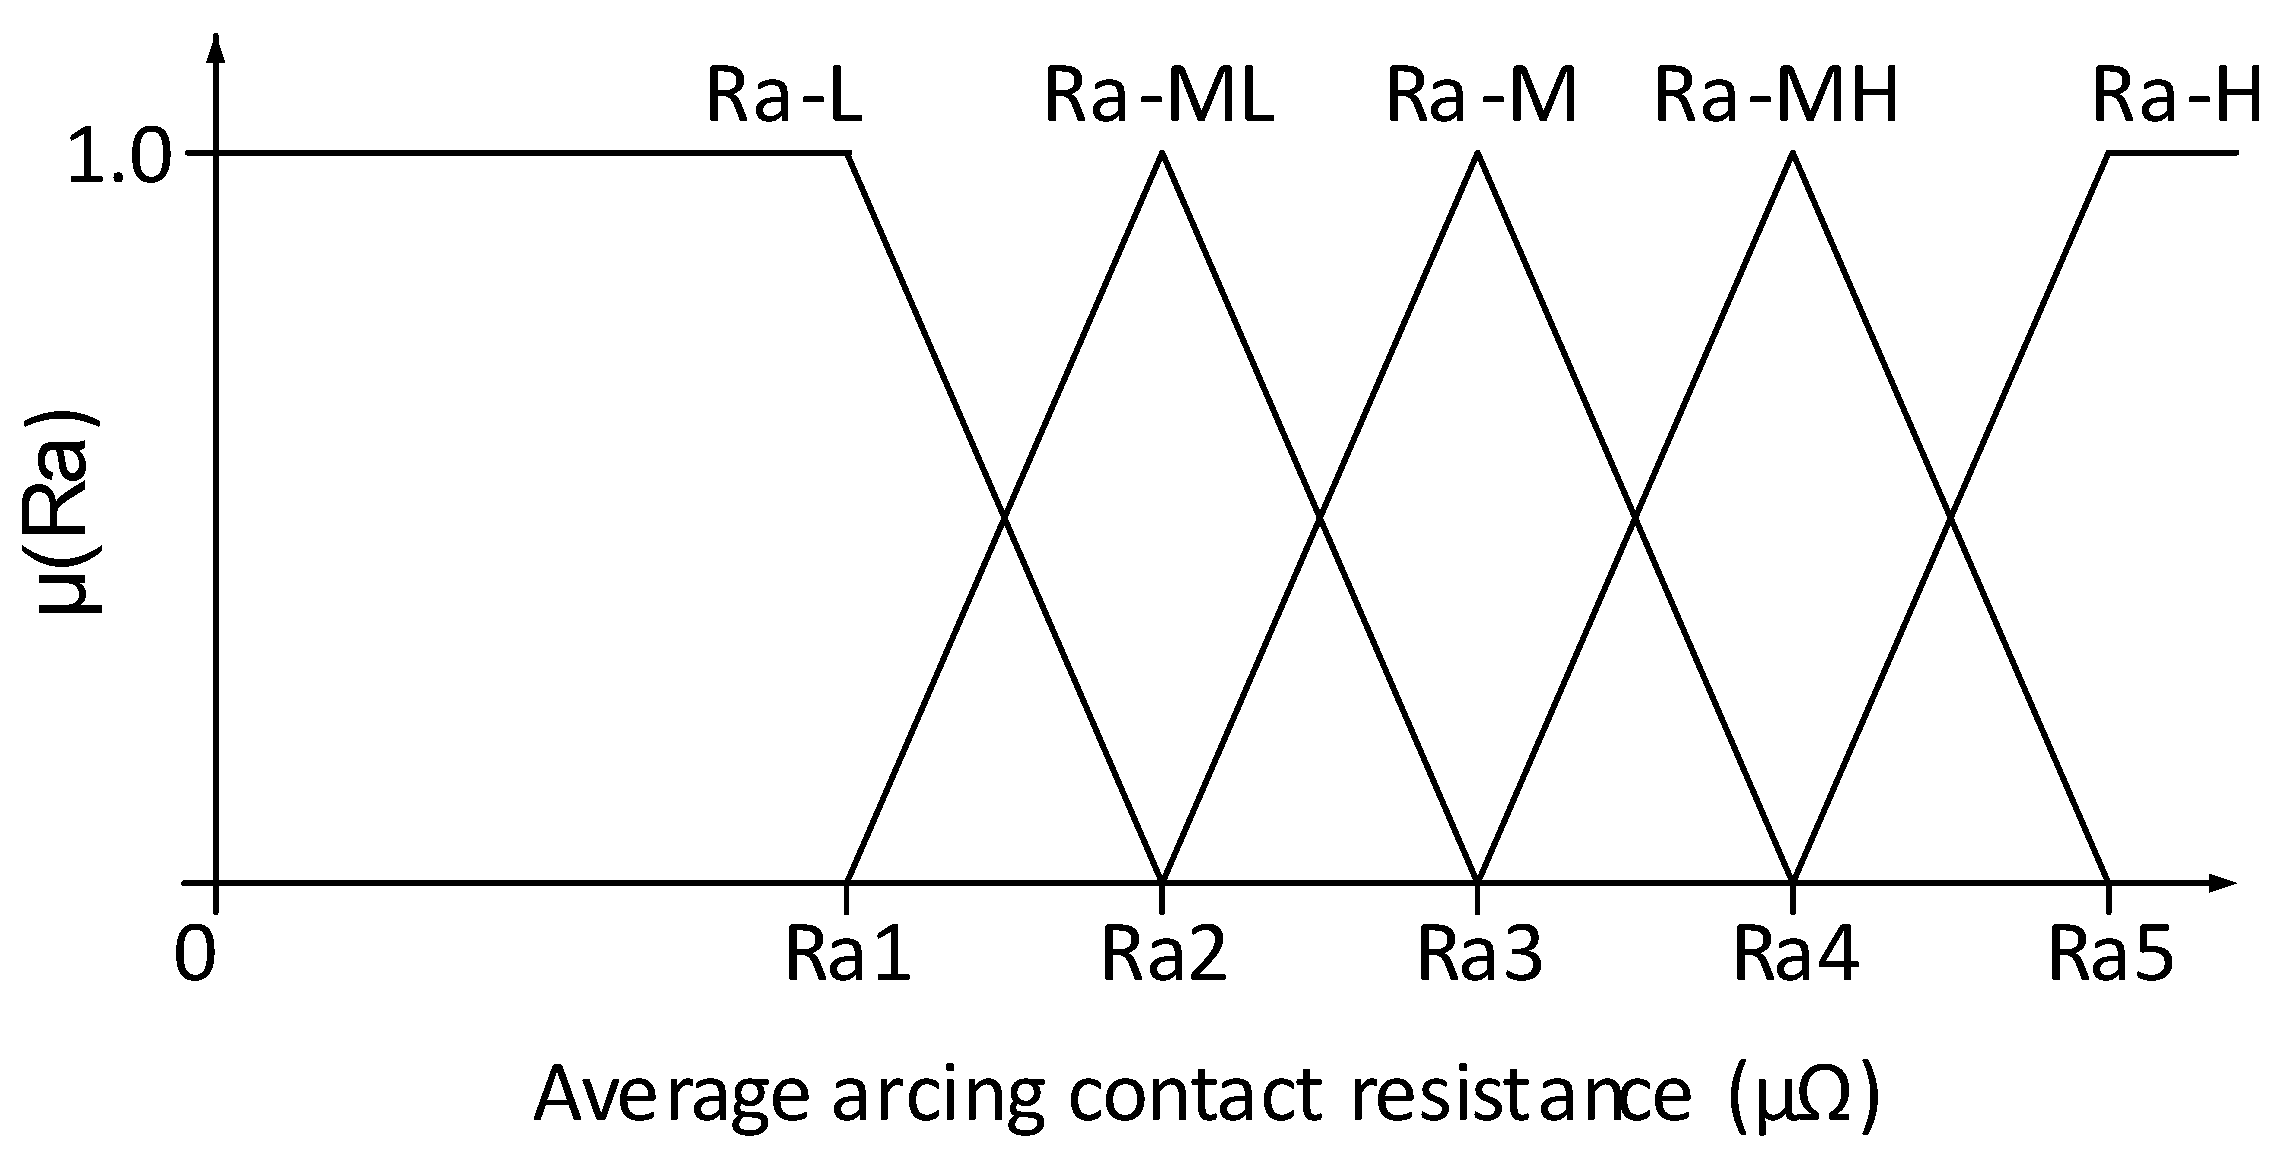
2.2. Parameter Extraction
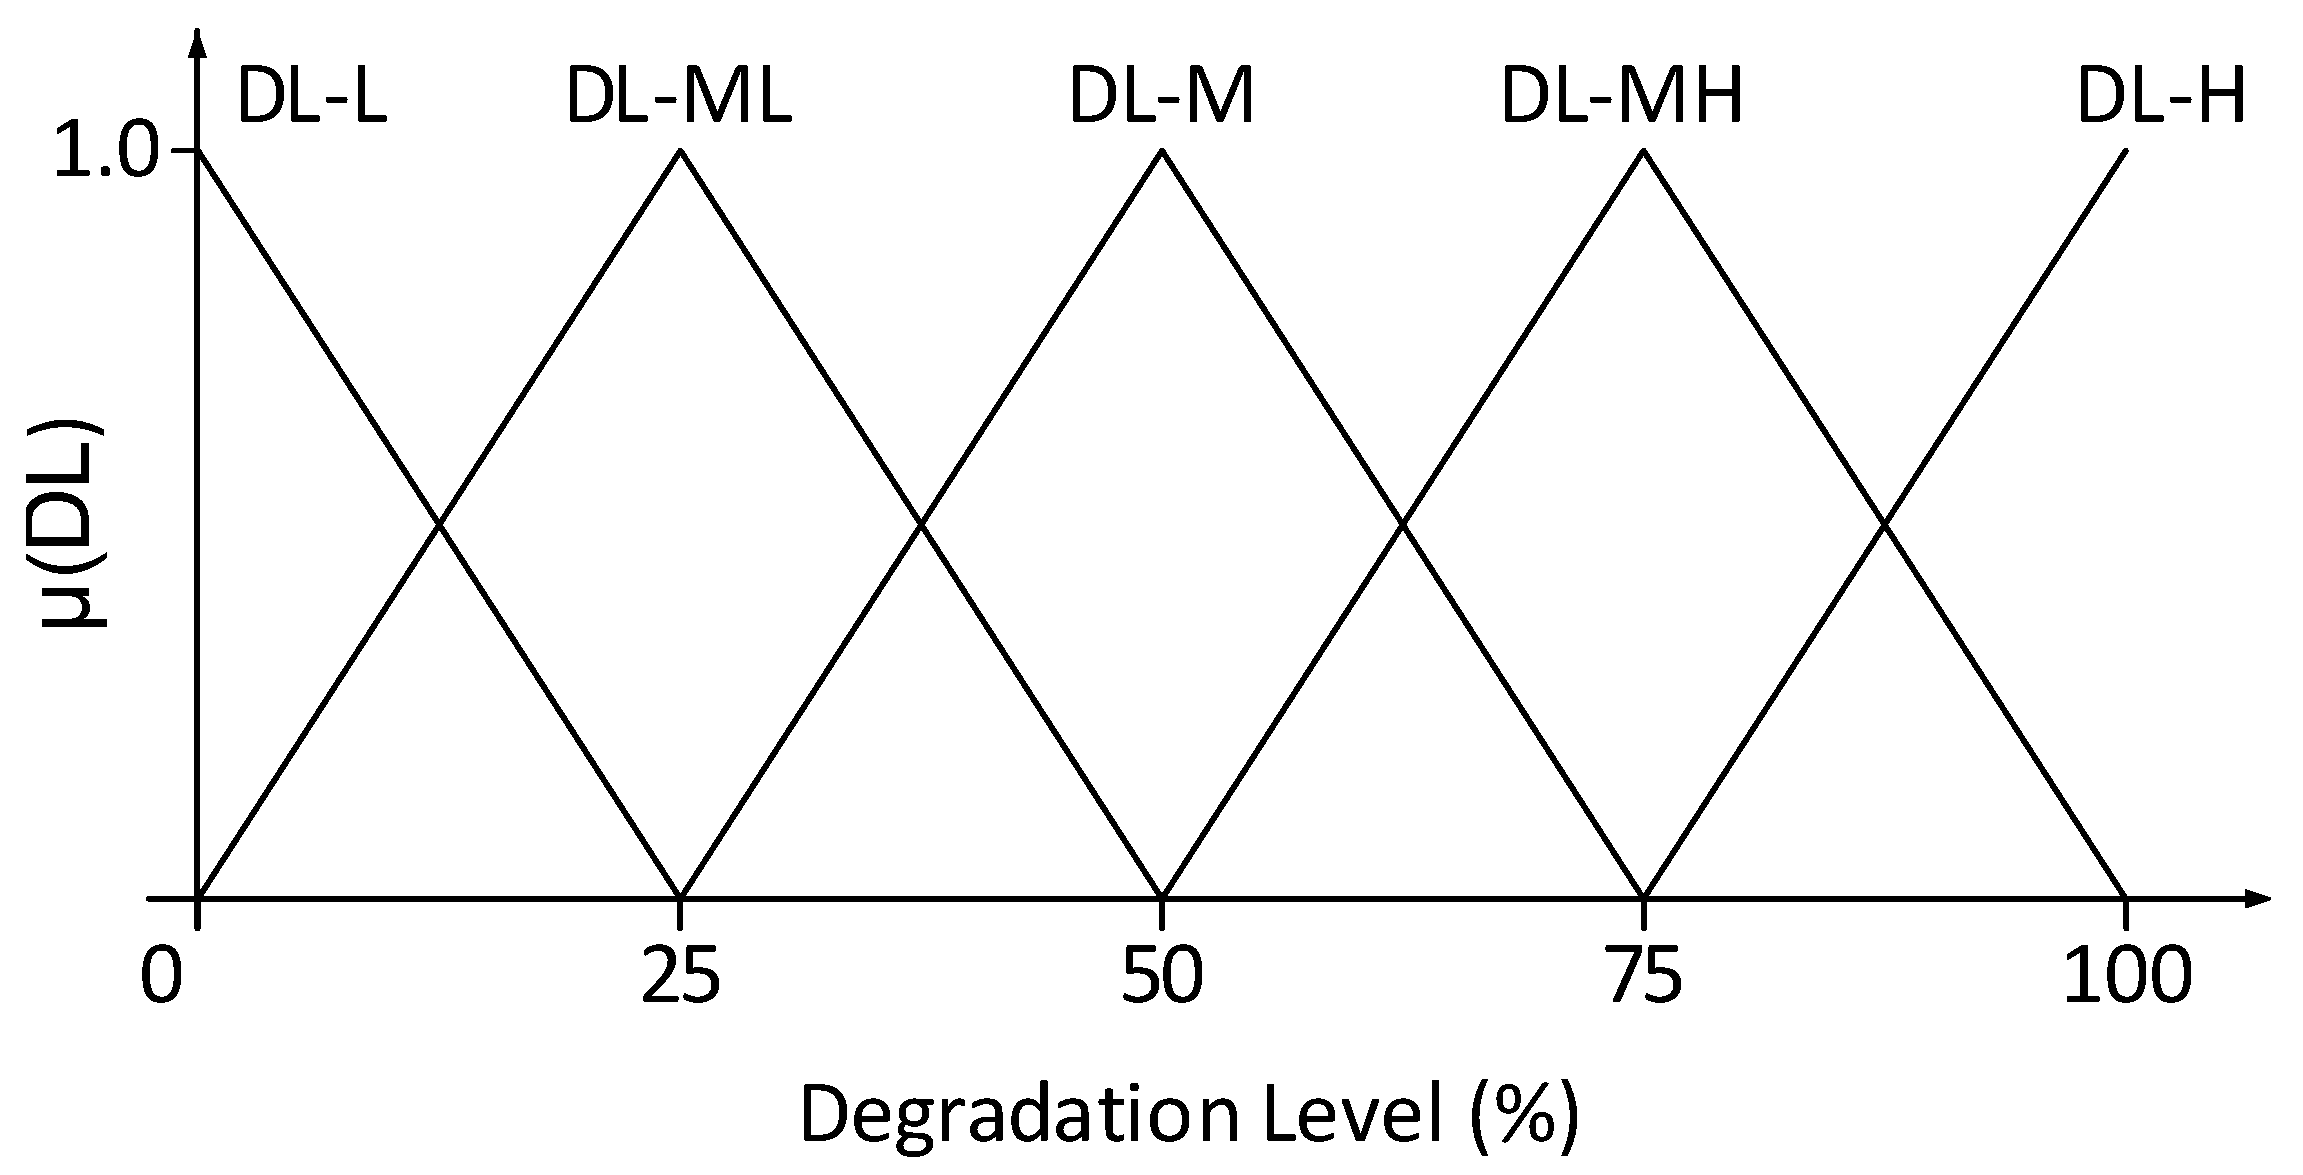
2.3. Contact Classification
- If Rm = L and Ra = L, then DL = L;
- If Rm = L and Ra = ML, then DL = ML
- If Rm = L and Ra = M, then DL = M;
- If Rm = ML and Ra = L, then DL = ML;
- If Rm = ML and Ra = ML, then DL = ML;
- If Rm = ML and Ra = M, then DL = M;
- If Rm = M and Ra = L, then DL = M;
- If Rm = M and Ra = ML, then DL = M;
- If Rm = M and Ra = M, then DL = M;
- If Rm ≠ H and Ra = MH, then DL = MH;
- If Rm = MH and Ra ≠ H, then DL = MH;
- If Rm = H or Ra = H, then DL = H.
3. Results and Discussion
4. Conclusions
Author Contributions
Funding
Data Availability Statement
Conflicts of Interest
References
- Ukil, A.; Zlatanski, M.; Hochlehnert, M. Monitoring of HV Generator Circuit Breaker Contact Ablation Based on Acoustic Emission. IEEE Trans. Instrum. Meas. 2013, 62, 2683–2693. [Google Scholar] [CrossRef]
- IEEE C37.10.1-2000; Guide for the Selection of Monitoring for Circuit Breakers. IEEE: New York, NY, USA, 2001.
- Zhong, J.; Li, W.; Billinton, R.; Yu, J. Incorporating a Condition Monitoring Based Aging Failure Model of a Circuit Breaker in Substation Reliability Assessment. IEEE Trans. Power Syst. 2015, 30, 3407–3415. [Google Scholar] [CrossRef]
- Grijp, M.H.; Bedet, J.S.; Hopkins, R.A.; Greyling, J.E. Condition Monitoring of High Voltage Circuit Breaker. In Proceedings of the 4th AFRICON 1996, IEEE AFRICON, Stellenbosch, South Africa, 27 September 1996; pp. 880–885. [Google Scholar]
- Huang, L.; Wang, W.; Wu, Z.; Xu, L. Research on the Model of HV SF6 Circuit Breaker Fault Diagnosis Based on Fuzzy Theory. In Proceedings of the Conference Condition Monitoring and Diagnosis, Beijing, China, 21–24 April 2008; pp. 428–431. [Google Scholar]
- Razi-Kazemi, A.A.; Niayesh, K. Condition monitoring of high voltage circuit breakers: Past to future. IEEE Trans. Power Deliv. 2021, 2, 740–750. [Google Scholar] [CrossRef]
- Ohlen, M.; Dueck, B.; Wernli, H. Dynamic Resistance Measurements a Tool for Circuit Breaker Diagnostics. In Proceedings of the Stockholm Power Tech International Symposium on Electric Power Engineering, Stockholm, Sweden, 18–22 June 1995; pp. 108–113. [Google Scholar]
- Landry, M.; Mercier, A.; Ouellet, G.; Rajotte, C.; Caron, J.; Roy, M.; Brikci, F. A New Measurement Method of the Dynamic Contact Resistance of hv Circuit Breakers. In Proceedings of the Transmission and Distribution Conference and Exhibition, Caracas, Venezuela, 15–18 August 2006; pp. 1–8. [Google Scholar]
- Landry, M.; Turcotte, O.; Brikci, F. A complete strategy for conducting dynamic contact resistance measurements on hv circuit breakers. IEEE Trans. Power Del. 2008, 23, 710–716. [Google Scholar] [CrossRef]
- Turcotte, O.; Gauthier, R. A thorough examination of circuit breaker health-hydro-quebec transenergie explores alternative diagnostic methods in its high-voltage circuit breaker maintenance program. Transm. Distrib. World 2008, 60, 28–33. [Google Scholar]
- Jeyaraj, S.G.; Habtay, Y. Effective and Efficient Circuit Breaker Analysis. In Proceedings of the IET Conference on Reliability of Transmission and Distribution Networks, London, UK, 22–24 November 2011; pp. 1–6. [Google Scholar]
- Cheng, T.; Gao, W.; Liu, W.; Li, R. Evaluation method of contact erosion for high voltage SF6 circuit breakers using dynamic contact resistance measurement. Electr. Power Syst. Res. 2018, 163, 725–732. [Google Scholar] [CrossRef]
- Stanisic, Z.; Neimanis, R. A New Ultra Lightweight Method for Static and Dynamic Resistance Measurements. In Proceedings of the IEEE International Symposium on Electrical Insulation, San Diego, CA, USA, 6–9 June 2010; pp. 1–4. [Google Scholar]
- Sodha, N.S.; Singh, S.; Victor, S.; Tyagi, R.K. Condition Assessment of EHV Class Circuit Breakers Using Dynamic Contact Resistance Measurement Technique. In Proceedings of the CIGRE Session, Paris, France, 26–30 August 2012. [Google Scholar]
- Bhole, A.; Gandhare, W. An overview of dynamic contact resistance measurement of hv circuit breakers. J. Inst. Eng. 2015, 4, 1–8. [Google Scholar] [CrossRef]
- Cheng, T.; Zhu, W.; Jin, G.; Yang, Z.; Gao, W. Influence of the injected current on Dynamic Contact Resistance Measurements of HV Circuit Breakers. In Proceedings of the China International Conference on Electricity Distribution (CICED), Shenzhen, China, 23–26 September 2014; pp. 1447–1481. [Google Scholar]
- Souza, R.T.; Costa, E.G.; Oliveira, A.C.; Sousa, W.D.V.; Morais, T.C.M. Characterization of Contacts Degradation in Circuit Breakers through the Dynamic Contact Resistance. In Proceedings of the Transmission & Distribution Conference and Exposition-Latin America, Medellin, Colombia, 10–13 September 2014; pp. 1–6. [Google Scholar]
- Khoddam, M.; Sadeh, J.; Pourmohamadiyan, P. Performance evaluation of circuit breaker electrical contact based on dynamic resistance signature and using health index. IEEE Trans. Compon. Packag. Manuf. Technol. 2016, 6, 1505–1512. [Google Scholar] [CrossRef]
- Chen, G.; Lan, L.; Pan, Z.; Wen, X.; Wang, Y.; Wu, Y. Electrical erosion test and condition assessment of SF6 CB contact sets. IET Gen. Trans. Distrib. 2017, 11, 1901–1909. [Google Scholar] [CrossRef]
- Liu, Y.; Zhang, G.; Qin, H.; Geng, Y.; Wang, J.; Yang, J.; Zhao, K. Prediction of the dynamic contact resistance of circuit breaker based on the kernel partial least squares. IET Gen. Trans. Distrib. 2018, 12, 1815–1821. [Google Scholar] [CrossRef]
- Liu, Y.; Zhang, G.; Yang, J.; Zhao, K.; Gao, S. The mathematical model of contact resistance and injected current in DRM tests of SF 6 circuit breaker. IEEE Trans. Compon. Packag. Manuf. Technol. 2017, 8, 82–87. [Google Scholar] [CrossRef]
- Liu, Y.; Zhang, G.; Qin, H.; Liu, W.; Wang, J.; Yang, J. Study on the influence of speed in DRM of SF6 circuit breaker. Int. J. Electr. Power Energy Syst. 2020, 121, 106067. [Google Scholar] [CrossRef]
- Sun, S.; Cong, P.; Wang, Y. Dynamic Resistance Measurement and Contact Ablation Diagnosis System for SF6 Circuit Breaker. In Proceedings of the 2022 China Automation Congress, Xiamen, China, 25–27 November 2022; pp. 5155–5159. [Google Scholar]
- Chen, G.; Li, M.; Wang, Q.; Lu, X.; Zhang, S.; Luo, D. The Contact Erosion Characteristics of SF6 Circuit Breaker Based on Dynamic Resistance Measurement Method. Energy Rep. 2022, 8, 1081–1089. [Google Scholar] [CrossRef]
- Cao, R.; Lv, H.; Wu, X.; Wang, H.; Zhao, P.; Xin, Z.; Liu, H.; Gao, W. Experimental Study on the Relationship Between Ablation of Circuit Breaker Electrical Life and Dynamic Resistance. In Proceedings of the 9th Frontier Academic Forum of Electrical Engineering; Lecture Notes in Electrical Engineering; Springer: Singapore; 2021. [Google Scholar]
- Santos Souza, H.F.; Oliveira, A.C.; Xavier, G.V.R.; Santana, H.N.; Costa, E.G.; Ferreira, T.V. Analysis of alternative parameters of dynamic resistance measurement in high voltage circuit breakers. High Volt. 2019, 4, 197–202. [Google Scholar]
- Abdollah, M.; Razi-Kazemi, A.A. Intelligent Failure Diagnosis for Gas Circuit Breakers Based on Dynamic Resistance Measurements. IEEE Trans. Instrum. Meas. 2019, 68, 3066–3077. [Google Scholar] [CrossRef]
- Walpole, R.E.; Myers, R.H.; Myers, S.L.; Ye, K. Probability & Statistics for Engineers & Scientists, 9th ed.; Pearson Education: Boston, MA, USA, 2012. [Google Scholar]
- Razi-Kazemi, A.A.; Vakilian, M.; Niayesh, K.; Lehtonen, M. Priority Assessment of Online Monitoring Investment for Power System Circuit Breakers—Part I: Qualitative-Quantitative Approach. IEEE Trans.Power Del. 2013, 28, 928–938. [Google Scholar] [CrossRef]
- Simões, M.G.; Shaw, I.S. Controle e Modelagem Fuzzy; Editora Blucher: São Paulo, SP, Brazil, 2007. [Google Scholar]
- Chang, C.S.; Wang, Z.; Yang, F.; Tan, W.W. Hierarchical Fuzzy Logic System for Implementing Maintenance Schedules of Offshore Power Systems. IEEE Trans. Smart Grid 2012, 3, 3–11. [Google Scholar] [CrossRef]
- Ge, H.; Asgarpoor, S. Reliability evaluation of equipment and substations with fuzzy Markov processes. IEEE Trans. Power Syst. 2010, 25, 1319–1328. [Google Scholar]
- Nemeth, B.; Laboncz, S.; Kiss, I. Condition Monitoring of Power Transformers Using dga and Fuzzy Logic. In Proceedings of the IEEE Electrical Insulation Conference, Montreal, QC, Canada, 31 May–3 June 2009; pp. 373–376. [Google Scholar]
- De Souza, R.T.; Da Costa, E.G.; De Oliveira, A.C. Circuit Breaker Contact Diagnostics Based on Dynamic Resistance and Fuzzy Logic. In Proceedings of the International Symposium on High Voltage Engineering, Pilsen, Czech Republic, 23–28 August 2015. [Google Scholar]
- Western Area Power Administration. Power System Maintenance Manual; Western Area Power Administration: Denver, CO, USA, 1998. [Google Scholar]


| Parameters | CB-A | CB-B | CB-C |
|---|---|---|---|
| Rm1 | 150.0 | 40 | 40 |
| Rm2 | 187.5 | 50 | 50 |
| Rm3 | 225.0 | 60 | 60 |
| Rm4 | 262.5 | 70 | 70 |
| Rm5 | 300.0 | 80 | 80 |
| Ra1 | 500.0 | 60 | 60 |
| Ra2 | 562.5 | 75 | 75 |
| Ra3 | 625.0 | 90 | 90 |
| Ra4 | 687.5 | 105 | 105 |
| Ra5 | 750.0 | 120 | 120 |
| Ra = L | Ra = ML | Ra = M | Ra = MH | Ra = H | |
|---|---|---|---|---|---|
| Rm = L | DL = L | DL = Wa × ML | DL = Wa × M | DL = Wa × MH | DL = H |
| Rm = ML | DL = Wm × ML | DL = ML | DL = Wa × M | DL = Wa × MH | DL = H |
| Rm = M | DL = Wm × M | DL = Wm × M | DL= M | DL = Wa × MH | DL = H |
| Rm = MH | DL = Wm × MH | DL = Wm × MH | DL = Wm × MH | DL = MH | DL = H |
| Rm = H | DL = H | DL = H | DL = H | DL = H | DL = H |
| DRM Test | Rm (µΩ) | Ra (µΩ) | ||||
|---|---|---|---|---|---|---|
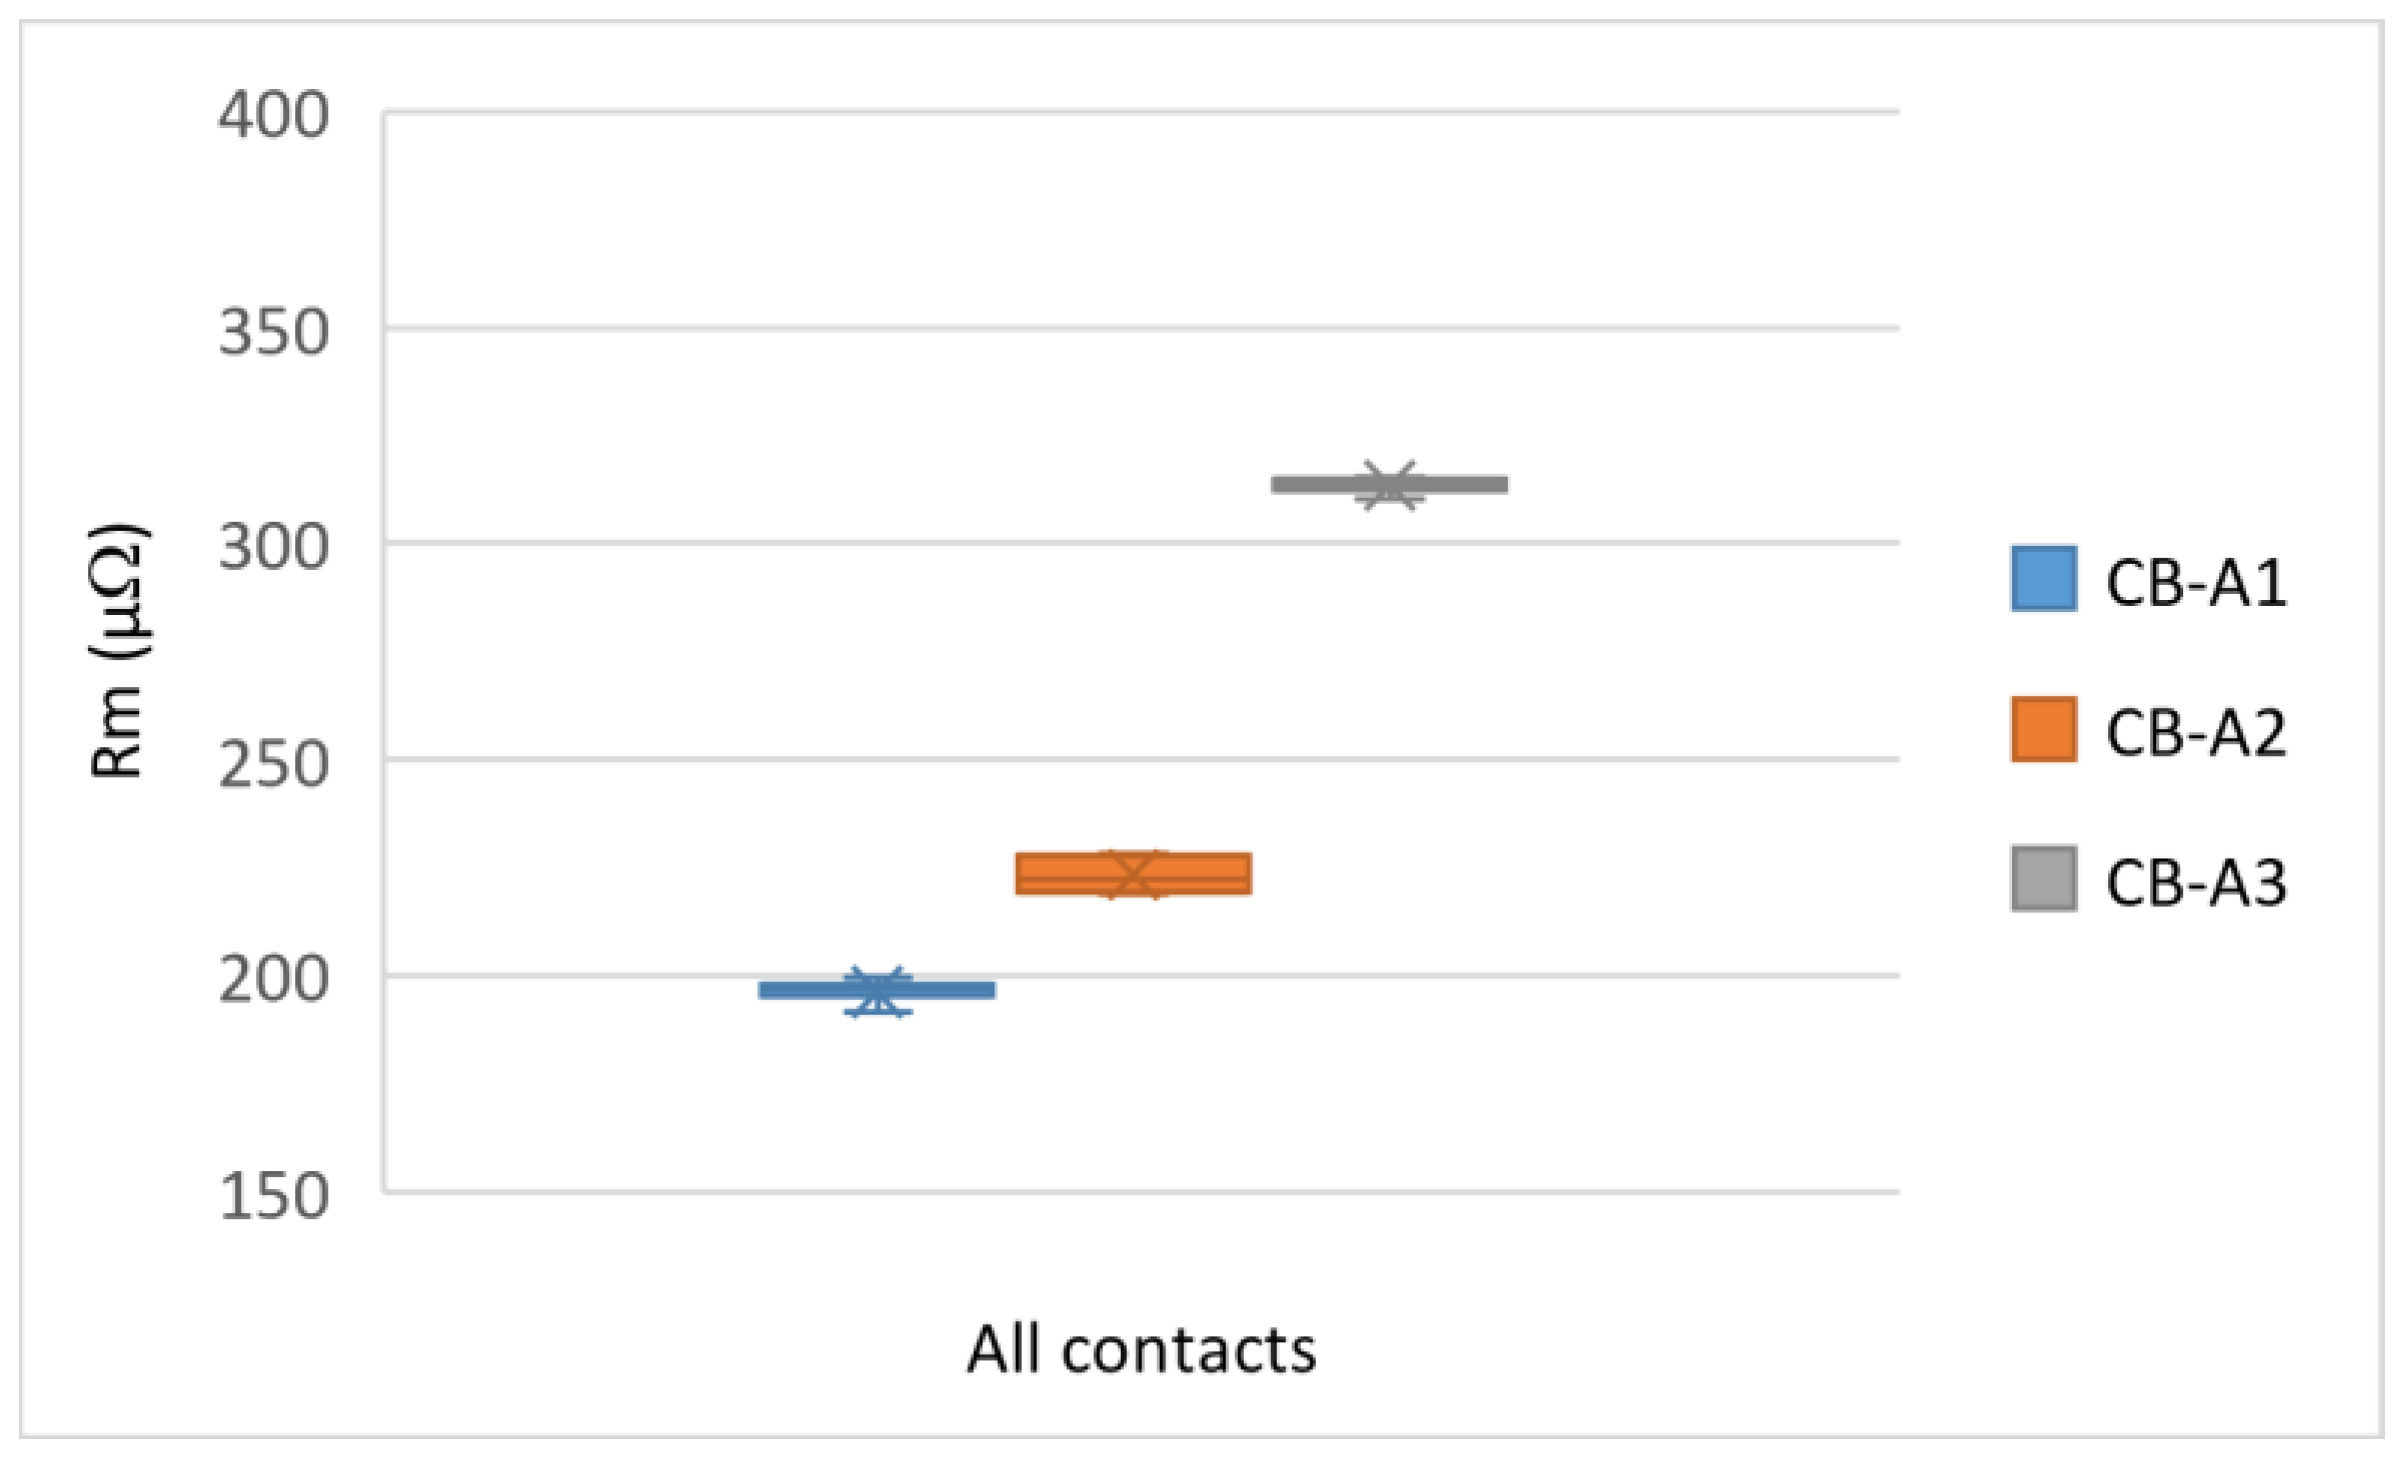
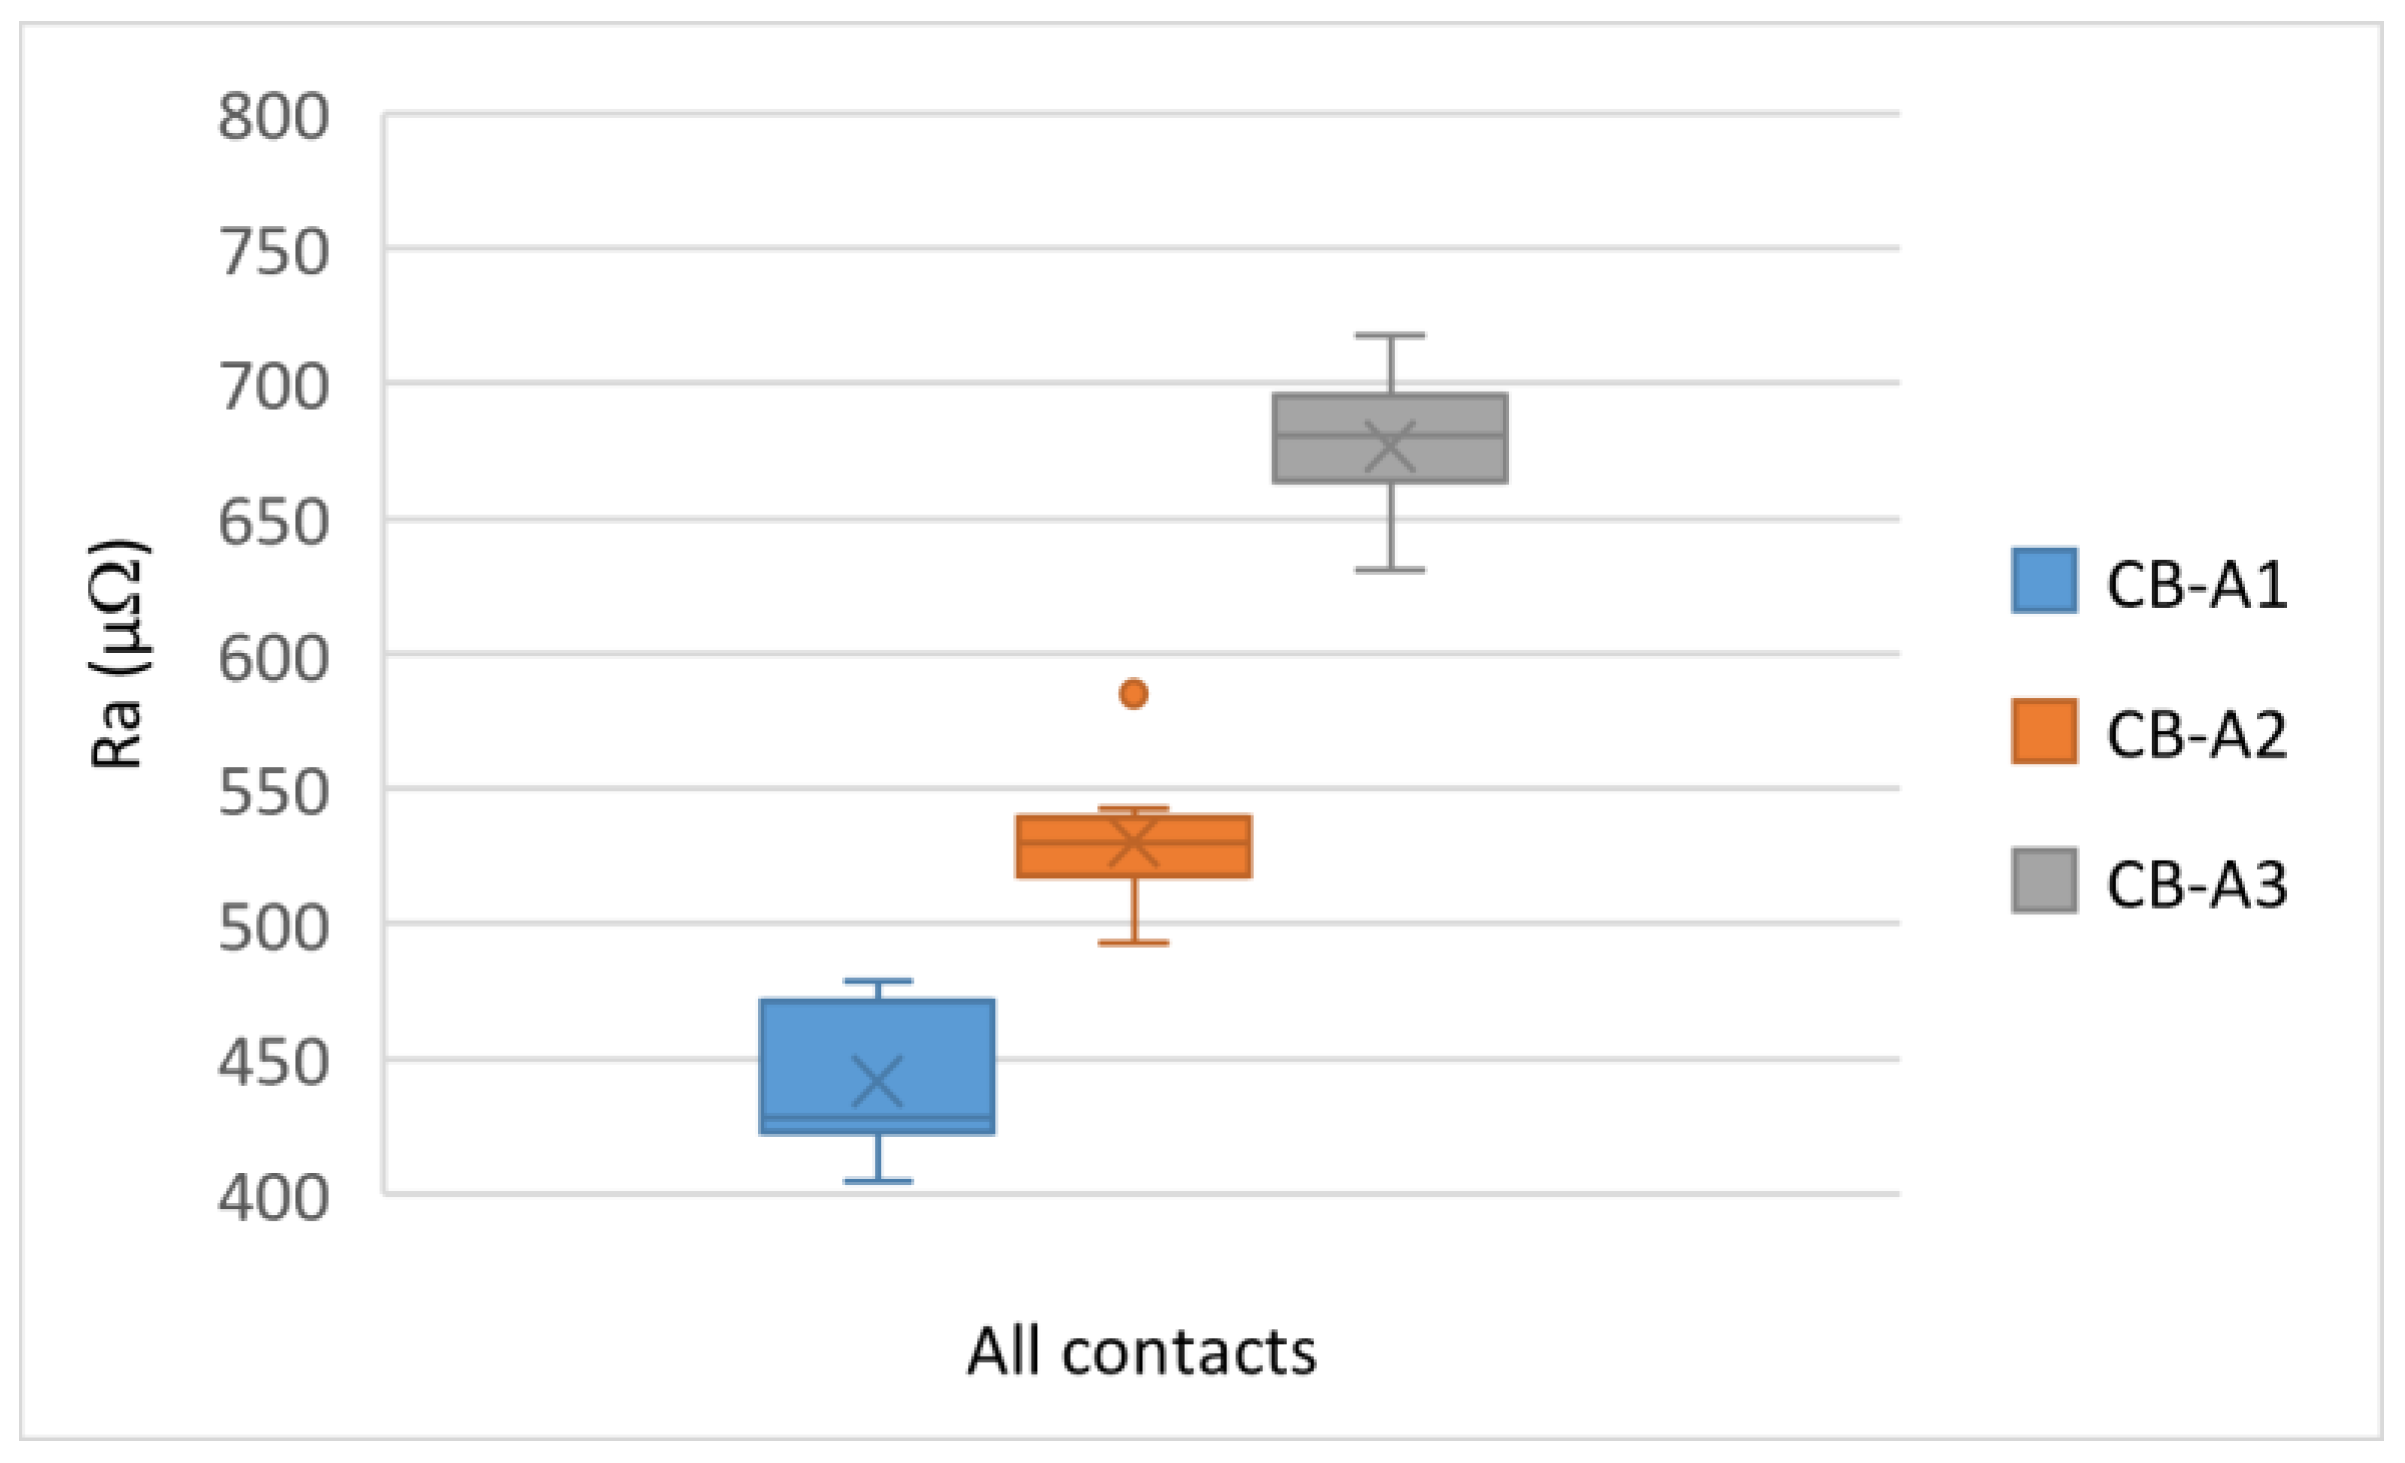
| CB-A1 | CB-A2 | CB-A3 | CB-A1 | CB-A2 | CB-A3 | |
| 1 | 200 | 228 | 310 | 423 | 543 | 718 |
| 2 | 198 | 227 | 313 | 430 | 517 | 701 |
| 3 | 196 | 228 | 314 | 479 | 493 | 686 |
| 4 | 197 | 228 | 315 | 405 | 531 | 697 |
| 5 | 198 | 224 | 314 | 477 | 521 | 692 |
| 6 | 197 | 221 | 315 | 427 | 585 | 676 |
| 7 | 197 | 220 | 315 | 424 | 541 | 672 |
| 8 | 193 | 220 | 312 | 418 | 535 | 661 |
| 9 | 192 | 219 | 314 | 459 | 509 | 631 |
| 10 | 196 | 219 | 313 | 476 | 529 | 633 |
| DRM Test | Rm (µΩ) | Ra (µΩ) | ||||||
|---|---|---|---|---|---|---|---|---|
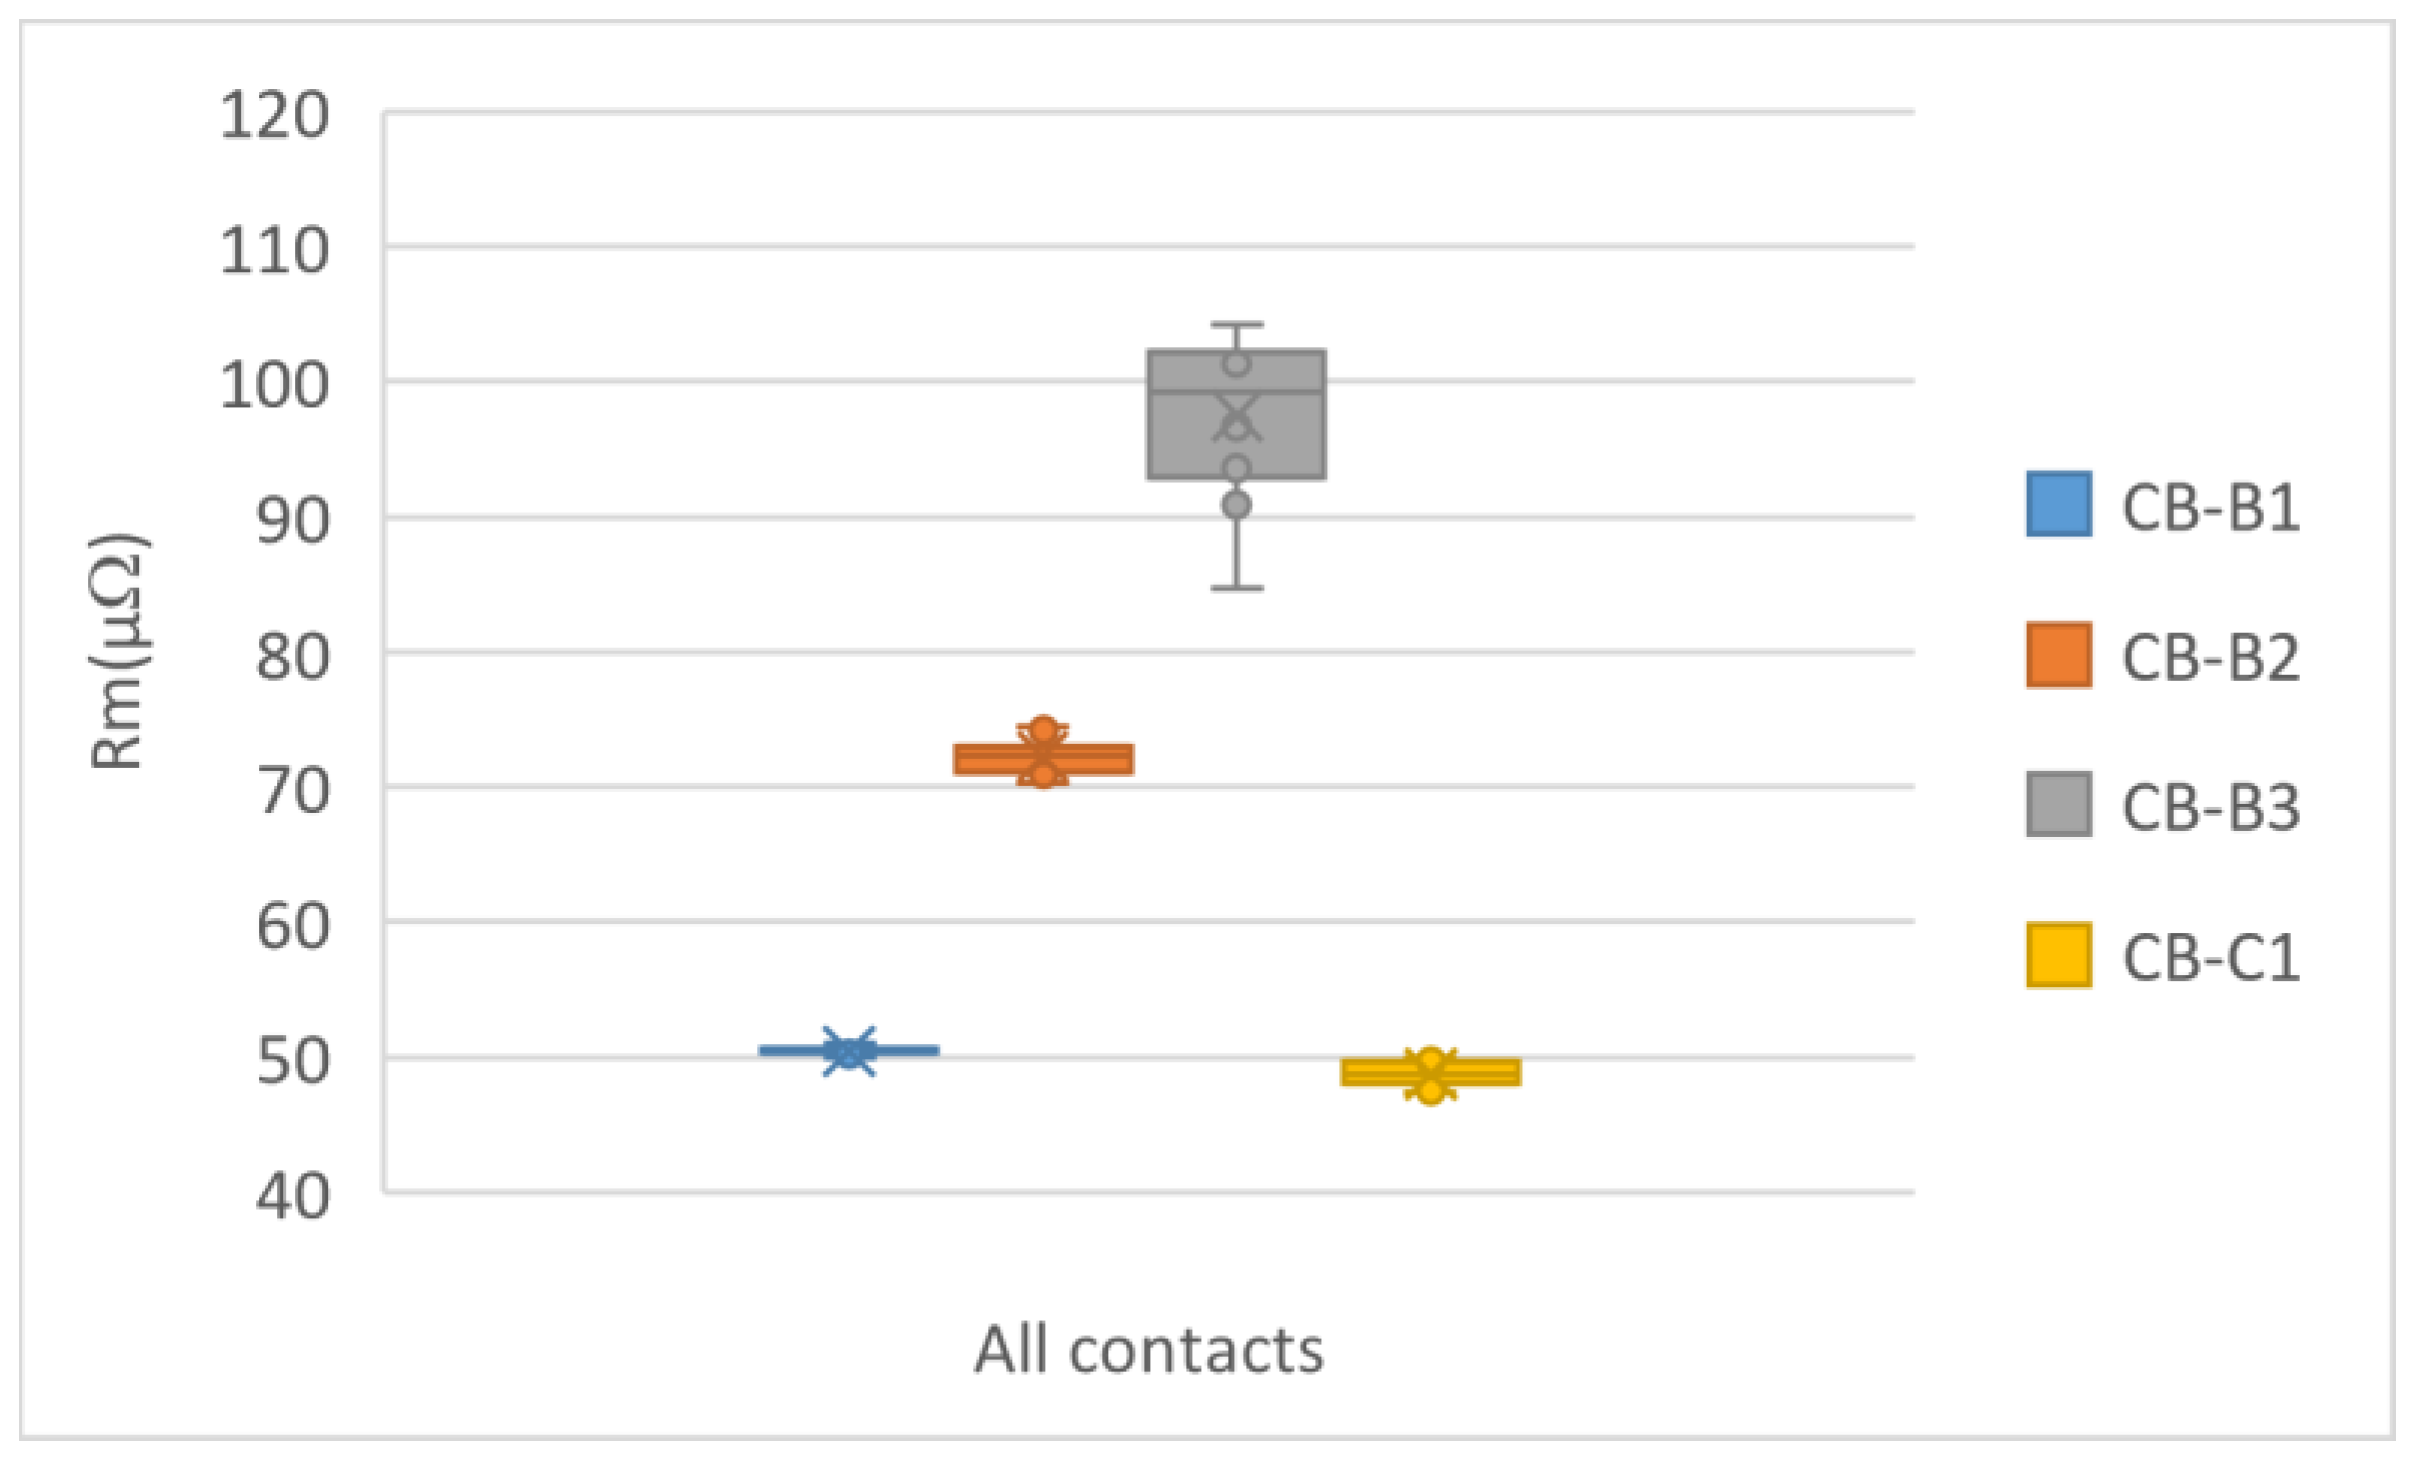
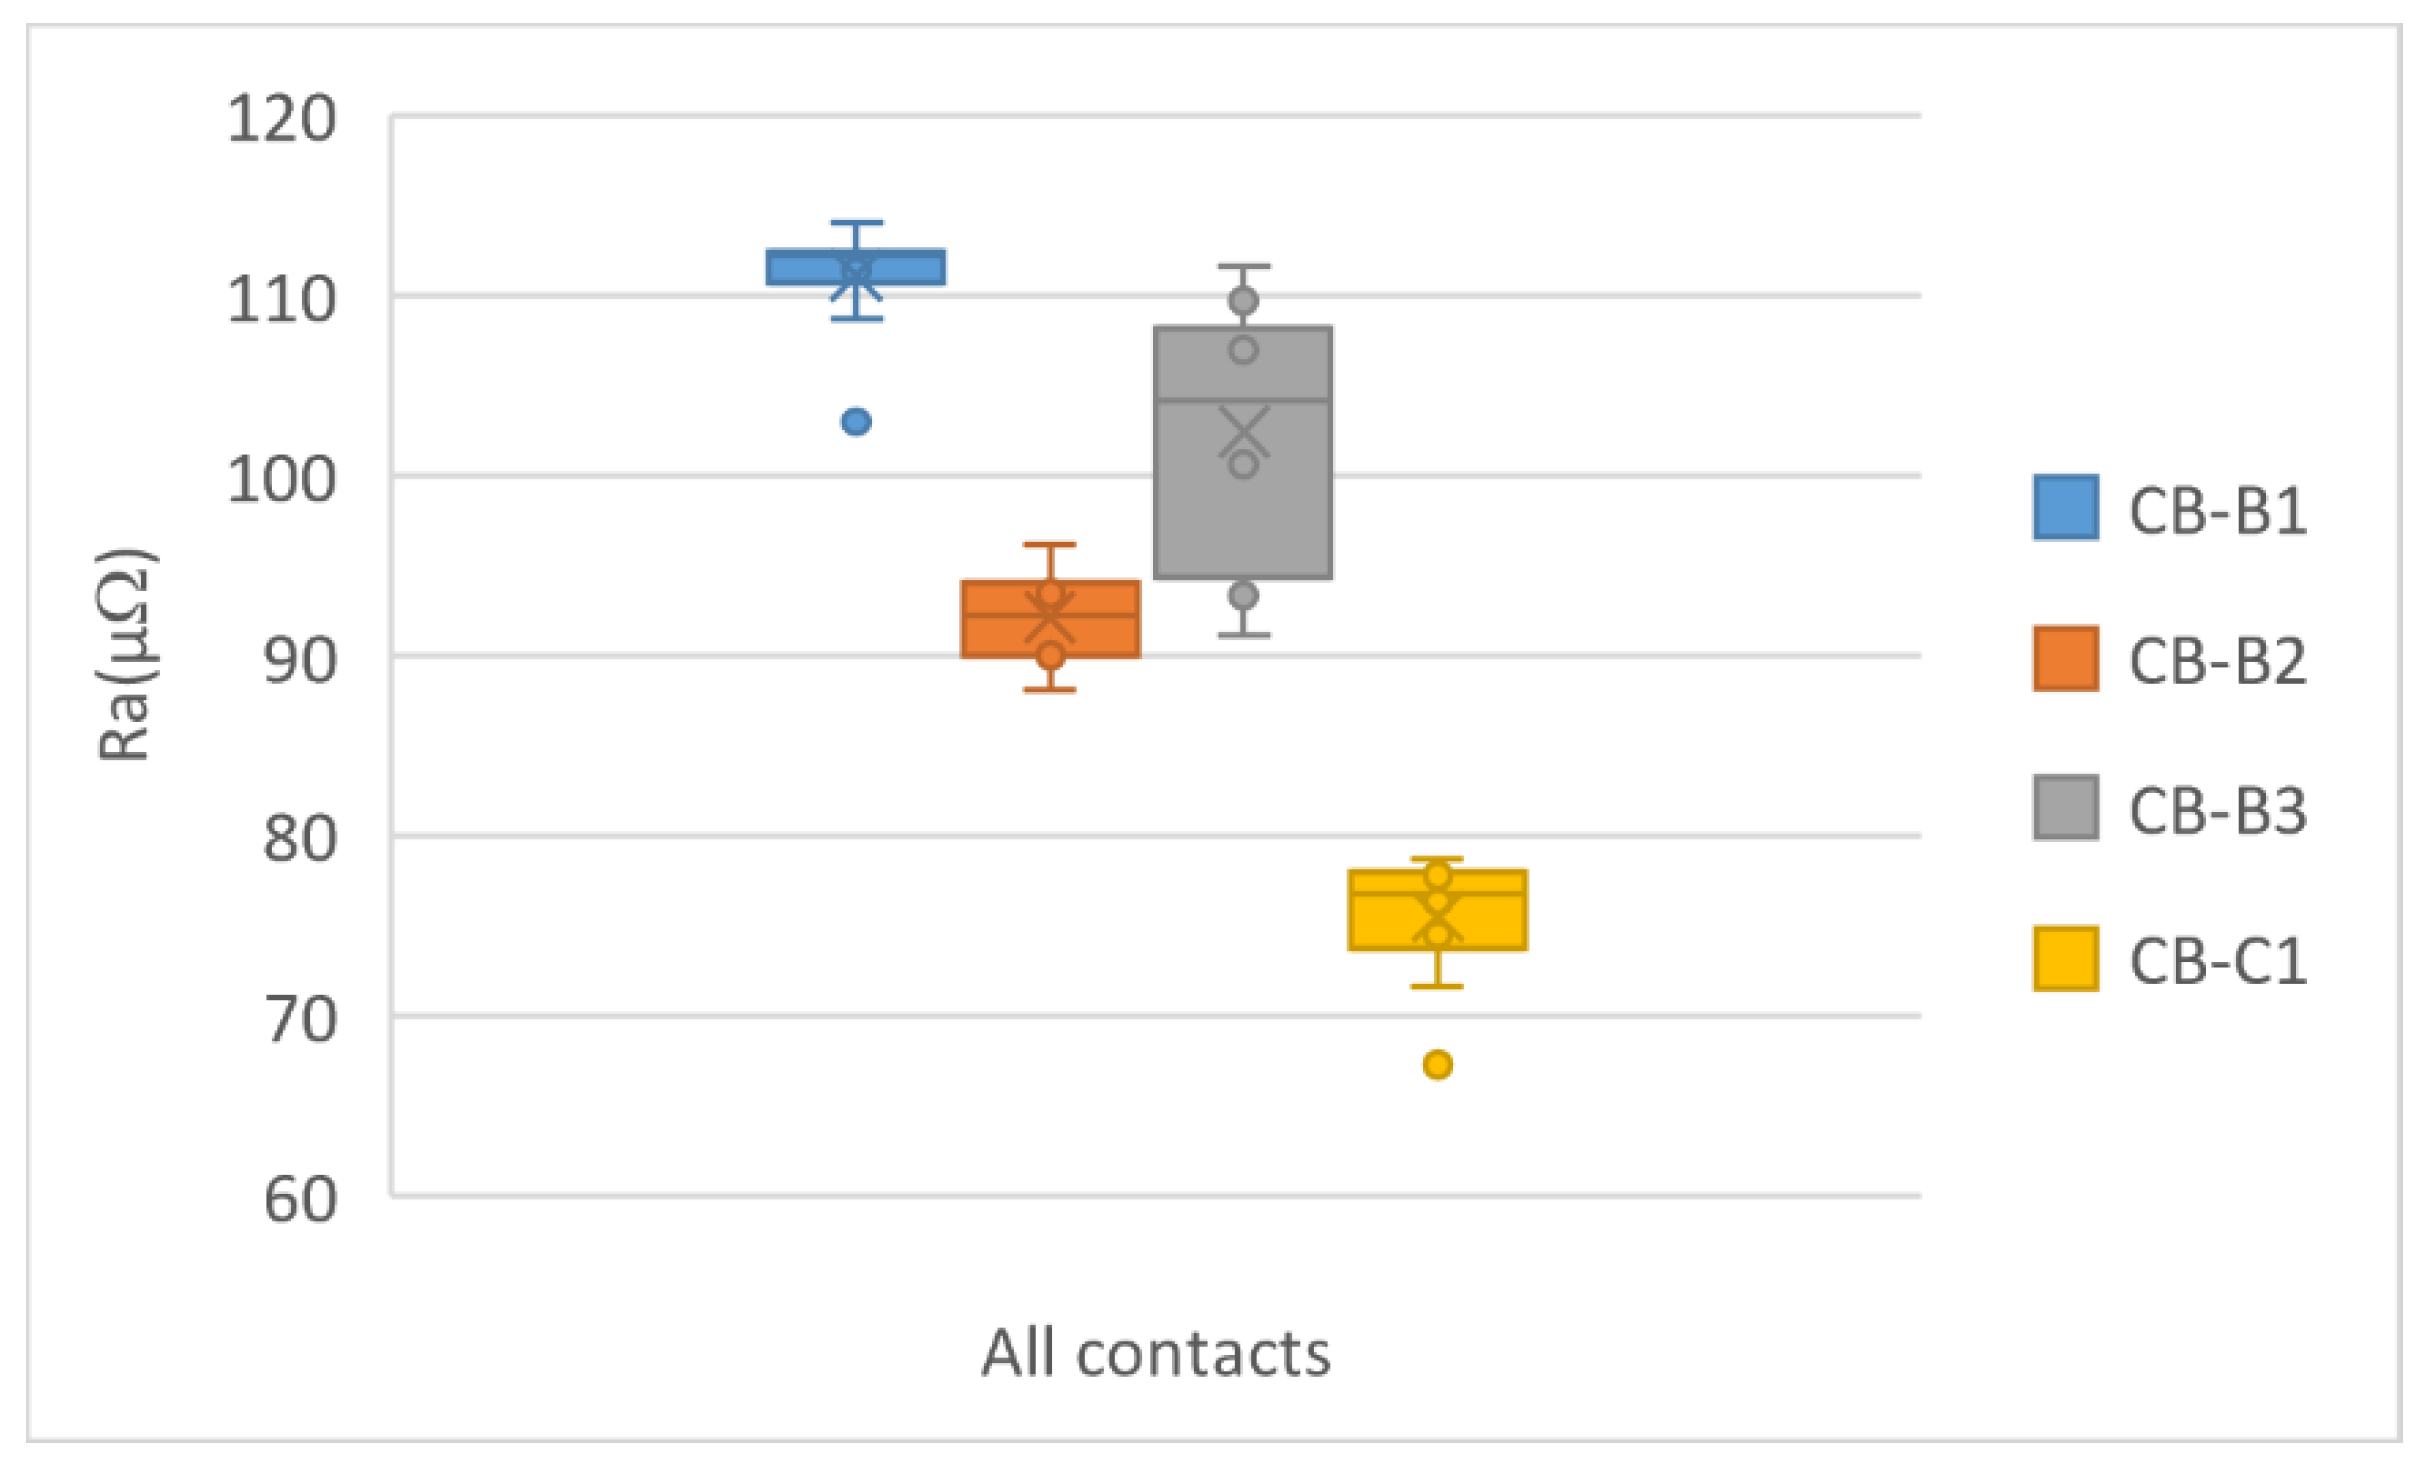
| CB-B1 | CB-B2 | CB-B3 | CB-C1 | CB-B1 | CB-B2 | CB-B3 | CB-C1 | |
| 1 | 51 | 73 | 104 | 49 | 103 | 91 | 91 | 76 |
| 2 | 51 | 70 | 102 | 47 | 109 | 95 | 108 | 77 |
| 3 | 50 | 73 | 101 | 49 | 114 | 94 | 110 | 77 |
| 4 | 51 | 71 | 102 | 50 | 111 | 93 | 107 | 75 |
| 5 | 50 | 71 | 94 | 49 | 113 | 90 | 101 | 72 |
| 6 | 50 | 74 | 103 | 48 | 112 | 96 | 112 | 67 |
| 7 | 50 | 72 | 91 | 48 | 112 | 90 | 95 | 78 |
| 8 | 50 | 75 | 97 | 50 | 112 | 94 | 107 | 78 |
| 9 | 50 | 72 | 97 | 49 | 112 | 90 | 101 | 79 |
| 10 | 50 | 73 | 85 | 50 | 112 | 88 | 93 | 77 |
| Contact | Rm (µΩ) | Ra (µΩ) | Level of Degradation (%) |
|---|---|---|---|
| CB-A1 | 198 | 472 | 32 |
| CB-A2 | 228 | 539 | 52 |
| CB-A3 | 314 | 695 | 100 |
| CB-B1 | 50 | 78 | 30 |
| CB-B2 | 73 | 94 | 81 |
| CB-B3 | 102 | 108 | 100 |
| CB-C1 | 50 | 78 | reference |
Disclaimer/Publisher’s Note: The statements, opinions and data contained in all publications are solely those of the individual author(s) and contributor(s) and not of MDPI and/or the editor(s). MDPI and/or the editor(s) disclaim responsibility for any injury to people or property resulting from any ideas, methods, instructions or products referred to in the content. |
© 2024 by the authors. Licensee MDPI, Basel, Switzerland. This article is an open access article distributed under the terms and conditions of the Creative Commons Attribution (CC BY) license (https://creativecommons.org/licenses/by/4.0/).
Share and Cite
Souza, R.T.; Lira, G.R.S.; Costa, E.G.; Oliveira, A.C.; Leite Neto, A.F. Methodology for Circuit Breaker Contact Diagnosis through Dynamic Resistance Measurements and Fuzzy-Logic-Based Analysis. Energies 2024, 17, 1869. https://doi.org/10.3390/en17081869
Souza RT, Lira GRS, Costa EG, Oliveira AC, Leite Neto AF. Methodology for Circuit Breaker Contact Diagnosis through Dynamic Resistance Measurements and Fuzzy-Logic-Based Analysis. Energies. 2024; 17(8):1869. https://doi.org/10.3390/en17081869
Chicago/Turabian StyleSouza, Ronimack T., George R. S. Lira, Edson G. Costa, Adriano C. Oliveira, and Antonio F. Leite Neto. 2024. "Methodology for Circuit Breaker Contact Diagnosis through Dynamic Resistance Measurements and Fuzzy-Logic-Based Analysis" Energies 17, no. 8: 1869. https://doi.org/10.3390/en17081869
APA StyleSouza, R. T., Lira, G. R. S., Costa, E. G., Oliveira, A. C., & Leite Neto, A. F. (2024). Methodology for Circuit Breaker Contact Diagnosis through Dynamic Resistance Measurements and Fuzzy-Logic-Based Analysis. Energies, 17(8), 1869. https://doi.org/10.3390/en17081869