Abstract
Hydrothermal geothermal energy, as a widely distributed, large reserve and easily exploitable renewable source, can be used for both power generation and building heating. In this study, a numerical simulation of heat extraction performance is conducted based on monitoring well temperature data in a geothermal field in Xiong’an New Area. The effects of the reinjection temperature, injection flow rate, and reinjection rate on the outlet temperature and the reservoir temperature during a long-term operation are analyzed. The results indicate that the lower reinjection temperature can generate a critical disturbance scope for the thermal reservoir during the exploitation process. The impact scope on the thermal reservoir can reach 210.3 m at a reinjection temperature of 25 °C, which is not conducive to maintaining the outlet temperature of production wells in the long-term. The reinjection rate significantly affects both the horizontal and vertical temperature fields of the thermal reservoir. Under reinjection conditions of 30 °C and 40 kg/s, the horizontal and vertical impact scope of the thermal reservoir are 262.3 and 588.5 m, respectively. The reinjection rate is inversely related to the outlet temperature. A decrease from 100% to 70% in the reinjection rate can increase the outlet temperature by 4.21%. However, a decrease in the reinjection rate will lead to a decline in the groundwater level. Therefore, balancing the variation in outlet temperature and groundwater level is crucial in practical engineering.
1. Introduction
An increasing global population and rapid industrial development have led to a continuous rise in the demand for energy [1]. However, the extensive development and use of traditional fossil fuels have exacerbated issues such as energy shortages and environmental pollution [2]. Hence, reducing dependence on traditional fossil fuels like oil, coal and natural gas and developing clean, pollution-free renewable energy sources have become increasingly important [3]. Geothermal energy, as an emerging clean energy source, is widely distributed in the Earth, offering enormous reserves and being clean, efficient, weather-independent and renewable [4]. In recent years, the development and utilization of geothermal resources as a primary energy source have garnered significant attention worldwide [5]. According to data from the 2020 World Geothermal Congress (WGC 2020) held in Reykjavik, Iceland, the global installed capacity of geothermal energy was 10,897 megawatts electric (MWe) in 2010, 12,283 MWe in 2015 and 15,950 MWe in 2020 [6]. It is estimated that by 2025, the global installed capacity of geothermal energy will reach 19,361 MWe [7]. This growth demonstrates the rapid development of geothermal energy utilization in recent years.
Geothermal resources can be classified into dry rock and hydrothermal types based on their occurrence [8]. Dry rock, specifically hot dry rock (HDR), refers to rock temperatures exceeding 200 °C, located several kilometers below the Earth’s surface and with little or no underground fluids [9]. These resources have challenges in terms of development technology and high associated costs [10]. Hydrothermal geothermal energy refers to high-temperature energy buried in underground water [11]. Hydrothermal geothermal resources often exist at relatively shallow depths, making their development less challenging [12]. China has abundant hydrothermal geothermal resources, with 2334 exposed hot springs and 5818 geothermal wells [13]. The hydrothermal geothermal resource is equivalent to 3.66 × 10¹³ MJ of heat, with an annual extractable amount equivalent to 5.46 × 10¹⁰ of heat. Therefore, developing hydrothermal geothermal resources at this stage offers lower technical difficulties and higher economic benefits [14].
Hydrothermal geothermal energy is currently widely utilized for electricity generation and heating [15]. The first experimental power station utilizing hydrothermal geothermal resources in China was the Yangba well geothermal power station, completed in 1977 at an altitude of 4300 m. By September 2020, the Yangba well geothermal power station had accumulated a power generation capacity of 3.39 billion kWh, serving as a demonstrative guide for the development and utilization of geothermal energy in Tibet and across the country [16]. The Yangyi geothermal field is one of the highest-temperature geothermal fields discovered in mainland China. With a thermal storage area of 11.3 km2, the Yangyi geothermal power station is the first in China to achieve 100% reinjection and is currently the world’s highest-altitude geothermal power station with the largest single-unit capacity domestically [17].
In addition to geothermal power generation, hydrothermal geothermal resources can be directly utilized for heating or cooling buildings [18]. The National Energy Administration aims to increase the area of geothermal heating (cooling) in the country by 50% by 2025 compared to 2020 [19]. By 2035, the goal is to double the geothermal heating (cooling) area compared to 2025 [20]. As part of the national agenda, Xiongan New Area aims to reduce pollutant emissions in production and daily life, becoming an eco-friendly and livable new urban area [21]. The promotion of geothermal heating as a replacement for coal in Xiongan New Area can contribute to building a replicable and scalable “Xiongan model” [22].
Geothermal heating projects have abundant engineering examples both domestically and internationally, with relatively mature applications [23]. Reinjection is a very important part of geothermal development, and it may help with the recharge of the reservoir and may provide pressure support, thus reducing reservoir pressure drawdown and preventing cold water infiltration [24]. However, due to geological conditions and the complexity of extraction projects, many issues still need to be addressed. Therefore, this paper’s numerical model relies on the geothermal field in Xiongan New Area and a field monitor method to study the impact of factors such as injection temperature, reinjection flow rate and reinjection ratio on the temperature field of the thermal reservoir (horizontal radius and depth of impact). The study also examines their effects on outlet temperature and flow impedance, analyzing the feasibility of long-term exploitation of the target site and providing theoretical guidance for final engineering implementation.
2. Overview of the Study Area
2.1. Geological Conditions
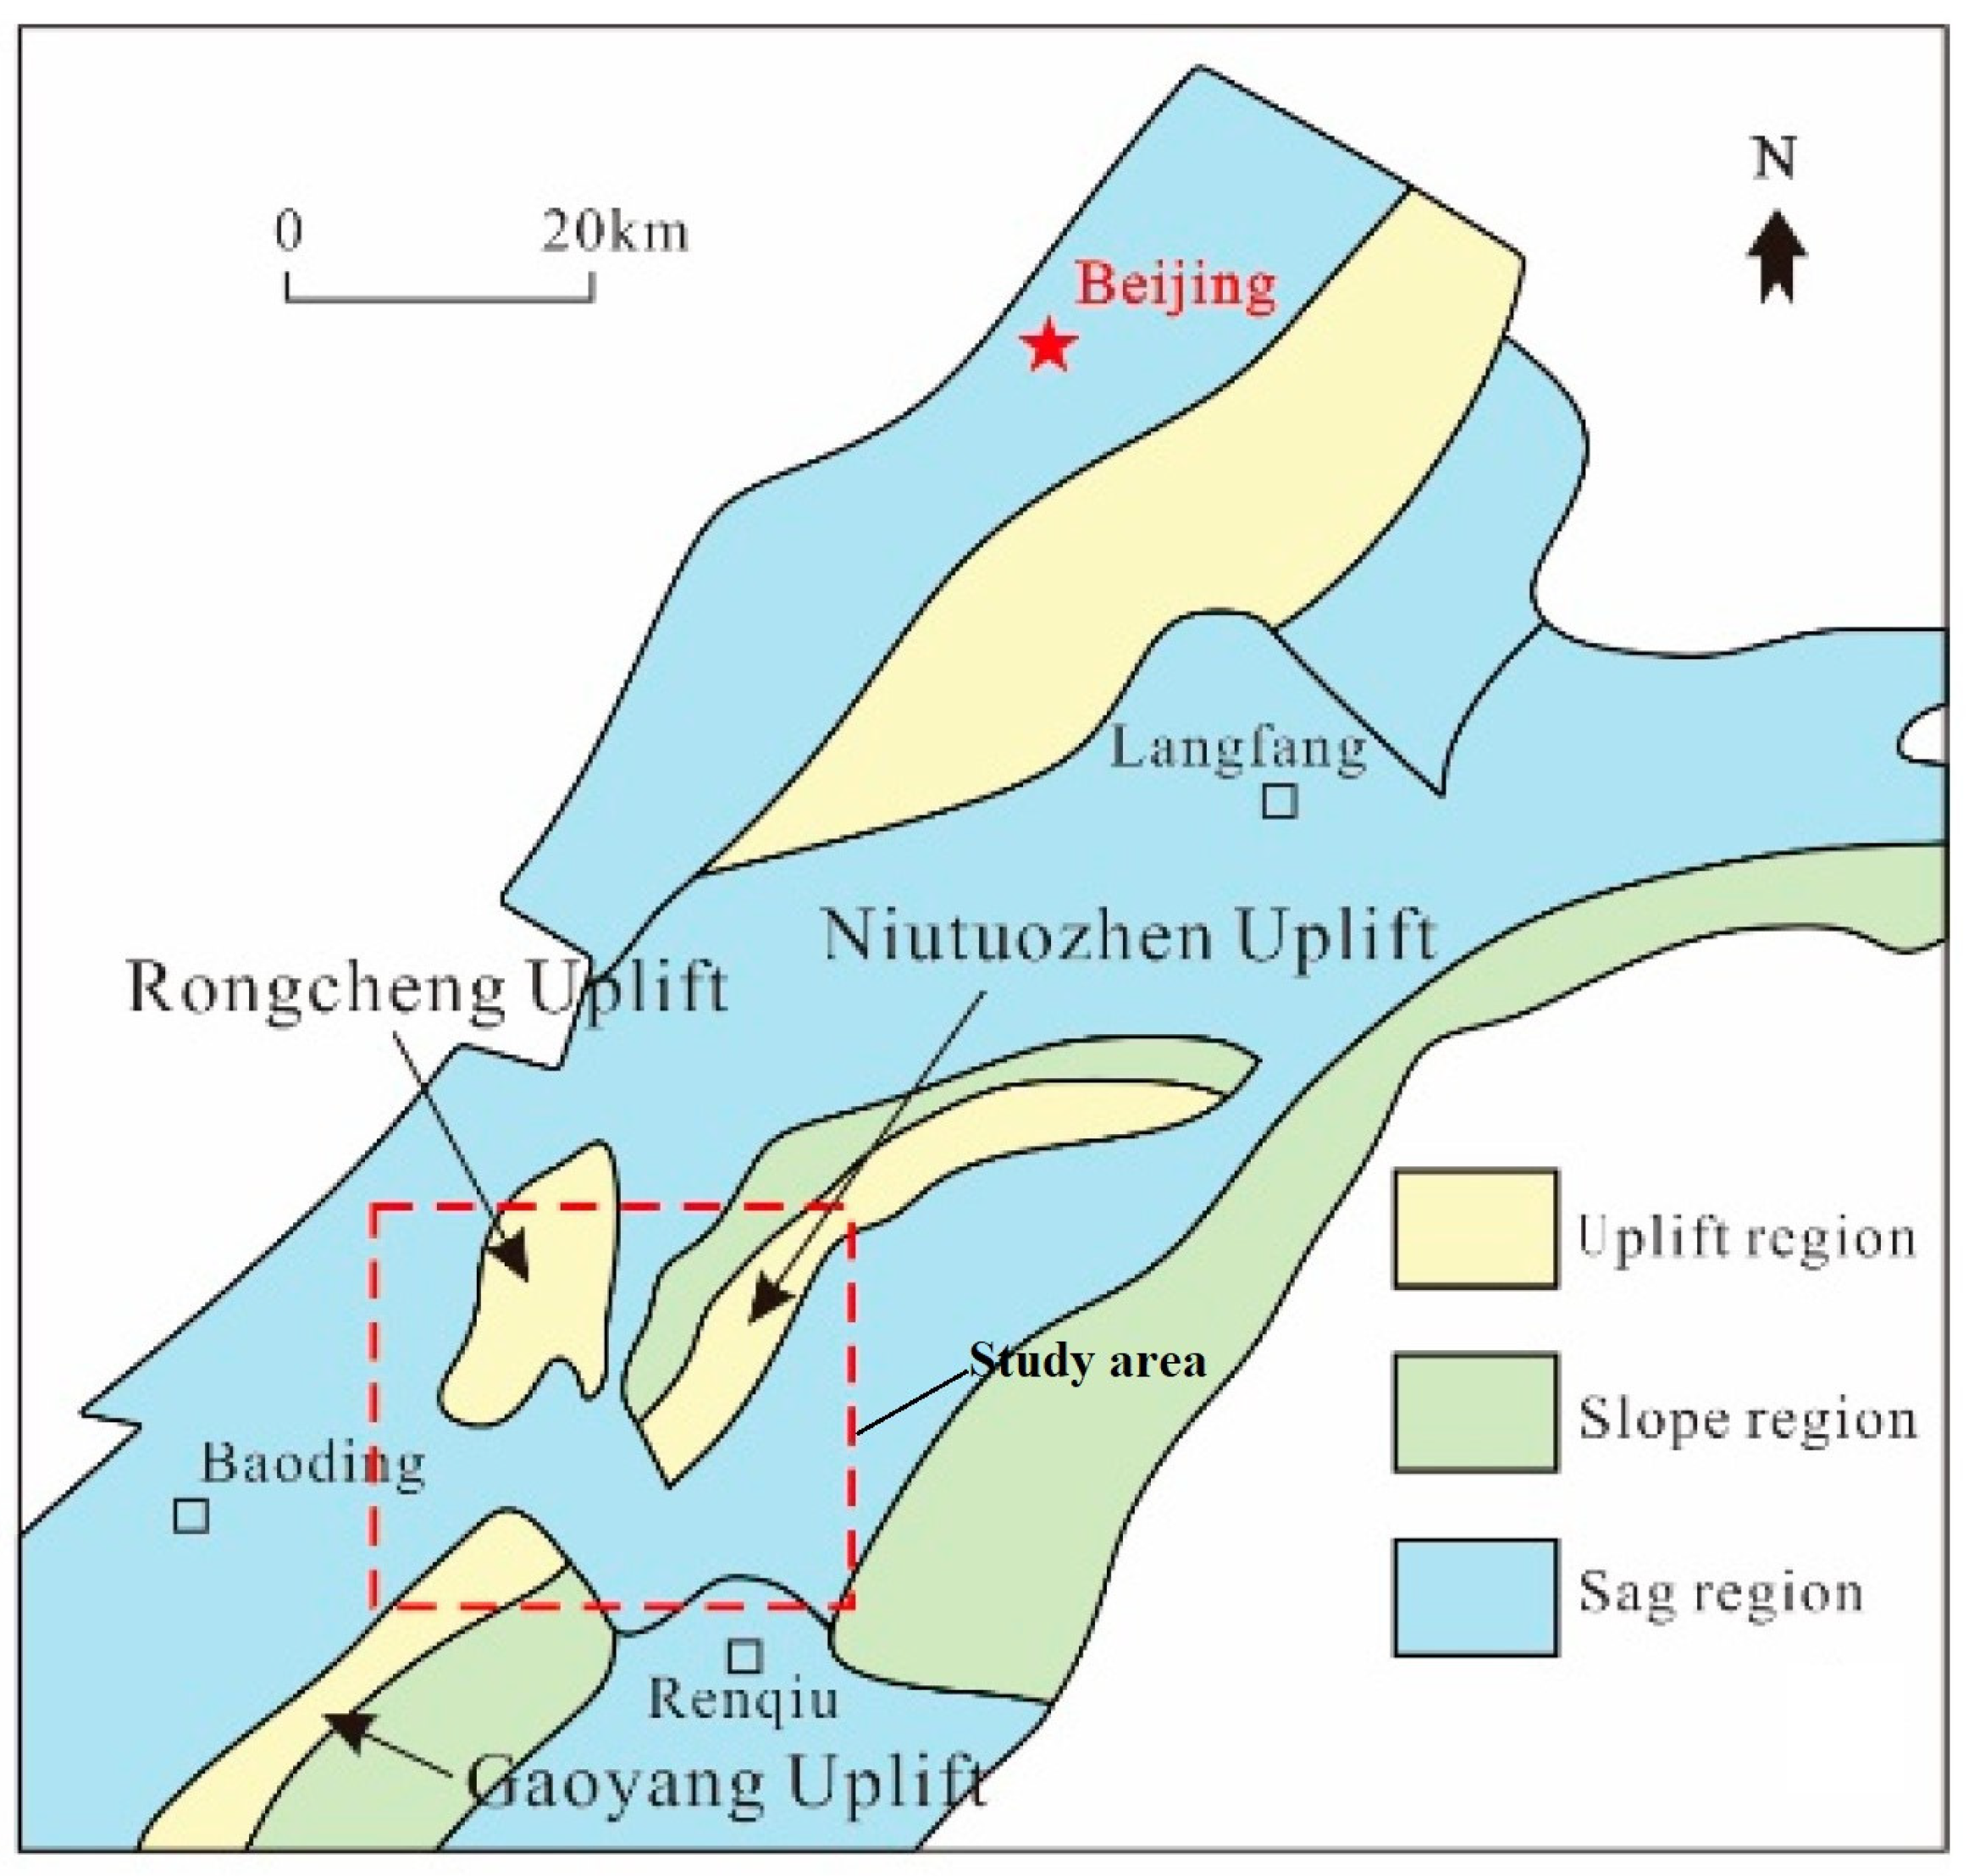
The target area of this study is the northernmost part of Baiyangdian in Xiongxian, Anxin and Rongcheng counties, Hebei Province. It is located in the southwest of the prominent elevation in Niutuo Town, situated in the hinterland of the Beijing–Tianjin–Baoding triangle. The Niutuo Town elevation is in the northeast part of the Jizhong Depression, constrained by the Niudong Fault, Rongcheng Fault and Niunan Fault, surrounded by depressions. It has a NE (northeast, 45°) to NNE (northeast, <45°) trend, forming an arc. The western part is the Rongcheng elevation, the northern part is the Langfang-Gu’an depression and the northeast and east are the Wuqing and Baxian depressions. The southern part includes Raoyang, the Gaoyang elevation and Baoding depression (Figure 1). Intense geological tectonic movements have caused geothermal anomalies in the region. The central part of the Niutuo Town elevation has bedrock buried at an average depth of about 1000 m, with the shallowest depth in Daying Town, where the burial depth of the Wumishan Formation is 493.85 m. Through depressurization experiments on multiple geothermal wells on-site, the burial depth of groundwater is determined to be between 23.3 and 71.24 m.

Figure 1.
Geological structure sketch map of the study area [25].
2.2. Characteristics of the Geothermal Field
According to geological survey results, the distribution of shallow surface temperature is positively correlated with the undulations of the bedrock surface. At the same depth, the temperature in elevated areas is higher than in depressed areas. Groundwater activity has a significant impact on the temperature field near the piedmont plain and active fault zones, while the influence of magmatic activity is limited to local areas where large-scale magmatic activity has occurred recently. The vertical temperature field is related to the lithology of the formation because different rock thermal conductivities lead to different temperature gradients. The average temperature gradient in the Niutuo Town elevation caprock is 3.0–8.0 °C/100 m, with a general trend of high temperatures in the southwest and low in the northeast, high temperatures in the axial part and low on both sides [26]. The distribution trend of temperature gradients reflects the close relationship between the temperature distribution and the tectonic morphology of the Niutuo Town elevation. Regions with high geothermal gradients are in line with tectonic uplifts or bulge positions.
3. Mathematical Modeling
3.1. Water and Heat Coupling in Reservoirs
In high-temperature reservoirs, there exists a temperature field, typically with higher temperatures at greater depths due to the geothermal gradient [27]. This temperature difference caused by the geothermal gradient leads to heat transfer from high-temperature areas to low-temperature areas, forming heat conduction. By describing this process using mathematical methods through a heat conduction differential equation and its boundary conditions, a three-dimensional unsteady-state heat conduction differential equation can be obtained [28] as follows:
where is the thermal conductivity of the fluid (W/(m·K)), is the rate at which heat is generated per unit volume (W/m3), is the density of the heat transfer medium (kg/m3), c is the specific heat capacity (J/(kg·°C)) and T and t are temperature (°C) and time (s).
On the other hand, the heat transfer process between lower-temperature fluids and higher-temperature rocks and soils is a convective heat transfer phenomenon. The convective heat transfer between fluid and solid can be characterized using Newton’s cooling formula, as shown in Equation (2):
where Q is the heat flux density (W/m2), A is the contact area between fluid and rock (m2) and is the temperature difference between fluid and rock (°C).
Combining Equations (1) and (2), Equation (3) describing the flow state and temperature distribution of the fluid during the flow process can be obtained.
Continuity equation:
Momentum differential equation:
Energy differential equation:
where represent the velocity vector (m/s). and represent the volume force component in the and -directions (N), is the motion viscosity coefficient of the fluid (m2/s) and is the specific heat capacity.
3.2. Model Parameters
The geological parameters of the numerical model are obtained based on the drilling results of the target site. Parameters such as lithology, porosity, permeability, density and thermal conductivity obtained from drilling data are generalized in the vertical direction into eight geological layers. The specific thicknesses and parameters of each layer are shown in Table 1. Considering the impact scope of the temperature field based on previous numerical studies of hydrothermal geothermal values, the depths of wells in this simulation were around 1200 m. The deepest layer in this model was set at 1800 m. The distances from production and injection wells to the lateral boundaries were both greater than 500 m, effectively eliminating the influence of lateral boundaries on the performance of geothermal exploitation during the geothermal extraction process. To simulate the disturbance of reservoir fluid flow on the surrounding temperature field during the production process as much as possible and minimize the simulation time, the model’s length, width and depth were set to 3200 m × 3600 m × 1800 m, as shown in Figure 2. An irregular method was used to partition the numerical model, with enhanced resolution around production and injection wells, resulting in a total of 39,080 grids. The numerical simulator used was TOUGH2 (V2), which allows for dynamic evaluation of the development and utilization of geothermal resources [29]. TOUGH2 is a universal numerical simulation program used to simulate multiphase fluids and heat flows in porous fractured media. It belongs to the MULKOM code family and was developed by Lawrence National Laboratory for use in geothermal storage engineering, nuclear waste treatment, gas zone hydrology, geology and carbon dioxide storage (carbon storage) [30]. Figure 2 illustrates the establishment of the geothermal well irrigation numerical model.

Table 1.
Distribution and parameters of the geological layers.
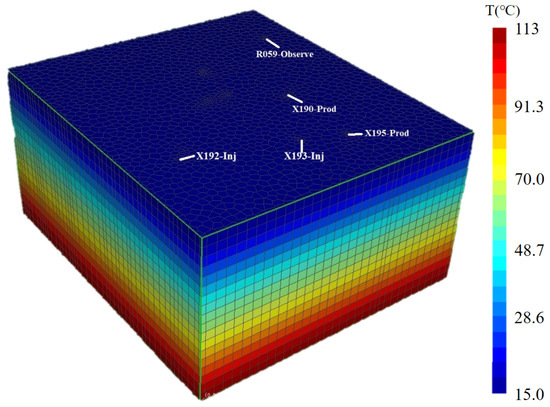
Figure 2.
The establishment of the geothermal well irrigation numerical model.
The target study area has a total of five geothermal wells available, as shown in Figure 3. According to the overall project plan and actual site conditions, the “double production and double injection” extraction mode is adopted in this study. Wells X192 and X190 are a set of extraction and reinjection wells. Wells X193 and X195 are another set of extraction and reinjection wells. R059 serves as a monitoring well, with its temperature data used for model verification and extraction optimization. The specific extraction and irrigation allocation as well as geothermal well parameters are shown in Table 2.
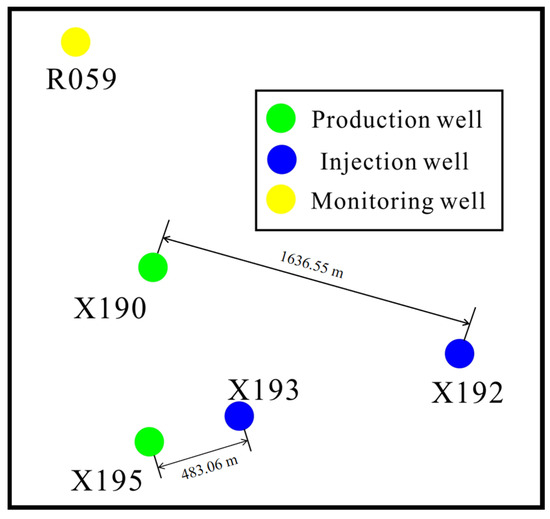
Figure 3.
Schematic map of the distribution of geothermal wells in the study area.
Table 2.
Parameters of the geothermal wells.
3.3. Initial and Boundary Conditions
The initial water pressure in the reservoir was set according to static water pressure. The top and bottom of the model were set to be impermeable, while the sides were set as pressure boundaries. The initial water pressure inside the wellbore was equal to the static water pressure. After the reinjection began (t > 0), a flow boundary was set at the wellhead.
The initial temperature field of the model was set based on the temperature gradient (∆T). The top of the model was set to the average ground temperature (Ts = 15 °C) in the study area. The bottom borehole was set to be thermally insulated and the sides were open boundaries. The initial temperature inside the wellbore was consistent with the surrounding rock. After reinjection began (t > 0), the temperature at the wellhead was set to Tin.
where: —the ground temperature (K);
—ground gradient (K/m);
—reinjection temperature (K).
The thermal flux at the wellhead of the production well was set as follows:
At the interface between the wellbore and the reservoir rock, the mass flux was applied to the inner boundary of the reservoir as follows:
where: —mass flux (kg/m/s);
—Bare well length (m);
q—Flow rate (m3/h).
The heat source at the inner boundary of the reservoir was set as follows:
where: —the temperature of the bare section of the reinjection well (K).
According to the winter heating characteristics of Xiong’an New Area, the heating duration was set to 4 months per year (from 15 November to 15 March) and the pump was stopped during other times to allow the bottom of the well to undergo thermal recovery. According to the project’s design and planned service life, the total simulation time for this study was 20 years.
4. Field Tests
4.1. Geothermal Well Monitoring
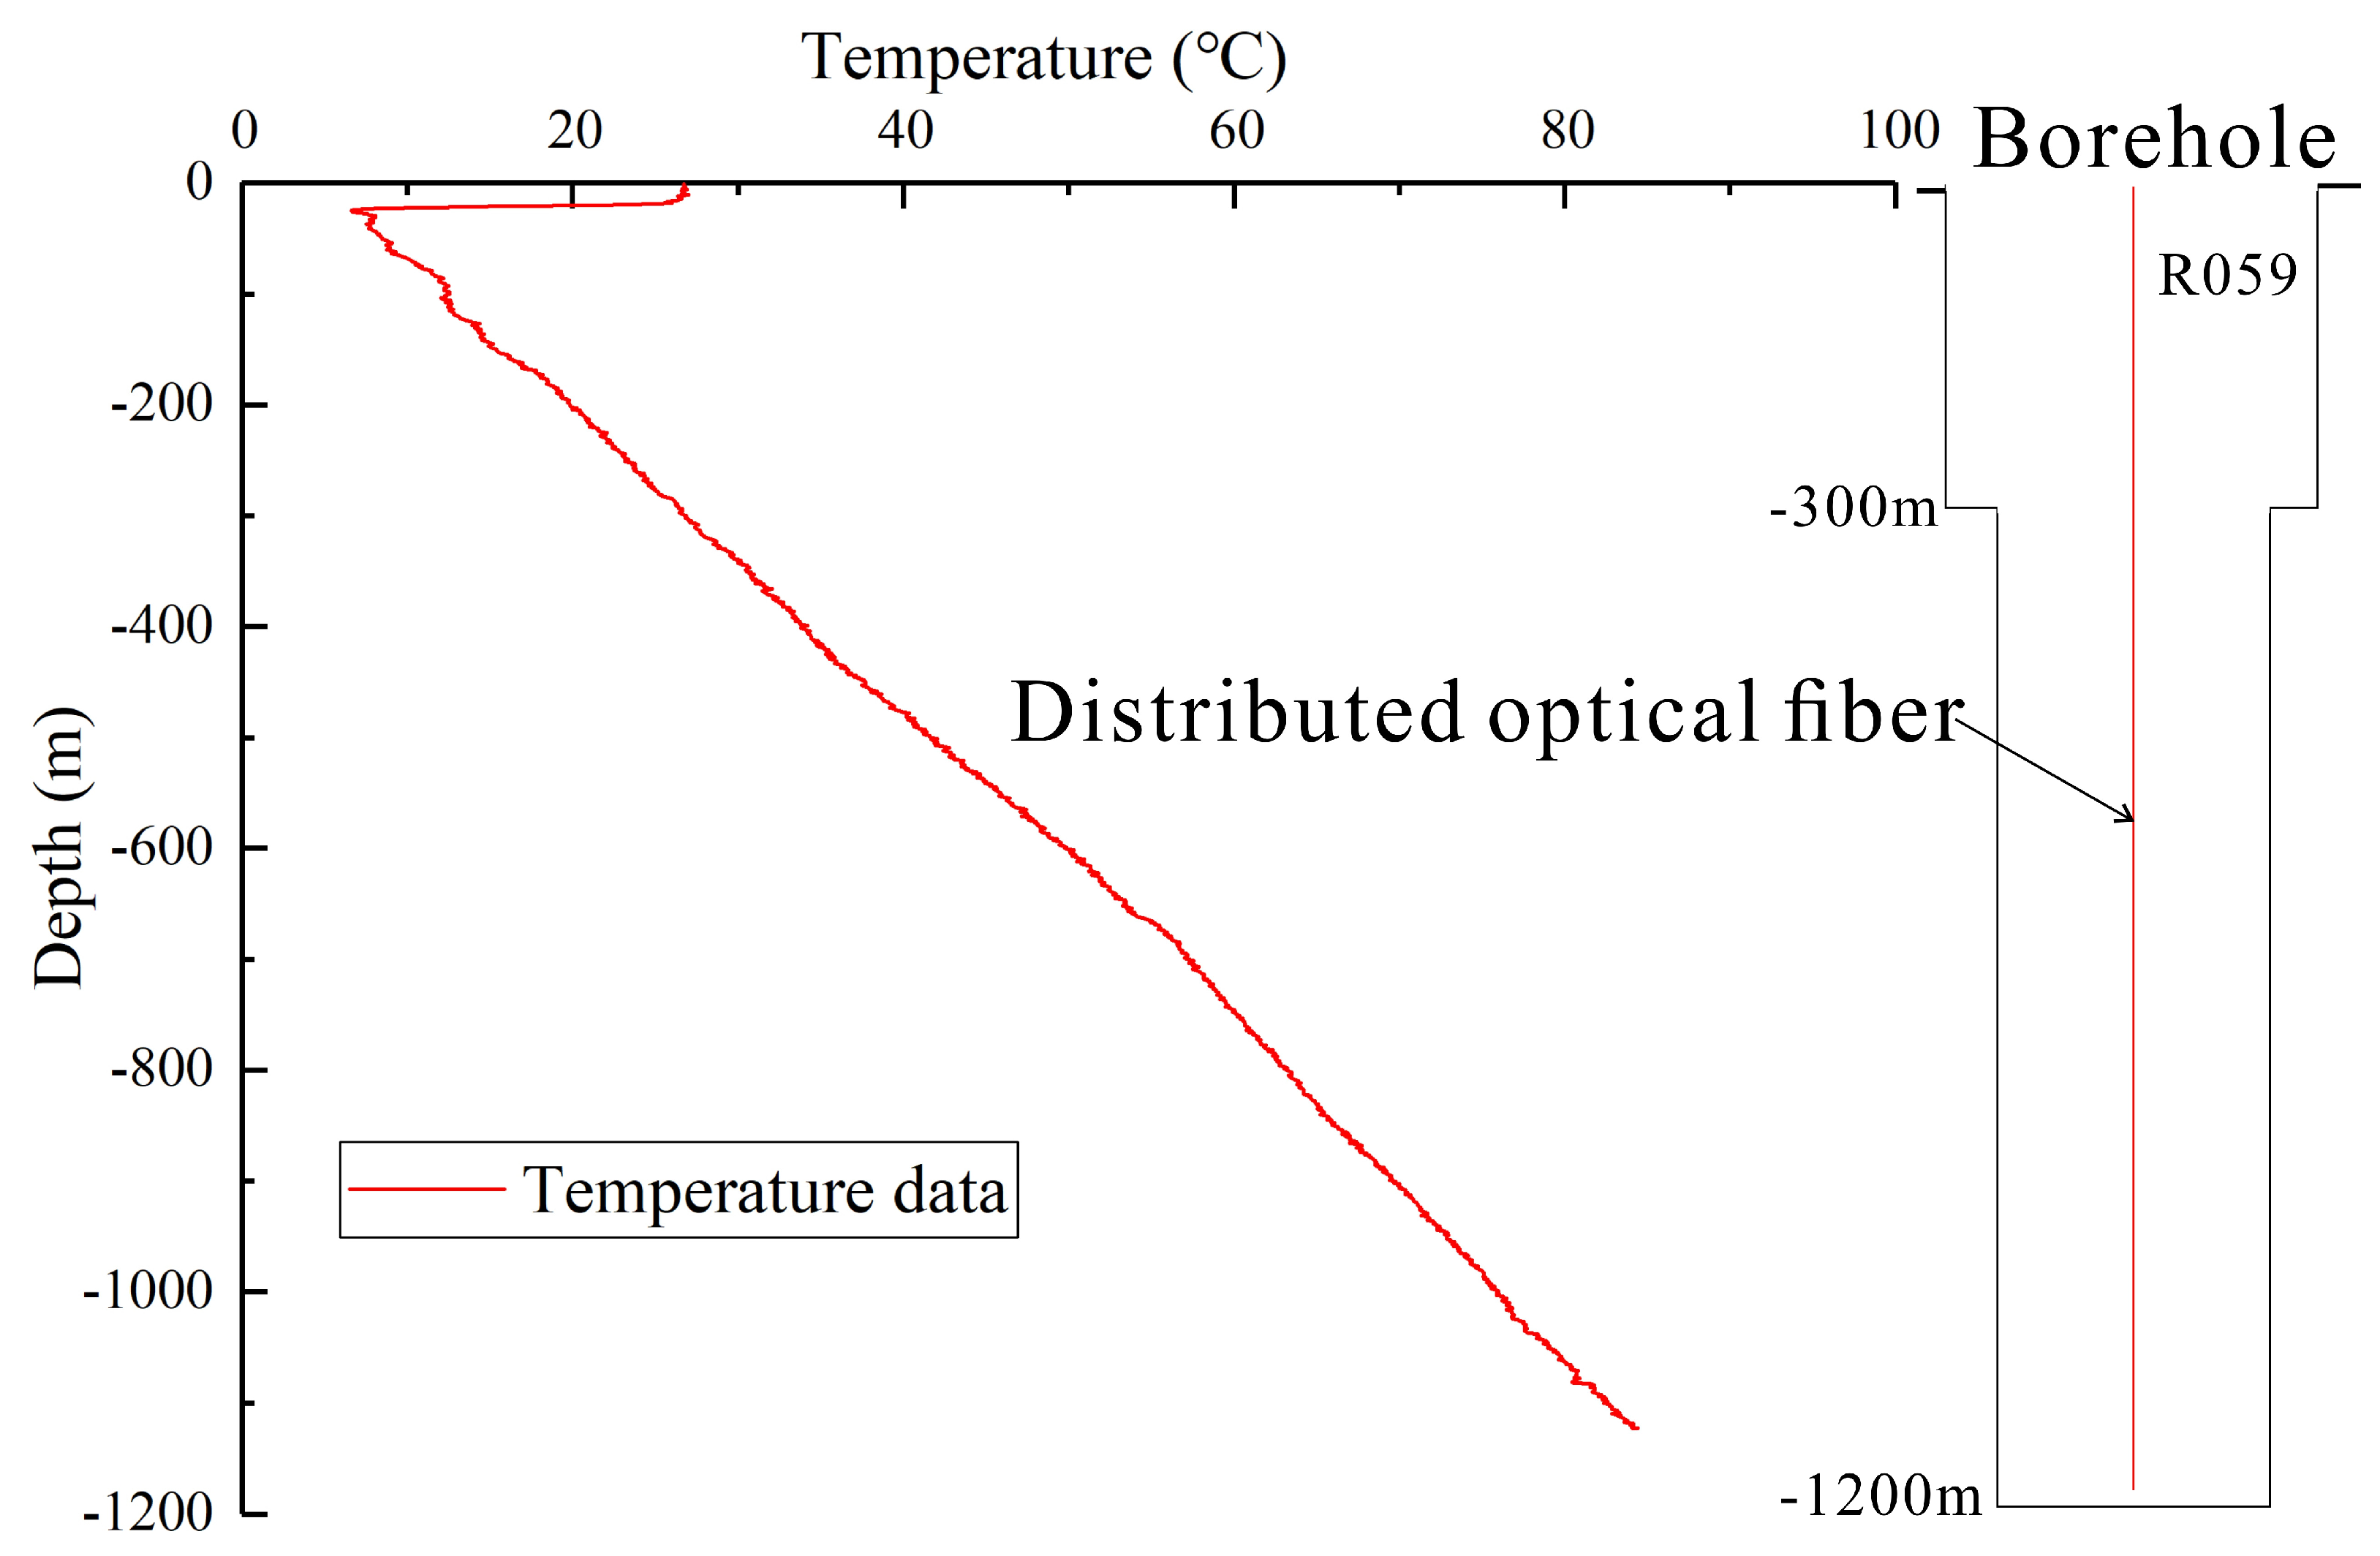
To further determine the temperature evolution of the geothermal field during the extraction and injection process of geothermal wells, a distributed fiber optic temperature sensor was used to conduct long-term monitoring of geothermal wells and analyze the dynamic temperature response law under extraction and injection conditions. A distributed fiber optic temperature measurement system is usually composed of a fiber optic, laser light source, optical splitter, photoelectric signal receiving processor and a display device. The fiber optic is based on the principle of Raman scattering and an optical time-domain reflectometer, and reflects the evolution of temperature along space and time through the scattering effect of light. Therefore, the entire depth of the fiber optic can be regarded as a temperature sensor. The fiber diameter in this device was 62.5 μm. The measurement range was −50~150 °C, with a resolution of ±0.1 °C and a depth positioning accuracy of ±1 m. It was used to monitor the evolution of fluid temperature over time in the annular area.
The observation well R059 was used for temperature monitoring using a DBDTS-2000 (manufactured by Tianjin Xingtong Jiuheng Technology Co., Ltd., Tianjin, China) distributed fiber optic temperature measurement system. The temperature evolution with the depth and time of the well R059 was obtained during the operation and intermittent periods. The evolution of the geothermal gradient in monitoring well R059 is shown in Figure 4. The temperature at the bottom of the well was 85 °C. The study area has superior ground temperature conditions. The temperature monitoring results can provide a basis for model establishment and validation.
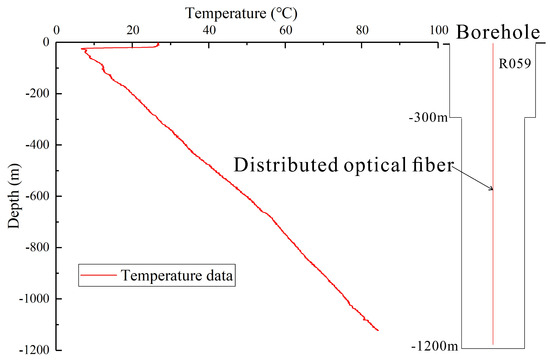
Figure 4.
Distributed optical fiber measurement and temperature distribution in geothermal wells.
4.2. Model Verification
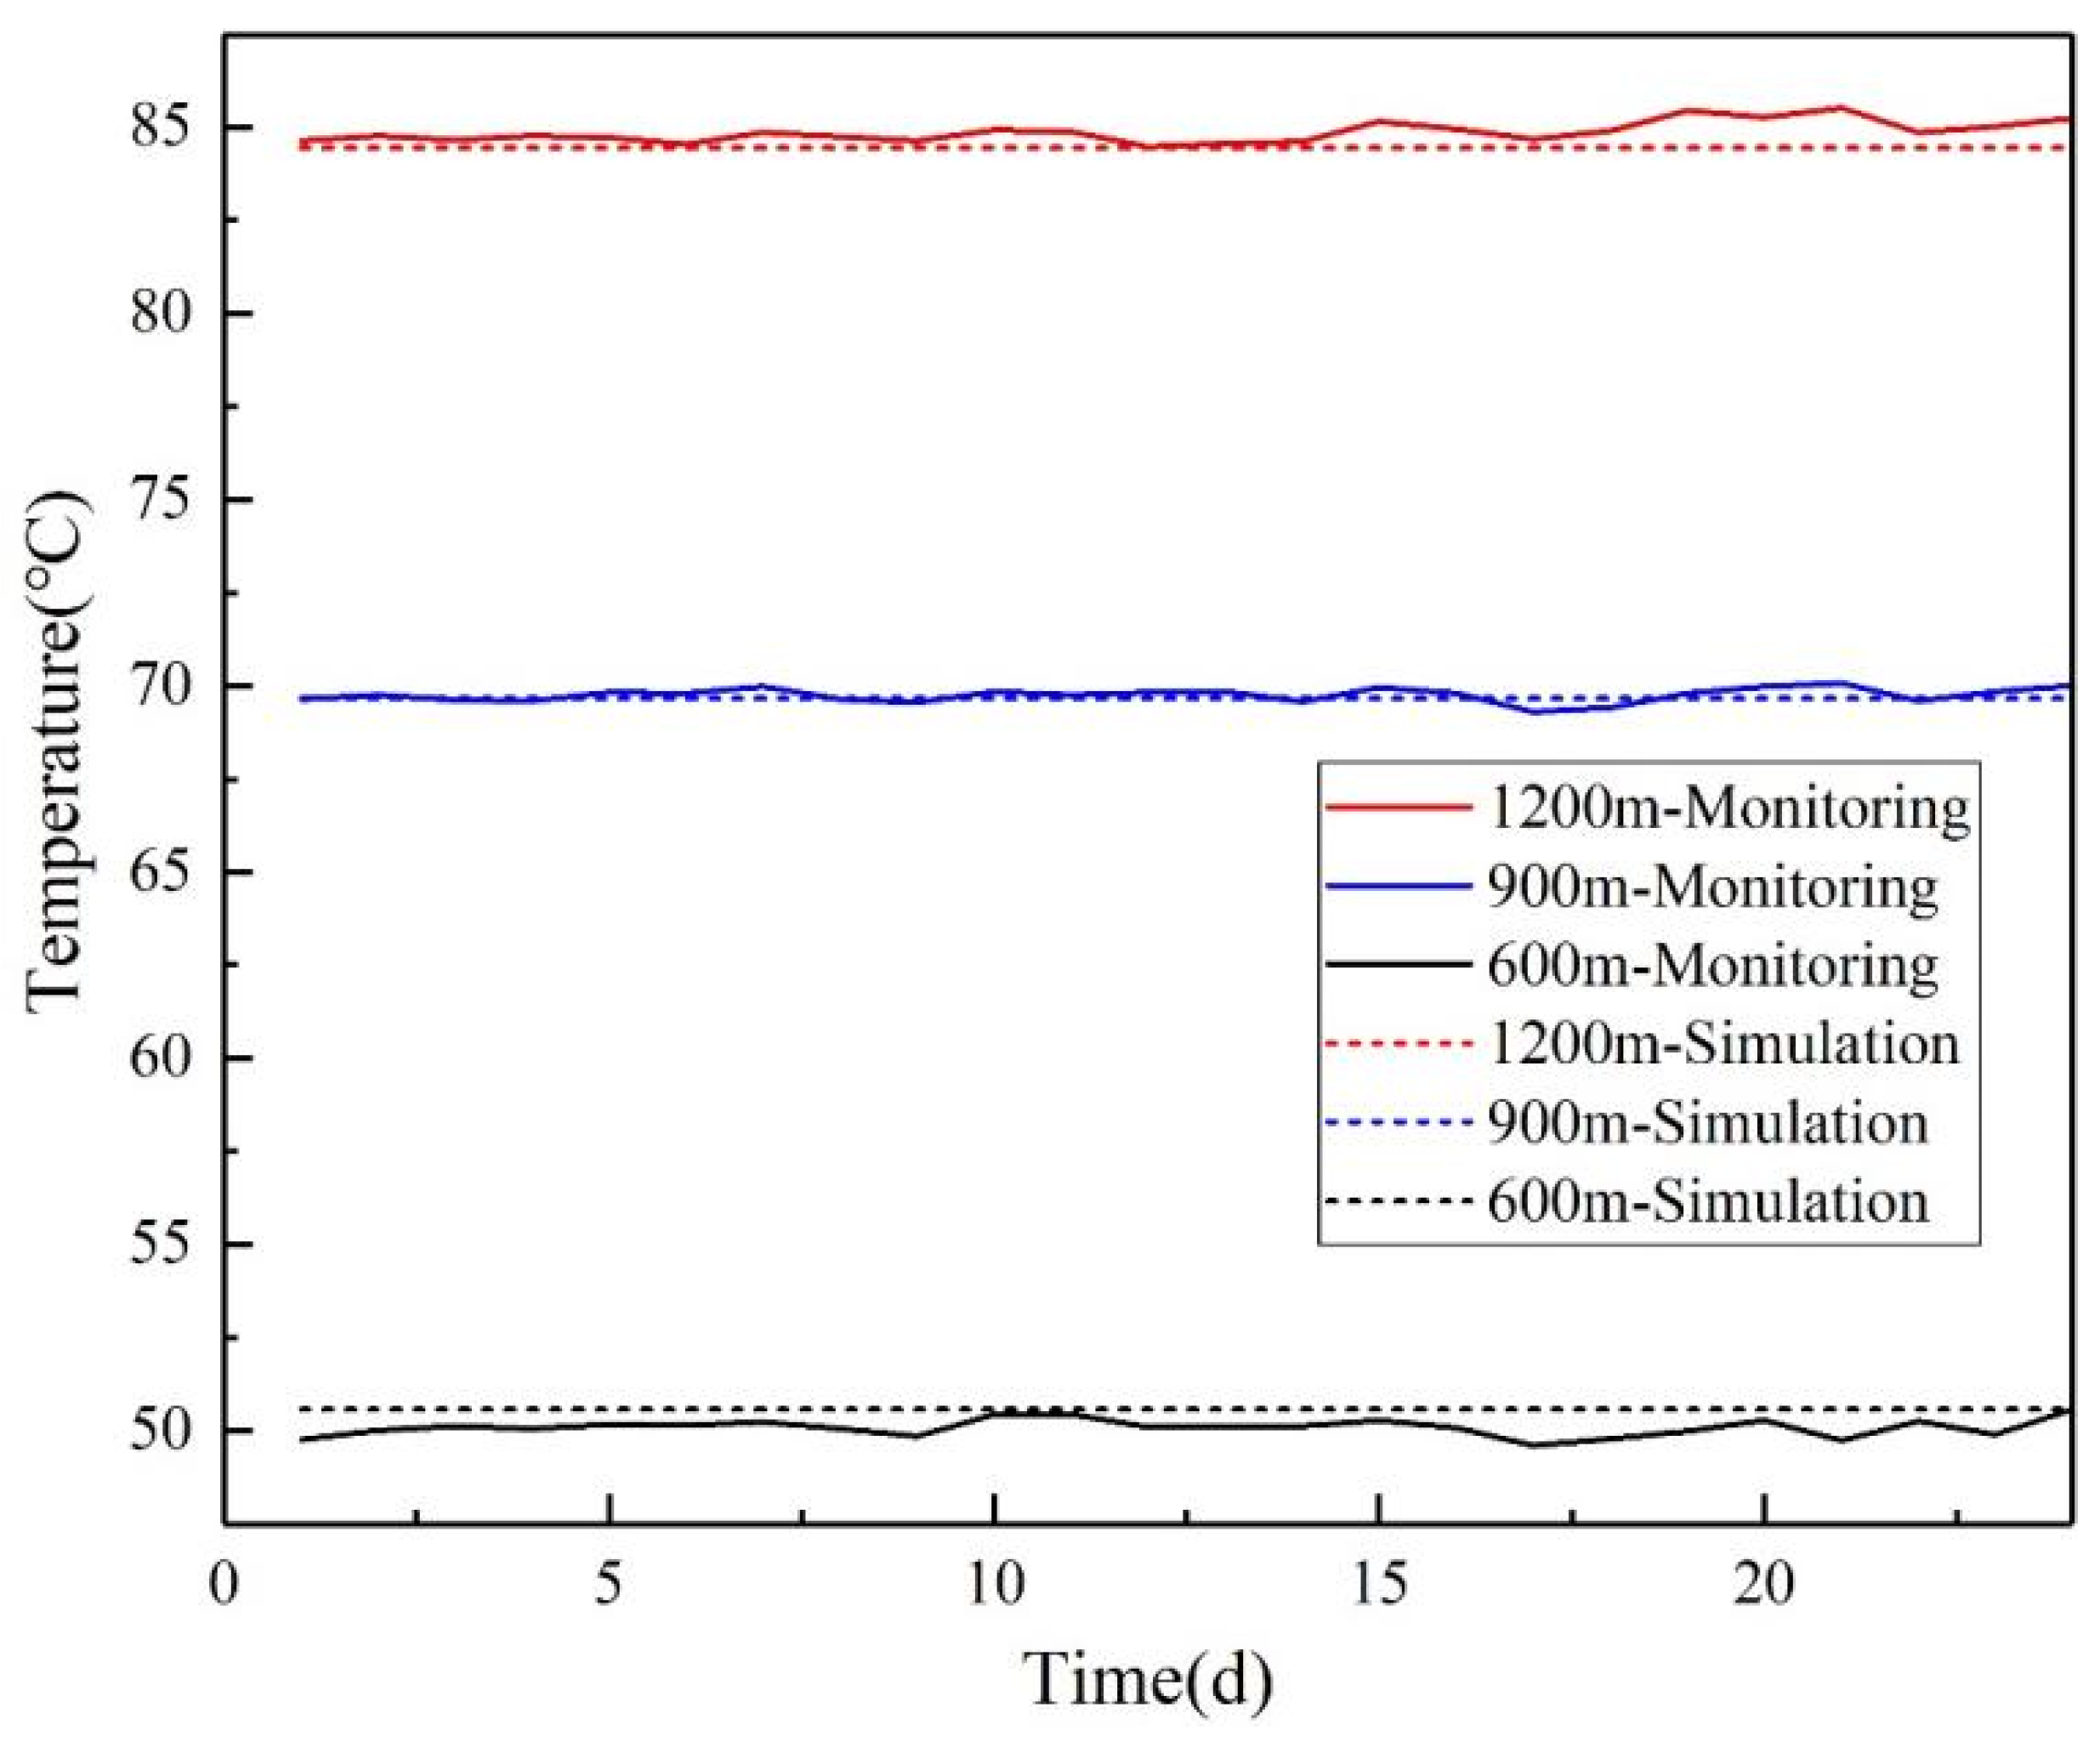
After a numerical model is established, it needs to be checked for accuracy. Thus, numerical simulation results need to be compared and verified with field test data. After the completion of drilling in the geothermal wells, heat extraction was carried out. The temperature evolution was measured based on the distributed fiber optic sensors. In this model verification process, the extraction and injection rates were set to those during the heat extraction, with a runtime of 30 days. Temperature data at depths of 1200 m, 900 m and 600 m were compared with the monitoring temperature. The temperature evolution at different depths in the monitoring well compared with the simulated results at the corresponding locations is shown in Figure 5.
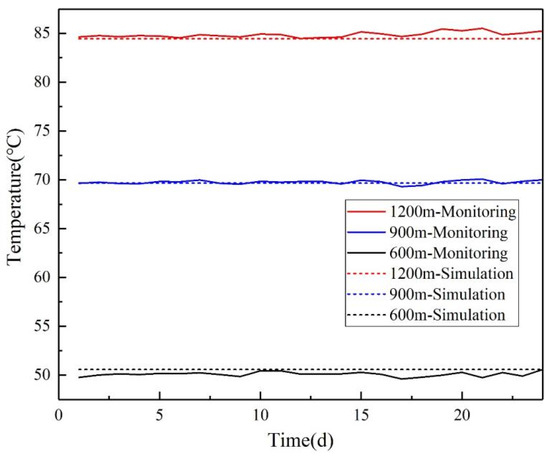
Figure 5.
The comparison of simulated and monitored temperature data at different depths in observation well R059.
It can be seen that the fitting effect of on-site monitoring data and numerical simulation results at different depths is good, with errors not exceeding 5%. This indicates that the model has a certain reliability for conducting numerical simulation research. Therefore, this numerical model can be used for subsequent analysis and research on geothermal extraction and irrigation.
5. Results and Discussion
The effects of factors such as reinjection temperature, reinjection rate and reinjection ratio on the temperature field of the reservoir based on the numerical simulation methods (horizontal impact radius and depth), as well as the impact on outlet temperature, changes in groundwater level and flow impedance are analyzed in the geothermal field. The impacts of various parameters of geothermal wells on long-term operation are discussed.
5.1. Effect of Reinjection Temperature
After extracting underground hot water from production wells, it gradually cools during the process of heating buildings. Previous studies have shown that residual heat in geothermal tailwater can reduce disturbances in the reservoir temperature field and increase the outlet temperature of production wells. The reinjection temperature of geothermal tailwater is mainly controlled by the heating system design. To quantitatively investigate the impact of reinjection temperature on the performance of geothermal exploitation systems, reinjection temperatures of 25, 30, 35 and 40 °C were considered. The impacts of different reinjection temperatures on the temperature field and extraction efficiency were analyzed.
The reinjection rate of the injection well was 30 kg/s, and it is considered that the tailwater after heat exchange was completely reinjected. The variation of the outlet temperature after operating for 20 years is shown in Figure 6.
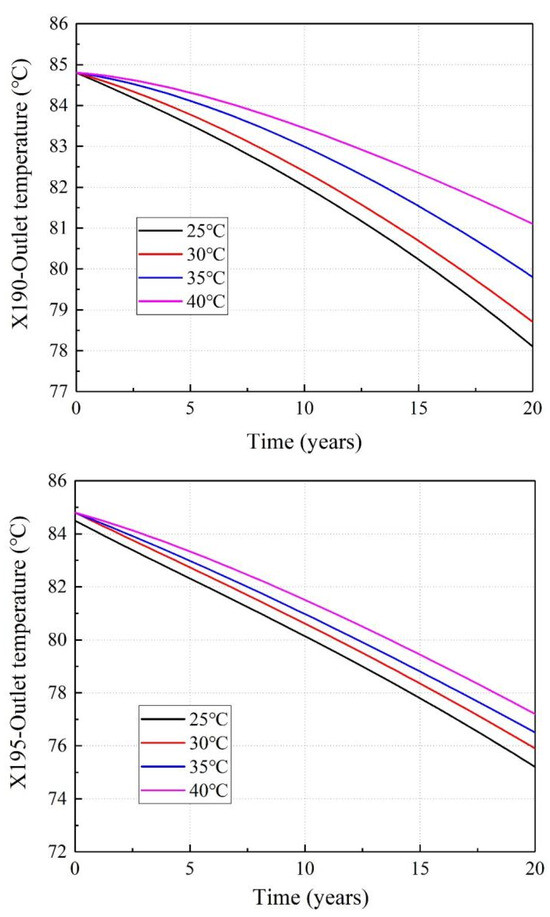
Figure 6.
Evolution of outlet temperatures for production wells X190 and X195.
Figure 6 shows the evolution of outlet temperatures with time for production wells X190 and X195 at different reinjection temperatures. Overall, the outlet temperature of well X190 was consistently slightly higher than that of X195. This is because the low-temperature fluid flowing into well X190 follows a longer path, absorbing more heat within the reservoir, resulting in a higher outlet temperature. As the reinjection temperature increases, the corresponding outlet temperature also increases. For example, in the case of well X190, with an increase in reinjection temperature, the outlet temperatures after 20 years were 78.1 °C, 78.7 °C, 79.8 °C and 81.1 °C, respectively. These results indicate that raising the temperature of reinjected water can ensure the quality of the produced hot water.
Since the depth of the four wells was generally around 1100 m, the temperature field at a depth of 1100 m underground was selected to represent the effect of different reinjection temperatures, as shown in Figure 7. As the reinjection temperature increases, the temperature impact range around the production wells gradually decreases. For well X192, with an increase in the reinjection temperature, the temperature impact scopes after 20 years were 210.3, 198.5, 185.6 and 179.3 m, respectively. This result indicates that raising the reinjection temperature can reduce temperature disturbances in the reservoir during the production process, ensuring the continuous operation of geothermal production activities. According to engineering experience, a reinjection water temperature of around 25 °C is the lower limit reached. Therefore, low-temperature reinjection water will not have a significant impact on this project.
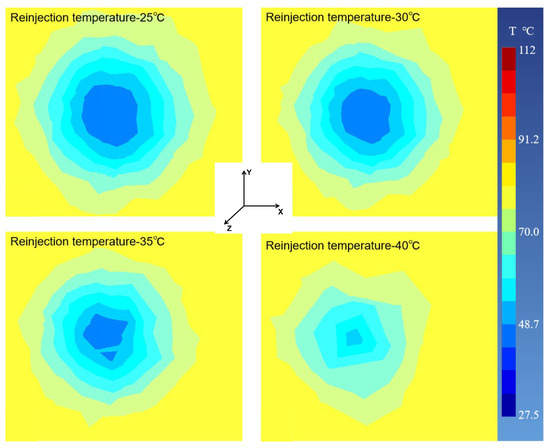
Figure 7.
Variation of the temperature field at the bottom of well X192 for different reinjection temperatures.
5.2. Effect of Reinjection Rates
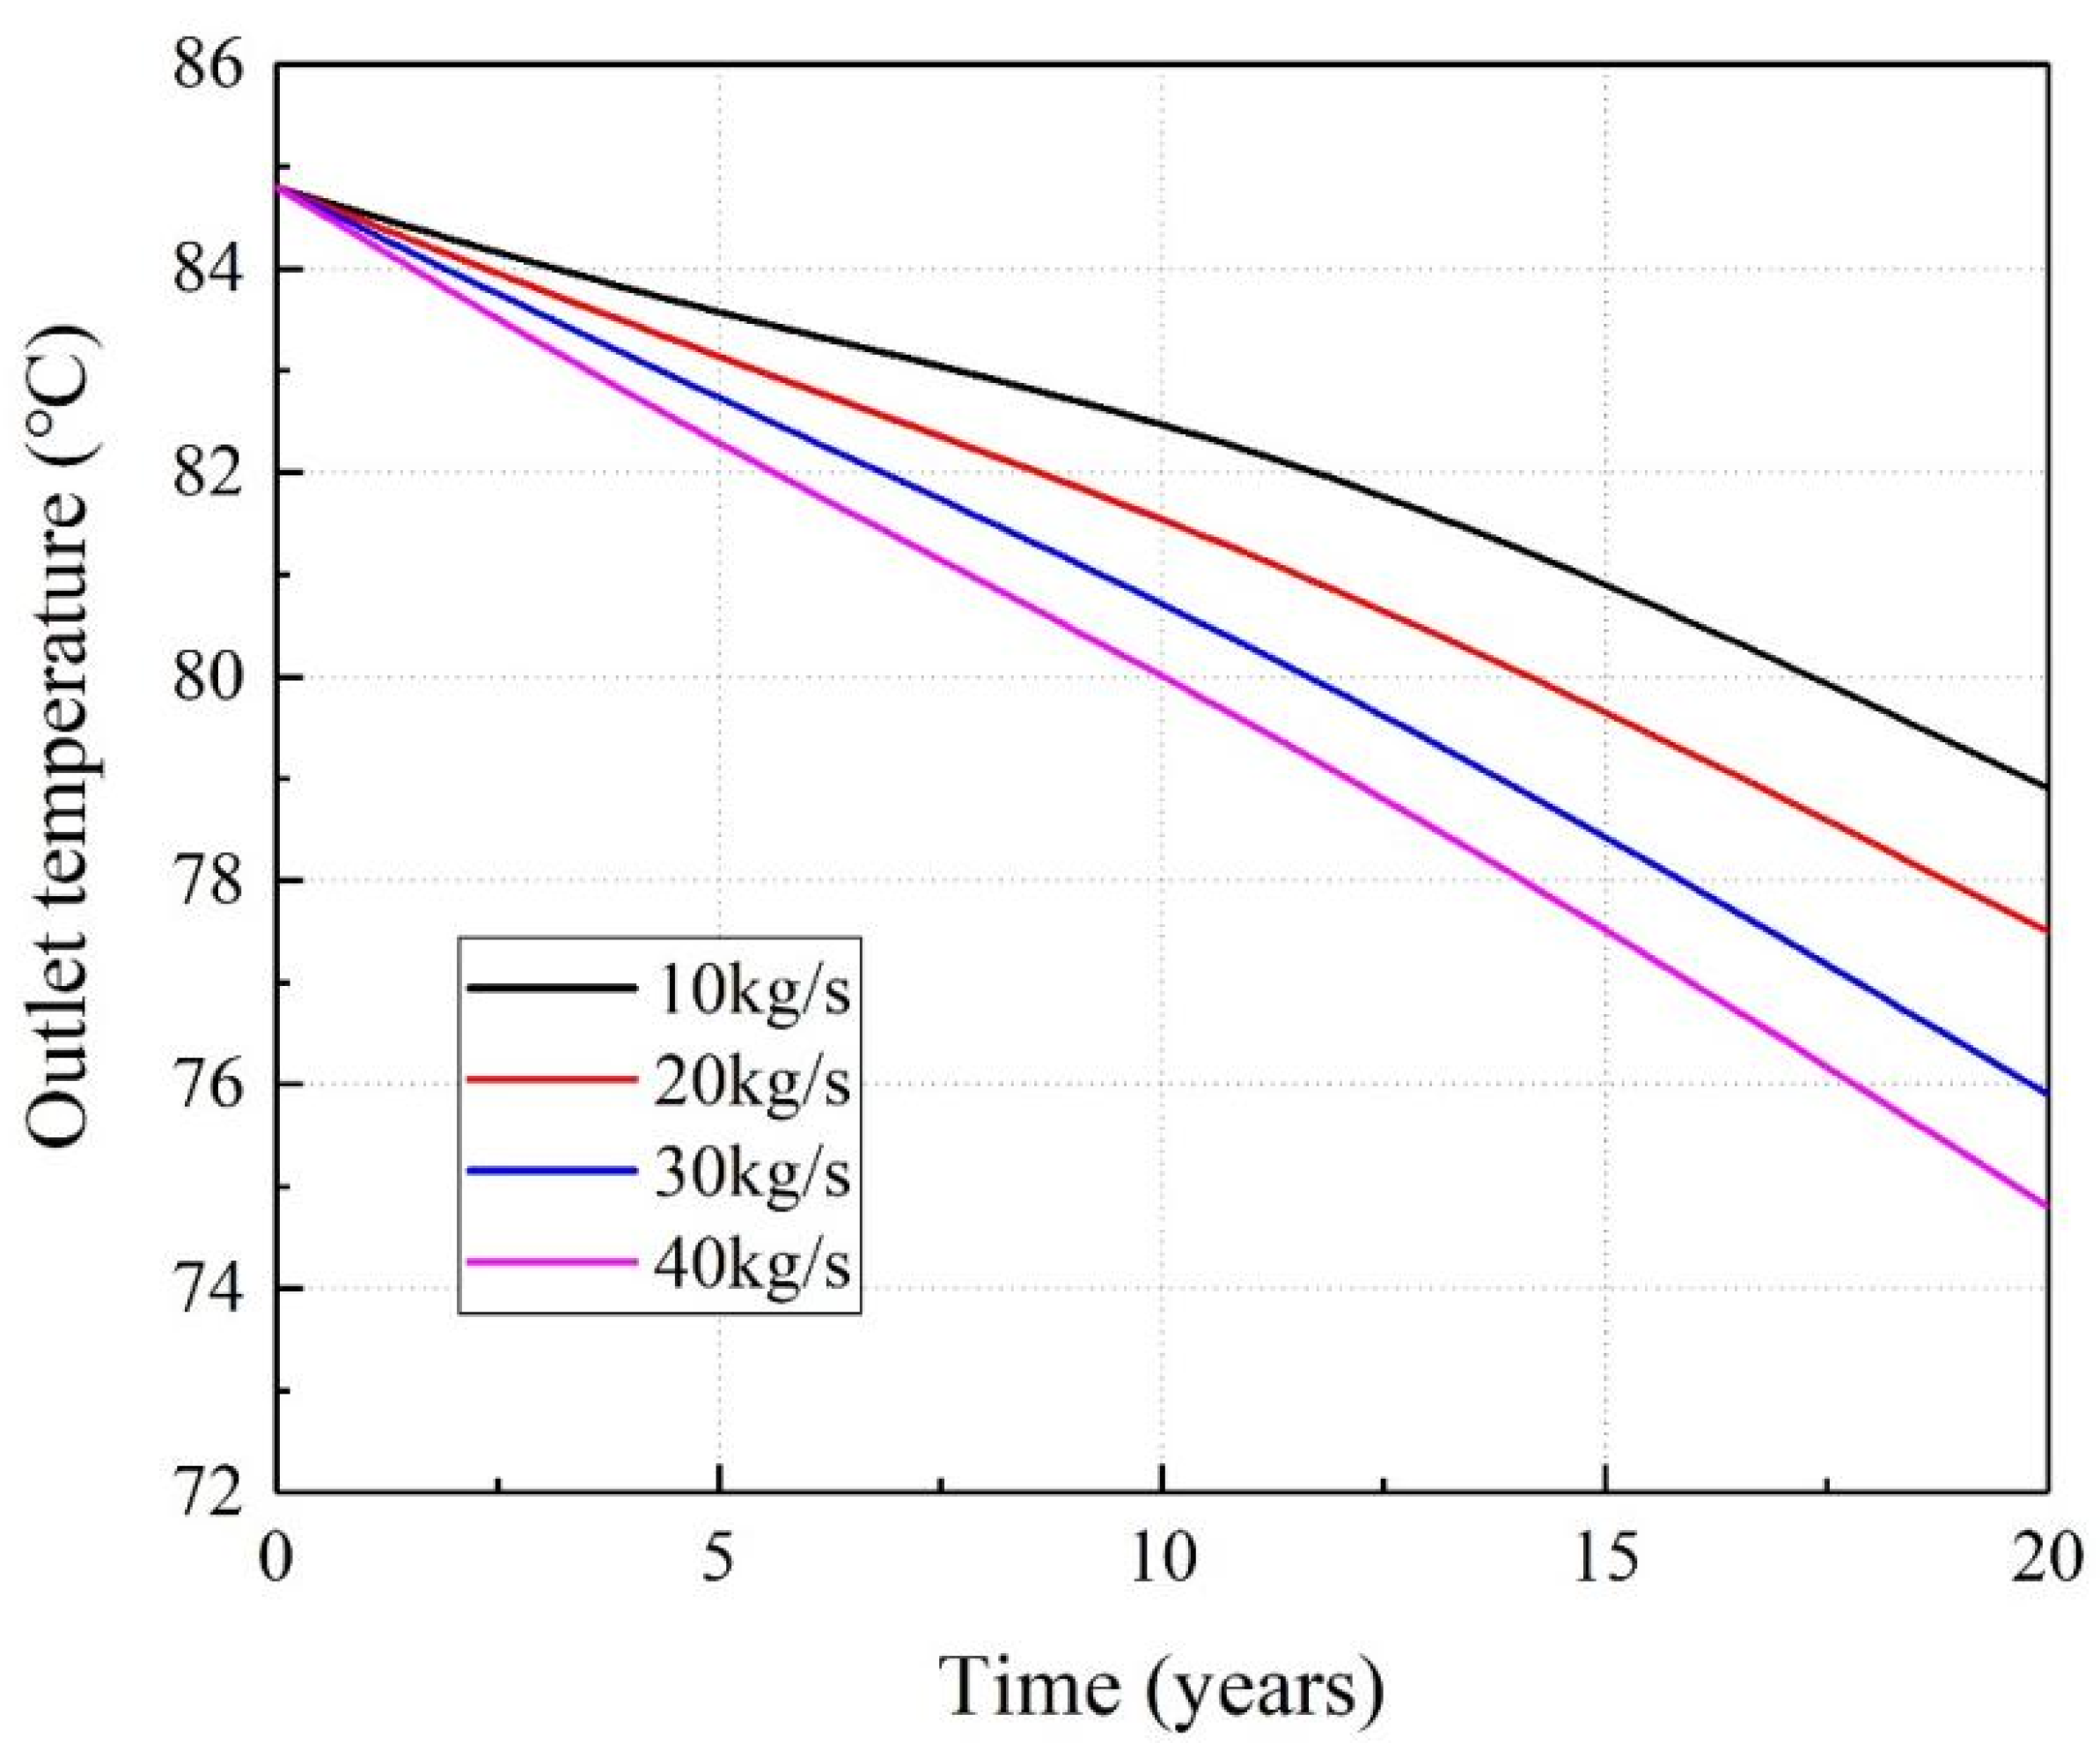
Increasing the fluid reinjection rate during the extraction process can significantly enhance the production of hot water. However, due to the limitations of geothermal reservoir conditions, extracting large quantities of geothermal fluid in a short period can substantially alter the underground temperature field. Therefore, it is essential to control the reinjection rate within a reasonable range. Based on the geothermal well extraction experiences in the Xiong’an region, the reinjection rates were set at 10, 20, 30 and 40 kg/s during the operation process to analyze the effects of different reinjection rates. To better illustrate the impact of different injection rates on the reservoir, tailwater of 30 °C was set in the simulation. And a 100% reinjection ratio was considered.
Figure 8 demonstrates that, compared to different reinjection temperatures, the reinjection rate has a more significant impact on the outlet temperature of the production well. The trend of outlet temperature during the extraction process shows that as the reinjection rate increases, the outlet temperature decreases. After 20 years of operation, the outlet temperatures for well X195 were 78.9 °C, 77.5 °C, 75.9 °C and 74.8 °C, respectively. This result indicates that accelerating the injection of cold water and the extraction of hot water weakens the heating capacity of the reservoir, causing the cold water injected into the reservoir to not be fully heated before being extracted to the surface, gradually leading to a decrease in outlet temperature. It also shows that the main extraction was of the pre-existing high-temperature fluid in the reservoir, so reinjecting water did not have a significant impact on the outlet temperature.
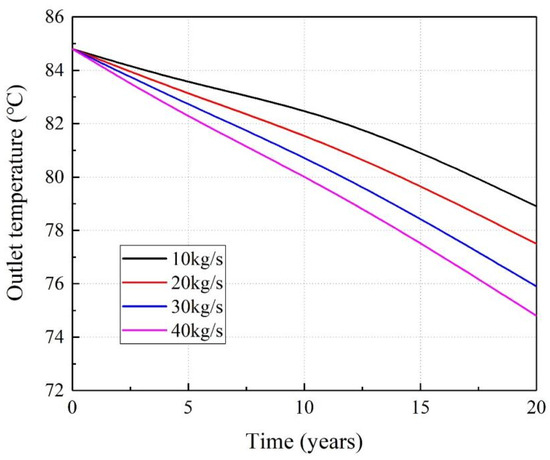
Figure 8.
The variation of the outlet temperature of production well X195 with time.
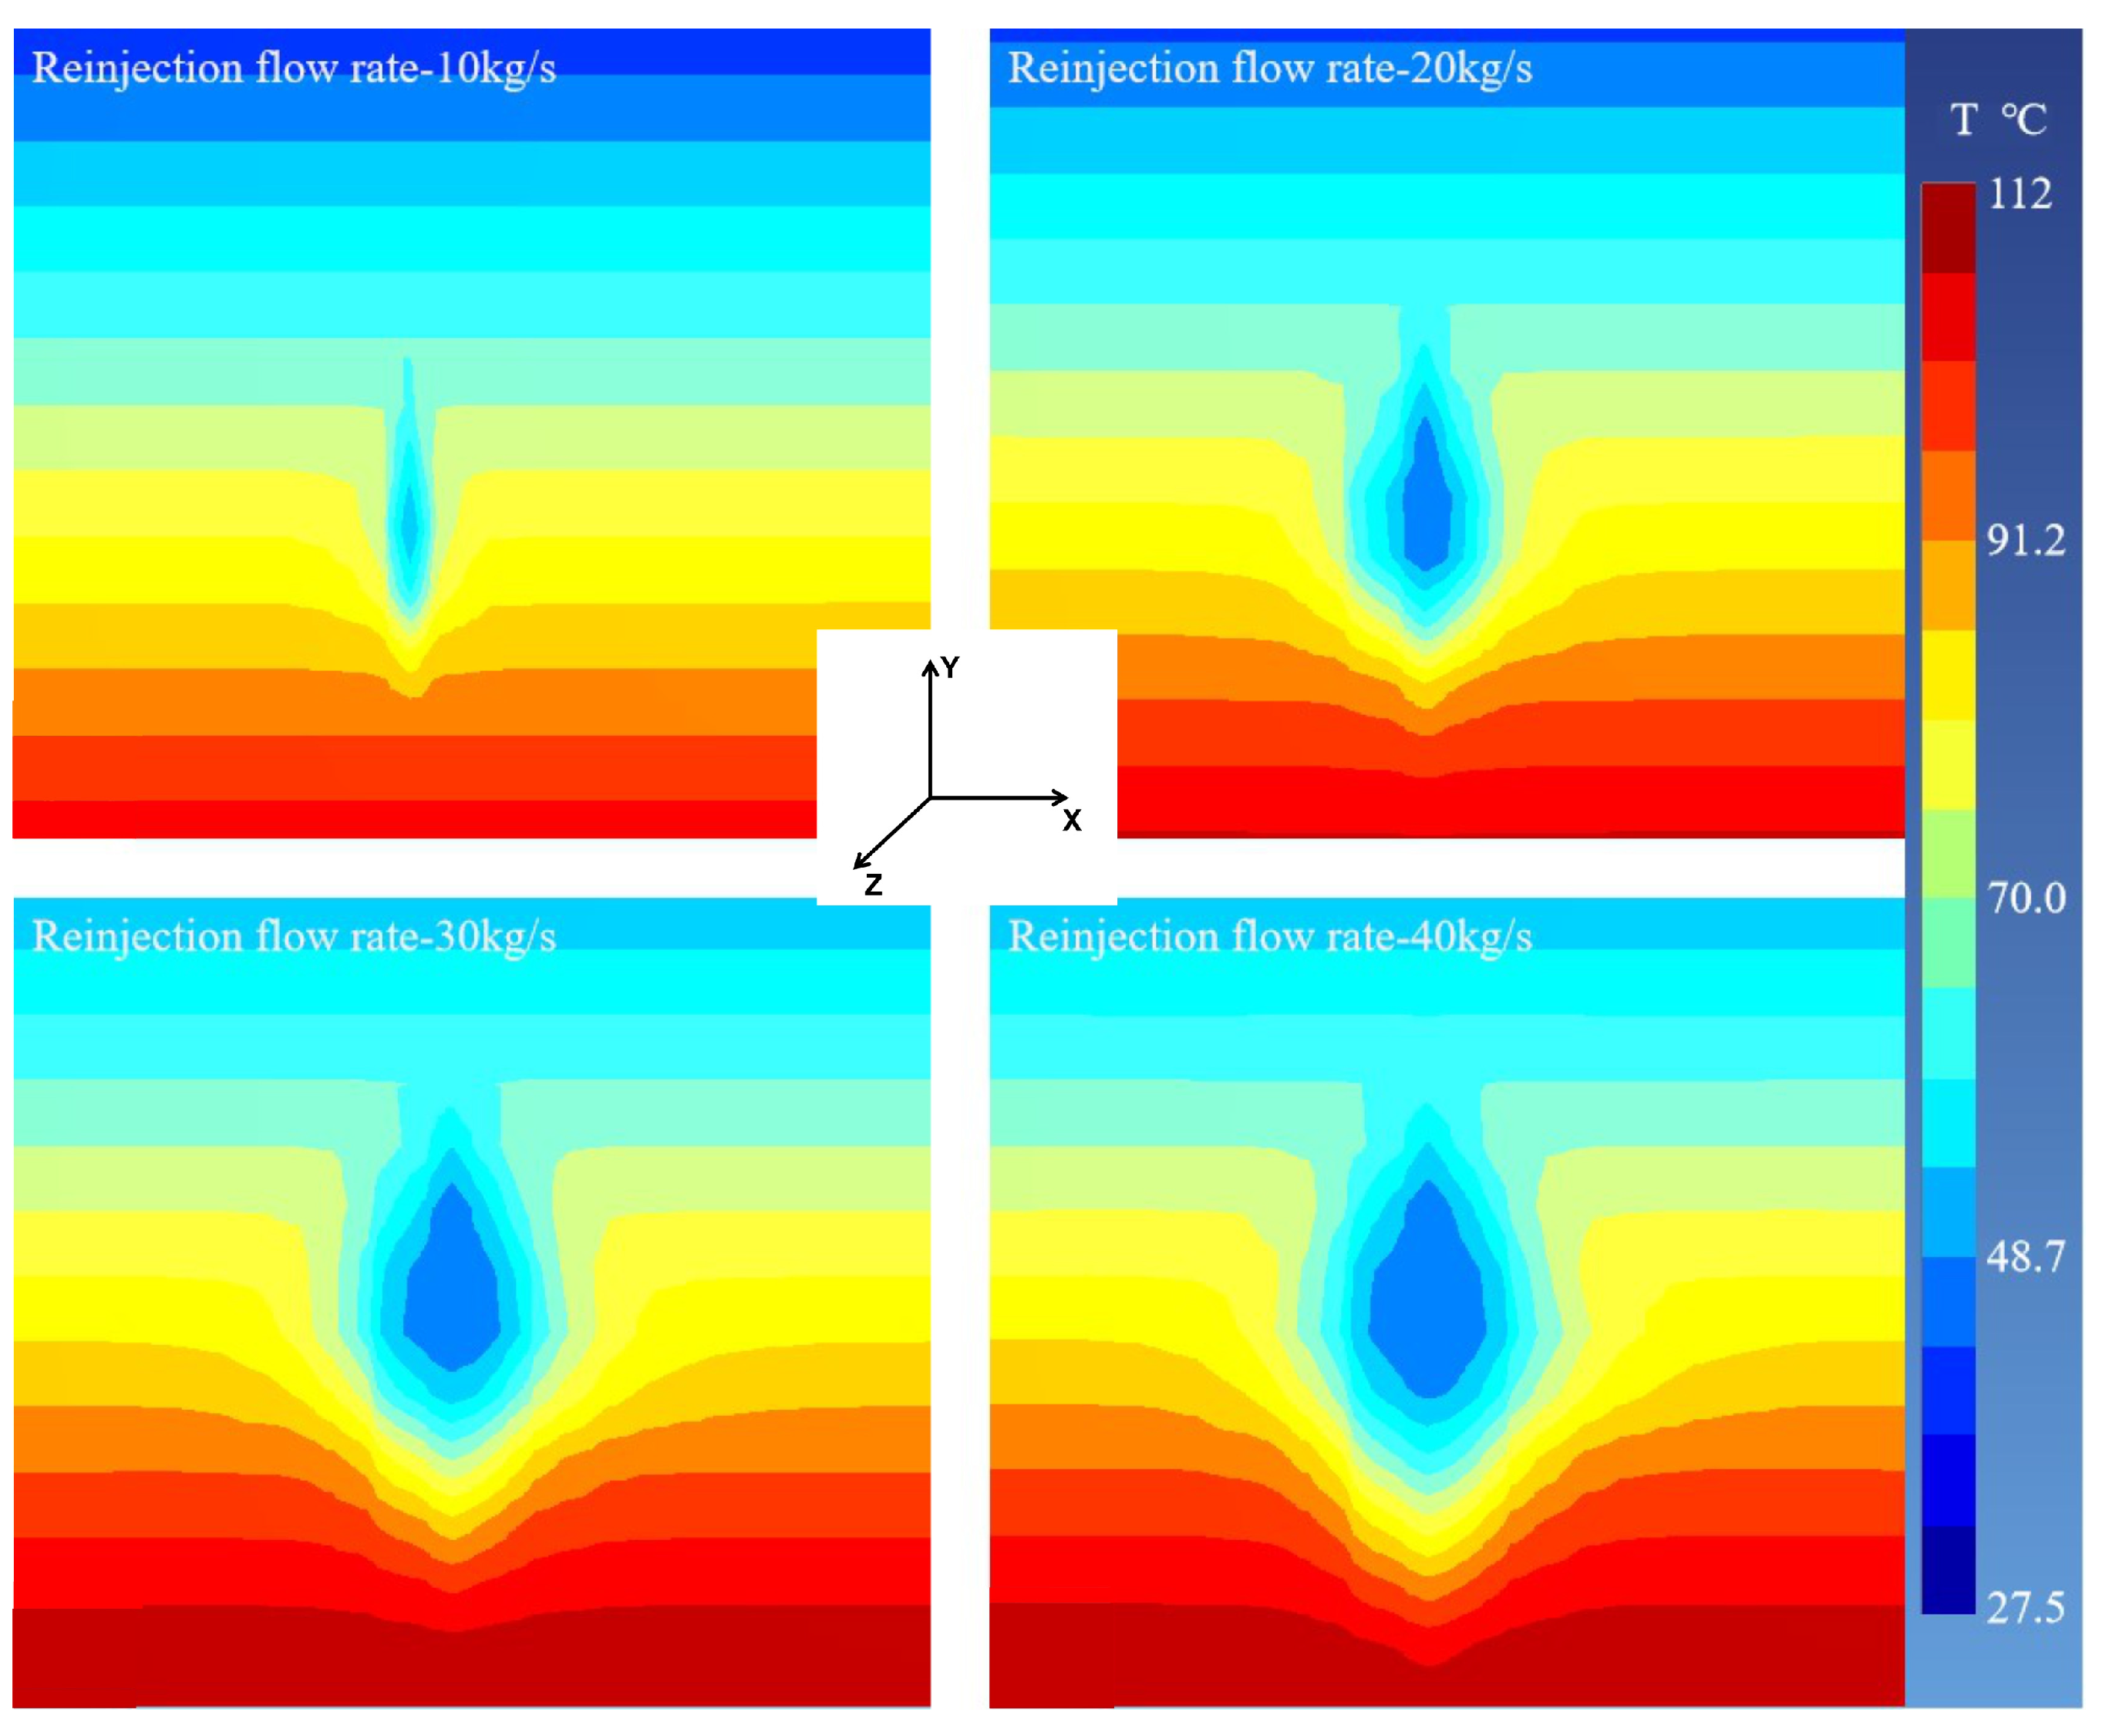
The temperature field distribution in the longitudinal profile around reinjection well X193 is shown in Figure 9. With an increase in reinjection rate, the temperature disturbance range significantly increased in both the horizontal and vertical directions. With faster reinjection rates, the horizontal temperature disturbance radii for well X193 in the reservoir were 147.2 m, 178.8 m, 211.4 m and 262.3 m, respectively. The result indicates that as the reinjection flow rate increases, high-temperature fluid in the reservoir is rapidly extracted to the surface. The group wells and the surrounding areas are gradually filled with reinjection water, while the replenishment of hot water is a relatively slow process, leading to a decrease in reservoir temperature. The vertical temperature disturbance radii from the wellbore were 256.8 m, 392.1 m, 534.6 m and 588.5 m, respectively. With a faster reinjection rate, the pound of reinjection water on the wellbore is more significant. The kinetic energy of low-temperature fluid moving downward after leaving the wellbore is higher, influencing the vertical temperature over a greater distance.

Figure 9.
The variation of the temperature field around reinjection well X193.
Flow impedance can reflect the difficulty of groundwater flow in the thermal reservoir. Flow impedance during the extraction process increases with the rise in reinjection rate, which is shown in Figure 10. Flow impedance during production mainly includes friction between the fluid and the wellbore of the reinjection/production well, and the resistance as the fluid flows through the geothermal reservoir toward the production well. When the reinjection rate was high, a large amount of low-temperature fluid was injected into the reservoir, continuously carrying away heat from the reservoir, causing an overall decrease in reservoir temperature. As the temperature decreases, fluid viscosity increases. The greater the internal frictional resistance that needs to be overcome during fluid motion, the higher the increase in flow impedance.
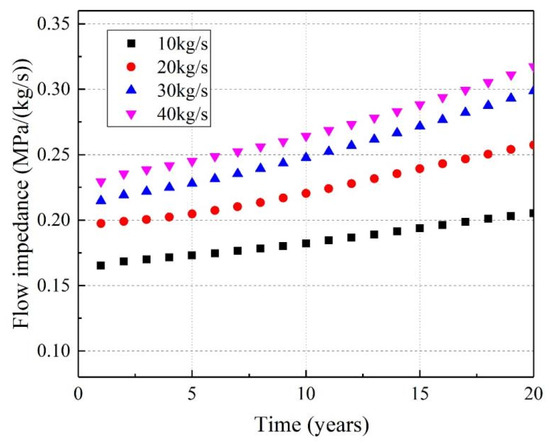
Figure 10.
The variation in flow impedance during the production process.
5.3. Effect of Reinjection Ratio
Geothermal resources are extracted and exchanged using groundwater as a medium during the extraction process. The cyclic replenishment of groundwater is slow during the exploitation process. Extensive exploitation of geothermal water can lead to a sharp drop in groundwater level and even depletion of geothermal resources. To achieve the goal of “taking heat without taking water”, reheated tailwater is injected back into reinjection wells, a process known as geothermal reinjection. Different reinjection ratios lead to varied pressure recoveries in the thermal reservoir and disturbances in the reservoir temperature field.
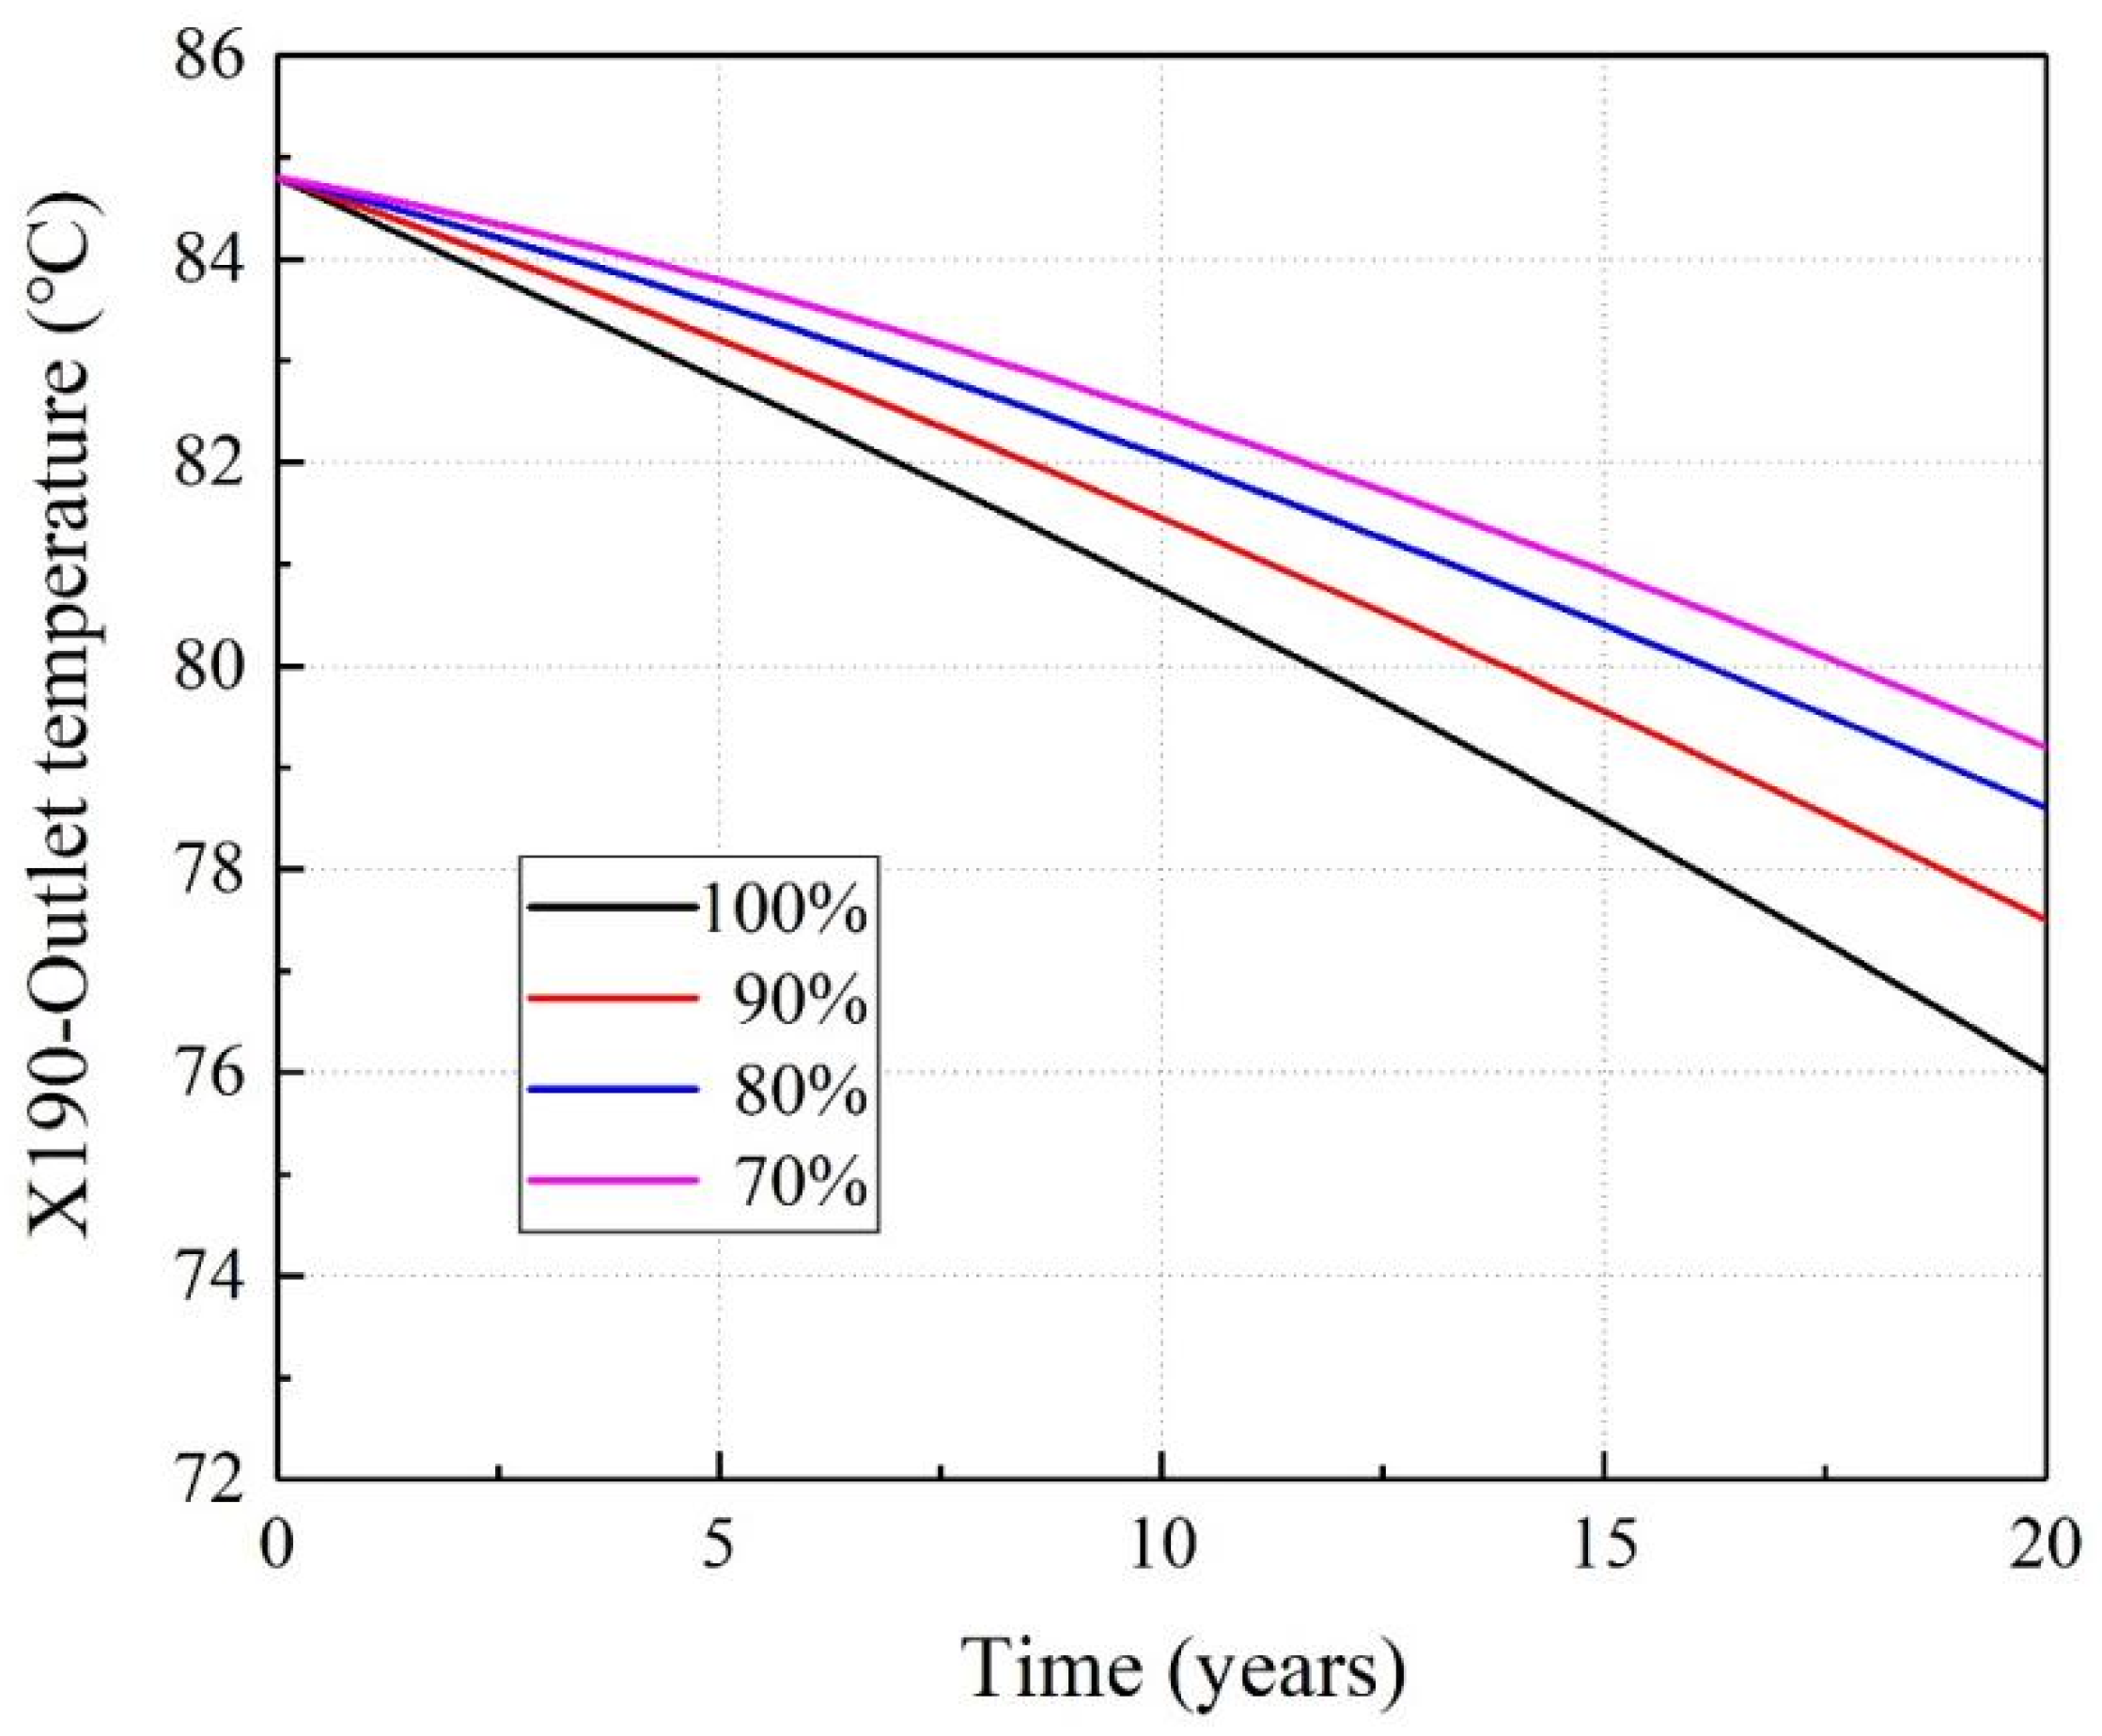
This analysis is conducted on the heat extraction capacity of group wells under different reinjection ratios during the extraction process. The study considers a reinjection temperature set at 30 °C and a reinjection rate set at 30 kg/s. Four reinjection ratios of 70%, 80%, 90% and 100% were established and the impact of different reinjection ratios on the production capacity of geothermal wells was analyzed.
From Figure 11, it is observed that the outlet temperature of production wells is sensitive to the reinjection ratio. For lower reinjection ratios, higher outlet temperatures can be extracted. For well X190, when the reinjection ratio decreased from 100% to 70%, the outlet temperature increased from 76 °C to 77.5 °C, 78.6 °C and 79.2 °C, representing increases of 1.97%, 3.42% and 4.21%, respectively. This is because less low-temperature tailwater is injected back into the reservoir for a lower reinjection ratio. As a result, the proportion of high-temperature hot water extracted by the production well from the existing reservoir increases, leading to a higher outlet temperature.
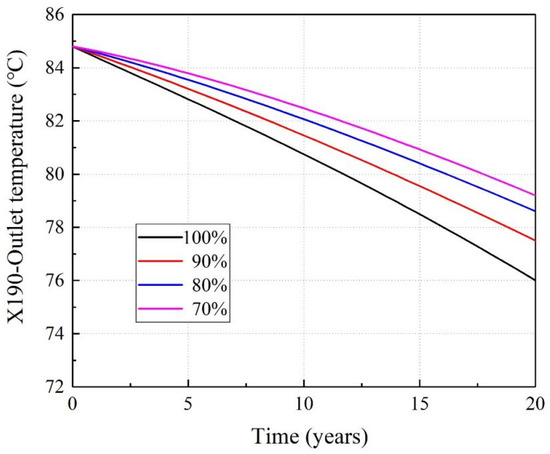
Figure 11.
The variation in the outlet temperature of production well X190 over time.
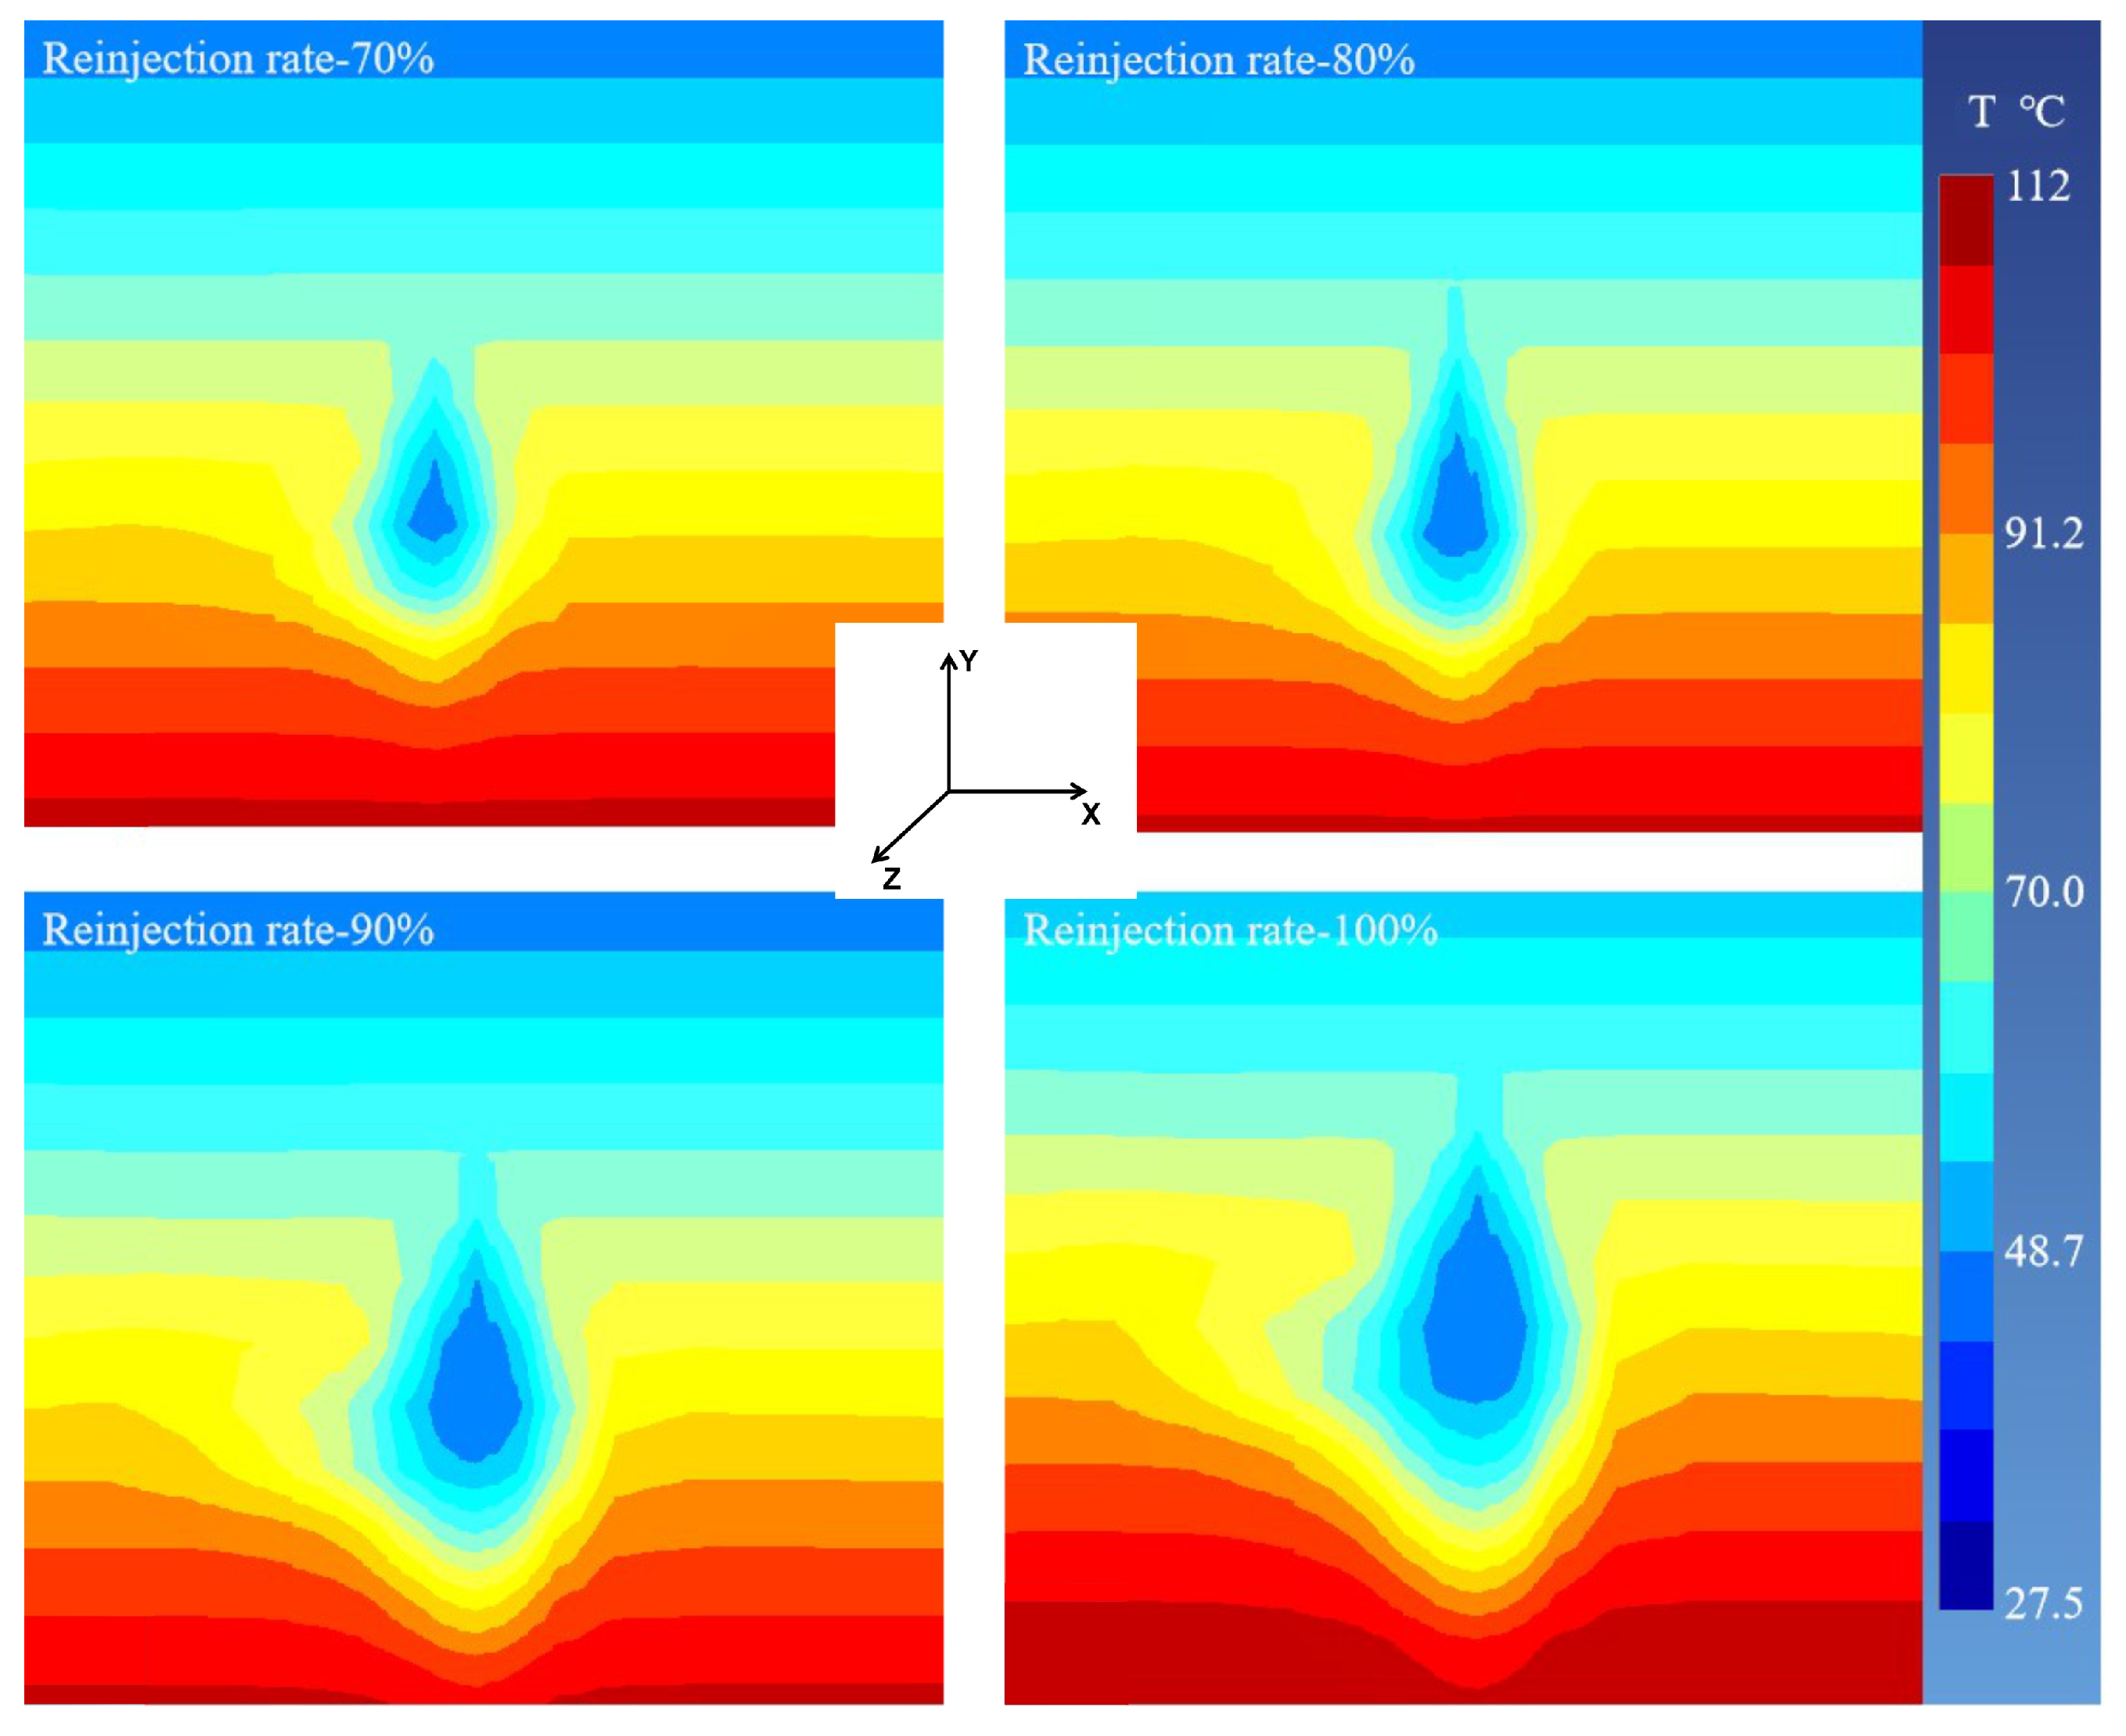
For different reinjection ratios, well X192 exhibited similar characteristics in the temperature influence range in both the horizontal and vertical directions in the reservoir, which is shown in Figure 12. Specifically, higher reinjection ratios led to larger disturbance ranges in the temperature field near the well. This is because, with a constant extraction flow rate in the production well, higher reinjection ratios result in a larger mass of low-temperature fluid being injected into the reinjection well in the same time period. The fluid absorbs heat in the reservoir, causing a temperature decrease in the horizontal direction of the reservoir. Additionally, the increased bottom pressure in the reinjection well due to a high reinjection ratio accelerates the downward movement of fluid, leading to a temperature decrease in the vertical direction around the reinjection well.

Figure 12.
The variation in the bottom temperature field in the reinjection well X192.
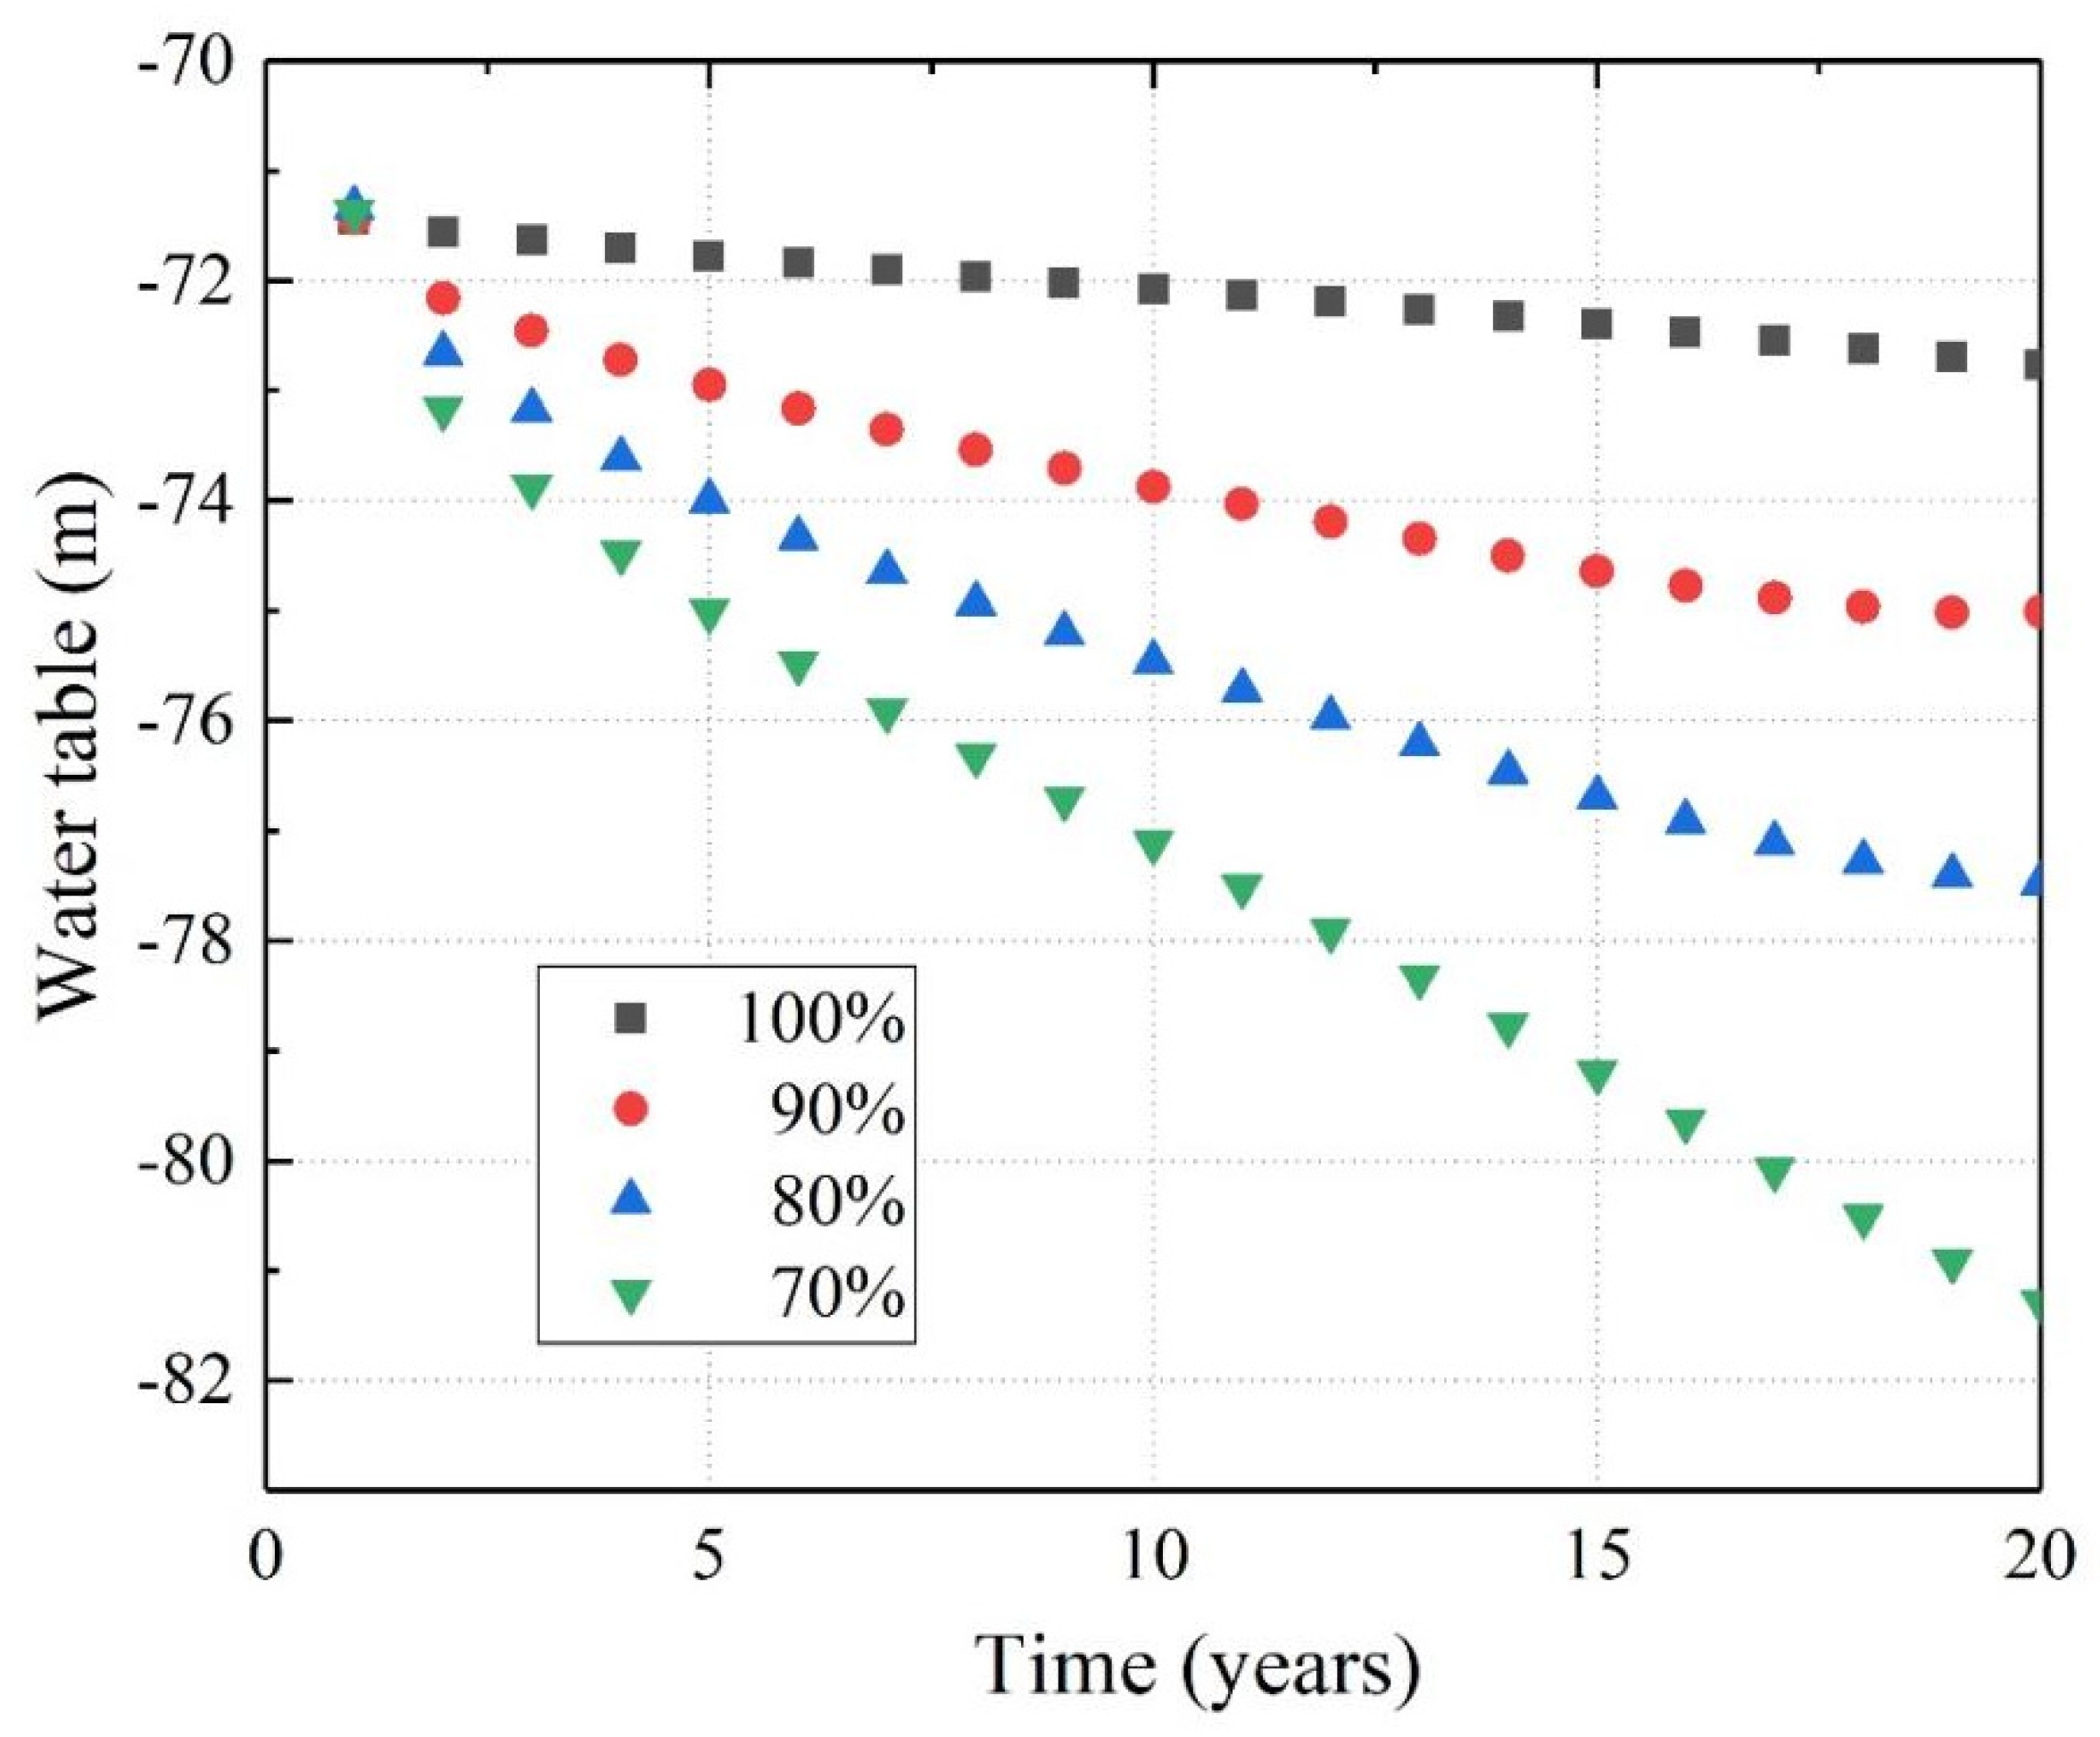
According to the requirements for geothermal resource extraction limitations, the decrease in groundwater dynamic water level during geothermal resource extraction should not be too large. In this study, the lowest groundwater level during each extraction cycle was selected to create a scatter plot, which is shown in Figure 13. The different reinjection ratios have a significant impact on groundwater level changes during long-term extraction. Lower reinjection ratios resulted in a faster decline in groundwater levels. After 20 years of extraction, the groundwater levels with reinjection ratios of 70%, 80%, 90% and 100% decreased to 81.28 m, 77.47 m, 75.01 m and 72.76 m, respectively. This result indicates that reinjection requirements should be increased in practical extraction processes. Higher reinjection ratios can minimize interference with surrounding groundwater and reduce the environmental impact of the project.
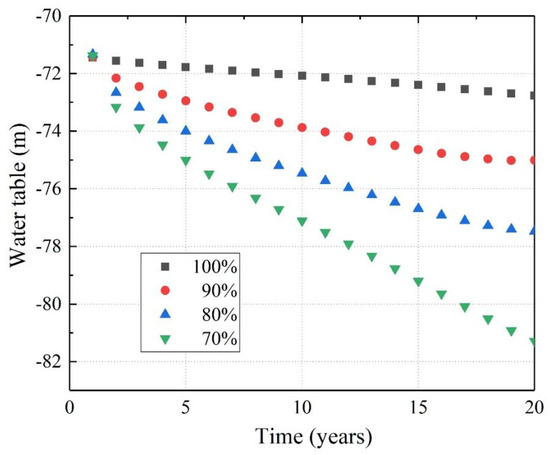
Figure 13.
The variation of the groundwater levels during the production process.
6. Conclusions
The effects of the factors of reinjection temperature, injection flow rate and reinjection ratio on the temperature field of geothermal reservoirs are deduced based on numerical simulation and temperature monitoring data during long-term extraction in Xiong’an New Area. The conclusions drawn are as follows:
- (1)
- Higher reinjection temperatures can reduce disturbance to the reservoir temperature field during the exploitation process, which is beneficial for maintaining the water temperature of production wells in long-term operations.
- (2)
- Larger reinjection rates during the exploitation process result in lower water temperatures from production wells and also cause a wide-ranging disturbance in the thermal reservoir around the reinjection wells. The horizontal impact scope can reach 262.3 m for a reinjection rate of 40 kg/s.
- (3)
- With an increase in the reinjection ratio, the outlet temperature from production wells decreases. However, it is able to effectively suppress the issue of a groundwater level drop during the extraction process. Therefore, the reinjection rate should be increased as much as possible while the outlet temperature meets production requirements in the operation process.
Author Contributions
Methodology, Z.L. and S.G.; Software, Y.H.; Investigation, J.M.; Resources, X.L.; Data curation, Z.W.; Writing—original draft, Y.H. All authors have read and agreed to the published version of the manuscript.
Funding
This study has been funded by the China Postdoctoral Science Foundation (No. 2022TQ0284; 2022M712854).
Data Availability Statement
Data are contained within the article.
Conflicts of Interest
The authors declare no conflict of interest.
References
- Su, Y.; Fan, Q. Renewable energy technology innovation, industrial structure upgrading and green development from the perspective of China’s provinces. Technol. Forecast. Soc. Change 2022, 180, 121727. [Google Scholar] [CrossRef]
- Huang, Y.; Zhang, Y.; Gao, X.; Ma, Y. Thermal disturbance analysis in rock-soil induced by heat extraction from the abandoned well. Geothermics 2022, 101, 102374. [Google Scholar] [CrossRef]
- Alimonti, C.; Vitali, F.; Scrocca, D. Reuse of Oil Wells in Geothermal District Heating Networks: A Sustainable Opportunity for Cities of the Future. Energies 2024, 17, 169. [Google Scholar] [CrossRef]
- Hoang, A.T.; Pham, V.V.; Nguyen, X.P. Integrating renewable sources into energy system for smart city as a sagacious strategy towards clean and sustainable process. J. Clean. Prod. 2021, 305, 127161. [Google Scholar] [CrossRef]
- Jayachandran, M.; Gatla, R.K.; Rao, K.P.; Rao, G.S.; Mohammed, S.; Milyani, A.H.; Azhari, A.A.; Kalaiarasy, C.; Geetha, S. Challenges in achieving sustainable development goal 7: Affordable and clean energy in light of nascent technologies. Sustain. Energy Technol. Assess. 2022, 53, 102692. [Google Scholar] [CrossRef]
- Lund, J.W.; Boyd, T.L. Direct Utilization of Geothermal Energy 2020 Worldwide Review. Geothermics 2021, 90, 101915. [Google Scholar] [CrossRef]
- Bertani, R. Geothermal power generation in the world 2010–2014 update report. Geothermics 2016, 60, 31–43. [Google Scholar] [CrossRef]
- Agoundedemba, M.; Kim, C.K.; Kim, H.-G. Energy Status in Africa: Challenges, Progress and Sustainable Pathways. Energies 2023, 16, 7708. [Google Scholar] [CrossRef]
- Moska, R.; Labus, K.; Kasza, P.; Moska, A. Geothermal potential of hot dry rock in south-east baltic basin Countries—A review. Energies 2023, 16, 1662. [Google Scholar] [CrossRef]
- Putra, V.; Furui, K. Phase-Field Modeling of Coupled Thermo-Hydromechanical Processes for Hydraulic Fracturing Analysis in Enhanced Geothermal Systems. Energies 2023, 16, 7942. [Google Scholar] [CrossRef]
- Liu, X.; Falcone, G.; Alimonti, C. A systematic study of harnessing low-temperature geothermal energy from oil and gas reservoirs. Energy 2018, 142, 346–355. [Google Scholar] [CrossRef]
- Zhang, W.; Qu, Z.; Guo, T.; Wang, Z. Study of the enhanced geothermal system (EGS) heat mining from variably fractured hot dry rock under thermal stress. Renew. Energy 2019, 143, 855–871. [Google Scholar] [CrossRef]
- Guiling, W.; Wei, Z.; Jiyun, L.; Wenjing, L.; Zhiming, L.; Wanli, W. Evaluation of Geothermal Resources Potential in China. Acta Geosci. Sin. 2017, 38, 449–459. [Google Scholar]
- Huang, Y.; Zhang, Y.; Yu, Z.; Ma, Y.; Zhang, C. Experimental investigation of seepage and heat transfer in rough fractures for enhanced geothermal systems. Renew. Energy 2018, 135, 846–855. [Google Scholar] [CrossRef]
- Li, K.; Ding, Y.Z.; Ai, C.; Sun, H.; Xu, Y.P.; Nedaei, N. Multi-objective optimization and multi-aspect analysis of an innovative geothermal-based multi-generation energy system for power, cooling, hydrogen, and freshwater production. Energy 2022, 245, 123198. [Google Scholar] [CrossRef]
- Zeng, Y.C.; Zhan, J.M.; Wu, N.Y.; Luo, Y.Y.; Cai, W.H. Numerical simulation of electricity generation potential from fractured granite reservoir through vertical wells at Yangbajing geothermal field. Energy 2016, 103, 290–304. [Google Scholar] [CrossRef]
- Guo, Q.; Wang, Y.; Liu, W. Hydrogeochemistry and environmental impact of geothermal waters from Yangyi of Tibet, China. J. Volcanol. Geotherm. Res. 2009, 180, 9–20. [Google Scholar] [CrossRef]
- Huang, W.; Wang, J.; Lu, Z.; Wang, S. Exergoeconomic and exergoenvironmental analysis of a combined heating and power system driven by geothermal source. Energy Convers. Manag. 2020, 211, 112765. [Google Scholar] [CrossRef]
- Zhao, N.; You, F. Can renewable generation, energy storage and energy efficient technologies enable carbon neutral energy transition. Appl. Energy 2020, 279, 115889. [Google Scholar] [CrossRef]
- Zhang, S.; Chen, W. China’s energy transition pathway in a carbon neutral vision. Engineering 2021, 14, 7. [Google Scholar] [CrossRef]
- Jiang, S.; Tan, X.; Hu, P.; Wang, Y.; Shi, L.; Ma, Z.; Lu, G. Air pollution and economic growth under local government competition: Evidence from China, 2007–2016. J. Clean. Prod. 2022, 334, 130231. [Google Scholar] [CrossRef]
- Wang, G.L.; Wang, W.L.; Zhang, W.; Ma, F.; Liu, F. The status quo and prospect of geothermal resources exploration and development in Beijing-Tianjin-Hebei region in China. China Geol. 2020, 3, 173–181. [Google Scholar] [CrossRef]
- Lee, S.; Park, S.; Kang, M.; Choi, H. Performance evaluation of coaxial-type GHEX in GSHP system installed in Korean residential building. Energy Build. 2021, 235, 110734. [Google Scholar] [CrossRef]
- Cobos, J.E.; Sgaard, E.G. Systematic Study of Geothermal Brine Reinjection for SaltPower Generation Purposes: Citric Acid as a Potential Iron Control Agent. Geothermics 2021, 95, 102116. [Google Scholar] [CrossRef]
- Yue, G.; Zhu, X.; Wang, G.; Ma, F. Mineral Reaction Kinetics during Aciding of the Gaoyuzhuang Carbonate Geothermal Reservoir in the Xiong’an New Area, Northern China. Water 2022, 14, 3160. [Google Scholar] [CrossRef]
- Wang, Z.; Zhang, C.; Jiang, G.; Hu, J.; Tang, X.; Hu, S. Present-day geothermal field of Xiongan New Area and its heat source mechanism. Chin. J. Geophys. 2019, 62, 4313–4322. [Google Scholar]
- Aydin, H.; Merey, S. Design of Electrical Submersible Pump system in geothermal wells: A case study from West Anatolia, Turkey. Energy 2021, 230, 120891. [Google Scholar] [CrossRef]
- Feng, B.; Ren, H.; Yang, Y.; Cui, Z.; Zhao, J. Comparative Analysis of Heating Efficiency of a Single-Well Geothermal System in the Cold Region of Northeast China. Energies 2023, 16, 1884. [Google Scholar] [CrossRef]
- Sun, X.; Wang, Z.; Liao, Y.; Sun, B.; Gao, Y. Geothermal energy production utilizing a U-shaped well in combination with supercritical CO2 circulation. Appl. Therm. Eng. 2019, 151, 523–535. [Google Scholar] [CrossRef]
- Basmanov, O.L.; Kiryukhin, A.V.; Maguskin, M.A.; Dvigalo, V.N.; Rutqvist, J. Thermo-hydrogeomechanical modeling of vertical ground deformation during the operation of the Mutnovskii Geothermal Field. J. Volcanol. Seismol. 2016, 10, 138–149. [Google Scholar] [CrossRef]


Disclaimer/Publisher’s Note: The statements, opinions and data contained in all publications are solely those of the individual author(s) and contributor(s) and not of MDPI and/or the editor(s). MDPI and/or the editor(s) disclaim responsibility for any injury to people or property resulting from any ideas, methods, instructions or products referred to in the content. |
© 2024 by the authors. Licensee MDPI, Basel, Switzerland. This article is an open access article distributed under the terms and conditions of the Creative Commons Attribution (CC BY) license (https://creativecommons.org/licenses/by/4.0/).