Abstract
The European Union is committed to a 55% reduction in greenhouse gas emissions by 2030, as outlined in the Green Deal and Climate Law initiatives. In response to geopolitical events, the RePowerEU initiative aims to enhance energy self-sufficiency, reduce reliance on Russian natural gas, and promote hydrogen utilization. Hydrogen valleys, localized ecosystems integrating various hydrogen supply chain elements, play a key role in this transition, particularly benefiting isolated regions like islands. This manuscript focuses on optimizing a Centralized Green Hydrogen Production Facility (CGHPF) on the island of Crete. A mixed-integer linear programming framework is proposed to optimize the CGHPF, considering factors such as land area, wind and solar potential, costs, and efficiency. Additionally, an in-depth sensitivity analysis is conducted to explore the impact of key factors on the economic feasibility of hydrogen investments. The findings suggest that hydrogen can be sold in Crete at prices as low as 3.5 EUR/kg. Specifically, it was found in the base scenario that, selling hydrogen at 3.5 EUR/kg, the net profit of the investment could be as high as EUR 6.19 million, while the capacity of the solar and wind installation supplying the grid hydrogen facility would be 23.51 MW and 52.97 MW, respectively. It is noted that the high profitability is justified by the extraordinary renewable potential of Crete. Finally, based on our study, a policy recommendation to allow a maximum of 20% direct penetration of renewable sources of green hydrogen facilities into the grid is suggested to encourage and accelerate green hydrogen expansion.
1. Introduction
The European Union has set ambitious objectives aimed at significantly reducing carbon dioxide emissions. A paramount goal among these is to realize a minimum 55% reduction in greenhouse gas emissions by the year 2030, compared to the levels recorded in 1990. This commitment is articulated through their Green Deal and Climate Law initiatives [1]. In the wake of the Russian incursion into Ukraine in 2022, fresh strategies have been devised, including the RePowerEU initiative [2]. This initiative places predominant emphasis on attaining energy self-sufficiency, particularly by reducing dependence on Russian natural gas and accelerating the utilization of hydrogen. Notably, hydrogen has emerged as a pivotal energy carrier that holds the potential to assume a central role in the transition toward a net-zero emissions energy framework. It remains a prominent point on the European Union’s policy agenda [3,4]. As a demonstration of their dedication, the EU intends to substantially ramp up its manufacturing capacity for renewable hydrogen production in the upcoming years, aligning with the Fitfor55 and RePowerEU plans. A notable feature of these plans is the strategic development of hydrogen valleys [1].
A hydrogen valley refers to a localized ecosystem or region that integrates various elements of the hydrogen supply chain. This includes hydrogen production, storage, transportation, and utilization across diverse sectors such as industry, transportation, residential, etc. The concept aims to create a self-contained and interconnected network that maximizes the use of hydrogen as an energy carrier while leveraging renewable sources for its production. Hydrogen valleys are designed to foster sustainable energy systems, promote local economic development, and contribute to the transition toward a low-carbon energy future. Commonly referred to as hydrogen hubs, these valleys often serve as recipients of substantial multi-million EUR investments with the aim of propelling economic growth within their respective geographical zones [5]. Among the prime candidates for this transformative paradigm are inhabited islands due to the manifold challenges they confront: geographic isolation, constrained energy resources, elevated electricity costs, susceptibility to climate-induced impacts, dependency on imported fuels, energy system fragility, and the complexity of energy interconnections [6]. The EU parliament recognizes the islands’ unique energy challenges and “Encourages the Commission and the Member States to devise specific solutions in order to ramp up hydrogen production in less connected or isolated regions such as islands, while ensuring the development of related infrastructure, including by repurposing it” [1].
Green hydrogen, produced through electrolysis utilizing renewable power sources [4,7,8], can be generated by employing either centralized or decentralized methods [1]. In the case of centralized hydrogen production, all hydrogen production occurs within a single facility situated in proximity to or co-located with the renewable energy generation site. This approach boasts reduced production costs due not only to the proximity of electricity generation to the electrolysis plant but primarily owing to the advantages of economies of scale [9]. Nevertheless, its drawback is that the demand or end-use locations might be geographically distant from the production facility, leading to elevated transportation expenses.
Conversely, decentralized production involves the production of hydrogen in close proximity to the consumption sites, often facilitated by smaller-scale facilities. Unlike centralized production, in the decentralized model, transportation costs are negligible, yet the production expenses tend to increase. Both alternatives are feasible, and some may be more suitable in a certain situation; for instance, decentralized production may be suitable for an industry with a high volume of hydrogen consumption [1].
1.1. Literature Review
Decentralized electrolyzers fulfill a diverse array of roles, catering to residential [10,11], commercial [12], industrial installations, universities [13], mines [14], telecommunication systems [15], and even refueling stations [16,17]. Given that the paper’s focus revolves around optimizing a Centralized Green Hydrogen Production Facility (CGHPF) situated on the island of Crete, this literature review will concentrate solely on that topic, avoiding an extensive exploration of decentralized electrolysis.
Centralized hydrogen facilities have gained considerable attention within the literature, with noteworthy contributions shedding light on this subject. For instance, El-Emam et al. [18] present a comprehensive survey of hydrogen production technologies in conjunction with their alignment with renewable sources. This exploration highlights nuclear and geothermal energy as standout contenders, given their competitive energy costs, rendering them potentially pivotal in facilitating cost-effective, carbon-free hydrogen production. Seyam et al. [19] delve into an investigation involving geothermal and isobutene power plants, forming a combined electric power output of 130 MW. This endeavor revolves around supplying energy to a hydrogen liquefaction power plant, yielding an impressive daily output of approximately 330 tons of liquefied hydrogen. Fereidooni et al. [20] investigate hydrogen production powered by solar energy in Iran. Examining the annual performance, their analysis reveals a seasonal variation. The facility averages about 48 tons of generated hydrogen each month. Different scenarios are examined, encompassing a range of operating parameters for PV systems such as tracking mechanisms. The endeavor extends to an economic analysis, ultimately highlighting a payback period of approximately 16 years.
Fasihi et al. [21] conducted a thorough analysis spanning from 2020 to 2050, examining hydrogen production across various global regions. The focal points of investigation encompassed the renewable baseload electricity level derived from solar and wind sources, coupled with the corresponding baseload hydrogen level. The outcomes of this study reveal a worldwide trend toward reduced baseload levels by 2050. The electricity baseload presents a drop to 33 EUR/MW, while the hydrogen baseload aligns with a value of 35 EUR/MW. In a similar vein, Nematollahi et al. [22] undertook a comprehensive evaluation centered on hydrogen production from wind and solar sources within two Iranian provinces. By developing a mathematical model, the authors examined the system from both technical and economic perspectives. The study employed geographic information system maps to support the envisioned hydrogen economy and facilitate renewable energy integration within the studied regions. The potential applications of wind and solar energy could yield up to 40 tons/year of hydrogen within a single site. Tlili et al. [23] explored an energy scenario in France for 2035 that focuses on hydrogen as the essential decarbonizing energy vector driven by surplus renewable energy. In their examination, the authors identified strategic regional sites for the installation of electrolyzers. Simulations indicated that the anticipated energy landscape in France for 2035 may not suffice for hydrogen production, solely relying on excess renewable energy. As a potential solution, integration with nuclear power could potentially yield dual benefits, lowering hydrogen costs and significantly enhancing system flexibility.
Khosravi et al. [24] delved into a sophisticated energy system configuration, combining PV energy and ocean thermal energy for power generation, coupled with hydrogen production and storage, achieving an overall efficiency of 3.3%. The authors additionally conducted an economic assessment, revealing a payback period of 8 years. Hassan et al. [25] undertook a study centered on electrifying the Australian island Thursday through the utilization of green hydrogen produced in a centralized manner on the neighboring island Horn. The cost of energy production varies between 0.37 AUD/kWh and 1.08 AUD/kWh, depending on the degree of hydrogen penetration. Hou et al. [26] highlighted the advantages and prospects of hydrogen production through water electrolysis powered by wind turbines. The authors prioritized enhancing return on investment for these systems, indicating the most favorable approach as direct selling of the generated hydrogen to end users rather than employing it solely for electricity production. Specifically, their analysis concluded that selling hydrogen at 2 EUR/kg, 5 EUR/kg, and 9 EUR/kg corresponds to payback periods of 24.4 years, 5.5 years, and 2.6 years, respectively.
Kim et al. [27] introduced an optimization model that employs mixed-integer linear programming (MILP) to design and evaluate a wind–hydrogen system. This comprehensive approach encompasses technical considerations for wind turbine (WT) selection, wind farm classification (onshore or offshore), and the development of the hydrogen supply network. Notably, onshore installations are favored due to their lower capital costs despite yielding less energy compared to offshore counterparts. An economic advantage is attributed to the utilization of a centralized electrolyzer, driven by economies of scale, with the hydrogen cost ranging between 7.8 EUR/kg H2 and 11.5 EUR/kg H2.
Finally, Apostolou et al. [27] have reviewed several systems based on wind technology linked with hydrogen production via water electrolysis. The authors have identified three categories for wind/hydrogen applications, namely grid-connected systems, autonomous applications, and systems to support mobility. Their analysis of these applications yielded a levelized cost of hydrogen ranging from a notably optimistic 0.3 EUR/kg up to nearly 27 EUR/kg (refer to [27]). Nevertheless, 0.3 EUR/kg is too optimistic and prerequisites an extremely low or even negative electricity price. Most of the studies demonstrate a mean cost of hydrogen of approximately 6 EUR/kg.
1.2. Scope and Contribution of the Paper
The existing literature underlines the substantial variability observed in the levelized cost of hydrogen, underscoring the profound influence of regional renewable resource availability on hydrogen production economics. This variability becomes evident in studies such as that of Genç et al. [28], which spans different regions within Turkey and reveals how the cost of hydrogen can fluctuate significantly, ranging from 5.5 AUD/kg to 46.17 AUD/kg (refer to Table 5 of [28]), even for identical wind–hydrogen setups. This variability is a direct consequence of the distinct wind potential across different regions. Drawing inspiration from this observation, the present study carries out an economic viability assessment of a Centralized Green Hydrogen Production Facility (CGHPF). This facility integrates hybrid wind–solar generators and an electrolyzer, operating within the context of the island of Crete, Greece. Crete boasts an extraordinary wind energy potential, both in winter and summer seasons, attributed to the renowned “meltemia” winds. These winds, stemming from the northwest, are driven by the interaction of hot air masses from the Sahara and colder air currents over the Balkan Peninsula, guaranteeing a consistent wind direction (northwest) marked by minimal turbulence and fluctuations, rendering it a premium energy source [29]. This remarkable local wind dynamic, in tandem with Crete’s exceptional solar potential—characterized by an annual global horizontal solar irradiation exceeding 1900 kWh/m2—positions the island as an ideal site for green hydrogen production investments. It establishes Crete as a prime candidate for creating hydrogen valleys, epitomizing the island’s potential for comprehensive green hydrogen initiatives.
To optimize the installation of a CGHPF, we present a mixed-integer linear programming (MILP) framework that takes as inputs several crucial factors. These factors encompass the available land area, hourly wind and solar potential data spanning an entire year, renewable and electrolyzer costs, and electrolyzer efficiency. The proposed MILP framework ultimately yields the optimal installed capacities for wind, solar, and electrolyzer, thus maximizing the profit of the candidate investors. Its distinct feature is that it always ensures the global optimal solution to the examined optimization problem [30]. In the context of CGHPF, two distinct market strategies were examined: The first strategy revolves around the complete autonomy of the facility, with no provision for injecting any portion of the generated renewable power into the grid. Here, the entirety of the renewable power is solely dedicated to hydrogen production. In contrast, the second strategy offers a degree of flexibility to the CGHPF. This strategy permits a portion, up to a predetermined maximum percentage, of the generated renewable power to be directly injected into the grid. This approach recognizes that not all of the generated renewable power is exclusively allocated to hydrogen production, thereby minimizing the potential for renewable power curtailment during periods of elevated renewable energy generation.
Simulation results confirm that hydrogen can be sold in Crete at prices as low as 3.5 EUR/kg. Specifically, it was found in the base scenario that, selling hydrogen at 3.5 EUR/kg, the net profit of the investment could be as high as EUR 6.19 million. It is noted that the high profitability is justified by the extraordinary renewable potential of Crete.
2. Optimization Model
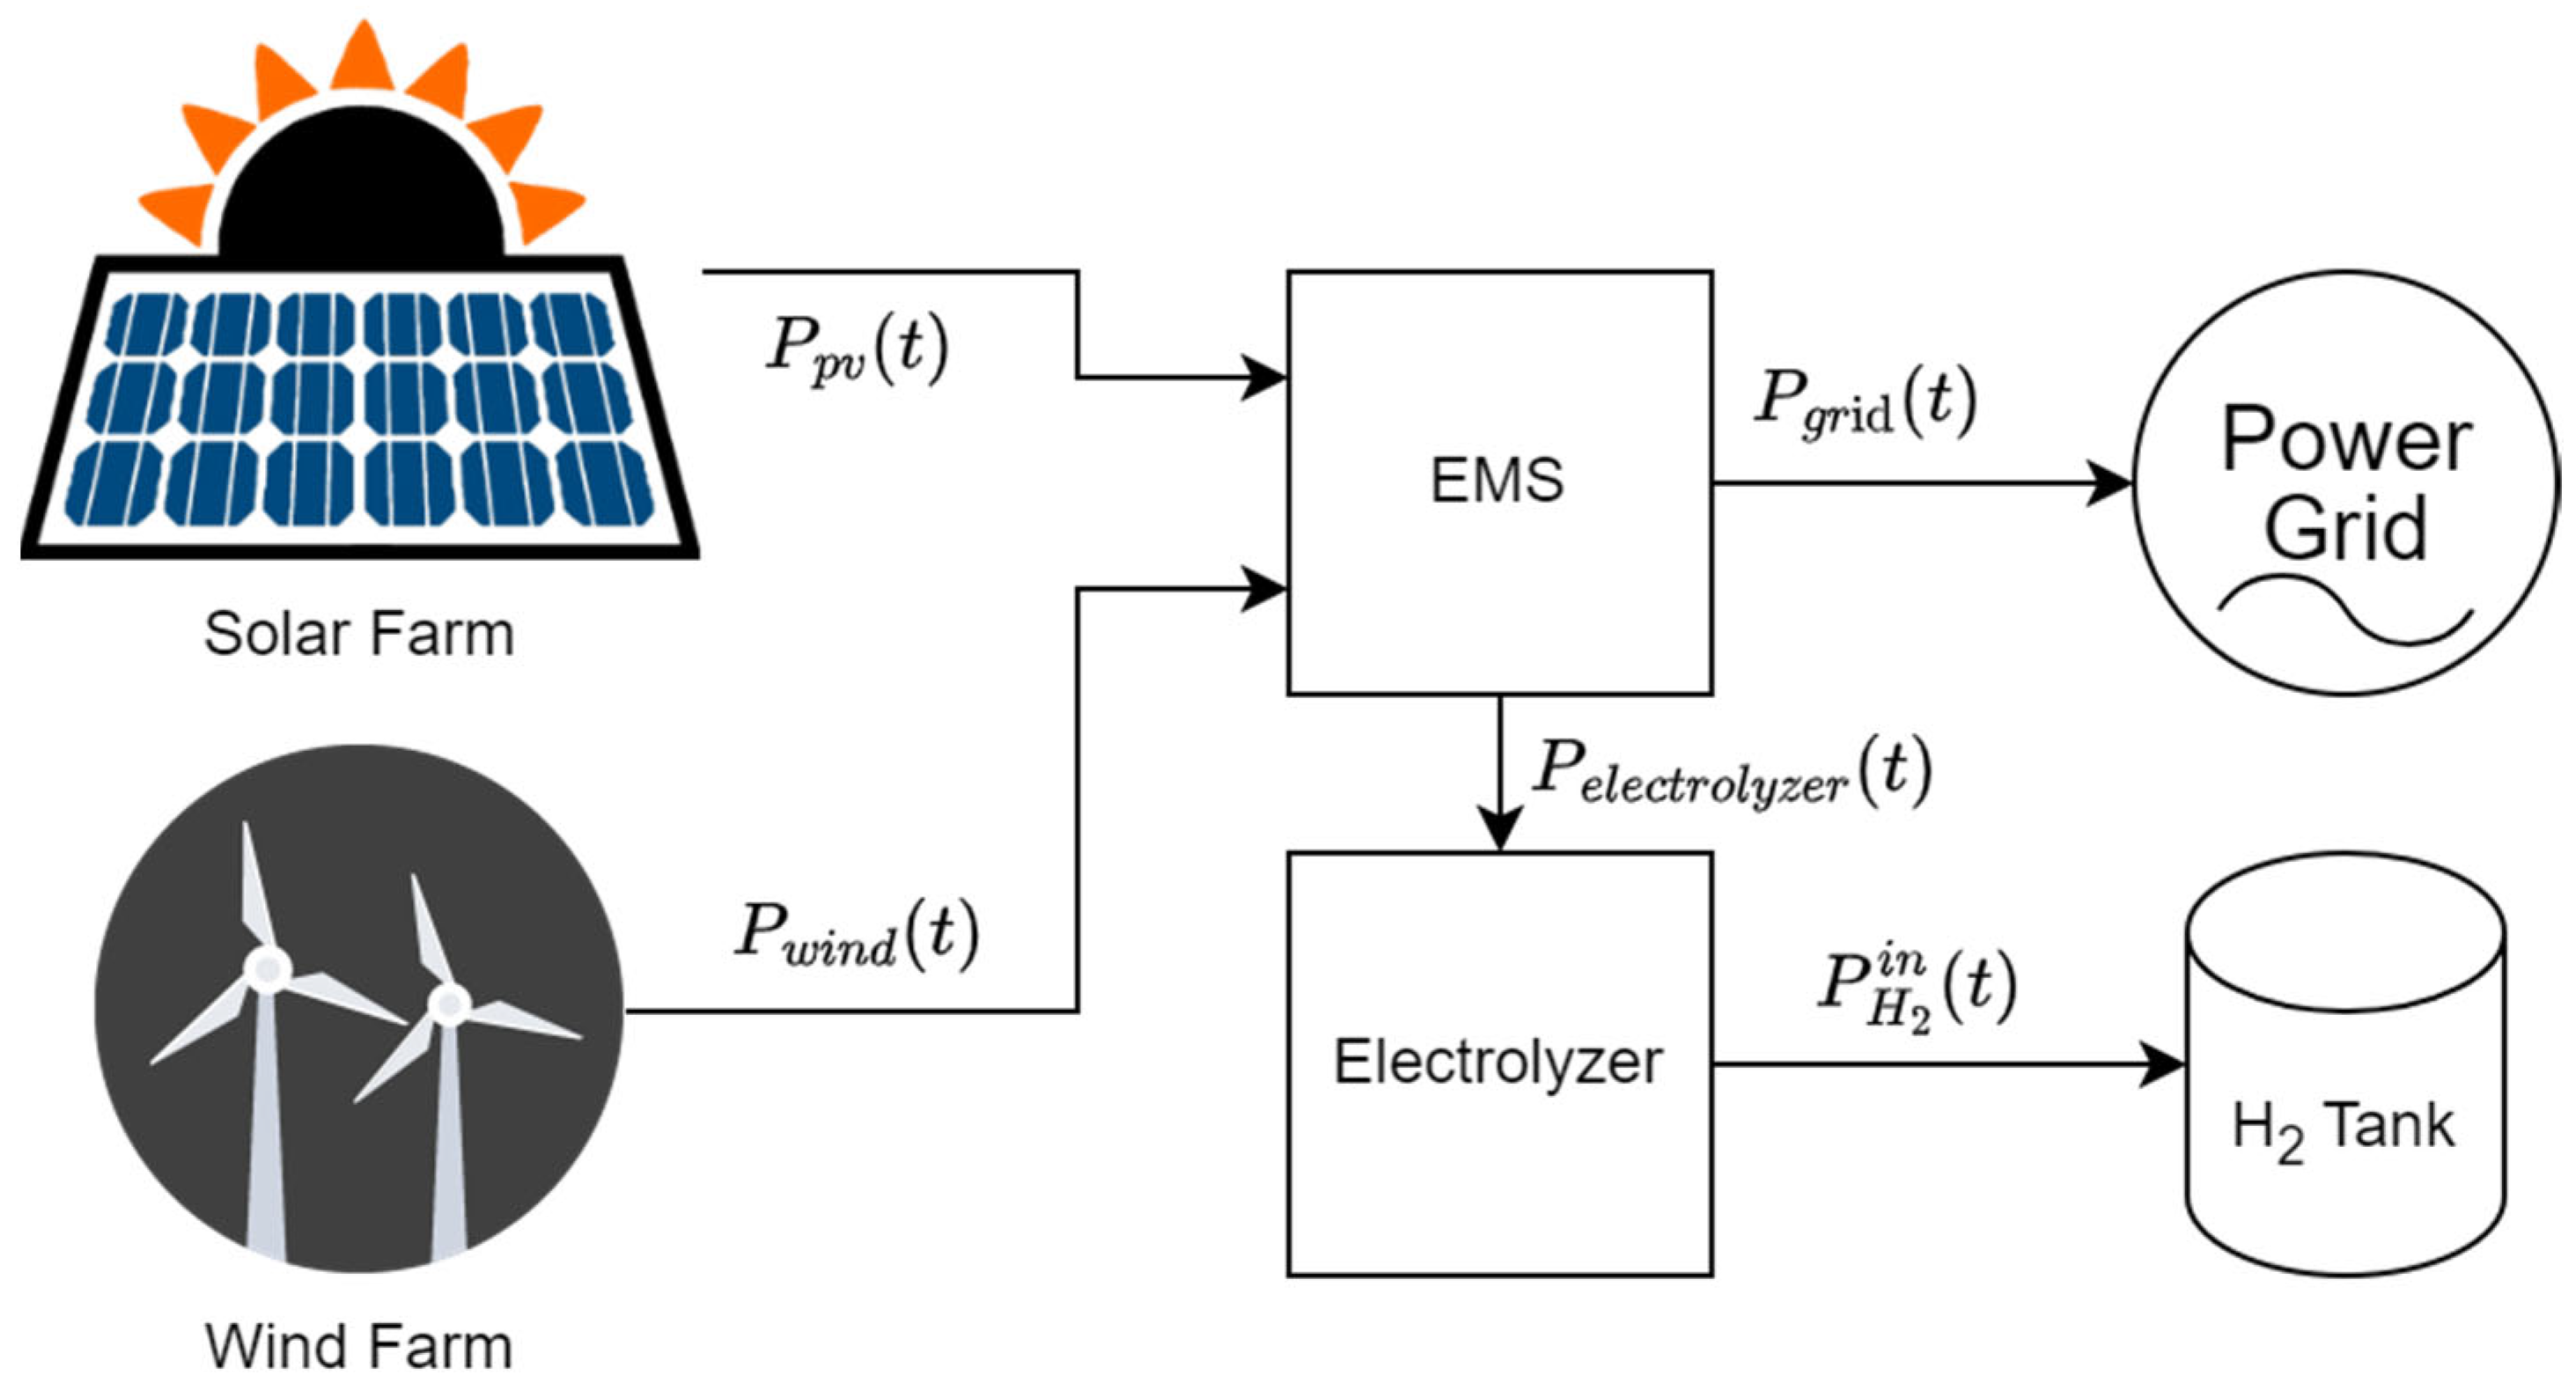
The system model is presented in Figure 1. The Energy Management System (EMS) is responsible for sending the generated renewable energy either directly to the power grid or storing it as hydrogen in the hydrogen tank via the electrolyzer.
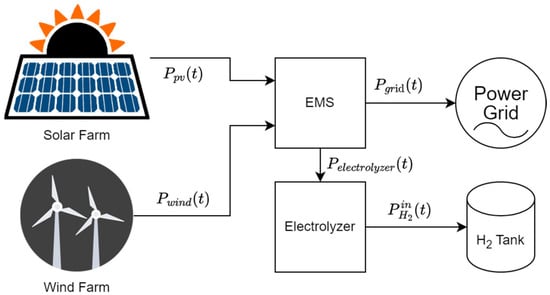
Figure 1.
Overall schematic of the examined CGHPF installation.
The optimization model is described in Equations (1)–(15). The model can constitute an important tool for optimizing the installed power of the electrolyzer, hydrogen tank, and solar and wind installed power in a CGHPF with the aim of optimizing the total installation profit over the lifetime of the project. The proposed model is a linear programming problem, simply solved using commercial solvers, e.g., CPLEX and GAMS. In this paper, we used the CPLEX solver in MATLAB. The CPLEX solver is a highly sophisticated optimization tool designed to tackle complex mathematical programming challenges. Specializing in linear programming (LP), mixed-integer programming (MIP), and quadratic programming (QP) problems, CPLEX utilizes advanced algorithms, including the branch-and-bound method and cutting-plane algorithms, to efficiently solve large-scale optimization problems. The strong advantage of our model is its ability to always compute the global optimal solution due to its linear nature as well as its simplicity.
The objective function of the proposed optimization model is given in Equation (1), while the constraints of the model are given in Equations (2)–(15).
The and in Equation (1) are given in Equations (2) and (3), respectively. All the variables have been defined in the nomenclature. The denotes the total income from the investment throughout the total project lifetime, e.g., 20 years. and denote the selling price of hydrogen and electricity, respectively. Note that in this paper, we have assumed that the CGHPF has the capability to inject a small part (e.g., 20%) of the annual renewable production into the grid, instead of exclusively producing hydrogen. This portion is represented here as . In this way, a degree of flexibility is provided to the investors of CGHPFs to inject the surplus of renewable energy into the grid instead of rejecting/curtailing it, thus increasing their profit and their incentive to invest in CGHPFs. The cost of the investment is given in Equation (3c), consisting of the installation costs given in Equation (3a) and the operation and maintenance (O&M) cost is given in Equation (3b). The CAPEX is the sum of the wind farm installation cost (), the solar farm installation cost (), the electrolyzer installation cost (), and the hydrogen tank cost (). The O&M cost is considered to be 2% of the CAPEX discounted with the inflation rate over the lifetime of the project.
The power balance equation is constrained in Equation (4), equating the power produced by the renewables (), the power injected into the grid (), and the power delivered to the electrolyzer ().
Equations (5) and (6) constrain the power produced by the solar and wind generators, respectively, to be lower than the maximum available power based on the installation capacity (). Note that and are the normalized () powers of the renewables denoting the power produced per 1 MW of installed renewable power at time t. The annual waveforms of these parameters are obtained by historical data or measurements in the candidate location of the CGHPF.
In Equation (7), the electrolyzer input power is constrained between the maximum and minimum power of the electrolyzer.
In Equation (8), the surplus renewable power, which exceeds the maximum electrolyzer power, is injected into the power grid, offering additional income to the investor instead of being curtailed. Note that H(∙) is the Heaviside function, which introduces a non-linearity into the proposed model; however, Equation (8) is linearized in the Appendix A to allow the solution of the formulation using MILP solvers.
Equation (9) ensures that the annual input energy of electrolyzer is higher than % of the total annual renewable production. For example, assuming that , the cumulative annual input energy of the electrolyzer is restricted to be higher than 80% of the total annual renewable generation. This restriction serves to legitimize the predominant use of the CGHPF as a green hydrogen facility. Simultaneously, it permits a limited portion of renewable energy sources (under 20%) to be directly fed into the grid. This approach mitigates the curtailment of renewables when their output surpasses the maximum capacity of the electrolyzers. Furthermore, allowing up to 20% direct penetration of renewables into the grid does not notably strain the electrical network, especially in Greek islands where solar peak coincides with the load peak due to summer tourism.
Equation (10) computes the production rate of hydrogen as a function of the input power of the electrolyzer and the electrolyzer efficiency (ε).
Equation (11) is the energy balance equation of the hydrogen tank, relating the stored hydrogen into the hydrogen tank at hour () and () with the input and output power of the hydrogen tank. The output power has been defined in (12) as the mean input power during the year. In fact, Equation (12) guarantees a consistent hydrogen supply from the facility all year round at a constant rate, ensuring the seamless fulfillment of the island’s hydrogen requirements.
Equation (13) constrains the stored hydrogen energy to be within the maximum and minimum (0) limits of the hydrogen tank. In Equation (14), we assume that there is an available hydrogen tank that can store hydrogen produced by the electrolyzer at its maximum power for at least 48 h. This is an arbitrary assumption that ensures that the installation has a safety margin for providing hydrogen despite the intermittency of renewables.
Finally, the installed wind and solar power are restricted in (15) based on the total available land area in the region . Note that and denote, respectively, the density of wind and solar installations, e.g., occupied land per installed MW, while typical values are shown in Table 1.

Table 1.
Parameters of the base scenario.
3. Optimization Results
In the formulated optimization, a base case scenario is outlined, specifically tailored to Crete, Greece. This scenario adopts standard values for various model parameters, as detailed in Table 1. It assumes a total area of 2,000,000 m2 available for renewable energy installations. The hydrogen selling price is set at 3.5 EUR/kg, equivalent to approximately 105 EUR/MWh. The base case scenario’s timeframe spans 20 years, with an inflation rate of 3% (as of December 2023, the inflation rate in the Eurozone is 2.9%, and the European Union is 3.4% [32]. Therefore, an acceptable inflation rate of 3% has been assumed for the purpose of the study). Employing the proposed optimization algorithm and leveraging the parameters from Table 1, the optimal capacity for renewable energy sources and the electrolyzer is determined. Additionally, the maximum potential profit over the project’s lifetime in Crete is calculated.
Table 2 presents the outcomes of the optimization for the base scenario, utilizing the parameters specified in Table 1. The results reveal optimal capacities for solar and wind installations at 23.51 MW and 52.97 MW, respectively, while the electrolyzer’s optimal capacity is determined to be 25.85 MW. The total O&M cost is found to constitute approximately 30% of the CAPEX over the project’s 20-year lifespan. The net profit, as defined by the objective function in Equation (1), is projected to be EUR 6.19 million during the lifetime. These findings underscore Crete’s significant potential in renewable energy: hydrogen production and sale are not only feasible but also potentially lucrative, even at a relatively low selling price of 3.5 EUR/kg H2. This suggests that investing in centralized hydrogen facilities in Crete could yield profitable returns even under low selling prices.
Table 2.
Results of the optimization for the base scenario.
4. Sensitivity Analysis
Conducting a sensitivity analysis is vital to understand how various factors and their uncertainties affect the profitability of a CGHPF. In this section, we delve into a comprehensive sensitivity analysis to pinpoint the key parameters that significantly influence CGHPF’s financial viability. This investigation encompasses several critical elements, such as (a) efficiency of the electrolyzer , (b) electrolyzer cost , (c) project lifetime, (d) solar installation cost , (e) wind installation cost , and (f) the factor .
4.1. Electrolyzer Efficiency
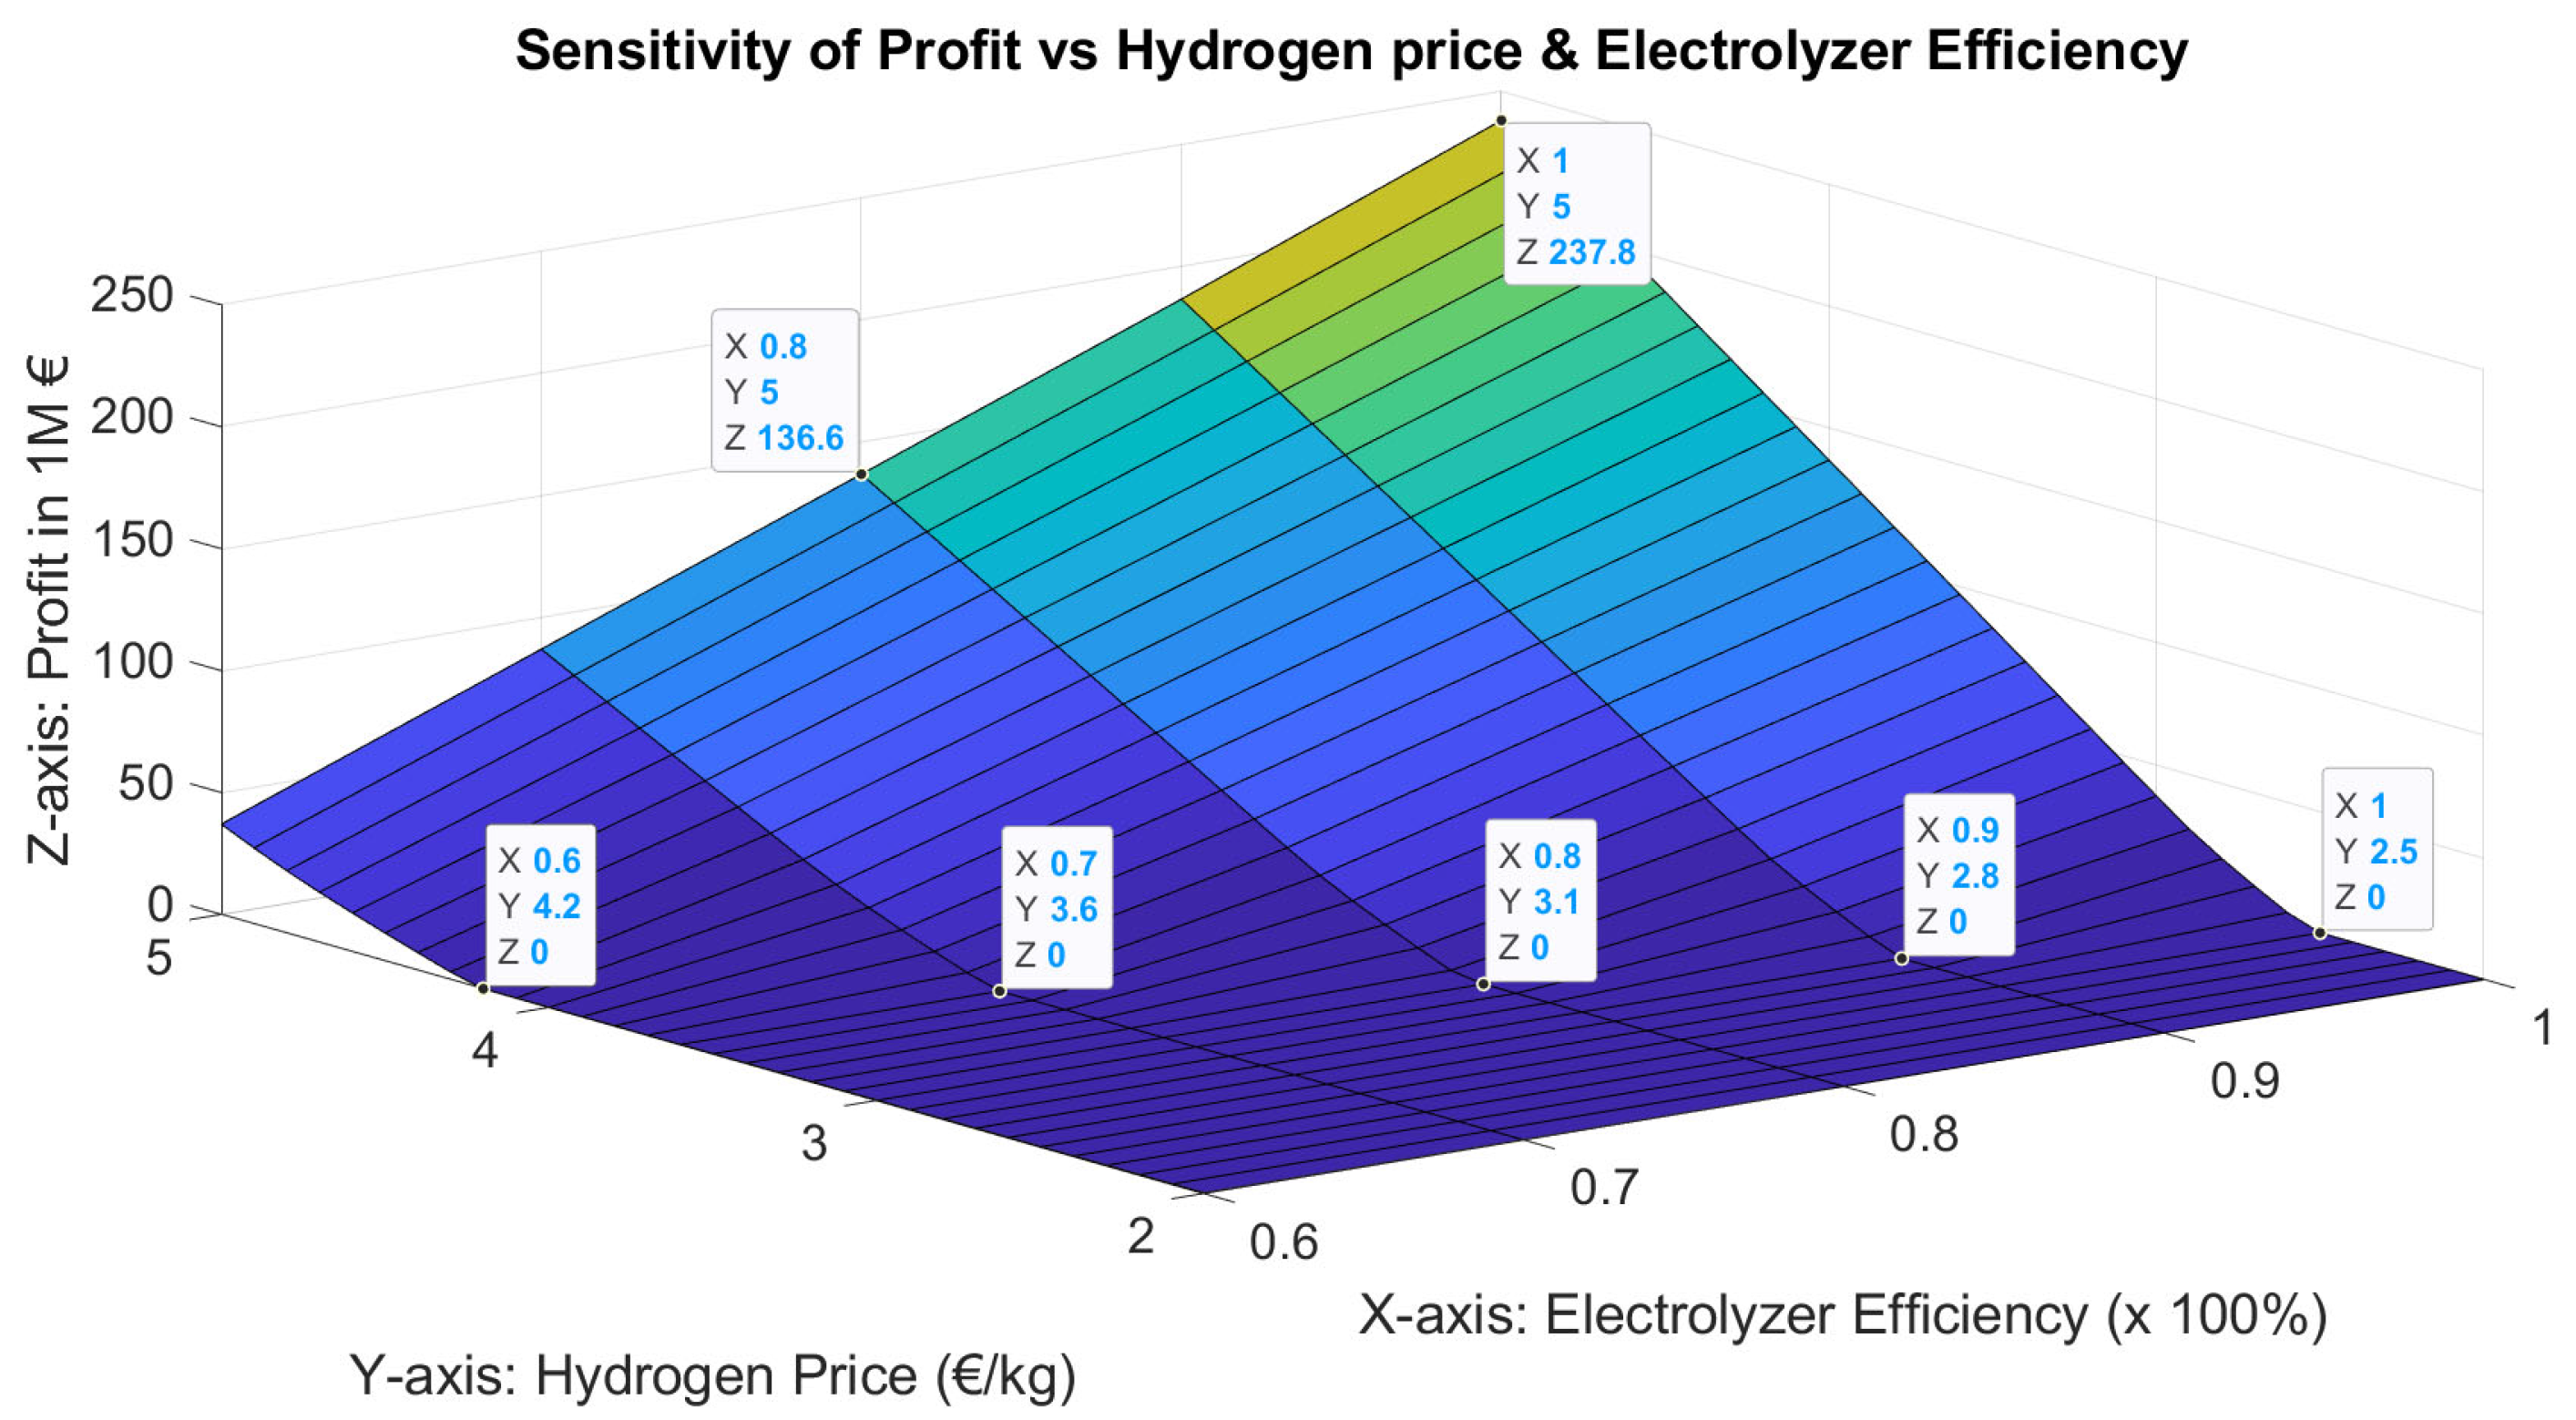
Figure 2 illustrates a three-dimensional sensitivity analysis of the profitability of a CGHPF, depicted along the Z-axis, against two key variables: hydrogen price (Y-axis) and electrolyzer efficiency (X-axis). The diagram is enhanced with strategically placed markers for clearer interpretation. This visual representation highlights the relationship between CGHPF profit, hydrogen cost, and electrolyzer efficiency. As expected, the highest profit is obtained at a hydrogen price of 5 EUR/kg and electrolyzer efficiency of 100%. Additionally, the analysis indicates a critical hydrogen selling price for each electrolyzer efficiency level, below which the CGHPF becomes unprofitable, as the optimization algorithm suggests zero output from solar, wind, and electrolyzer capacities in those cases. For instance, at 60% electrolyzer efficiency, the hydrogen must be sold for more than 4.2 EUR/kg to ensure profitability. Prices below 4.2 EUR/kg are not profitable; therefore, the optimization chooses 0 capacity for solar and wind installation. Remarkably, with perfect electrolyzer efficiency (100%), the CGHPF remains profitable even if hydrogen prices drop to as low as 2.5 EUR/kg. This suggests that improving electrolyzer efficiency (as technology improves) could allow for significantly lower hydrogen prices without compromising the investment’s profitability.

Figure 2.
Sensitivity of profit (Z-axis) vs. hydrogen selling price (Y-axis) and electrolyzer efficiency (X-axis).
4.2. Electrolyzer Cost
Figure 3 illustrates the relationship between profit, hydrogen pricing, and electrolyzer costs. Here, electrolyzer cost is shown as a percentage of the baseline cost, which is 1,672,000 Euros per MW, as detailed in Table 1. Notably, the peak profit of EUR 212.4 million is achieved with a hydrogen price of 5 EUR/kg and zero electrolyzer cost. Within Figure 3, there is a distinct threshold (critical hydrogen price) beyond which hydrogen production becomes unprofitable, resulting in zero profit as neither solar nor wind installations are selected under these conditions. A key observation is that as the cost of electrolyzers decreases, the critical hydrogen price for profitability significantly drops. For instance, if the electrolyzer cost is halved, the critical hydrogen selling price could fall to as low as 2.8 EUR/kg. This reduction approaches the prices associated with coal gasification methods, potentially making fuel cell electric vehicles more competitive, as noted in reference [33].
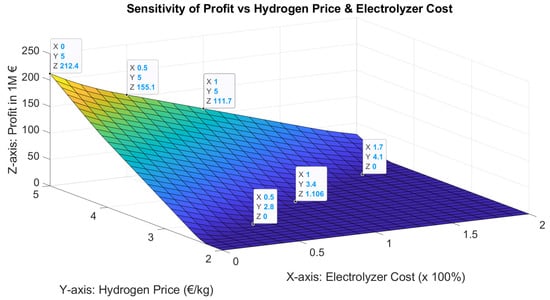
Figure 3.
Sensitivity of profit vs. hydrogen price and electrolyzer cost.
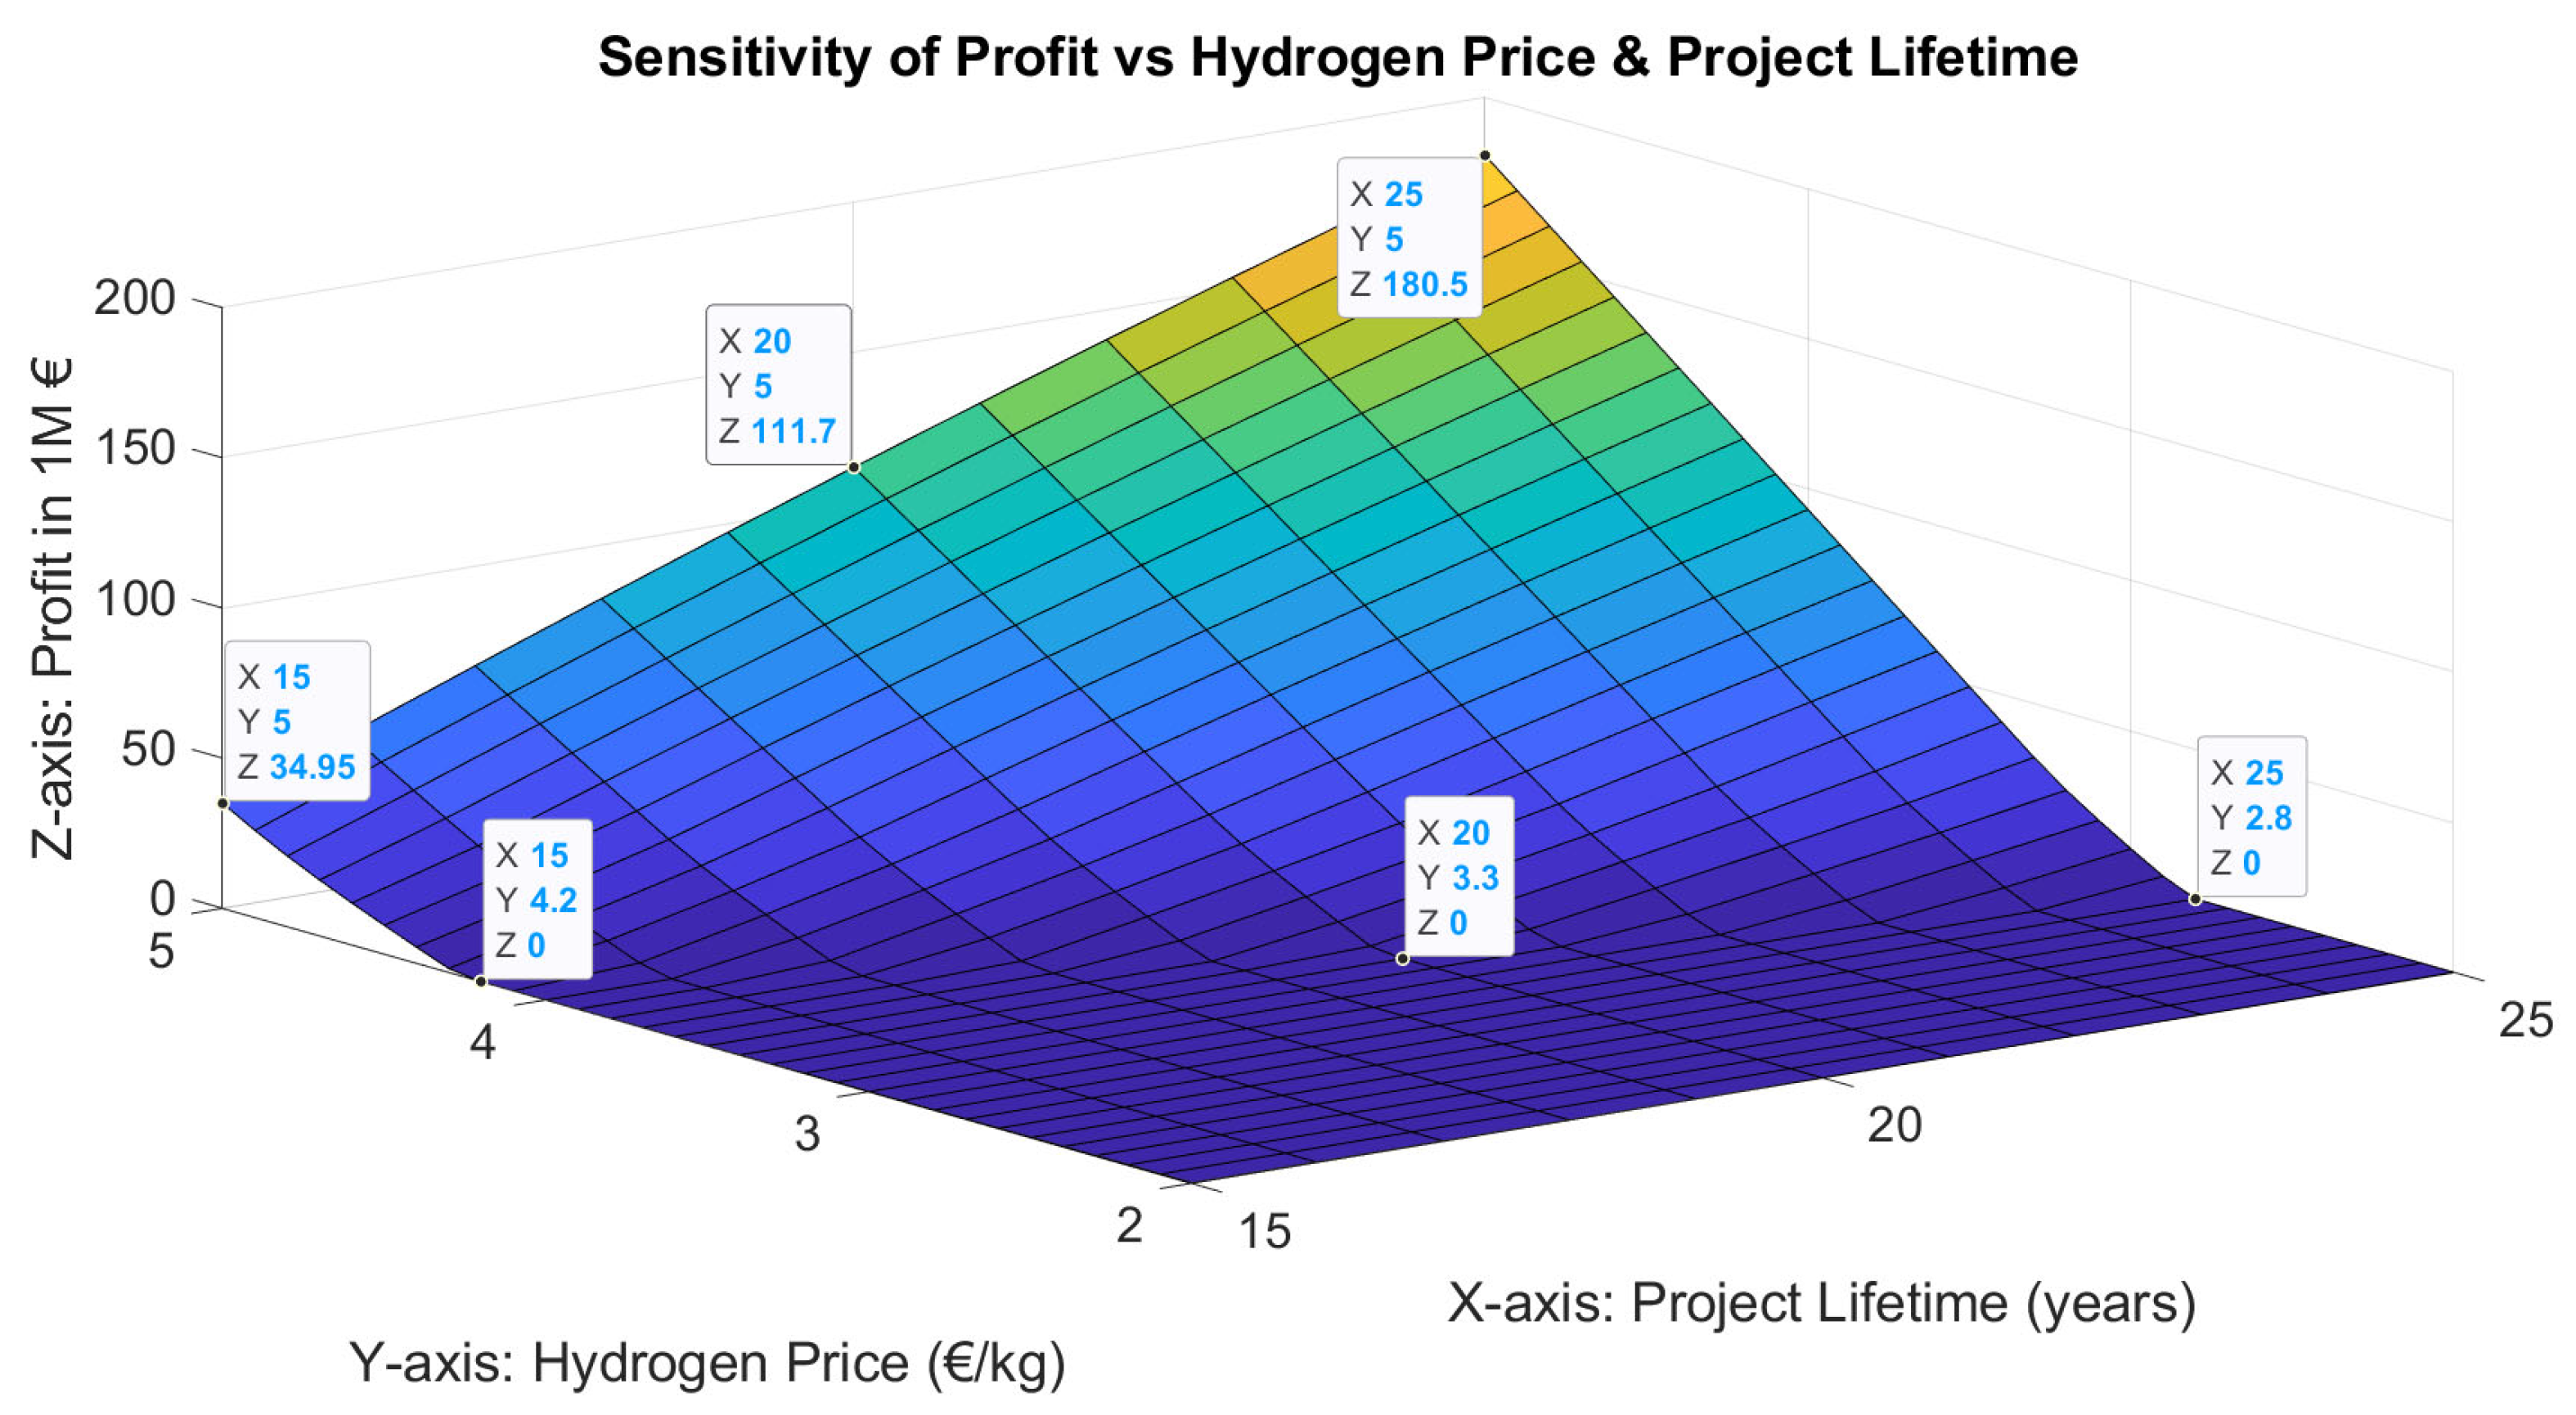
4.3. Project Lifetime
Figure 4 displays how net profit correlates with hydrogen pricing and the project’s lifespan. This section specifically examines how potential failures in project components, such as solar panels, wind turbines, and electrolyzers, before their expected lifespan affect the investment’s viability. As the project’s duration increases, so does the net profit. It is clear that the maximum net profit is achieved with a hydrogen price of 5 euros per kilogram and a project lifetime of 25 years. Notably, the critical value of hydrogen selling price rises as the project’s lifespan shortens. For instance, to ensure profitability for a 15-year project lifespan, the hydrogen price must exceed 4.2 EUR/kg, whereas for a 25-year lifespan, the critical price is only 2.8 EUR/kg. Additionally, it is observed that at the highest hydrogen price of 5 EUR/kg, the net profit varies considerably with its lifespan, ranging from 34.9 million euros for a 15-year duration to 180.5 million euros for a 25-year lifespan.

Figure 4.
Sensitivity of net profit vs. hydrogen price and project lifetime.
4.4. PV and Wind Installation Cost
Figure 5 explores the sensitivity of profit vs. hydrogen pricing and the cost of photovoltaic (PV) installations. Here, PV installation costs are represented as a percentage of the base cost outlined in Table 1 (EUR 1,220,000 per MW). A key observation is that as PV installation costs decrease—a likely trend with advancements in solar technology—hydrogen energy becomes profitable at increasingly lower hydrogen prices. For instance, as PV installation costs fluctuate between 70% and 130% of the base cost, the critical hydrogen price necessary for profitability ranges from 3 to 3.5 EUR/kg. Additionally, at a hydrogen price of 3.5 EUR/kg (the base scenario in Table 1), a 30% reduction in PV installation costs can boost the net profit from EUR 6.19 million (the base scenario) to EUR 19 million.
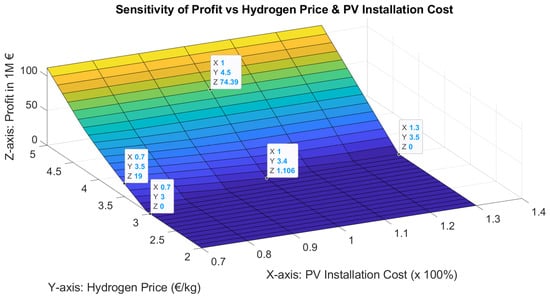
Figure 5.
Sensitivity of profit vs. hydrogen price and PV installation cost.
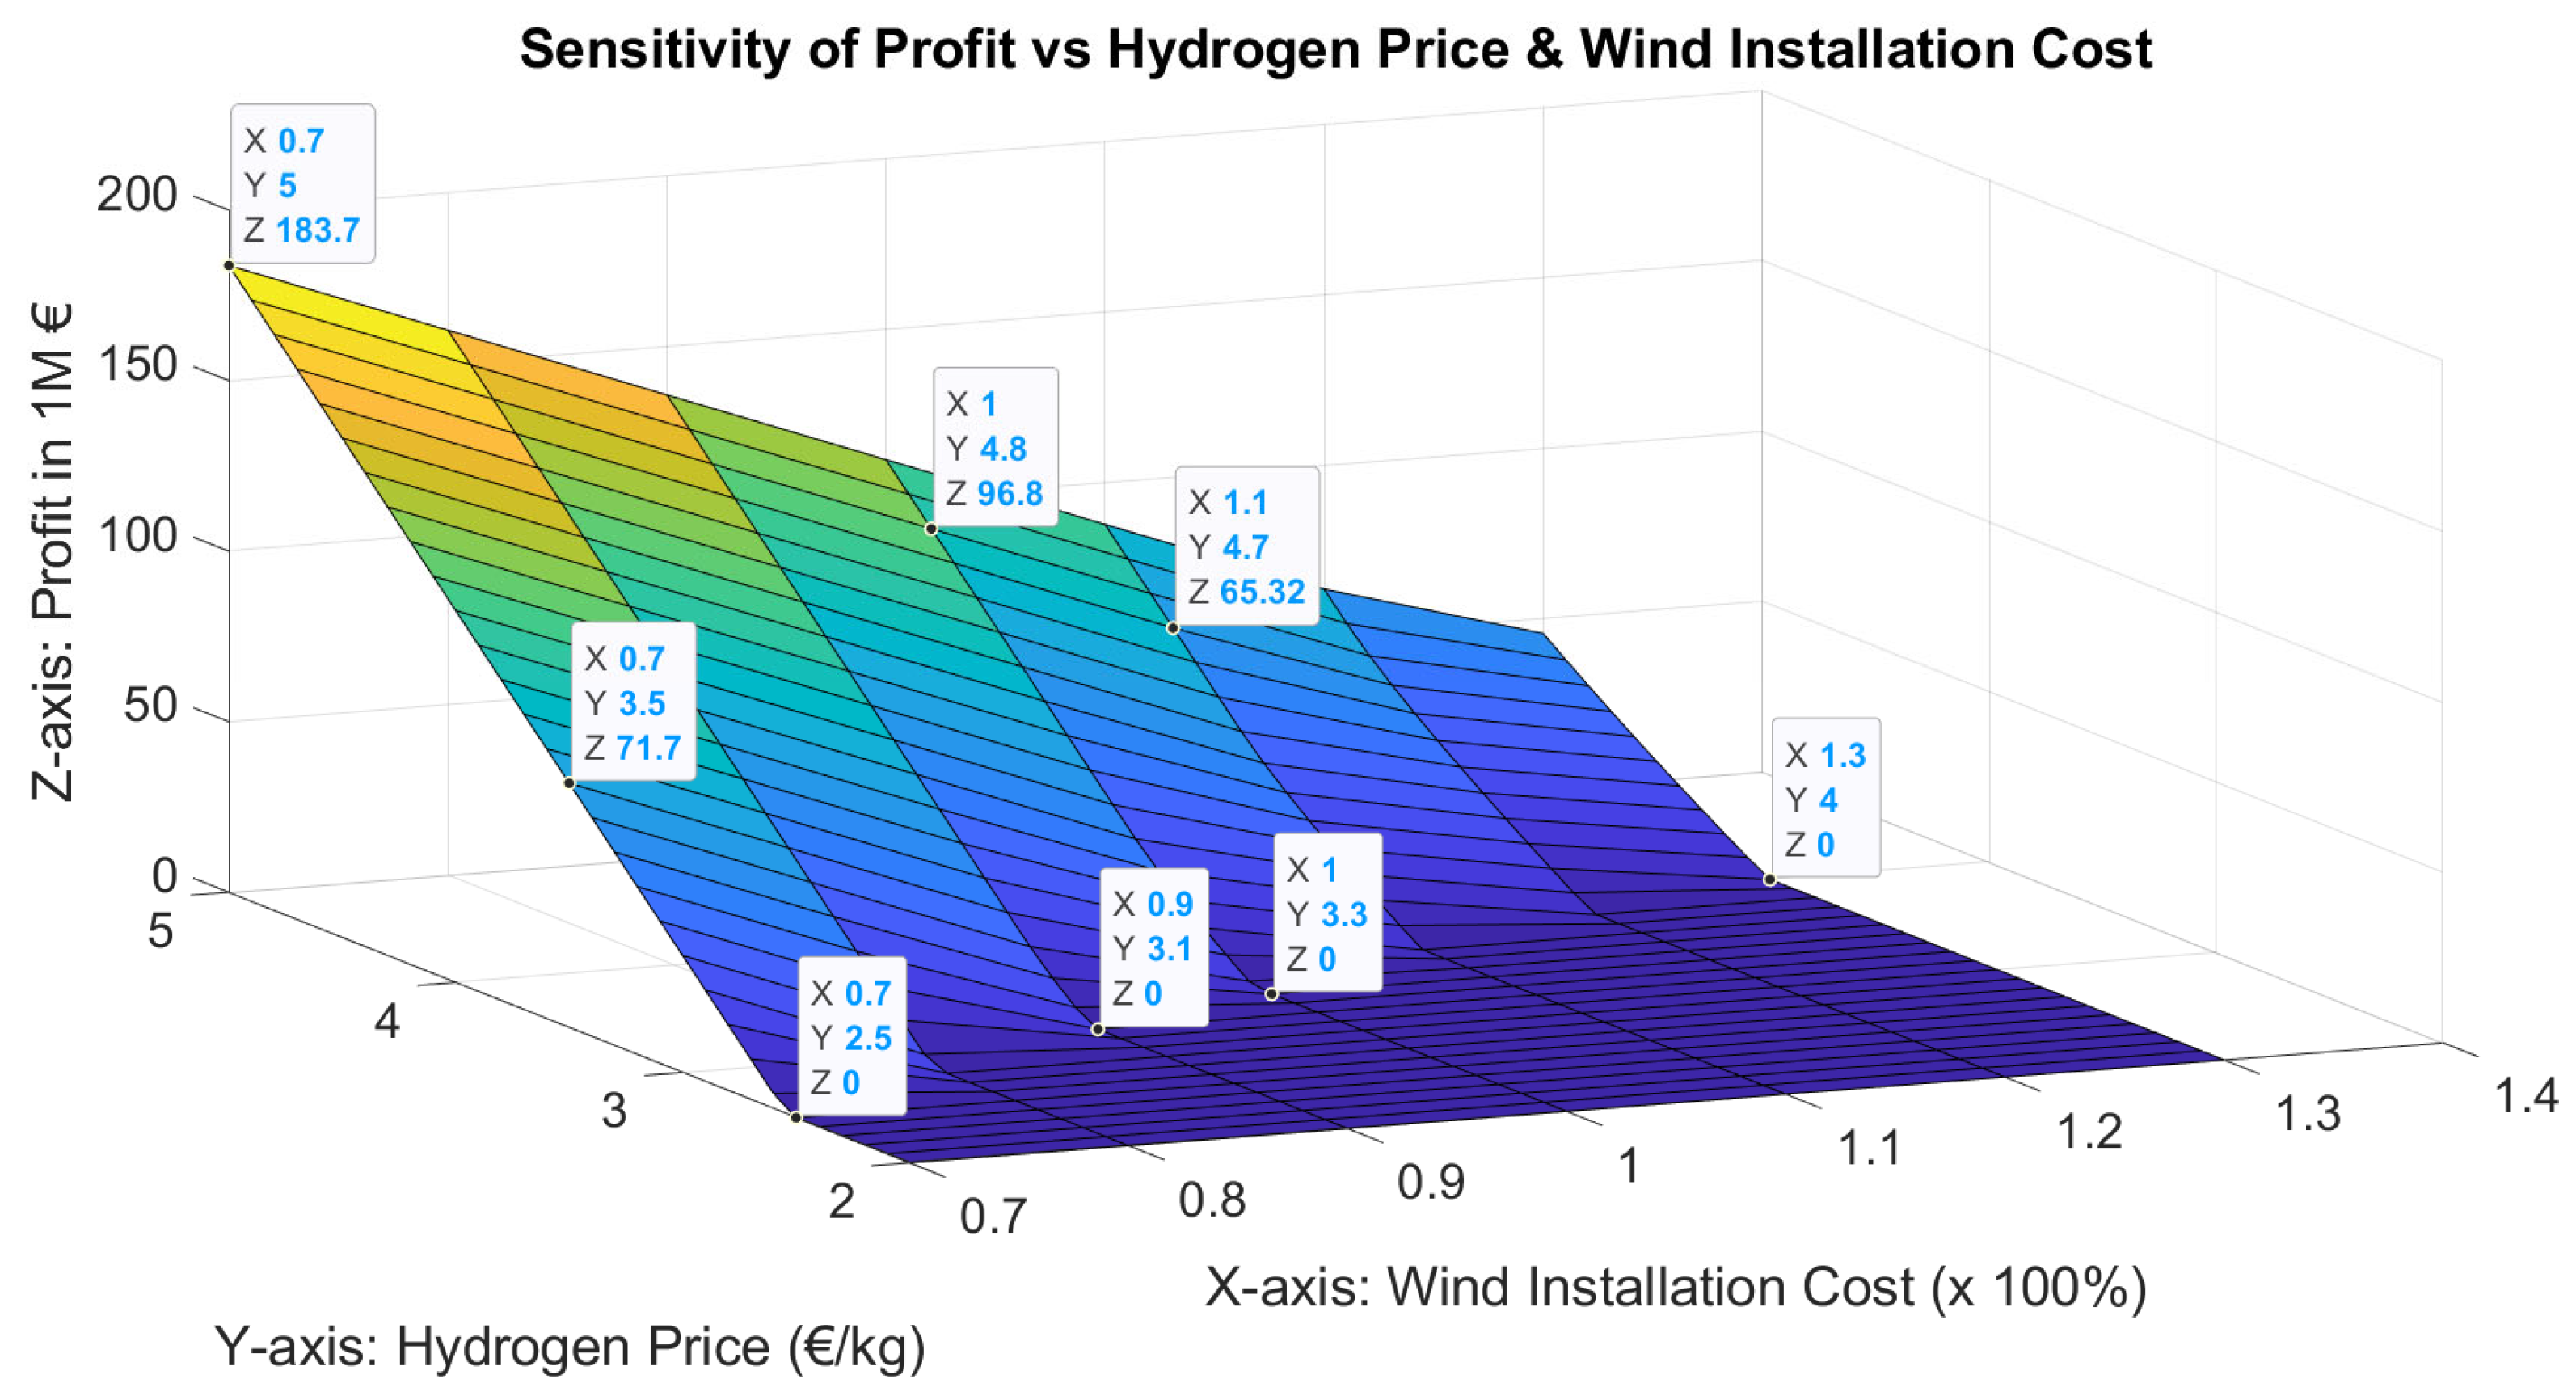
Figure 6 demonstrates the relationship between profit, hydrogen price, and the cost of wind installations. The cost of wind installations is shown as a percentage of the base cost, which is specified in Table 1 (1,850,000 euros per MW). There are two critical observations: (a) When the cost of wind installation decreases to 70% of the current cost, the critical hydrogen price drops significantly to just 2.5 EUR/kg. This underscores the substantial impact that wind installation costs have on the investment’s viability. (b) At a hydrogen price of 3.5 EUR/kg (the base scenario), a 30% reduction in wind installation costs can dramatically increase the net profit from EUR 6.19 million (the base scenario) to EUR 71.7 million.
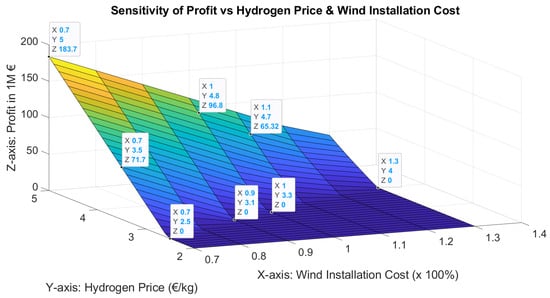
Figure 6.
Sensitivity of profit vs. hydrogen price and wind installation cost.
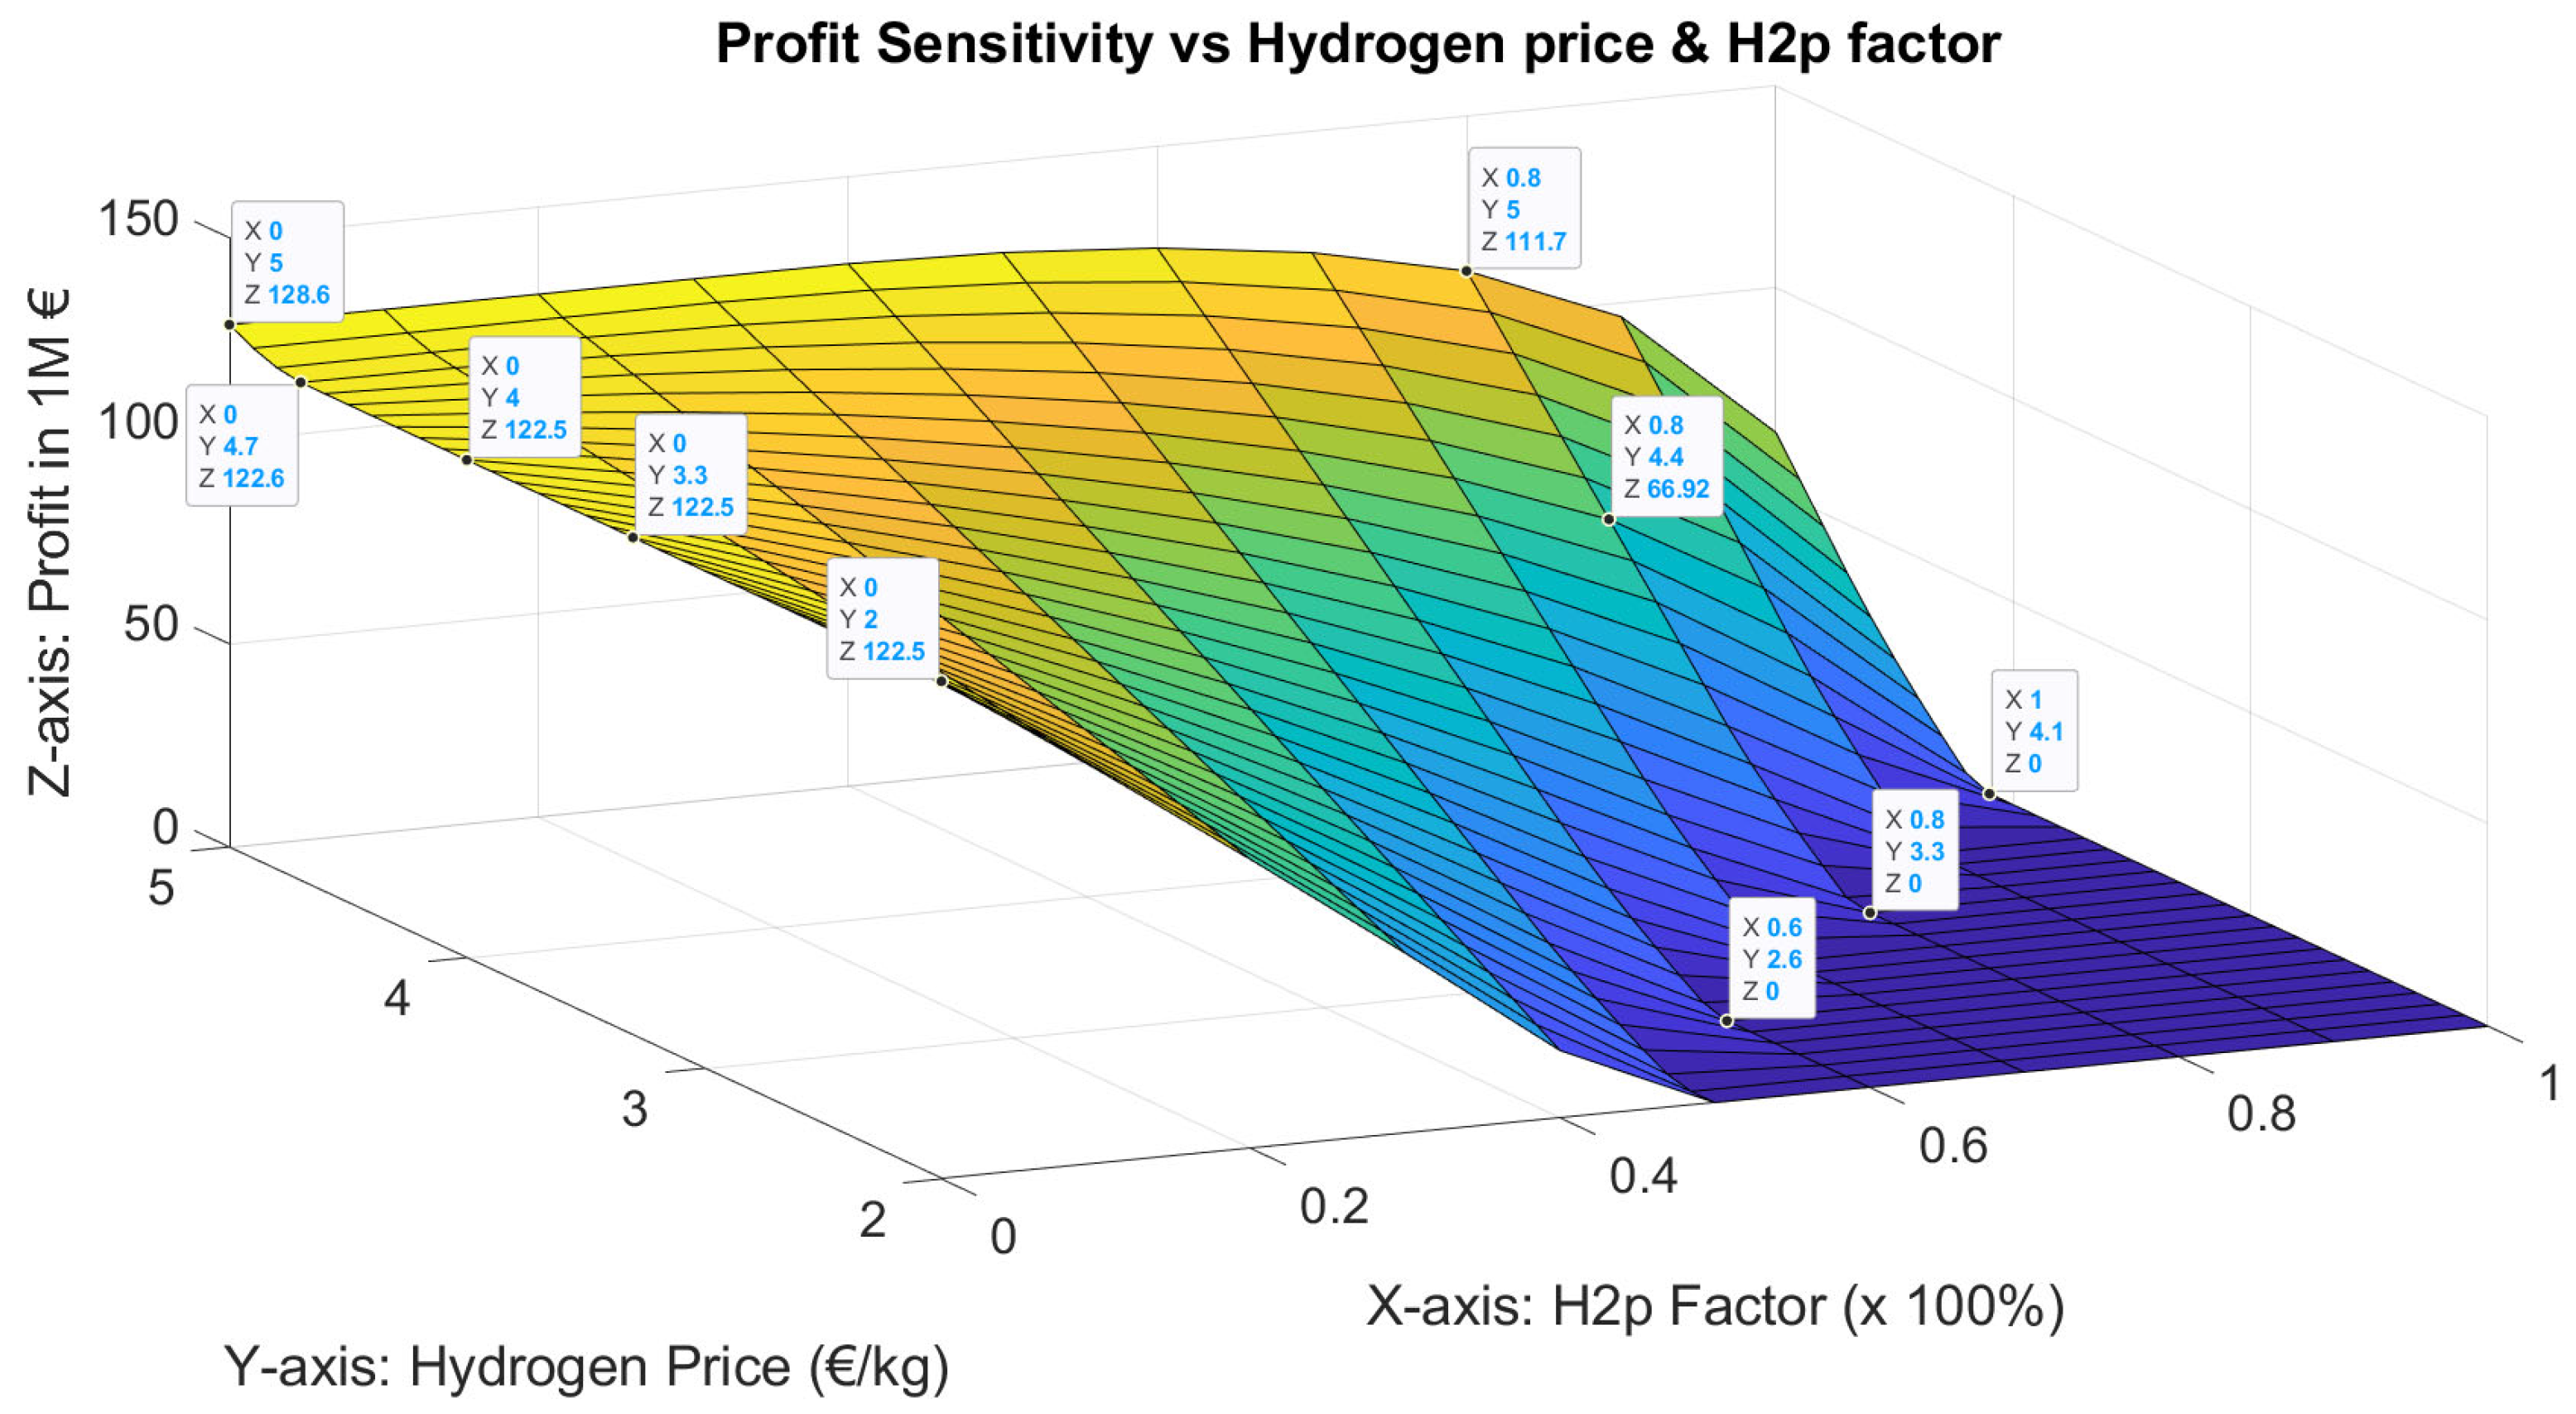
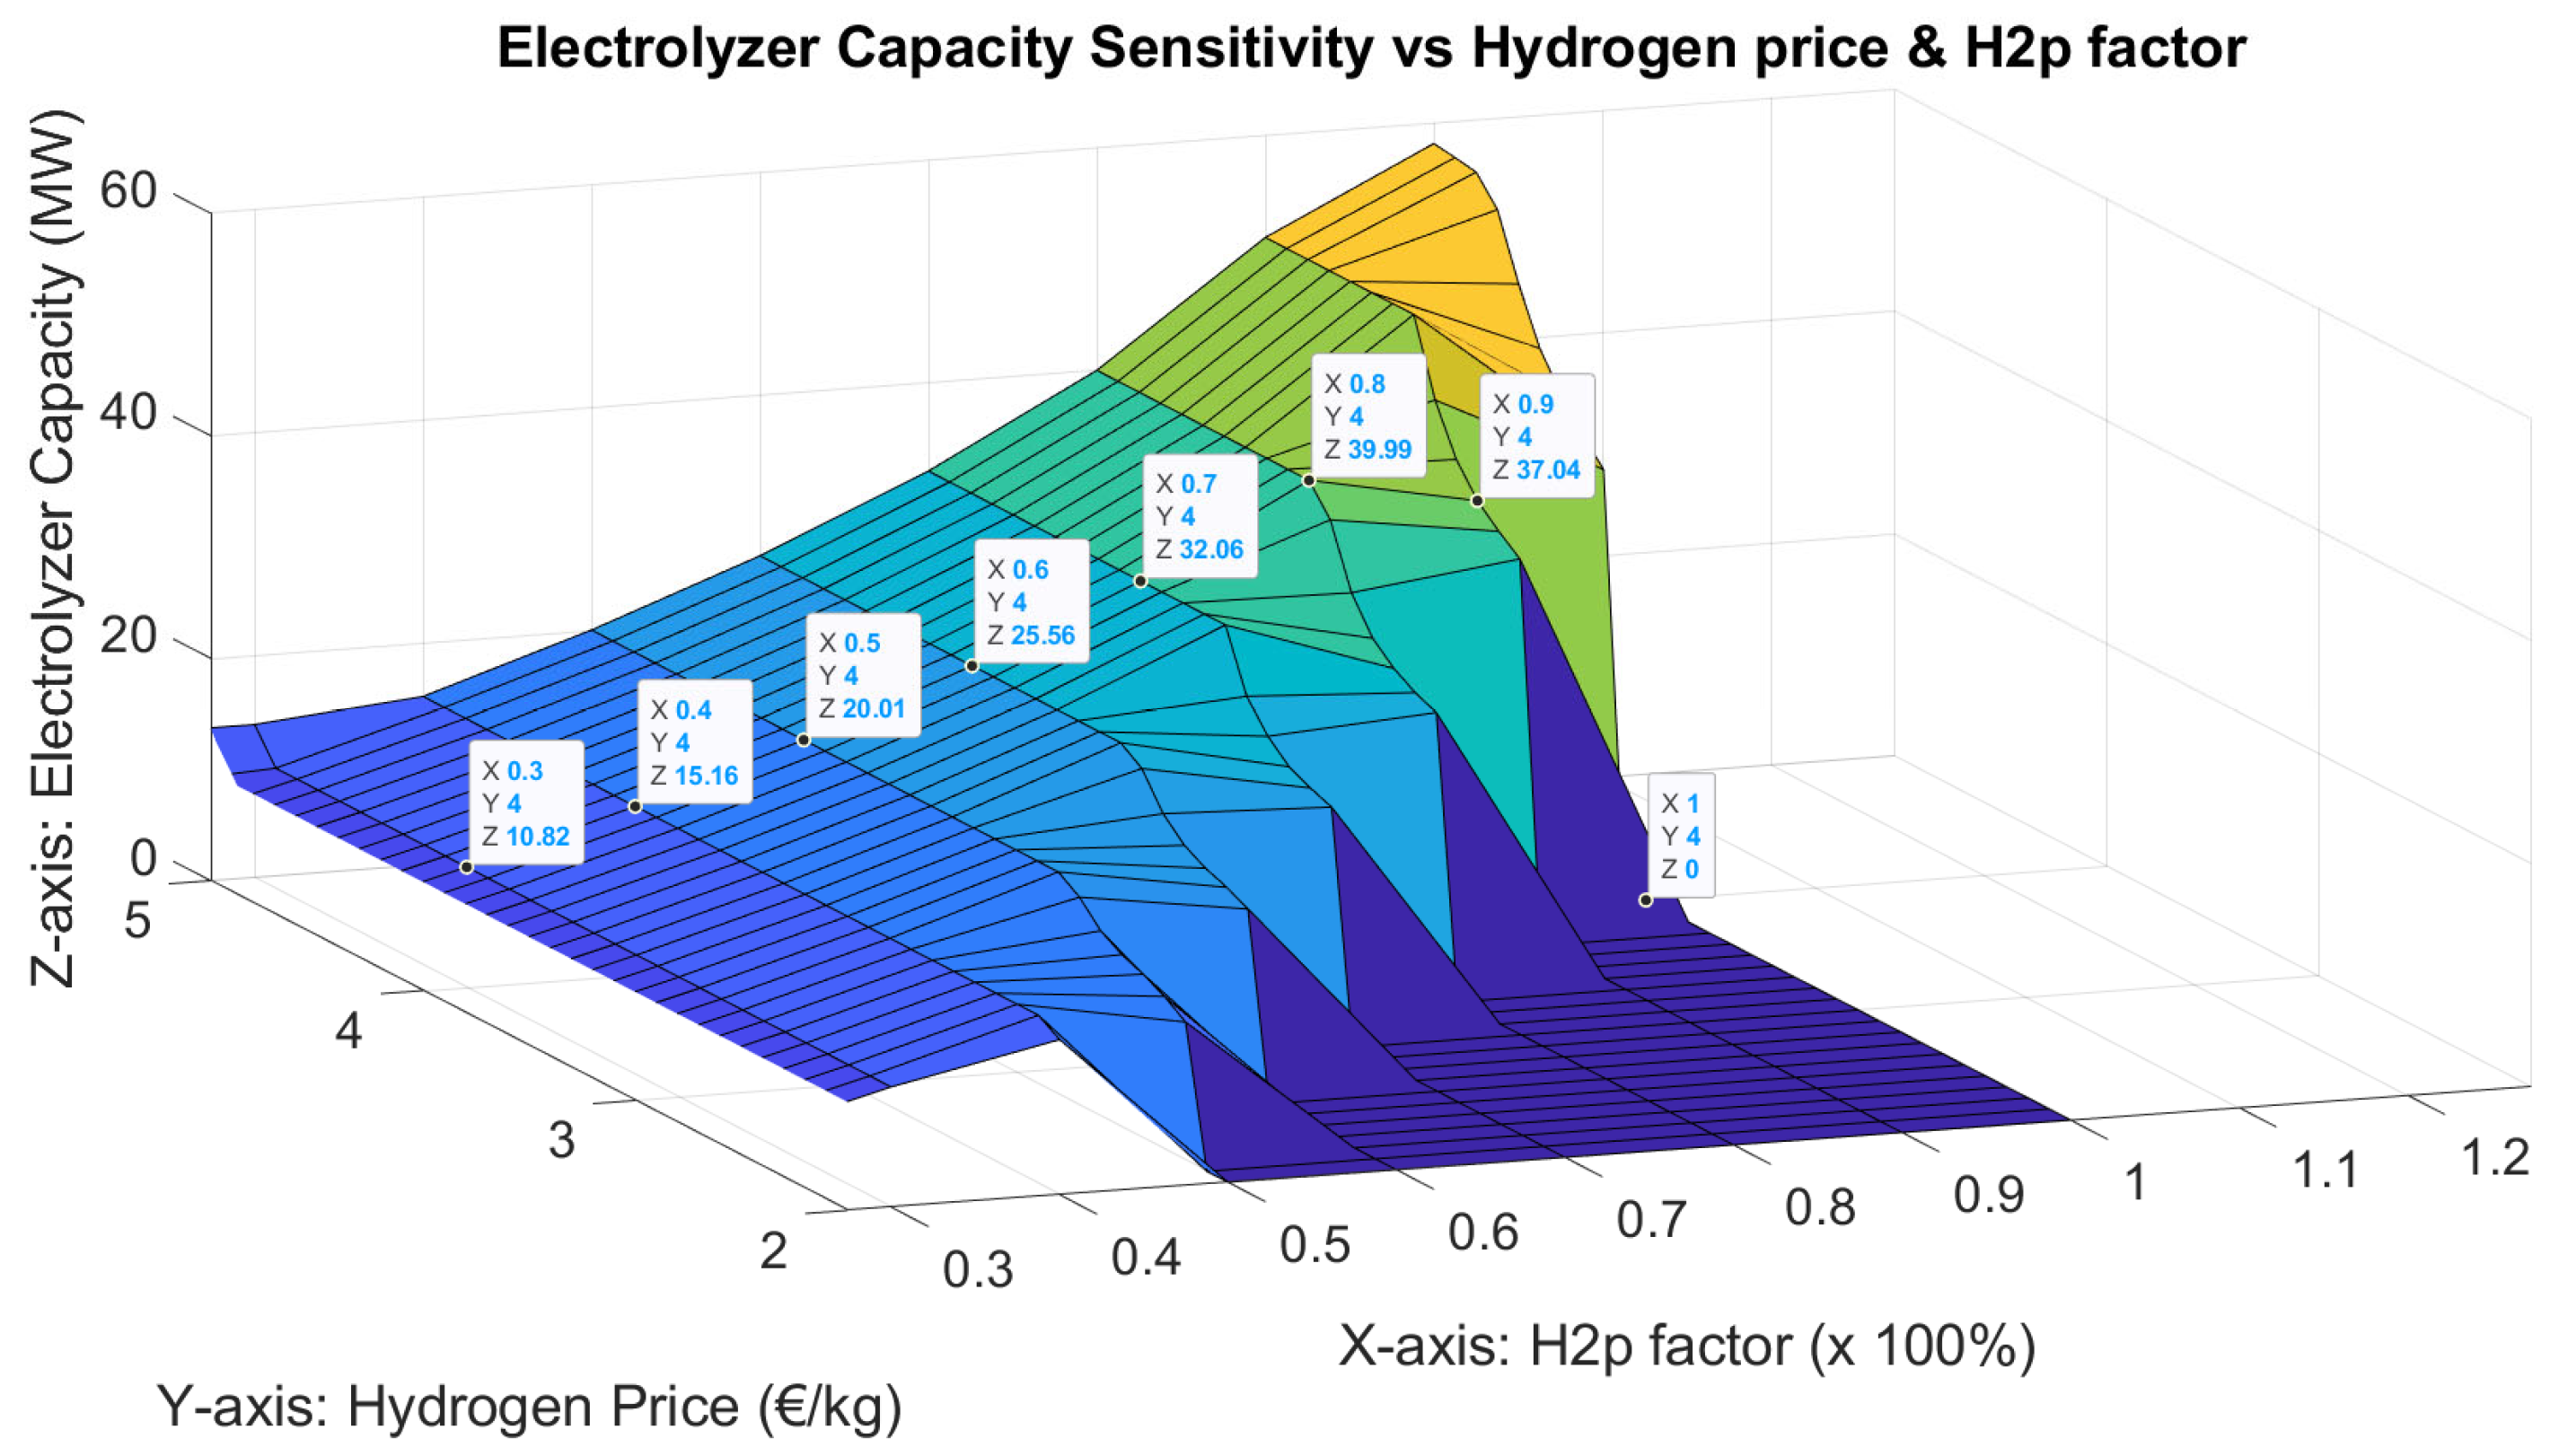
4.5. Factor
Figure 7 illustrates the relationship between profit sensitivity and two key variables: the hydrogen price and the factor. The factor represents the minimum percentage of annual cumulative renewable energy that must be converted into hydrogen energy. For instance, an factor of 80% indicates that a minimum of 80% of the annual cumulative renewable energy is directed toward the electrolyzer, as shown in Figure 1. Meanwhile, Figure 8 displays how the electrolyzer capacity varies with changes in the hydrogen price and the factor. Observations from both Figure 7 and Figure 8 reveal several noteworthy points:

Figure 7.
Sensitivity of profit vs. hydrogen price and factor.

Figure 8.
Sensitivity of electrolyzer capacity vs. hydrogen price and factor.
- ▪
- When the factor is set to 0% (indicating no restrictions on direct renewable energy injection into the grid), hydrogen production turns profitable only if the selling price exceeds 4.7 EUR/kg (Figure 7). This is because the direct injection of renewable power into the grid is more economically competitive at lower hydrogen prices, resulting in a potential net profit of up to EUR 122.5 million;
- ▪
- With the factor at 100% (meaning no direct injection of renewables into the grid), the critical hydrogen selling price for profitability stands at approximately 4.1 EUR/kg. This is notably higher than the 3.3 EUR/kg threshold identified for an factor of 80%. This comparison demonstrates that permitting a small portion of renewable power to be directly injected into the grid markedly lowers the critical selling price of hydrogen. Such a strategy substantially enhances both the profitability and the attractiveness of the investment;
- ▪
- Permitting a modest direct integration of renewable energy into the grid significantly boosts electrolyzer capacity, as shown in Figure 8. For instance, relaxing the factor from 100% to 80% at a steady hydrogen selling price of 4 EUR/kg leads to an increase in electrolyzer capacity from 0 to 39.99 MW. This relaxation facilitates investment in green hydrogen projects. A key finding of this study, highlighted in Figure 8, is that for every specific hydrogen price, there exists an optimal factor at which the electrolyzer capacity is maximized, e.g., for 4 EUR/kg, the optimal . This strategy allows for a rapid expansion of the island’s electrolyzer capacity in an economically viable way without overloading the electric grid, thanks to the small portion of direct renewable penetration.
5. Conclusions and Discussion
This manuscript presents an economic viability assessment for a Centralized Green Hydrogen Production Facility (CGHPF) in Crete, Greece, leveraging the island’s exceptional wind and solar potential. It introduces a mixed-integer linear programming (MILP) framework to optimize the installation of the CGHPF, considering factors such as land area, wind and solar potential, and costs. This study underscores Crete’s potential as a prime candidate for comprehensive green hydrogen initiatives, utilizing its unique wind and solar resources.
The optimization model provided serves as a crucial tool for determining the optimal installation of various components in a CGHPF, including the electrolyzer, hydrogen tank, solar, and wind installations. Formulated as a linear programming problem, the optimization is implemented using the CPLEX solver in MATLAB, aiming to maximize the total installation profit over the project’s lifetime.
Simulation results validate the feasibility of selling hydrogen in Crete at competitive prices, with estimates as low as 3.5 EUR/kg of H2. Specifically, under the base scenario, it was determined that selling hydrogen at this price could yield a substantial net profit of EUR 6.19 million. This profitability stems from Crete’s exceptional renewable energy potential. To highlight, Table 3 depicts the optimized profit for green hydrogen facilities in different regions around the world using the proposed optimization model under uniform assumptions, such as land availability and selling price of hydrogen, based on the data of Table 1. Notably, Crete’s substantial renewable energy potential makes it a particularly promising site for hydrogen investment.
Table 3.
Optimized profit for green hydrogen facilities around the world with uniform land availability. Insights from sources [34,35].
A significant finding from the simulations is that even a modest direct injection of renewable power into the grid (instead of being injected to the electrolyzer) significantly encourages the expansion of electrolyzer capacity. With a hydrogen selling price of 4 EUR/kg, allowing an annual 20% direct renewable penetration into the grid increases electrolyzer capacity from 0 to 39.99 MW, resulting in a surge in investment profit from EUR 0 to 37 million, as illustrated in Figure 8. Therefore, a policy recommendation to allow at least 20% direct penetration of renewable sources of green hydrogen facilities into the grid is suggested to encourage and accelerate the green hydrogen expansion.
The establishment of centralized hydrogen facilities goes beyond mere economic returns for investors. It has transformative benefits to both Transmission System Operators (TSOs) and Distribution System Operators (DSOs). By producing, storing, and utilizing energy locally, it significantly reduces the strain on existing grid infrastructures. This local energy management approach mitigates the need for extensive system upgrades, presenting a more effective and sustainable method of renewable energy expansion. Moreover, hydrogen facilities empower islands to have greater control over their energy future. Islands become active participants in the transition to cleaner and more sustainable energy systems, acquiring a sense of ownership and responsibility for energy production and consumption. These projects also create new economic opportunities and new jobs in hydrogen production, distribution, and maintenance while attracting sustainable tourism centered around eco-friendly energy practices. Additionally, as islands often face the burden of climate change impacts, the availability of locally produced hydrogen enhances community resilience by providing a reliable energy source during extreme weather events and reducing electricity interruptions. The growth of hydrogen-based energy systems into islands will also contribute to national economic prosperity and counteract “brain drain” by attracting scientific and technical talent. Environmentally, it contributes to a marked decrease in carbon dioxide emissions, aligning with global efforts to tackle climate change. Finally, the seamless availability of cheap green hydrogen could forward hydrogen mobility, introducing more affordable and cleaner transportation options. This shift away from traditional fuels also lessens the reliance on imported fossil fuels, further promoting economic stability and environmental conservation. This combination of energy security, economic growth, and climate resilience has a profound and positive social impact, elevating the quality of life for island residents and inspiring similar initiatives in regions around the world.
Author Contributions
A.A. and E.E.P.; methodology, A.A. and E.E.P.; software, A.A.; validation, A.A. and E.E.P.; formal analysis, A.A. and E.E.P.; investigation, A.A. and E.E.P.; resources, A.A. and E.E.P.; data curation, A.A. and E.E.P.; writing—original draft preparation, A.A. and E.E.P.; writing—review and editing, A.A., E.E.P., Y.K. and E.S.K.; visualization, A.A., E.E.P., Y.K. and E.S.K.; supervision, A.A., E.E.P., Y.K. and E.S.K.; project administration, Y.K. and E.S.K.; funding acquisition, Y.K. and E.S.K. All authors have read and agreed to the published version of the manuscript.
Funding
This work received financial support from the project “Enhancing resilience of Cretan power system using distributed energy resources (CResDER)” (Proposal ID: 03698) financed by the Hellenic Foundation for Research and Innovation (H.F.R.I.) under the Action “2nd Call for H.F.R.I. Research Projects” to support Faculty Members and Researchers.
Conflicts of Interest
The authors declare no conflict of interest.
Nomenclature
| Variable | Description | Unit |
| lifetime | Project lifetime | years |
| Power input of electrolyzer at time t | V | |
| Wind generation at time t | V | |
| Normalized wind generation at time t | pu | |
| Solar generation at time t | MW | |
| Normalized solar generation at time t | pu | |
| Power to the grid at time t | MW | |
| Solar installation capacity | MW | |
| Wind installation capacity | MW | |
| Electrolyzer installation capacity | MW | |
| Hydrogen charging tank at time t | MW | |
| Hydrogen charging tank at time t | MW | |
| Hydrogen tank state at time t | MWh | |
| Hydrogen tank installation capacity | MWh | |
| Wind farm density | km2/MW | |
| Solar farm density | km2/MW | |
| Available land area | km2 | |
| Cost of solar PV installation per MW | EUR/MW | |
| Cost of wind installation per MW | EUR/MW | |
| Cost of hydrogen tank per MWh | EUR/MWh | |
| Cost of electrolyzer per MW | EUR/MW | |
| Selling price of hydrogen | EUR/MWh | |
| Selling price of electricity | EUR/MWh | |
| Inflation rate | % | |
| Binary variable for the MILP problem | - | |
| Sufficiently large number for the MILP problem | - | |
| Electrolyzer efficiency | - | |
| Percentage of annual renewable generation converted to hydrogen | % |
Appendix A
The nonlinear Equation (8) is linearized via the linear inequalities (A1)–(A3):
From Equation (A1), if , then . In that case, Equation (A2) yields . Similarly, if , then . In that case, Equation (A3) yields . Using (A1)–(A3), the nonlinear Equation (8) is linearized, enabling the solution of the proposed optimization formulation with commercial MILP solvers.
References
- Vivanco-Martín, B.; Iranzo, A. Analysis of the European Strategy for Hydrogen: A Comprehensive Review. Energies 2023, 16, 3866. [Google Scholar] [CrossRef]
- European Commission. REPowerEU: Joint European Action for More Affordable, Secure and Sustainable Energy. Available online: https://ec.europa.eu/commission/presscorner/detail/en/IP_22_1511 (accessed on 2 September 2023).
- European Commission. Key Actions of the EU Hydrogen Strategy. Available online: https://energy.ec.europa.eu/topics/energy-systems-integration/hydrogen/key-actions-eu-hydrogen-strategy_en (accessed on 2 September 2023).
- Stori, V. Offshore Wind to Green Hydrogen; Technical Report; Clean Energy States Alliance: Montpelier, VT, USA, 2021. [Google Scholar]
- Clean Hydrogen Partnership. Mission Innovation. Hydrogen Valley Platform. Available online: https://www.h2v.eu/ (accessed on 7 June 2022).
- European Commission. Clean Energy for EU Islands. Available online: https://clean-energy-islands.ec.europa.eu/islands (accessed on 2 September 2023).
- Nazir, H.; Louis, C.; Jose, S.; Prakash, J.; Muthuswamy, N.; Buan, M.E.; Flox, C.; Chavan, S.; Shi, X.; Kauranen, P.; et al. Is the H2 economy realizable in the foreseeable future? Part I: H2 production methods. Int. J. Hydrogen Energy 2020, 45, 13777–13788. [Google Scholar] [CrossRef]
- Nazir, H.; Muthuswamy, N.; Louis, C.; Jose, S.; Prakash, J.; Buan, M.E.; Flox, C.; Chavan, S.; Shi, X.; Kauranen, P.; et al. Is the H2 economy realizable in the foreseeable future? Part II: H2 storage, transportation, and distribution. Int. J. Hydrogen Energy 2020, 45, 20693–20708. [Google Scholar] [CrossRef]
- Kim, M.; Kim, J. An integrated decision support model for design and operation of a wind-based hydrogen supply system. Int. J. Hydrogen Energy 2017, 42, 3899–3915. [Google Scholar] [CrossRef]
- Lokar, J.; Virtič, P. The potential for integration of hydrogen for complete energy self-sufficiency in residential buildings with photovoltaic and battery storage systems. Int. J. Hydrogen Energy 2020, 45, 34566–34578. [Google Scholar] [CrossRef]
- Jafari, M.; Armaghan, D.; Mahmoudi, S.S.; Chitsaz, A. Thermoeconomic analysis of a standalone solar hydrogen system with hybrid energy storage. Int. J. Hydrogen Energy 2019, 44, 19614–19627. [Google Scholar] [CrossRef]
- Peppas, A.; Kollias, K.; Politis, A.; Karalis, L.; Taxiarchou, M.; Paspaliaris, I. Performance evaluation and life cycle analysis of RES-hydrogen hybrid energy system for office building. Int. J. Hydrogen Energy 2021, 46, 6286–6298. [Google Scholar] [CrossRef]
- Dursun, B. Determination of the optimum hybrid renewable power generating systems for Kavakli campus of Kirklareli University, Turkey. Renew. Sustain. Energy Rev. 2012, 16, 6183–6190. [Google Scholar] [CrossRef]
- Kalantari, H.; Ghoreishi-Madiseh, S.A.; Sasmito, A.P. Hybrid Renewable Hydrogen Energy Solution for Application in Remote Mines. Energies 2020, 13, 6365. [Google Scholar] [CrossRef]
- Nguyen, H.Q.; Aris, A.M.; Shabani, B. PEM fuel cell heat recovery for preheating inlet air in standalone solar-hydrogen systems for telecommunication applications: An exergy analysis. Int. J. Hydrogen Energy 2016, 41, 2987–3003. [Google Scholar] [CrossRef]
- Brown, T.; Stephens-Romero, S.; Samuelsen, G.S. Quantitative analysis of a successful public hydrogen station. Int. J. Hydrogen Energy 2012, 37, 12731–12740. [Google Scholar] [CrossRef]
- Silvestri, L.; Di Micco, S.; Forcina, A.; Minutillo, M.; Perna, A. Power-to-hydrogen pathway in the transport sector: How to assure the economic sustainability of solar powered refueling stations. Energy Convers. Manag. 2021, 252, 115067. [Google Scholar] [CrossRef]
- El-Emam, R.S.; Özcan, H. Comprehensive review on the techno-economics of sustainable large-scale clean hydrogen production. J. Clean. Prod. 2019, 220, 593–609. [Google Scholar] [CrossRef]
- Seyam, S.; Dincer, I.; Agelin-Chaab, M. Analysis of a clean hydrogen liquefaction plant integrated with a geothermal system. J. Clean. Prod. 2020, 243, 118562. [Google Scholar] [CrossRef]
- Fereidooni, M.; Mostafaeipour, A.; Kalantar, V.; Goudarzi, H. A comprehensive evaluation of hydrogen production from photovoltaic power station. Renew. Sustain. Energy Rev. 2018, 82 Pt 1, 415–423. [Google Scholar] [CrossRef]
- Fasihi, M.; Breyer, C. Baseload electricity and hydrogen supply based on hybrid PV-wind power plants. J. Clean. Prod. 2020, 243, 118466. [Google Scholar] [CrossRef]
- Nematollahi, O.; Alamdari, P.; Jahangiri, M.; Sedaghat, A.; Alemrajabi, A.A. A techno-economical assessment of solar/wind resources and hydrogen production: A case study with GIS maps. Energy 2019, 175, 914–930. [Google Scholar] [CrossRef]
- Tlili, O.; Mansilla, C.; Robinius, M.; Syranidis, K.; Reuss, M.; Linssen, J.; André, J.; Perez, Y.; Stolten, D. Role of electricity interconnections and impact of the geographical scale on the French potential of producing hydrogen via electricity surplus by 2035. Energy 2019, 172, 977–990. [Google Scholar] [CrossRef]
- Khosravi, A.; Syri, S.; Assad, M.; Malekan, M. Thermodynamic and economic analysis of a hybrid ocean thermal energy conversion/photovoltaic system with hydrogen-based energy storage system. Energy 2019, 172, 304–319. [Google Scholar] [CrossRef]
- Hasan, T.; Emami, K.; Shah, R.; Hassan, N.; Belokoskov, V.; Ly, M. Techno-economic Assessment of a Hydrogen-based Islanded Microgrid in North-east. Energy Rep. 2023, 9, 3380–3396. [Google Scholar] [CrossRef]
- Hou, P.; Enevoldsen, P.; Eichman, J.; Hu, W.; Jacobson, M.Z.; Chen, Z. Optimizing investments in coupled offshore wind -electrolytic hydrogen storage systems in Denmark. J. Power Sources 2017, 359, 186–197. [Google Scholar] [CrossRef]
- Apostolou, D.; Enevoldsen, P. The past, present and potential of hydrogen as a multifunctional storage application for wind power. Renew. Sustain. Energy Rev. 2019, 112, 917–929. [Google Scholar] [CrossRef]
- Genç, M.S.; Çelik, M.; Karasu, I. A review on wind energy and wind–hydrogen production in Turkey: A case study of hydrogen production via electrolysis system supplied by wind energy conversion system in Central Anatolian Turkey. Renew. Sustain. Energy Rev. 2012, 16, 6631–6646. [Google Scholar] [CrossRef]
- Katsaprakakis, D.A.; Michopoulos, A.; Skoulou, V.; Dakanali, E.; Maragkaki, A.; Pappa, S.; Antonakakis, I.; Christakis, D.; Condaxakis, C. A Multidisciplinary Approach for an Effective and Rational Energy Transition in Crete Island, Greece. Energies 2022, 15, 3010. [Google Scholar] [CrossRef]
- Pompodakis, E.E.; Kryonidis, G.C.; Karapidakis, E.S. Optimizing the installation of hybrid power plants in non-interconnected islands. J. Energy Storage 2023, 74 Pt B, 109511. [Google Scholar] [CrossRef]
- Global Hydrogen Review 2022, IEA. Available online: https://www.iea.org/reports/global-hydrogen-review-2022/executive-summary (accessed on 5 April 2024).
- Harmonized Index of Consumer Prices (HICP) Inflation Rate in Europe in December 2023, by Country. Available online: https://www.statista.com/statistics/225698/monthly-inflation-rate-in-eu-countries/ (accessed on 5 April 2024).
- Albatayneh, A.; Juaidi, A.; Jaradat, M.; Manzano-Agugliaro, F. Future of Electric and Hydrogen Cars and Trucks: An Overview. Energies 2023, 16, 3230. [Google Scholar] [CrossRef]
- Pfenninger, S.; Staffell, I. Long-term patterns of European PV output using 30 years of validated hourly reanalysis and satellite data. Energy 2016, 114, 1251–1265. [Google Scholar] [CrossRef]
- Staffell, I.; Pfenninger, S. Using Bias-Corrected Reanalysis to Simulate Current and Future Wind Power Output. Energy 2016, 114, 1224–1239. [Google Scholar] [CrossRef]


Disclaimer/Publisher’s Note: The statements, opinions and data contained in all publications are solely those of the individual author(s) and contributor(s) and not of MDPI and/or the editor(s). MDPI and/or the editor(s) disclaim responsibility for any injury to people or property resulting from any ideas, methods, instructions or products referred to in the content. |
© 2024 by the authors. Licensee MDPI, Basel, Switzerland. This article is an open access article distributed under the terms and conditions of the Creative Commons Attribution (CC BY) license (https://creativecommons.org/licenses/by/4.0/).