Article

Comparative Study of Solid-Based and Liquid-Based Heat Transfer Enhancement Techniques in Liquid Piston Gas Compression

Department of Mechanical Engineering, Baylor University, Waco, TX 76798, USA
*
Author to whom correspondence should be addressed.
Energies 2025, 18(8), 2032; https://doi.org/10.3390/en18082032
Submission received: 7 March 2025 / Revised: 12 April 2025 / Accepted: 13 April 2025 / Published: 16 April 2025
(This article belongs to the Special Issue Recent Advances in Heat Transfer Efficiency)

Abstract

:
The combination of a liquid piston gas compressor and a solid metal insert can achieve a near-isothermal compression process, which can greatly contribute to improving the system efficiency of a compressed-air energy storage system. To examine the effectiveness of the insert at various pressure levels, compressions were performed in a liquid piston compressor with and without copper wire mesh inserts at three different pressures of 1, 2, and 3 bars. The use of inserts increased isothermal compression efficiencies by 8–10% from the baseline isothermal efficiencies about 83–87%, while the compromised air volume due to the inserts was minor. In addition to the solid insert-based technique analysis, a comparative study with other proven liquid-based heat transfer enhancement techniques, spray injection and aqueous foam, was performed. Not only was a quantitative analysis made comparing the isothermal efficiency values but the pros and cons of each technique’s distinctive working mechanisms were also compared.

1. Introduction

1.1. Compressed Air Energy Storage and Importance of Isothermal Compression

The impact of climate change has become so significant that it is no longer a future issue to be taken care of by the next generation. To slow down climate change, curtailing the use of fossil fuels is critical. Society’s dependence on fossil fuels can be reduced by increasing the use of renewable energy [1]. The intermittent nature of renewable energy sources is one of the primary obstacles that hinder their use [2]. Energy storage systems can help mitigate this issue by storing surplus energy and discharging the stored energy during on-peak hours. By doing so, energy can be distributed to match demand [3,4]. For energy storage systems on a utility scale, compressed air energy storage (CAES) is one of the proven technologies that has been in operation since 1978 [5]. The basic concept of CAES is to store energy in the form of compressed air. When there is surplus energy to be stored, it is used to compress air. The compressed air is kept in a storage vessel during off-peak hours. When energy demand goes up, the stored air is transferred to an expander. The expansion of air can operate a turbine, which, in turn, generates electricity [5]. In addition to the large capacity, CAES is advantageous because it is both economically competitive, due to its low capital costs, and environmentally less burdensome [6,7]. CAES systems utilizing various storage platforms and technologies have been proposed [3,8,9,10,11]. Despite its advantages, CAES is not an ideal option due to its relatively low efficiency. The efficiencies of the two conventional CAES systems in Huntorf, Germany, and McIntosh, Alabama, are 42% and 54%, respectively [12]. Thermal energy waste during the compression stage contributes to these low efficiencies. When a gas is compressed, the gas molecules experience an increase in kinetic energy, thus causing the temperature of the gas to rise, generating heat [13]. Likewise, CAES experiences a great amount of heat generation. In a conventional CAES system, the heat is dissipated to the surroundings without being saved. In other words, some portion of compression work input is used to generate the heat and is wasted. Additionally, conventional CAES require an external energy source, such as a natural gas, in the expansion stage. During the expansion process, the temperature of the gas decreases, making an external heat source necessary to avoid freezing the system [14,15].
One approach to reducing energy waste is an isothermal CAES (ICAES), which minimizes heat generation. In ICAES, compression and expansion are carried out isothermally. This ensures that thermal energy is not lost during the compression and an additional energy source is not required in the expansion, leading to enhanced system efficiency. Given that CAES is a utility-scale system, the utilization of renewable energy can be greatly boosted by the realization of isothermal processes. Since it is implausible to achieve a perfect isothermal process, a near-isothermal process is a more realistic goal. Maximizing heat transfer is key to achieving a near-isothermal process [16,17].

1.2. Liquid Piston Gas Compressor and Heat Transfer Enhancement for Isothermal Compression

Liquid piston compressors were recently reintroduced in [16] and started gaining attention because of their potential applicability to the energy storage field. In a liquid piston, a liquid column functions as the piston in a conventional reciprocating compressor. Because of the conforming nature of a liquid, a variety of methods to increase a surface area for heat exchange can be introduced. A variety of heat transfer enhancement techniques have been incorporated with the liquid piston, including modifying the chamber itself. The possibility of boosted heat transfer was examined with a chamber composed of many cylinders [16,18], a chamber with tube bundles [19], and a chamber with a noncylindrical shape [20]. Introducing external media is another approach to achieving a near-isothermal process. Placing solid inserts inside the compression chamber is a straightforward way to add extra surface area. Hence, the inserts can work as a heat exchanger for the heat generated during the gas compression process. A variety of inserts have been examined: porous media such as metal foam and interrupted plates [21,22,23], metal wire mesh [24], and aluminum plates [25]. It was confirmed that the use of inserts leads to an improved isothermal performance. With the use of porous-media-type inserts, the compression efficiency increased by 18% for the compression with a pressure ratio of 10 [22]. For extreme pressure conditions, the use of porous media was proved to be highly effective. For the compression starting from 7 to 210 bars, the efficiency was improved by 13% [21]. With the metal wire mesh or metal plate inserts, up to 8% of compression efficiency improvements were observed [24,25]. In addition, compressors that have a working mechanism similar to that of a liquid piston were studied and showed promising results [26,27]. If a liquid is employed as a medium for heat exchange, the technique can be classified as a liquid-based technique. Spray injection and aqueous foam are proven liquid-based heat transfer enhancement techniques for the liquid piston. For the spray injection, numerous water droplets are introduced, offering extra surface area for heat transfer. Its effectiveness has been studied with simulation [17] and experiments [28]. In the experimental study, various injection pressures were examined and their impact on the isothermal efficiency were investigated. A higher pressure led to a smaller temperature change during the compression process at the expense of extra work to inject droplets. Thus, there was a sweet spot where the performance gain was maximized. Aqueous foam is yet another liquid-type medium tested with liquid pistons. The compression chamber is filled with aqueous foam, which provides additional surface area for heat exchange, and then the compression is performed. In [29], the use of aqueous foam in the liquid piston compressor was tested through experiments, proving that the volume of the foam in the compression chamber, flowrate of the air for foam generation, and foam generator designs were factors that affect the isothermal performance. In [30], the solid-based methods using metal wire mesh inserts and the two liquid-based techniques were experimentally tested and compared. However, the comparative study of [30] has drawbacks. Each reference is a separate work and the various experiments were not performed under consistent experimental conditions. Additionally, compressions were conducted at atmospheric pressure only. A multi-stage compression system, which can save work input during the compression stage [31], is employed in conventional CAES systems [12,32,33].
Pressure–volume profiles of isothermal compression, single-stage compression, and multi-stage compression are displayed in Figure 1. The work input of a compression process can be obtained by calculating the area under the profile of the process. The initial point of a compression process is State 1 at ( V 0 , P 0 ) and the target point is State 3 at ( V f , i s o , P f ). If air is compressed isothermally, the profile moves directly from State 1 to 3 along the isothermal profile and has the smallest area among the profiles. The profile labeled as single-stage compression is a non-isothermal compression profile. Even though the target pressure, P f , is achieved at State 2, it still requires cooling work, which is represented by a horizontal move from State 2 to State 3, after the compression [34]. In contrast, the multi-stage profile includes an intercooling stage and moves along the path of (1→2a→2b→3a→3). This trajectory consumes less work than single-stage compression, which has a trajectory of (1→2→3). The saved work input with a multi-stage compression system can lead to an improved system efficiency.
Therefore, to examine the applicability of a technology to a real CAES system with multi-stage compression, it is critical to evaluate its functionality at various pressure levels. Under consistent conditions, baseline liquid piston compression [35] and compression with spray injection and aqueous foam techniques [36,37] at three different pressure levels of 1, 2, and 3 bars were performed. The use of heat transfer enhancement techniques boosted isothermal performance of compression. However, as pointed out in [28], the work input for the spray is a factor that needs to be considered. Furthermore, the work input for the spray becomes a more significant issue under the elevated pressure conditions. This is because the spray injection into a pressurized environment requires a greater amount of work. Under the experimental conditions in [37], the spray work input exponentially increased with the initial pressure level. Hence, without proper optimization, the overall efficiency drop may be unjustifiable. Aqueous foam also showed a similar trend. At a higher pressure, the boosted collapse of the foam in the chamber was observed and is thought to be the reason for the reduced efficiency improvement under elevated pressure conditions. Even though the aqueous foam method does not require additional work input during the compression, the efficiency improvement was relatively less impressive [36].

1.3. Objectives of the Present Work

Because previous studies on the use of solid-based techniques using inserts for the liquid piston typically did not examine different initial pressure levels, the present work aims to explore the effectiveness of a solid-based method at various pressure levels for application to a multi-stage compression system. Unlike the spray and aqueous foam methods, where the volume of the introduced media in the chamber varies during the progress of the compression, solid media is less affected by the external conditions. Therefore, it is worth investigating the effectiveness of the solid media in the liquid piston in comparison with the liquid-based techniques. A comparative study of heat transfer techniques in a liquid piston was performed in [30]. However, the testing conditions of each technique were not completely aligned and the compressions were performed at the atmospheric initial pressure only. Therefore, it was not sufficient for exploring the practicability and fair comparison.
This current work has two main goals: (1) to experimentally test the use of solid inserts in the liquid piston gas compression at various pressure levels and (2) to perform a comprehensive comparative study of proven heat transfer techniques. Solid-based techniques using inserts have been studied by many researchers. However, the impact of initial pressure levels was typically outside the scope of these experiments. Therefore, by testing metal wire mesh inserts at various pressure levels, the effects of initial pressure levels on this technique can be investigated in this work. Compressions with and without metal wire mesh inserts were performed. The compressions started from 1 bar (atmospheric pressure, about 0.1 MPa), 2 bars, and 3 bars, each with a pressure ratio of 2. For the inserts, copper wire mesh sheets were rolled into a spiral shape and placed in the chamber. Then, the results were compared with those of the liquid-based techniques tested in [36,37]. In addition to the quantitative analysis, a more comprehensive analysis is conducted by comparing the working mechanisms, pros, and cons of the techniques.
The present article has five sections. In Section 1, the research background and motivations are introduced. The analytical modeling of the topic is given in Section 2. Then, the methodology is explained in Section 3. Section 4 displays and discusses the results, and conclusions are given in Section 5.

2. Analytical Modeling

2.1. Mathematical Modeling of Liquid Piston Heat Transfer

Air compression in a liquid piston has been commonly expressed as Equation (1) with the first law of thermodynamics [24,28,35,38]:
d U / d t = Q ˙ W ˙ c o m p r e s s i o n
U stands for the internal energy, and Q ˙ and W ˙ indicate the rate of heat transfer and compression work, respectively. The internal energy rate term can be expressed in terms of the mass and temperature of the air.
m a i r C v d T a i r / d t = Q ˙ W ˙ c o m p r e s s i o n
m a i r and T a i r are representative of the mass and temperature of air. If the compression process is performed isothermally, the temperature change, represented by d T a i r / d t , is zero. This indicated that Q ˙ and W ˙ should be equal to satisfy the isothermal condition. However, W ˙ c o m p r e s s i o n is typically greater than Q ˙ [28]. Hence, additional heat transfer is required. Figure 2 schematically compares the heat transfer of compressions with and without a metal wire mesh insert.
As shown in Figure 2, the insert provides additional heat transfer compared to the baseline compression, in which no extra heat transfer technique is used. This can be illustrated mathematically in Equation (3).
m a i r C v d T a i r / d t = Q ˙ + Q ˙ m e s h W ˙ c o m p r e s s i o n
In Equation (3), an extra heat transfer term, representing the metal wire mesh insert, is added. This causes the difference between the compression work rate and the total heat transfer rate terms to become smaller. Q ˙ m e s h can be represented in a more detailed manner as follows [24]:
Q ˙ m e s h = h m e s h A m e s h T m e s h T a i r
h m e s h , A m e s h , and T m e s h are the heat transfer coefficient, surface area, and temperature of the insert. Combining Equations (3) and (4), air compression in a liquid piston with a metal wire mesh insert can be represented as Equation (5).
m a i r C v d T a i r / d t = U h A c h a m b e r T T a i r + h m e s h A m e s h T m e s h T a i r P a i r d V a i r / d t
Q ˙ and W ˙ c o m p r e s s i o n can be switched into an alternative form [24,28]. In Equation (5), U h , A c h a m b e r , and T represent the overall heat transfer coefficient, surface area of the compression chamber inside, and temperature of the surroundings. P a i r and V a i r indicate the pressure and volume of the air.
For the spray injection and aqueous foam, Q ˙ m e s h term is replaced with Q ˙ s p r a y and Q ˙ f o a m , respectively. The expressions for the rate of heat transfer of the spray and aqueous foam can be expressed as Equations (6) and (7) [28,36].
Q ˙ s p r a y = i = 1 N h d r o p , i A d r o p , i T d r o p , i T a i r
Q ˙ f o a m = i = 1 N k b u b b l e , i A b u b b l e , i T b u b b l e , i T a i r / L b u b b l e , i
In Equations (6) and (7), N is the total number of droplets or bubbles, and the subscript i indicates i th droplet or bubble. A more detailed illustration on this model can be found in [28,36,37].

2.2. Isothermal Compression Efficiency

The pressure–volume profiles of isothermal, adiabatic, and actual compressions are displayed in Figure 3 to schematically illustrate why an isothermal process is more advantageous in terms of compression efficiency. The initial point where compression starts is ( V 0 , P 0 ), and the target point is ( V f , i s o , P f ). Since the area under a trajectory represents a required work input, a smaller area means a more efficient process. Thus, the isothermal profile is the most efficient compression process shown above. The trajectory labeled as actual compression is a random, non-isothermal compression profile. Even when the target pressure P f is achieved, a horizontal move from ( V f , P f ) to ( V f , i s o , P f ), which is a cooling work, is required to reach the final point [34]. This means that more work input is needed if a compression process is conducted non-isothermally. The isothermal compression efficiency, η i s o , can be expressed as Equation (8) [37].
η i s o = W i s o W c o m p r e s s i o n + W c o o l i n g = V 0 V f , i s o P i s o V i s o P 0 d V V 0 V f P V P 0 d V + P 0 P r 1 V f V 0 P r 100 [ % ]
The isothermal efficiency is the ratio of required work input for isothermal compression to the combined work input of compression and cooling. In Equation (8), W i s o and W c o o l i n g represent the isothermal compression work and cooling work. P i s o and V i s o are the pressure and volume of an isothermal process, and P r is the pressure ratio.

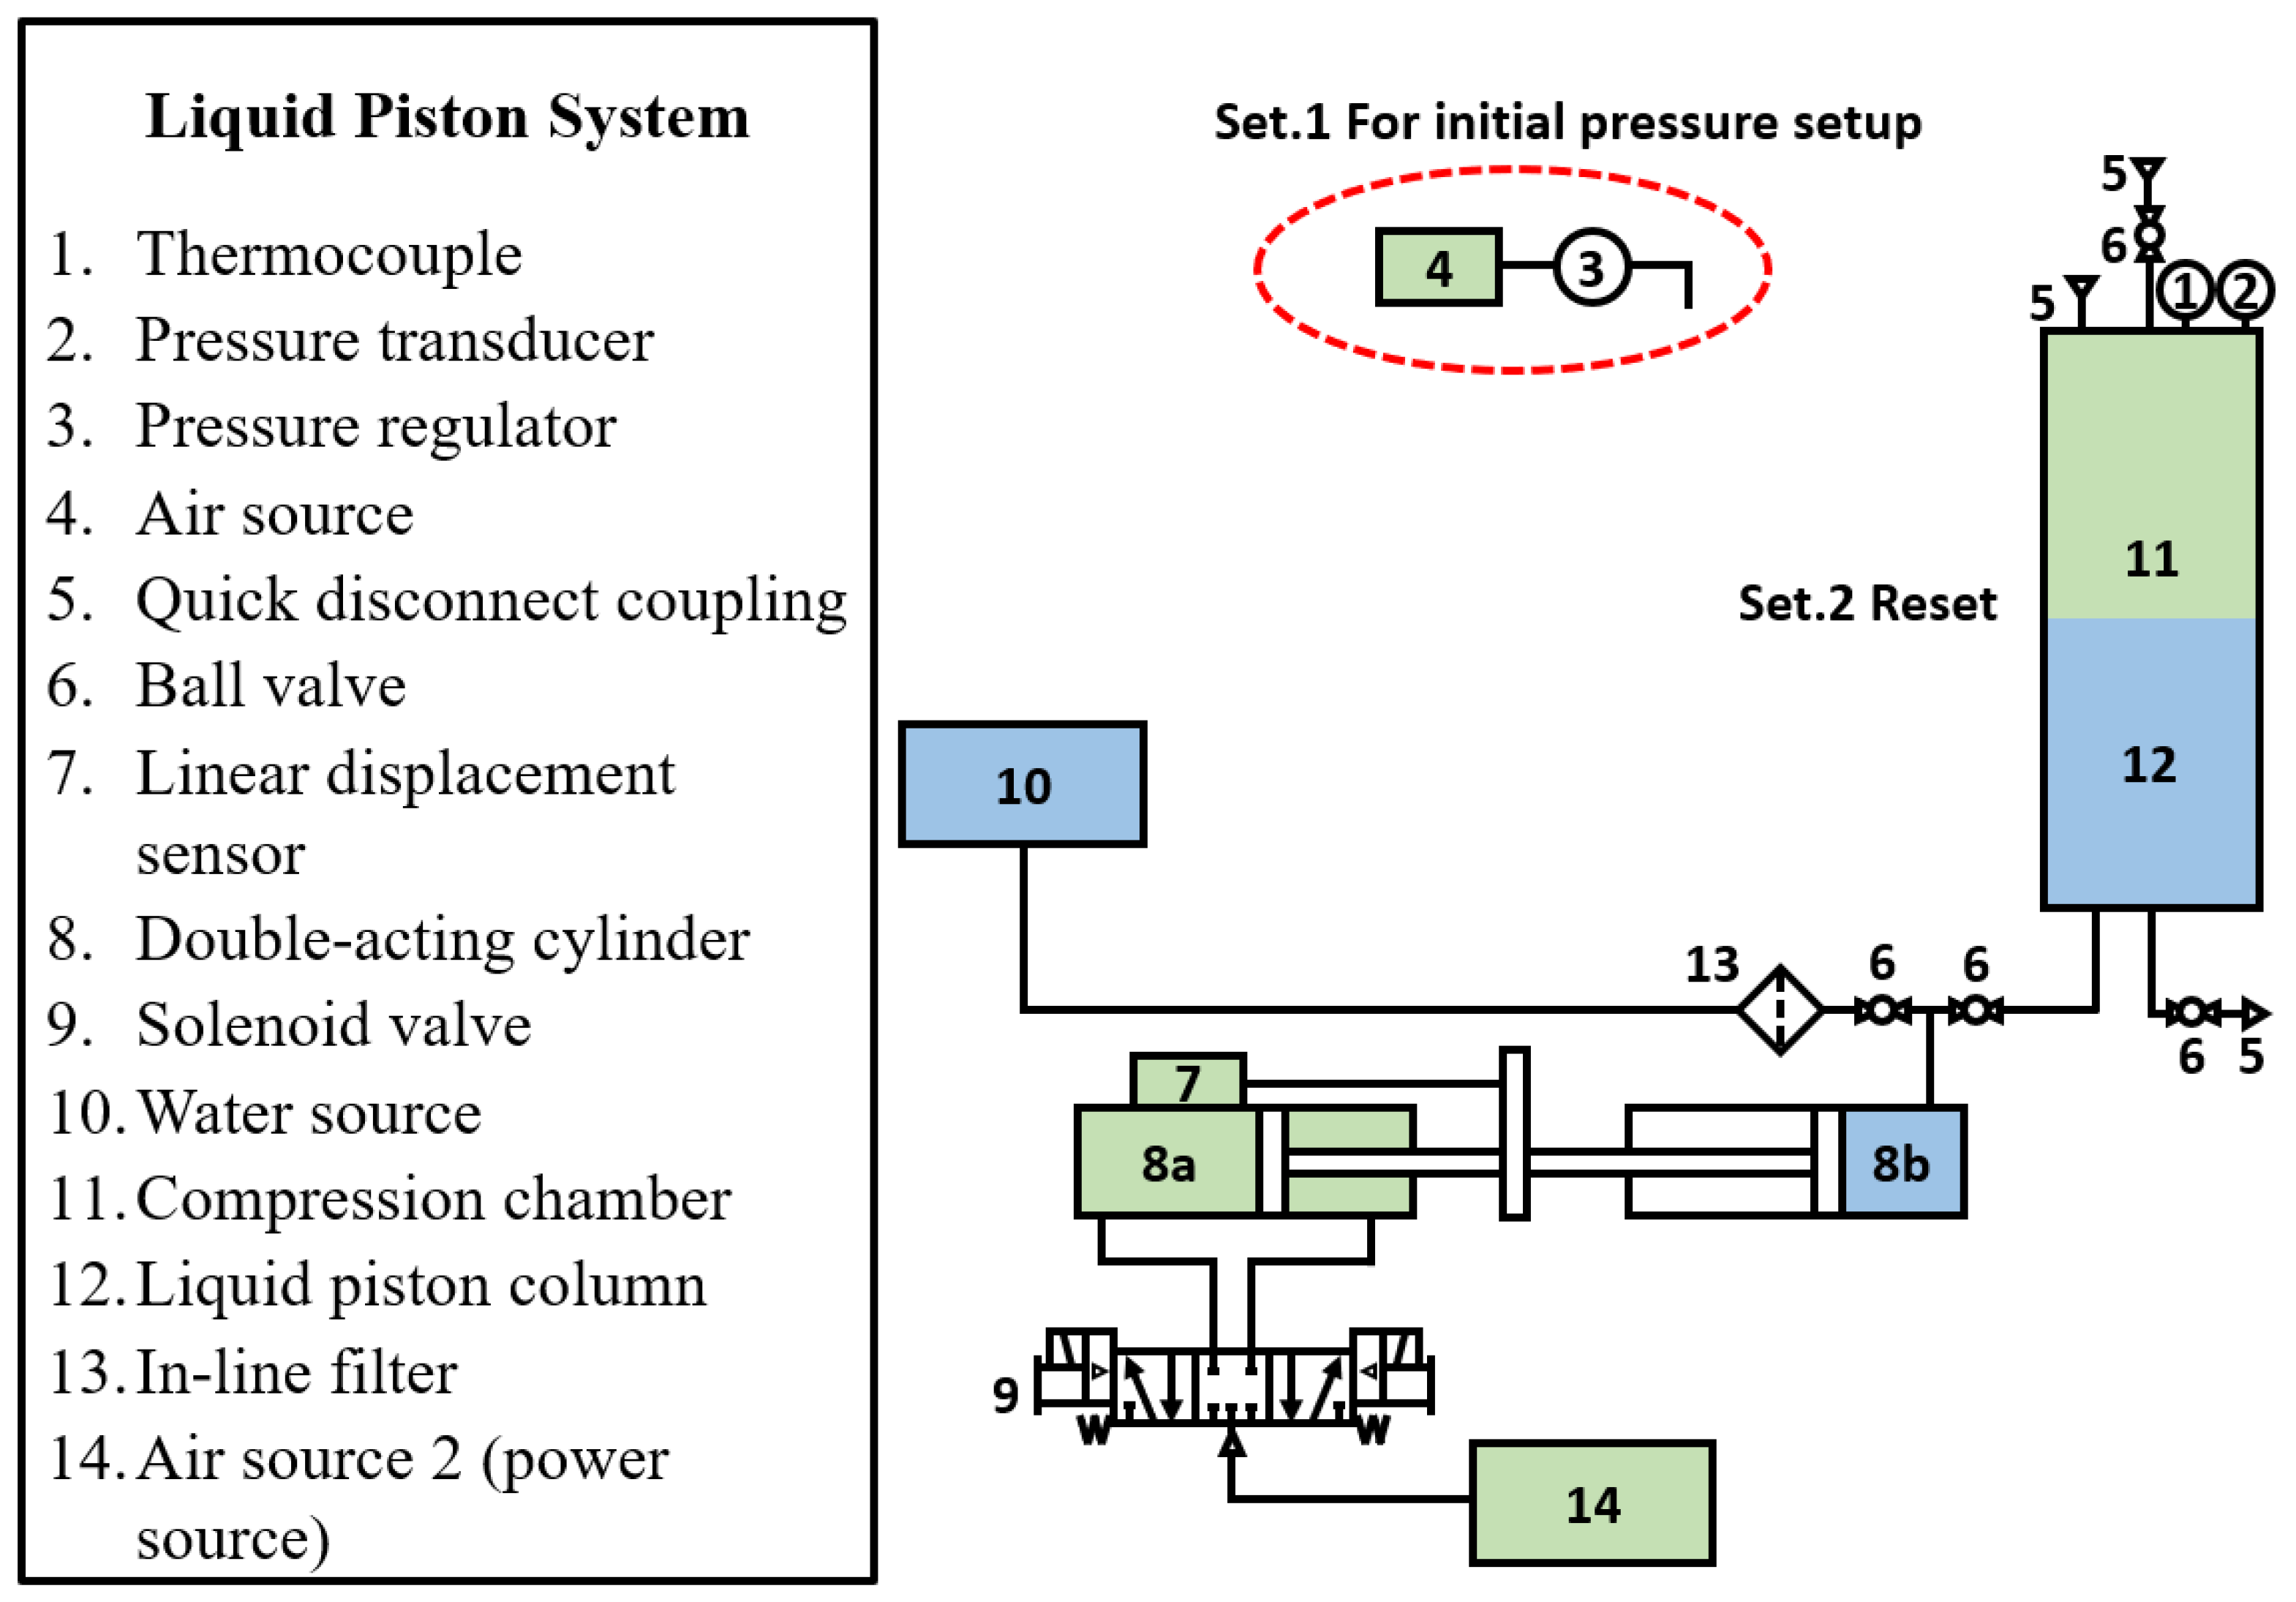
3. Materials and Methods

A liquid piston compressor was built with the same design as the compressor used in [35,37], and ambient air was compressed. The schematic diagram of the system is displayed in Figure 4.
For the compression chamber (#11 in Figure 4), a two-foot-long polycarbonate cylinder served as a chamber wall, and both ends of the cylinder were closed with aluminum plates. The temperature and pressure of the air were measured by a thermocouple (#1) and a pressure transducer (#2) installed on the ceiling of the chamber. The red circled component (#3 and #4) in Figure 4 is an external line that was used to set up an elevated initial pressure. It was connected to the chamber through a quick-disconnect coupling (#5) installed on the top of the chamber and injected compressed air into the chamber. Two reciprocating cylinders (#8) functioned as a water pump. The rod ends of the cylinder were coupled with one another so that the extension of one cylinder resulted in the retraction of the other and vice versa. One of the cylinders directly connected to the chamber (#8b) was filled with water, and the movement of the other cylinder (#8a) was controlled by a power source (#14) and a solenoid valve (#9). When the controlled cylinder extends, the water-filled cylinder retracts. As a result, the water is pushed into the chamber and the air is compressed. The volume of the air was measured by subtracting the volume of the entering water from the initial volume of the air. A linear position sensor (#7) measured the position of the coupled cylinder rod ends, enabling the measurement of the water volume that entered the chamber. The initial air volume was manually measured. The sensor models and their accuracy information are summarized in Table 1.
The metal wire mesh inserts used in the tests and a picture of the actual liquid piston with the inserts introduced are given in Figure 5. Two copper wire mesh sheets were rolled into a spiral shape with different dimensions to form the inserts. The mesh had eight openings per inch and the wire diameter was 0.028 inches. The large insert weighed 626 g and the small one was 343 g. Both inserts had a height similar to the compression chamber. Hence, when the inserts were placed in the chamber, the inserts stood throughout the chamber as displayed on the right side of Figure 5.
Compressions were performed with and without the inserts at 1 bar (atmospheric pressure), 2 bars, and 3 bars, each with a pressure ratio of 2. For each test, four compression strokes were performed. The first stroke was to stabilize the experimental conditions, and the data from the next three strokes were processed for analysis. Between strokes, a rest time was given to initialize the experimental condition so that all strokes were performed under consistent pressure and temperature conditions. The stroke time and rest time were managed by an Arduino controller. As the experiments were performed in the indoor facility, the impact of the external conditions was minimal.

4. Results and Discussion

This section is dedicated to presenting the experimental results and providing observations from the results. The first subsection outlines the results collected from the baseline compression. The results from the compression with the copper wire mesh inserts are given in the following subsection. The comparative analysis with the liquid-based techniques is presented in the last subsection.

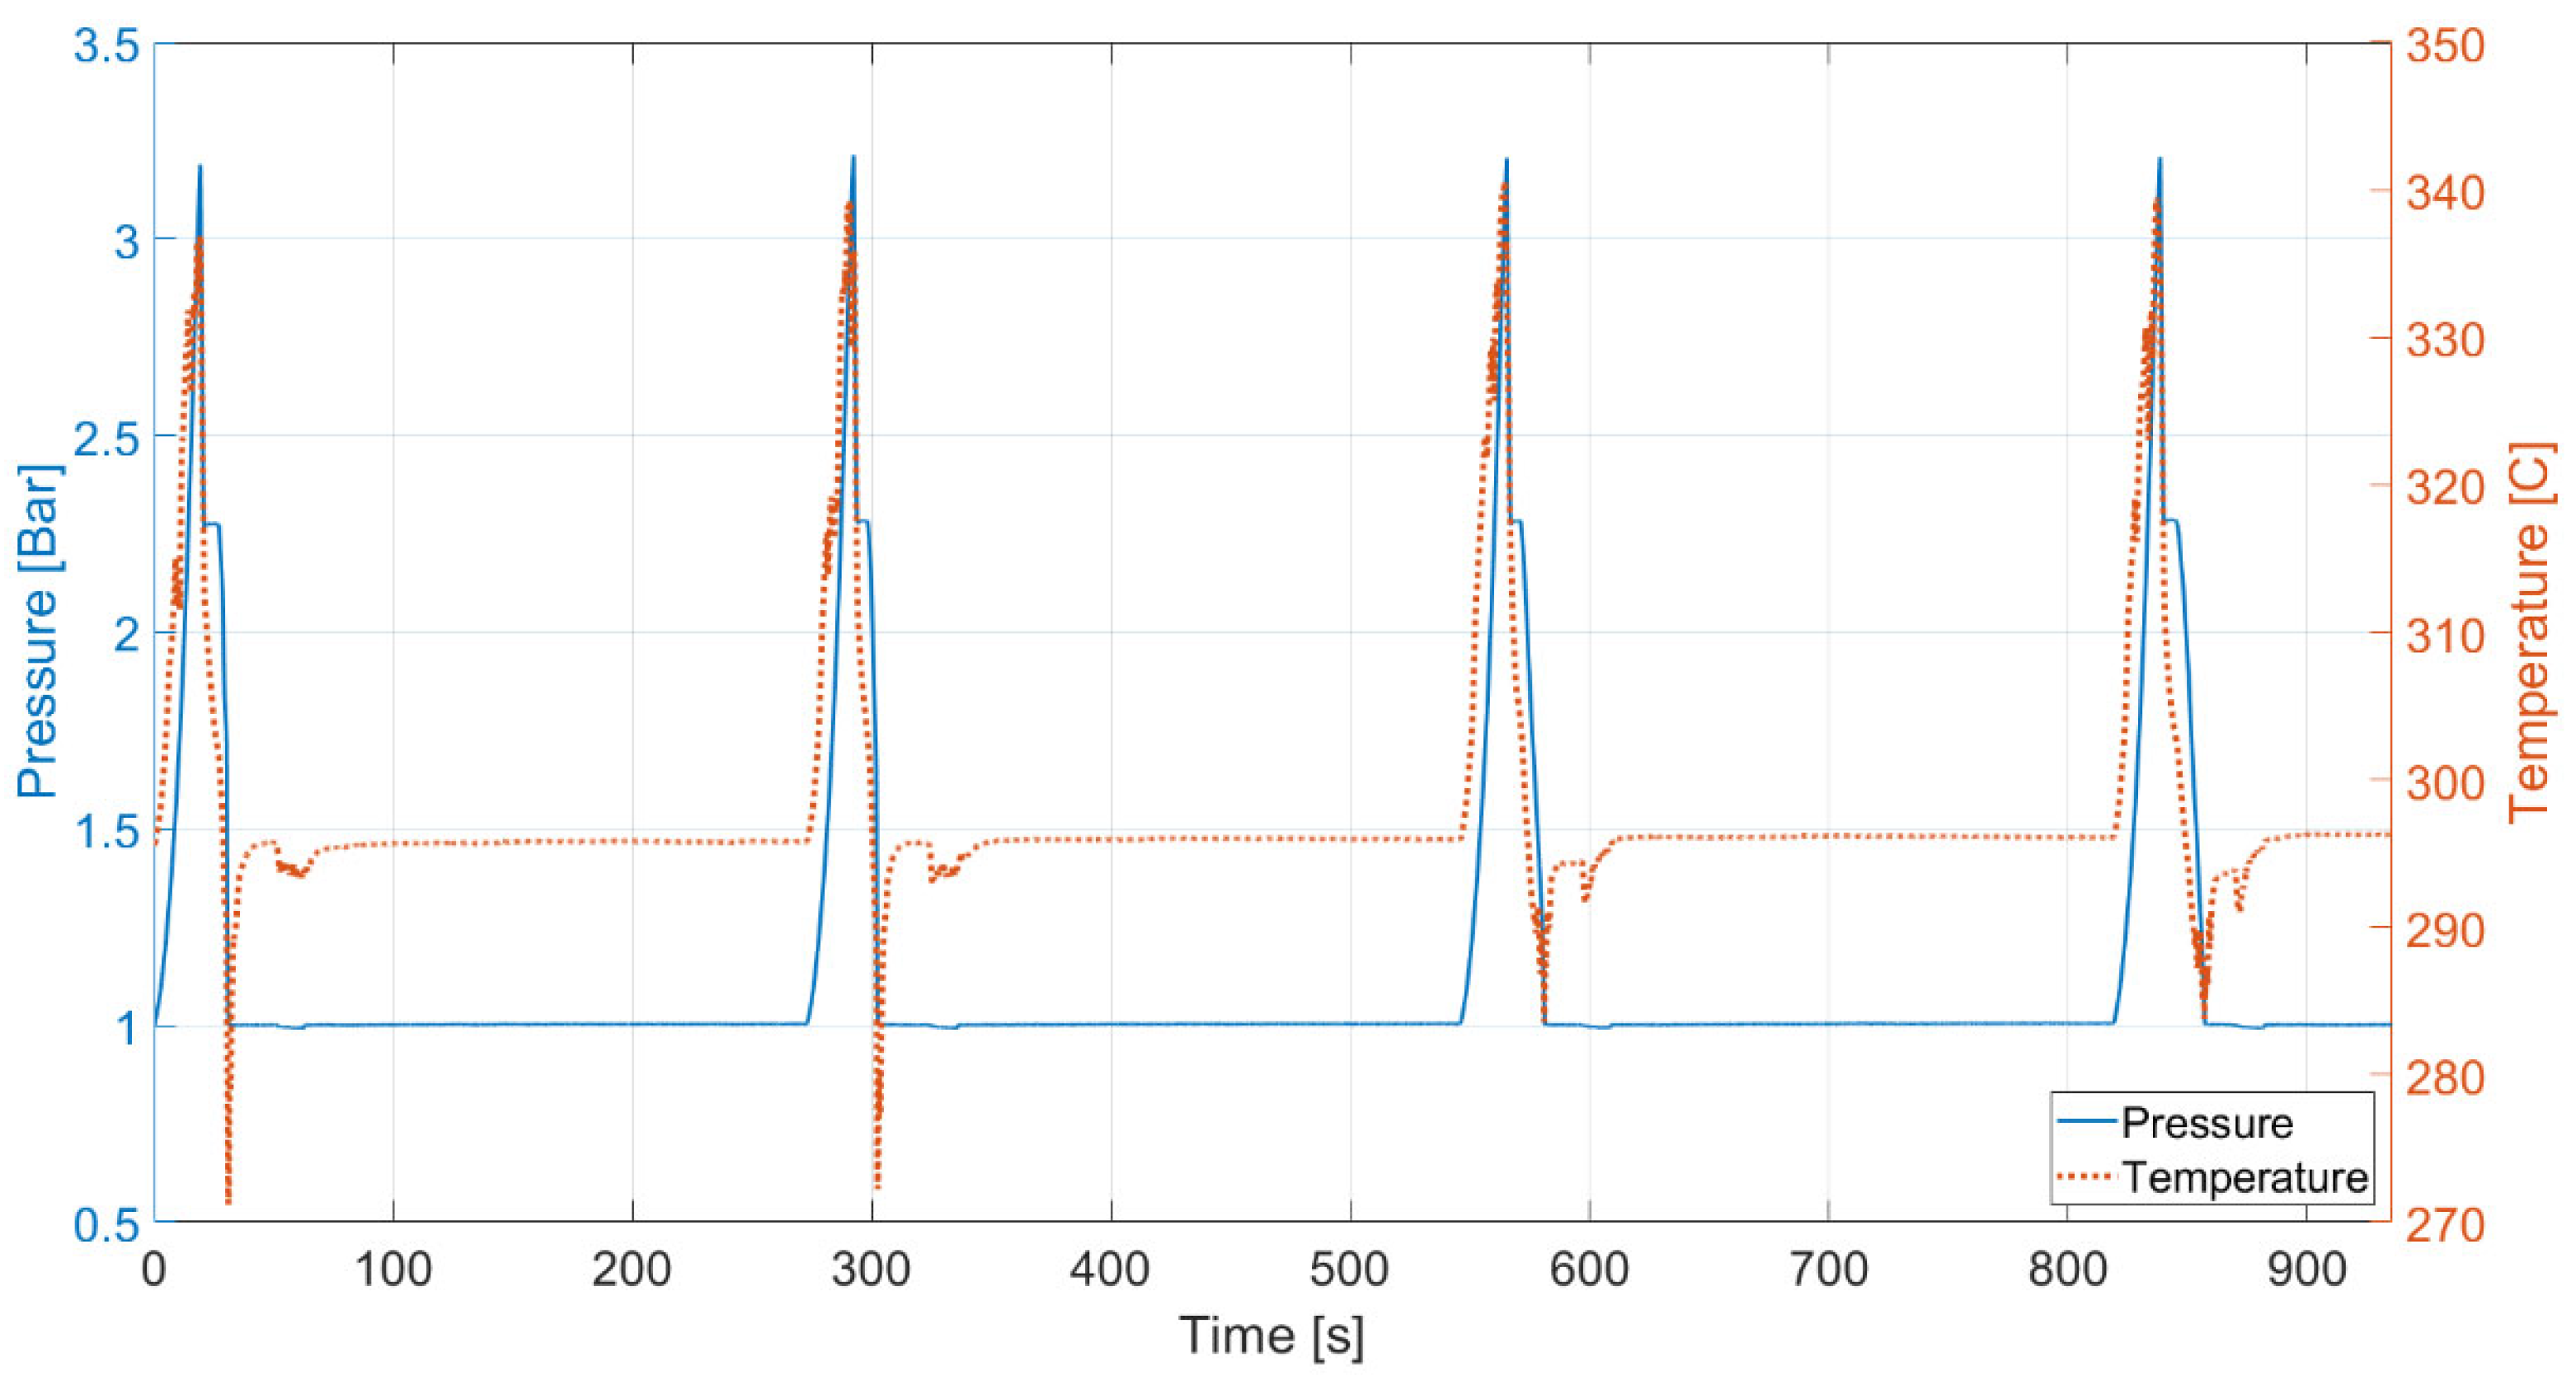
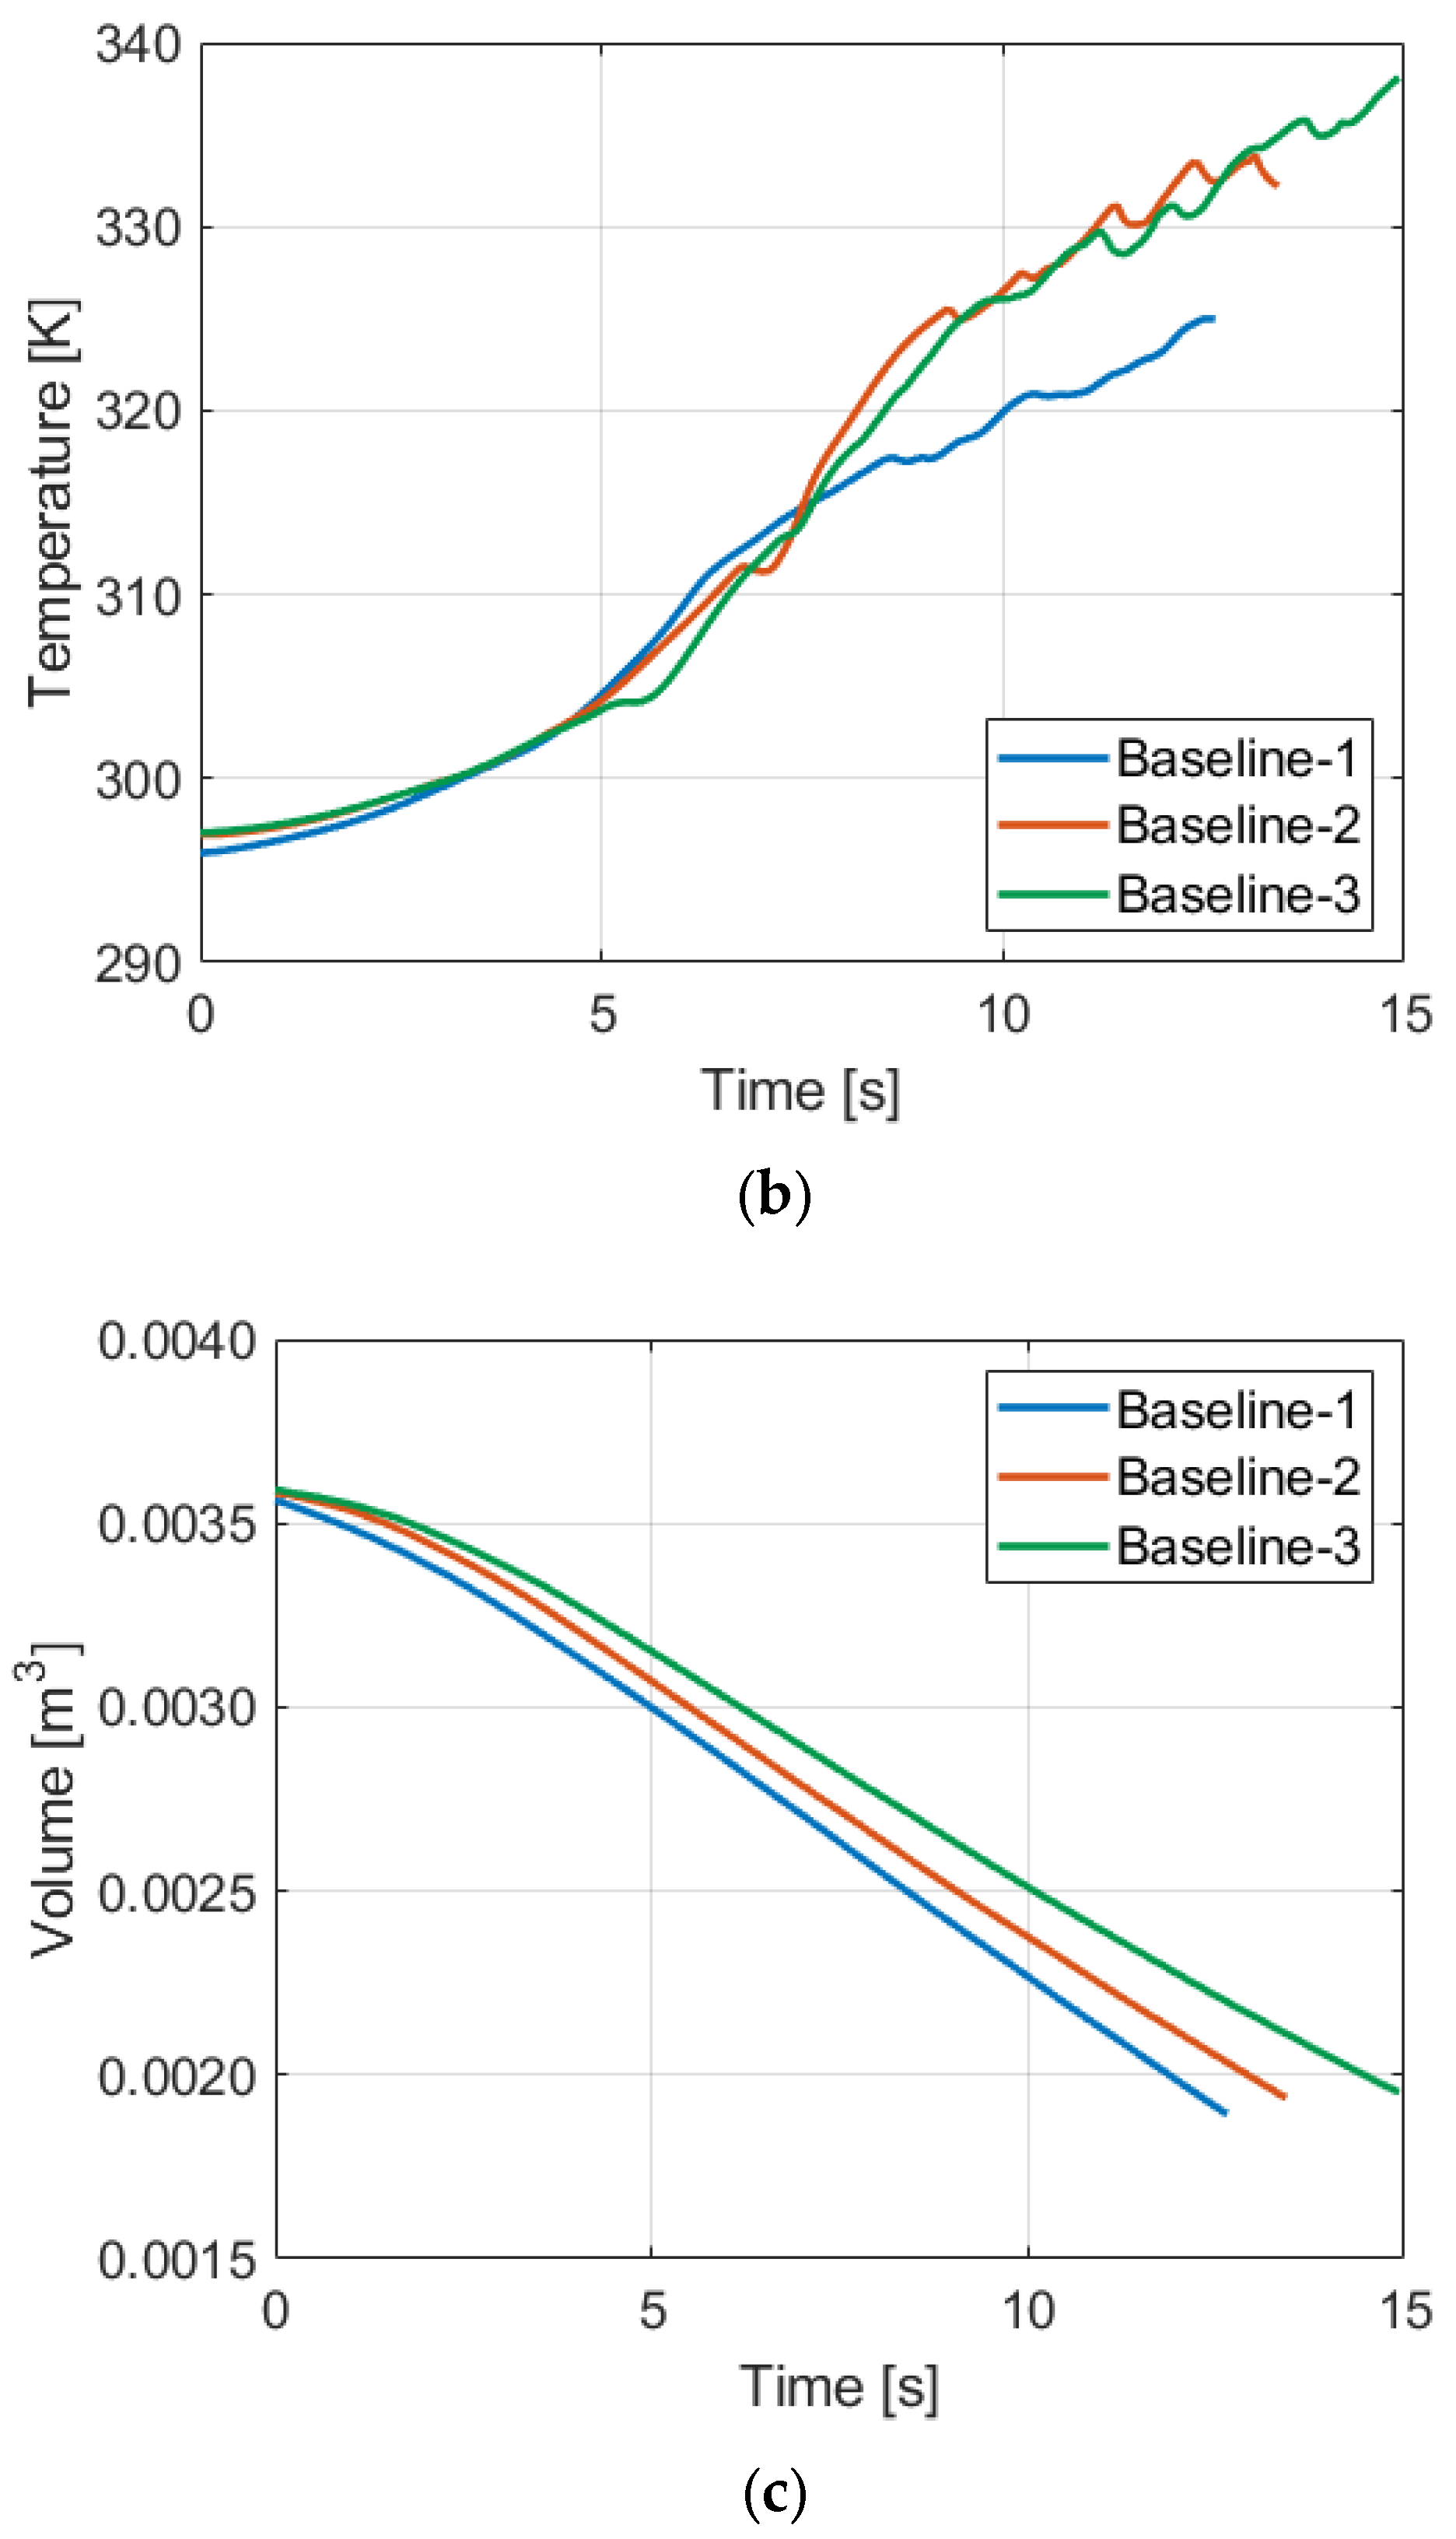
4.1. Baseline Compression

Figure 6 presents the pressure and temperature of the baseline compression starting at atmospheric pressure to show how each cycle was performed.
For safe data collection, the strokes were continued even after the target pressure ratio was achieved. For data processing, only the data up to a pressure ratio of 2 were used for analysis. Since the first stroke was performed for the system initialization, only the data of the following three strokes were averaged. In the same manner, the baseline compressions with the initial pressure of 2 and 3 bars were performed, and the data of all the baseline compressions are presented in Figure 7.
In Figure 7, the pressure, temperature, and volume of the baseline tests at the three pressure levels are displayed. In the plot legend of Figure 7, Baseline-N means the baseline compression starting at N bar(s). At the point that the target pressure ratio of 2 was achieved, temperature increases of 29.03 K, 35.24 K, and 41.03 K were observed in Baseline-1, 2, and 3, respectively. In Figure 7b, there are oscillations in the temperature data. This is due to the flowing and circulating movement of the air inside the chamber during the compression process and the sensitive tip of the thermocouple used to measure the temperature of this moving air. The results show that a higher initial pressure leads to lower isothermal performance. This is because of the greater amount of heat generation of a higher-pressure test, while conditions that determine heat transfer remained the same [39]. Because of a technical difficulty, the compression speeds were not perfectly matched. The higher-pressure tests took longer than the lower-pressure tests. In other words, the higher-pressure tests were under more advantageous conditions, as a slower stroke is more beneficial for heat transfer [21]. Despite the exposure to the beneficial condition, the higher initial pressure case showed a greater temperature change. Hence, it is safe to conclude that higher initial pressure results in a lower isothermal performance, which agrees with previous studies [35,39].
For a more intuitive comparison, pressure–volume profiles of Baseline-1, 2, and 3 are presented in Figure 8. The data were normalized, meaning it has been divided by initial values. In a pressure–volume plot, the closer a profile is to the isothermal profile, the better the isothermal performance that is achieved. As can be seen from Figure 8, Baseline-1 is placed closest to the isothermal line. Baseline-2 is the second closest and Baseline-3 is the farthest. Isothermal efficiencies were calculated with Equation (8). Baseline-1, 2, and 3 showed isothermal efficiencies of 87.4%, 84.2%, and 83.0%, respectively. Hence, the visual observation and isothermal efficiency values are compatible with the isothermal performance evaluation based on the temperature.

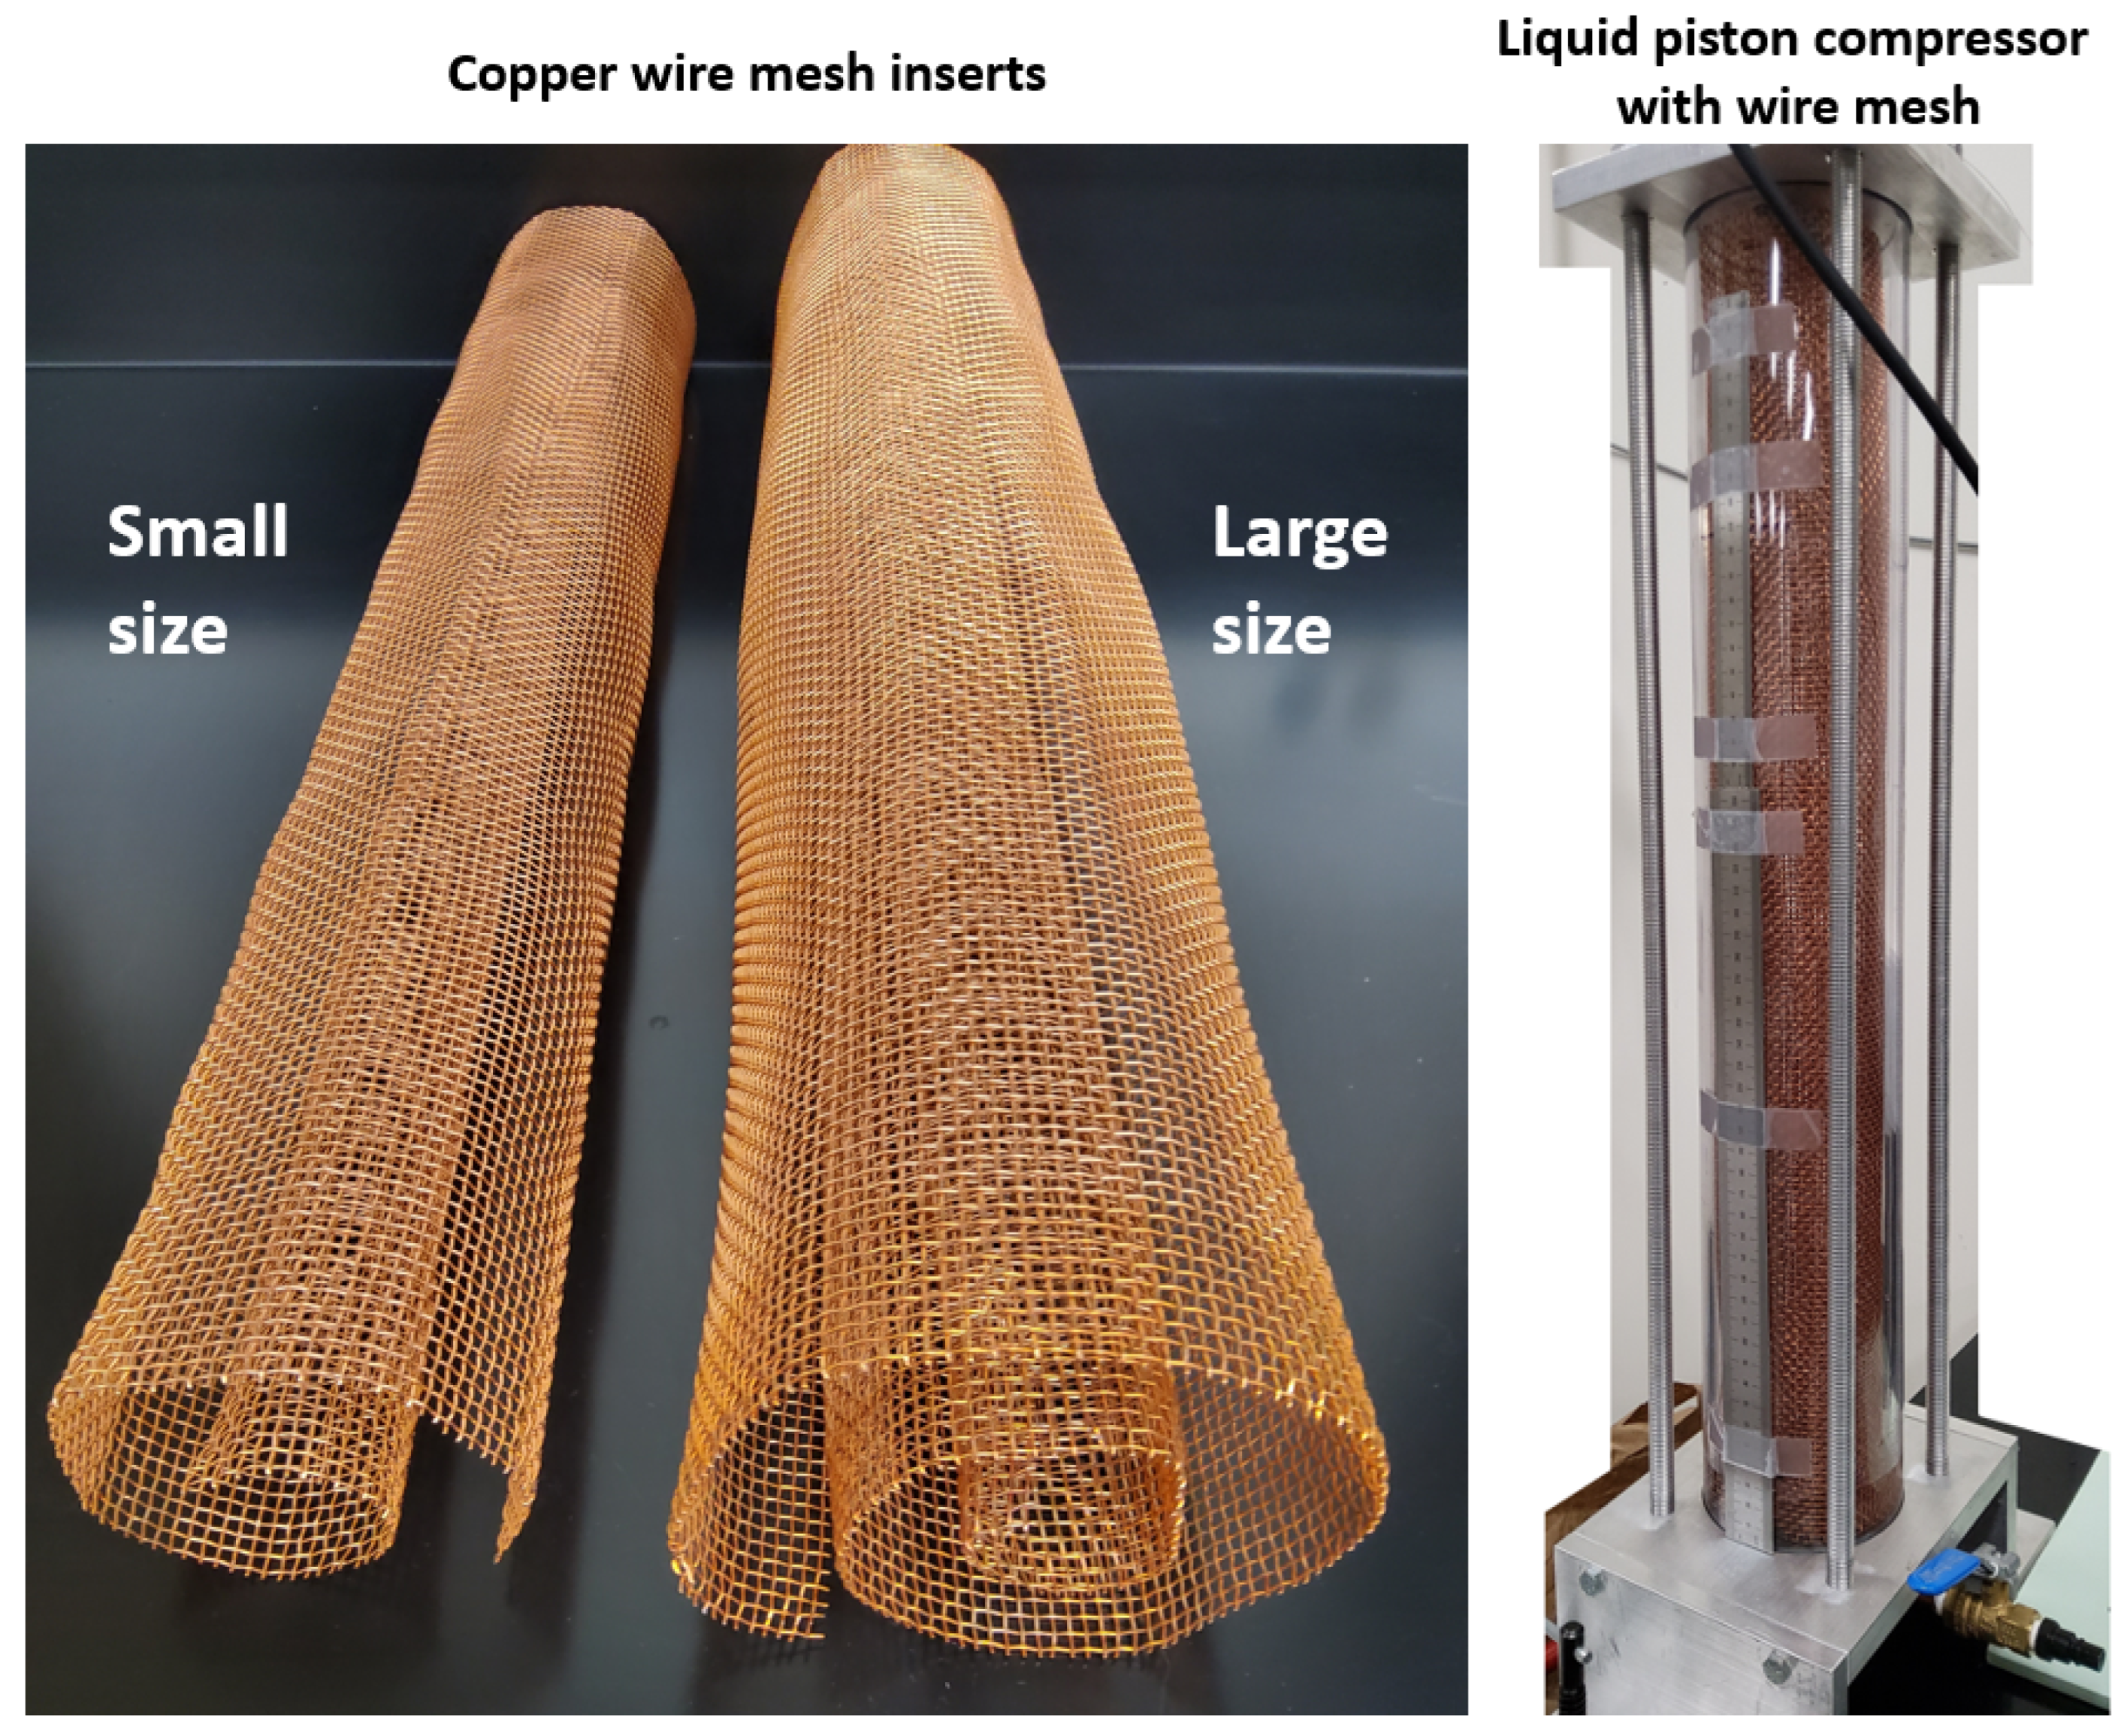
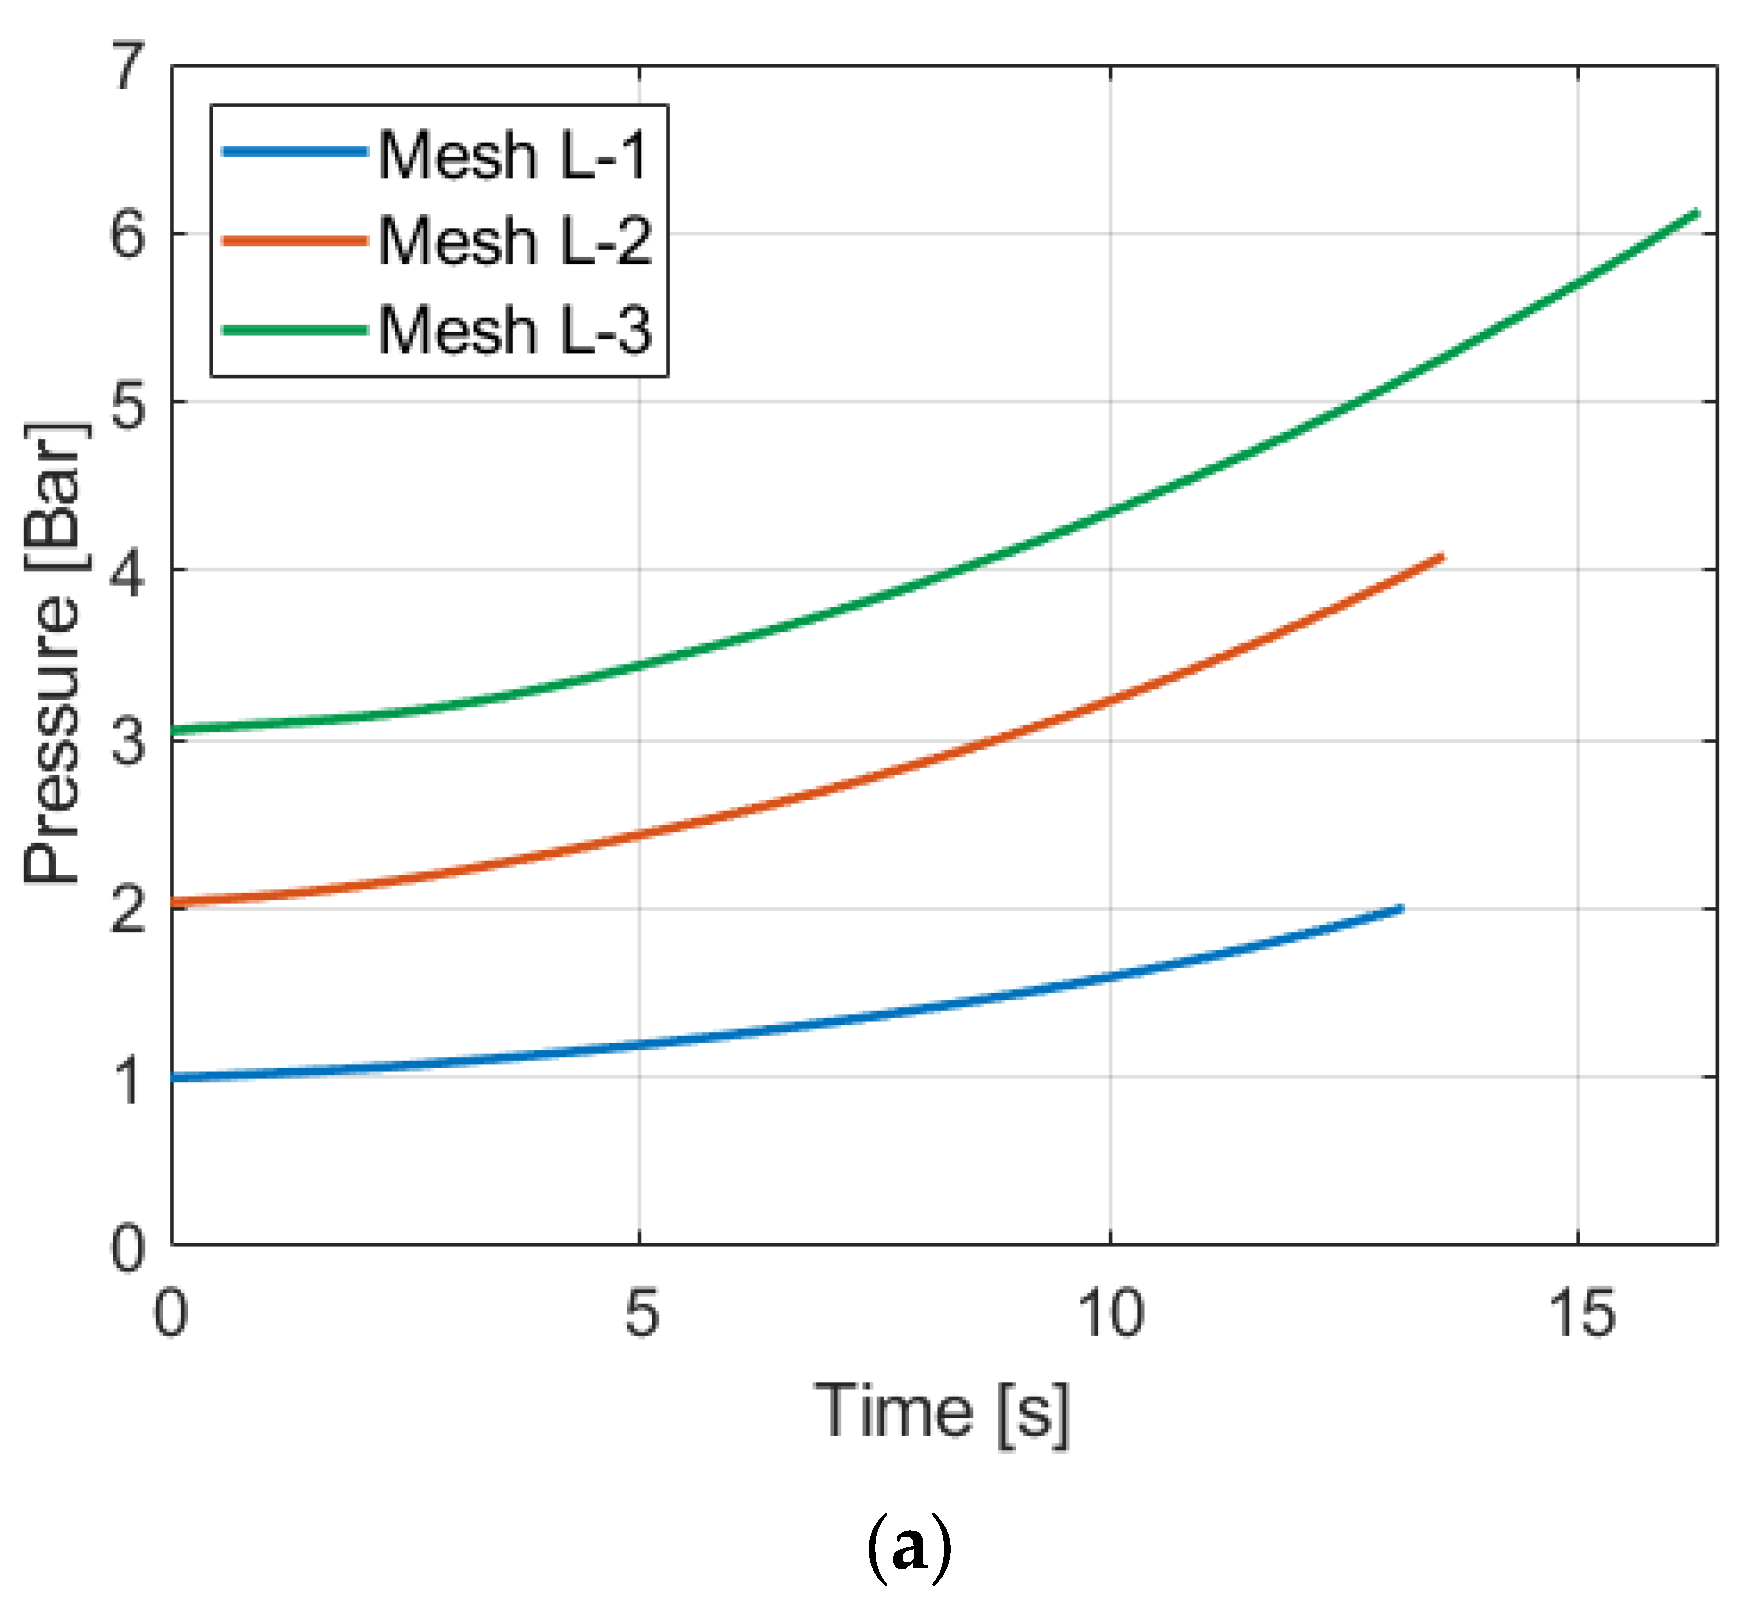
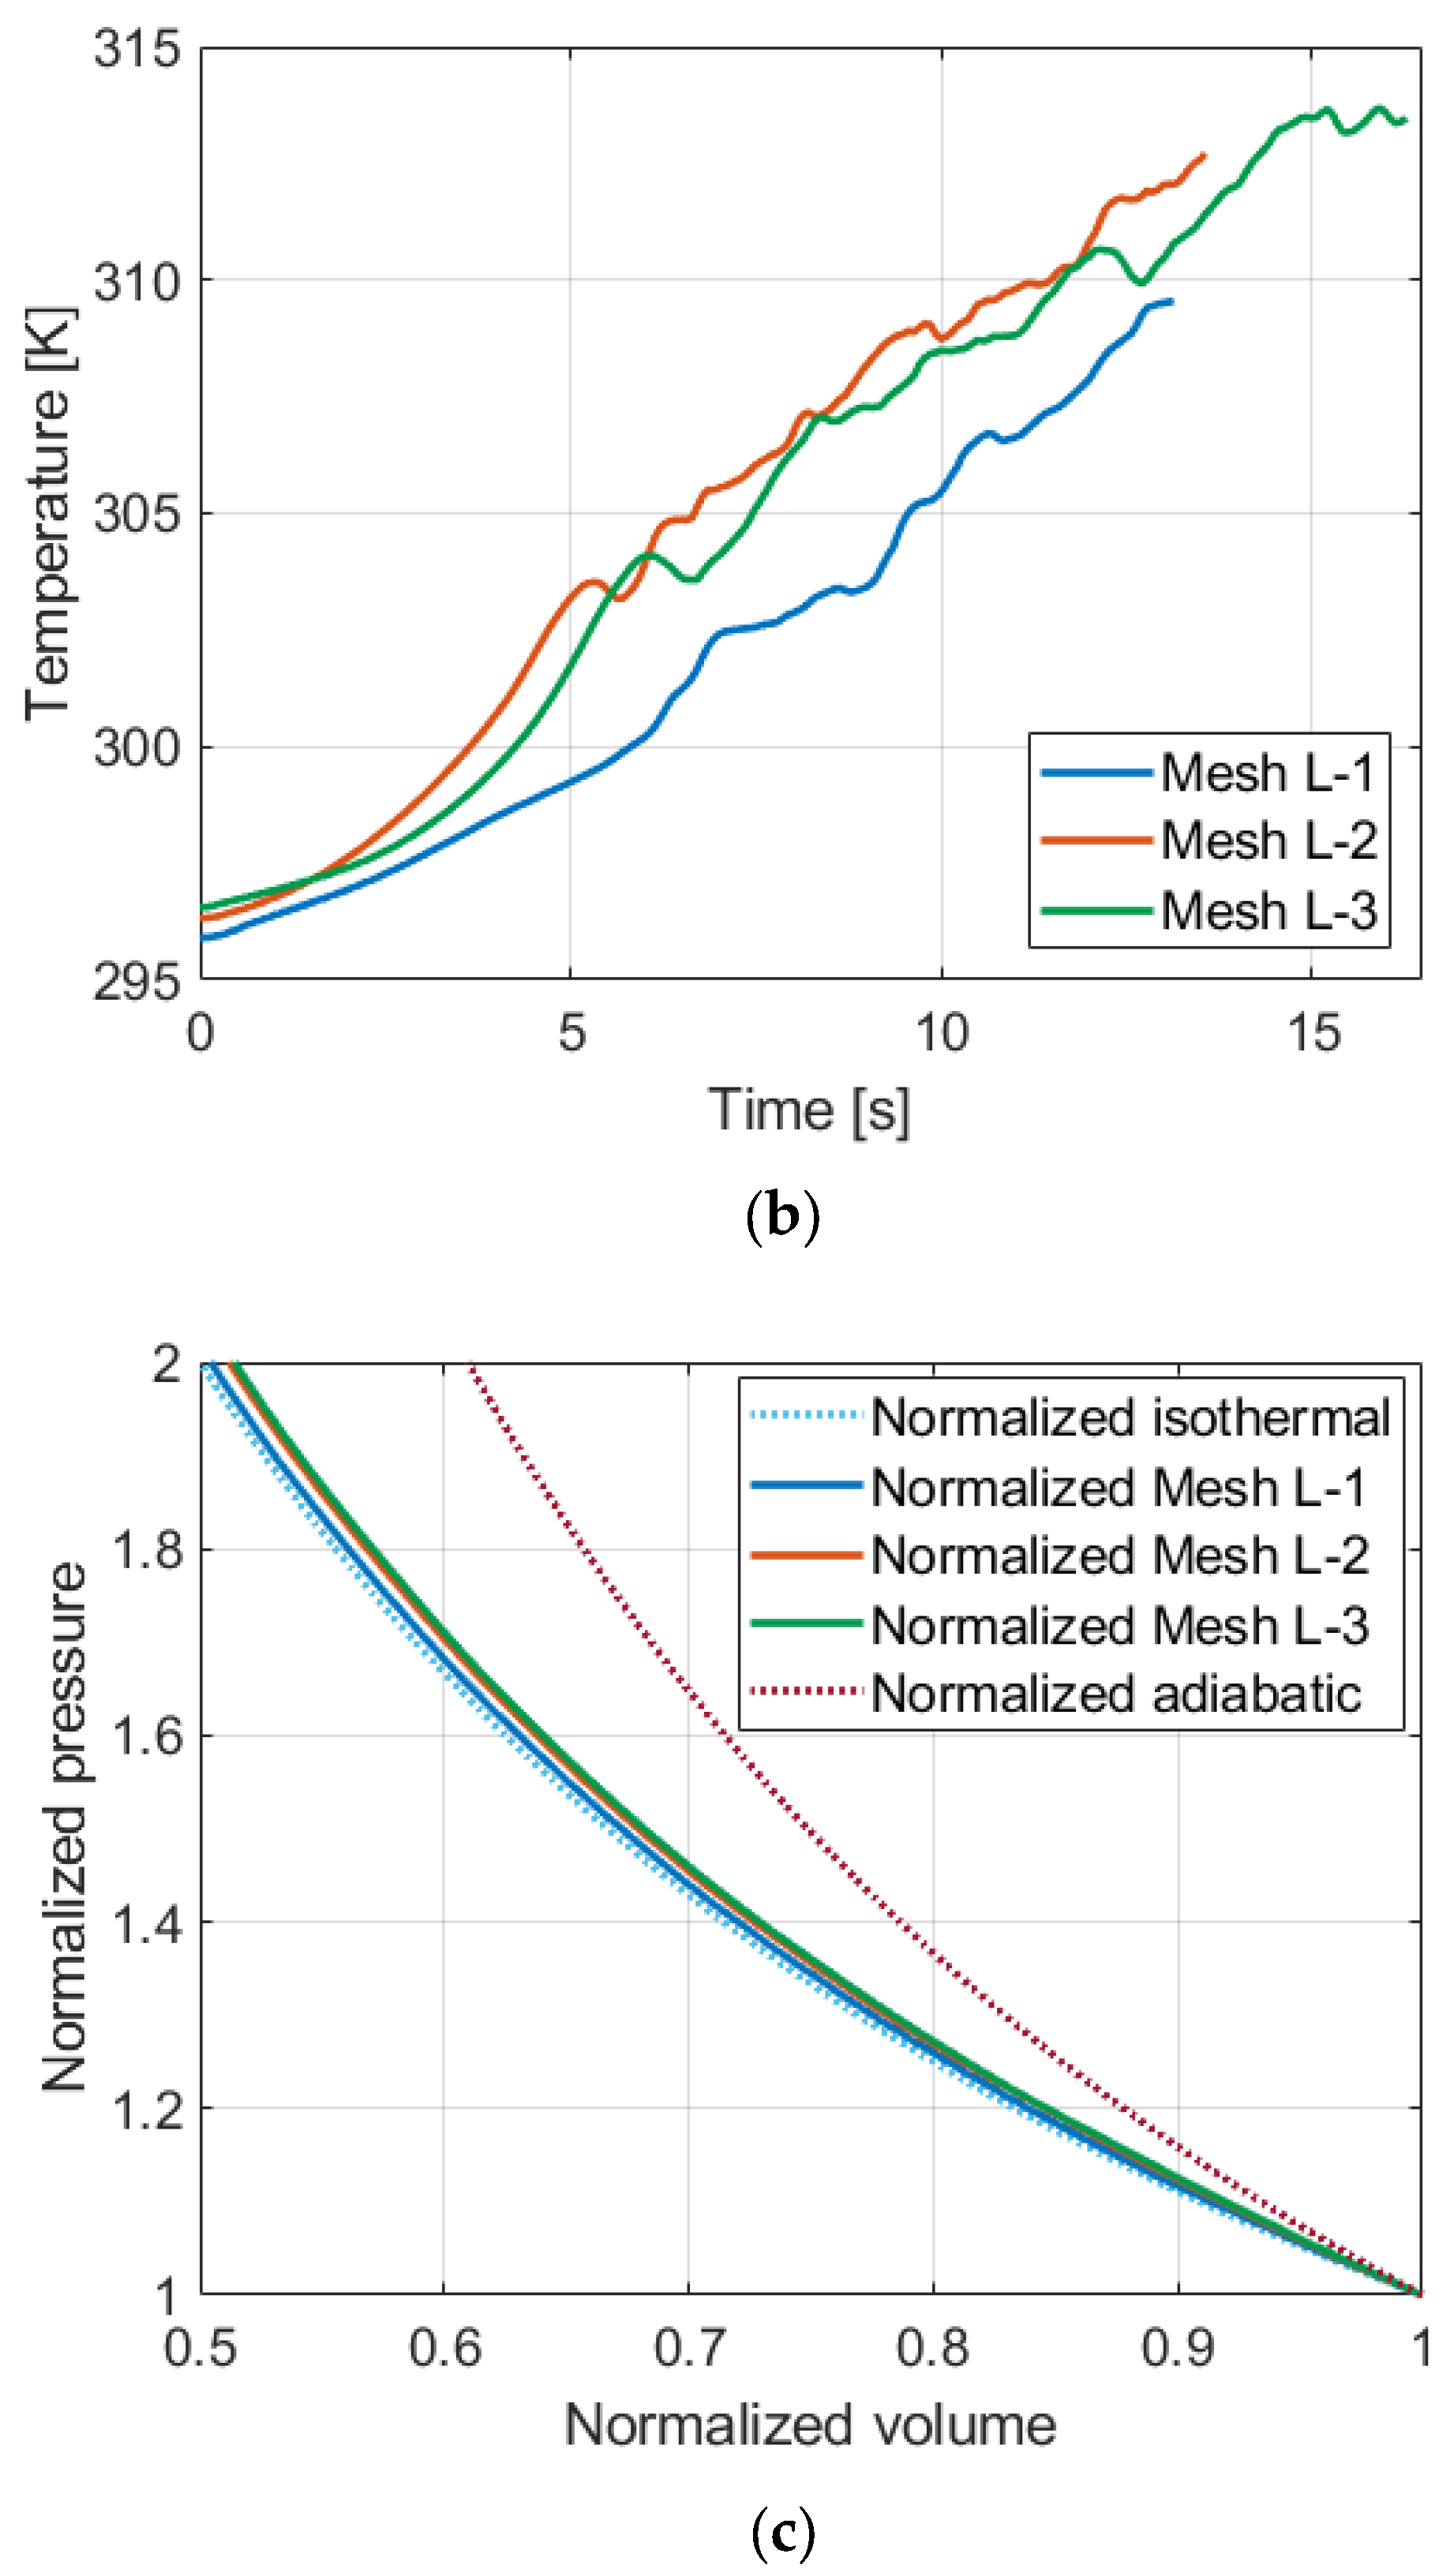
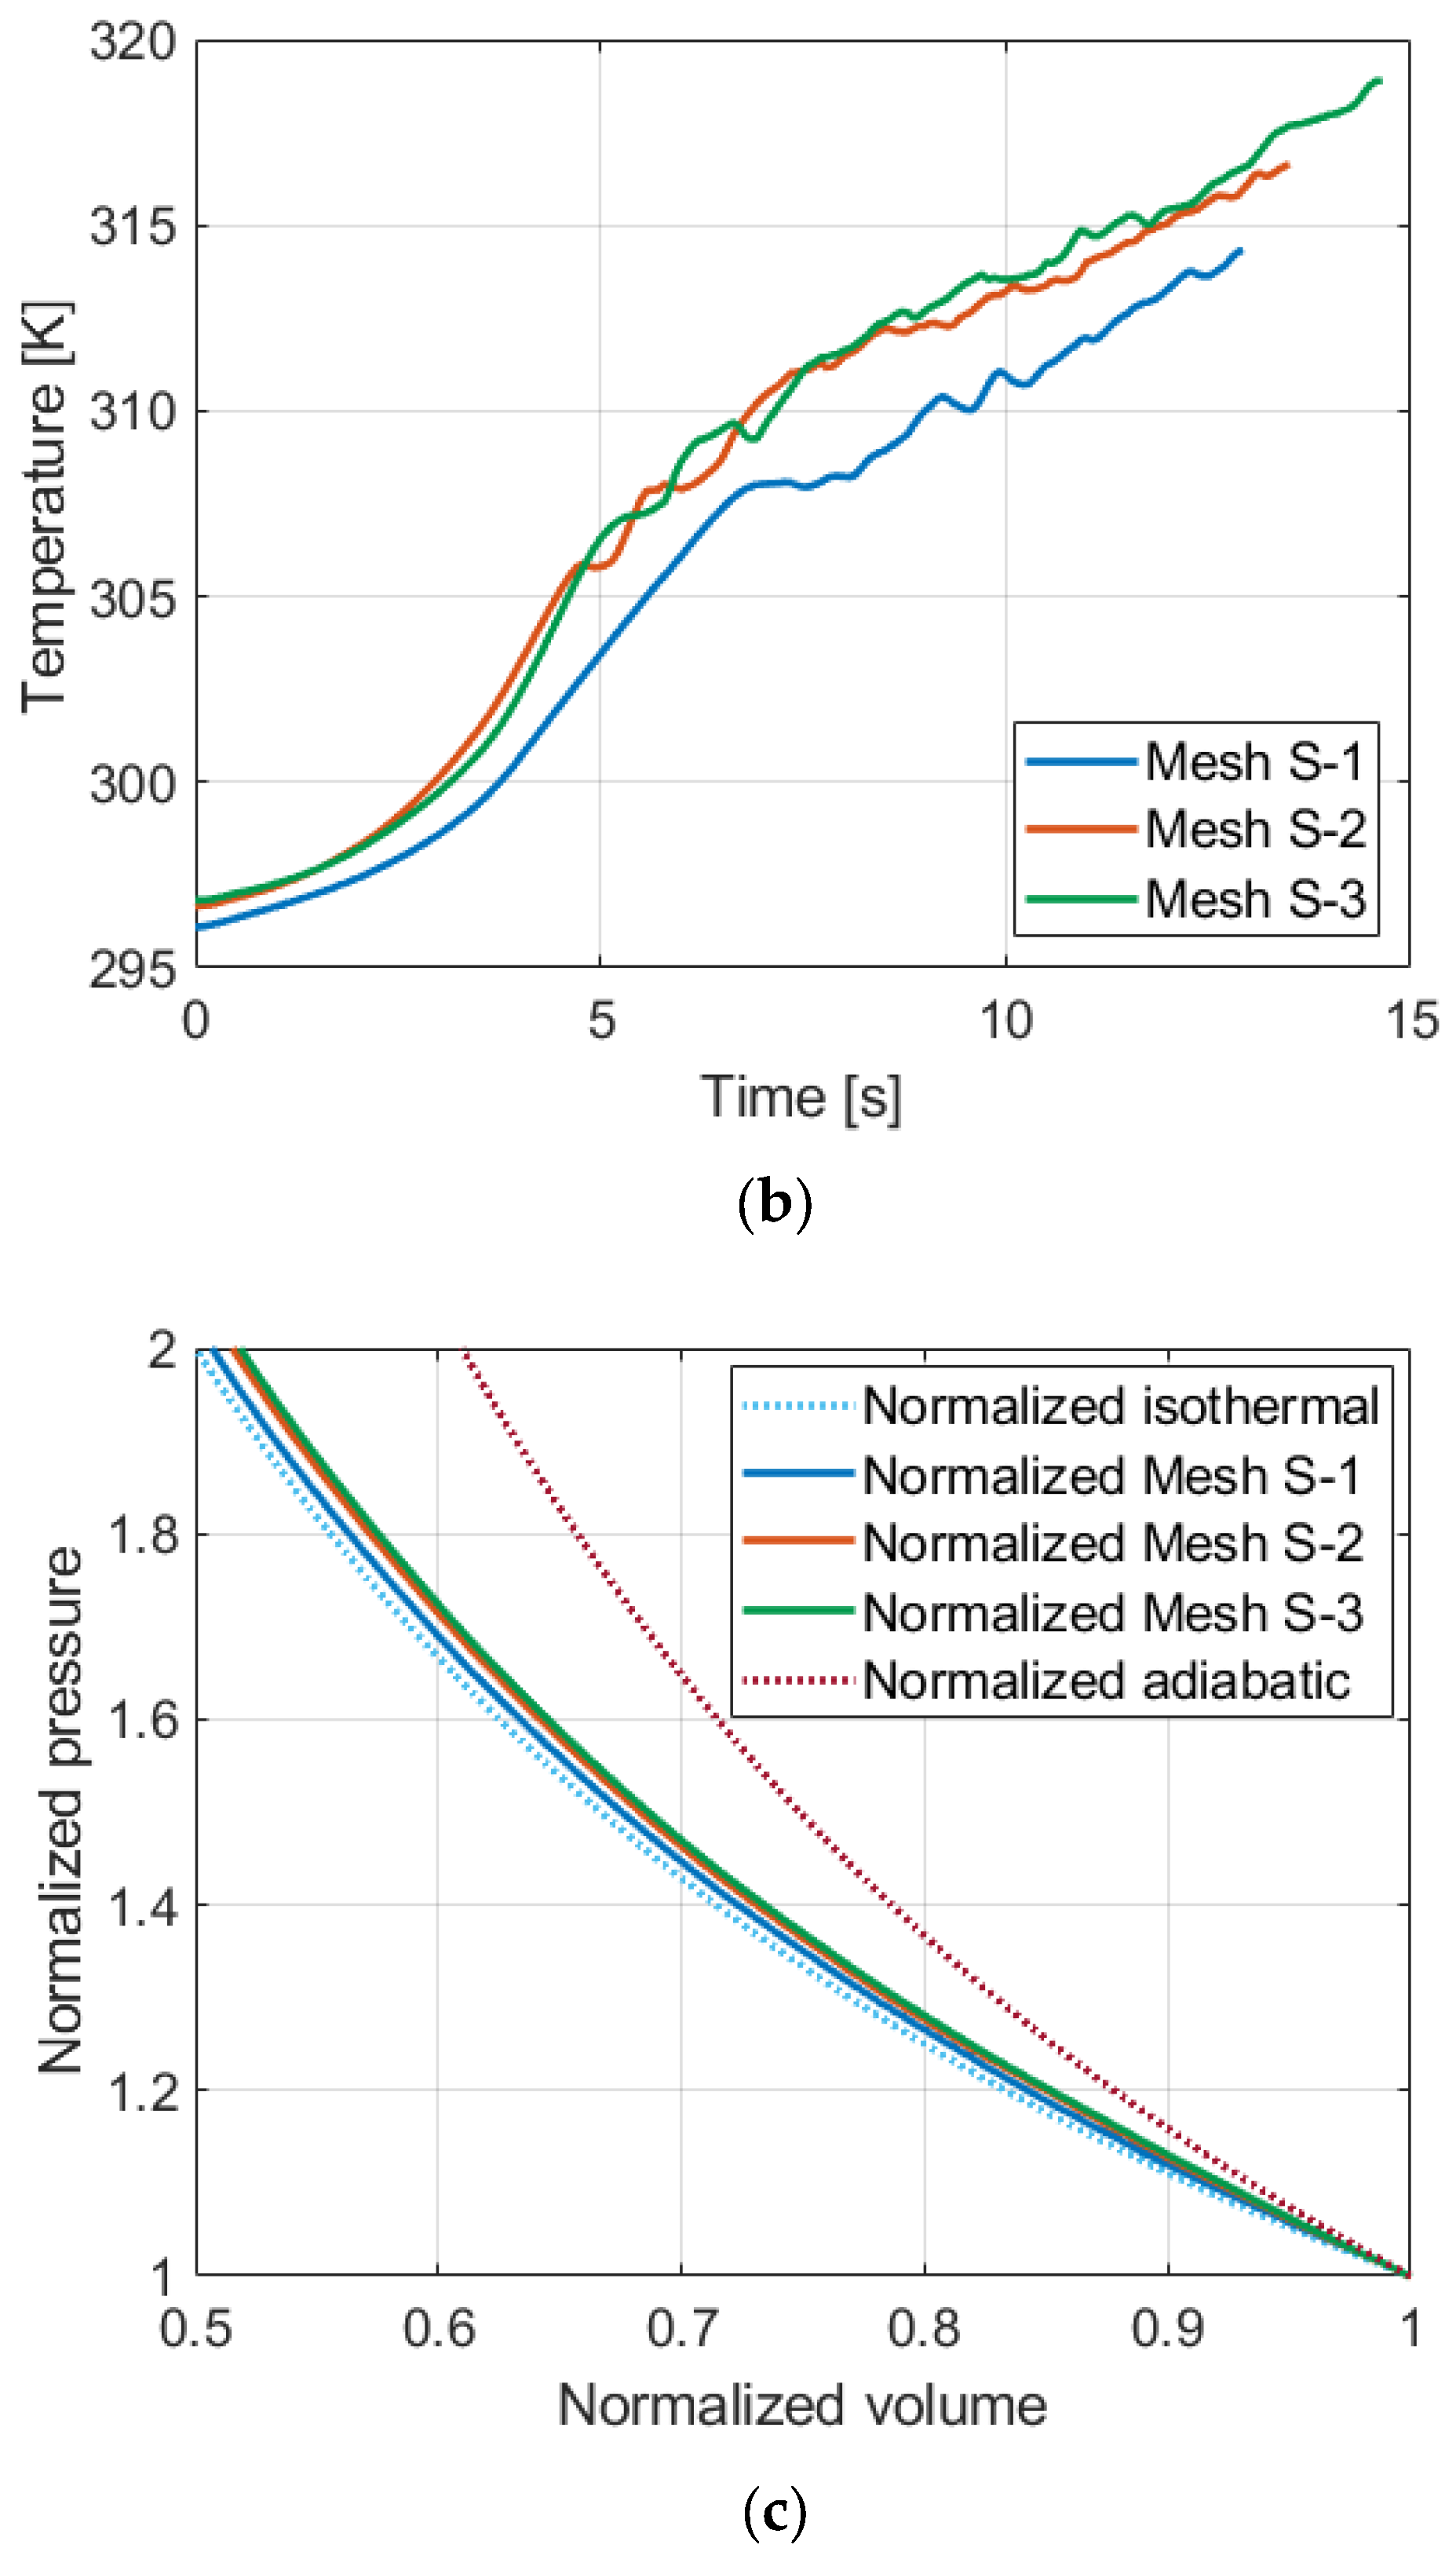
4.2. With-Copper Wire Mesh Insert Compression

In the same manner as the baseline tests, compressions were performed with the copper wire mesh inserts. Figure 9 displays the pressure, temperature, and pressure–volume profiles of compressions with the large insert and Figure 10 shows those of compressions with the small insert.
Mesh L-N in the plot legend of Figure 9 stands for with large insert compression starting at N bar(s) and Mesh S-N of Figure 10 for with small insert compression starting at N bar(s). Two parameters, temperature change ( Δ T ) and isothermal compression efficiency ( η i s o ), were calculated for the isothermal performance evaluations. The numerical values of the parameters are summarized in Table 2.
In the isothermal efficiency calculation, the changes in air volume due to the inserts were reflected. The efficiency computation was performed by using the method described in Section 2.2. To verify the values, the isothermal efficiency of every single stroke was also calculated. For each case of experiments, the standard deviations of the isothermal efficiency were between 0.01% and 0.23%. For example, the efficiency and standard deviation of Baseline-1 cycle were 87.4 ± 0.21%. The with-insert tests show the same trend as the baseline tests. The temperature changes were greater when the initial pressure was higher, and the pressure–volume profile of a lower initial pressure case was closer to the isothermal profile. Additionally, the efficiency difference between 1-bar and 2-bar compressions was greater than that between 2-bar and 3-bar compressions. Comparing the baseline and with-insert tests, regardless of whether the used insert was large or small, the use of an insert resulted in a smaller temperature change and a higher isothermal efficiency when the pressure level was the same. The large copper wire mesh insert showed improved efficiencies over the small one because the large insert provided a greater surface area and thermal capacity.
In addition to the performance assessment based on the isothermal efficiency and temperature values, the volume of air compromised depending on the size of an insert needs to be addressed for a comprehensive evaluation because the volume influences the work input and output. As observed in Table 2, the use of the large insert led to a better isothermal efficiency. Because the volume of the large insert was almost twice as big as the small one, the improved efficiency was achieved at a greater expense of initial air volume. The volumes taken by the large and small inserts were 1.88% and 1.03%, respectively, which are relatively small values, for the resulting efficiency gains. Therefore, a metal wire mesh insert is an advantageous option that can offer efficiency enhancement while not heavily compromising the initial air volume.
The current system included some potential error sources for the isothermal performance evaluation. When the inserts were placed in the chamber, it was difficult to read the initial air volume in the chamber. Additionally, there was a possibility that the insert was in contact with the thermocouple tip and could affect the temperature measurement. Despite the potential issues, the results of the current work agree with the trend shown in a former study that tested inserts of various sizes [25,38] and support the effectiveness using solid inserts, which has also been explored by former studies [21,22,24,25]. Hence, it is safe to conclude that the overall isothermal performance trend with the use of metal wire mesh inserts was well represented.

4.3. Comparative Study with Liquid-Based Heat Transfer Enhancement Techniques

In this sub-section, solid-based and liquid-based heat transfer techniques are compared in a quantitative and qualitative manner. A series of experimental studies on the combination of a liquid piston and heat transfer enhancement techniques, including two liquid-based methods, the spray injection and aqueous foam, have been conducted in [36,37]. The working mechanism of the spray method is to inject droplets into the chamber when compression or expansion is in progress. The droplets provide extra surface area for heat exchange, thus injecting droplets continuously throughout the compression process is beneficial [17]. In contrast, the way that aqueous foam was employed in [29,36] did not require continuous operation or generation during the compression or expansion. The chamber was filled with aqueous foam by blowing air through a surfactant solution prior to compression, and the foam served as an additional heat exchange area.
Because the experimental setups share the same system design and tests were performed with the same methodology, a fair comparison of the methods can be made. Figure 11 compares the isothermal compression efficiencies of the baseline compression and compressions with the spray injection, aqueous foam, and copper wire mesh inserts.
The use of a heat transfer enhancement technique resulted in an increased isothermal efficiency, in that their efficiencies were higher than those of the baseline test at all the pressure levels. Except for the spray test, there is an inversely proportional relationship between the isothermal performance and initial pressure level. However, these numbers were computed solely based on the pressure and volume data of the tests. If the work input to operate the spray injection, which exponentially increases with the initial pressure [37], is addressed, the spray compression also shows the same trend. The isothermal efficiency and increased isothermal efficiency ( Δ η i s o ) are summarized in Table 3. For Δ η i s o , the values were computed by subtracting the baseline compression efficiency from the efficiency of the compression with the heat transfer techniques. Since each study was a separate work, baseline compressions were performed for a reference.
The spray injection showed the best isothermal performance among the tests with an isothermal efficiency of 98–98.5% at all the pressure levels. The spray nozzle used in [37] was able to generate fine droplets. Since each droplet provided surface area for heat exchange and the droplets were continuously injected, the total surface area for heat exchange was immense. The efficiency benefit from the use of the spray is greater at a higher-pressure level. This is because a higher spray pressure was required to inject water droplets into a higher-pressure environment. Spray flowrate, droplet size, and droplet speed, which are critical parameters for determining the droplet heat transfer, are dependent on the spray pressure. Thus, a higher-pressure injection results in greater heat transfer. Metal wire mesh inserts followed the spray injection, having the second highest change in isothermal efficiency. With the large insert, about 10% efficiency increases were achieved at the three pressure levels and, with the small insert, about 8.5%. The use of aqueous foam achieved the smallest efficiency increases. The effectiveness declines at a higher pressure, even though the differences were marginal.
Because each method has a distinctive working mechanism, comparison with the efficiency numbers only is not enough for a comprehensive analysis. When it comes to the spray method, the work input to operate the spray needs to be addressed. Even though injecting droplets throughout the compression process is more advantageous [17], it continuously consumes work input. Since the work input is determined by the injection pressure and flowrate [40], a greater work input is required at a higher-pressure level. In the experiments at various pressure levels, when the spray pressure was set at the target pressure of the compression, which is a minimum constant pressure for continuous injection, the spray work input exponentially increased with the initial pressure. The overall efficiencies, which include the spray work input in the calculation, of Spray-1, 2, and 3 were 74.7%, 59.5%, and 49.6%, respectively. Even though these values are even less efficient than the baseline compressions, they should not be used to undervalue the effectiveness of the spray technique. For the experimental setup, the compression strokes were performed at a relatively slow speed to avoid the excessive temperature increase for the safe operation of the system components, and it was not an ideal condition for the spray use because the work input is proportional to the stroke time when the spray is continuously operated during the process. The goal of the spray study was to understand the impact of the initial pressure on spray effectiveness. With the proper optimization of the stroke time and spray nozzle capacity, a sweet spot where the gain from the spray is greater than the work input can be achieved. The spray injection study shows that the spray work input is a critical factor that determines the actual efficiency of compression. Hence, the spray injection is not suitable for compressions performed at an elevated pressure level or with a long compression stroke time.
Aqueous foam can be used without extra work input in a multi-stage compression system by transferring compressed air to the next stage through a surfactant solution [36]. The transfer through the solution can function as an air-blowing process to generate the foam. The efficiency gains from the use of the aqueous foam were 2.2%, 2.1%, and 1.3% at the initial pressures of 1 bar, 2 bars, and 3 bars, respectively. These are the smallest improvements compared to the other methods. The volume change of the foam contributes to less impressive performance because the collapse of the foam is inevitable under the conditions where pressure and temperature vary with the progress of the compression. Since the foam was generated only ahead of the compression and no extra foam was added during the compression, the collapse of the foam reduces the surface area for the heat transfer. Furthermore, it does not have much room for extra improvement. In [29], a parametric study was performed by varying a couple of factors such as the flowrate of blowing air, volume of the foam, and foam generator design. The efficiency changes caused by varying the factors were relatively small. In short, aqueous foam has an advantage of no extra work input to operate when it is employed in a multi-stage compression system, but it has disadvantages of less effectiveness and a lower ceiling than the other techniques.
Although the isothermal performance using metal wire mesh inserts was second to the spray technique, the effectiveness of the technique was excellent. Comparing the overall efficiencies with the work input considered, the metal wire mesh inserts showed the best results among the techniques under the testing conditions. Additionally, it can be simply incorporated into the system. By changing the type or dimension of an insert, the degree of heat transfer can be adjusted. However, the solid insert technique also has disadvantages, including potentially high cost and compromised volume. On a lab scale like the present work, the compromised volume is a relatively less significant issue. However, given that CAES is typically for the utility scale, the values deemed minor in the lab scale could lead to a substantial difference in the energy output in the real system. For an actual scale CAES fully equipped with liquid piston compressors, the total volume of the chamber is expected to be gigantic and the cost for the insert materials may be huge, even though the volume ratio of the inserts is relatively small. Moreover, the heating of the insert could be an issue when the compression stroke is repeatedly performed without a sufficient time interval between strokes.
Each technique can be selectively employed depending on the working environment and conditions because the pros and cons of each technique differ from one another. For instance, at a higher-pressure stage after passing through previous low-pressure stages, the total volume of the air may be smaller than the low-pressure stage. Using solid inserts can be a proper choice for this situation. Because of the reduced volume, it does not require as much material for the insert as the early-stage applications. In contrast, it is not an ideal environment to inject droplets into because it requires a high spray injection pressure, which leads to a greater work input.

4.4. Future Work and Suggestions

In future works, several factors that were not covered in this work should be investigated. The stroke time was fixed in this work. The extent of isothermal efficiency variations at different initial pressure levels may differ from what was observed in the current processes performed at a relatively slow speed. This is critical particularly for the spray method, the efficiency of which is heavily dependent on the stroke time. In addition, by trying a greater number of diverse-sized inserts, a more in-depth investigation on the relationship between the compromised volume and efficiency can be made. Furthermore, higher pressure conditions can be another topic. Given that the pressure ranges of actual CAES plants in operation in Huntorf and McIntosh are dozens of bars [12], the tested pressure ranges and pressure ratios were relatively quite low. Because the visual observation through the transparent chamber was highly critical in the series of experimental works, the selection of the experimental apparatus materials and conditions was limited. This is because a higher pressure ratio or a higher initial pressure may accompany a greater increase in pressure and temperature. Therefore, moderate pressure conditions were chosen for the current work. For future experimental studies, testing higher initial pressure levels and ratios with a more durable system is expected to pave the way for a deeper understanding of the heat transfer techniques in the liquid piston.
Further investigation into the inserts placed in the chamber can be another interesting topic. In this work, although the volumes of the inserts differ from one another, they were relatively small for the total volume of the compression chamber. Therefore, a potential relationship between the insert volume and the compression efficiency was not fully investigated in the present work. Additionally, identifying the heat transfer coefficient and the impact of the material characteristics are worthwhile subjects in the future as well.
Even though there is room for improvement in future works, the current article achieved the primary goal of performing a comparative study of a solid-based technique and liquid-based techniques at various pressure levels. It made a fair comparison of the techniques, as the series of the experimental studies were performed under consistent conditions. Provided that the chamber designs were the same and the efficiency level of the baseline tests were similar, the efficiency changes solely based on the use of each technique were compared.

5. Conclusions

This work was carried out with two primary objectives: 1) to evaluate the combination of a liquid piston and copper wire mesh inserts at various pressure levels and 2) to conduct a comparative study based on the experimental results of the current study and previous research on the spray and aqueous foam methods. For the first objective, baseline compression and compressions with two different-sized copper wire mesh inserts were performed starting at 1 bar, 2 bars, and 3 bars, each with a pressure ratio of 2. An isothermal compression efficiency of up to 97.4% was achieved with a large insert and up to 96.1% with a small insert. These are noticeable increases compared to the efficiency of 87.4% without an insert. The improved efficiencies were achieved at the expense of some initial air volume. However, because the volumes taken by the inserts were less than 2% of the initial air volume, the cost of volume compromise was relatively small.
For the second objective, the results were compared with liquid-based heat transfer enhancement techniques under consistent conditions. Comparing the isothermal performance, the spray injection method showed the largest efficiency improvement, followed by the metal wire mesh inserts, and the least improvement was observed with the aqueous foam. Apart from the quantitative evaluation based on the efficiency values, a comprehensive comparison was made based on the working mechanisms and characteristics of the techniques. The metal wire mesh insert technique has the following pros and cons in comparison with the other techniques:
  • Pros: it showed excellent isothermal performance, second to the spray method. This was achieved with a relatively small reduction in the volume of the compression chamber. No extra work input is required to be employed, and it can be simply incorporated into the system.
  • Cons: when the system is scaled up to a utility scale, the cost of the materials can be substantial. The existence of inserts in the chamber compromises air volume.
The unique working mechanism of each method distinguishes the techniques from one another. Hence, depending on the working conditions, such as pressure level and volume of the chamber, the selective use of the techniques can result in the maximization of system efficiency.
For future works, testing under higher initial pressure levels and pressure ratios conditions will provide a better understanding of practicability.

Author Contributions

Conceptualization, B.A. and P.I.R.; methodology, B.A.; formal analysis, B.A.; investigation, B.A. and M.S.; data curation, B.A.; writing—original draft preparation, B.A.; writing—review and editing, M.S. and P.I.R.; supervision, P.I.R.; project administration, P.I.R. All authors have read and agreed to the published version of the manuscript.

Funding

This research was not supported by external funding but internal funding from Baylor University.

Data Availability Statement

The original contributions presented in the study are included in the article, further inquiries can be directed to the corresponding author.

Conflicts of Interest

The authors declare no conflicts of interest.

Nomenclature and Abbreviations

A b u b b l e Surface area of bubble
A c h a m b e r Surface area of chamber
A d r o p Surface area of a droplet
A m e s h Surface area of mesh insert
C v Specific heat
h d r o p Heat transfer coefficient of a droplet
h m e s h Overall heat transfer coefficient of mesh insert
k b u b b l e Thermal conductivity of bubble
L b u b b l e Bubble wall thickness
m a i r Mass of air
P Pressure
P 0 Initial pressure
P a i r Pressure of air
P f Final pressure
P i s o Pressure profile of isothermal process
P r Pressure ratio
Q ˙ Rate of heat transfer
Q ˙ f o a m Rate of aqueous foam heat transfer
Q ˙ m e s h Rate of mesh insert heat transfer
Q ˙ s p r a y Rate of spray heat transfer
T a i r Temperature of air
T b u b b l e Temperature of bubble
T d r o p Temperature of droplet
T m e s h Temperature of mesh insert
T Temperature of surroundings
Δ T Temperature change of air
t Time
U Internal energy
U h Overall heat transfer coefficient
V Volume
V 0 Initial volume
V a i r Temperature of air
V f Final volume
V f , i s o Final volume of isothermal compression
V i s o Volume profile of isothermal process
W c o m p r e s s i o n Compression work
W c o o l i n g Cooling work
W i s o Isothermal compression work
W ˙ c o m p r e s s i o n Rate of compression work
η i s o Isothermal compression efficiency
Baseline-NBaseline compression starting at N bar(s)
Mesh L-NCompression with large mesh insert starting at N bar(s)
Mesh S-NCompression with small mesh insert starting at N bar(s)
Spray-NCompression with spray injection starting at N bar(s)
Foam-NCompression with aqueous foam starting at N bar(s)
CAESCompressed air energy storage
ICAESIsothermal compressed air energy storage

References

  1. Renewable Energy Explained—U.S. Energy Information Administration (EIA). Available online: https://www.eia.gov/energyexplained/renewable-sources/ (accessed on 8 December 2023).
  2. Yekini Suberu, M.; Wazir Mustafa, M.; Bashir, N. Energy Storage Systems for Renewable Energy Power Sector Integration and Mitigation of Intermittency. Renew. Sustain. Energy Rev. 2014, 35, 499–514. [Google Scholar] [CrossRef]
  3. Qin, C.; Loth, E. Isothermal Compressed Wind Energy Storage Using Abandoned Oil/Gas Wells or Coal Mines. Appl. Energy 2021, 292, 116867. [Google Scholar] [CrossRef]
  4. Qin, C.; Loth, E.; Li, P.; Simon, T.; Van de Ven, J. Spray-Cooling Concept for Wind-Based Compressed Air Energy Storage. J. Renew. Sustain. Energy 2014, 6, 043125. [Google Scholar] [CrossRef]
  5. Crotogino, F.; Mohmeyer, K.-U.; Scharf, R. Huntorf CAES: More than 20 Years of Successful Operation. In Proceedings of the SMRI Spring Meeting, Orlando, FL, USA, 15–18 April 2001. [Google Scholar]
  6. Cavallo, A. Controllable and Affordable Utility-Scale Electricity from Intermittent Wind Resources and Compressed Air Energy Storage (CAES). Energy 2007, 32, 120–127. [Google Scholar] [CrossRef]
  7. Cavallo, A.J. Energy Storage Technologies for Utility Scale Intermittent Renewable Energy Systems. J. Sol. Energy Eng. 2001, 123, 387–389. [Google Scholar] [CrossRef]
  8. Bennett, J.A.; Simpson, J.G.; Qin, C.; Fittro, R.; Koenig, G.M.; Clarens, A.F.; Loth, E. Techno-Economic Analysis of Offshore Isothermal Compressed Air Energy Storage in Saline Aquifers Co-Located with Wind Power. Appl. Energy 2021, 303, 117587. [Google Scholar] [CrossRef]
  9. Hunt, J.D.; Zakeri, B.; Nascimento, A.; de Jesus Pacheco, D.A.; Patro, E.R.; Đurin, B.; Pereira, M.G.; Filho, W.L.; Wada, Y. Isothermal Deep Ocean Compressed Air Energy Storage: An Affordable Solution for Seasonal Energy Storage. Energies 2023, 16, 3118. [Google Scholar] [CrossRef]
  10. Maisonnave, O.; Moreau, L.; Aubrée, R.; Benkhoris, M.-F.; Neu, T.; Guyomarc’h, D. Optimal Energy Management of an Underwater Compressed Air Energy Storage Station Using Pumping Systems. Energy Convers. Manag. 2018, 165, 771–782. [Google Scholar] [CrossRef]
  11. Wang, Z.; Ting, D.S.-K.; Carriveau, R.; Xiong, W.; Wang, Z. Design and Thermodynamic Analysis of a Multi-Level Underwater Compressed Air Energy Storage System. J. Energy Storage 2016, 5, 203–211. [Google Scholar] [CrossRef]
  12. Wolf, D. Methods for Design and Application of Adiabatic Compressed Air Energy Storage Based on Dynamic Modeling; Laufen: Oberhausen, Germany, 2011. [Google Scholar]
  13. Tec-Science. Why Do Pressure and Temperature Increase During the Compression of a Gas? Tec-Science: New Delhi, India, 2021. [Google Scholar]
  14. Budt, M.; Wolf, D.; Span, R.; Yan, J. Compressed Air Energy Storage—An Option for Medium to Large Scale Electrical-Energy Storage. Energy Procedia 2016, 88, 698–702. [Google Scholar] [CrossRef]
  15. Kim, Y.-M.; Lee, J.-H.; Kim, S.-J.; Favrat, D. Potential and Evolution of Compressed Air Energy Storage: Energy and Exergy Analyses. Entropy 2012, 14, 1501–1521. [Google Scholar] [CrossRef]
  16. Van de Ven, J.D.; Li, P.Y. Liquid Piston Gas Compression. Appl. Energy 2009, 86, 2183–2191. [Google Scholar] [CrossRef]
  17. Qin, C.; Loth, E. Liquid Piston Compression Efficiency with Droplet Heat Transfer. Appl. Energy 2014, 114, 539–550. [Google Scholar] [CrossRef]
  18. Zhang, C.; Saadat, M.; Li, P.Y.; Simon, T.W. Heat Transfer in a Long, Thin Tube Section of an Air Compressor: An Empirical Correlation From CFD and a Thermodynamic Modeling; American Society of Mechanical Engineers Digital Collection; ASME: Houston, TX, USA, 2013; pp. 1601–1607. [Google Scholar]
  19. Hu, S.; Xu, W.; Jia, G.; Cai, M.; Li, J.; Lu, Y.; Ren, T. Efficiency Analysis of an Arrayed Liquid Piston Isothermal Air Compression System for Compressed Air Energy Storage. J. Therm. Sci. 2023, 32, 17–29. [Google Scholar] [CrossRef]
  20. Zhang, C.; Li, P.Y.; Van de Ven, J.D.; Simon, T.W. Design Analysis of a Liquid-Piston Compression Chamber with Application to Compressed Air Energy Storage. Appl. Therm. Eng. 2016, 101, 704–709. [Google Scholar] [CrossRef]
  21. Wieberdink, J.; Li, P.Y.; Simon, T.W.; Van de Ven, J.D. Effects of Porous Media Insert on the Efficiency and Power Density of a High Pressure (210 bar) Liquid Piston Air Compressor/Expander—An Experimental Study. Appl. Energy 2018, 212, 1025–1037. [Google Scholar] [CrossRef]
  22. Yan, B.; Wieberdink, J.; Shirazi, F.; Li, P.Y.; Simon, T.W.; Van de Ven, J.D. Experimental Study of Heat Transfer Enhancement in a Liquid Piston Compressor/Expander Using Porous Media Inserts. Appl. Energy 2015, 154, 40–50. [Google Scholar] [CrossRef]
  23. Haney, L.; Prosser, R.; Lanzon, A.; Mahmoudi, Y. Modelling of near Isothermal Liquid Piston Gas Compressor Employing Porous Media for Compressed Air Energy Storage Systems. Int. J. Therm. Sci. 2025, 212, 109775. [Google Scholar] [CrossRef]
  24. Patil, V.C.; Liu, J.; Ro, P.I. Efficiency Improvement of Liquid Piston Compressor Using Metal Wire Mesh for Near-Isothermal Compressed Air Energy Storage Application. J. Energy Storage 2020, 28, 101226. [Google Scholar] [CrossRef]
  25. Khaljani, M.; Vennard, A.; Harrison, J.; Surplus, D.; Murphy, A.; Mahmoudi, Y. Experimental and Modelling Analysis of Efficiency Enhancement in a Liquid Piston Gas Compressor Using Metal Plate Inserts for Compressed Air Energy Storage Application. J. Energy Storage 2021, 43, 103240. [Google Scholar] [CrossRef]
  26. Ren, T.; Xu, W.; Jia, G.-W.; Cai, M. A Novel Isothermal Compression Method for Energy Conservation in Fluid Power Systems. Entropy 2020, 22, 1015. [Google Scholar] [CrossRef] [PubMed]
  27. Ren, T.; Xu, W.; Cai, M.; Wang, X.; Li, M. Experiments on Air Compression with an Isothermal Piston for Energy Storage. Energies 2019, 12, 3730. [Google Scholar] [CrossRef]
  28. Patil, V.C.; Acharya, P.; Ro, P.I. Experimental Investigation of Water Spray Injection in Liquid Piston for Near-Isothermal Compression. Appl. Energy 2020, 259, 114182. [Google Scholar] [CrossRef]
  29. Patil, V.C.; Ro, P.I. Experimental Study of Heat Transfer Enhancement in Liquid Piston Compressor Using Aqueous Foam. Appl. Therm. Eng. 2020, 164, 114441. [Google Scholar] [CrossRef]
  30. Patil, V.C. Efficiency Improvement Techniques in Liquid Piston Compressor for Ocean Compressed Air Energy Storage Application. Ph.D. Thesis, North Carolina State University, Raleigh, NC, USA, 2019. [Google Scholar]
  31. Single vs. Multi-Stage Compressors. Available online: https://cascousa.com/compressed-air-101/types-of-compressors/single-versus-multi-stage-compressors/ (accessed on 8 April 2022).
  32. Pollak, R. History of First U.S. Compressed-Air Energy Storage (CAES) Plant (110 MW 26 h): Volume 2: Construction; EPRI: Palo Alto, CA, USA, 1994. [Google Scholar]
  33. Budt, M.; Wolf, D.; Span, R.; Yan, J. A Review on Compressed Air Energy Storage: Basic Principles, Past Milestones and Recent Developments. Appl. Energy 2016, 170, 250–268. [Google Scholar] [CrossRef]
  34. Zhang, C.; Yan, B.; Wieberdink, J.; Li, P.Y.; Van de Ven, J.D.; Loth, E.; Simon, T.W. Thermal Analysis of a Compressor for Application to Compressed Air Energy Storage. Appl. Therm. Eng. 2014, 73, 1402–1411. [Google Scholar] [CrossRef]
  35. Ahn, B.; Ro, P.I. Experimental Investigation of Impacts of Initial Pressure Levels on Compression Efficiency and Dissolution in Liquid Piston Gas Compression. Energies 2023, 16, 1921. [Google Scholar] [CrossRef]
  36. Ahn, B. Comprehensive Experimental Investigation of Liquid Piston Gas Compression for Energy Storage Applications. Ph.D. Thesis, Baylor University, Waco, TX, USA, 2023. [Google Scholar]
  37. Ahn, B.; Ro, P.I. Spray Cooling Technique in Liquid Piston Gas Compression and Impact of Air Dissolution on Efficiency Evaluation at Different Pressure Levels. J. Energy Storage 2024, 81, 110460. [Google Scholar] [CrossRef]
  38. Ahn, B.; Patil, V.C.; Ro, P.I. Effect of Integrating Metal Wire Mesh with Spray Injection for Liquid Piston Gas Compression. Energies 2021, 14, 3723. [Google Scholar] [CrossRef]
  39. Li, C.; Wang, H.; He, X.; Zhang, Y. Experimental and Thermodynamic Investigation on Isothermal Performance of Large-Scaled Liquid Piston. Energy 2022, 249, 123731. [Google Scholar] [CrossRef]
  40. Çengel, Y.; Boles, M. Thermodynamics An Engineering Approach, 2nd ed.; McGraw-Hill, Inc.: Chicago, IL, USA, 1994; ISBN 0-07-911652-3. [Google Scholar]
Figure 1. Pressure–volume profiles of isothermal compression, single-stage compression, and multi-stage compression.
Energies 18 02032 g001
Figure 2. Schematic diagram of liquid piston air compression with and without metal wire mesh insert.
Energies 18 02032 g002
Figure 3. Pressure–volume profiles of isothermal, adiabatic, and actual compressions.
Energies 18 02032 g003
Figure 4. Schematic diagram of liquid piston system.
Energies 18 02032 g004
Figure 5. Copper wire mesh inserts and liquid piston compressor with copper wire mesh inserts.
Energies 18 02032 g005
Figure 6. Baseline compression at atmospheric pressure.
Energies 18 02032 g006
Figure 7. (a) Pressure, (b) temperature, and (c) volume of baseline compressions starting at 1, 2, and 3 bars.
Energies 18 02032 g007aEnergies 18 02032 g007b
Figure 8. Normalized pressure–volume profiles of Baseline-1, 2, and 3.
Energies 18 02032 g008
Figure 9. (a) Pressure, (b) temperature, and (c) normalized pressure–volume profiles of compressions with large mesh insert starting at 1, 2, and 3 bars.
Energies 18 02032 g009aEnergies 18 02032 g009b
Figure 10. (a) Pressure, (b) temperature, and (c) normalized pressure–volume profiles of compressions with small mesh insert starting at 1, 2, and 3 bars.
Energies 18 02032 g010aEnergies 18 02032 g010b
Figure 11. Isothermal efficiency comparison of baseline compression and compression with spray injection, aqueous foam, and metal wire mesh insert with initial pressure of 1, 2, and 3 bars [36,37].
Energies 18 02032 g011
Table 1. Sensor models and accuracy information.
SensorModelAccuracy
Pressure transducerOmega Engineering PX409-250A10V (Norwalk, CT, USA)±0.08% BSL accuracy
ThermocoupleOmega Engineering 5TC-TT-K-40 (Norwalk, CT, USA)2.2 °C
Linear position sensorTE SPD-50-3 (Galway, Ireland)0.25%
Table 2. Initial volume, temperature increase, and isothermal efficiency of cycles.
P 0
(Bar)
BaselineMesh LMesh S
Δ T (K) η i s o (%) Δ T (K) η i s o (%) Δ T (K) η i s o (%)
129.0387.413.6597.418.2496.1
235.2484.216.3994.319.9992.7
341.0383.016.9193.422.0891.5
Table 3. Isothermal efficiency comparison of heat transfer techniques [36,37].
ProjectCompression η i s o (%)Compression η i s o (%) Δ η i s o (%)
SprayBaseline-187.8Spray-198.5+10.7
Baseline-284.2Spray-298.0+13.8
Baseline-383.3Spray-398.5+15.2
Aqueous foamBaseline-189.2Foam-191.4+2.2
Baseline-286.1Foam-288.2+2.1
Baseline-385.3Foam-386.6+1.3
Wire meshBaseline-187.4Mesh L/S-197.4/96.1+10/+8.7
Baseline-284.2Mesh L/S-294.3/92.7+10.1/+8.5
Baseline-383.0Mesh L/S-393.4/91.5+10.4/+8.5
Disclaimer/Publisher’s Note: The statements, opinions and data contained in all publications are solely those of the individual author(s) and contributor(s) and not of MDPI and/or the editor(s). MDPI and/or the editor(s) disclaim responsibility for any injury to people or property resulting from any ideas, methods, instructions or products referred to in the content.

