
Life-Cycle Assessment and Environmental Costs of Cement-Based Materials Manufactured with Mixed Recycled Aggregate and Biomass Ash

 ,
, 
 ,
,  and
and
Abstract
1. Introduction
2. Materials and Methods
2.1. Mortar Component Materials
2.1.1. Cement CEM I 42.5R
2.1.2. Powder of Biomass Bottom Ash (pBBA)
2.1.3. Processed Mixed Recycled Aggregates (pMRA)
2.1.4. Normalised Sand (SNS) 0/2 mm Size According to EN 196-1 [61]
2.1.5. Mixed Recycled Fine Aggregates (Fine MRA) 0/2 Size, from Gecorsa Company (Córdoba, Spain)
2.1.6. Admixture
2.2. Component Materials of Concrete Mixtures
2.2.1. Cement CEM II 42.5
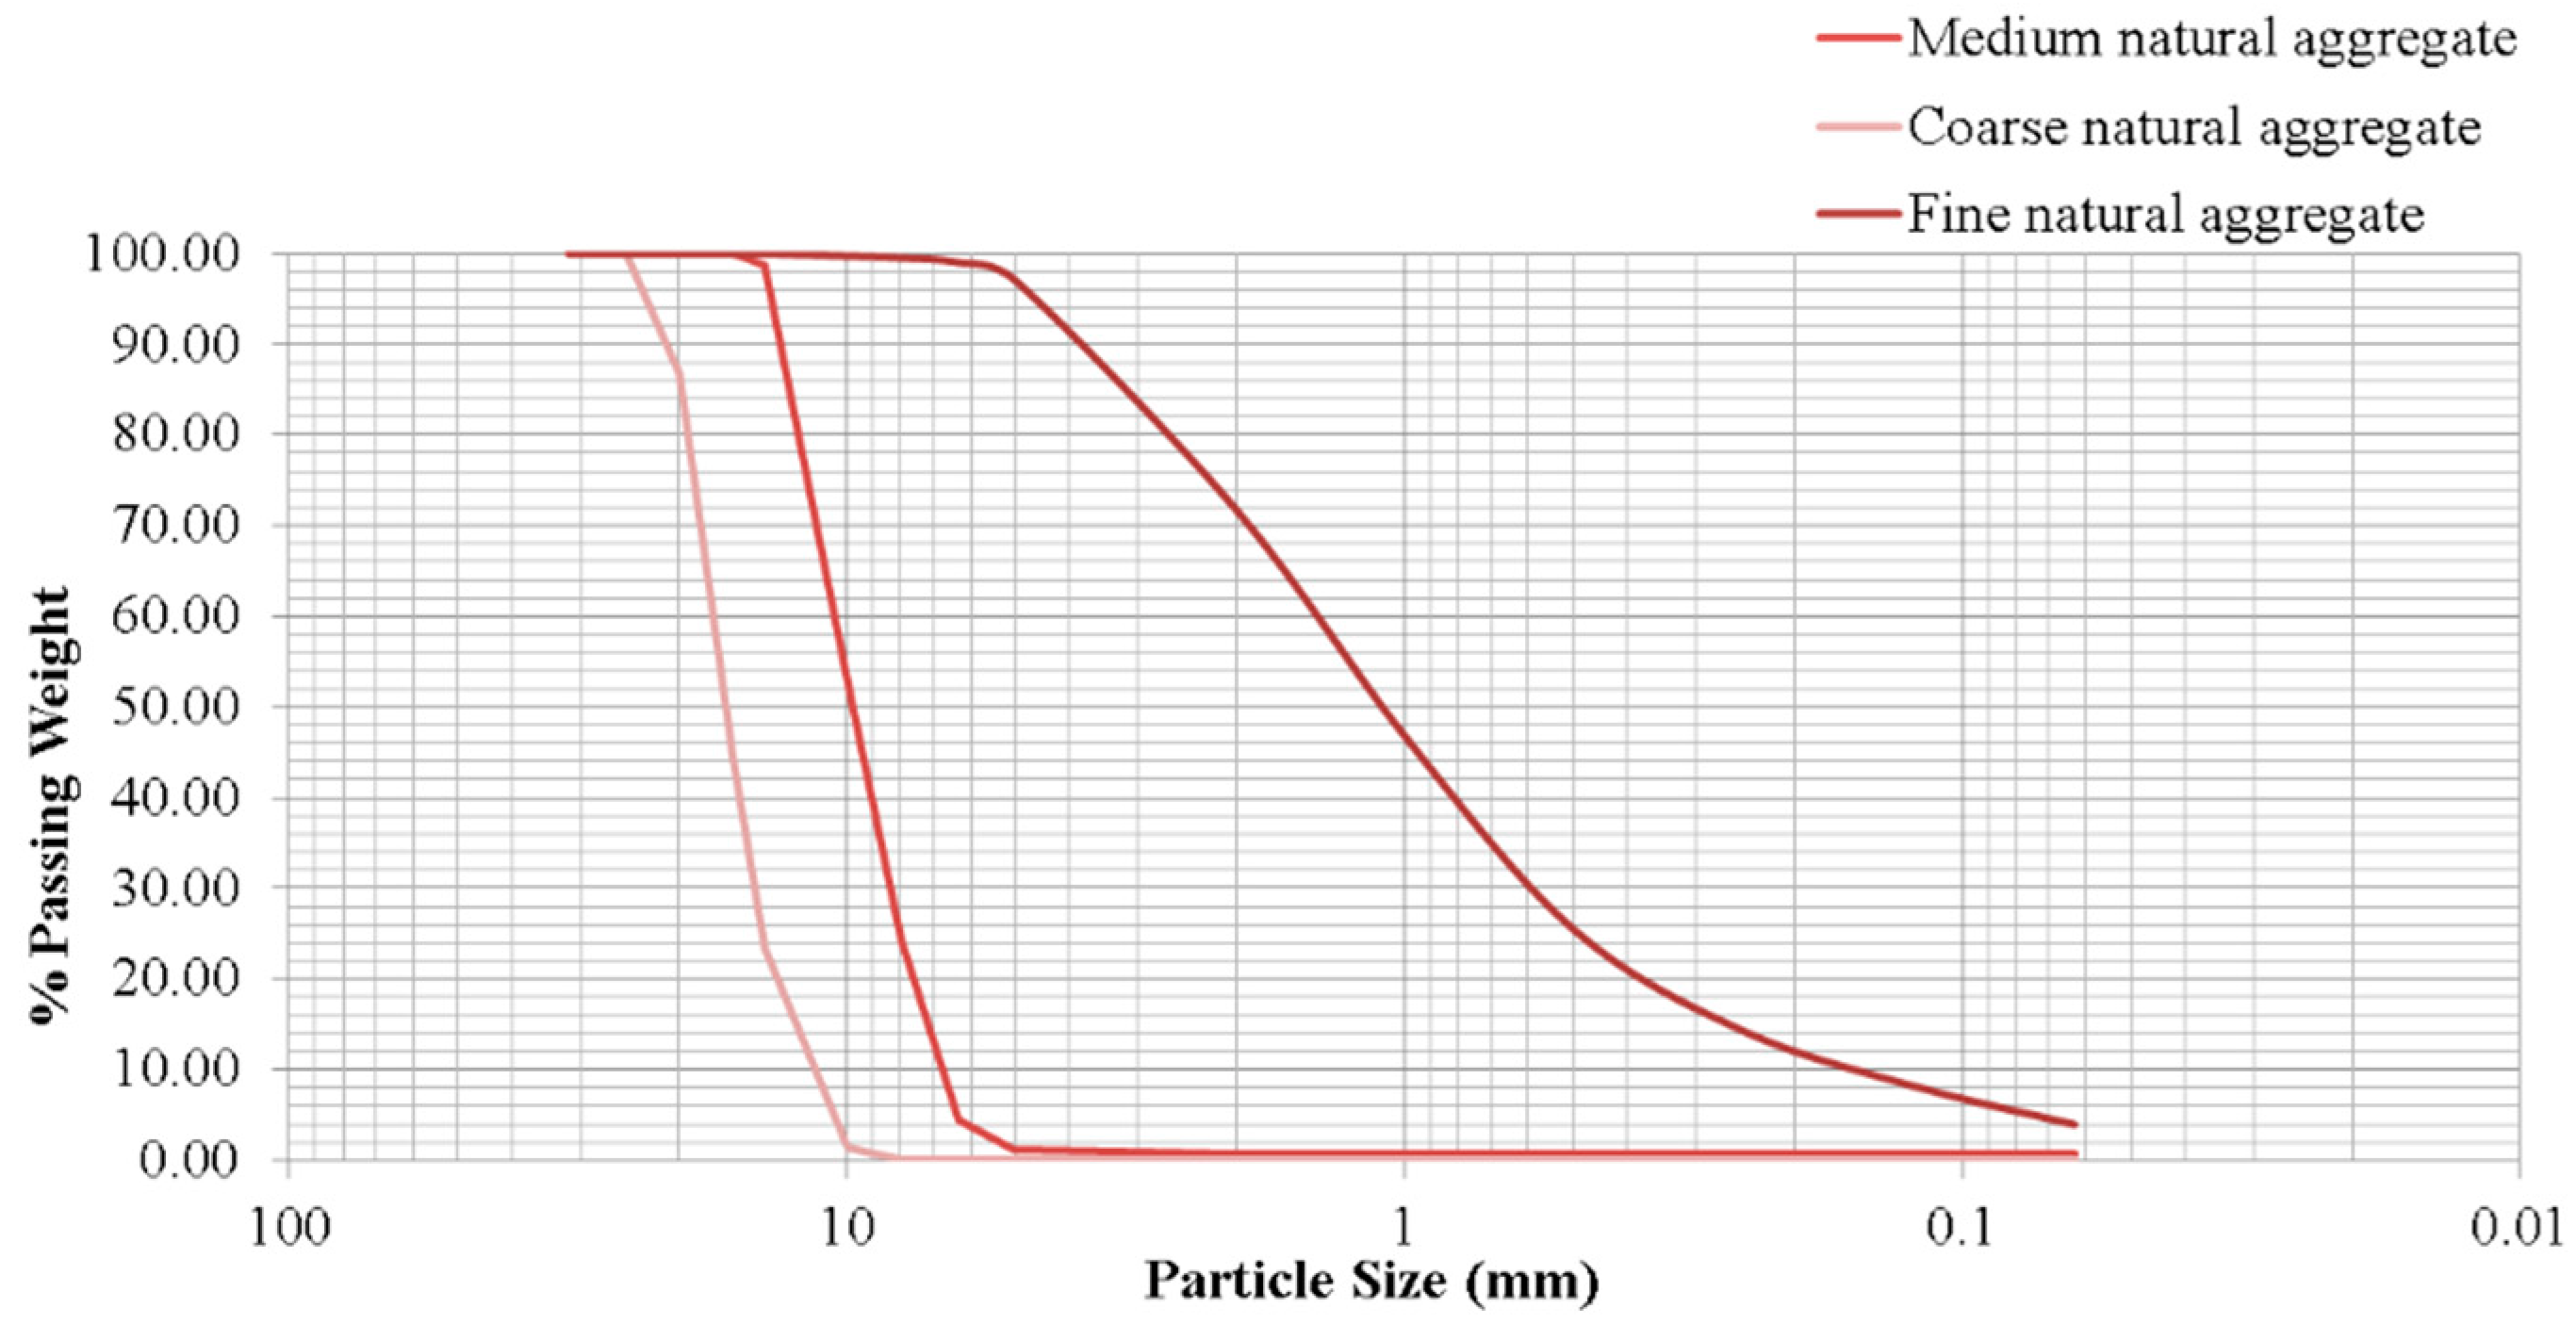
2.2.2. Natural Aggregates
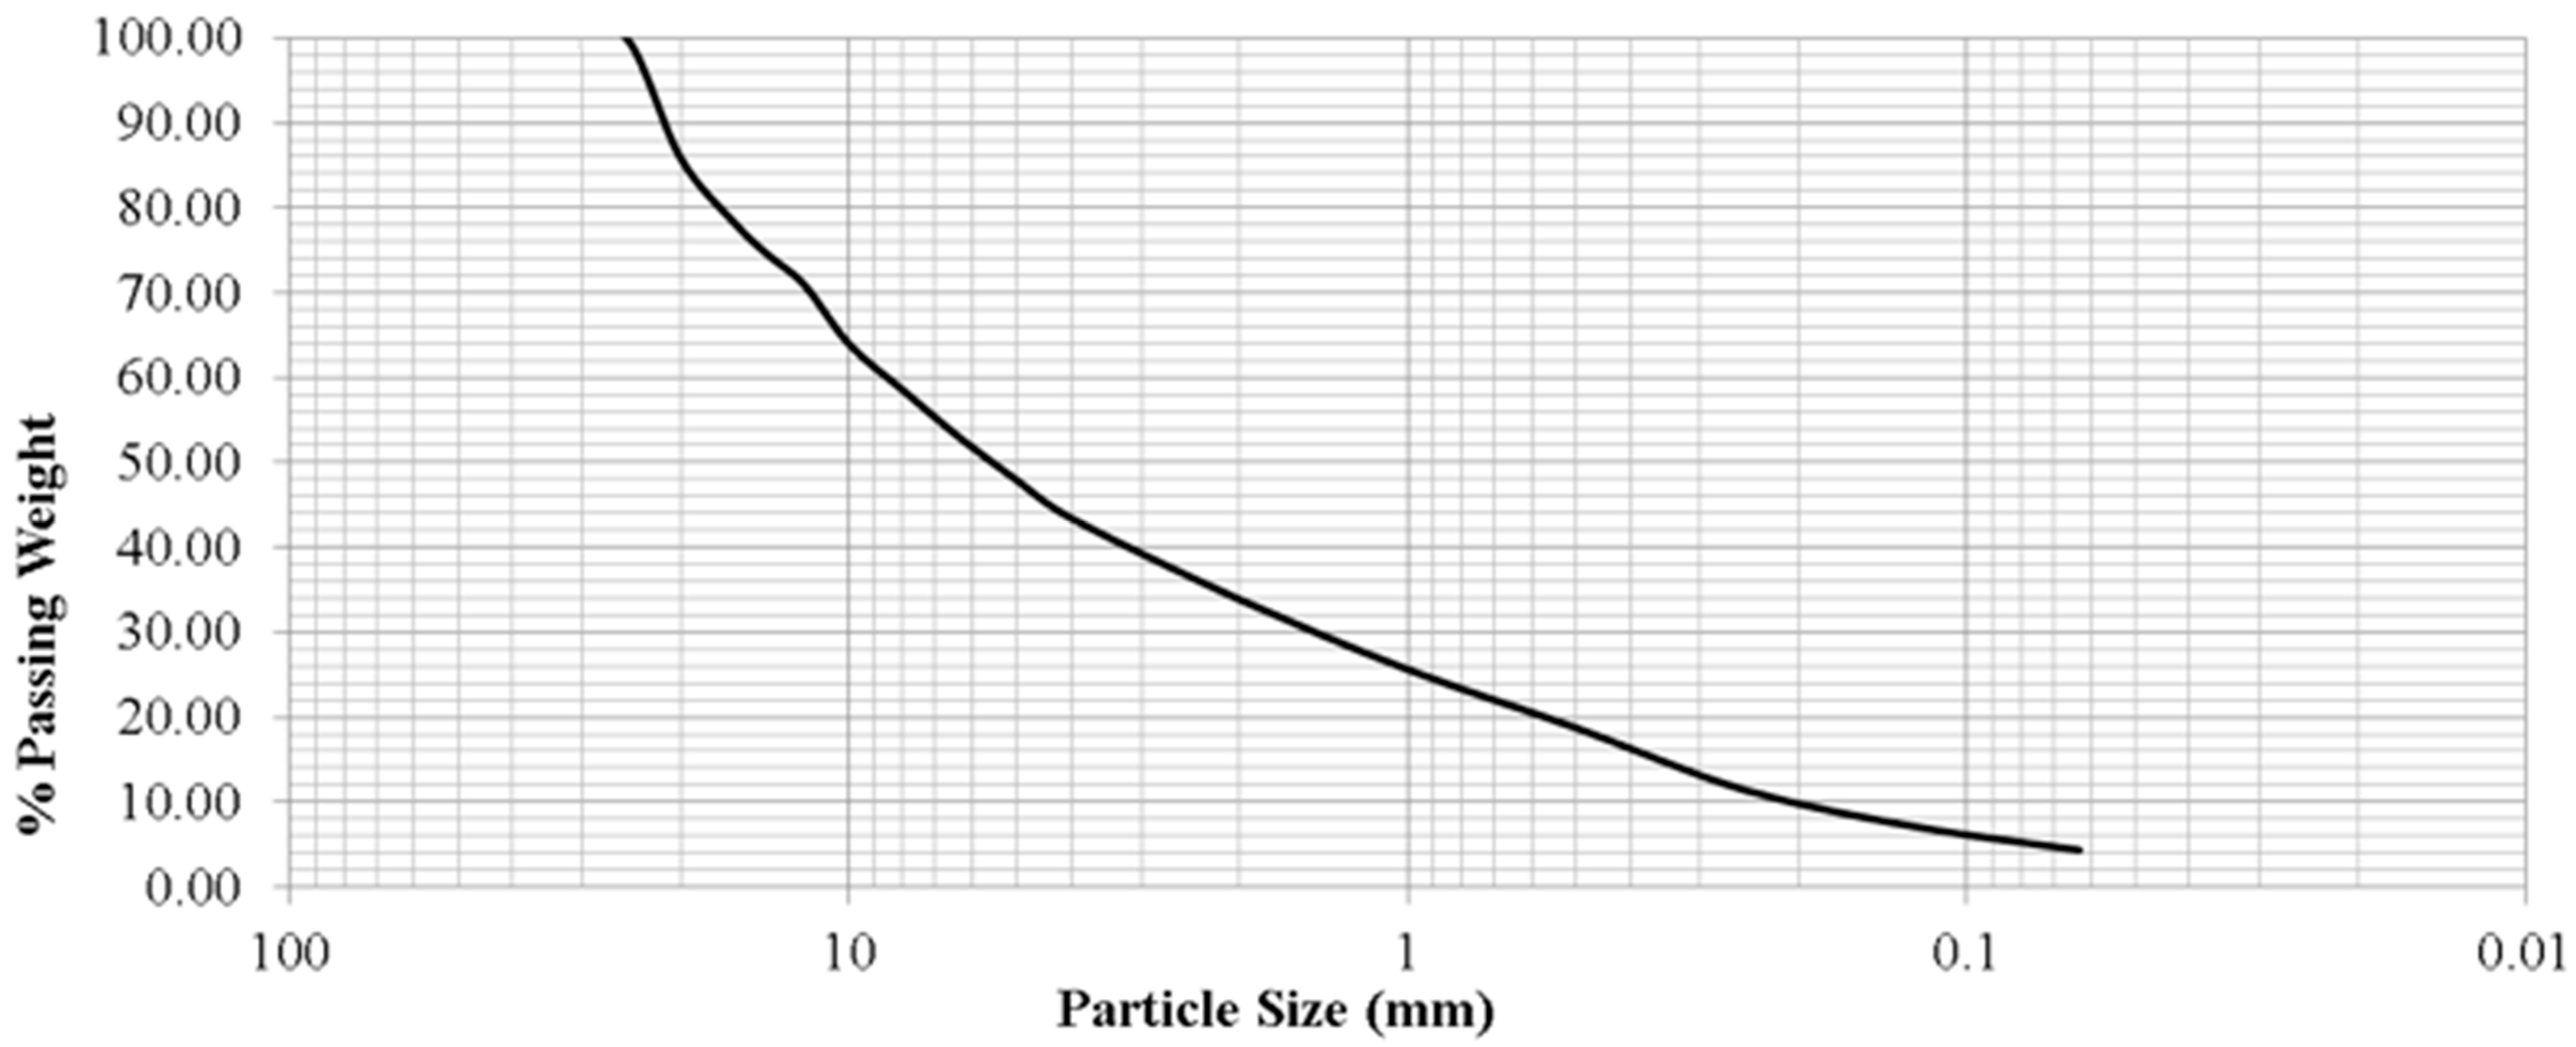
2.2.3. Mixed Recycled Aggregates (MRAs) (0/22 mm)
2.2.4. Biomass Bottom Ash (BBA) (0/4 mm)
2.2.5. Admixture
2.3. Dosages
3. Experimental Methods and Results of Mechanical Behaviour of Mortars and Concrete Mixture
3.1. Compressive Strength and Flexural Strength in Mortar and Concrete Mixtures
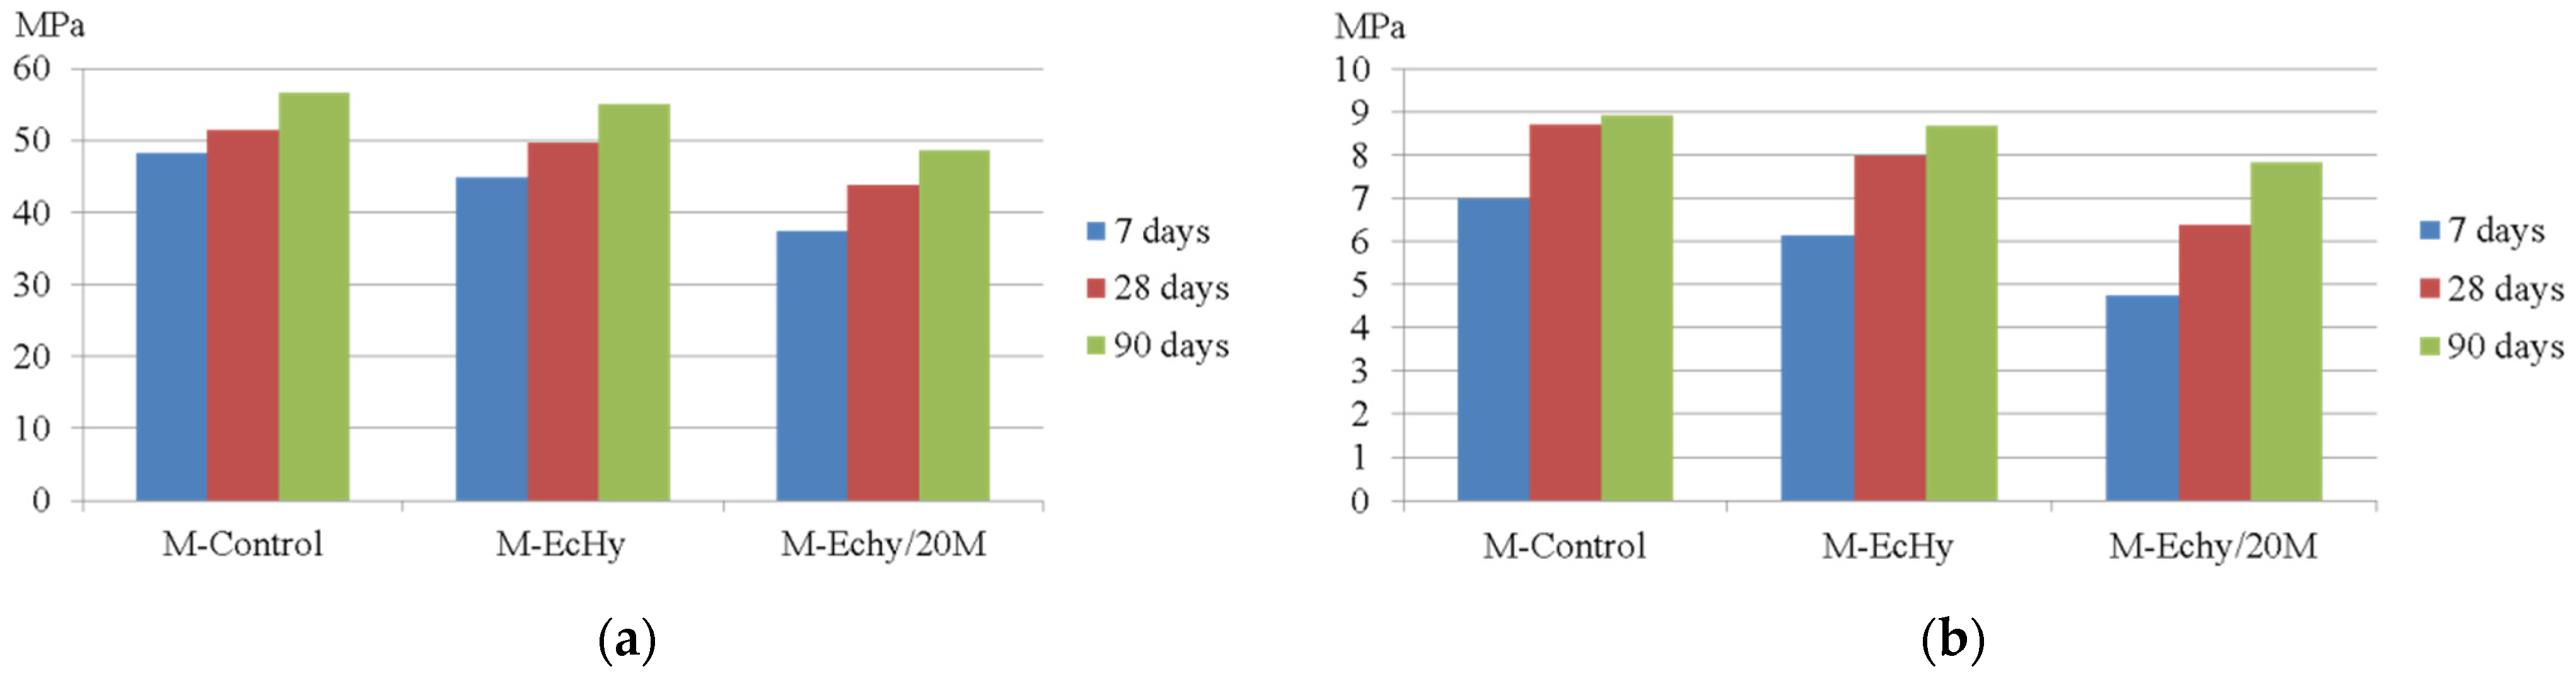
3.1.1. Results of Compressive Strength and Flexural Strength of Mortar Mixtures
3.1.2. Results of Compressive Strength and Flexural Strength of Concrete Mixtures
3.2. Dimensional Changes in Mortar and Concrete Mixtures
3.2.1. Results of Dimensional Changes of Mortar Mixtures
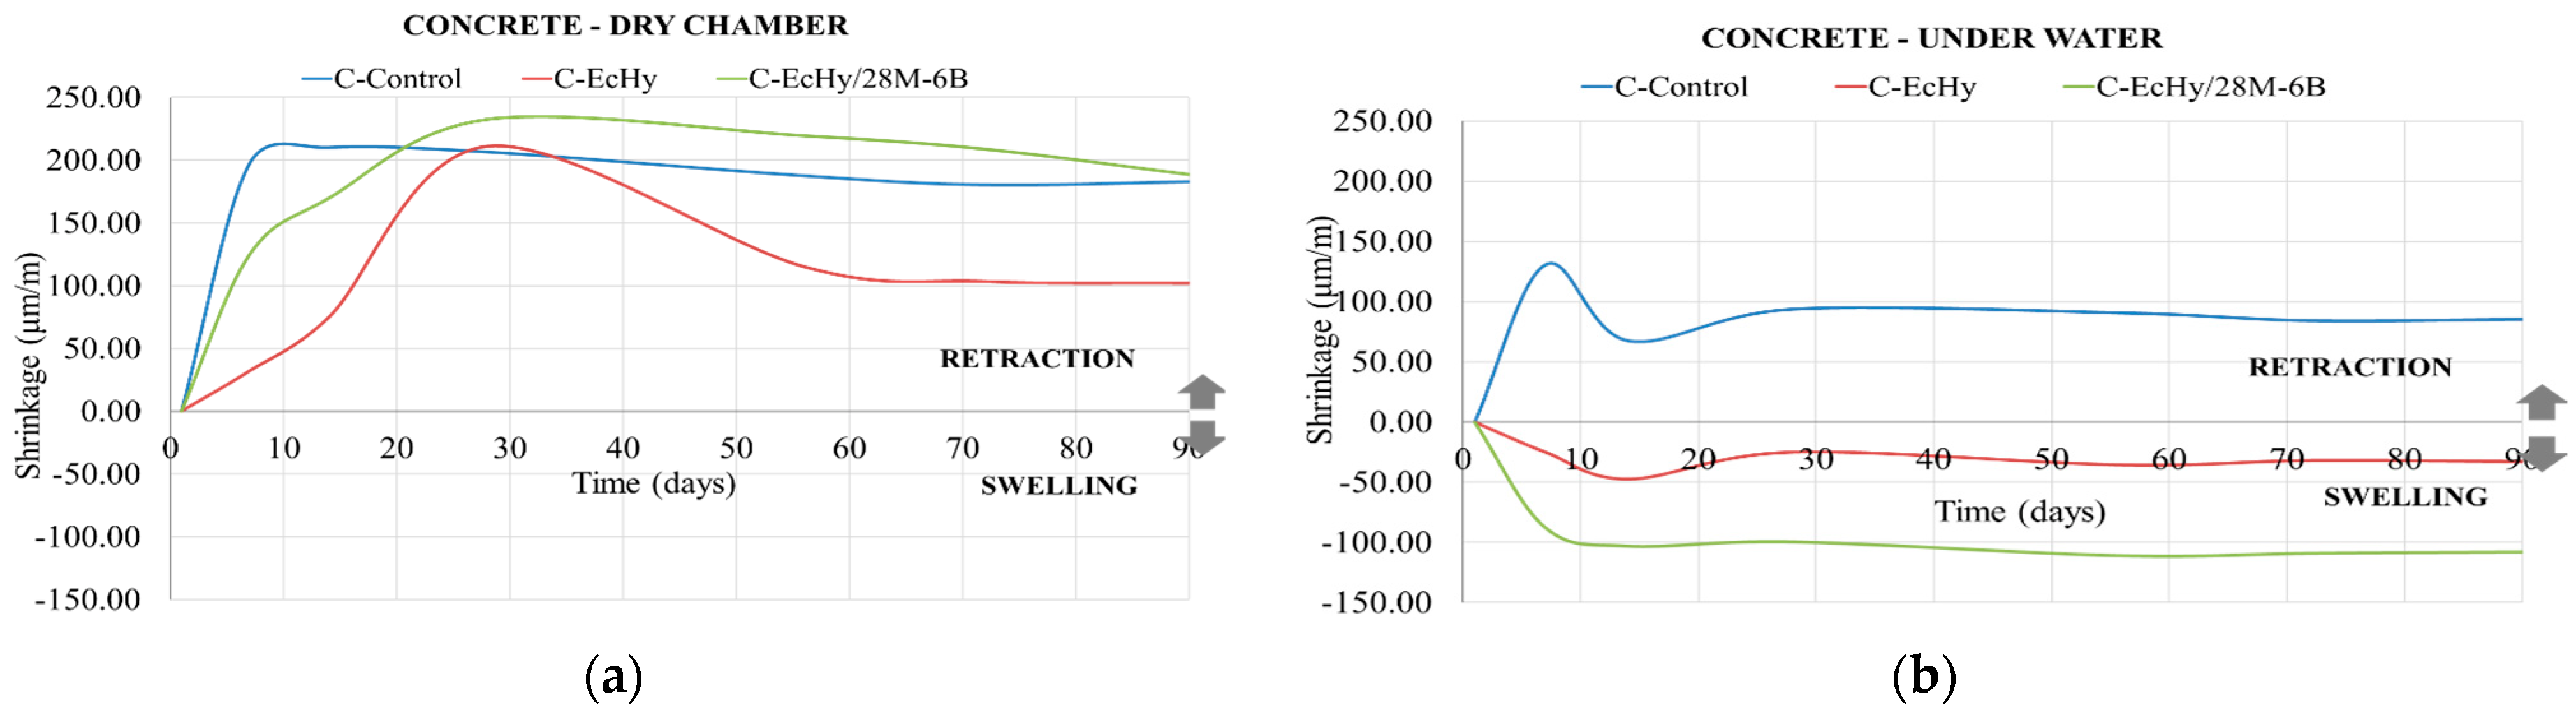
3.2.2. Results of Dimensional Changes in Concrete Mixtures
4. LCA Methodology and Results
4.1. LCA Methodology
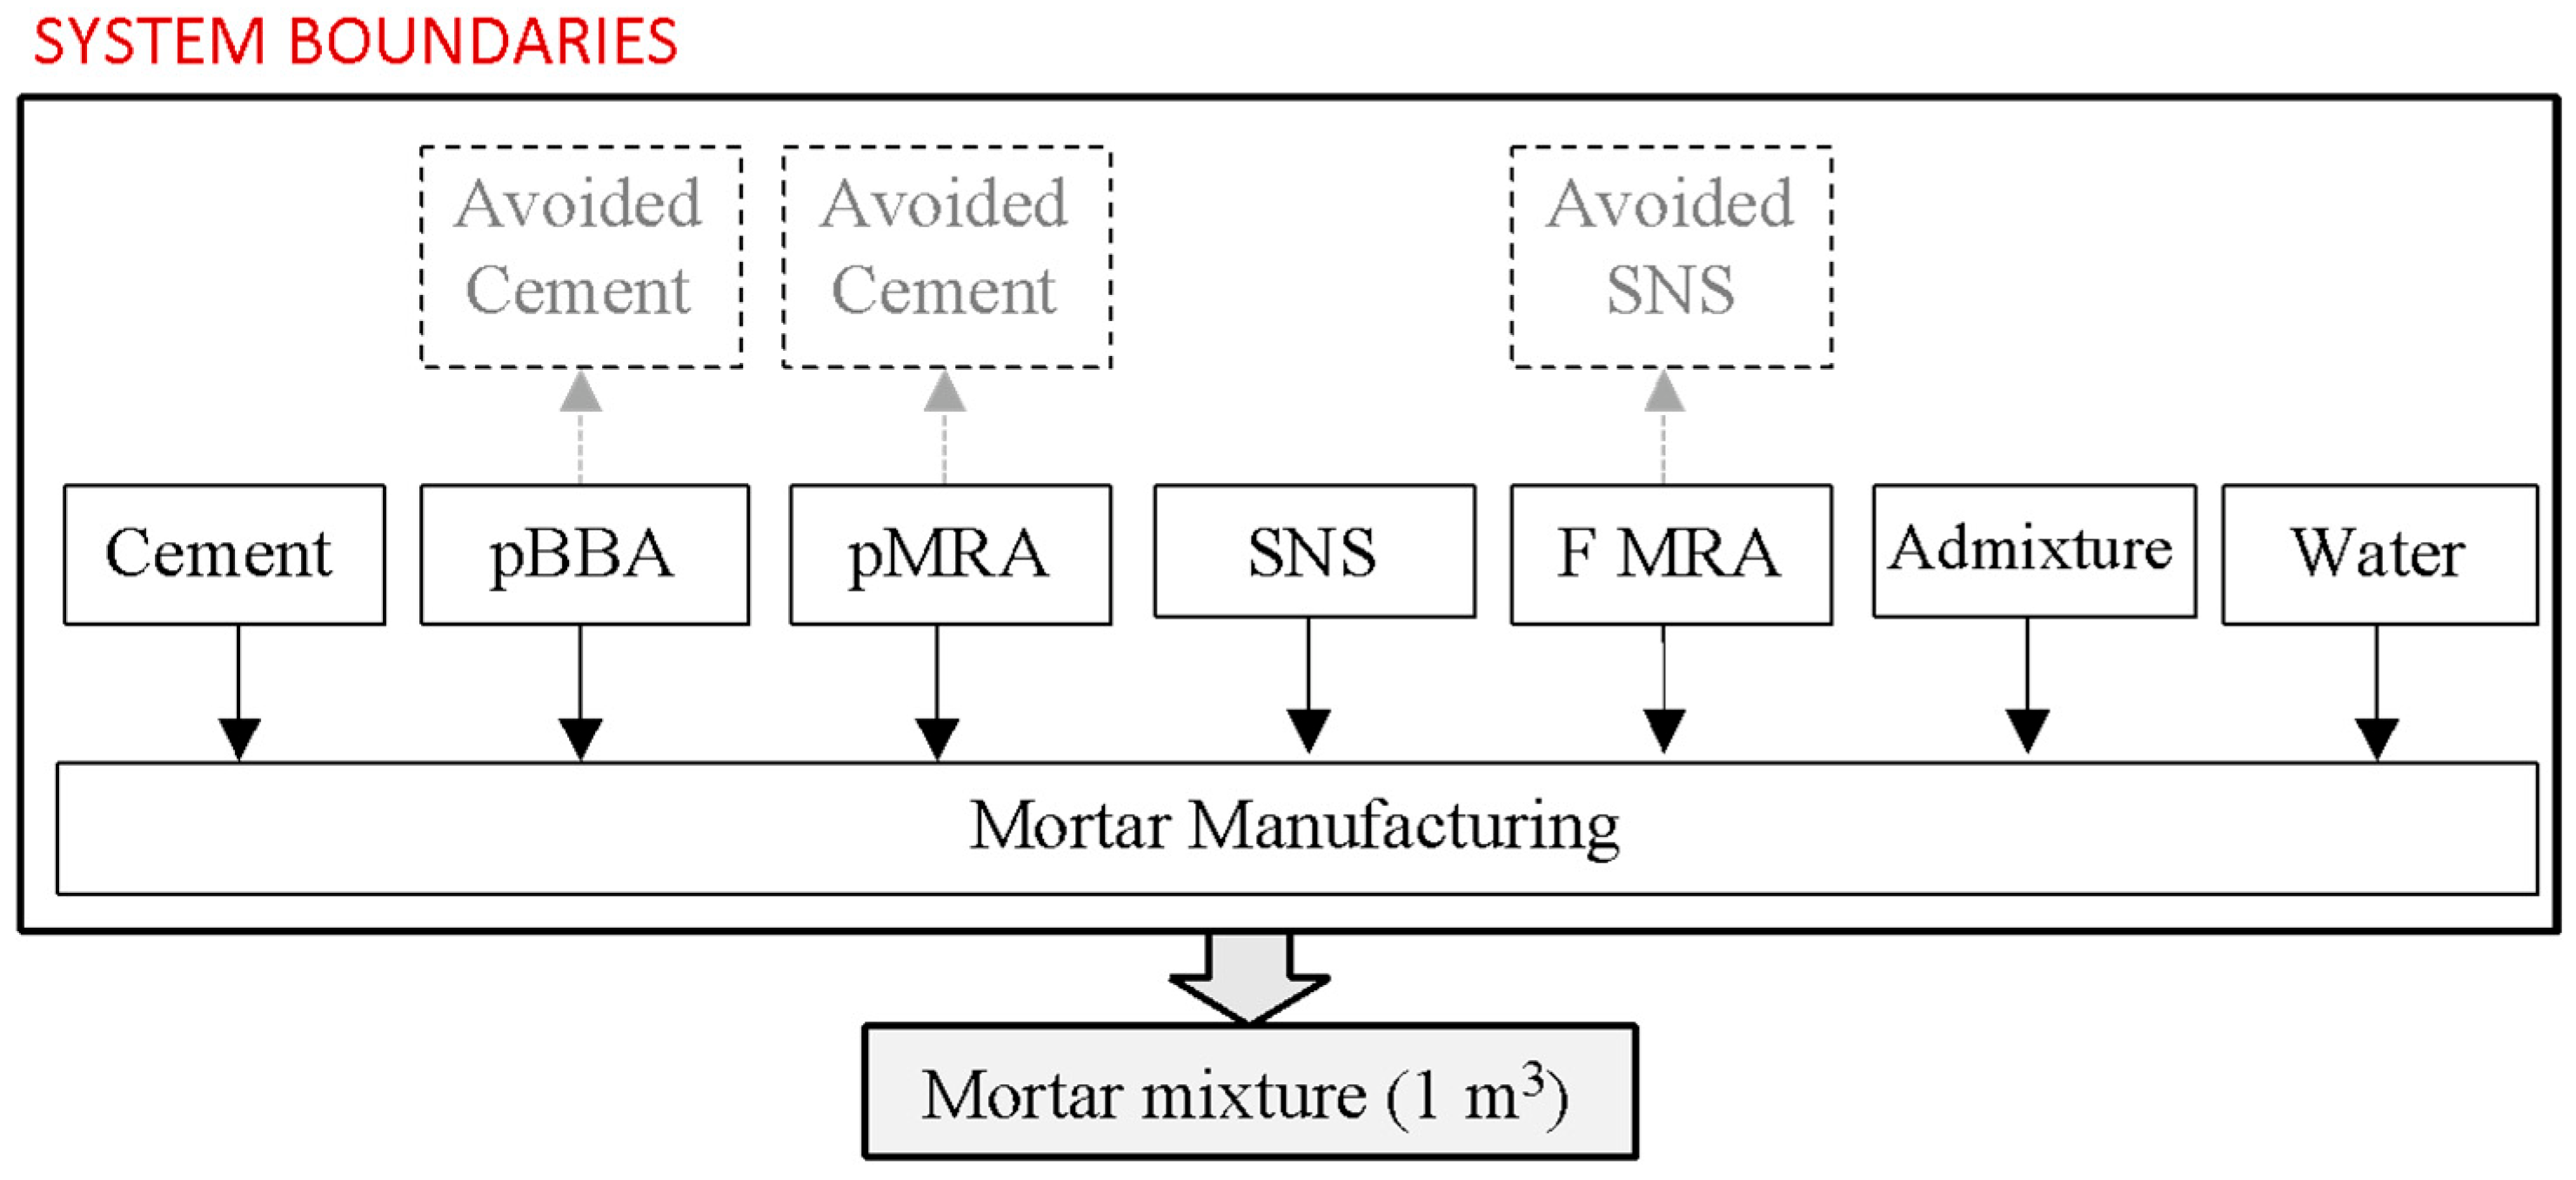
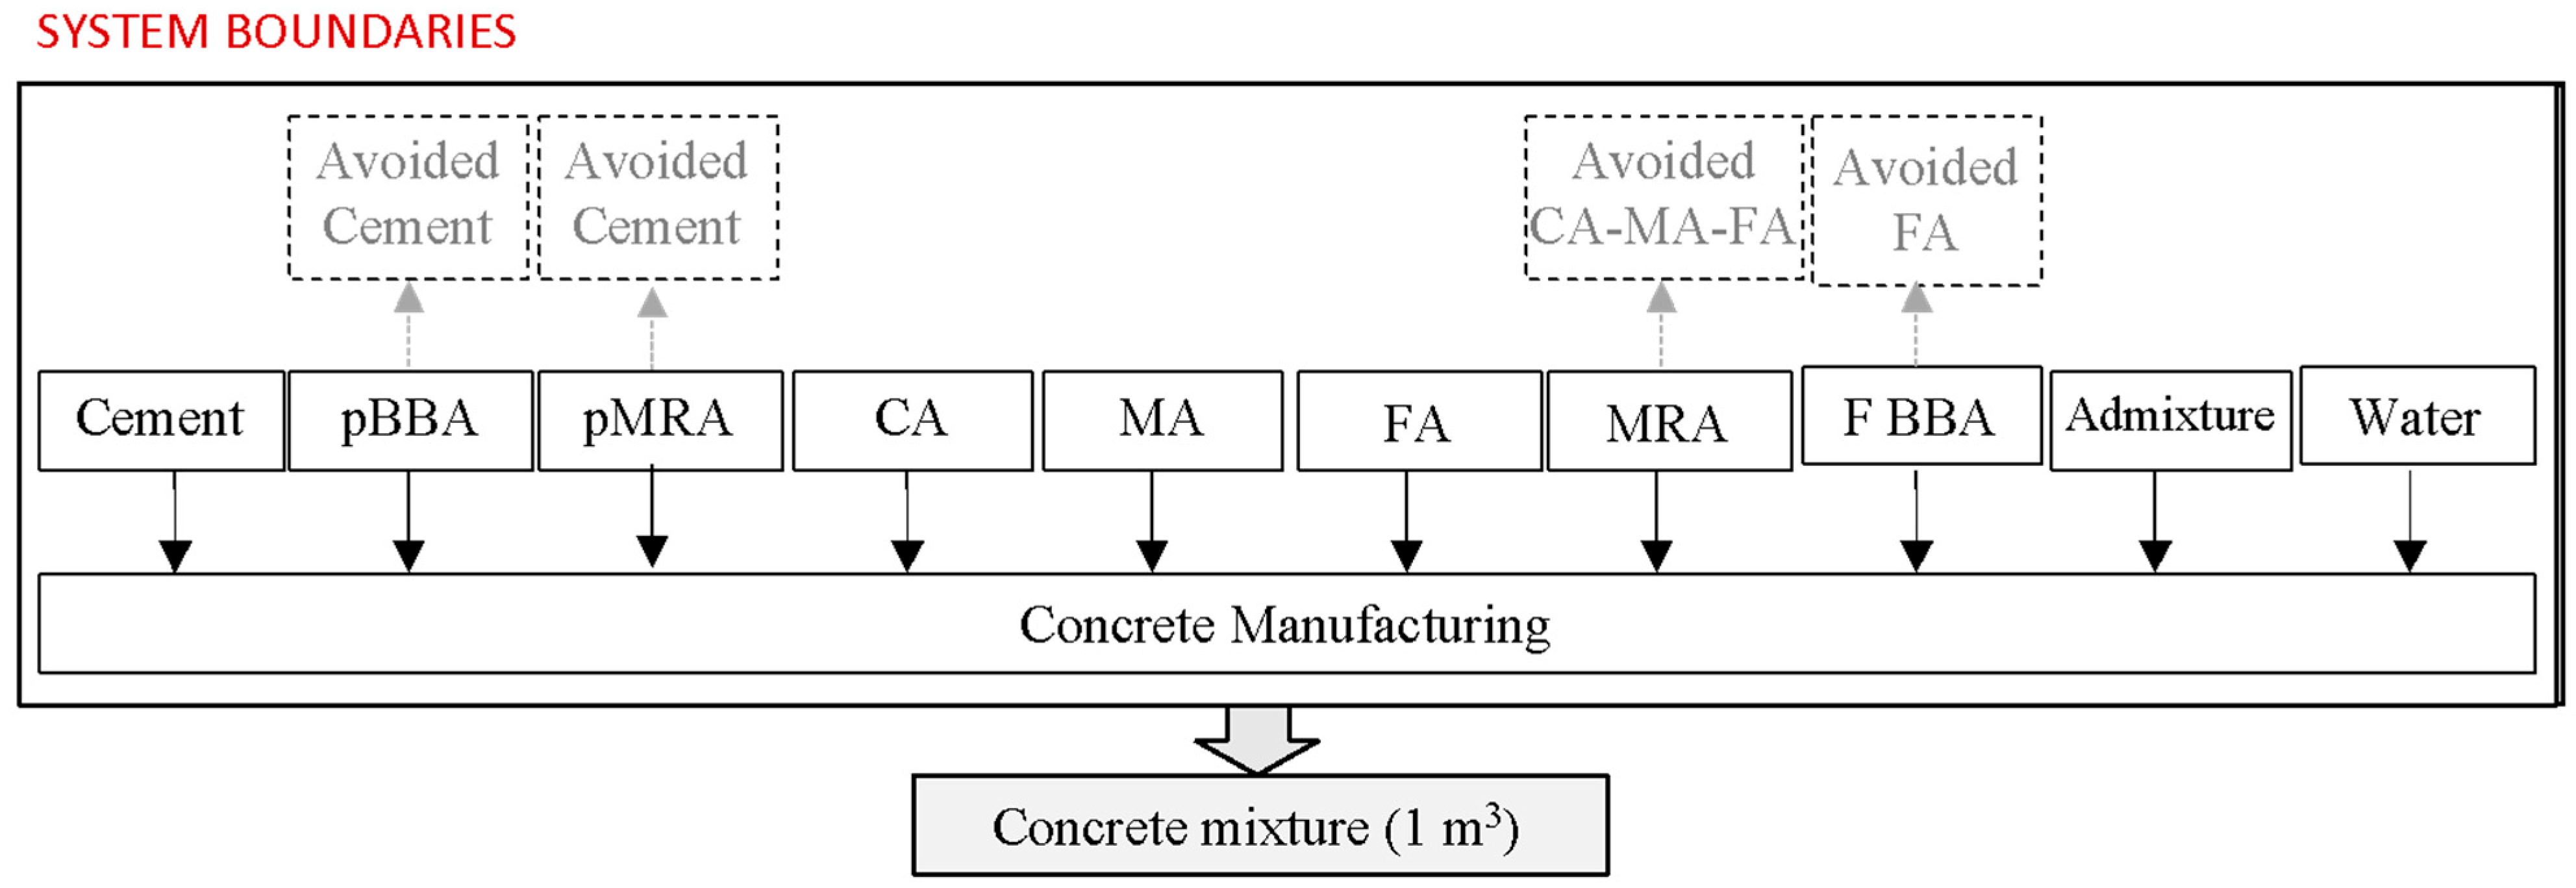
4.1.1. LCA—Objective, Scope, and System Boundaries
- The manufacture of the components of the mortar and concrete mixtures;
- The avoided production of cement, since the use of pBBA and pMRA as a replacement for cement avoids the production of cement;
- Avoided production of natural aggregates. In the manufacture of mortar mixtures, the substitution of SNS for fine MRA avoids the production of SNS. In the manufacture of concrete, the incorporation of MRA and BBA prevents the production of CA, MA, and FA;
- As the materials to be used were available at the place of manufacture of the mortar and concrete mixtures, transport distances were not considered;
- The equipment required for the manufacturing process of mortar and concrete mixtures;
4.1.2. Life-Cycle Inventory (LCI)
- Inventories on the natural aggregates (CA, MA, FA, and SNS) were determined, according to the production processes, by means of primary data and the Ecoinvent v.3.8 database [93]. These aggregates were produced by a dolomitic quarry. The material was extracted using a bulldozer with a ripper without blasting and, after several crushing and screening processes, several fractions were obtained, including CA, MA, FA, and SNS.
- Inventory for the BBA was developed following the drying, sieving, and/or crushing treatment to which they were subjected, through the collection of primary data and the Ecoinvent v.3.8 database [93]. The treatment began when the wet ash was collected from the ashtray by means of a loader and transported to an outside storage area for air drying. Once BBA dried, it was collected in a storage area. To obtain 0/4 mm BBA, original BBA was moved to a screening area. The BBA grinding process was carried out in a ball mill for half an hour until the required fineness for pBBA was reached.
- MRA was produced in a C&DW treatment plant from non-selectively collected construction waste. The material, mostly from demolished buildings, was subjected to different processes of crushing, iron removal, blowing, and screening until different fractions of MRA were obtained. As there were practically no rejects, 100% of C&DW was recycled. From 1t of RCD treated, 0.28t of MRA (0/22 mm), 0.112 t of fine MRA (0/2 mm), and 0.608 t of other fractions were obtained. To obtain pMRA, MRA (0/22 mm) was run in a ball mill for three hours. The inventory of these components was generated from the primary data related to equipment and machinery, and with the processes of the Ecoinvent v.3.8 database [93];
- For the inventory of cement, water, and admixture, the processes of the Ecoinvent v.3.8 database [93] were used;
- For the mortar and concrete manufacturing process, “Concrete, high exacting requirement (CH), concrete production, Cut off, U” was used.
4.1.3. Impact Assessment Methodology
4.2. LCA Results and Discussion
4.2.1. LCA of Component Materials
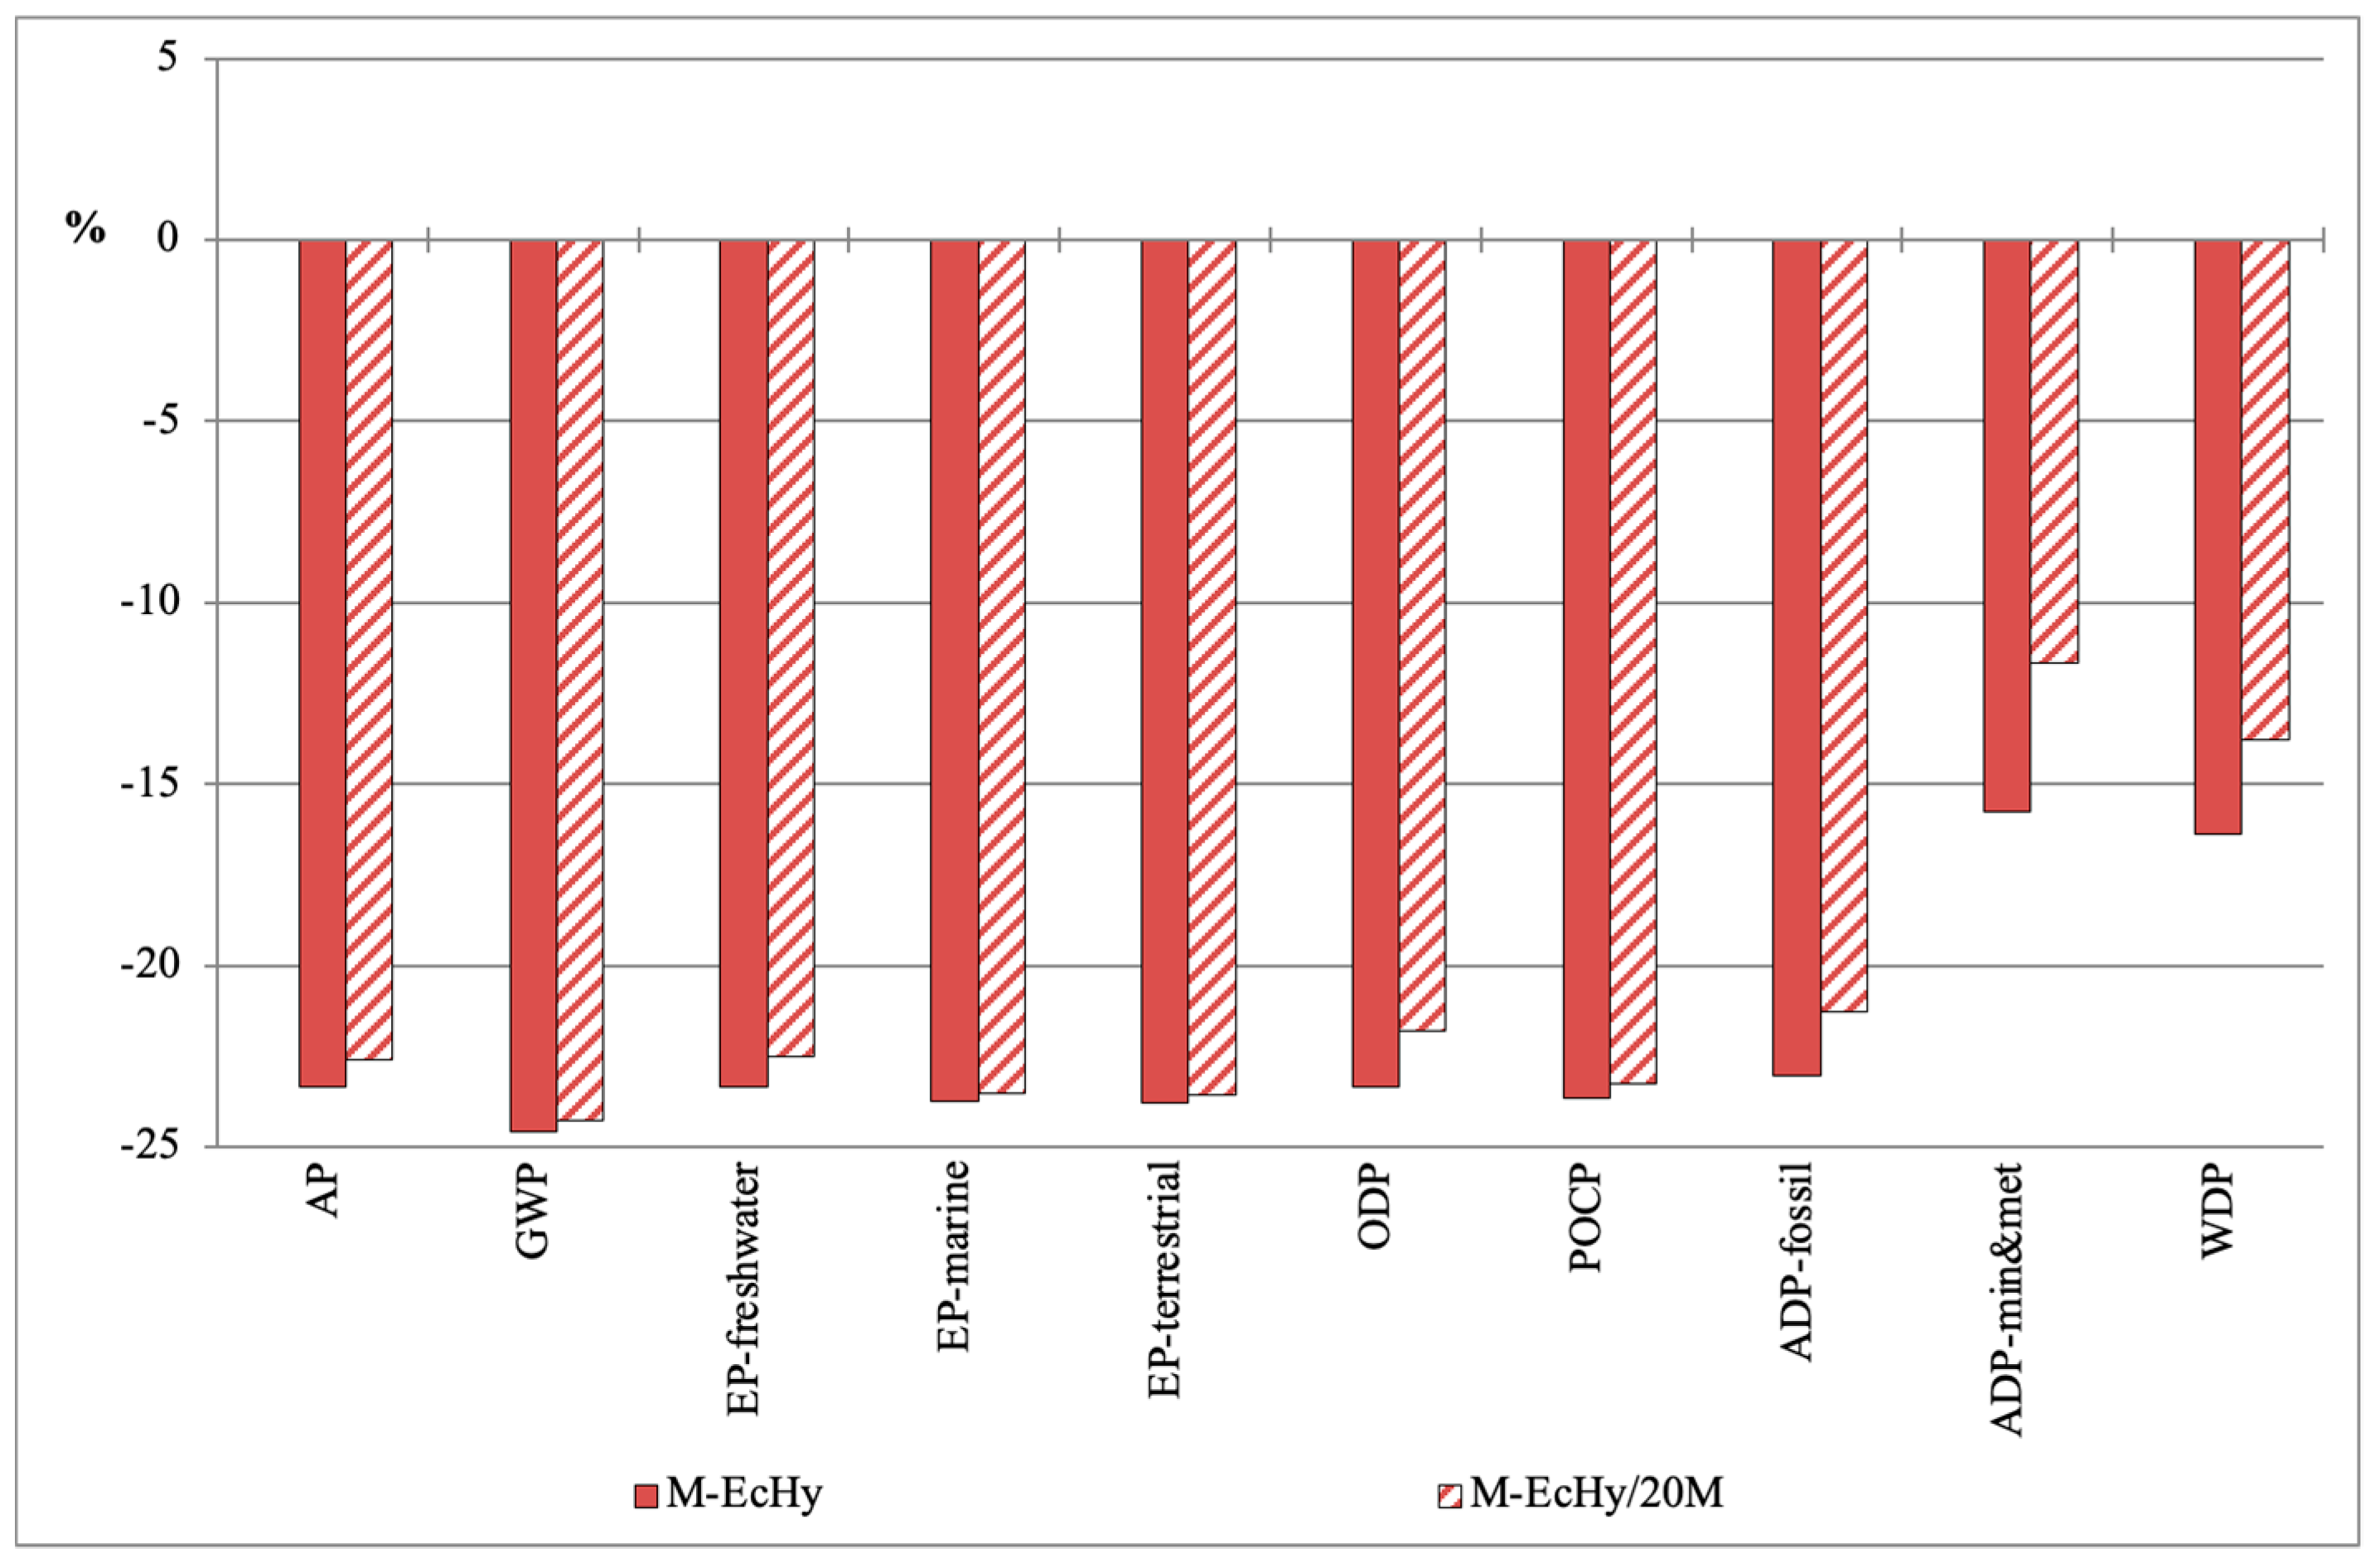
4.2.2. LCA of Cement Mortar Mixtures
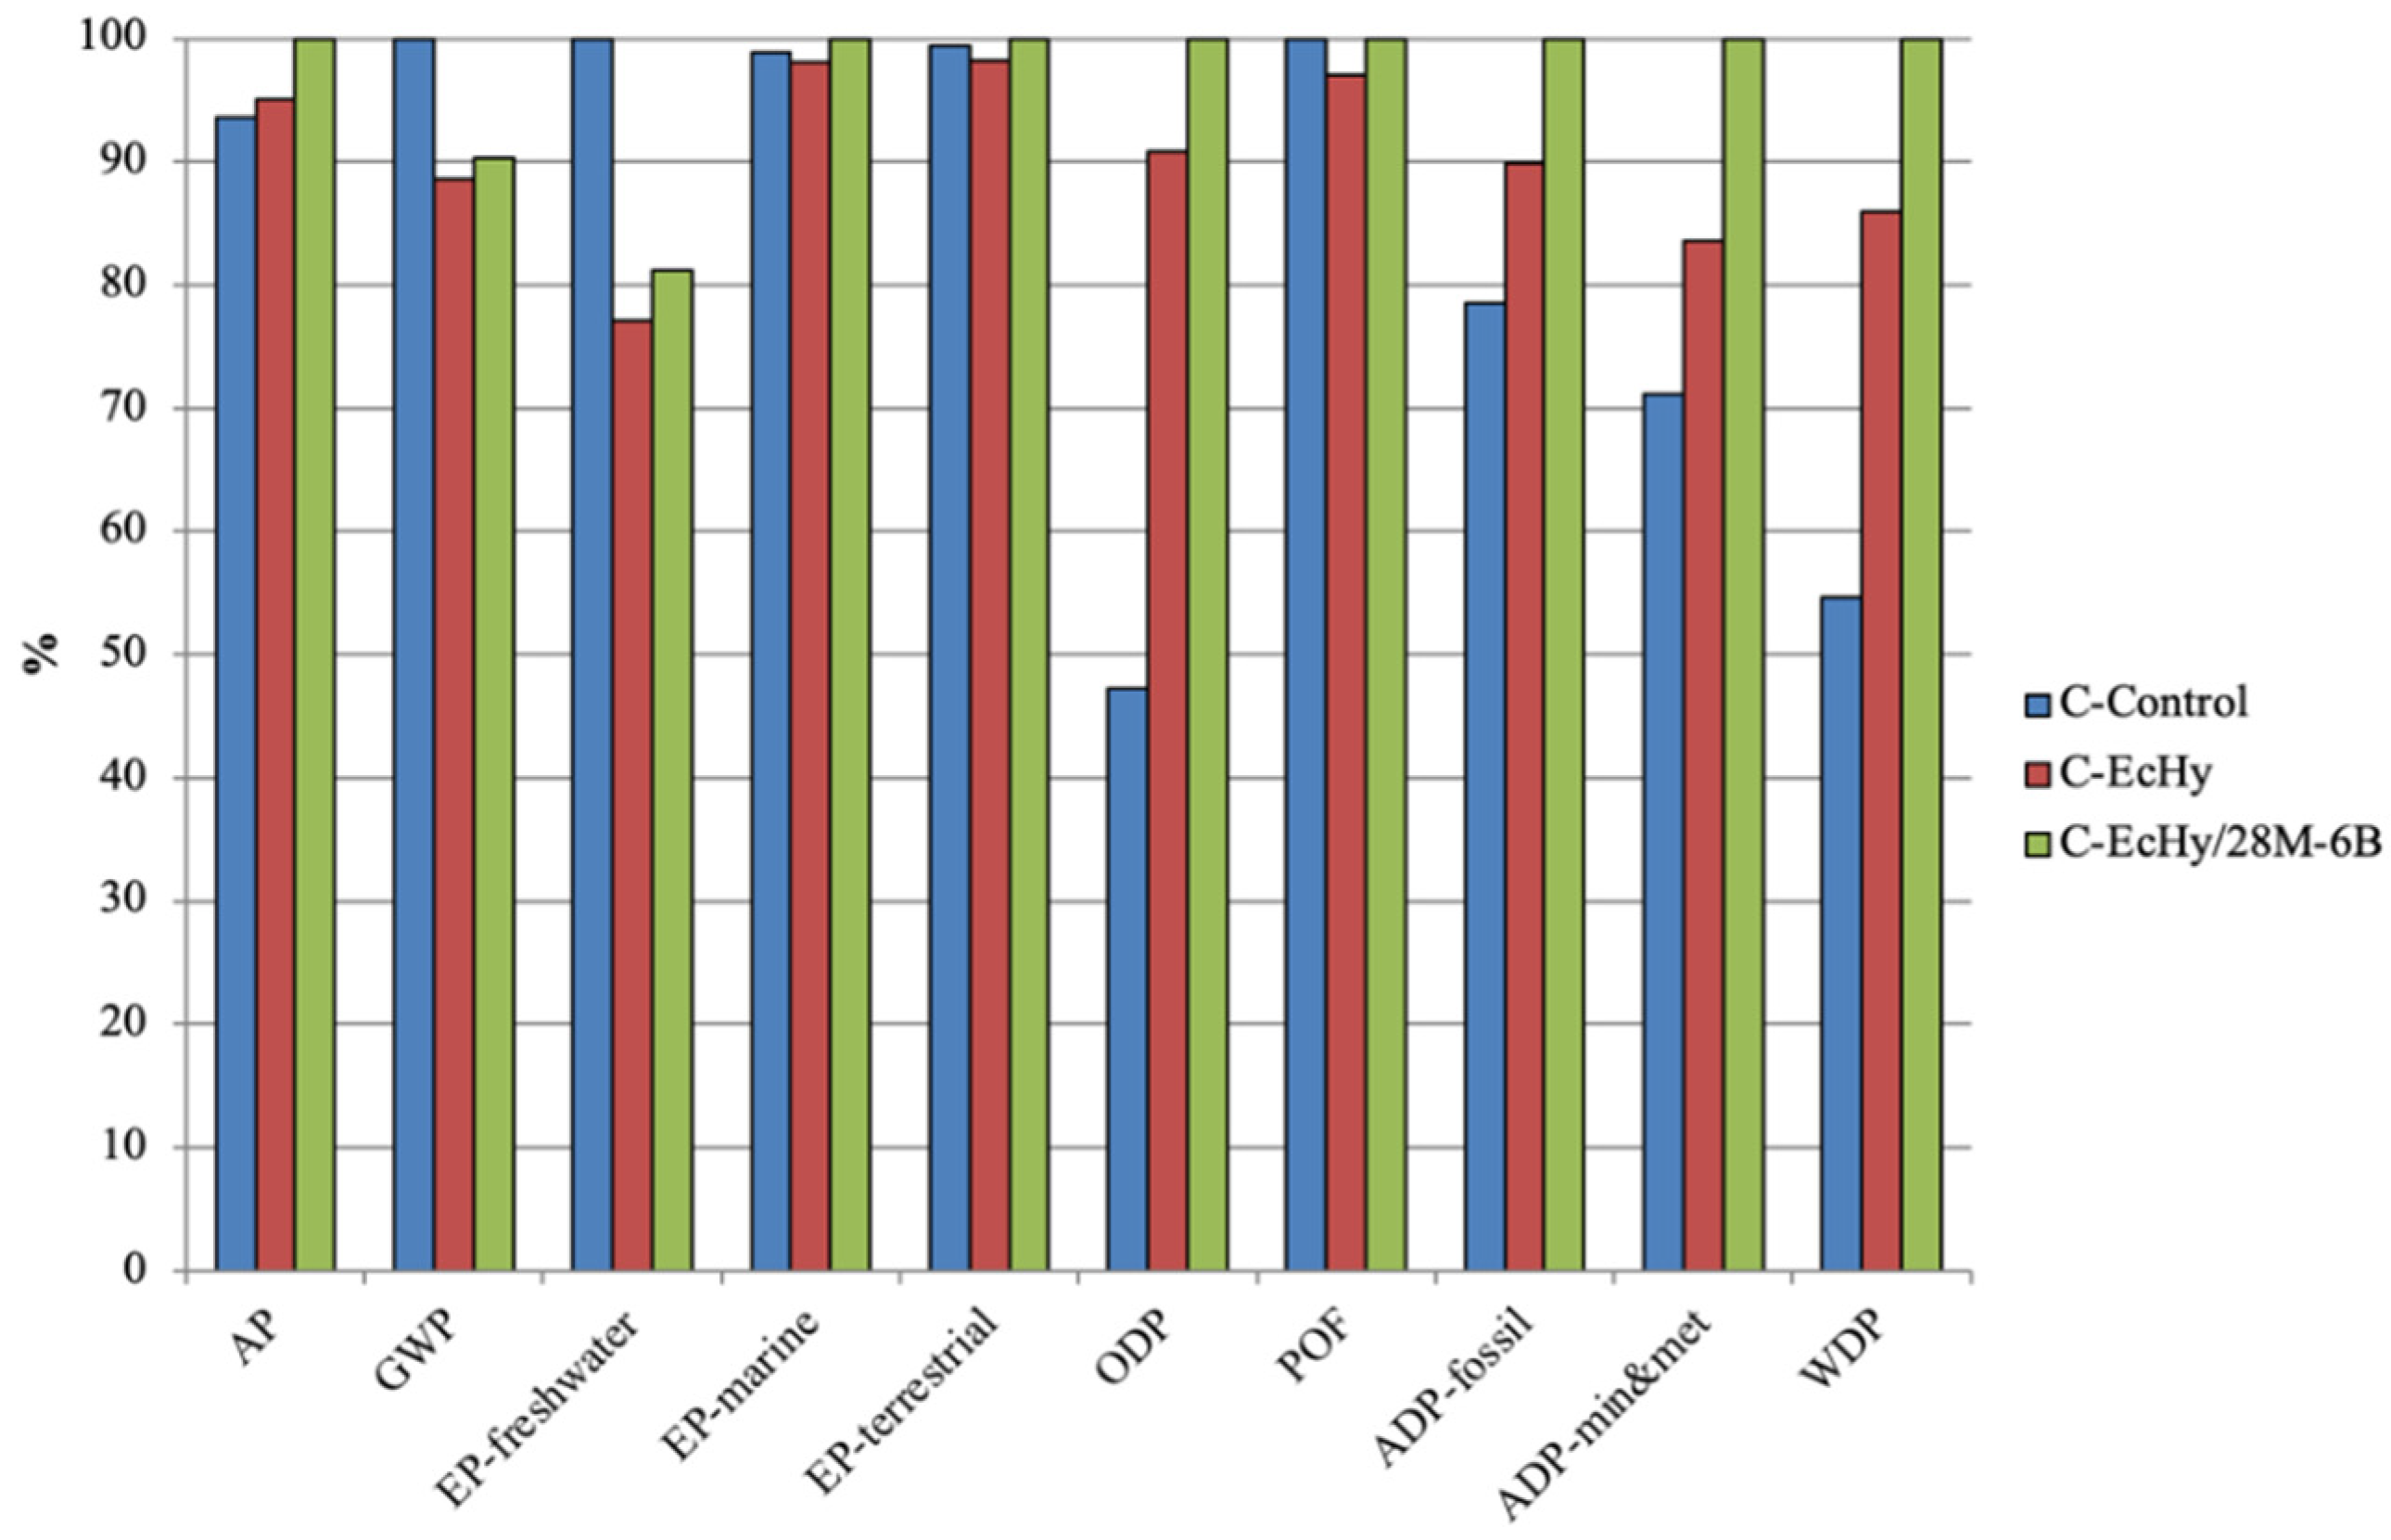
4.2.3. LCA of Concrete Mixtures
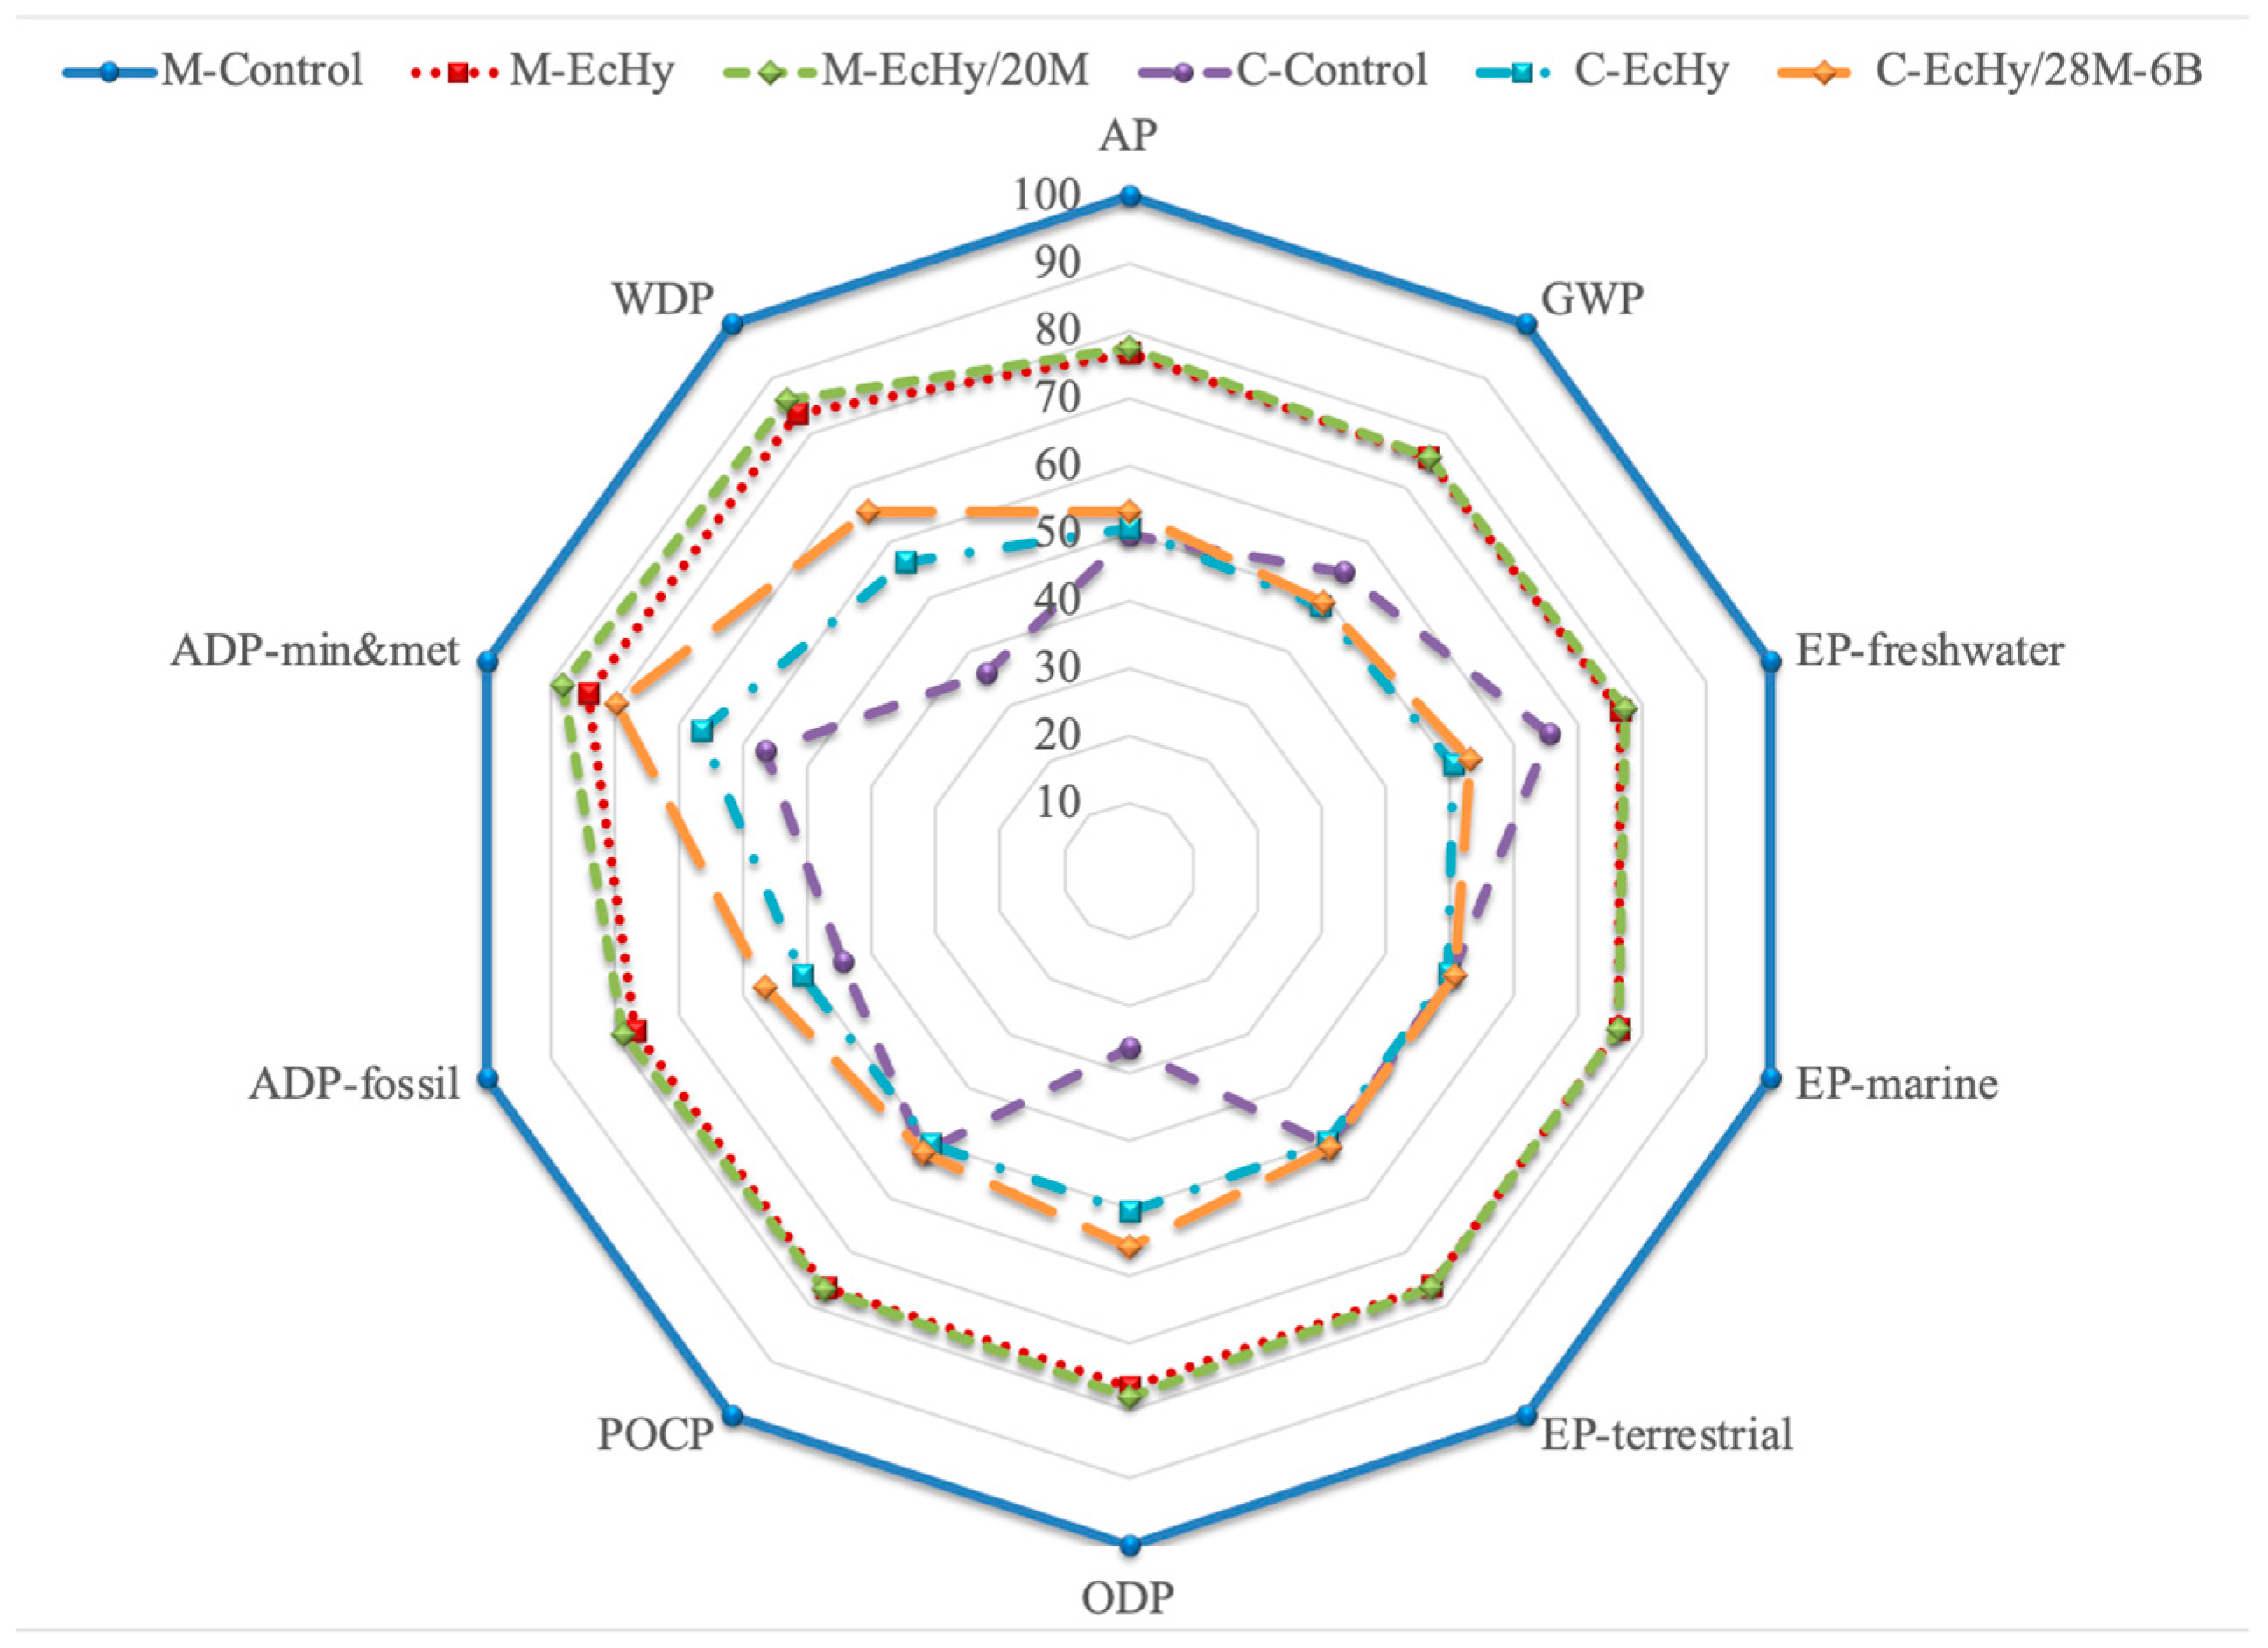
4.2.4. LCA of Cement Mortar Mixtures vs. Concrete Mixtures
5. Environmental and Materials Costs: Methodology and Results
5.1. Environmental and Materials Costs Methodologies
5.1.1. EMC—Objective, Scope, and System Boundaries
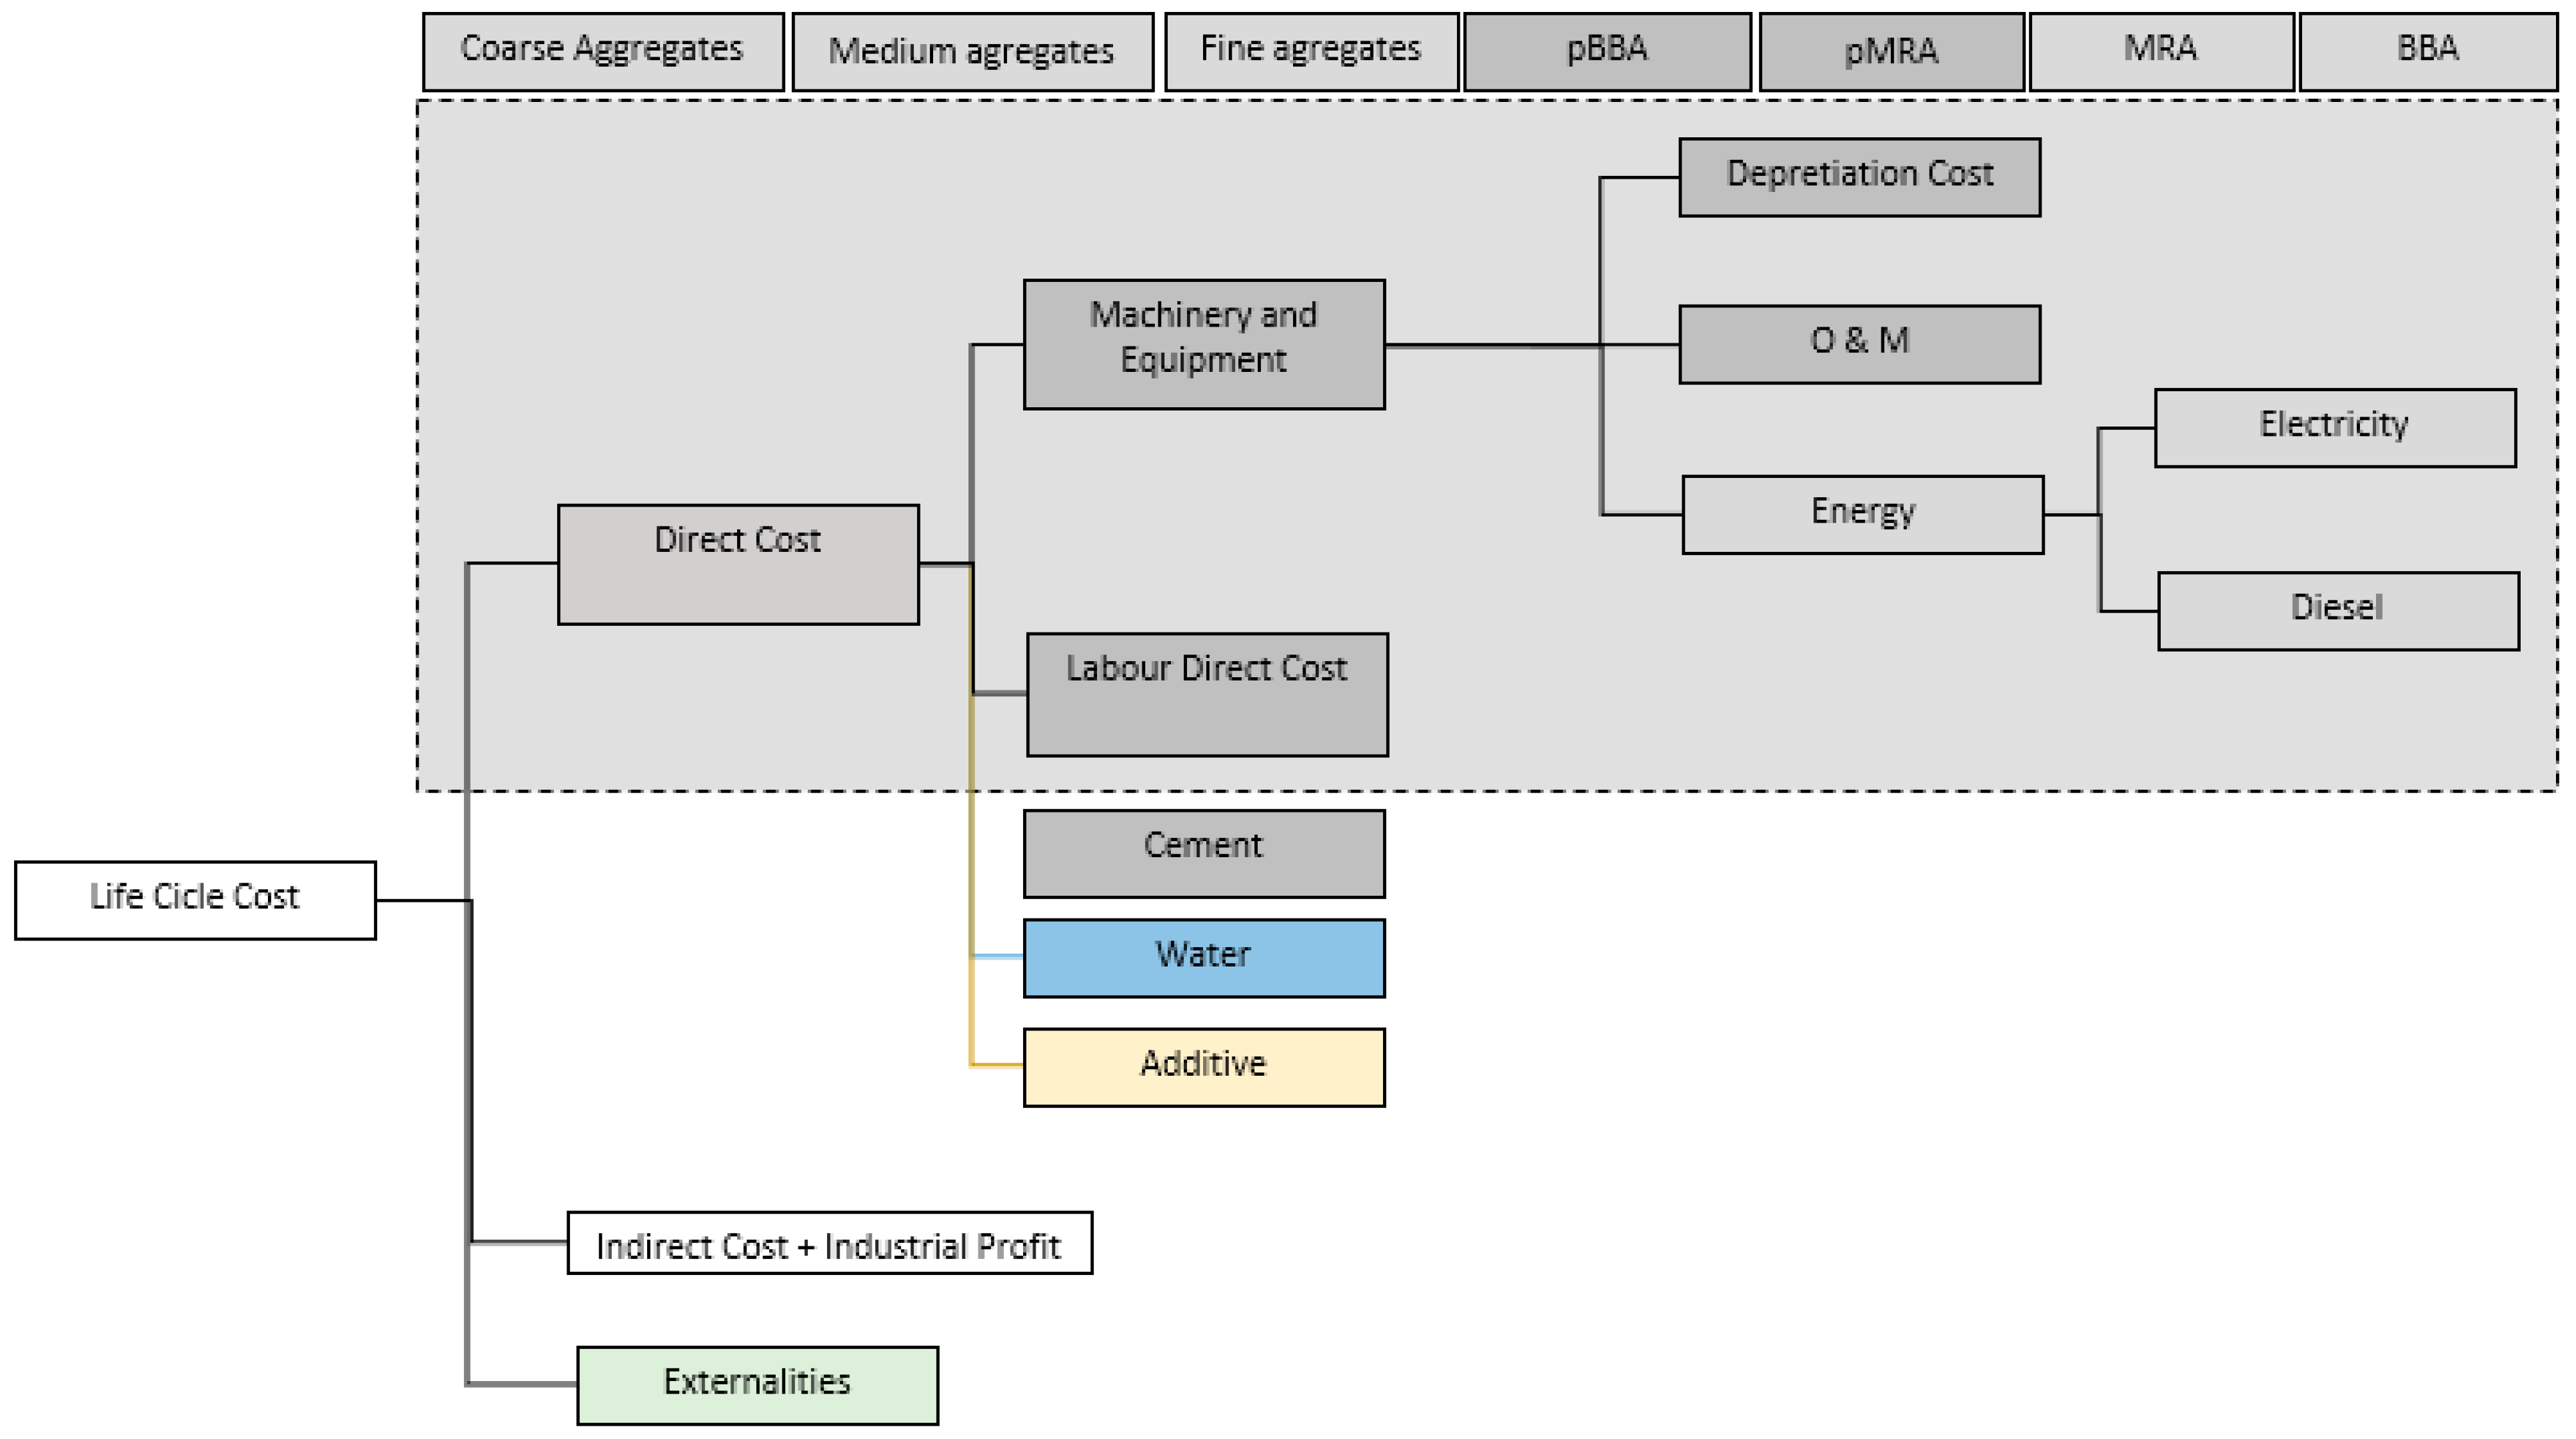
5.1.2. Environmental and Materials Costs Inventory (EMCI)
- Direct costs.
- (a)
- Energy costs. Electricity (0.24 €/kWh). Diesel (1.34 €/l). The consumption of these inputs was calculated from the data of the production processes (Stage A1) that were previously defined. The values were obtained from SIMAPRO using the Ecoinvent database [93]. In order to comply with the data-quality requirements related to technical, geographical, and technological representativeness, the Ecoinvent processes were modified according to the data provided by the producers (see Section 4.1.2).
- (b)
- Calculation of the amortisation costs of the machinery. The calculation of the performance of the machinery (h/t) was obtained from the estimation of the time necessary to carry out a work cycle, taking into account the capacity of the machine and the different speeds of the activities carried out in the cycle. As an example, in the case of Handling by Shovel Loader, the loading time of the shovel bucket, the hauling distance with a load, and the unloaded return of the shovel were considered. In this case, a loader yield of 0.00125 h/t was obtained for a hauling distance of 130 m, which was the case of the gravel, sand, and cement manufacturing plant (located in Cordoba). This process was carried out to calculate the work cycles of the machinery necessary to manufacture each of the materials that were analysed.
- (c)
- Operation and maintenance (O&M) of machinery and equipment. For the calculation of the operation and maintenance costs, a useful life of the machinery of 10,000 h was considered. The depreciation cost was obtained by dividing the purchase price of the machinery by its useful life. O&M costs were 85% of amortisation costs and include, among others, tyres, overhauls, maintenance, and lubricant.
- Indirect costs. Indirect costs were calculated as a percentage of direct costs. They include general expenses and industrial profit excluding transportation (Stage A2). From the results of the DELPHI methodology carried out with experts, a percentage of 40% of the direct costs was considered.
5.2. EMC Results and Discussion
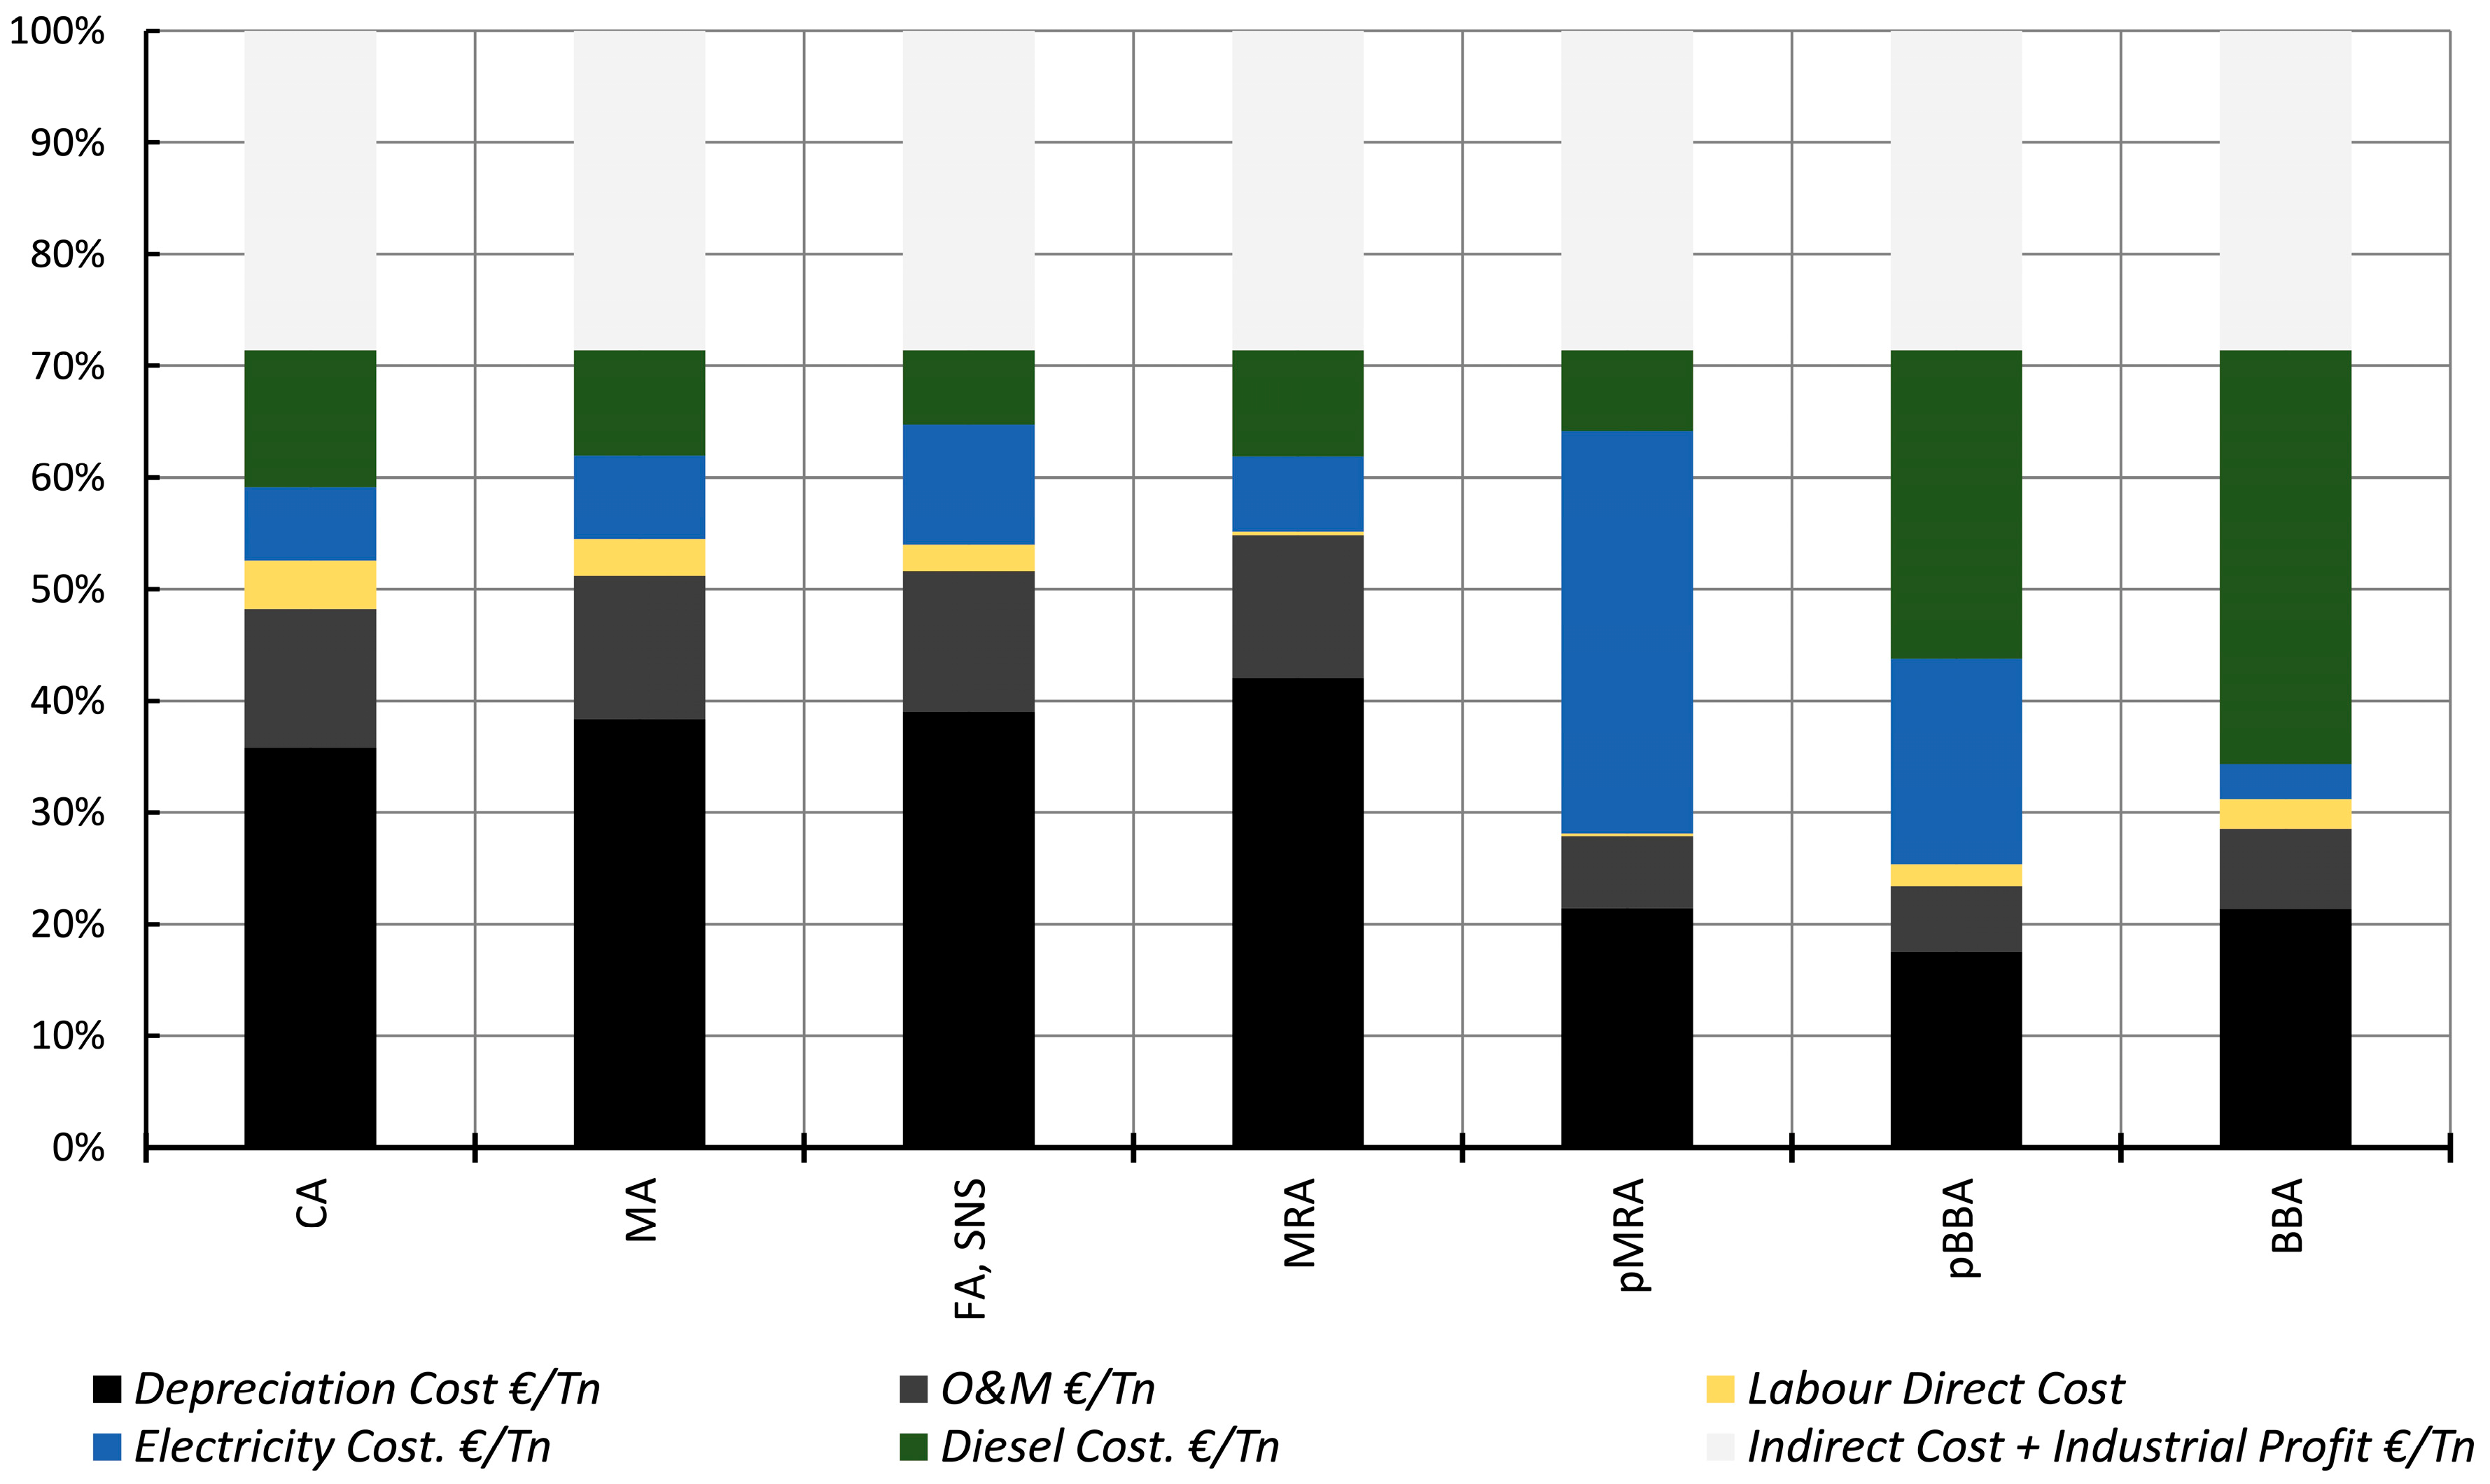
5.2.1. EMC Results and Discussions of the Component Materials
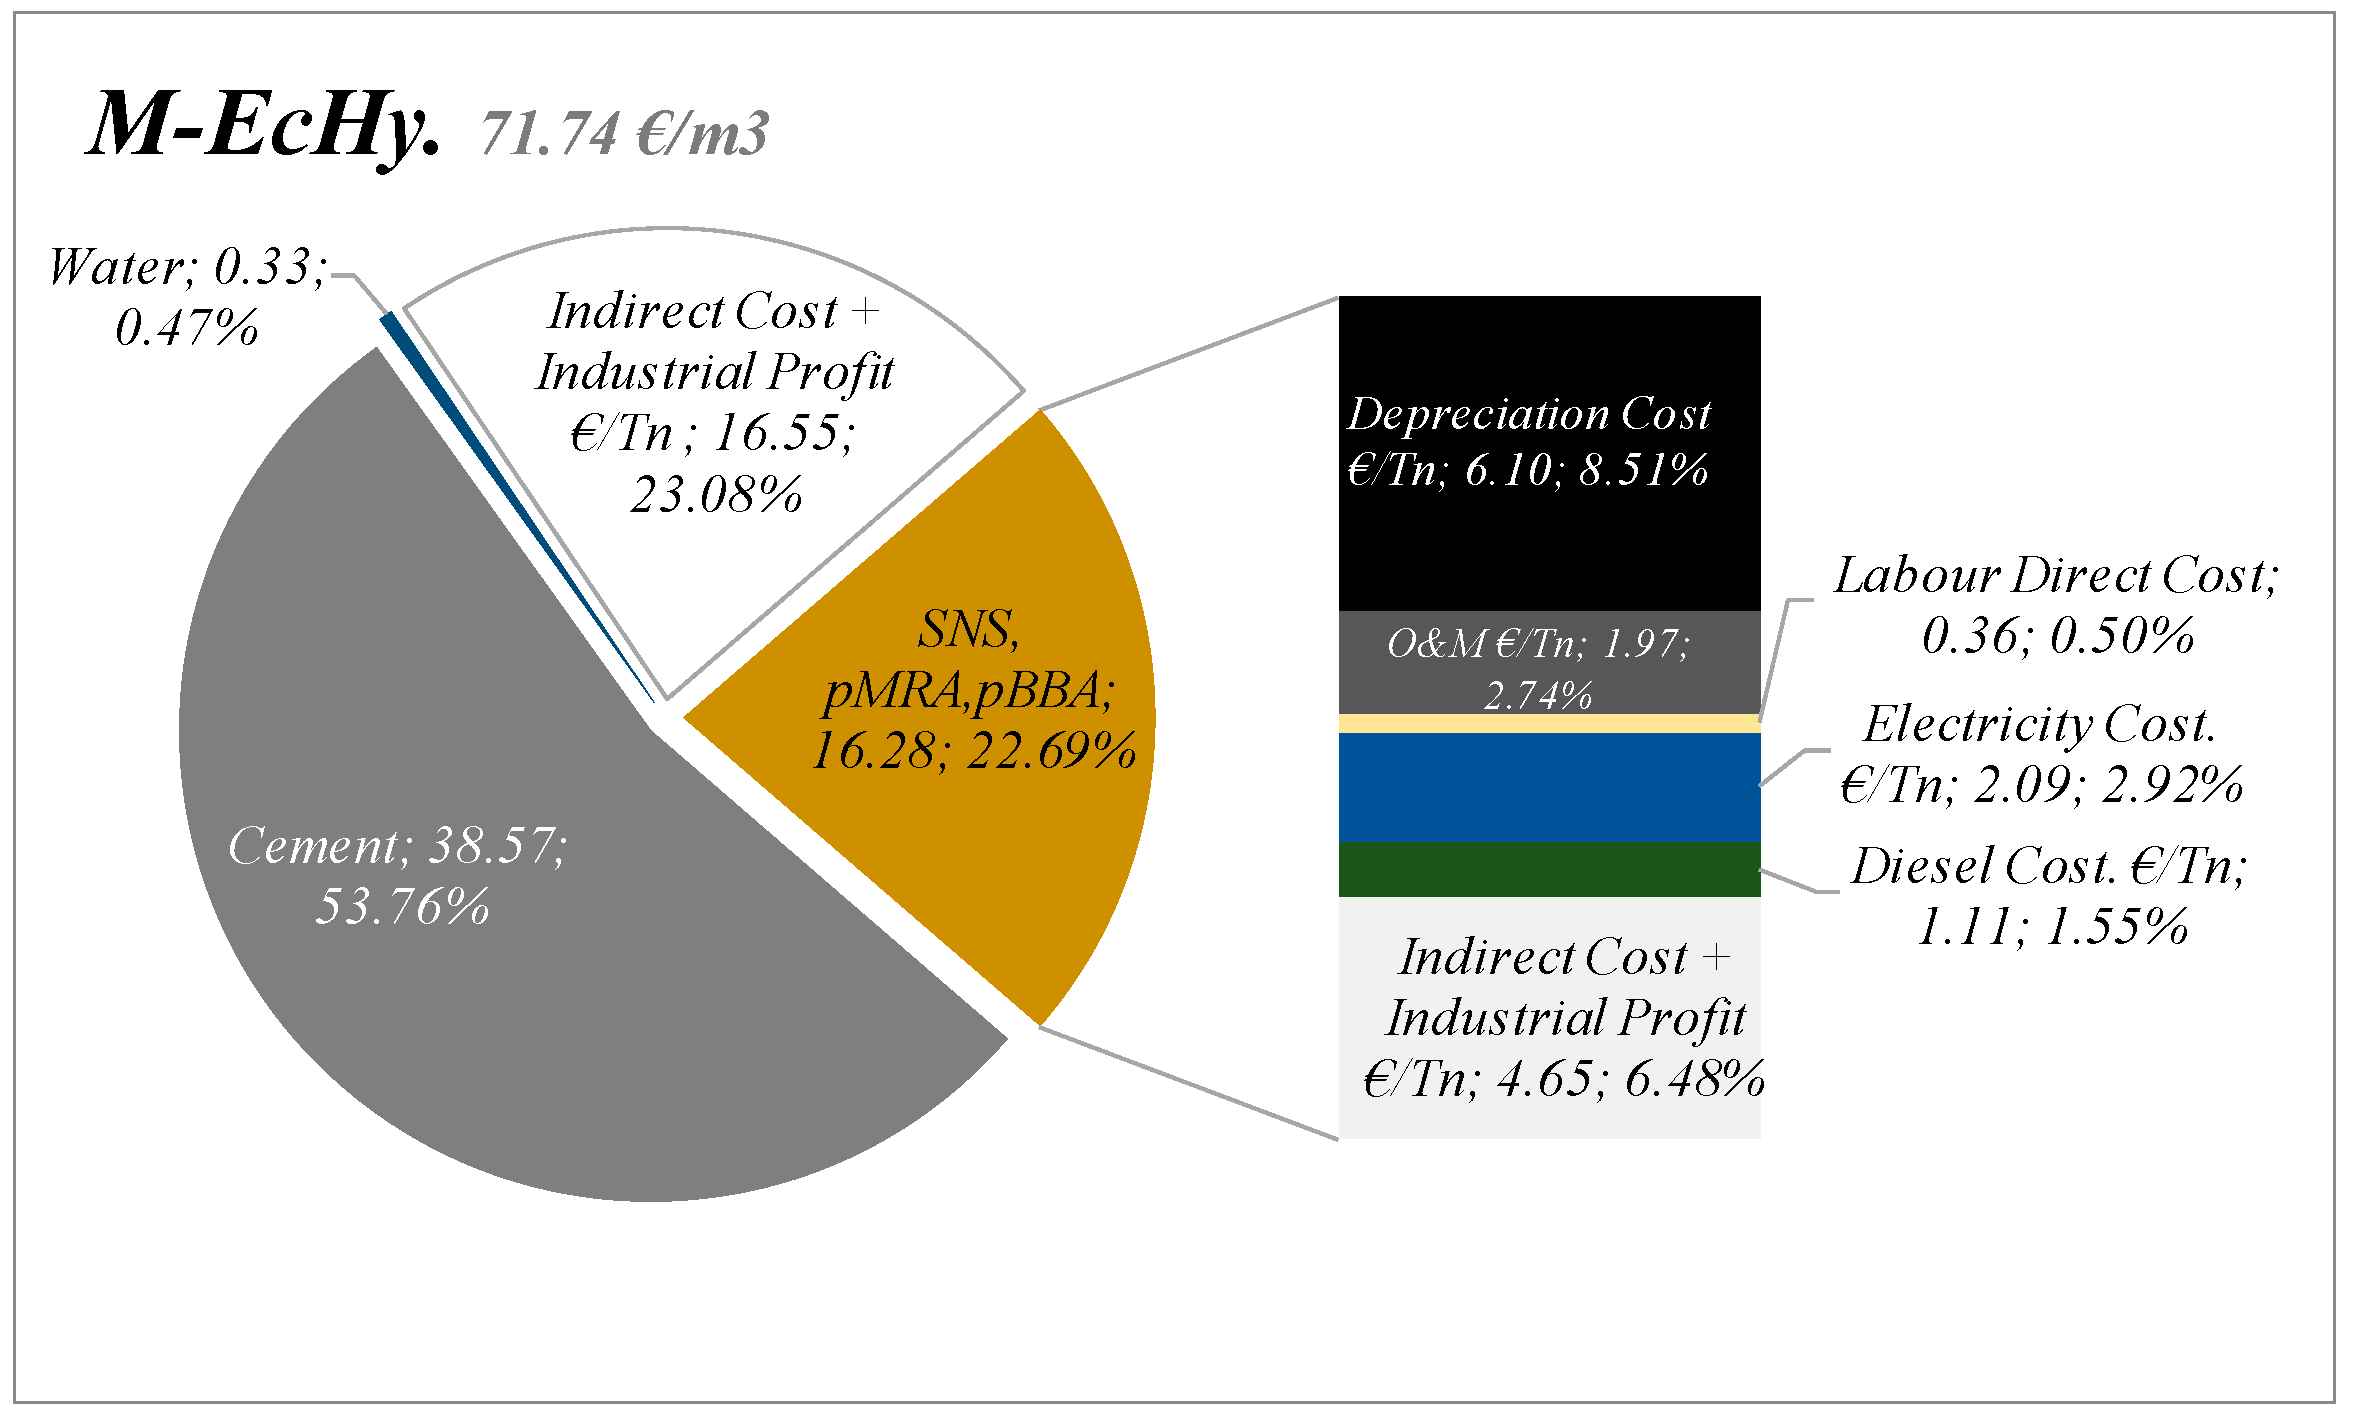
5.2.2. EMC Results and Discussions: Cement Mortar Mixtures
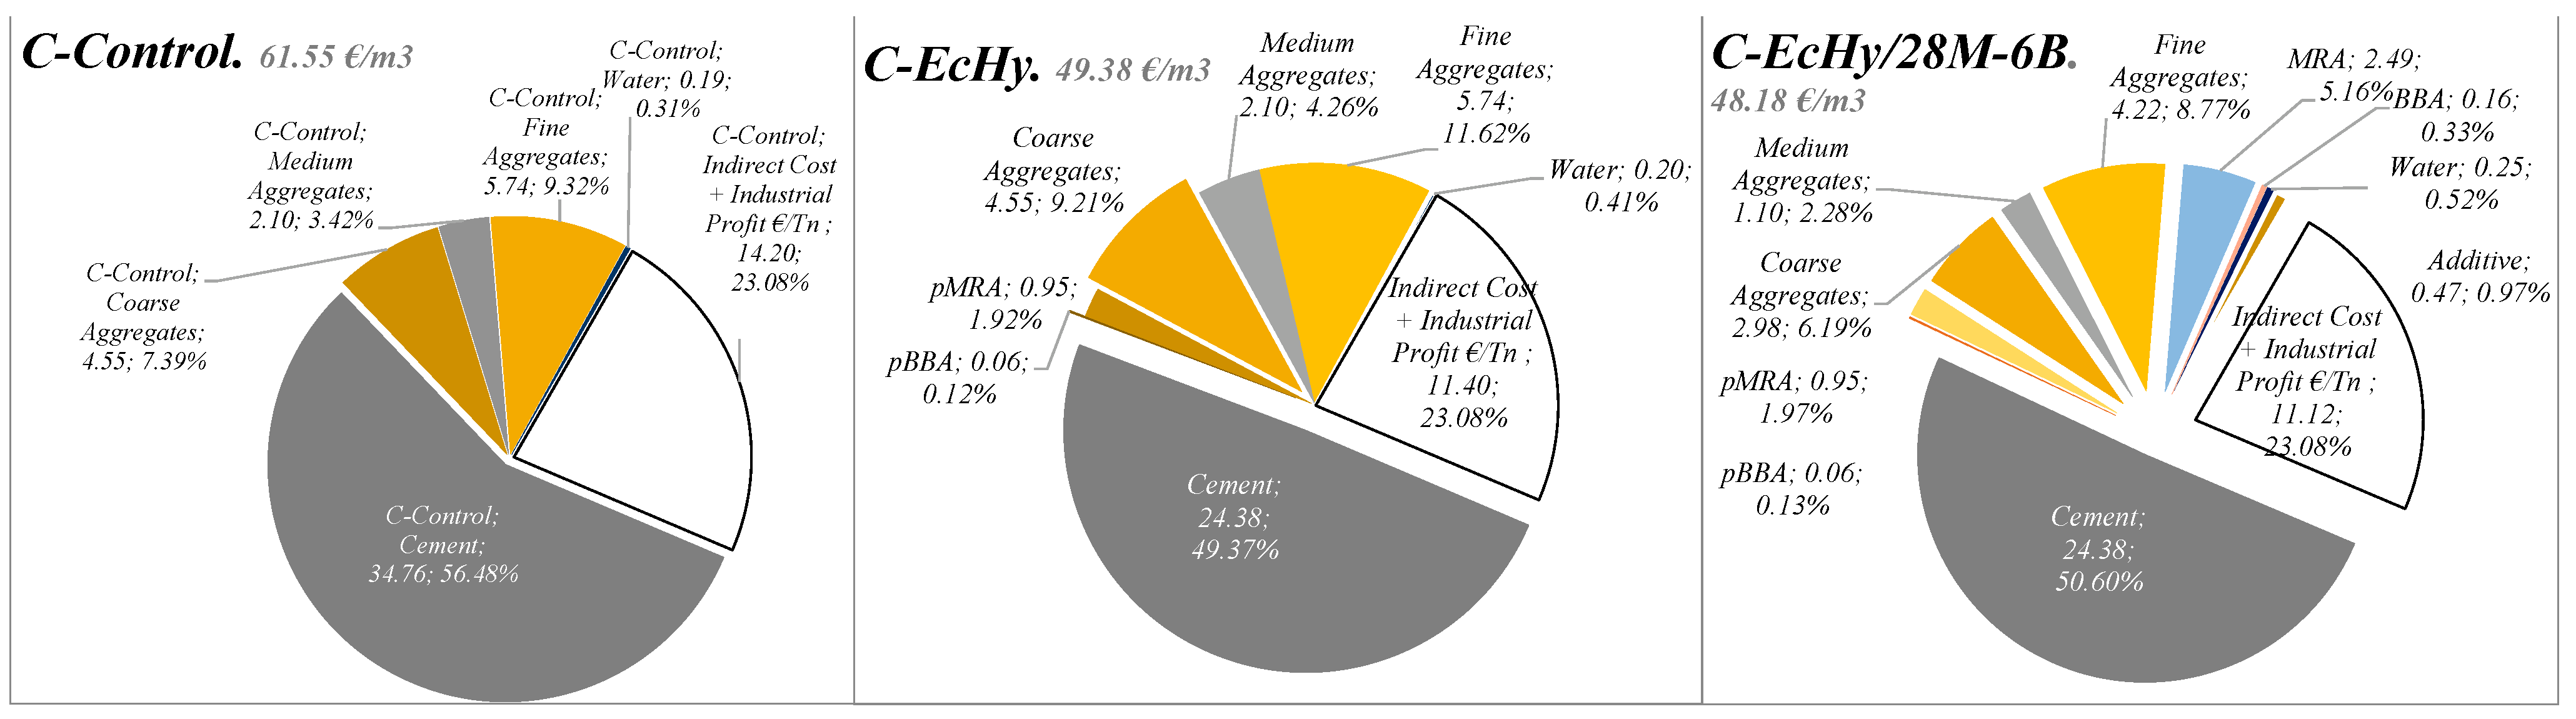
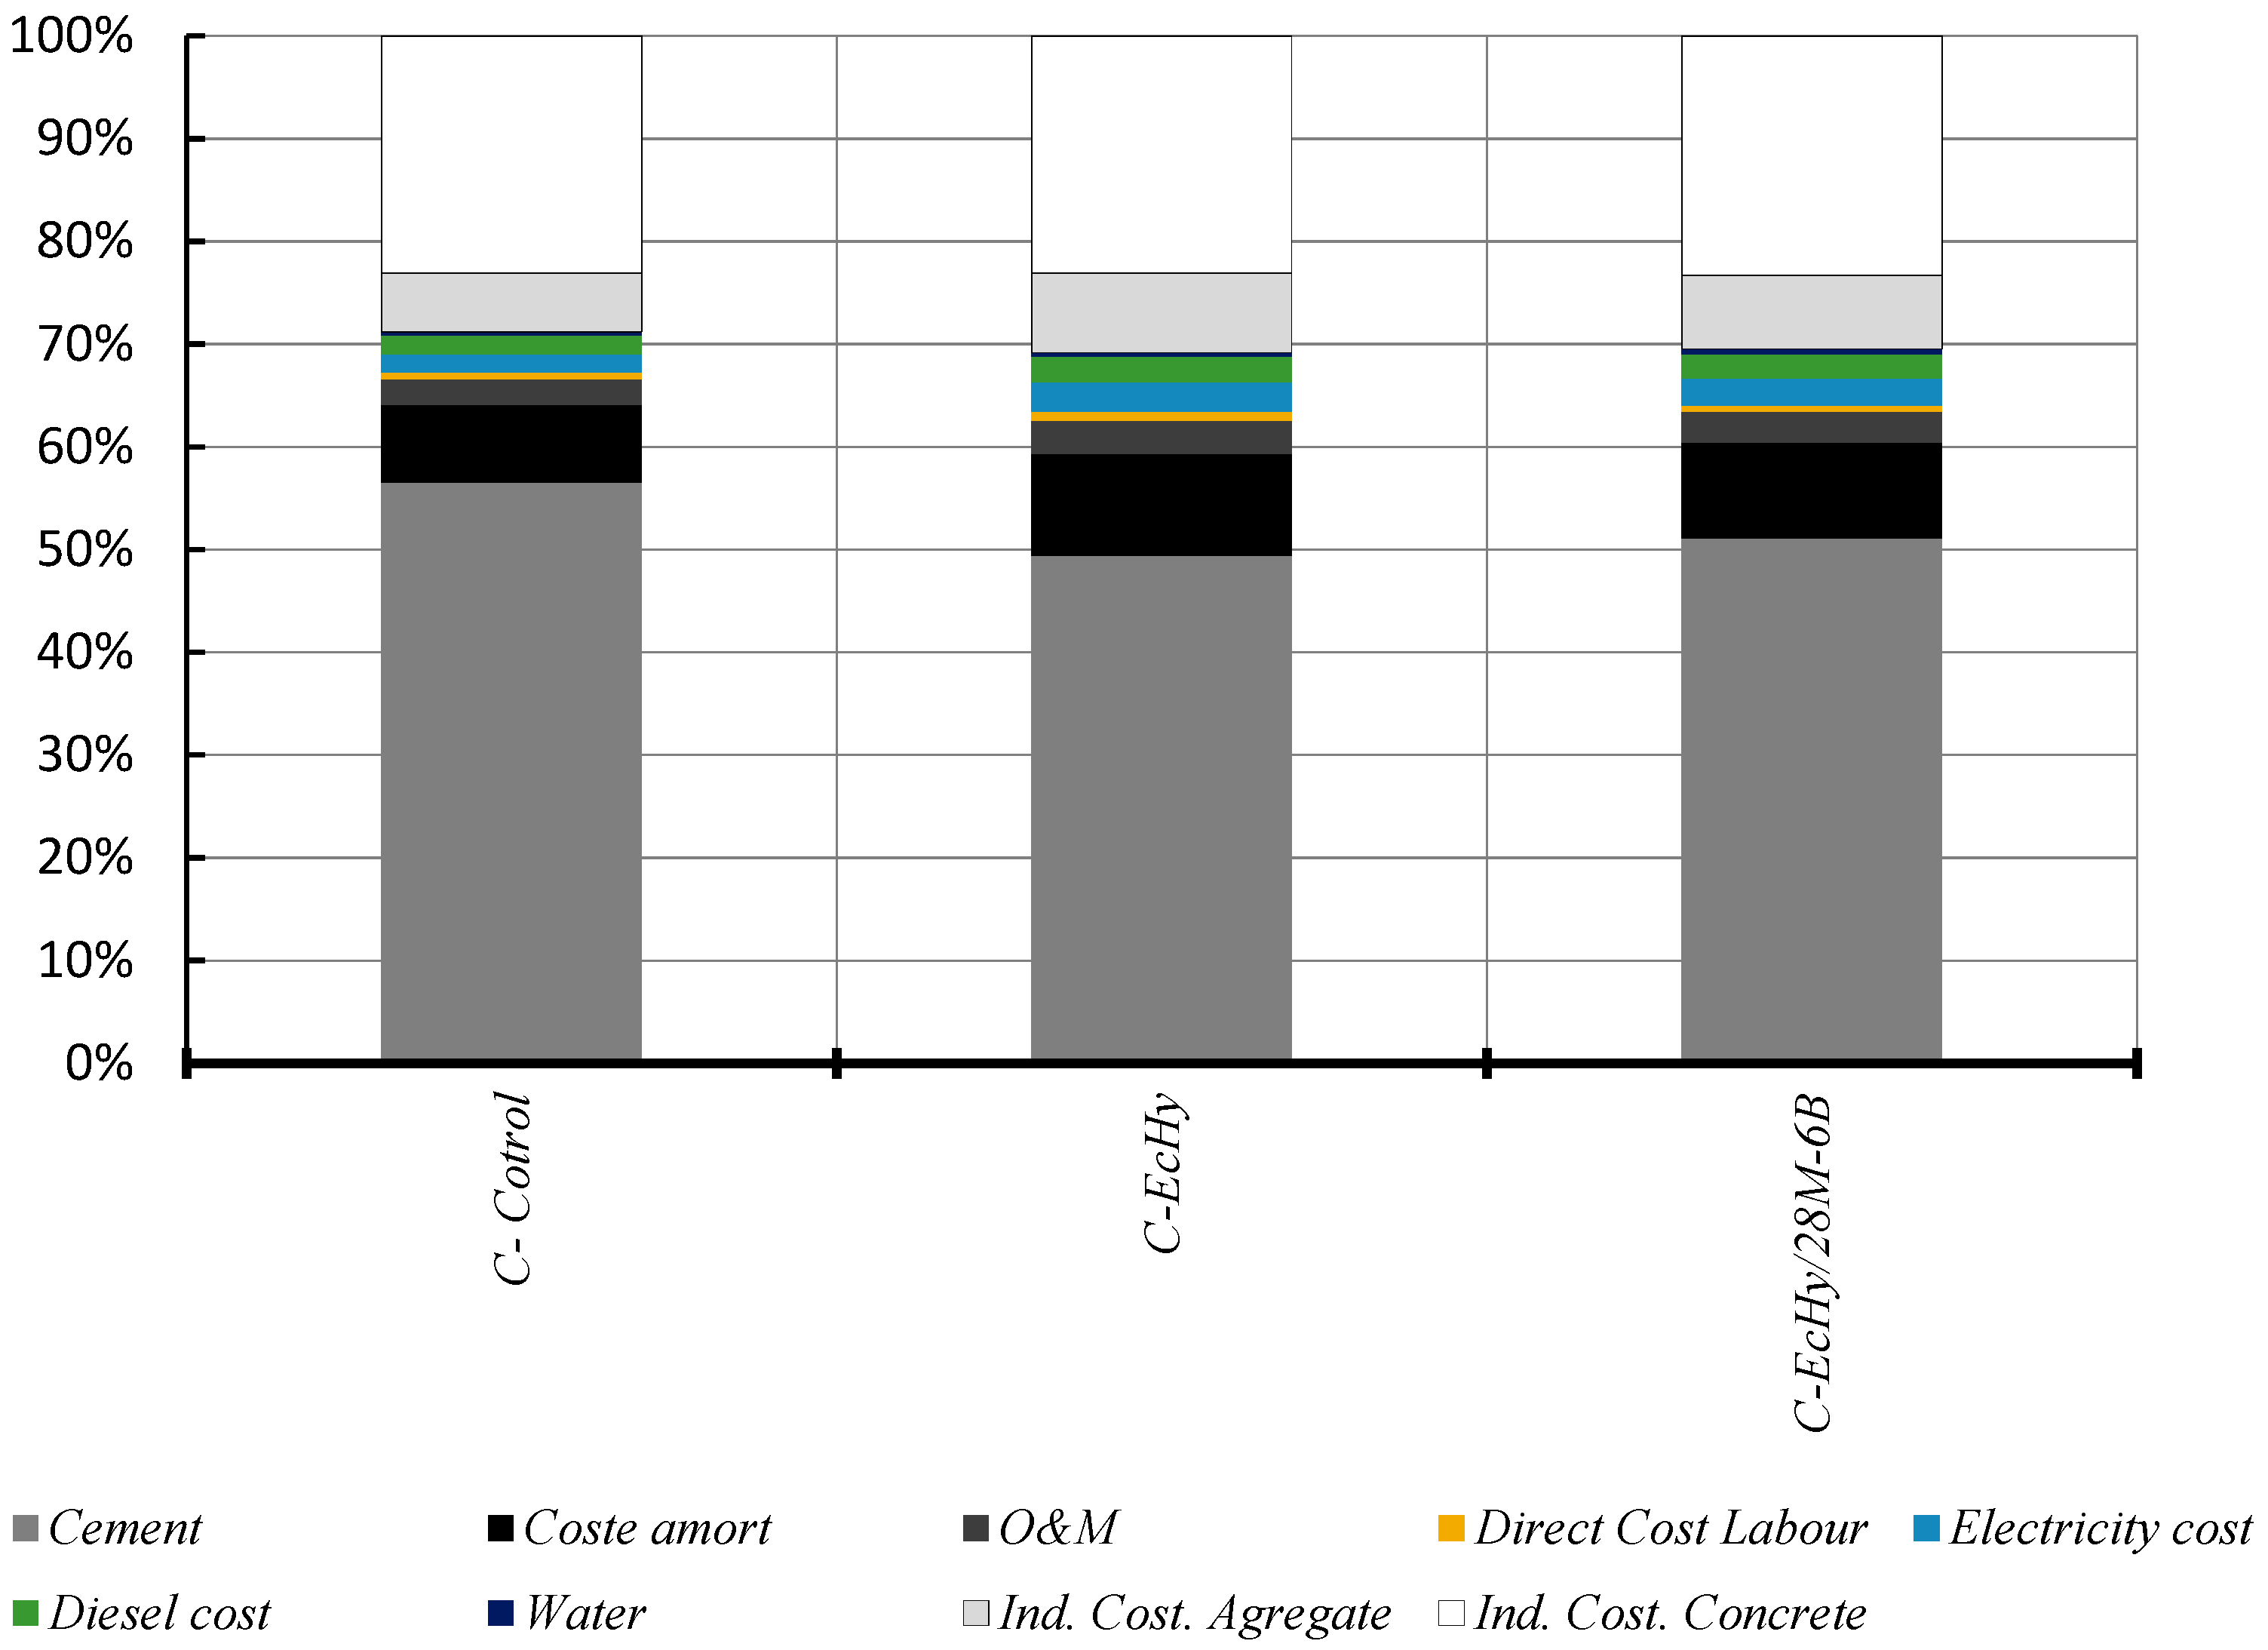
5.2.3. EMC Results and Discussions: Concrete Mixtures
5.3. EMC Final Results
6. Conclusions
Author Contributions
Funding
Institutional Review Board Statement
Informed Consent Statement
Data Availability Statement
Acknowledgments
Conflicts of Interest
References
- Krausmann, F.; Lauk, C.; Haas, W. Wiedenhofer, from resource extraction to outflows of wastes and emissions: The socioeconomic metabolism of the global economy, 1900–2015. Glob. Environ. Chang. 2018, 52, 131–140. [Google Scholar] [CrossRef] [PubMed]
- Bajželj, B.; Allwood, J.M.; Cullen, J.M. Designing climate change mitigation plans that add up. Environ. Sci. Technol. 2013, 47, 8062–8069. [Google Scholar] [CrossRef] [PubMed]
- Habert, G.; Miller, S.A.; John, V.M.; Provis, J.L.; Favier, A.; Horvath, A.; Scrivener, K.L. Environmental impacts and decarbonization strategies in the cement and concrete industries. Nat. Rev. Earth Environ. 2020, 1, 559–573. [Google Scholar] [CrossRef]
- Chen, C.; Habert, G.; Bouzidi, Y.; Jullien, A. Environmental impact of cement production: Detail of the different processes and cement plant variability evaluation. J. Clean. Prod. 2010, 18, 478–485. [Google Scholar] [CrossRef]
- Miller, S.A.; Horvath, A.; Monteiro, P.J. Readily implementable techniques can cut annual CO2 emissions from the production of concrete by over 20%. Environ. Res. Lett. 2016, 11, 074029. [Google Scholar] [CrossRef]
- Snellings, R. Assessing, understanding and unlocking supplementary cementitious materials. RILEM Technol. Lett. 2016, 1, 50–55. [Google Scholar] [CrossRef]
- Asensio, E.; Medina, C.; Frías, M.; de Rojas, M.I.S. Fired clay-based construction and demolition waste as pozzolanic addition in cements. Design of new eco-efficient cements. J. Clean. Prod. 2020, 265, 121610. [Google Scholar] [CrossRef]
- Rosales, M.; Rosales, J.; Agrela, F.; de Rojas, M.S.; Cabrera, M. Design of a new eco-hybrid cement for concrete pavement, made with processed mixed recycled aggregates and olive biomass bottom ash as supplementary cement materials. Constr. Build. Mater. 2022, 358, 129417. [Google Scholar] [CrossRef]
- Chen, Z.; Yu, J.; Nong, Y.; Yang, Y.; Zhang, H.; Tang, Y. Beyond time: Enhancing corrosion resistance of geopolymer concrete and BFRP bars in seawater. Compos. Struct. 2023, 322, 117439. [Google Scholar] [CrossRef]
- Tang, Y.; Feng, W.; Chen, Z.; Mai, J.; Zheng, J.; Yang, Y. Behaviour of steel-reinforced recycled aggregate concrete-filled GFRP tubular short columns under eccentric axial compression. Thin-Walled Struct. 2024, 199, 111818. [Google Scholar] [CrossRef]
- García Palacios, J. Análisis de Impacto Ambiental del Hormigón Estructural Fabricado con Árido Reciclado; Universitat Politècnica de Catalunya: Barcelona, Spain, 2022. [Google Scholar]
- Katerusha, D. Attitude towards sustainability, study contents and the use of recycled concrete in building construction-case study Germany and Switzerland. J. Clean. Prod. 2021, 289, 125688. [Google Scholar] [CrossRef]
- Deresa, S.T.; Xu, J.; Demartino, C.; Heo, Y.; Li, Z.; Xiao, Y. Clay content of argillites: Influence on cement based mortars. Appl. Clay Sci. 2009, 43, 322–330. [Google Scholar]
- Habert, G.; Choupay, N.; Escadeillas, G.; Guillaume, D.; Montel, J.M. Clay content of argillites: Influence on cement based mortars. Appl. Clay Sci. 2009, 43, 322–330. [Google Scholar] [CrossRef]
- Alujas, A.; Fernández, R.; Quintana, R.; Scrivener, K.L.; Martirena, F. Pozzolanic reactivity of low grade kaolinitic clays: Influence of calcination temperature and impact of calcination products on OPC hydration. Appl. Clay Sci. 2015, 108, 94–101. [Google Scholar] [CrossRef]
- Buyle, M.; Braet, J.; Audenaert, A. Life cycle assessment in the construction sector: A review. Renew. Sustain. Energy Rev. 2013, 26, 379–388. [Google Scholar] [CrossRef]
- Zanni, S.; Simion, I.M.; Gavrilescu, M.; Bonoli, A. Life cycle assessment applied to circular designed construction materials. Procedia CIRP 2018, 69, 154–159. [Google Scholar] [CrossRef]
- Jonsson, A.; Bjorklund, T.; Tillman, A.-M. LCA of concrete and steel building frames. Int. J. Life Cycle Assess. 1998, 3, 216–224. [Google Scholar] [CrossRef]
- Marinković, S. Life cycle assessment (LCA) aspects of concrete. In Eco-Efficient Concrete; Elsevier: Amsterdam, The Netherlands, 2013; pp. 45–80. [Google Scholar]
- Flower, D.J.; Sanjayan, J.G. Green house gas emissions due to concrete manufacture. Int. J. Life Cycle Assess. 2007, 12, 282–288. [Google Scholar] [CrossRef]
- Kim, T.; Lee, S.; Chae, C.U.; Jang, H.; Lee, K. Development of the CO2 emission evaluation tool for the life cycle assessment of concrete. Sustainability 2017, 9, 2116. [Google Scholar] [CrossRef]
- Gursel, A.P.; Masanet, E.; Horvath, A.; Stadel, A. Life-cycle inventory analysis of concrete production: A critical review. Cem. Concr. Compos. 2014, 51, 38–48. [Google Scholar] [CrossRef]
- Marinković, S.; Malešev, M.; Ignjatović, I. Life cycle assessment (LCA) of concrete made using recycled concrete or natural aggregates. In Eco-Efficient Construction and Building Materials; Elsevier: Amsterdam, The Netherlands, 2014; pp. 239–266. [Google Scholar]
- Bovea, M.D.; Simó, A. Life cycle assessment of ceramic tiles: Environmental and statistical analysis. Int. J. Life Cycle Assess. 2011, 16, 916–928. [Google Scholar]
- Pargana, N.; Pinheiro, M.D.; Silvestre, J.D.; De Brito, J. Comparative environmental life cycle assessment of thermal insulation materials of buildings. Energy Build. 2014, 82, 466–481. [Google Scholar] [CrossRef]
- Ingrao, C.; Selvaggi, R.; Valenti, F.; Matarazzo, A.; Pecorino, B.; Arcidiacono, C. Life cycle assessment of expanded clay granulate production using different fuels. Resour. Conserv. Recycl. 2019, 141, 398–409. [Google Scholar] [CrossRef]
- Cabeza, L.F.; Castell, A.; Pérez, G. Life cycle assessment (LCA) of phase change materials (PCMs) used in buildings. In Eco-Efficient Construction and Building Materials; Elsevier: Amsterdam, The Netherlands, 2014; pp. 287–310. [Google Scholar]
- Sathre, R.; González-García, S. Life cycle assessment (LCA) of wood-based building materials. In Eco-Efficient Construction and Building Materials; Elsevier: Amsterdam, The Netherlands, 2014; pp. 311–337. [Google Scholar]
- Stafford, F.N.; Raupp-Pereira, F.; Labrincha, J.A.; Hotza, D. Life cycle assessment of the production of cement: A Brazilian case study. J. Clean. Prod. 2016, 137, 1293–1299. [Google Scholar] [CrossRef]
- Salas, D.A.; Ramirez, A.D.; Rodríguez, C.R.; Petroche, D.M.; Boero, A.J.; Duque-Rivera, J. Environmental impacts, life cycle assessment and potential improvement measures for cement production: A literature review. J. Clean. Prod. 2016, 113, 114–122. [Google Scholar] [CrossRef]
- Marceau, M.; Nisbet, M.A.; Van Geem, M.G. Life Cycle Inventory of Portland Cement Manufacture; Portland Cement Association: Skokie, IL, USA, 2006. [Google Scholar]
- Huntzinger, D.N.; Eatmon, T.D. A life-cycle assessment of Portland cement manufacturing: Comparing the traditional process with alternative technologies. J. Clean. Prod. 2009, 17, 668–675. [Google Scholar] [CrossRef]
- Moretti, L.; Caro, S. Critical analysis of the life cycle assessment of the Italian cement industry. J. Clean. Prod. 2017, 152, 198–210. [Google Scholar] [CrossRef]
- Cuenca-Moyano, G.M.; Martín-Morales, M.; Bonoli, A.; Valverde-Palacios, I. Environmental assessment of masonry mortars made with natural and recycled aggregates. Int. J. Life Cycle Assess. 2019, 24, 191–210. [Google Scholar] [CrossRef]
- Tosti, L.; van Zomeren, A.; Pels, J.R.; Comans, R.N. Technical and environmental performance of lower carbon footprint cement mortars containing biomass fly ash as a secondary cementitious material. Resour. Conserv. Recycl. 2018, 134, 25–33. [Google Scholar] [CrossRef]
- Napolano, L.; Menna, C.; Graziano, S.F.; Asprone, D.; D’Amore, M.; de Gennaro, R.; Dondi, M. Environmental life cycle assessment of lightweight concrete to support recycled materials selection for sustainable design. Constr. Build. Mater. 2016, 119, 370–384. [Google Scholar] [CrossRef]
- Gayarre, F.L.; Pérez, J.G.; Pérez, C.L.C.; López, M.S.; Martínez, A.L. Life cycle assessment for concrete kerbs manufactured with recycled aggregates. J. Clean. Prod. 2016, 113, 41–53. [Google Scholar] [CrossRef]
- Ingrao, C.; Giudice, A.L.; Mbohwa, C.; Clasadonte, M.T. Life Cycle Inventory analysis of a precast reinforced concrete shed for goods storage. J. Clean. Prod. 2014, 79, 152–167. [Google Scholar] [CrossRef]
- Sappa, G.; Iacurto, S.; Ponzi, A.; Tatti, F.; Torretta, V.; Viotti, P. The LCA methodology for ceramic tiles production by addition of MSWI BA. Resources 2019, 8, 93. [Google Scholar] [CrossRef]
- Pini, M.; Ferrari, A.M.; Gamberini, R.; Neri, P.; Rimini, B. Life cycle assessment of a large, thin ceramic tile with advantageous technological properties. Int. J. Life Cycle Assess. 2014, 19, 1567–1580. [Google Scholar] [CrossRef]
- Seco, A.; Omer, J.; Marcelino, S.; Espuelas, S.; Prieto, E. Sustainable unfired bricks manufacturing from construction and demolition wastes. Constr. Build. Mater. 2018, 167, 154–165. [Google Scholar] [CrossRef]
- Qiao, L.; Tang, Y.; Li, Y.; Liu, M.; Yuan, X.; Wang, Q.; Ma, Q. Life cycle assessment of three typical recycled products from construction and demolition waste. J. Clean. Prod. 2020, 376, 134139. [Google Scholar] [CrossRef]
- Gulotta, T.; Mistretta, M.; Praticò, F. A Life cycle assessment of three typical recycled products from construction and demolition waste. J. Clean. Prod. 2022, 376, 134139. [Google Scholar]
- Polo-Mendoza, R.; Penabaena-Niebles, R.; Giustozzi, F.; Martinez-Arguelles, G. Eco-friendly design of Warm mix asphalt (WMA) with recycled concrete aggregate (RCA): A case study from a developing country. Constr. Build. Mater. 2022, 326, 126890. [Google Scholar] [CrossRef]
- Mercante, I.T.; Bovea, M.D.; Ibáñez-Forés, V.; Arena, A.P. Life cycle assessment of construction and demolition waste management systems: A Spanish case study. Int. J. Life Cycle Assess. 2012, 17, 232–241. [Google Scholar] [CrossRef]
- Guignot, S.; Touzé, S.; Von der Weid, F.; Ménard, Y.; Villeneuve, J. Recycling construction and demolition wastes as building materials: A life cycle assessment. J. Ind. Ecol. 2015, 19, 1030–1043. [Google Scholar] [CrossRef]
- da Costa, T.P.; Quinteiro, P.; Tarelho, L.A.; Arroja, L.; Dias, A.C. Environmental assessment of valorisation alternatives for woody biomass ash in construction materials. Resour. Conserv. Recycl. 2019, 148, 67–79. [Google Scholar] [CrossRef]
- Babashamsi, P.; Yusoff, N.I.M.; Ceylan, H.; Nor, N.G.M.; Jenatabadi, H.S. Evaluation of pavement life cycle cost analysis: Review and analysis. Int. J. Pavement Res. Technol. 2016, 9, 241–254. [Google Scholar] [CrossRef]
- Li, J.; Xiao, F.; Zhang, L.; Amirkhanian, S.N. Life cycle assessment and life cycle cost analysis of recycled solid waste materials in highway pavement: A review. J. Clean. Prod. 2019, 233, 1182–1206. [Google Scholar] [CrossRef]
- Mohammadi, A.; Ramezanianpour, A.M. Investigating the environmental and economic impacts of using supplementary cementitious materials (SCMs) using the life cycle approach. J. Build. Eng. 2023, 79, 107934. [Google Scholar] [CrossRef]
- Eliche-Quesada, D.; Calero-Rodríguez, A.; Bonet-Martínez, E.; Pérez-Villarejo, L.; Sánchez-Soto, P.J. Geopolymers made from metakaolin sources, partially replaced by Spanish clays and biomass bottom ash. J. Build. Eng. 2021, 40, 102761. [Google Scholar] [CrossRef]
- UNE-EN-196-6:2019; Methods of Testing Cement—Part 6: Determination of Fineness. AENOR: Madrid, Spain, 2019.
- UNE-EN 1097-6:2001; Ensayos Para Determinación las Propiedades Mecánicas y Físicas de los Áridos. Parte 6: Determinación de la Densidad de Partículas y la Absorción de Agua. AENOR: Madrid, Spain, 2001.
- UNE-ISO 11048:2007; Calidad del Suelo. Determinación de Sulfato Soluble en Agua y en Ácido. AENOR: Madrid, Spain, 2007.
- UNE-EN 1744-1:2010; Ensayos Para Determinar las Propiedades Químicas de los Áridos. Parte 1: Análisis Químico. AENOR: Madrid, Spain, 2010.
- UNE 103204:2019; Determinación del Contenido de Materia Orgánica Oxidable de un Suelo por el Método del Permanganato Potásico. AENOR: Madrid, Spain, 2019.
- Carrasco-Hurtado, B.; Corpas-Iglesias, F.A.; Cruz-Pérez, N.; Terrados-Cepeda, J.; Pérez-Villarejo, L. Addition of bottom ash from biomass in calcium silicate masonry units for use as construction material with thermal insulating properties. Constr. Build. Mater. 2014, 52, 155–165. [Google Scholar] [CrossRef]
- Santos, T.A.; Neto, J.S.A.; Cilla, M.S.; Ribeiro, D.V. Influence of the Content of Alkalis (Na2O and K2O), MgO, and SO3 Present in the Granite Rock Fine in the Production of Portland Clinker. J. Mater. Civ. Eng. 2022, 34, 04021464. [Google Scholar] [CrossRef]
- Medina, C.; Banfill, P.F.G.; De Rojas, M.S.; Frías, M. Rheological and calorimetric behaviour of cements blended with containing ceramic sanitary ware and construction/demolition waste. Constr. Build. Mater. 2013, 40, 822–831. [Google Scholar] [CrossRef]
- Carrasco, B.; Cruz, N.; Terrados, J.; Corpas, F.A.; Pérez, L. An evaluation of bottom ash from plant biomass as a replacement for cement in building blocks. Fuel 2014, 118, 272–280. [Google Scholar] [CrossRef]
- UNE-EN 933-11:2009; Ensayos Para Determinar las Propiedades Geométricas de los Áridos. Parte 11: Ensayo de Clasificación de los Componentes de los Áridos Gruesos Reciclados. AENOR: Madrid, Spain, 2018.
- UNE 146404:2018; Áridos Para Hormigones. Medida del Coeficiente de Friabilidad de las Arenas. AENOR: Madrid, Spain, 2018.
- UNE-EN 933-8:2012; Ensayos Para Determinar las Propiedades Geométricas de los Áridos. Parte 8: Evaluación de los Finos. Ensayo del Equivalente de Arena. AENOR: Madrid, Spain, 2018.
- de Brito, J.; Agrela, F.; Silva, R.V. Construction and demolition waste. In New Trends in Eco-Efficient and Recycled Concrete; Elsevier: Amsterdam, The Netherlands, 2019; pp. 1–22. [Google Scholar]
- Martínez, P.S.; Cortina, M.G.; Martínez, F.F.; Sánchez, A.R. Comparative study of three types of fine recycled aggregates from construction and demolition waste (CDW), and their use in masonry mortar fabrication. J. Clean. Prod. 2016, 118, 162–169. [Google Scholar] [CrossRef]
- Jiménez, J.R.; Ayuso, J.; López, M.; Fernández, J.M.; De Brito, J.M.C.L. Use of fine recycled aggregates from ceramic waste in masonry mortar manufacturing. Constr. Build. Mater. 2013, 40, 679–690. [Google Scholar] [CrossRef]
- Thomas, C.; Setién, J.; Polanco, J. Structural recycled aggregate concrete made with precast wastes. Constr. Build. Mater. 2016, 114, 536–546. [Google Scholar] [CrossRef]
- ISO 20290–3:2019; Aggregates for Concrete. Test Methods for Mechanical and Physical Properties. Part 3: Determination of Aggregate Crushing Value (ACV). International Organization for Standardization: Geneva, Switzerland, 2019.
- UNE-EN 1097-2:2021; Ensayos Para Determinar las Propiedades Mecánicas y Físicas de los Áridos. Parte 2: Métodos Para la Determinación de la Resistencia a la Fragmentación. AENOR: Madrid, Spain, 2018.
- Bui, N.K.; Satomi, T.; Takahashi, H. Improvement of mechanical properties of recycled aggregate concrete basing on a new combination method between recycled aggregate and natural aggregate. Constr. Build. Mater. 2017, 148, 376–385. [Google Scholar] [CrossRef]
- Levy, S.M.; Helene, P. Durability of recycled aggregates concrete: A safe way to sustainable development. Cem. Concr. Res. 2004, 34, 1975–1980. [Google Scholar] [CrossRef]
- Juez, J.M.; Cazacliu, B.; Cothenet, A.; Artoni, R.; Roquet, N. Recycled concrete aggregate attrition during mixing new concrete. Constr. Build. Mater. 2016, 116, 299–309. [Google Scholar] [CrossRef]
- Hasdemir, S.; Tuğrul, A.; Yılmaz, M. The effect of natural sand composition on concrete strength. Constr. Build. Mater. 2016, 112, 940–948. [Google Scholar] [CrossRef]
- Al Harthi, A.; Saada, Y.A. Utilisation de granulats naturels d’oueds pour la fabrication de bétons (Ouest de l’Arabie Saoudite). Bull. Eng. Geol. Environ. 1997, 55, 27–37. [Google Scholar] [CrossRef]
- Thomas, C.; De Brito, J.; Cimentada, A.I.A.I.; Sainz-Aja, J.A. Macro-and micro-properties of multi-recycled aggregate concrete. J. Clean. Prod. 2020, 245, 118843. [Google Scholar] [CrossRef]
- Rodríguez-Robles, D.; García-González, J.; Juan-Valdés, A.; Pozo, J.M.M.D.; Guerra-Romero, M.I. Quality assessment of mixed and ceramic recycled aggregates from construction and demolition wastes in the concrete manufacture according to the Spanish standard. Materials 2014, 7, 5843–5857. [Google Scholar] [CrossRef]
- Cabrera, M.; Galvin, A.P.; Agrela, F.; Carvajal, M.D.; Ayuso, J. Characterisation and technical feasibility of using biomass bottom ash for civil infrastructures. Constr. Build. Mater. 2014, 58, 234–244. [Google Scholar] [CrossRef]
- Rosales, J.; Cabrera, M.; Beltrán, M.G.; López, M.; Agrela, F. Effects of treatments on biomass bottom ash applied to the manufacture of cement mortars. J. Clean. Prod. 2017, 154, 424–435. [Google Scholar] [CrossRef]
- Eliche-Quesada, D.; Felipe-Sesé, M.A.; Martínez-Martínez, S.; Pérez-Villarejo, L. Comparative study of the use of different biomass bottom ash in the manufacture of ceramic bricks. J. Mater. Civ. Eng. 2017, 29, 04017238. [Google Scholar] [CrossRef]
- UNE-EN 12390-3:2020; Ensayos de Hormigón Endurecido. Parte 3: Determinación de la Resistencia a Compresión de Probetas. AENOR: Madrid, Spain, 2018.
- UNE-EN 12390-5:2020; Ensayos de Hormigón Endurecido. Parte 5: Resistencia a Flexión de Probetas. AENOR: Madrid, Spain, 2018.
- Monteiro, P. Concrete: Microstructure, Properties, and Materials; McGraw-Hill Publishing: New York, NY, USA, 2006. [Google Scholar]
- Medina, J.M.; Sáez del Bosque, I.F.; Frías, M.; Sánchez de Rojas, M.I.; Medina, C. Characterisation and valorisation of biomass waste as a possible addition in eco-cement design. Mater. Struct. 2017, 50, 207. [Google Scholar] [CrossRef]
- Rajamma, R.; Senff, L.; Ribeiro, M.J.; Labrincha, J.A.; Ball, R.J.; Allen, G.C.; Ferreira, V.M. Biomass fly ash effect on fresh and hardened state properties of cement based materials. Compos. Part B Eng. 2015, 77, 1–9. [Google Scholar] [CrossRef]
- Beltrán, M.G.; Barbudo, A.; Agrela, F.; Jiménez, J.R.; de Brito, J. Mechanical performance of bedding mortars made with olive biomass bottom ash. Constr. Build. Mater. 2016, 112, 699–707. [Google Scholar] [CrossRef]
- Rosales, J.; Beltrán, M.G.; Cabrera, M.; Velasco, A.; Agrela, F. Feasible use of biomass bottom ash as addition in the manufacture of lightweight recycled concrete. Waste Biomass Valorization 2016, 7, 953–963. [Google Scholar] [CrossRef]
- Kikuchi, M.; Miura, T.; Dosho, Y.; Narikawa, M. Application of recycled aggregate concrete for structural concrete. Part 1—Experimental study on the quality of recycled aggregate and recycled aggregate concrete. In Proceedings of the Sustainable Construction: Use of Recycled Concrete Aggregate: Proceedings of the International Symposium organised by the Concrete Technology Unit, University of Dundee and held at the Department of Trade and Industry Conference Centre, London, UK, 11–12 November 1998. [Google Scholar]
- Reddy, B.V.; Gupta, A. Influence of sand grading on the characteristics of mortars and soil–cement block masonry. Constr. Build. Mater. 2008, 22, 1614–1623. [Google Scholar] [CrossRef]
- Mellmann, G.; Meinhold, U.; Maultzsch, M. Processed concrete rubble for the reuse as aggregates. In Exploiting Wastes in Concrete; Thomas Telford Publishing: London, UK, 1999; pp. 171–178. [Google Scholar]
- Silva, J.; De Brito, J.; Veiga, R. Recycled red-clay ceramic construction and demolition waste for mortars production. J. Mater. Civ. Eng. 2010, 22, 236–244. [Google Scholar] [CrossRef]
- ISO 14040; Environmental Management—Life Cycle Assessment—Principles and Framework. International Organization for Standardization: Geneva, Switzerland, 2006.
- ISO 14044; Environmental Management—Life Cycle Assessment—Requirements and Guidelines. International Organization for Standardization: Geneva, Switzerland, 2006.
- Ecoinvent v3.8. Available online: https://ecoinvent.org/ (accessed on 1 July 2024).
- UNE-EN 15804:2012+A2:2020; Sostenibilidad en la Construcción—Declaraciones Ambientales de Producto—Reglas de Categoría de Productos Básicas para Productos de Construcción. AENOR: Madrid, Spain, 2020.
- European Commission. Uso de los Métodos de la Huella Ambiental Para Medir y Comunicar el Comportamiento Ambiental de los Productos y las Organizaciones a lo Largo de su Ciclo de Vida; European Commission: Brussels, Belgium, 2021. [Google Scholar]
- ISO 15686-5; International Organization for Standardization Standard, Buildings and Constructed Assets, Service-life Planning, Part 5: Life-cycle Costing. International Organization for Standardization: Geneva, Switzerland, 2017.
- EN 60300-3-3:2017; Dependability Management—Part 3-3: Application Guide—Life Cycle Costing. International Organization for Standardization: Geneva, Switzerland, 2017.
- de Bruyn, S.; Bijleveld, M.; de Graaff, L.; Schep, E.; Schroten, A.; Vergeer, R.; Ahdour, S. Environmental Prices Handbook EU28 Version. 2018. Available online: https://cedelft.eu/publications/environmental-prices-handbook-eu28-version/ (accessed on 1 July 2024).
- Vivienda, S.G. Base de Costes de la Construcción de Andalucía (BCCA). Available online: https://www.juntadeandalucia.es/organismos/fomentoarticulaciondelterritorioyvivienda/areas/vivienda-rehabilitacion/planes-instrumentos/paginas/bcca-ene-2024.html (accessed on 10 January 2023).


| XRF (%) | UNE-EN 196-6 [52] | |||||||||
|---|---|---|---|---|---|---|---|---|---|---|
| CEM I 52.5R | CaO | SiO2 | SO3 | Al2O3 | Fe2O3 | MgO | K2O | Na2O | TiO2 | Density (kg/m3) |
| 70.03 | 17.06 | 4.49 | 3.63 | 1.89 | 1.36 | 0.94 | 0.29 | 0.31 | 3070 | |
| Cement Substitute Wastes—Characterisation of pBBA | ||||
|---|---|---|---|---|
| Properties | Size | Results | Test Method | |
| Density-SSD (kg/m3) | 0–0.125 mm | 2840 | UNE-EN 1097-6 [53] | |
| Water Absorption (%) | 0–0.125 mm | 20.96 | ||
| Sulphates (% SO4) | 0–0.125 mm | Acid | 0.29 | UNE-ISO 11048 [54] |
| Water | 0.29 | |||
| Chlorides | 0–0.125 mm | 0.21 | UNE-EN 1744-1 [55] | |
| Organic Content (%) | 0–0.125 mm | 2.57 | UNE 103204 [56] | |
| Composition (%) | 0–0.125 mm | SiO2 (%) | 33.96 | XRF |
| CaO (%) | 31.73 | |||
| Al2O3 (%) | 6.66 | |||
| Fe2O3 (%) | 2.94 | |||
| MgO (%) | 5.11 | |||
| K2O (%) | 15.32 | |||
| SO3 (%) | 0.57 | |||
| Na2O (%) | 0.31 | |||
| TiO2 (%) | 0.29 | |||
| P2O5 (%) | 2.97 | |||
| MnO2 (%) | 0.14 | |||
| Cement Substitute Wastes—Characterisation of MRA Powder | ||||
|---|---|---|---|---|
| Properties | Size | Results | Test Method | |
| Density-SSD (kg/m3) | 0–0.125 mm | 2910 | UNE-EN 1097-6 [53] | |
| Water Absorption (%) | 0–0.125 mm | 9.01 | ||
| Sulphates (% SO4) | 0–0.125 mm | Acid | 0.70 | UNE-ISO 11048 [54] |
| Water | 0.24 | |||
| Chlorides (%) | 0–0.125 mm | 0.07 | UNE-EN 1744-1 [55] | |
| Organic Content (%) | 0–0.125 mm | 0.19 | UNE 103204 [56] | |
| Composition (%) | 0–0.125 mm | SiO2 (%) | 45.68 | XRF |
| CaO (%) | 33.01 | |||
| Al2O3 (%) | 9.92 | |||
| Fe2O3 (%) | 3.38 | |||
| MgO (%) | 2.83 | |||
| K2O (%) | 1.93 | |||
| SO3 (%) | 1.59 | |||
| Na2O (%) | 0.68 | |||
| TiO2 (%) | 0.62 | |||
| P2O5 (%) | 0.19 | |||
| MnO2 (%) | 0.17 | |||
| Sieve (mm) | Lower Limit | Interval Average | Upper Limit |
|---|---|---|---|
| 2 | 0 | 0 | 0 |
| 1.6 | 2 | 7 | 12 |
| 1 | 28 | 33 | 38 |
| 0.5 | 62 | 67 | 72 |
| 0.16 | 82 | 87 | 92 |
| 0.08 | 98 | 99 | 100 |
| Constituents Composition MRA (0–22 mm) UNE-EN 933-11 [61] | ||||||
|---|---|---|---|---|---|---|
| Concrete (%) | Natural Aggregates (%) | Ceramic (%) | Bituminous (%) | Others (%) | Glass (%) | Floating (cm3/kg) |
| 44.0 | 34.5 | 18.6 | 2.3 | 0.6 | 0 | 0 |
| Properties | Characterisation of Fine Fraction MRA | ||
|---|---|---|---|
| Size | Results | Test Method | |
| Density-SSD (kg/m3) | 0–4 mm | 2370 | UNE-EN 1097-6 [53] |
| Water Absorption (%) | 0–4 mm | 9.42 | |
| Friability Ratio (%) | 0.1–2 mm | 23.9 | UNE 146404 [62] |
| Sand Equivalent (%) | 0–2 mm | 75.28 | UNE-EN 933-8 [63] |
| Organic Content (%) | 0–2 mm | 0.19 | UNE 103204 [56] |
| Chlorides (%) | 0–2 mm | 0.04 | UNE-EN 1744-1 [55] |
| Water-soluble sulphates (%) | 0–2 mm | 0.35 | |
| Acid-soluble sulphates (%) | 0–2 mm | 0.35 | |
| XRF (%) | UNE-EN 196-6 [52] | |||||||||
|---|---|---|---|---|---|---|---|---|---|---|
| CEM II 42.5 | CaO | SiO2 | SO3 | Al2O3 | Fe2O3 | MgO | K2O | Na2O | TiO2 | Density (kg/m3) |
| 59.53 | 27.65 | 3.73 | 4.52 | 1.42 | 1.31 | 1.29 | 0.28 | 0.27 | 3110 | |
| Properties | Characterisation of Natural Aggregate | ||
|---|---|---|---|
| Size | Results | Test Method | |
| Density-SSD (kg/m3) | 0–4 mm | 2590 | UNE-EN 1097-6 [53] |
| Water Absorption (%) | 0.72 | ||
| Density-SSD (kg/m3) | 4–12 mm | 2640 | |
| Water Absorption (%) | 0.47 | ||
| Density-SSD (kg/m3) | 12–22 mm | 2660 | |
| Water Absorption (%) | 0.44 | ||
| Friability Ratio (%) | 0.1–2 mm | 14.8 | UNE 146404 [62] |
| Sand Equivalent (%) | 0–2 mm | 87.7 | UNE-EN 933-8 [63] |
| Crushing Value (%) | 10–12.5 mm | 18.58 | ISO 20290-3 [68] |
| Los Angeles (%) | 10–14 mm | 20.0 | UNE-EN 1097-2 [69] |
| Properties | Characterisation of MRA | ||
|---|---|---|---|
| Size | Results | Test Method | |
| Density-SSD (kg/m3) | 0–4 mm | 2370 | UNE-EN 1097-6 [53] |
| Water Absorption (%) | 9.42 | ||
| Density-SSD (kg/m3) | 4–22 mm | 2320 | |
| Water Absorption (%) | 6.49 | ||
| Friability Ratio (%) | 0.1–2 mm | 23.9 | UNE 146404 [62] |
| Sand Equivalent (%) | 0–2 mm | 75.28 | UNE-EN 933-8 [63] |
| Crushing Value (%) | 10–12.5 mm | 26.69 | ISO 20290-3 [68] |
| Los Angeles (%) | 10–14 mm | 34.72 | UNE-EN 1097-2 [69] |
| Properties | Characterisation of BBA | ||
|---|---|---|---|
| Size | Results | Test Method | |
| Density-SSD (k) | 0–4 mm | 1.94 | UNE-EN 1097-6 [53] |
| Water Absorption (%) | 0–4 mm | 19.82 | |
| Friability Ratio (%) | 0.1–2 mm | 20.0 | UNE 146404 [62] |
| Sand Equivalent (%) | 0–2 mm | 68.73 | UNE-EN 933-8 [63] |
| Organic Content (%) | 0–2 mm | 3.1 | UNE 103204 [56] |
| Chlorides (%) | 0–2 mm | 0.23 | UNE-EN 1744-1 [55] |
| Water-soluble sulphates (%) | 0–2 mm | 0.29 | |
| Acid-soluble sulphates (%) | 0–2 mm | 0.29 | |
| Series Name | Description | Dosages—Mortar Mixtures (kg/m3) | ||||||||
|---|---|---|---|---|---|---|---|---|---|---|
| CEM I 52.5 | CEMII 42.5 | pBBA | pMRA | SNS (0/2 mm) | Fine MRA (0/2 mm) | Water | Water Absorption | Admixture | ||
| M-Control | Control CEM II 42.5 | - | 540 | 0 | 0 | 1620 | 0 | 270 | 0 | 0 |
| M-EcHy | 6% pBBA 19% pMRA | 405 | - | 29.7 | 96.3 | 1620 | 0 | 265.5 | 0 | 0 |
| M-EcHy/20M | 6% pBBA 19% pMRA 20% MRA | 405 | - | 29.7 | 96.3 | 1296 | 271.9 | 265.5 | 11.5 | 1.2 |
| Series Name | Description | Dosages—Concrete Mixtures (kg/m3) | |||||||||||
|---|---|---|---|---|---|---|---|---|---|---|---|---|---|
| CEM I 52.5 | CEM II 42.5 | pBBA | pMRA | CA (12/22 mm) | MA (4/12 mm) | FA (0/4 mm) | MRA (0/22 mm) | BBA (0/4 mm) | Water | Water Absorption | Admixture | ||
| C-Control | Control CEM II 42.5 | - | 365 | 0 | 0 | 915 | 325 | 625 | 0 | 0 | 153.3 | 0 | 0 |
| C-EcHy | 19% pMRA 6% pBBA | 256 | - | 23 | 69 | 915 | 325 | 625 | 0 | 0 | 146.3 | 16 | 0 |
| C-EcHy/28M-6B | 19% pMRA 6% pBBA 28.5% MRA 6% BBA | 256 | - | 23 | 69 | 600 | 170 | 460 | 472 | 80 | 146.3 | 53 | 3.8 |
| Serie | Name | Description | Compressive S. (Mpa) | Flexural S. (Mpa) | ||||||||||
|---|---|---|---|---|---|---|---|---|---|---|---|---|---|---|
| 7 Days | 28 Days | 90 Days | 7 Days | 28 Days | 90 Days | |||||||||
| μ | σ | μ | σ | μ | σ | μ | σ | μ | σ | μ | σ | |||
| Mortar | M-Control | Control CEM II 42.5 | 48.34 | 1.07 | 51.48 | 0.94 | 56.66 | 0.91 | 6.98 | 0.14 | 8.72 | 0.18 | 8.91 | 0.22 |
| M-EcHy | 19% pMRA 6% pBBA | 44.83 | 1.18 | 49.74 | 0.97 | 55.04 | 1.08 | 6.14 | 0.21 | 7.99 | 0.19 | 8.67 | 0.24 | |
| M-Echy/20M | 19% pMRA 6% pBBA 20% MRA | 37.46 | 0.79 | 43.85 | 0.86 | 48.61 | 0.84 | 4.76 | 0.24 | 6.37 | 0.18 | 7.84 | 0.19 | |
| Serie | Name | Description | Compressive S. (Mpa) | Flexural S. (Mpa) | ||||||||||
|---|---|---|---|---|---|---|---|---|---|---|---|---|---|---|
| 7 Days | 28 Days | 90 Days | 7 Days | 28 Days | 90 Days | |||||||||
| μ | σ | μ | σ | μ | σ | μ | σ | μ | σ | μ | σ | |||
| Concrete | C-Control | Control CEM II 42.5 | 49.7 | 1.23 | 55.7 | 1.34 | 58.4 | 1.09 | 5.09 | 0.19 | 5.68 | 0.18 | 5.84 | 0.22 |
| C-EcHy | 19% pMRA 6% pBBA | 44.5 | 1.01 | 49.1 | 1.14 | 54.7 | 1.12 | 4.81 | 0.14 | 5.38 | 0.16 | 5.74 | 0.19 | |
| C-EcHy/28M-6B | 19% pMRA 6% pBBA 28% MRA 6% BBA | 39.4 | 0.98 | 43.0 | 1.01 | 52.3 | 1.08 | 4.32 | 0.21 | 4.56 | 0.18 | 5.42 | 0.17 | |
| Materials | Process | Equipment | Amount | Power | Production | Operation Time | Electrical Consumption | Distance |
|---|---|---|---|---|---|---|---|---|
| (kW) | (t/h) | (h) | (kWh/t) | (km) | ||||
| Cement | ||||||||
| CEM I 52.5 | Cement, Portland (Europe without Switzerland), production, Cut off, U, (Ecoinvent v3.8). | |||||||
| CEM II 42.5 | Cement, alternative constituents 6–20% (Europe without Switzerland) production, Cut off, U, (Ecoinvent v3.8). | |||||||
| CEM EcHy | Cement, Portland (Europe without Switzerland), production, Cut off, U, (Ecoinvent v3.8). | |||||||
| pBBA | ||||||||
| pMRA | ||||||||
| Natural aggregates | ||||||||
| CA 12/22 mm | Extraction | Bulldozer with ripper | 1 | - | 998.87 | - | - | - |
| MA 4/12 mm | Handling | Shovel loader | 2 | - | 30.52 | - | - | - |
| FA 0/4 mm | Handling | Conveyor belt, 25 m | 1 | 20 | 168.92 | - | 0.118 | - |
| SNS 0/2 mm | Conveyor belt, 15 m | 2 | 8 | 112.61 | - | 0.071 | - | |
| Conveyor belt, 5 m | 2 | 4 | 123.87 | - | 0.032 | - | ||
| Screening | Vibrating screen | 4 | 18.5 | 225 | - | 0.082 | - | |
| Crushing | Impact mill | 1 | 125.1 | 400 | - | 0.313 | - | |
| Jaw crusher | 1 | 206.1 | 400 | - | 0.515 | - | ||
| Biomass Bottom Ash | ||||||||
| Fine BBA 0/2 mm | Handling | Shovel loader | 4 | - | 31.221 | - | - | - |
| pBBA | Transport | Shovel loader | 2 | - | - | 0.006 | - | 0.03 |
| Transport | Shovel loader | 2 | - | 0.01 | - | 0.05 | ||
| Screening | Vibrating screen | 1 | 22.08 | 250 | - | 0.0883 | - | |
| Crushing | Ball mill | 1 | 15 | 4 | 0.5 | 1.88 | - | |
| Handling | Conveyor belt, 5 m | 1 | 4 | 22.55 | - | 0.2130 | - | |
| Conveyor belt, 5 m | 1 | 4 | 22.55 | - | 0.1770 | - | ||
| Mixed Recycled Aggregate | ||||||||
| MRA 0/22 mm | Handling | Shovel loader | 2 | - | 100 | - | - | - |
| Fine MRA 0/2 mm | Transport | Shovel loader | 1 | - | - | 0.02 | - | 0.1 |
| pMRA | Transport | Shovel loader | 1 | - | - | 0.01 | - | 0.05 |
| Handling | Overband | 2 | 3.68 | 108.91 | - | 0.0338 | - | |
| Blower | 1 | 14 | 144.73 | - | 0.0967 | - | ||
| Vibrating plate | 1 | 3 | 80 | 0.0375 | - | |||
| Conveyor belt, 15 m | 1 | 7.36 | 148.51 | - | 0.0496 | - | ||
| Conveyor belt, 10 m | 1 | 7.36 | 108.91 | - | 0.0676 | - | ||
| Conveyor belt, 5 m | 5 | 4 | 108.91 | - | 0.0367 | - | ||
| Screening | Vibrating screen | 4 | 22.08 | 250 | - | 0.0883 | - | |
| Crushing | Jaw crusher | 1 | 160 | 325 | - | 0.4920 | - | |
| Impact mill | 1 | 75 | 250 | - | 0.3000 | - | ||
| Ball mill | 1 | 15 | 4 | 3 | 11.3 | - | ||
| Water | Tap water (Europe without Switzerland), tap water production, conventional treatment, Cut-off, U (Ecoinvent v3.8). | |||||||
| Admixture | Plasticiser, for concrete, based on sulfonated melamine formaldehyde (GLO-ES), production, Cut-off, U, (Ecoinvent v3.8). | |||||||
| Material | Impact category (Unit) | |||||||||
|---|---|---|---|---|---|---|---|---|---|---|
| AP | GWP | EP-Freshwater | EP-Marine | EP-Terrestrial | ODP | POCP | ADP-Fossil | ADP min & met | WDP | |
| mol H+ eq | kg CO2 eq | kg P eq | kg N eq | mol N eq | kg CFC11 eq | kg NMVOC eq | MJ | kg Sb eq | m3depriv. | |
| CEM I 52.5 | 1.97 | 869.52 | 8.47 × 10⁻² | 5.30 × 10⁻¹ | 6.02 | 2.61 × 10⁻⁵ | 1.51 | 3.29 × 10³ | 1.28 × 10⁻³ | 57.2 |
| CEM II 42.5 | 1.83 | 799.91 | 7.94 × 10⁻² | 4.90 × 10⁻¹ | 5.56 | 2.41 × 10⁻⁵ | 1.40 | 3.07 × 10³ | 1.25 × 10⁻³ | 53.2 |
| CEM EcHy | 1.49 | 653.08 | 6.38 × 10⁻² | 3.99× 10⁻¹ | 4.53 | 1.96 × 10⁻⁵ | 1.14 | 2.49 × 10³ | 9.62 × 10⁻⁴ | 43.4 |
| pBBA | 9.60 × 10⁻³ | 1.25 | 3.04 × 10⁻⁴ | 2.40× 10⁻³ | 2.57 × 10⁻² | 1.53 × 10⁻⁷ | 7.23 × 10⁻³ | 23.1 | 7.69 × 10⁻⁶ | 4.80 × 10⁻¹ |
| pMRA | 4.06× 10⁻² | 4.89 | 1.50 × 10⁻³ | 8.30 × 10⁻³ | 8.77 × 10⁻² | 4.37 × 10⁻⁷ | 2.41 × 10⁻² | 1.03 × 10² | 1.85 × 10⁻⁵ | 2.59 |
| CA | 1.02 × 10⁻² | 1.05 | 1.60 × 10⁻⁴ | 3.68 × 10⁻³ | 4.02 × 10⁻² | 1.76 × 10⁻⁷ | 1.10 × 10⁻² | 17.1 | 5.37 × 10⁻⁶ | 1.48 |
| MA | 1.04 × 10⁻² | 1.07 | 1.66 × 10⁻⁴ | 3.70 × 10⁻³ | 4.05 × 10⁻² | 1.77 × 10⁻⁷ | 1.11 × 10⁻² | 17.5 | 5.42 × 10⁻⁶ | 1.49 |
| FA | 1.04 × 10⁻² | 1.07 | 1.67 × 10⁻⁴ | 3.70 × 10⁻³ | 4.05 × 10⁻² | 1.77 × 10⁻⁷ | 1.11 × 10⁻² | 17.5 | 5.43 × 10⁻⁶ | 1.49 |
| SNS | 1.04 × 10⁻² | 1.07 | 1.67 × 10⁻⁴ | 3.70 × 10⁻³ | 4.05 × 10⁻² | 1.77 × 10⁻⁷ | 1.11 × 10⁻² | 17.5 | 5.43 × 10⁻⁶ | 1.49 |
| MRA | 6.20 × 10⁻³ | 8.05 × 10⁻¹ | 1.28 × 10⁻⁴ | 1.97 × 10⁻³ | 2.14 × 10⁻² | 1.28 × 10⁻⁷ | 5.99× 10⁻³ | 13.4 | 2.67 × 10⁻⁶ | 1.95 × 10⁻¹ |
| Fine MRA | 6.30 × 10⁻³ | 8.18 × 10⁻¹ | 1.33 × 10⁻⁴ | 1.99 × 10⁻³ | 2.15 × 10⁻² | 1.29 × 10⁻⁷ | 6.04× 10⁻³ | 13.7 | 2.75 × 10⁻⁶ | 2.03 × 10⁻¹ |
| BBA 0/2 | 3.85 × 10⁻³ | 5.54 × 10⁻¹ | 3.45 × 10⁻⁵ | 1.49× 10⁻³ | 1.63 × 10⁻² | 1.11 × 10⁻⁷ | 4.60× 10⁻³ | 7.95 | 5.76 × 10⁻⁷ | 4.10 × 10⁻² |
| Admixture | 8.64 | 1.19 × 10³ | 3.52 × 10⁻¹ | 1.10 | 11.8 | 2.10 × 10⁻⁴ | 4.37 | 2.92 × 10⁴ | 3.78 × 10⁻² | 9.41 × 10² |
| Impact Category | Unit | Cement Mortar | ||
|---|---|---|---|---|
| M-Control | M-EcHy | M-EcHy/20M | ||
| AP | mol H+ eq | 1.12 | 0.86 | 0.87 |
| GWP | kg CO2 eq | 475.78 | 358.91 | 360.21 |
| EP-freshwater | kg P eq | 4.83 × 10⁻² | 3.70 × 10⁻² | 3.74 × 10⁻² |
| EP-marine | kg N eq | 0.30 | 0.23 | 0.23 |
| EP-terrestrial | mol N eq | 3.38 | 2.58 | 2.58 |
| ODP | kg CFC11 eq | 1.49 × 10⁻⁵ | 1.14 × 10⁻⁵ | 1.16 × 10⁻⁵ |
| POCP | kg NMVOC eq | 0.86 | 0.65 | 0.67 |
| ADP-fossil | MJ | 1879.75 | 1446.38 | 1479.53 |
| ADP-min&met | kg Sb eq | 1.08 × 10⁻³ | 9.10 × 10⁻⁴ | 9.54 × 10⁻⁴ |
| Water use | m3 depriv. | 46.77 | 39.12 | 40.32 |
| Impact Category | Unit | Concrete Mixtures | ||
|---|---|---|---|---|
| C-Control | C-EcHy | C-EcHy/28M-6B | ||
| AP | mol H+ eq | 0.56 | 0.57 | 0.60 |
| GWP | kg CO2 eq | 258.89 | 229.43 | 233.71 |
| EP-freshwater | kg P eq | 3.16 × 10⁻² | 2.44 × 10⁻² | 2.57 × 10⁻² |
| EP-marine | kg N eq | 0.15 | 0.15 | 0.15 |
| EP-terrestrial | mol N eq | 1.71 | 1.69 | 1.72 |
| ODP | kg CFC11 eq | 3.91 × 10⁻⁶ | 7.53 × 10⁻⁶ | 8.29 × 10⁻⁶ |
| POCP | kg NMVOC eq | 0.44 | 0.43 | 0.44 |
| ADP-fossil | MJ | 835.57 | 956.83 | 1063.94 |
| ADP-min&met | kg Sb eq | 6.13 × 10⁻⁴ | 7.20 × 10⁻⁴ | 8.62 × 10⁻⁴ |
| Water use | m3 depriv. | 16.82 | 26.42 | 30.74 |
| Category Cost (€/tn) | pBBA | pMRA | CA | MA | FA | SNS | MRA | Fine MRA | BBA 0/2 |
|---|---|---|---|---|---|---|---|---|---|
| Depreciation Cost | 0.47046 | 2.94631 | 1.77992 | 2.48392 | 3.58392 | 3.58392 | 2.21895 | 2.21895 | 0.42646 |
| O&M | 0.15789 | 0.89506 | 0.61753 | 0.82873 | 1.15873 | 1.15873 | 0.67127 | 0.67127 | 0.14469 |
| Labour Direct Cost | 0.05224 | 0.03483 | 0.21657 | 0.21657 | 0.21657 | 0.21657 | 0.01741 | 0.01741 | 0.05224 |
| Electricity cost | 0.49378 | 4.95588 | 0.32476 | 0.48508 | 0.98742 | 0.98742 | 0.35707 | 0.35707 | 0.06377 |
| Diesel cost | 0.74128 | 1.00053 | 0.61134 | 0.61134 | 0.61134 | 0.61134 | 0.50027 | 0.50027 | 0.74128 |
| Total Direct Cost | 1.91564 | 9.83261 | 3.55012 | 4.62564 | 6.55798 | 6.55798 | 3.76497 | 3.76497 | 1.42844 |
| Indirect Cost + Industrial Profit (IP) | 0.76626 | 3.93304 | 1.42005 | 1.85026 | 2.62319 | 2.62319 | 1.50599 | 1.50599 | 0.57138 |
| Price | 2.68190 | 13.76565 | 4.97017 | 6.47590 | 9.18118 | 9.18118 | 5.27096 | 5.27096 | 1.99982 |
| Material | Quantity (Tn) | Price (€/Tn) | Total | ||
|---|---|---|---|---|---|
| Eco-hybrid cement | Cement CEM I | 0.75 | 124.00 | 93.00 | |
| pBBA | 0.06 | 2.68 | 0.16 | ||
| pMRA | 0.19 | 13.77 | 2.62 | ||
| Proportional share of indirect costs and industrial profit of added materials pBBA, pMRA. | 30.00% | 0.83 | 0.83 | ||
| 96.61 €/Tn | |||||
| Substance/Compartment | Unit | CEM I 52.5 | CEM II 42.5 | CEM EcHy | pBBA | pMRA | CA | MA | FA | SNS | MRA | Fine MRA | BBA 0/2 | Admixture |
|---|---|---|---|---|---|---|---|---|---|---|---|---|---|---|
| Euro | 122.97 | 114.14 | 92.58 | 0.43 | 1.84 | 0.44 | 0.44 | 0.44 | 0.44 | 0.35 | 0.36 | 0.17 | 407.46 | |
| Arsenic (air) | % | 0.79 | 0.82 | 0.79 | 1.25 | 0.92 | 0.84 | 0.84 | 0.84 | 0.84 | 0.56 | 0.57 | 0.26 | 5.07 |
| Arsenic (water) | % | 1.20 | 1.23 | 1.21 | 2.56 | 3.01 | 1.33 | 1.36 | 1.36 | 1.36 | 1.29 | 1.32 | 0.65 | 3.46 |
| Barium (water) | % | 0.49 | 0.50 | 0.49 | 0.67 | 0.53 | 0.52 | 0.52 | 0.52 | 0.52 | 0.42 | 0.42 | 0.46 | 2.20 |
| Cadmium (air) | % | 0.18 | 0.19 | 0.18 | 0.23 | 0.14 | 0.17 | 0.17 | 0.17 | 0.17 | 0.11 | 0.11 | 0.06 | 1.10 |
| Carbon dioxide, fossil (air) | % | 38.81 | 38.46 | 38.72 | 15.11 | 13.83 | 12.91 | 12.92 | 12.93 | 12.93 | 12.21 | 12.23 | 17.85 | 13.71 |
| Lead (air) | % | 0.66 | 0.68 | 0.66 | 0.83 | 0.60 | 0.58 | 0.58 | 0.58 | 0.58 | 0.39 | 0.40 | 0.23 | 3.48 |
| Manganese (water) | % | 7.23 | 7.31 | 7.23 | 7.24 | 8.59 | 3.77 | 3.86 | 3.87 | 3.87 | 3.73 | 3.82 | 2.02 | 9.10 |
| Methane, fossil (air) | % | 0.59 | 0.59 | 0.59 | 0.67 | 0.73 | 0.42 | 0.43 | 0.43 | 0.43 | 0.41 | 0.41 | 0.38 | 2.28 |
| Nitrogen oxides (air) | % | 21.71 | 21.60 | 21.71 | 27.82 | 22.31 | 43.45 | 43.14 | 43.08 | 43.08 | 28.68 | 28.53 | 45.79 | 12.96 |
| Particulates, <2.5 µm (air) | % | 4.36 | 4.42 | 4.38 | 12.55 | 10.87 | 15.52 | 15.46 | 15.45 | 15.45 | 11.10 | 11.09 | 16.02 | 9.77 |
| Particulates, >2.5 µm, and <10 µm (air) | % | 5.59 | 5.72 | 5.58 | 3.55 | 2.53 | 2.84 | 2.85 | 2.85 | 2.85 | 2.25 | 2.27 | 2.48 | 4.76 |
| Sulphur dioxide (air) | % | 10.91 | 10.97 | 10.94 | 17.36 | 20.29 | 10.87 | 11.03 | 11.06 | 11.06 | 10.36 | 10.53 | 8.82 | 23.57 |
| Remaining substances (air) | % | 7.49 | 7.52 | 7.52 | 10.16 | 15.64 | 6.77 | 6.85 | 6.86 | 6.86 | 28.49 | 28.30 | 4.97 | 8.52 |
| Mortar | Category Cost (€/m3) | Cement | Water | Additive | pBBA | pMRA | SNS | MRA | Total |
|---|---|---|---|---|---|---|---|---|---|
| M-Control | Cost amort | - | |||||||
| 5.806 | 5.806 | ||||||||
| O&M | - | 1.877 | 1.877 | ||||||
| Direct Cost Labour | - | 0.351 | 0.351 | ||||||
| Electricity cost | - | 1.600 | 1.600 | ||||||
| Diesel cost | - | 0.990 | 0.990 | ||||||
| Total Indirect Cost Materials | - | 4.250 | 4.250 | ||||||
| TOTAL COST | 43.71 | 0.28 | 12.678 | ||||||
| Total Indirect EMC-MAT Mortar (15%) | 19.991 | ||||||||
| 51.424 | 0.340 | 14.874 | 86.629 | ||||||
| M-EcHy | 38.568 | 0.335 | 38.903 | ||||||
| Cost amort | 0.014 | 0.284 | 5.806 | 6.104 | |||||
| O&M | 0.005 | 0.086 | 1.877 | 1.968 | |||||
| Direct Cost Labour | 0.002 | 0.003 | 0.351 | 0.356 | |||||
| Electricity cost | 0.015 | 0.477 | 1.600 | 2.092 | |||||
| Diesel cost | 0.022 | 0.096 | 0.990 | 1.109 | |||||
| Total Indirect. Cost. | 0.023 | 0.379 | 4.250 | 4.651 | |||||
| Total Indirect Cost Mortar | 16.554 | ||||||||
| 38.568 | 0.335 | 0.080 | 1.326 | 14.874 | 71.736 | ||||
| M-EcHy/20 | 38.568 | 0.349 | 0.148 | 39.065 | |||||
| Cost amort | 0.014 | 0.284 | 4.645 | 0.603 | 5.546 | ||||
| O&M | 0.005 | 0.086 | 1.502 | 0.183 | 1.775 | ||||
| Direct Cost Labour | 0.002 | 0.003 | 0.281 | 0.005 | 0.290 | ||||
| Electricity cost | 0.015 | 0.477 | 1.280 | 0.097 | 1.869 | ||||
| Diesel cost | 0.022 | 0.096 | 0.792 | 0.136 | 1.047 | ||||
| Additive | |||||||||
| Total Indirect Cost | 0.023 | 0.379 | 3.400 | 0.409 | 4.211 | ||||
| Total Indirect Cost Mortar | 16.141 | ||||||||
| 38.568 | 0.349 | 0.148 | 0.080 | 1.326 | 11.899 | 1.433 | 69.943 |
| EMC-ENV Stage | Substance/Compartment | M-Control | M-EcHy | M-EcHy/20M | ||||
|---|---|---|---|---|---|---|---|---|
| Euro | % | Euro | % | Euro | % | |||
| Total cost | 69.57 | 100 | 53.16 | 100 | 53.61 | 100 | ||
| Materials | 67.14 | 96.51 | 50.74 | 94.44 | 51.18 | 95.47 | ||
| CEM I 52.5 | 66.41 | 95.44 | 49.80 | 93.68 | 49.80 | 92.91 | ||
| pBBA | - | - | 0.01 | 0.02 | 0.01 | 0.02 | ||
| pMRA | - | - | 0.18 | 0.33 | 0.18 | 0.33 | ||
| SNS | 0.72 | 1.04 | 0.72 | 1.36 | 0.58 | 1.08 | ||
| Fine MRA | - | - | - | - | 0.10 | 0.18 | ||
| Water | 0.02 | 0.03 | 0.02 | 0.04 | 0.02 | 0.04 | ||
| Admixture | - | - | - | - | 0.49 | 0.91 | ||
| Cement mortar manufacturing | 2.43 | 3.49 | 2.43 | 4.56 | 2.43 | 4.53 | ||
| Arsenic (air) | 0.92 | 1.32 | 0.64 | 1.20 | 0.74 | 1.38 | ||
| Arsenic (water) | 0.77 | 1.10 | 0.72 | 1.36 | 0.66 | 1.23 | ||
| Carbon dioxide, fossil (air) | 26.10 | 37.51 | 19.68 | 37.03 | 19.74 | 36.83 | ||
| Manganese (water) | 5.08 | 7.30 | 3.89 | 7.32 | 3.94 | 7.34 | ||
| Mercury (air) | 1.6 | 2.68 | 1.40 | 2.63 | 1.40 | 2.61 | ||
| Nitrogen oxides (air) | 14.98 | 21.54 | 11.42 | 21.49 | 11.45 | 21,36 | ||
| Particulates, <2.5 µm (air) | 3.19 | 4.58 | 2.49 | 4.68 | 2.52 | 4.71 | ||
| Particulates, >2.5 µm, and <10 µm (air) | 3.88 | 5.58 | 2.96 | 5.57 | 2.98 | 5.56 | ||
| Sulphur dioxide (air) | 7.75 | 11.14 | 5.98 | 11.25 | 6.09 | 11.36 | ||
| Remaining substances | 5.04 | 7.25 | 3.98 | 7.48 | 4.08 | 7.61 | ||
| Concrete | Category Cost (€/m3) | Cement | Water | Addit | pBBA | pMRA | CA | MA | FA, SNS | MRA | BBA 0/2 | Total |
|---|---|---|---|---|---|---|---|---|---|---|---|---|
| C- Control | 34.75895 | 0.19316 | 34.95211 | |||||||||
| Cost amort | 1.62863 | 0.80727 | 2.23995 | 4.67586 | ||||||||
| O&M | 0.56504 | 0.26934 | 0.72421 | 1.55859 | ||||||||
| Direct Cost Labour | 0.19816 | 0.07039 | 0.13536 | 0.40390 | ||||||||
| Electricity cost | 0.29715 | 0.15765 | 0.61714 | 1.07194 | ||||||||
| Diesel cost | 0.55937 | 0.19868 | 0.38209 | 1.14015 | ||||||||
| Ind. Cost. Aggregate | 1.29934 | 0.60133 | 1.63950 | 3.54017 | ||||||||
| Ind. Cost. Concrete | 14.20281 | |||||||||||
| 34.75895 | 0.19316 | 4.54770 | 2.10467 | 5.73823 | 61.54553 | |||||||
| C-EcHy | 24.37888 | 0.20450 | 24.58338 | |||||||||
| Cost amort | 0.01082 | 0.20330 | 1.62863 | 0.80727 | 2.23995 | 4.88997 | ||||||
| O&M | 0.00363 | 0.06176 | 0.56504 | 0.26934 | 0.72421 | 1.62398 | ||||||
| Direct Cost Labour | 0.00120 | 0.00240 | 0.19816 | 0.07039 | 0.13536 | 0.40751 | ||||||
| Electricity cost | 0.01136 | 0.34196 | 0.29715 | 0.15765 | 0.61714 | 1.42525 | ||||||
| Diesel cost | 0.01705 | 0.06904 | 0.55937 | 0.19868 | 0.38209 | 1.22623 | ||||||
| Ind. Cost. Aggregate | 0.01762 | 0.27138 | 1.29934 | 0.60133 | 1.63950 | 3.82918 | ||||||
| Ind. Cost. Concrete | 11.39565 | |||||||||||
| 24.37888 | 0.20450 | 0.06168 | 0.94983 | 4.54770 | 2.10467 | 5.73823 | 49.38115 | |||||
| C-EcHy/28M-6B | 24.37888 | 0.25112 | 0.46816 | 25.09816 | ||||||||
| Cost amort | 0.01082 | 0.20330 | 1.06795 | 0.42227 | 1.64860 | 1.04735 | 0.03412 | 4.43440 | ||||
| O&M | 0.00363 | 0.06176 | 0.37052 | 0.14088 | 0.53302 | 0.31684 | 0.01158 | 1.43823 | ||||
| Direct Cost Labour | 0.00120 | 0.00240 | 0.12994 | 0.03682 | 0.09962 | 0.00822 | 0.00418 | 0.28238 | ||||
| Electricity cost | 0.01136 | 0.34196 | 0.19485 | 0.08246 | 0.45421 | 0.16854 | 0.00510 | 1.25848 | ||||
| Diesel cost | 0.01705 | 0.06904 | 0.36680 | 0.10393 | 0.28122 | 0.23613 | 0.05930 | 1.13346 | ||||
| Ind. Cost. Aggregate | 0.01762 | 0.27138 | 0.85203 | 0.31454 | 1.20667 | 0.71083 | 0.04571 | 3.41878 | ||||
| Ind. Cost. Concrete | 11.11917 | |||||||||||
| 24.37888 | 0.25112 | 0.46816 | 0.06168 | 0.94983 | 2.98210 | 1.10090 | 4.22334 | 2.48789 | 0.15999 | 48.18306 |
| EMC Stage | Substance/Compartment | C-Control | C-EcHy | C-EcHy/28M-6B | ||||
|---|---|---|---|---|---|---|---|---|
| Euro | % | Euro | % | Euro | % | |||
| Total cost | 36.48 | 100 | 34.88 | 100 | 36.33 | 100 | ||
| Materials | 34.05 | 93.35 | 32.45 | 93.04 | 33.91 | 93.32 | ||
| CEM II 42.5 | 33.22 | 91.06 | - | - | - | - | ||
| Eco-hybrid cement | - | - | 31.62 | 90.64 | 31.62 | 87.02 | ||
| CEM I 52.5 | - | - | 31.48 | 90.25 | 31.48 | 86.65 | ||
| pBBA | - | - | 0.01 | 0.03 | 0.01 | 0.03 | ||
| pMRA | - | - | 0.13 | 0.36 | 0.13 | 0.35 | ||
| CA | 0.40 | 1.10 | 0.40 | 1.15 | 0.26 | 0.72 | ||
| MA | 0.14 | 0.40 | 0.14 | 0.41 | 0.08 | 0.21 | ||
| FA | 0.28 | 0.76 | 0.28 | 0.80 | 0.20 | 0.56 | ||
| MRA | - | - | - | - | 0.17 | 0.46 | ||
| Fine BBA | - | - | - | - | 0.01 | 0.04 | ||
| Water | 0.01 | 0.04 | 0.01 | 0.04 | 0.02 | 0.05 | ||
| Admixture | - | - | - | - | 1.55 | 4.26 | ||
| Concrete manufacturing | 2.43 | 6.65 | 2.43 | 6.96 | 2.43 | 6.68 | ||
| Arsenic (air) | 0.73 | 2.01 | 0.49 | 1.41 | 0.57 | 1.57 | ||
| Arsenic (water) | 0.53 | 1.45 | 0.50 | 1.44 | 0.56 | 1.53 | ||
| Carbon dioxide, fossil (air) | 13.65 | 37.42 | 12.58 | 36.06 | 12.78 | 35.16 | ||
| Carbon-14 (air) | 0.24 | 0.67 | 0.21 | 0.60 | 0.22 | 0.59 | ||
| Manganese (water) | 3.31 | 9.09 | 2.57 | 7.36 | 2.70 | 7.44 | ||
| Nitrogen oxides (air) | 7.44 | 20.41 | 7.48 | 21.44 | 7.61 | 20.95 | ||
| Particulates, <2.5 µm (air) | 1.39 | 3.82 | 1.70 | 4.87 | 1.83 | 5.03 | ||
| Particulates, >2.5 µm, and <10 µm (air) | 2.52 | 6.91 | 1.94 | 5.55 | 2.01 | 5.52 | ||
| Radon-222 (air) | 0.34 | 0.93 | 0.28 | 0.81 | 0.29 | 0.81 | ||
| Sulphur dioxide (air) | 3.77 | 10.34 | 3.98 | 11.41 | 4.33 | 11.92 | ||
| Remaining substances | 2.54 | 6.95 | 3.16 | 9.07 | 3.44 | 9.47 | ||
| Mortar | Material Cost | Environmental Cost | Total Cost | ||
|---|---|---|---|---|---|
| (Euros/m3) | (%) | (Euros/m3) | (%) | (Euros/m3) | |
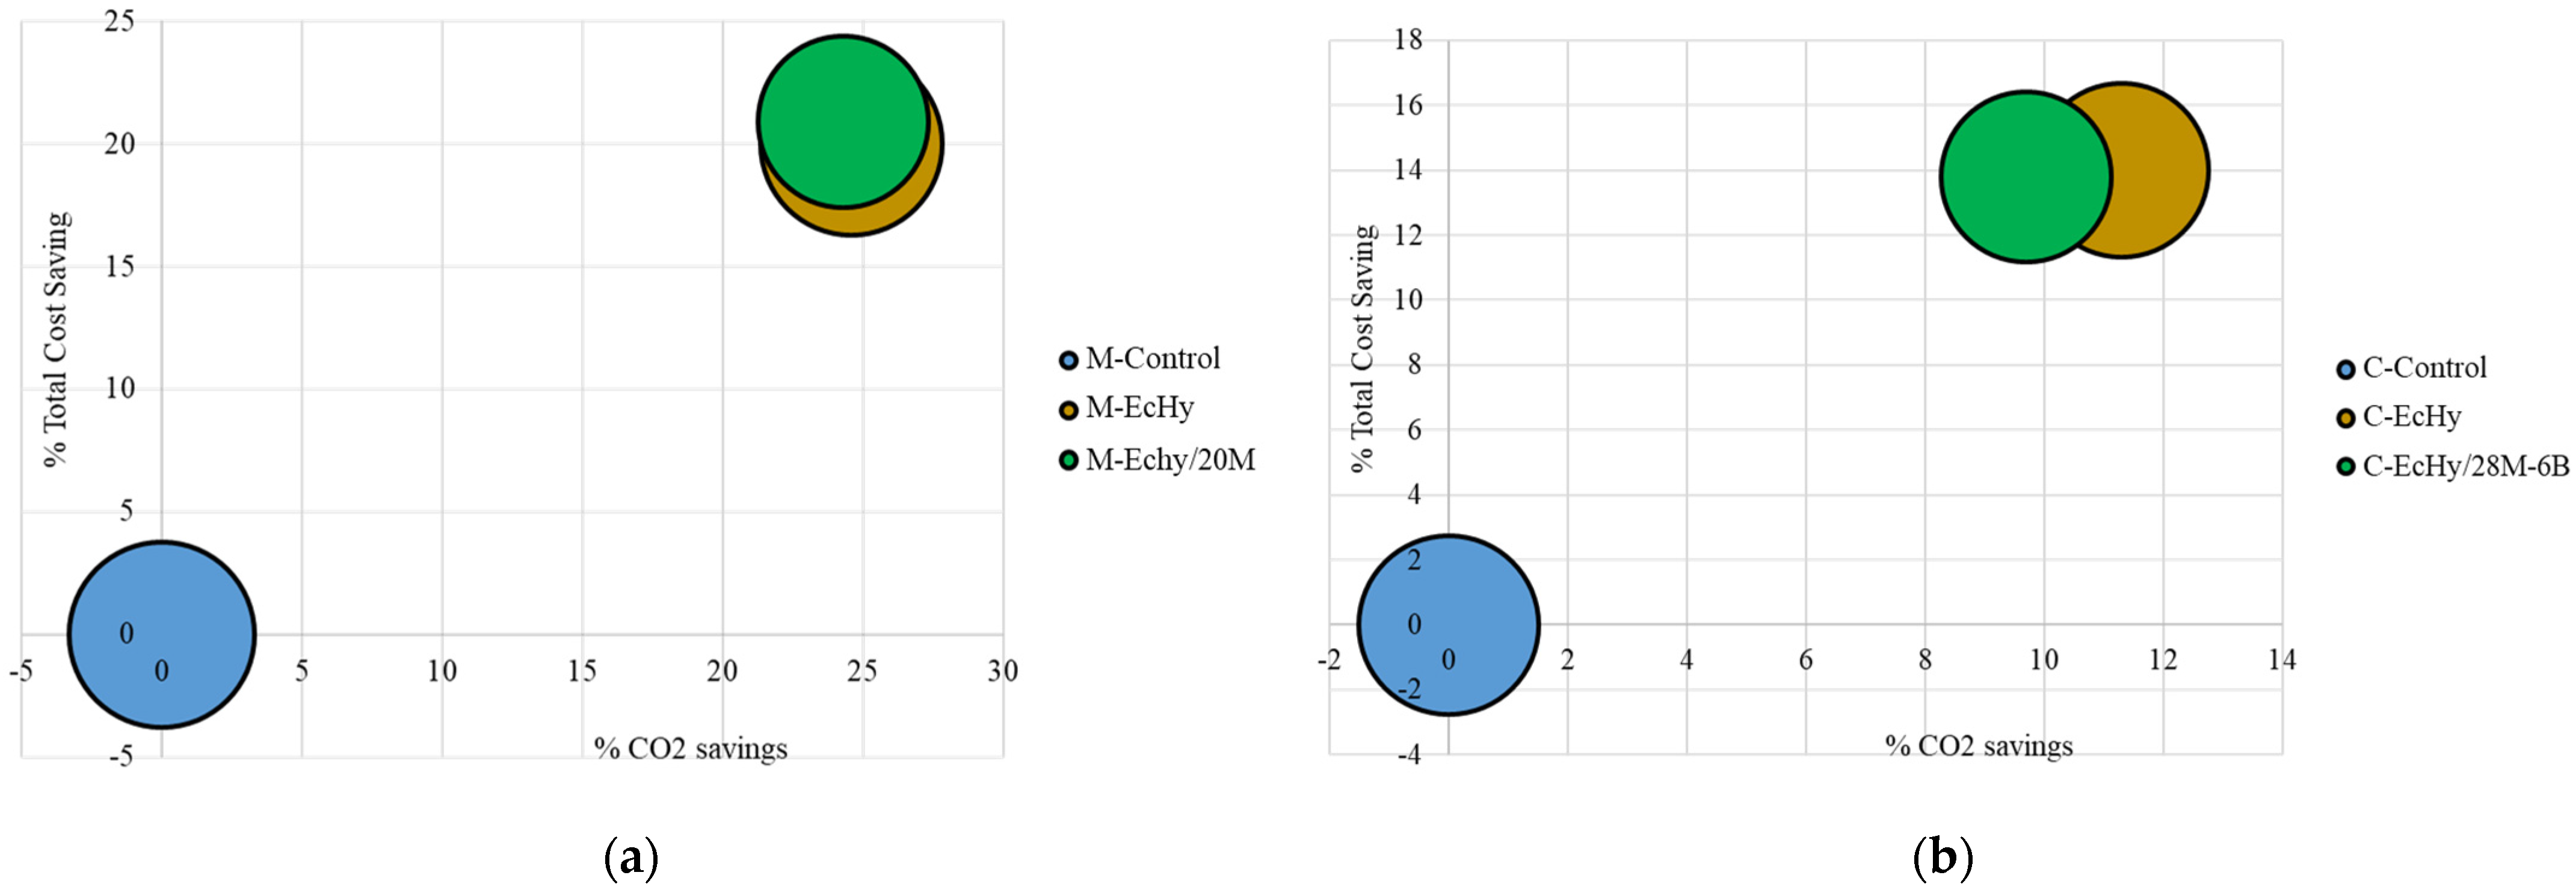
| M- Control | 86.63 | 55.5 | 69.57 | 44.5 | 156.20 |
| M-EcHy | 71.74 | 57.4 | 53.16 | 42.6 | 124.90 |
| M-EcHy/20M | 69.94 | 56.6 | 53.61 | 43.4 | 123.55 |
| C-Control | 61.55 | 62.8 | 36.48 | 37.2 | 98.03 |
| C-EcHy | 49.38 | 58.6 | 34.88 | 41.4 | 84.26 |
| C-EcHy/28M-6B | 48.18 | 57.0 | 36.33 | 43.0 | 84.51 |
Disclaimer/Publisher’s Note: The statements, opinions and data contained in all publications are solely those of the individual author(s) and contributor(s) and not of MDPI and/or the editor(s). MDPI and/or the editor(s) disclaim responsibility for any injury to people or property resulting from any ideas, methods, instructions or products referred to in the content. |
© 2024 by the authors. Licensee MDPI, Basel, Switzerland. This article is an open access article distributed under the terms and conditions of the Creative Commons Attribution (CC BY) license (https://creativecommons.org/licenses/by/4.0/).
Share and Cite
Agrela, F.; Rosales, M.; Alonso, M.L.; Ordóñez, J.; Cuenca-Moyano, G.M. Life-Cycle Assessment and Environmental Costs of Cement-Based Materials Manufactured with Mixed Recycled Aggregate and Biomass Ash. Materials 2024, 17, 4357. https://doi.org/10.3390/ma17174357
Agrela F, Rosales M, Alonso ML, Ordóñez J, Cuenca-Moyano GM. Life-Cycle Assessment and Environmental Costs of Cement-Based Materials Manufactured with Mixed Recycled Aggregate and Biomass Ash. Materials. 2024; 17(17):4357. https://doi.org/10.3390/ma17174357
Chicago/Turabian StyleAgrela, Francisco, Manuel Rosales, Mónica López Alonso, Javier Ordóñez, and Gloria M. Cuenca-Moyano. 2024. "Life-Cycle Assessment and Environmental Costs of Cement-Based Materials Manufactured with Mixed Recycled Aggregate and Biomass Ash" Materials 17, no. 17: 4357. https://doi.org/10.3390/ma17174357
APA StyleAgrela, F., Rosales, M., Alonso, M. L., Ordóñez, J., & Cuenca-Moyano, G. M. (2024). Life-Cycle Assessment and Environmental Costs of Cement-Based Materials Manufactured with Mixed Recycled Aggregate and Biomass Ash. Materials, 17(17), 4357. https://doi.org/10.3390/ma17174357