Abstract
The objective of this study was to propose a correlation model of the damage class and deformation of reinforced concrete (RC) beams damaged by earthquakes with a focus on columns and walls. For this purpose, a series of full-scale RC beam specimens with different shear strength margins were tested under cyclic lateral loading to examine their deformation performance and damage states. Then, the damage class and seismic capacity reduction factor of RC beams were evaluated based on the test results. The results showed that the tendency of shear failure, such as shear crack pattern and shear deformation component, of specimens with small shear strength margins was more remarkable, and its maximum residual crack widths tended to be slightly larger and dominated by shear cracks. The results also indicated that the effect of the shear strength margin on the seismic capacity reduction factor which represents the residual seismic performance of RC beams was limited, whereas the specimen with a smaller shear strength margin exhibited lower ultimate deformation capacity. In addition, there was a difference in the boundary value of the lateral drift angle which classifies the damage class of specimens with different shear strength margins. Finally, correlation models between the damage class and deformation of RC beams with different deformation capacities were proposed.
1. Introduction
The major concern of damaged reinforced concrete (RC) buildings after an earthquake is their safety regarding aftershocks, and quick damage inspections are needed. In the stage following quick damage inspections, a precise damage evaluation should be quantitatively performed to identify necessary actions required for the damaged buildings. For this purpose, the guidelines for Post-Earthquake Damage Evaluation and Rehabilitation (JBDPA, 2015) was developed in 1991 and revised in 2001 and 2015 in Japan []. In these guidelines, a residual seismic capacity ratio index, which corresponds to building damage, is defined as the ratio of capacity of the post-damaged condition to that of the pre-damaged condition (i.e., the ratio of the residual capacity to the original). Here, the original or residual capacity of RC buildings can be calculated based on the initial (pre-earthquake) or residual energy absorption capacity as defined in the Japanese Standard for Seismic Evaluation (JBDPA, 2017), which is most widely applied to evaluate the seismic capacity of existing pre-damaged buildings in Japan [].
Since the residual or dissipated energy of RC structures is difficult to grasp on-site, the current Japanese guidelines mentioned above also provide a simplified calculation method for the residual seismic capacity ratio index, which employs visual damage information such as the maximum residual crack widths of members. As shown in Figure 1, the damage classes of structural members should be classified first from the damage state [,]. Then, a seismic capacity reduction factor η, which is defined as the ratio of the absorbable hysteretic energy after an earthquake to the original absorbable energy of each structural member, should be calculated corresponding to the damage classes of members [,,]. Considering the seismic capacity reduction factor η, a residual seismic capacity ratio index, which is defined as the ratio of post-earthquake seismic capacity to original capacity, can be calculated [,,,]. Finally, the damage of a building can be rated based on the damage rating criteria [,,,].
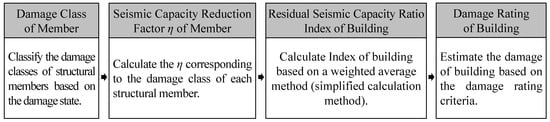
Figure 1.
Basic concept of residual seismic capacity evaluation method.
Jung et al. [] conducted several earthquake response analysis studies for the evaluation of residual seismic capacity using the simplified calculation method described above. In this study, a correlation model between the damage class and deformation was assumed for the vertical members, such as columns and walls. Thereby, the damage classes of RC columns and walls could be estimated based on their deformation obtained from the analysis results. However, the validity of the correlation model between damage class and deformation for RC beam members, which exhibited significantly different deformation characteristics compared to the vertical members, has not yet been clearly verified. Therefore, it is difficult to evaluate the residual seismic capacity of weak-beam RC buildings through earthquake response analysis studies.
Therefore, in this study, static loading tests are conducted on two full-scale RC beam specimens with different shear strength margins to investigate the effects of the shear strength margin on the deformation capacity and damage pattern. Then, the damage classes for each specimen are discussed in detail based on the test results. Finally, we propose the correlation model between the damage class and ductility ratio which takes into account the deformation performance of RC beams.
2. Experiment Outline
2.1. Specimen Outline
Figure 2, Table 1, Table 2, and Table 3 present the structural details, material characteristics, and specimen properties, respectively. Since the dimension effect on damage such as the residual crack width remains difficult to clarify, all specimens were designed as full-scale models to eliminate the influence of dimension effect. Then, the details of specimens were determined by referring to actual design examples, assuming beam members with a span length of 3600 mm []. As shown in Figure 2, each specimen had cross-sectional dimensions of 360 × 600 mm, with a length of 1800 mm to represent the geometric center of the actual span. The longitudinal reinforcement was 8-D25 (SD345, the standard yield strength of reinforcement was 345 MPa) and the spacing of transverse reinforcement was set at 150 mm for all specimens.
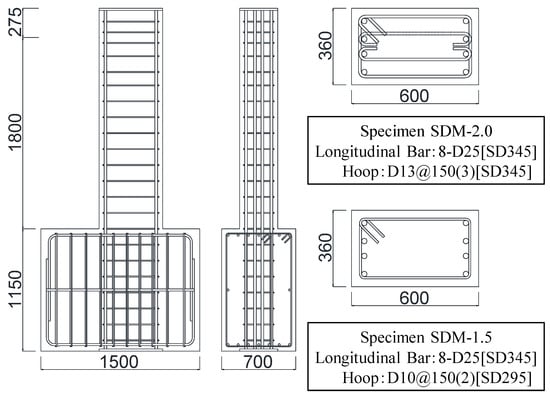
Figure 2.
Details of the test specimens (unit: mm).

Table 1.
Mechanical properties of concrete (unit: MPa).
Table 2.
Mechanical properties of reinforcement materials (Unit: MPa).
Table 3.
Summary of specimen properties.
The calculated results of the ultimate flexural strength (Qmu) and the shear strength (Qsu) using Equations (1) and (2) are summarized in Table 3. Here, the shear strength margin was defined as the ratio of Qsu to Qmu, and Qsu was adjusted using the reinforcement ratio and yield strength of transverse reinforcement, while Qmu was the same for each specimen []. Then, two specimens were fabricated with shear strength margins of 2.02 (specimen SDM-2.0; the transverse reinforcement ratio was 0.706% and the standard yield strength of transverse reinforcement was 345 MPa) and 1.57 (specimen SDM-1.5; the transverse reinforcement ratio was 0.264% and the standard yield strength of transverse reinforcement was 295 MPa).
where at is the cross-sectional area of longitudinal tensile reinforcement (mm2), σy is the yield strength of longitudinal reinforcement (MPa), d is the effective beam cross-section height (mm), hw is the beam length, pt is the longitudinal tensile reinforcement ratio (%), Fc is the compressive strength of concrete (MPa), M/(Qd) is the shear span ratio, pw is the transverse reinforcement ratio, σwy is the yield strength of transverse reinforcement (MPa), b is the beam cross-section width (mm), and j is the moment arm length from compressive to tensile resultant forces calculated by 7/8d (mm).
2.2. Loading Program and Instrumentation
Figure 3 illustrates the loading system. The lateral actuator was positioned at the height of the specimen (at a beam length of 1800 mm) to produce a cantilever moment distribution, and a pantograph was installed above the specimen. The lateral load was applied under displacement control in both positive and negative directions, with one cycle for the lateral drift angles of 0.0625%, 0.125%, and 0.25% and two cycles for the lateral drift angles of 0.5%, 0.75%, 1.0%, 1.5%, 2.0%, 3.0%, 4.0%, and 5.0%. In this study, the lateral drift angle R is defined as the ratio of lateral displacement to the beam length of 1800 mm.
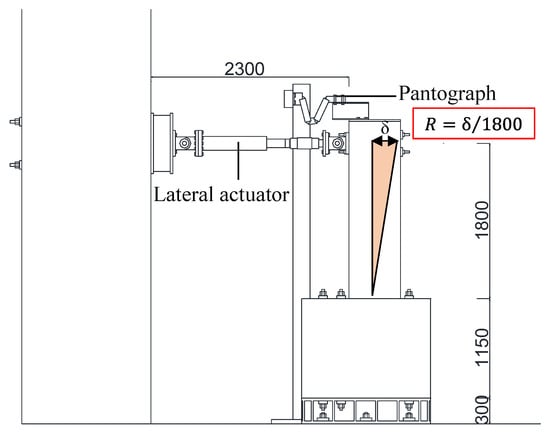
Figure 3.
Test setup and loading configuration.
As shown in Figure 4, flexural and shear deformations at each beam section were measured using displacement transducers (LVDTs). Strains in the longitudinal and transverse reinforcement were also recorded using strain gauges. Furthermore, the crack width and length were measured at the peak and unloading moment of each loading cycle for all lateral drift angles. Here, the crack width was measured visually using a crack scale, with the most open position value for each crack being recorded as its width. On the other hand, the crack length was calculated automatically using CAD software (AutoCAD 2020), which was digitized at the same scale after being measured visually. Detailed discussions on the flexural and shear deformations, as well as the damage, are presented in Section 3 and Section 4.
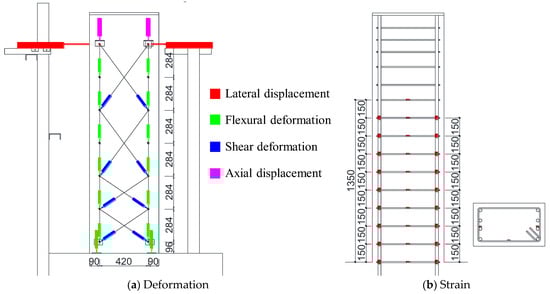
Figure 4.
Measurement schemes.
3. Experimental Results
3.1. Load–Deformation Relationship
Figure 5 presents the load–deformation relationships of the two specimens, including the calculation results of the ultimate flexural strength (Qmu) explained earlier. In the figure, the symbols △, □, ○, and × indicate the points of first concrete crack observation, tensile longitudinal reinforcement yielding, maximum strength, and 80% of the maximum strength, respectively. The notable characteristics of the hysteresis curves observed in the experimental results are summarized as follows.
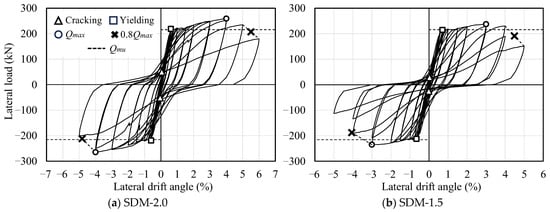
Figure 5.
Hysteresis curves.
In specimen SDM-2.0, yielding of the tensile longitudinal reinforcement was observed at lateral drift angles of R = +0.61% and −0.60% under positive and negative loading, respectively. The maximum strengths of +259.5 kN and −265.0 kN were recorded at R = 4.0% of each loading direction, which were approximately 1.18 times higher than the calculated value (Qmu). The load bearing capacity remained above 80% of the maximum strength even at R = +5.50% and −4.83%.
Similar trends in the hysteresis response and maximum strength were also observed in specimen SDM-1.5. The yielding of the tensile longitudinal reinforcement was observed at lateral drift angles of R = +0.71% and −0.66% under positive and negative loading, respectively. The maximum strengths of +237.5 kN and −235.0 kN were recorded at R = 3.0% of each loading direction, which were approximately 1.07 times higher than the calculated value (Qmu). Thereafter, the load bearing capacity remained above 80% of the maximum strength even at R = +4.50% and −4.06%.
Based on the experimental results noted above, it was confirmed that the RC beam with a smaller shear strength margin had lower load bearing and deformation capacity, as shown in a previous study by Watanabe et al. [].
3.2. Failure Pattern
Figure 6 illustrates the crack patterns of each specimen at the loading stage of tensile longitudinal reinforcement yielding, as well as R = 2.0% and 4.0%. In the figure, the blue and red lines indicate cracks formed during positive and negative loading, respectively.
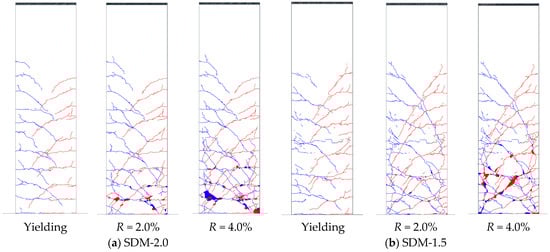
Figure 6.
Damaged state (blue and red lines indicate cracks of positive and negative loading).
In specimen SDM-2.0, flexural cracks were observed along the critical section at a loading cycle of R = 0.0625%, and shear cracks occurred at a 0.5% loading cycle. After tensile longitudinal reinforcement yielding, crushing and spalling of the cover concrete occurred near the critical section at a 2.0% loading cycle. The damage, such as crack widths and concrete crushing area, extended intensely as the lateral drift angle increased; finally, crushing of the core concrete was observed with exposure of longitudinal reinforcement at a 5.0% loading cycle.
Compared to specimen SDM-2.0, SDM-1.5 showed similar crack and concrete spalling patterns until the 2.0% loading cycle. However, the tendency of the shear crack pattern and adhesion failure on the SDM-1.5 specimen with a smaller shear strength margin was more remarkable. In addition, crushing of the core concrete and exposure of longitudinal reinforcement appeared earlier at R = 4.0% in SDM-1.5.
3.3. Distribution of Shear Deformation
Based on the previous research by Uchino et al. [], as shown in Figure 7, the shear deformation of each measured section (δsi) in the axial direction of the specimens was calculated. Figure 8 illustrates the shear deformation distributions of both specimens at the drift angles of R = +1.0% and +1.5%. At R = +1.0%, the shear deformation at a height of approximately 200 mm above the critical section was close to each specimen. However, at R = +1.5%, the shear deformation at the same measured section was 1.42 mm for specimen SDM-1.5, which is approximately 1.6 times larger than that of specimen SDM-2.0. This indicates that the shear deformation of specimen SDM-1.5 tended to be greater than specimen SDM-2.0 at the subsequent drift angles, which means the shear deformation is more dominant in the RC beams with low shear strength margins, consistent with previous research conducted by Maeda et al. [].
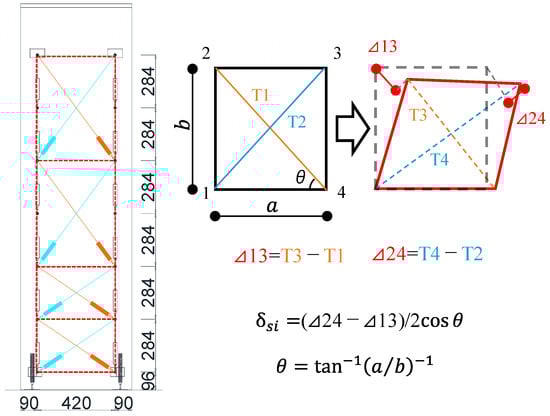
Figure 7.
Calculation method for shear deformation.
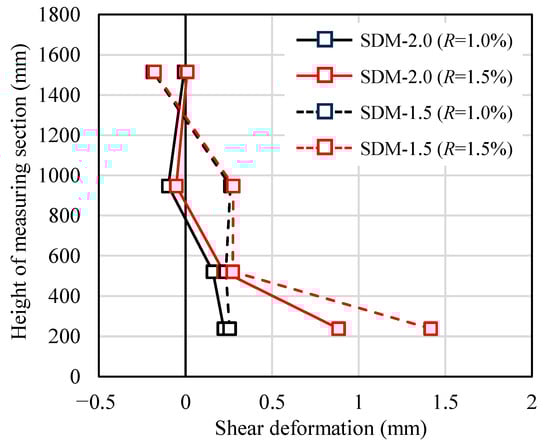
Figure 8.
Comparison of shear deformation distribution.
4. Evaluation of Damage Class and Seismic Capacity Reduction Factor η
4.1. Definition for Damage Class
Damage classification of the specimens was performed based on the damage definition shown in Figure 9 and Table 4. The damage classes of the RC beams are originally defined based on the mechanical properties (engineering demand parameters), such as cracking of concrete, tensile longitudinal reinforcement yielding, and maximum strength in Japanese guidelines (JBDPA, 2015) []. Furthermore, the relationships between the damage class and visual damage information, such as maximum residual crack width, are also defined to easily classify the damage class on-site. Figure 9 schematically illustrates the load carrying capacity, load–deflection curve, and member damage class, and RC members are classified in one of five categories (I through V), as defined in Table 4.
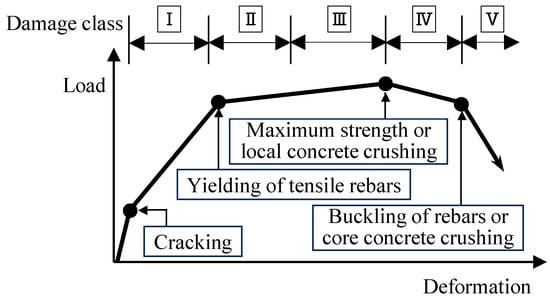
Figure 9.
Damage class definition.
Table 4.
Damage class criteria for ductile RC members [].
4.2. Damage Class
Figure 10 and Figure 11 present the results of damage classification for each specimen based on the mechanical properties and maximum residual crack widths, respectively. In Figure 10, the symbols △, □, ◇, ○, and × indicate the points of concrete cracking, tensile longitudinal reinforcement yielding, local concrete crushing, maximum strength (or remarkable concrete crushing), and 80% of the maximum strength (or core concrete crushing), respectively. In both specimens, as shown in Figure 10 and Figure 11, the damage classes evaluated based on the maximum residual crack widths tended to be overestimated in the post-yield deformation region compared to those evaluated based on mechanical properties. This is due to the fact that the maximum residual crack widths were measured from limited cracks, which were observed in and near the critical section of the specimens.
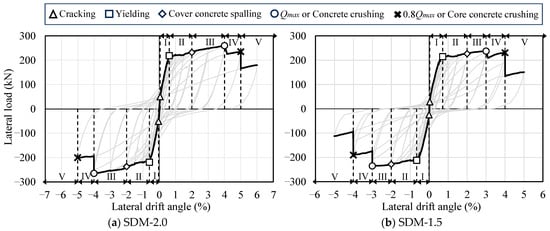
Figure 10.
Damage class based on engineering demand parameters.
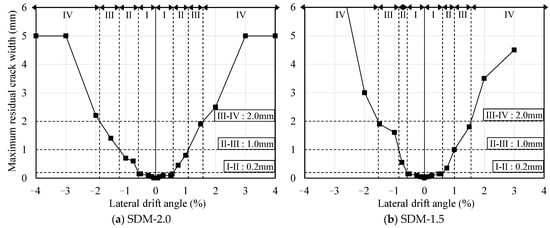
Figure 11.
Damage class based on maximum residual crack widths.
Based on the damage class investigated above, the damage classes for each specimen were finally determined by comprehensively considering mechanical properties and damage development. Here, damage classes up to II were conservatively evaluated by comparing the damage state, including mechanical property variation and the maximum residual crack width, and the higher value was judged as the final damage class. On the other hand, damage classes III and IV were classified based on mechanical property variation, such as spalling of concrete and deterioration of bearing capacity, considering the influence of limited cracking on the maximum residual crack width for each specimen. In addition, a conservative evaluation was conducted for damage class V based on 80% reduction in maximum bearing capacity and core concrete crushing, which are widely used to define the safety limitation for RC structural members, and the higher value was selected.
Table 5 shows the final damage class evaluation results and boundary values of the lateral drift angle to classify the damage class for each specimen. The boundary values of the lateral drift angle that classify damage classes up to III were similar for both specimens. However, as discussed above, because the shear strength margin influenced the deformation capacity and shear deformation distribution of RC beams, the boundary values of the lateral drift angle that classified damage classes above III tended to be smaller in specimen SDM-1.5 compared to SDM-2.0.
Table 5.
Boundary value of lateral drift angle R for damage class.
4.3. Seismic Capacity Reduction Factor η
The seismic capacity reduction factor η of each specimen was calculated based on the previous method developed in the Japanese guidelines (JBDPA, 2015) [], which is defined as the ratio of the absorbable hysteretic energy after an earthquake to the original absorbable energy of structural members, as illustrated in Figure 12. Figure 13 shows the calculated result of factor η for each specimen relating to the damage classes determined in Section 4.2. Table 6 arranges the boundary value of factor η to classify the damage class for each specimen, as shown in Figure 13 with the symbol □, comparing it to the values of the ductile beam defined in the Japanese guidelines (JBDPA, 2015) []. Here, factor η was calculated using a positive loading test only. It was found that the effect of the difference in shear strength margins on the seismic capacity reduction factor η was limited, and the boundary value of factor η was generally consistent with the specified value for the ductile beam.
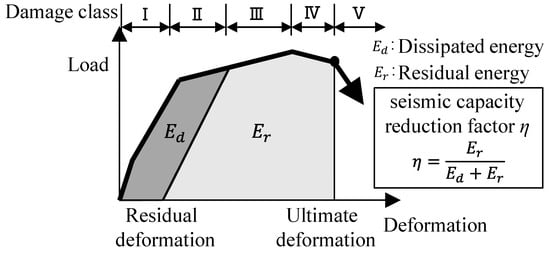
Figure 12.
Conceptual diagram of seismic capacity reduction factor η.
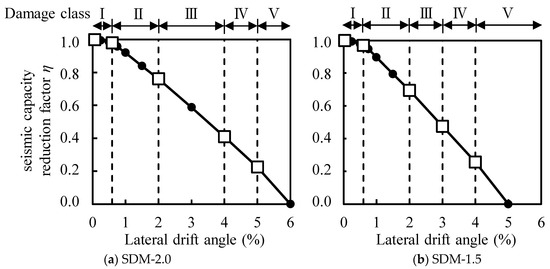
Figure 13.
Calculated results of factor η.
Table 6.
Relationship between damage class and factor η.
5. Correlation Model of Damage Class and Deformation
The ductility ratio μ was applied to develop the correlation model between damage class and deformation. Here, μ is defined as the ratio of the empirical displacement to the yielding displacement. As mentioned above, yielding displacement was confirmed by the strain gauges installed to the longitudinal reinforcement of each specimen. Table 7 shows the boundary values of the ductility ratio that classify the damage classes. Comparing these values of both specimens, the trend was generally similar up to damage class III. Meanwhile, from damage class III onward, a difference in the boundary values of the ductility ratio was observed depending on the shear strength margin of the specimen.
Table 7.
Boundary value of ductility ratio μ for damage class.
Figure 14 shows the proposed correlation models between damage class and ductility ratio for flexural RC beams with ultimate ductility ratios of 6 and 8. Here, the boundary values of the ductility ratio were simplified by applying the approximate values of the detailed calculation results, as shown in Table 8, and the detailed calculation results adopted smaller values for positive and negative loading, as discussed in Table 7. As a result, the correlation model was established by using the ultimate ductility ratio to represent the difference in deformation capacity of RC beams, and the boundary values of the ductility ratio were proposed for classifying damage classes; these would also be applicable to estimate the damage classes of RC beams based on their deformation.
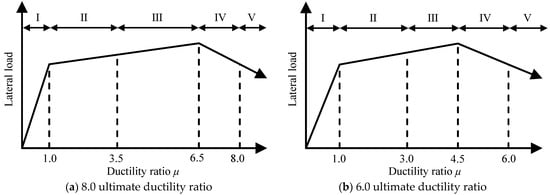
Figure 14.
Correlation model of damage class and ductility ratio μ.
Table 8.
Proposal of relationship between damage class and ductility ratio μ.
6. Conclusions
This paper presented the results of static loading tests on RC beam specimens with different shear strength margins, showing the effect on the deformation capacity and damage pattern of RC beams. Then, the relationship between the damage and deformation of RC beams was investigated. The key findings of this study are summarized as follows:
- Based on the test results, the RC beam specimen with a smaller shear strength margin showed lower lateral load bearing capacity and deformation performance. In this specimen, the failure pattern was also different, for example, the tendency of shear failure was more remarkable, and shear deformation was more dominant.
- The damage classification of RC beam specimens was successfully performed based on the realignment concept, which comprehensively considers mechanical properties and damage development, such as the cracking and crushing of concrete, yielding of reinforcement, and deterioration of lateral load bearing capacity.
- The effect of the shear strength margin on the seismic capacity reduction factor η of RC beams was limited, whereas the specimen with a smaller shear strength margin exhibited lower ultimate deformation capacity.
- The boundary values of the seismic capacity reduction factor η to classify damage classes were similar for both specimens, and they were generally consistent with the specified values for ductile beams in the Japanese guidelines.
- The boundary values of the ductility ratio μ to classify damage classes in both specimens generally showed similar trends up to damage class III. However, after experiencing damage class III, the boundary values of the ductility ratio μ were lower in the specimen with a smaller shear strength margin.
- Correlation models of damage class and ductility ratio were proposed by applying ultimate ductility ratios of 6 and 8 to represent the difference in deformation capacity of RC beams, and the boundary values of the ductility ratio μ for classifying damage classes were also specified.
This paper focused on the relationship between damage class and deformation of RC beams. The proposed correlation models of damage class and deformation should be applicable to future analytical studies focused on evaluating the residual seismic capacity of weak-beam RC structures. Moreover, since this study utilized two specimens with different shear strength margins adjusted using the transverse reinforcement ratio and yield strength of transverse reinforcement, loading tests should be performed on specimens with varying deformation capacities, and their influencing factors should be assessed to further enhance the applicability of the correlation models.
Author Contributions
Conceptualization, C.Q.; methodology, C.Q. and H.C.; software, C.Q.; validation, C.Q., H.C. and K.J.; formal analysis, H.C.; investigation, C.Q.; resources, C.Q. and H.C.; data curation, H.C. and K.J.; writing—original draft preparation, C.Q.; writing—review and editing, H.C.; visualization, K.J.; supervision, H.C.; project administration, C.Q. and H.C.; funding acquisition, C.Q. All authors have read and agreed to the published version of the manuscript.
Funding
This research was funded by the Research Fellowships for Young Scientists of Japan Society for the Promotion of Science, grant number 20K14815.
Data Availability Statement
The original contributions presented in this study are included in the article. Further inquiries can be directed to the author.
Conflicts of Interest
The authors declare no conflict of interest.
References
- The Japan Building Disaster Prevention Association (JBDPA). Guidelines for Post-Earthquake Damage Evaluation and Rehabilitation; JBDPA: Tokyo, Japan, 1991; (revised in 2001 and 2015). [Google Scholar]
- The Japan Building Disaster Prevention Association (JBDPA). Standard for Seismic Evaluation of Existing Reinforced Concrete Buildings; JBDPA: Tokyo, Japan, 1977; (revised in 1990, 2001 and 2017). [Google Scholar]
- Bunno, M.; Maeda, M.; Nagata, M. A study of the damage level estimation of RC buildings based on residual seismic capacity of members. Proc. Jpn. Concr. Inst. 2000, 22, 1447–1452. [Google Scholar]
- Maeda, M.; Bunno, M. Post-earthquake damage evaluation for RC buildings based on residual seismic capacity in structural members. In Proceedings of the US-Japan Workshop on Performance Based Seismic Design of Reinforced Concrete Building Structures, Seattle, WA, USA, 19–20 August 2001; pp. 19–20. [Google Scholar]
- Bunno, M.; Yukimura, N.; Maeda, M.; Kabeyazawa, T. Experimental study on behavior of reinforced concrete beams under axial restriction. Proc. Jpn. Concr. Inst. 1999, 21, 517–522. [Google Scholar]
- Bunno, M.; Nagayama, K.; Maeda, M. An evaluation of residual seismic capacity of reinforced concrete columns based on structural damage. Proc. Jpn. Concr. Inst. 2001, 23, 259–264. [Google Scholar]
- Ito, S.; Takahashi, K.; Maeda, M. Evaluation on residual seismic capacity of reinforced concrete columns and walls with shear failure. Proc. Jpn. Concr. Inst. 2013, 35, 859–864. [Google Scholar]
- Bao, S.; Matsukawa, K.; Maeda, M. Residual seismic capacity evaluation method for RC buildings with weak beam. In Proceedings of the 13th Japan Earthquake Engineering Symposium, Ibaraki, Japan, 17–20 November 2010; pp. 3255–3260. [Google Scholar]
- Miura, K.; Maeda, M.; Matsukawa, K.; Takahashi, K. Evaluation method of contribution factor of structural member for seismic capacity of single-story RC frames considering strength and energy dissipation (part 1). J. Struct. Constr. Eng. 2012, 77, 1283–1290. [Google Scholar]
- Quan, C.; Takahashi, N.; Choi, H.; Nakano, Y. Residual seismic capacity evaluation of overall weak-beam RC frame based on energy absorption capacity. J. Struct. Constr. Eng. 2013, 78, 1931–1938. [Google Scholar] [CrossRef]
- Fujita, K.; Miura, K.; Tabata, Y.; Maeda, M.; Shegay, A.; Seki, M. Post-earthquake capacity evaluation of RC frame structures with multi-story flexural walls. J. Struct. Constr. Eng. 2021, 86, 1084–1094. [Google Scholar] [CrossRef]
- Architectural Institute of Japan (AIJ). Reconnaissance Report of the 1968 Tokachi-Oki Earthquake; AIJ: Tokyo, Japan, 1968. [Google Scholar]
- Architectural Institute of Japan (AIJ). Reconnaissance Report of the 1978 Miyagiken-Oki Earthquake; AIJ: Tokyo, Japan, 1978. [Google Scholar]
- Architectural Institute of Japan (AIJ). School Buildings Reconnaissance Report of the 1995 Kobe Earthquake; AIJ: Tokyo, Japan, 1995. [Google Scholar]
- Institute of Industrial Science of the University of Tokyo (IIS). Earthquake and Tsunami Reconnaissance Report of the 2011 Great East Japan Earthquake; Architectural Institute of Japan: Tokyo, Japan, 2012. [Google Scholar]
- Jung, M.; Maeda, M.; Tasai, A.; Nagata, M. Estimation of residual seismic performance for RC buildings damaged due to earthquake. J. Struct. Eng. 2002, 48B, 189–196. [Google Scholar]
- Architectural Institute of Japan (AIJ). Structural Design of Reinforced Concrete Buildings; AIJ: Tokyo, Japan, 1965; (revised in 2020). [Google Scholar]
- Architectural Institute of Japan (AIJ). AIJ Standard for Structural Calculation of Reinforced Concrete Structures; AIJ: Tokyo, Japan, 1971; (revised in 2024). [Google Scholar]
- Watanabe, H.; Korenaga, T.; Nakano, K.; Matsuzaki, Y. Experimental study on evaluation of ductility of reinforced concrete beams. J. Struct. Constr. Eng. 2002, 67, 161–168. [Google Scholar] [CrossRef] [PubMed]
- Uchino, S.; Sato, R.; Tajima, K.; Shirai, N. Effectiveness of steel brace reinforcement for a row-span RC frame with walls using round steel bars as main reinforcement. Proc. Jpn. Concr. Inst. 2015, 37, 841–846. [Google Scholar]
- Maeda, M.; Arizono, Y.; Yukimura, N. Experimental Study on Evaluation of Deformation in R/C Beams. Proc. Jpn. Concr. Inst. 1997, 19, 861–866. [Google Scholar]
Disclaimer/Publisher’s Note: The statements, opinions and data contained in all publications are solely those of the individual author(s) and contributor(s) and not of MDPI and/or the editor(s). MDPI and/or the editor(s) disclaim responsibility for any injury to people or property resulting from any ideas, methods, instructions or products referred to in the content. |
© 2025 by the authors. Licensee MDPI, Basel, Switzerland. This article is an open access article distributed under the terms and conditions of the Creative Commons Attribution (CC BY) license (https://creativecommons.org/licenses/by/4.0/).