Article

Pilot Study of 3D Spatial Distribution of α-Pinene Emitted by Norway Spruce (L.) Karst Recently Infested by Ips typographus (L. 1758) (Coleoptera: Scolytinae)

by
Barbora Stříbrská
,
Antonioni Acacio Campos Moliterno
,
Tereza Hüttnerová
,
Martin Leiner
,
Peter Surový
and
Anna Jirošová
*
Faculty of Forestry and Wood Sciences, Czech University of Life Sciences Prague, 16500 Prague, Czech Republic
*
Author to whom correspondence should be addressed.
Forests 2024, 15(1), 10; https://doi.org/10.3390/f15010010
Submission received: 14 November 2023 / Revised: 14 December 2023 / Accepted: 17 December 2023 / Published: 20 December 2023
(This article belongs to the Special Issue Ecology and Management of Forest Pests—Series II)

Abstract

:
The Eurasian Spruce Bark Beetle (Ips typographus) (L. 1758) (Coleoptera: Scolytinae) poses a significant threat to Eurasia’s Norway spruce (Picea abies) (L.) Karst, forests. Early detection of infested trees is crucial to control beetle outbreaks and allow salvage logging before the next generation emerges. Besides traditional methods, new approaches focus on monitoring volatile organic compounds, mainly monoterpenes, emitted by infested trees. Using analytical chemistry, we studied the distribution of these compounds, particularly α-pinene, around infested trees. In lab trials, we optimized α-pinene detection using dynamic absorption and solid-phase microextraction (SPME), analyzed by gas chromatography with flame ionization detection (GC-FID). We conducted forest trials, revealing varying α-pinene abundance due to changing conditions. However, consistent trends emerged: levels were highest near the infested tree stem and 1.3 m above ground in the first trial and at a 1 m distance from the infested stem in the second. We generated a three-dimensional cloud depicting the distribution of α-pinene around infested trees in their natural habitat. These findings open avenues for detecting bark beetles on a large scale by mapping elevated concentrations of volatile organic compounds emitted by infested trees, potentially leading to alternative pest management methods. Scanning methods, such as electronic sensors combined with remote sensing, hold promise for this application.

Graphical Abstract

1. Introduction

The Eurasian Spruce Bark Beetle Ips typographus (L. 1758) (Coleoptera: Scolytinae) is the main pest of Norway spruce, Picea abies (L.) Karst. forests in the Central European region. Over the past decade, the combination of ongoing climate change, economically driven silvicultural practices, and the presence of spruce stands in areas beyond their natural range have weakened the natural defense mechanisms of trees and resulted in the occurrence of severe bark beetle spreading [1]. In the Czech Republic, outbreaks started after severe drought events in 2015 and 2018 [2] and led to an exponential increase in salvage logging volume from 2017 to 2020, with the volume rising from approximately 5.9 million m3 in 2017 to 26.2 million m3 in 2020 [3,4] (Figure S1).
The initial step in managing a bark beetle outbreak is early detection of newly infested trees to enable timely salvage before the emergence of offspring [4]. Forest keepers typically rely on traditional methods, which involve personally observing the boring dust produced by infesting beetles [5]. However, during bark beetle outbreaks in large, forested areas, this approach has severe limitations, often resulting in the exponential spread of the beetles.
Hence, an alternative method for early detection on a large scale is needed. Remote sensing techniques have been extensively investigated, using the detection of different indicators from spectral features to temperature [6] and recently also involving chemical substances (Sentinel SP) [7].
Recent research by [8] has proposed measuring the emission of volatile organic compounds (VOCs) from infested spruce as an indicator of bark beetle attacks. Furthermore, various methods for detecting these VOCs at different developmental stages have been introduced. Current research is investigating the utilization of an electronic nose equipped with nonspecific sensors for VOC detection [9]. Likewise, nonspecific metal oxide sensors have been mounted on UAVs to assess the concentration of α-pinene in forest environments [10]. Notably, natural olfaction systems of dogs trained to detect bark beetle pheromones have proven more effective in finding infested trees in cooperation with their dog handler compared to human experts only [11,12].
The VOC emitted by conifer mainly consists of hemi- and monoterpenes, which are produced as defense secondary metabolites. The conifer’s immediate defense mechanism against wood-boring insects is the exudation of constitutive resin, which has a toxic and immobilizing effect on beetles [13]. In the later stages of a bark beetle attack, the production of resin is induced in the newly formed resin ducts in the phloem, xylem, and bark [14]. The resin is a mixture of terpenic compounds. The monoterpenes are volatile and form the main content of VOCs emitted by conifers. In spruce, α-pinene, β-pinene, Δ-carene, limonene, β-phellandrene, camphene, and myrcene dominate [15] but resin also contains sesquiterpenes and a high content of highly viscous diterpenes [16,17]. Oxidized forms of all terpenes are also present.
In addition to resin emissions from the stem, volatile terpenes are also emitted from the needles in the canopy of conifers [18,19]. The emission rate of volatile terpenes from healthy trees is influenced by various macro- and microclimatic conditions, such as temperature and humidity [17,20]. Different temperatures, and consequently varying VOC emissions, are observed in clearings and forest edges within fragmented forests [17,21]. Furthermore, VOC emissions in conifer forests exhibit vertical variations [22] and follow a diurnal rhythm dependent on tree physiological processes [19]. The terpenes emissions from conifer forests are widely discussed in the context of terpenes as a free radical source in the atmosphere [23,24,25], because hemi and monoterpenes are photochemically reactive compounds that affect ozone and carbon monoxide concentrations and their oxidation products can participate in the formation of secondary organic aerosol and cloud condensation nuclei [26].
When Norway spruces are attacked by bark beetles, the content of emitted terpenes from the stem significantly increases during the first two weeks of infestation. This growth is primarily attributed to the opening of constitutive resin storage and is quantified in the close vicinity of the stem. Different methods used for quantification have yielded a wide range of results, ranging from a 10 to 100-fold upturn [8,27,28]. The dominant compound in emissions was always α-pinene, representing the time and spatial distribution of the other main monoterpenes [8]. The bouquet of infested trees also includes the aggregation pheromone produced by bark beetles. Beetles use this scent for navigation to aggregate, allowing them to overcome the tree’s defense during the infestation [29]. The content of bark beetle pheromones is several orders of magnitude lower than that of α-pinene in forests [30]. However, beetles are capable of discerning this signal from the background of host odors thanks to specialized receptors on their antennae, the organs responsible for perceiving smells [31]. Furthermore, beetles may orient themselves by detecting host compounds, primarily terpenes, when choosing a suitable host tree or habitat [32]. They also have specialized receptors for host compounds [33].
Numerous studies have investigated monoterpenes emitted by conifers in both laboratory and natural conditions. In the laboratory, collection systems can be readily optimized, as detailed in a comprehensive review [34]. In field conditions, VOC collection is more complex, and various techniques have been employed to address specific research questions [35]. The most common approach involves dynamic headspace sampling with compound collection onto sorbents, followed by extraction into solvents or thermal desorption. Additionally, solid-phase microextraction methods have been utilized (as shown in Table 1) [36,37].
To study emissions on an ecosystem scale, researchers have employed various instrumental techniques, such as proton-transfer-reaction-time-of-flight (PTR-TOF) [46,47,48] mass spectrometry for quantifying monoterpene fluxes [19] or specialized gas chromatographs installed in situ at collection sites. However, these instruments can be expensive and lack portability, restricting data collection to a limited number of sites [49].
Hypothesis and objectives: This study is founded on a previously proposed concept suggesting that the number of volatile organic compounds emitted by trees, particularly monoterpenes, significantly increases within two weeks of bark beetle infestation [8]. This increase can serve as a measurable characteristic upon which the foundation of a newly developed alternative early bark beetle detection method may be based.
Our objectives were to optimize the collection of α-pinene emissions from spruce logs subjected to a controlled simulative bark beetle infestation in the laboratory and consequently detect the outdoor 3D dispersion of monoterpenes, represented by α-pinene, in the surroundings of freshly infested spruce trees at horizontal and vertical distances. We employed analytical chemistry methods for collecting VOCs, which are not typically used for VOC collection in open environments.
Particular objectives were:
1. Assess the distribution of α-pinene at different distances from and heights within a simulatively infested log pile in the laboratory, considering specific temperature conditions.
2. Validate the feasibility of measuring the distribution of α-pinene under actual field conditions, specifically focusing on naturally Ips typographus-infested trees within a forest environment.
3. Consider other influencing factors, such as temperature, wind speed, and the immediate surroundings of the forest.
4. Compare the effectiveness of the Solid-Phase Microextraction (SPME) method with HayeSep-Q® sorbent cartridges, which involve drawing air through them using air pumps.

2. Materials and Methods

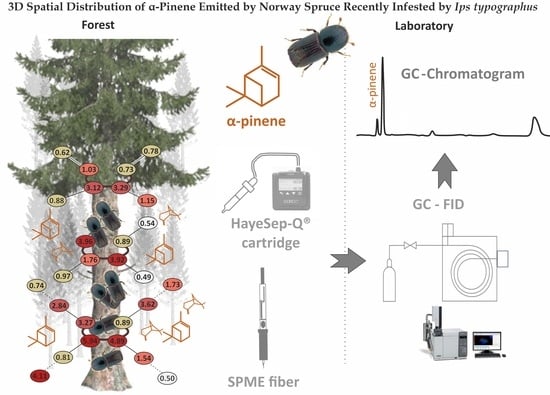
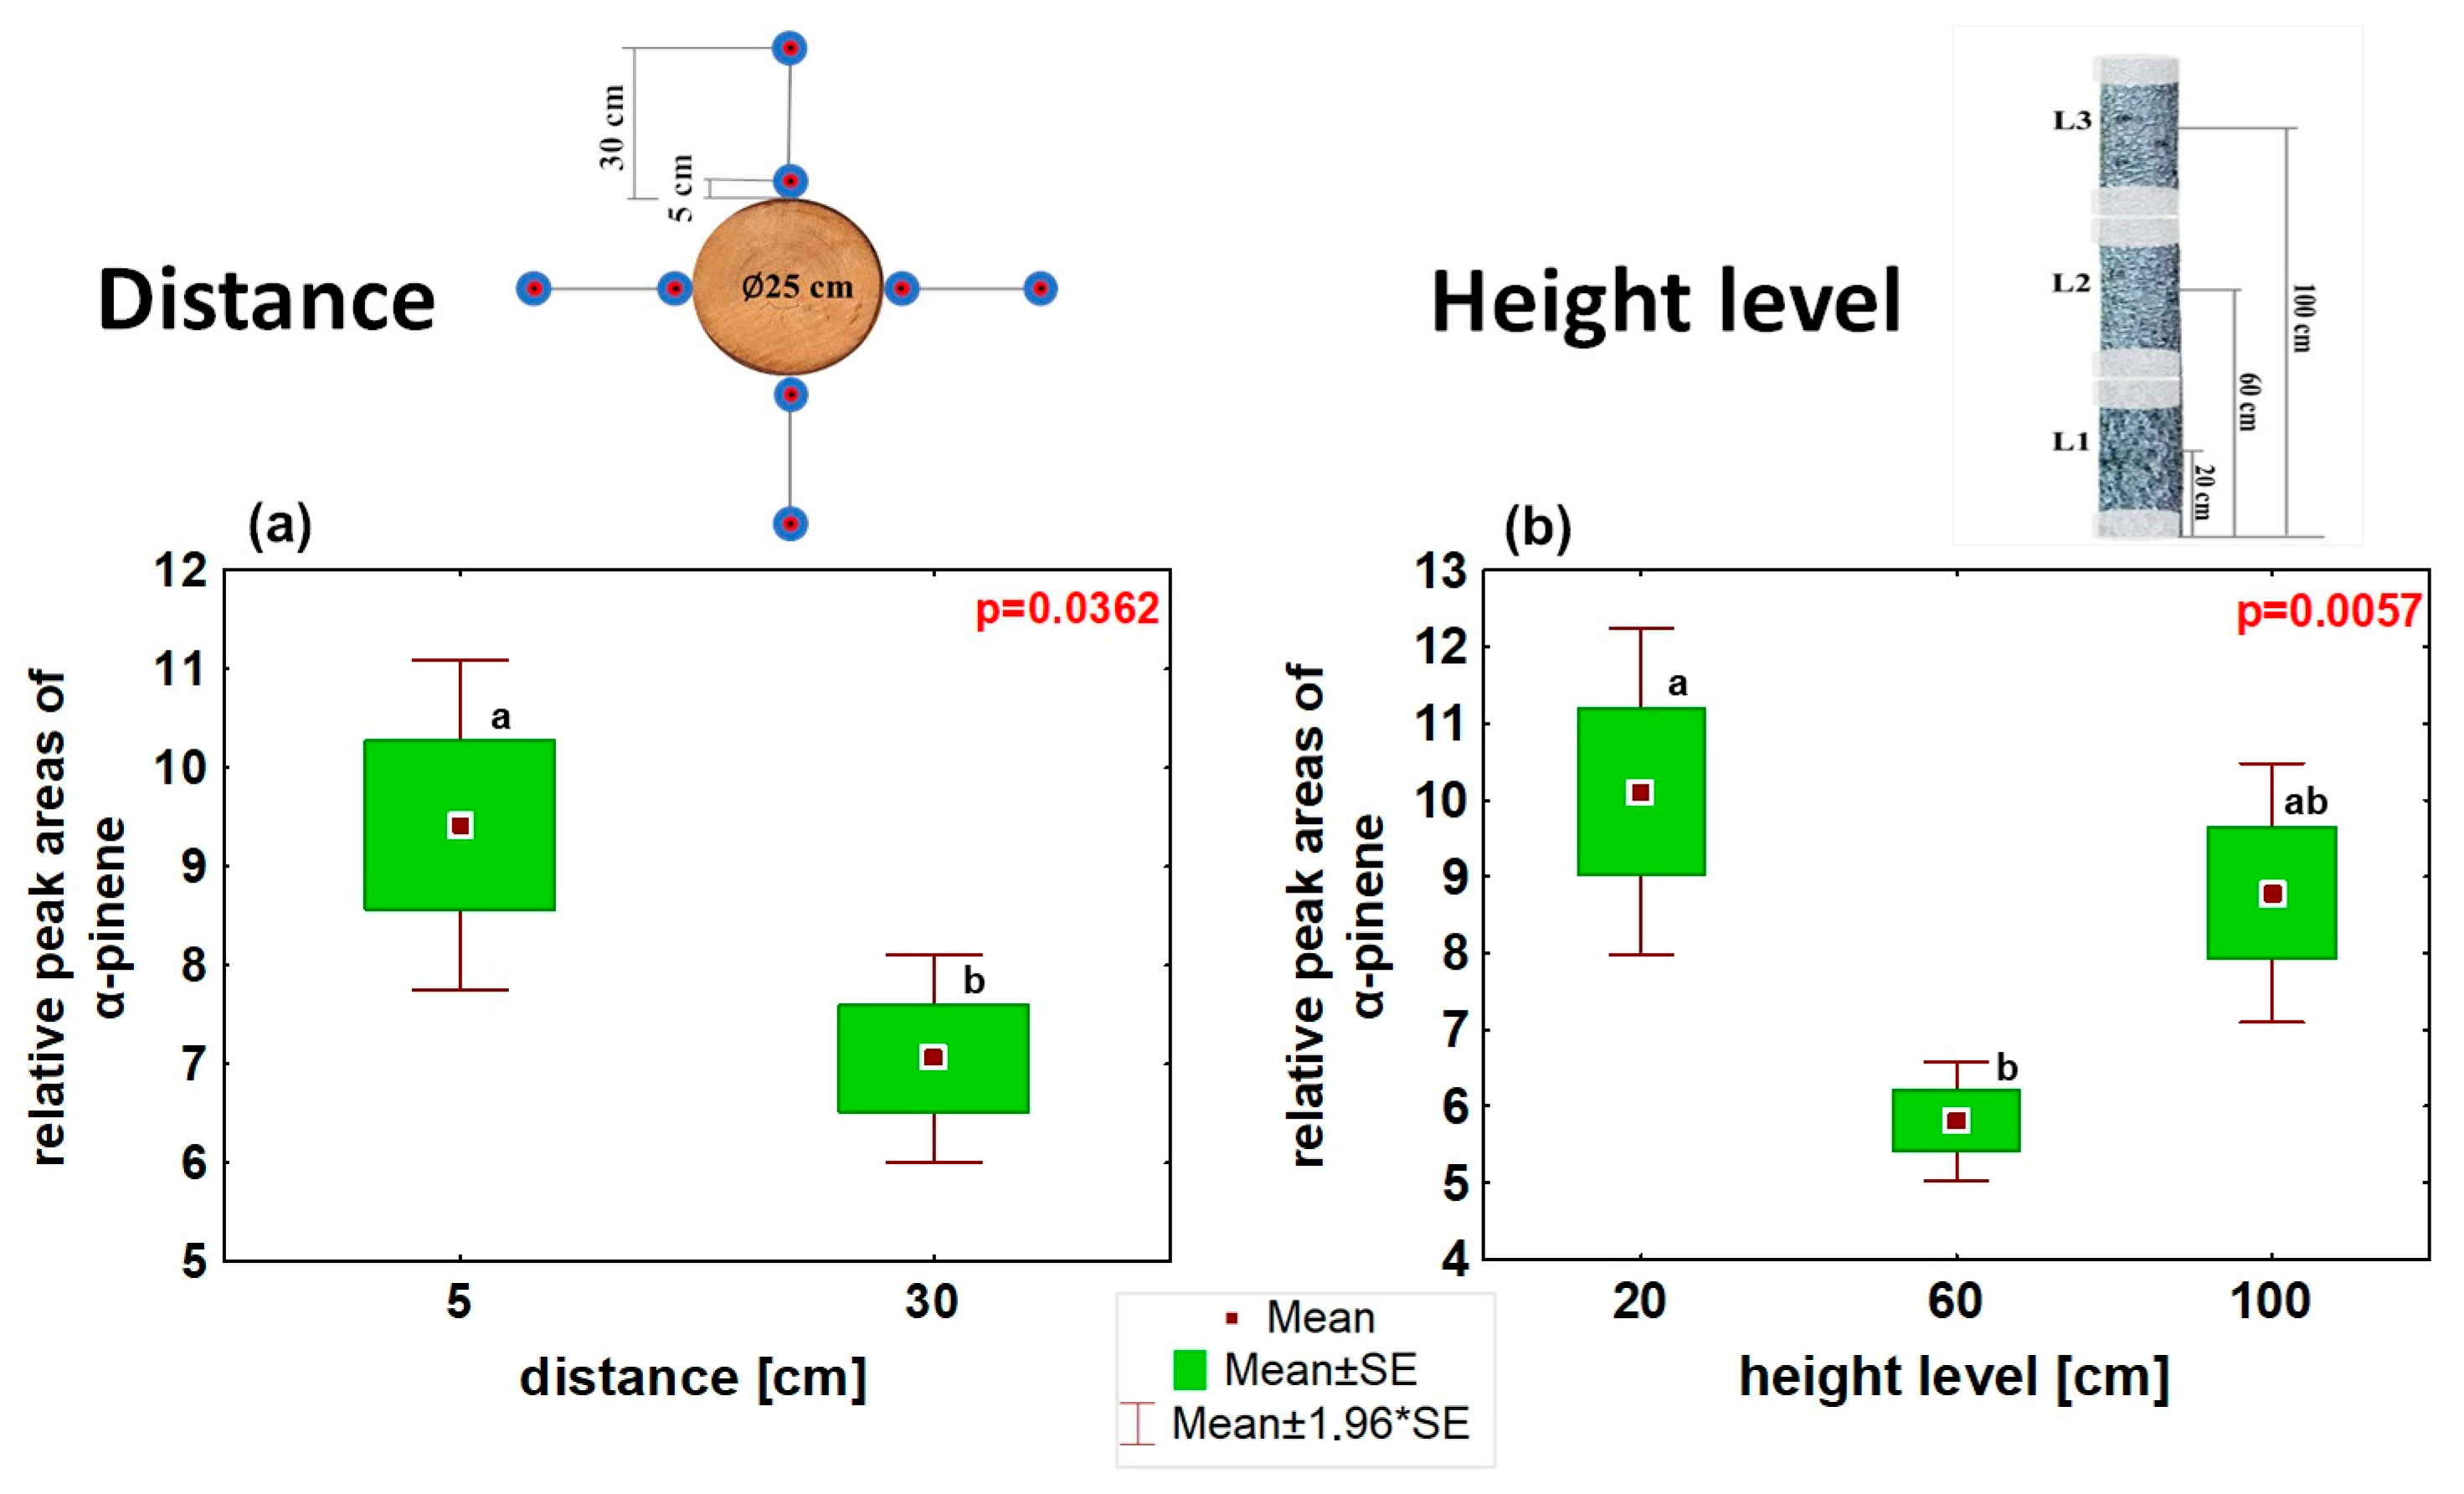
2.1. Optimization of VOC Collection from Simulatively Infested Spruce Logs in a Laboratory

The experiments were conducted under laboratory conditions (25 ± 1 °C, humidity 60% ± 10%) using three fresh-cut logs (height of 40, diameter of 25 cm) of Picea abies previously stored in a cold room (−5 °C). The experiment was repeated three times at one-week intervals. Prior of all repetitions, logs were acclimated for 24 h before volatile collection in the conditions described above. Logs were arranged vertically in piles from the floor: The lowest log represented level 1—L1 (20 cm), the middle log level 2—L2 (60 cm), and the upper log level 3—L3 (100 cm) (Figure 1a). To prevent unwanted VOC emissions from fresh-cut logs, the upper and lower exposed surfaces were covered with PE plastic film.
The bark beetle attack was simulated by drilling holes (Ø 2 mm × 0.3 cm deep) into the bark and phloem on the surface of the logs (100 holes per log, spaced in 5 cm spin) to mimic the production of VOC emissions during bark beetle infestation.
VOCs were collected from each of the three levels (L1, L2, and L3) at two distances, 5 cm and 30 cm from the bark surface, using Solid-Phase Microextraction (SPME) fibers (PDMS/CAR/DVB, Supelco, PA, USA) as shown in Figure 1b. The SPME fibers were fixed in protective hard plastic cylindrical chambers hung in an open space (7.2 cm high, Ø 5.2 cm, material PP, Merci, CZE), with an open bottom and a hole covered by septa in the upper lid to hold the fiber. To follow the distance and cardinal directions described above, the chambers in the experimental apparatus were fixed by metal wires.
SPME collection was conducted for 15 min, beginning 2 h after drilling, under controlled conditions (25 ± 1 °C, humidity 60% ± 10%). A total of 24 samples were taken, with 8 samples per level (n = 24).

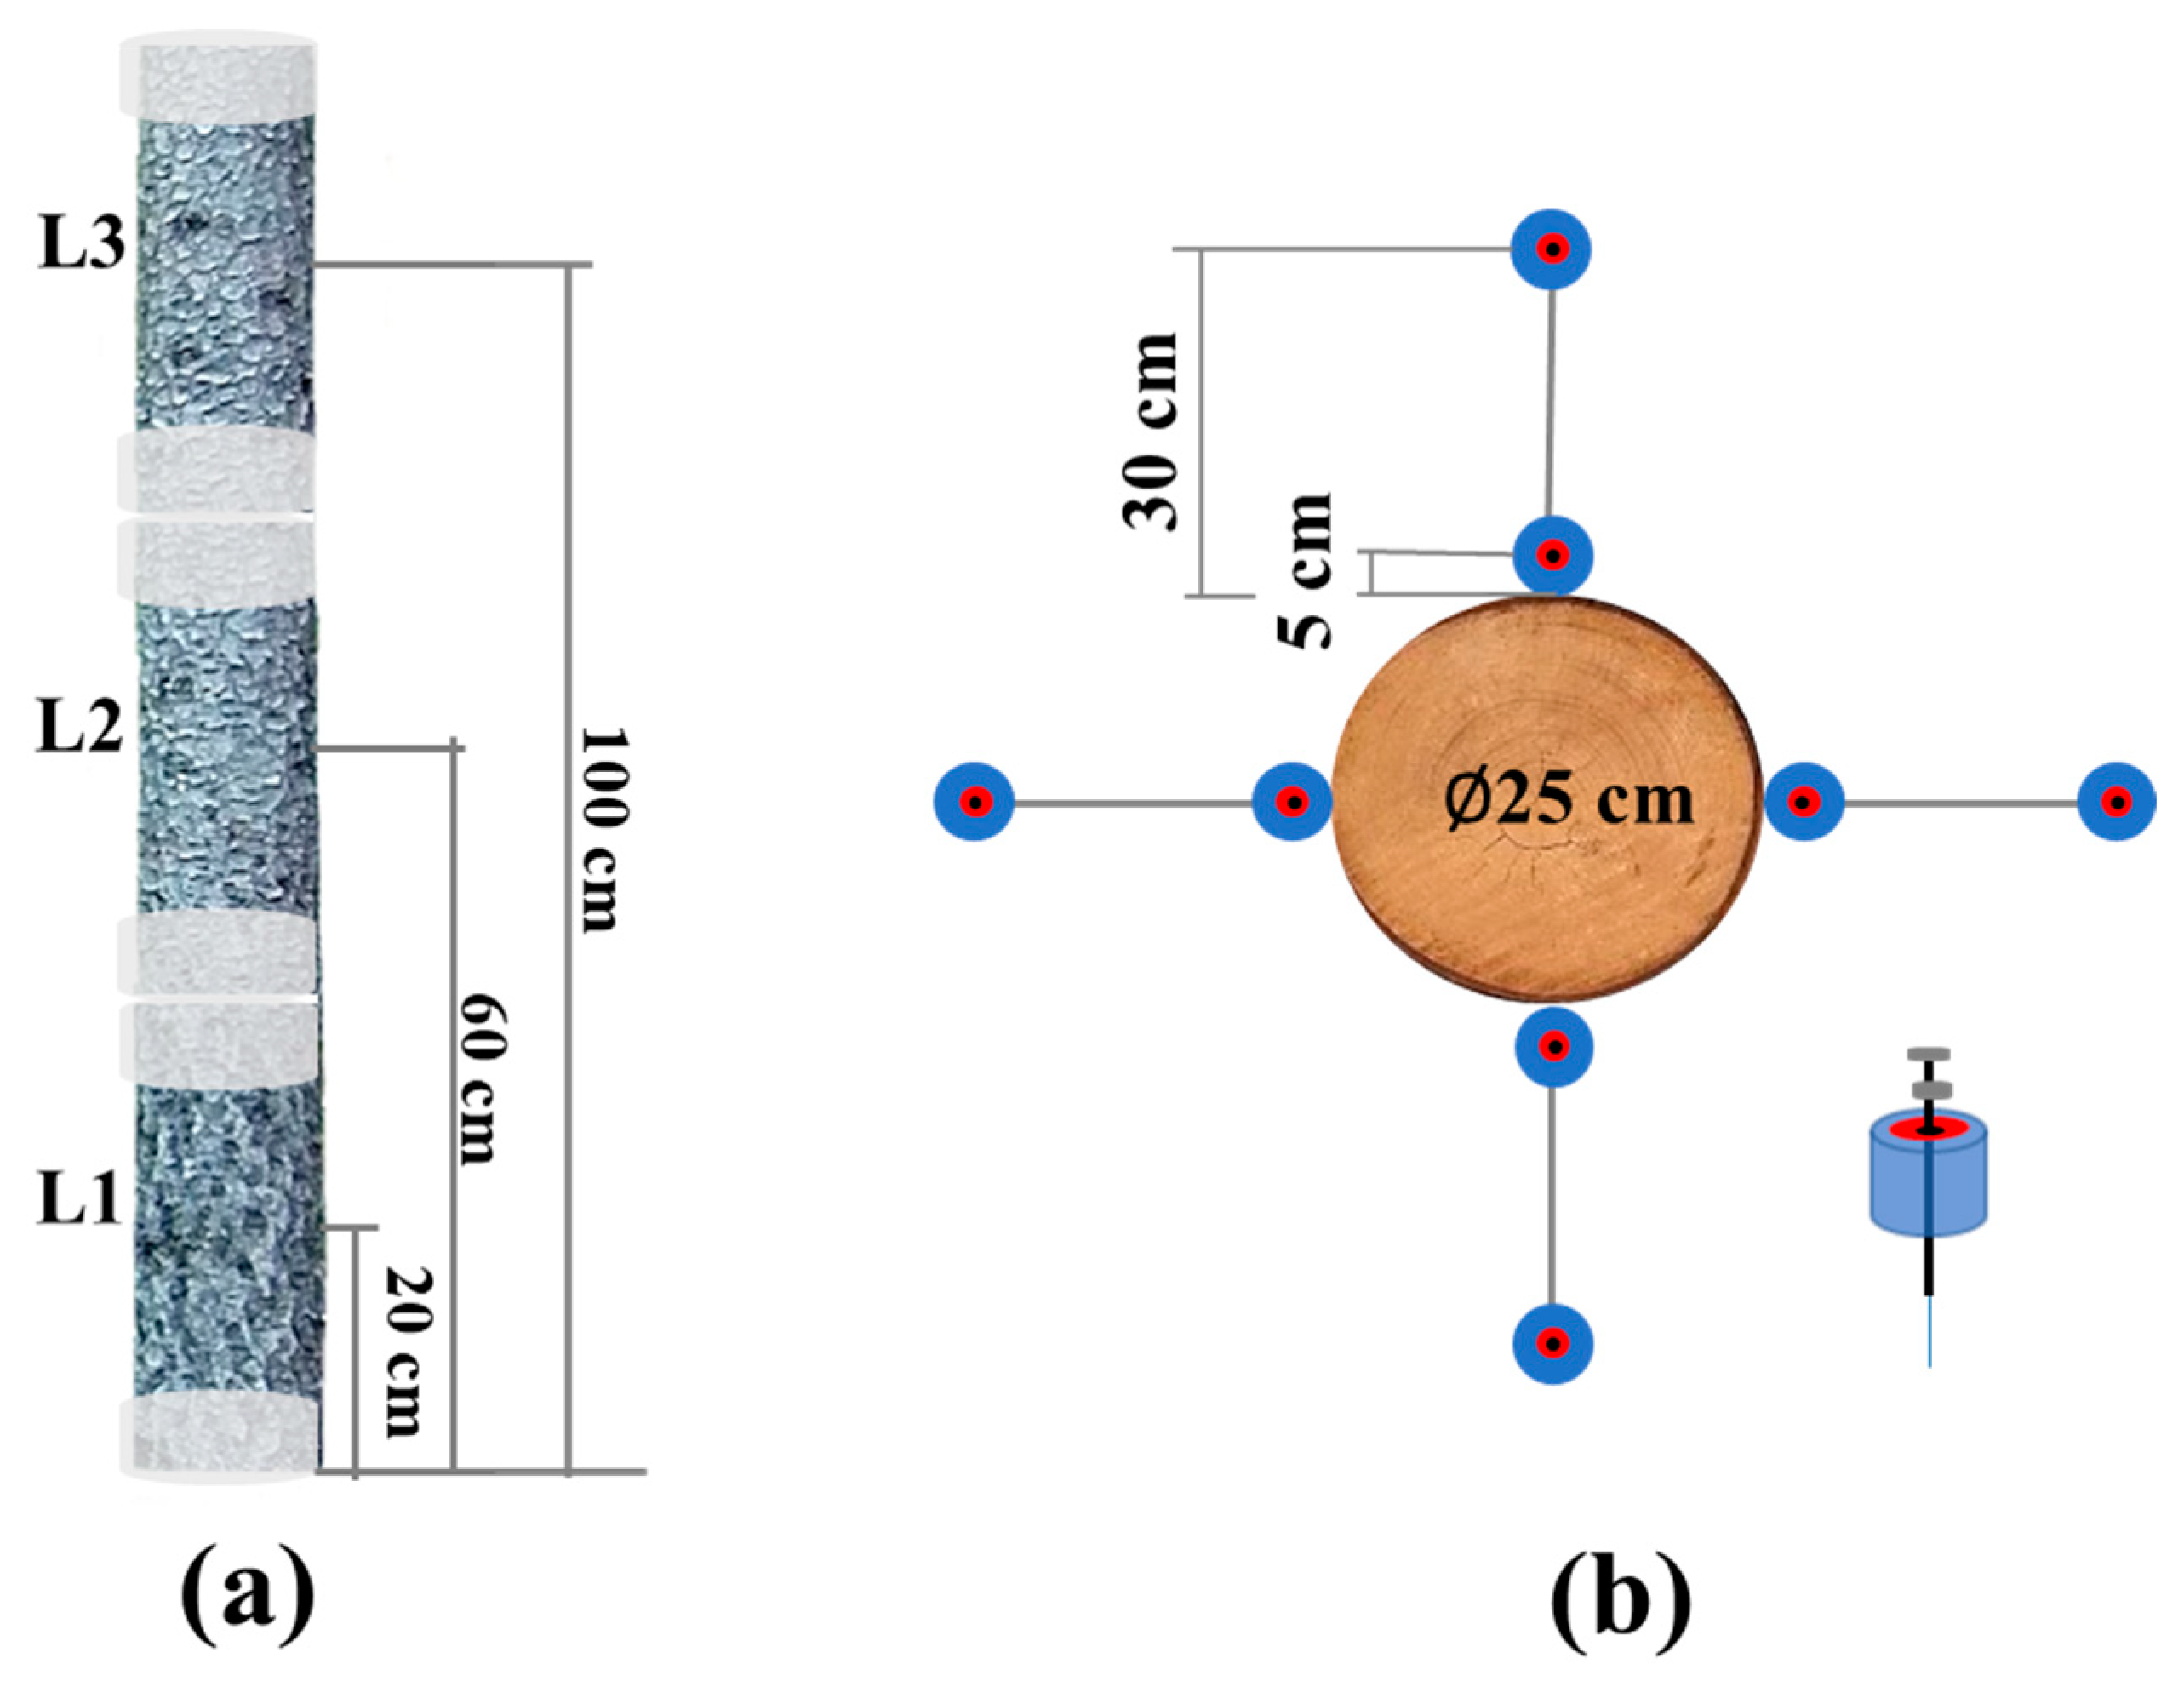
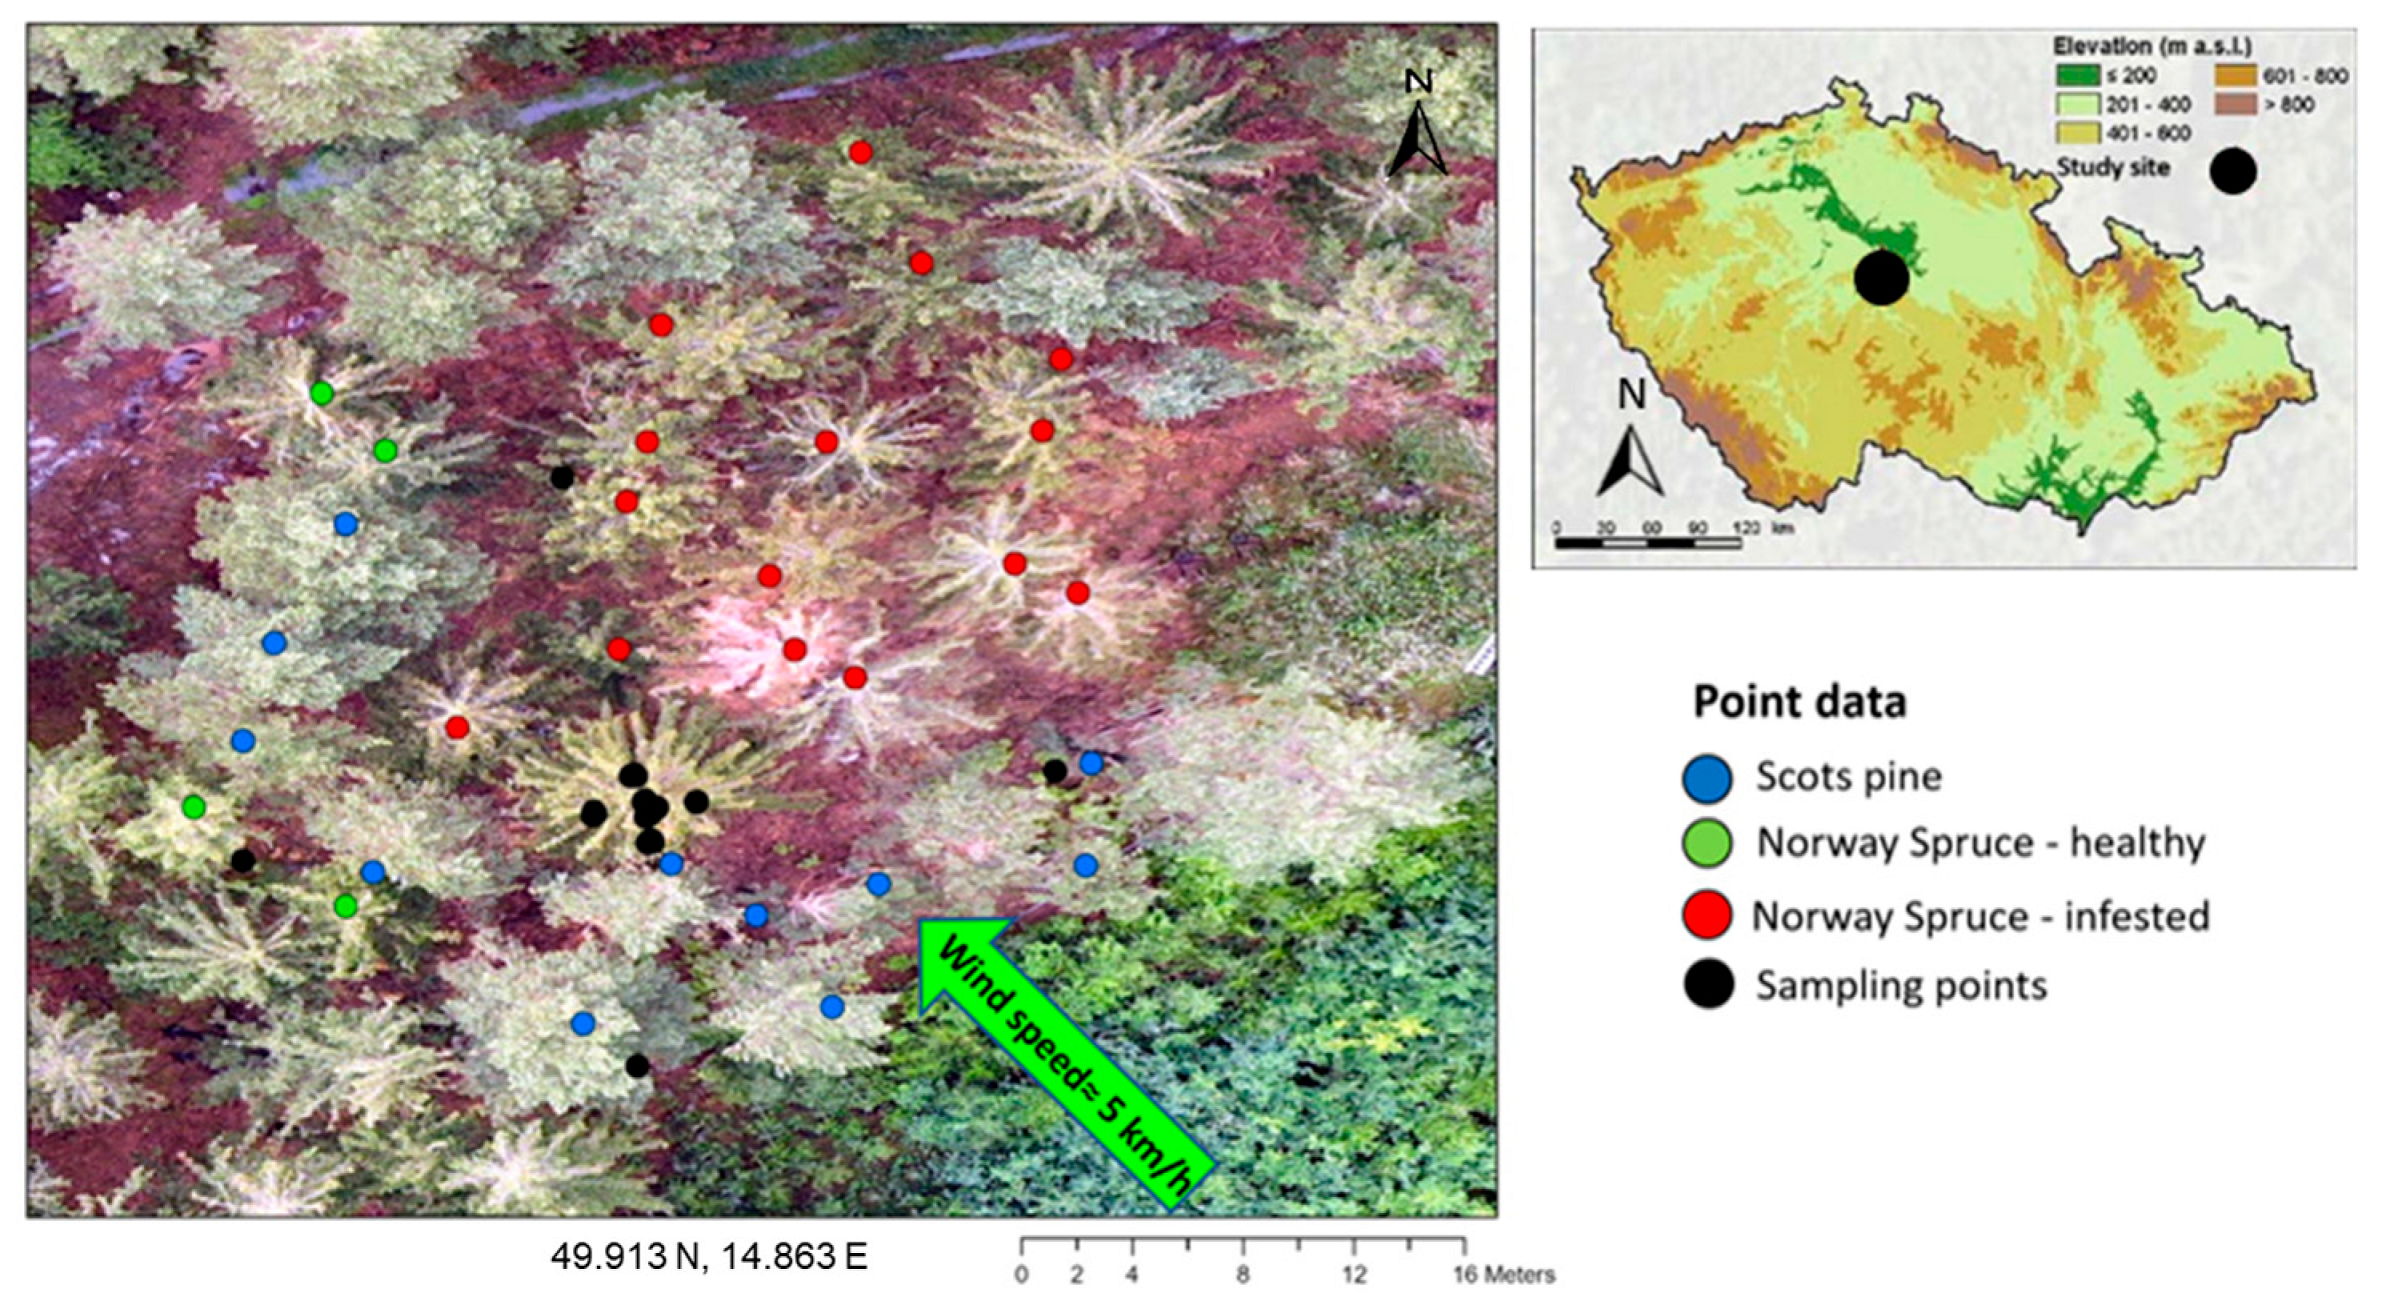
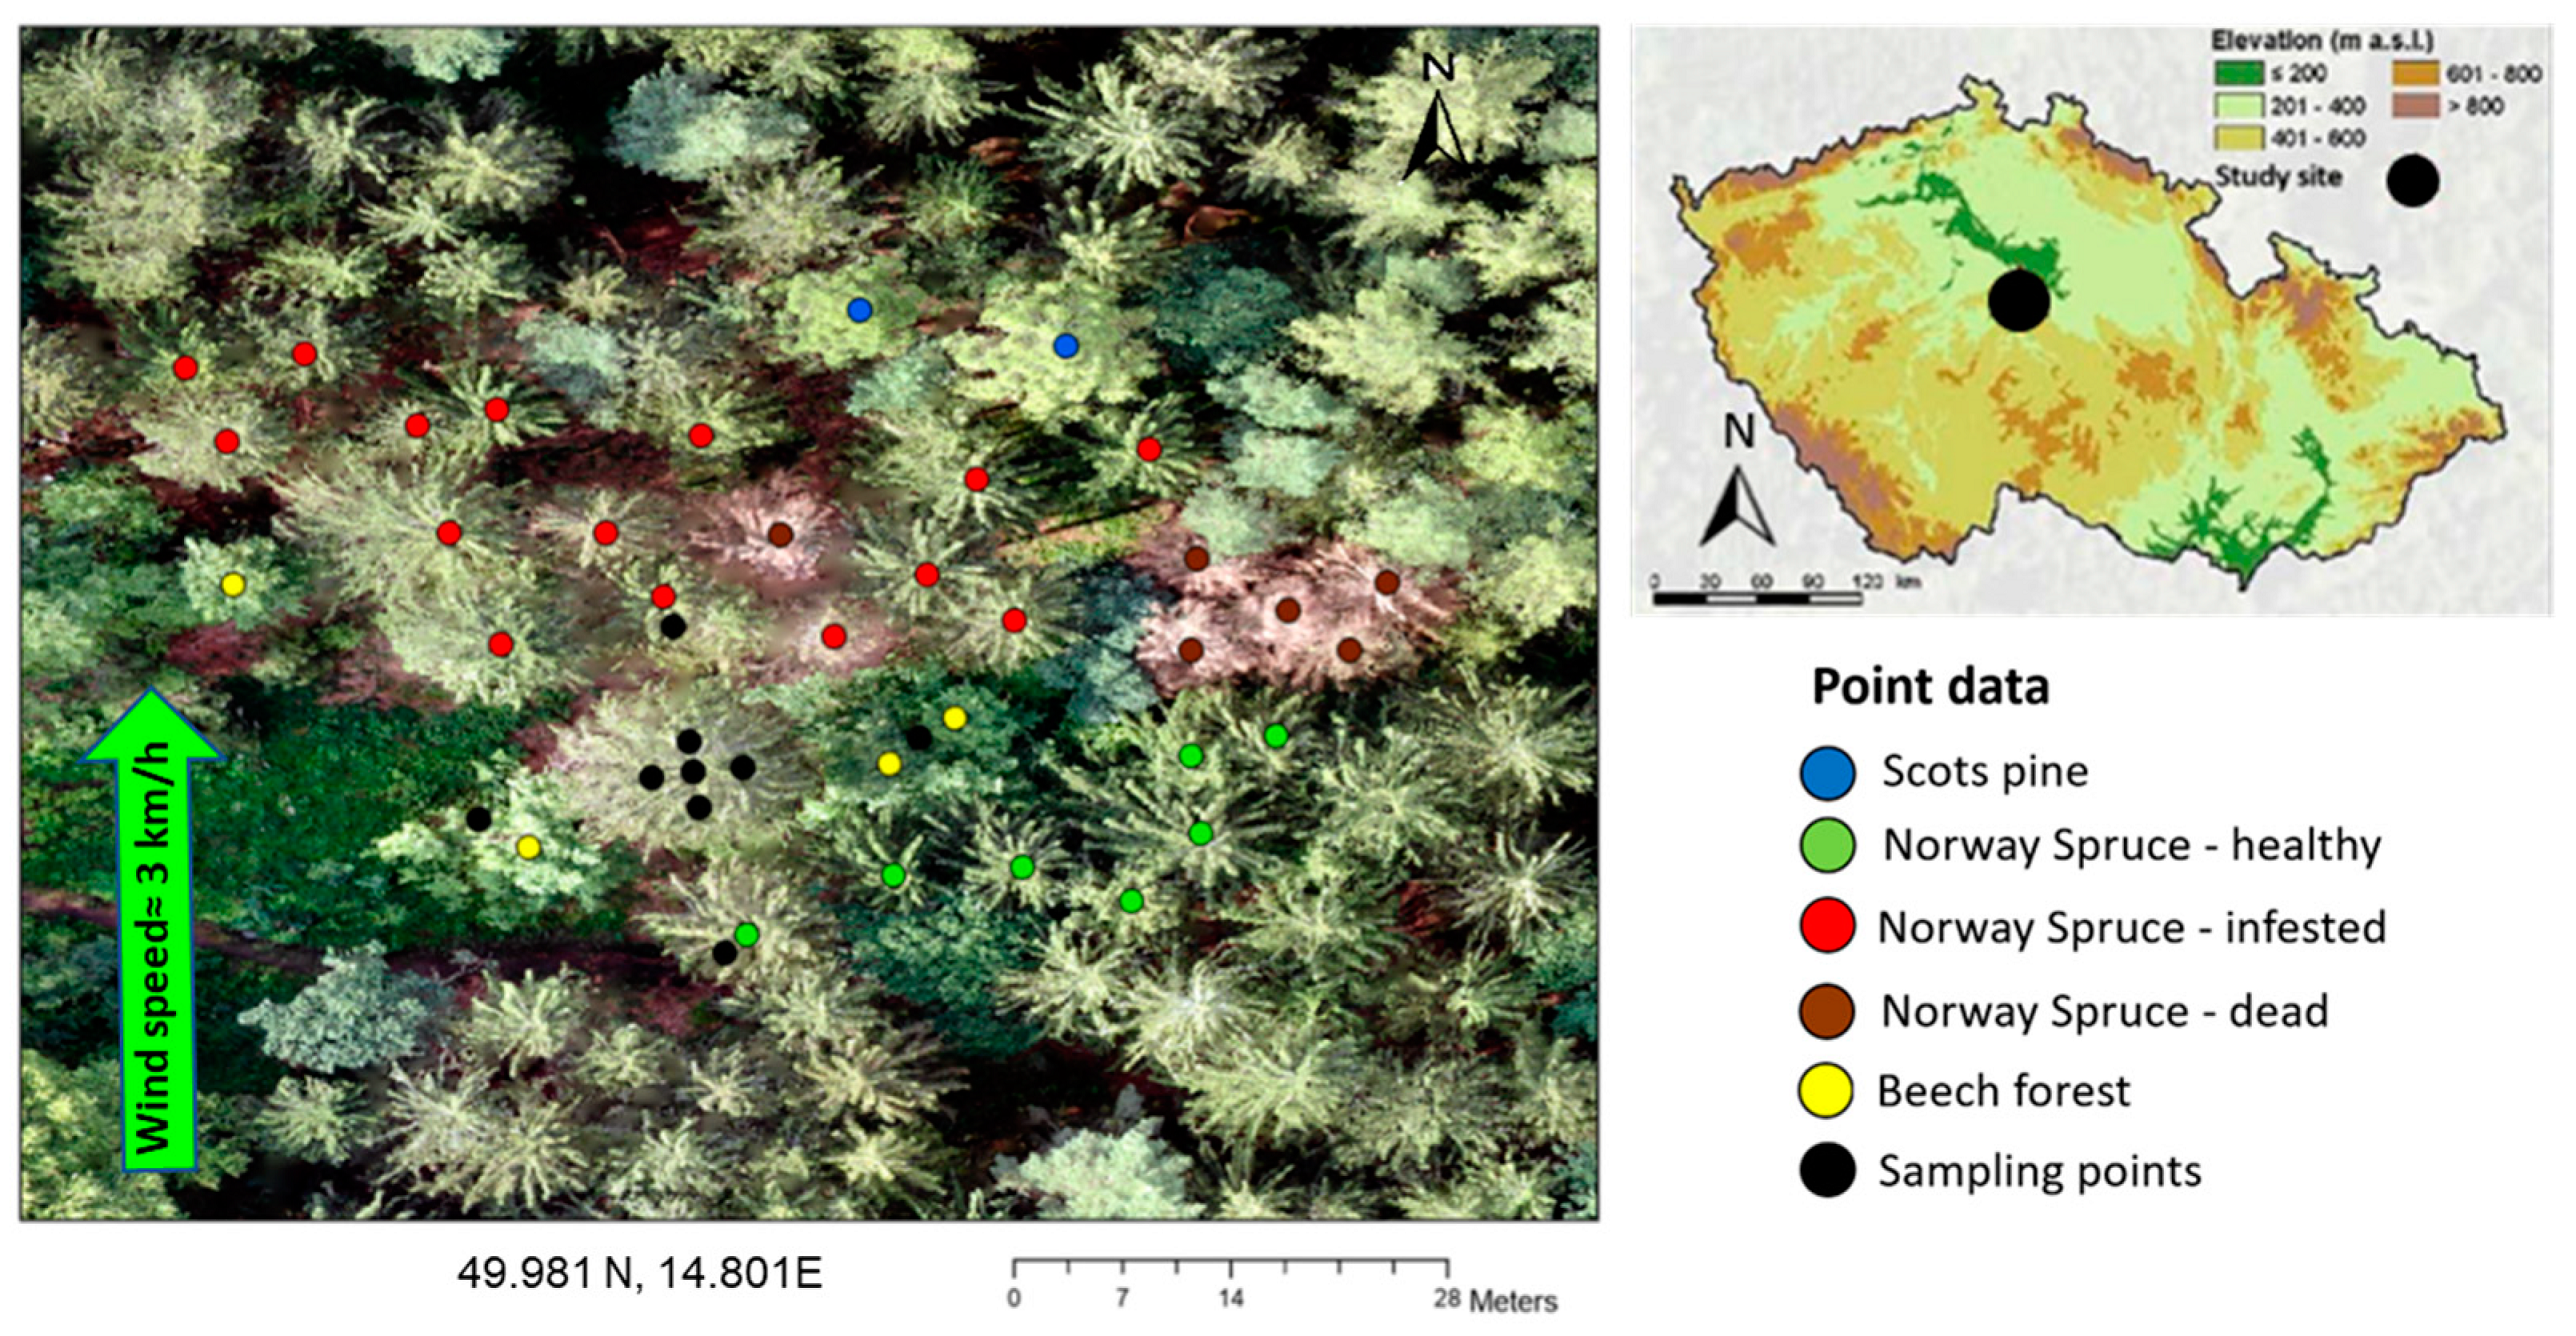
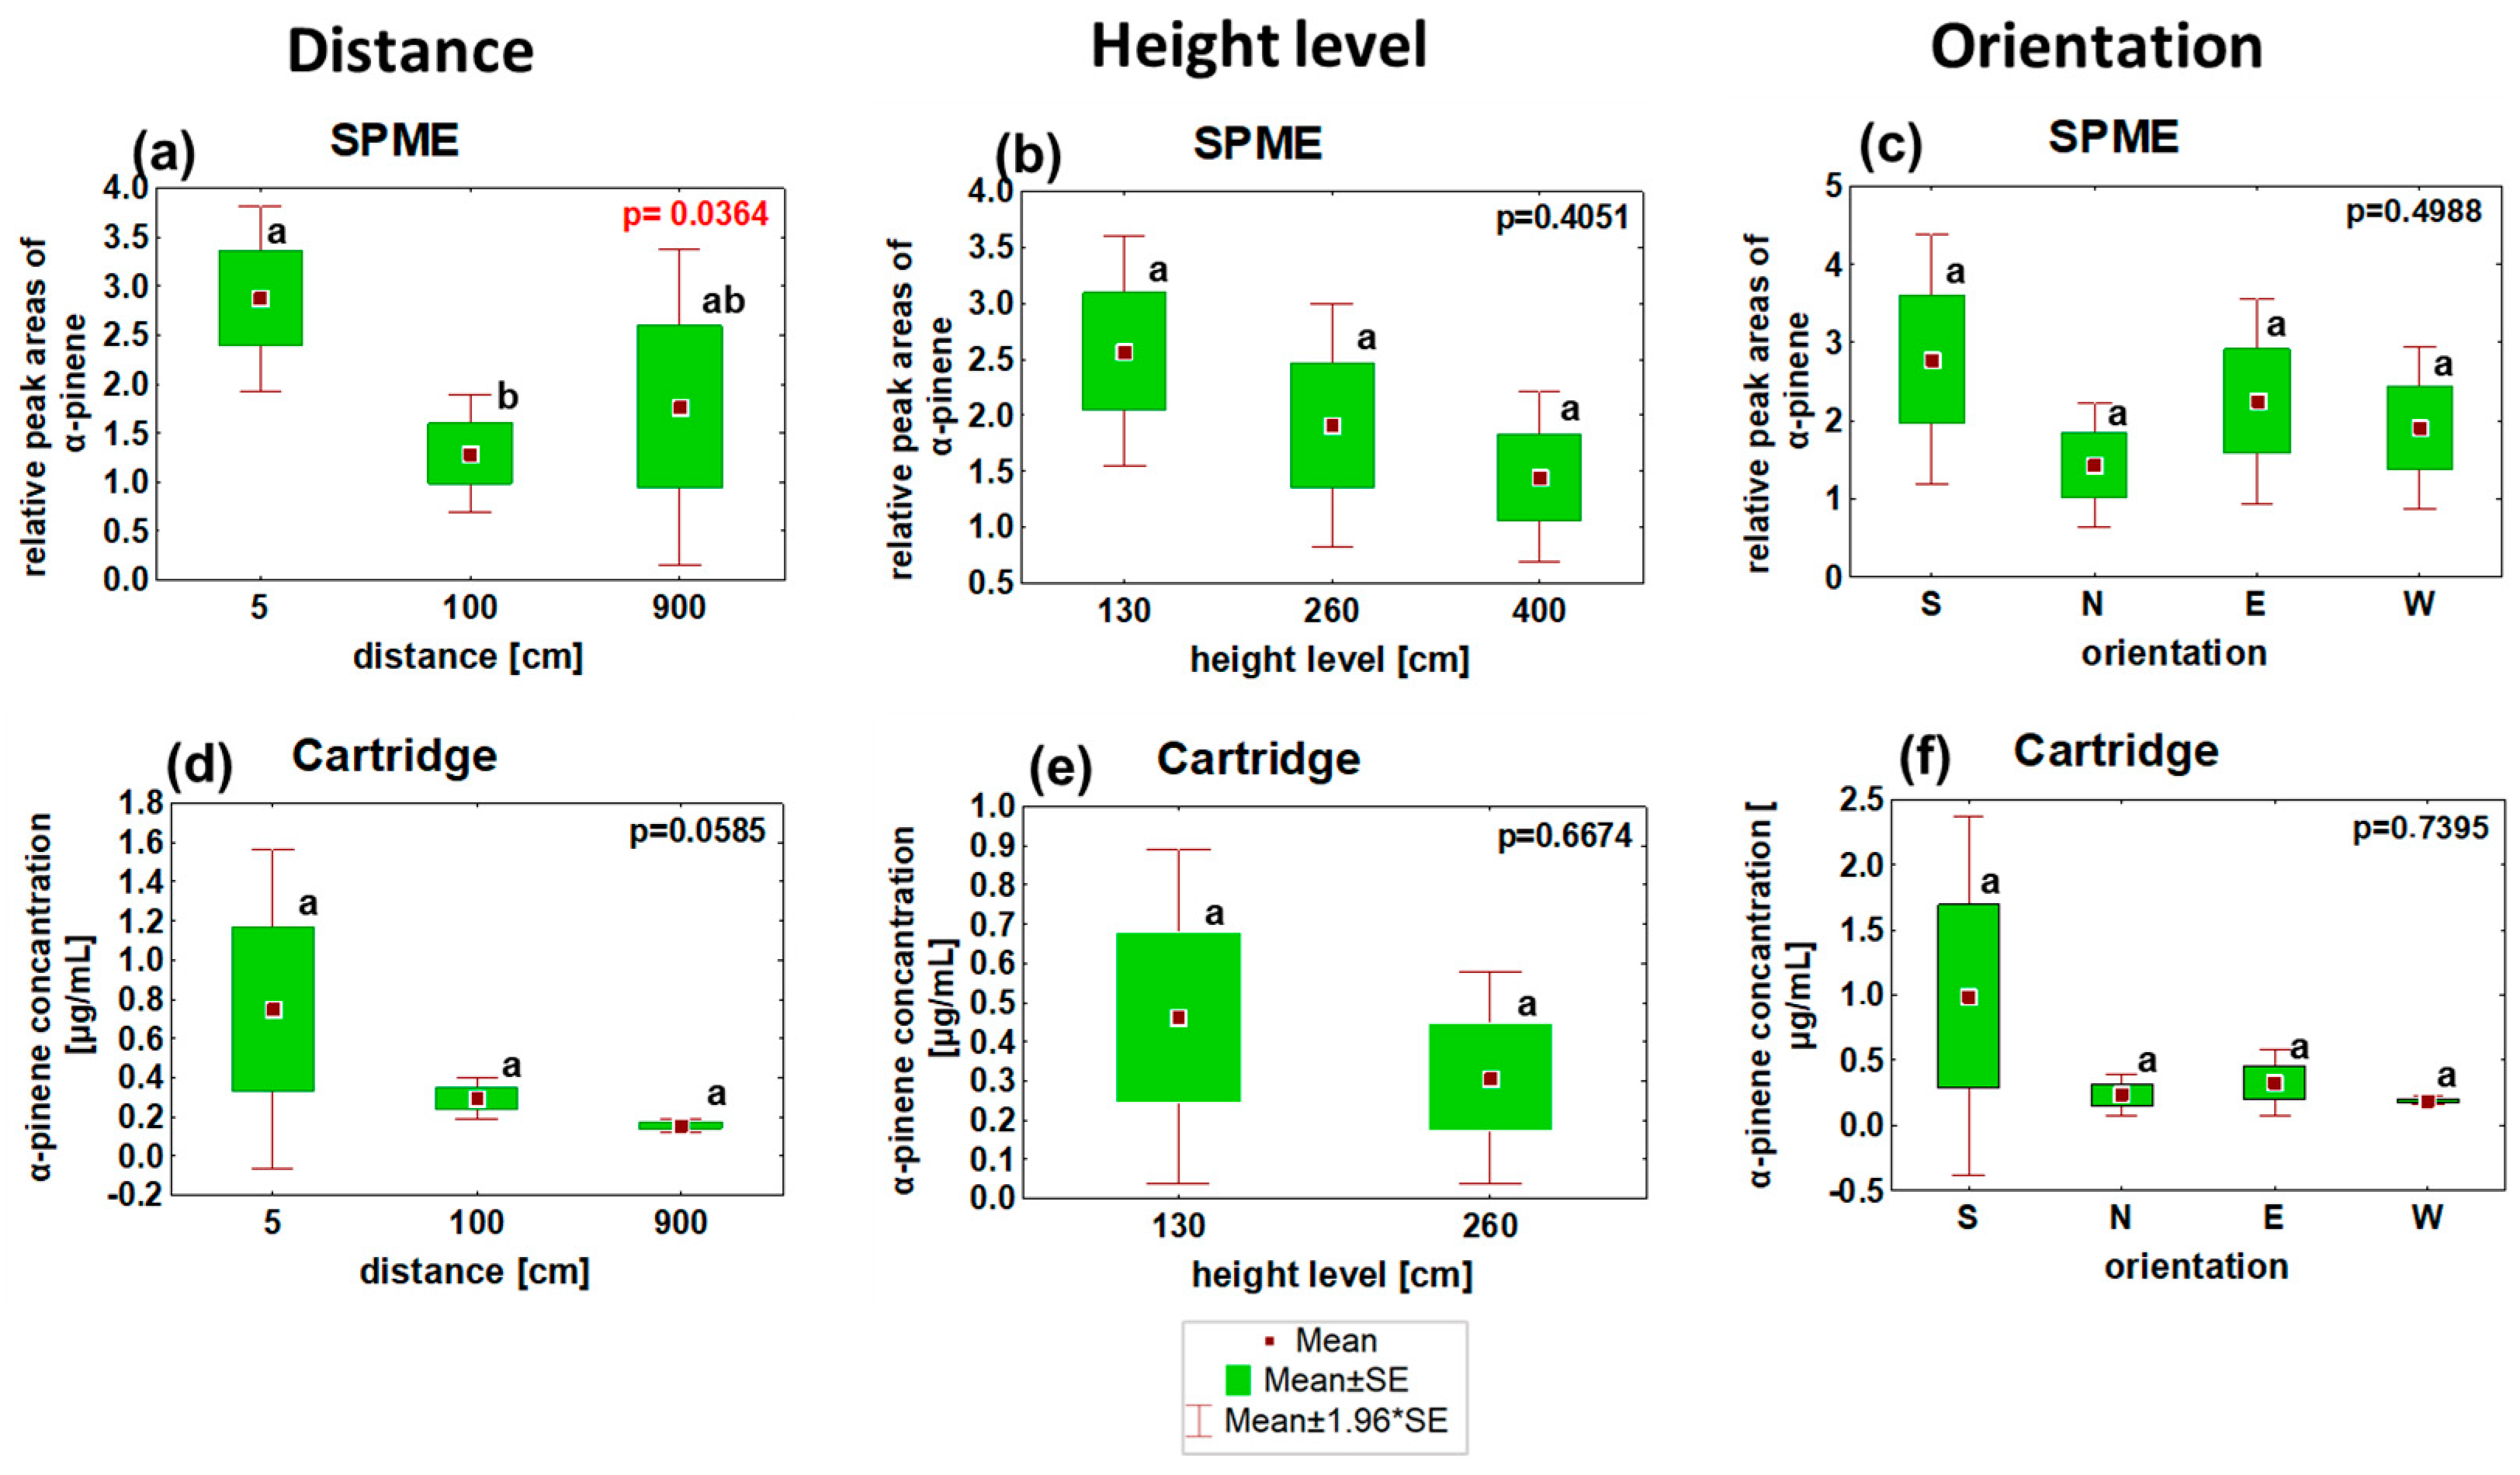
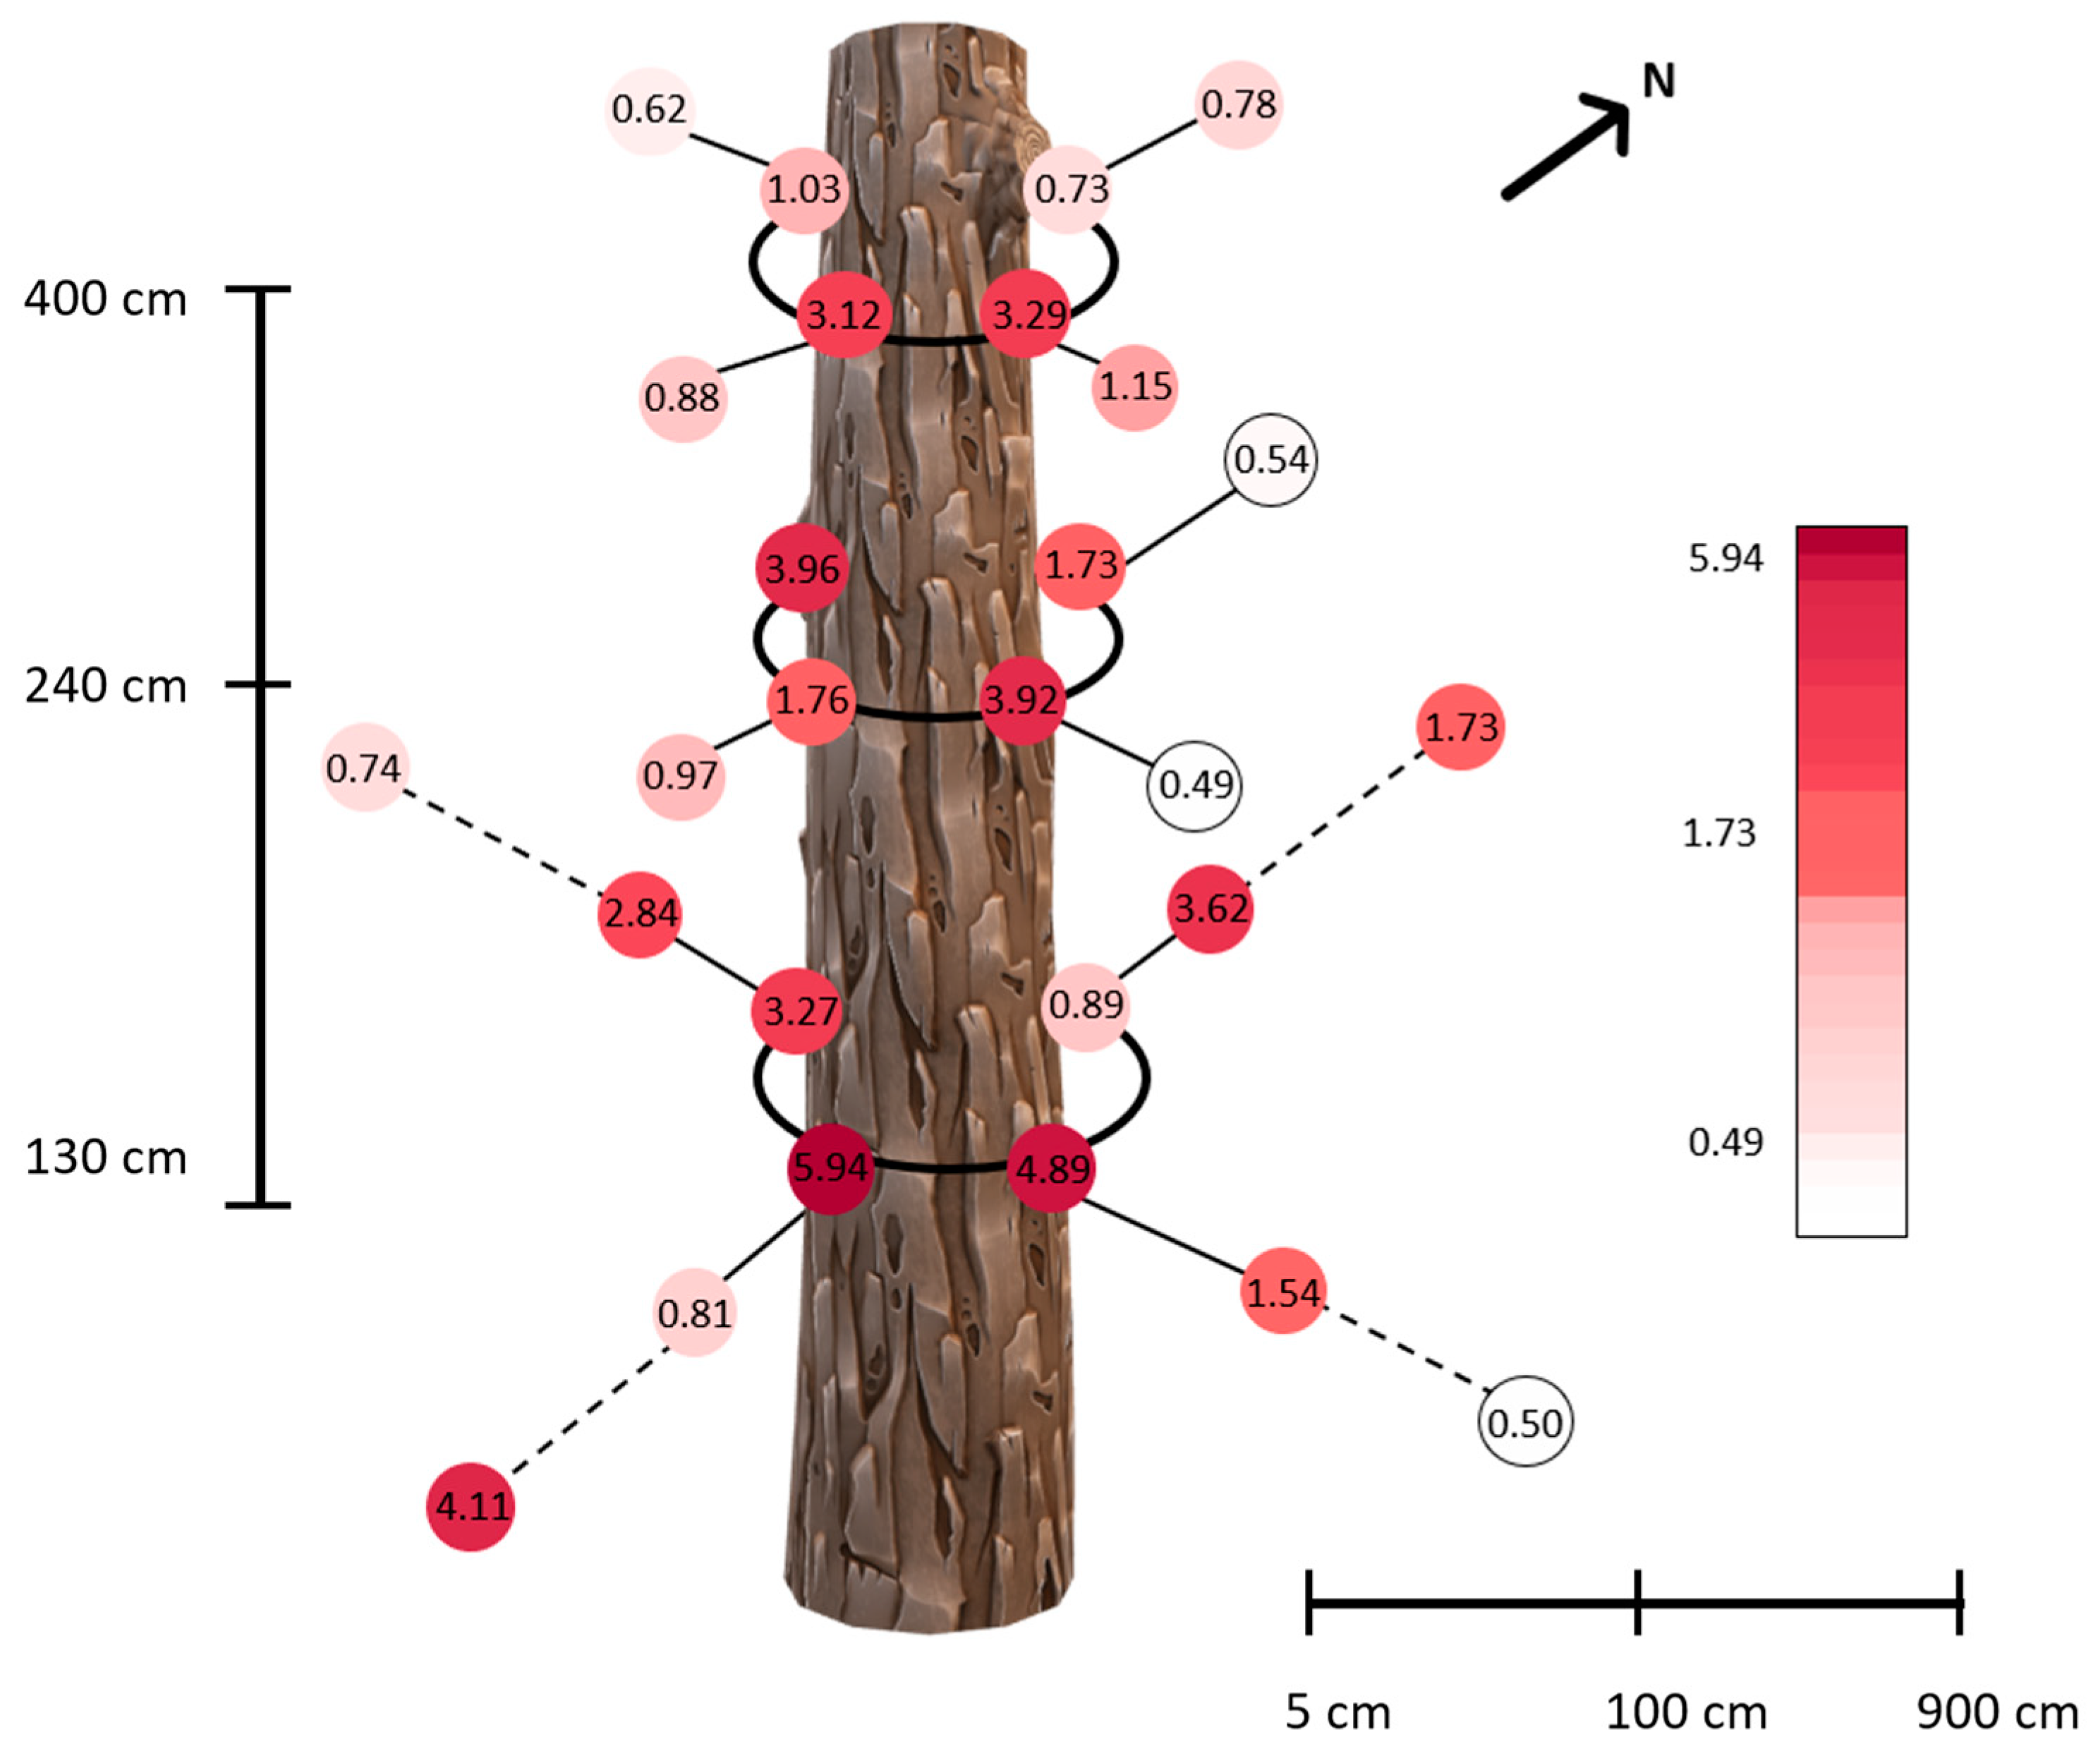
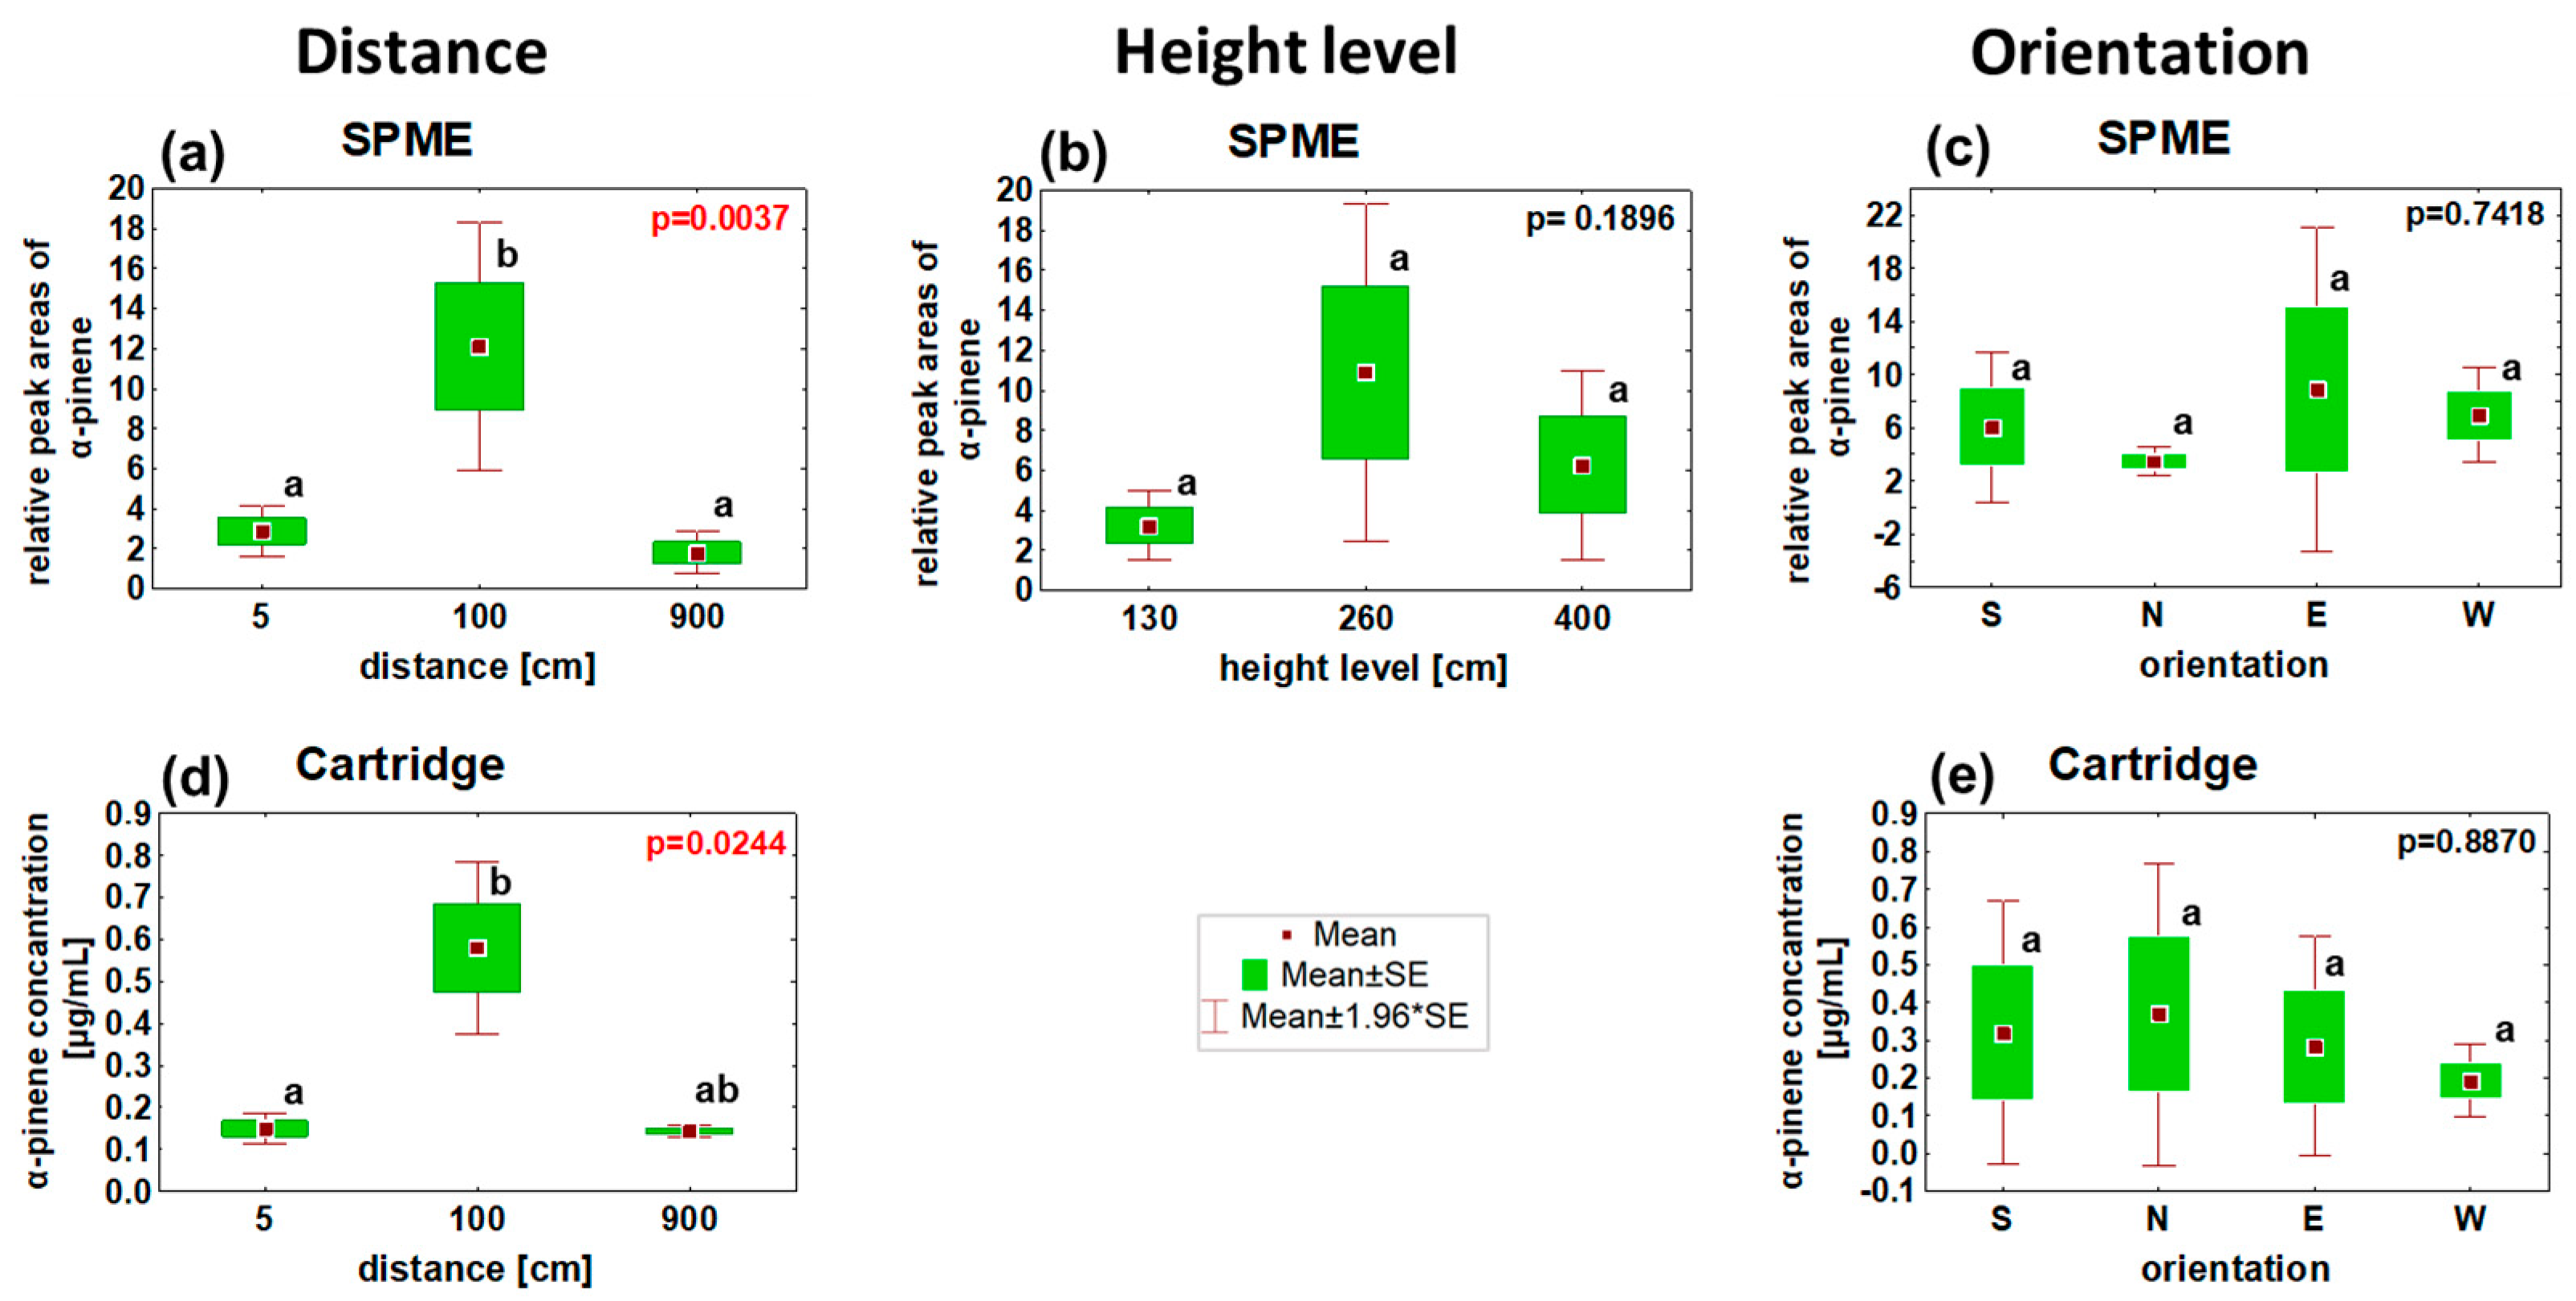
2.2. Field Collection of Distributed VOCs Emitted by the Ips typographus Naturally Infested Picea abies

We conducted two collections of VOCs from naturally infested trees in the field at different locations and during different periods of the 2022 growing season. In this study, we did not measure VOCs from non-infested trees as controls. This decision stems from the continuation of our prior study [8] and existing literature reports (Table 1), which have consistently demonstrated several-fold increases in emissions from infested trees using similar techniques. Both collections took place on the Forests ČZU property near Kostelec nad Černými lesy, the Czech Republic. The area is characterized by a mature forest primarily composed of a 90-year-old Norway spruce (P. abies) plantation, situated at an altitude of 400–450 m above sea level (Figure 2 and Figure 3).
The distributed VOCs were collected within 900 m around the freshly Ips typographus-infested individual Norway spruces. The infestation status was found by the occurrence of fresh frass at the stem’s base, and infestation stadia were specified by assessing the beetle attack density exhibited by the sampled tree. Both sampled trees were in the nuptial chamber building attack stadia, approximately two weeks from the beginning of the mass attack.
The VOCs were collected from infested trees at three different height levels from the ground (1.3 m, 2.6 m, and 4 m). Collection chambers were placed at three different distances from the tree trunk (5 cm, 100 cm, and 900 cm away from the tree) (Figure 3). The row of collection chambers was oriented in four cardinal directions: north (N), east (E), south (S), and west (W) (see Figure 2, Figure 3 and Figure 4 for reference). Dataloggers were used throughout the experiment to measure the temperature and humidity (Tables S1 and S2), and an anemometer was used to measure the wind speed (Figure 2 and Figure 3).
Two analytical approaches were employed to collect VOCs from infested trees in natural forest conditions [27,28,45]:
Sorption onto SPME fibers (PDMS/CAR/DVB, Supelco, PA, USA): Eight SPMEs fixed in protective chambers were positioned at three height levels: L1 (130 cm), L2 (240 cm), and L3 (400 cm). They were placed at two distances from the tree (5 cm and 100 cm) in the immediate proximity of the tree in four cardinal directions: north, south, west, and east. Additionally, four fibers were positioned 900 cm away from the tree in the same direction. These SPMEs were exposed for 60 min to collect volatile organic compounds (VOCs) from the forest air. After collection, the fibers were sealed in vials with septa in the same manner as in the laboratory. They were then placed on dry ice and subsequently stored in a freezer at −18 °C before undergoing measurement using Gas Chromatography-Flame Ionization Detection GC-FID, Agilent 8890 (Agilent, CA, USA).
Sorption using cartridges (inner Ø 3 mm) filled with HayeSep-Q® sorbent (30 mg, Sigma-Aldrich, St. Louis, MO, USA,): This approach involved filtering the surrounding air through sorbent in cartridges sucked by sampling pumps (Pocket Pump Touch; Serie 220–1000, Eighty Four, PA, USA). The pumps were calibrated to operate at a flow rate of 100 mL/min for 60 min. Of the 12 air pumps, the chosen measurements were established along the first height level (130 cm from the ground) in all cardinal directions and different distance levels, and two cartridges were set up at the second height level in north and south directions at a 5 cm distance from the bark surface.

2.3. Chemical Analyses of SMPE Fiber and Cartridges via Gas Chromatography-Flame Ionization Detection (GC-FID)

Cartridges were washed with 1 mL of GC-grade hexane (GC-capillary grade; Avantor, PA, USA) and stored at −18 °C for further chemical analysis.
The SPME and cartridge analyses were carried out via Gas Chromatography-Flame Ionization Detection (GC-FID) Agilent 8890 (Agilent, CA, USA). The GC-FID was equipped with a DB-WAX capillary column (30 m × 320 µm × 0.25 µm film thickness; Agilent, CA, USA). The GC oven program followed a temperature profile of the initial temperature at 40 °C for 2 min, followed by a ramping rate of 10 °C per minute to reach 230 °C, where it was held for 2 min. The carrier gas He flow was 1.5 mL·min−1. The inlet operated in spitless mode and the inlet temperature was 220 °C. For the desorption of SPME fibers, an SPME liner was used (n°5190-4048, 78.5 × 0.75 mm id, Agilent, CA, USA). The extracts in hexane (1 µL) from the cartridge collection were analyzed in spitless mode.

2.4. Determination of Relative Quantities of α-Pinene via SPME and Absolute Quantities Sorbed to Cartridges

On the chromatogram, peaks of the main spruce monoterpenes and other volatile organic compounds (VOCs) from the forest air near P. abies were observed. However, to describe their 3D distribution, only the most abundant α-pinene was chosen, as it adequately represents the trend of the other main monoterpenes [8].
In both collection methods, α-pinene’s peak identity was confirmed by comparing its retention time with the commercial standard (α-pinene, Sigma-Aldrich, St. Louis, MO, USA).
The abundance of α-pinene collected via SPME fiber was determined by measuring the peak area of α-pinene divided by the sum of areas of the peaks of the five main monoterpenes chosen (α-pinene, β-pinene, Δ-carene, limonene, camphene, and myrcene, 1.8 cineole) comparing it across individual samples. The quantification of α-pinene in the cartridge extracts was based on a calibration curve (Figure S2) constructed using the commercial standard of α-pinene diluted in hexane at 0.1, 0.5, 1, 10, 25, 50, and 100 µg/mL. The amount of α-pinene in one cartridge, expressed here as µg/mL, means µg/(6 L of air) in the vicinity of an infested tree.

2.5. Statistical Analyses

Statistical analyses were performed using Statistica (version 14.0.0.15). The normality assumption was tested using the Shapiro–Wilk test, and in each case, the null hypothesis (H0) was rejected, indicating the need for nonparametric testing. The Kruskal–Wallis test was used to compare individual levels, distances, and cardinal directions. When the test showed statistical differences, post hoc tests were conducted to examine differences between repetitions.
For SPME analysis, the dependent variable was the relative peak area of α-pinene collected. For cartridges, the amount of α-pinene quantified by the calibration curve was the dependent variable. In both analyses, the independent variables were the distance and height measurements.

3. Results

3.1. Optimization of VOC Collection to SPME in a Laboratory

The three VOC collections in the laboratory, taken at different times, were considered three repetitions since they were kept under the same experimental conditions (temperature and method of log drilling). Statistical analysis was conducted on all of them together (n = 72).
The abundance of α-pinene, the main monoterpene representing trends of other MT, was statistically highest at a 5 cm distance from the drilled stems compared to a 30 cm distance from the drilled stems (p = 0.0362) (Figure 5a).
In the vertical direction, the distribution of α-pinene was statistically different (p = 0.006). The lowest abundance was observed at the medium level L2 (60 cm from the ground), and it was significantly different from the abundance at the bottom level L1 (20 cm from the ground) (post-hoc; p = 0.007) (Figure 5b).

3.2. α-Pinene Spatial Distribution around Norway Spruce Infested by Ips typographus for Two Weeks

The conditions in the first forest spatial VOC measurement conducted on 30 June 2022 on two-week naturally infested trees were an average temperature of 25.1 °C, average humidity of 72.6%, wind speed of 5 km/h, wind direction from the SE, and sunshine. The abundance of α-pinene emitted from the naturally infested tree was upregulated at a 5 cm distance from the stem. This upregulation was detected by both collection methods, with a significant increase observed using SPME (p = 0.036), where 5 cm and 100 cm distances significantly differed (p = 0.036 post hoc) (Figure 6a) and a non-significant increase was observed using sorption to cartridges (p = 0.0585). A trend of a decreasing α-pinene concentration at a 900 cm distance from the infested tree was observed in the collection involving cartridges (Figure 6d), but not in the collection using SPME (Figure 6a).
In the vertical direction, a weak, non-significant trend was observed in the accumulation of α-pinene in the bottom level of the stem at 130 cm above the ground, decreasing with altitude up to 400 cm above the ground. This trend was consistent across both collection methods (Figure 6b,e).
Regarding cardinal orientation, there was no significant accumulation of α-pinene on any of the measured sides. However, considering the high variability of the data, there was a trend of increased α-pinene abundance on the south side of the infested stem, as observed with both SPME fiber and cartridge collection methods (Figure 6c,f).
A 3D depiction of the α-pinene collection using SPME fiber on 30 June 2022 is shown in Figure 7. Increased color saturation in the visualization corresponds to higher accumulated α-pinene levels. The accumulation aligns with Figure 6, indicating elevated concentrations at the first level (130 cm). In terms of distance, there is a notable increase at 5 cm from the stem. Beyond 900 cm, there is considerable variation in α-pinene amounts, making it difficult to observe a clear trend. Regarding the orientation, slightly higher concentrations are observed on the south and east sides, though are not significantly dominant.
The conditions for the second VOC measurement in the forest open space around a naturally infested tree, conducted on 24 August 2022, differed from the first collection in terms of location and environmental factors (average temperature of 20.7 °C, average humidity of 78.8%, wind speed of 3 km/h, wind direction from S, and sunshine).
α-pinene abundance significantly increased at a 100 cm distance from the stem, as detected by SPME (p = 0.0037) (Figure 8a) and sorption to cartridges (p = 0.0244) (Figure 8d), compared to both the 5 cm and 900 cm distances considered as controls.
A non-significant, very weak trend was observed for the accumulation of α-pinene at a height of 260 cm from the ground measured by SPME (Figure 8b). No significant differences were found in α-pinene accumulation in any cardinal direction (Figure 8c,e).
The 3D depiction of α-pinene collection using SPME fiber during the second field collection on 24 August 2022 is shown in Figure 9. Notably, there is an increase 100 cm from the stem in terms of distance and higher accumulation at the second level, 260 cm from the ground. This aligns with Figure 8.

4. Discussion

The volatile compounds emitted by infested trees have been studied in two main contexts: atmospheric chemistry processes, with a focus on reactive particle formation [50], and ecological roles related to bark beetles and their predators [27,28,32,51]. Most reports in atmospheric chemistry measured volatiles at the canopy or twig level [52]. Emission measurements of biogenic volatile organic compounds (BVOC) from infested trees appeared in only a few studies investigating the potential use of these emissions as early attack detection markers [9,10,39]. Our study is unique as it examines emissions within a distance of 10 m of the infested tree, specifically at ground level and up to 5 m, where α-pinene accumulates at an average infestation season temperature of 20 to 25 °C in central European forests [53]. This novel approach contributes new insights to our understanding of volatiles emitted by bark beetle-infested trees.
Primarily, in our study, we employed laboratory optimization techniques to collect volatiles from freshly infested trees. The main emitted compound, α-pinene, was selected as a representative of the primary monoterpenes. It reflects the trends observed in other monoterpenes emitted by spruce trees infested by bark beetles [54].
In the laboratory, where the temperature was 25 °C, we observed a higher abundance of α-pinene in the open space in the closest proximity to logs, particularly in the lowest and highest positions. This increase was likely caused by the proximity of open log cuts and exposed bark edges, despite our attempts to prevent them by covering them with PE foil.
The first detection of α-pinene in the surroundings of a naturally infested tree in the field was conducted approximately two weeks after the beginning of a mass attack on the tree, corresponding with the time the monoterpene emission peaks [8,50]. This detection also took place at a temperature of 25 °C, when, expectedly, α-pinene vapors are heavier than air (with a vapor pressure of 4.9 mm Hg at 27 °C) [55].
Similar to our laboratory findings and reports from the literature [27,28], we observed the highest abundance of α-pinene in the immediate vicinity of the infested tree. Vertically, α-pinene accumulated at the lowest level, approximately 1.3 m above the ground, which was confirmed by two different collection methods:
The lower-level accumulation of the monoterpenes under similar conditions was previously observed as the output of the continual measuring campaign of BVOC in the forest. It has been reported that monoterpenes are emitted by healthy trees during the daytime, but they are also more susceptible to degradation in the atmosphere during the same period [53]. Monoterpenes are known to be unstable in the atmosphere, with a relatively short lifetime, often lasting only hours or even minutes, forming atmospheric secondary organic aerosol particles, followed by reactions with ozone and radicals like NO, OH, and NO3 [56]. As a result of their decomposition, methanol and acetone, both of which are highly abundant in the forest atmosphere, are produced, alongside other products. Additionally, at higher elevations in the forest, strong air streams are present, resulting in monoterpenes having a higher ‘mixing ratio,’ which implies a lower concentration. The monoterpenes accumulate at lower altitudes in the forest, particularly during the nighttime [57].
The abundance of α-pinene in the controls placed at a further distance from the tree (9 m) exhibited greater variability [10].
This variability was most likely influenced by the surrounding trees. There were spruces, some of them in more progressed infestation stadia, or even dead and intact pines. In naturally infested trees, we also assessed an α-pinene orientation related to the infested stem’s cardinal direction. During the first field collection, we noticed a non-significant trend of higher α-pinene levels on the south side of the stem, despite the prevailing wind coming from the opposite direction. This was attributed to the tree’s location near the forest edge, allowing for direct afternoon sunlight exposure during collection [17,21].
The second collection, conducted later in the season, took place at a lower temperature of 22 °C. Interestingly, the highest abundance of monoterpenes was not observed at the lowest position, but rather at a height of 2.6 m, Additionally, it was not closest to the tree stem, but rather 1 m away. Results were confirmed again by two collection methods, Solid-Phase Microextraction (SPME) and HayeSep-Q® Cartridge sampling, conducted at two different time intervals. This sampled tree, despite being in a similar stage of infestation as the first tree, was fully surrounded by other trees, including some broadleaf varieties in the vicinity, resulting in no direct irradiation of the stem.
During this collection, we did not observe any significant influence of sunlight exposure or wind speed on the orientation of increased α-pinene abundance.
The temperature and humidity differences in altitude were recorded on the same experimental plot [9]. The highest temperatures were observed approximately 1 m above the ground with an upward gradient. This temperature variation may impact the higher abundance of α-pinene at an altitude of 2.6 m compared to ground level due to the physical properties of pinene vapors.
The variation in outcomes between the first and second field collections was attributed to differences in the surroundings of the measured trees, distinct parts of the season, and, primarily, variations in temperature and humidity conditions [36,37].
In forest practices, our 3D distribution data of α-pinene emitted by freshly infested spruces may serve as a foundation for scanning techniques, demonstrating promising potential for managing bark beetle populations by facilitating early attack detection.
The most advanced technique for volatile scanning in situ can be based on field and portable Gas Chromatography-Mass Spectrometry (GC-MS) instruments, which are possible to mount on UAV. These instruments have the capability to separate, identify, and quantify VOC compounds in situ and collect data at short intervals. Existing instruments on the market have been tested for various analytes, primarily for military applications [58]. However, reliable devices for detecting terpenes and other infestation marker VOCs are still lacking.
To specifically select markers of infestation by Ips typographus and exclude infestations of different herbivores (as relevant bark species or defoliators) from the complex odor environment of a natural forest, such as bark beetle pheromones and spruce host compounds, an olfactory perception system of the bark beetles, antennae can be used as a specific detector working via electroantennography principles [59,60]. Ongoing research is exploring the application of this method in insect pest detection, with future directions aiming to target insect protein odorant receptors for specific compounds indicative of infestation [31].
However, the most potentially promising novel device is a non-specific electronic nose, designed for real-time chemical substance detection (e.g., detecting dangerous gas leaks or measuring concentrations near landfills, monitoring volcanic activity, etc.). We previously conducted tests to explore the feasibility of early-stage stress detection in forest stands using an electronic nose, specifically the Sniffer4D [9].
Due to limitations in measuring VOCs with non-specific sensors in forests, especially in areas with higher concentrations of compounds from fresh clearings, debris, and broken trees, an ideal approach would involve integrating environmental VOC scanning with other data collected through different scanning methods. This integration could be achieved, ideally using UAV vehicles equipped with various sensors for high-resolution data collection [61]. The map of VOC abundance can be automatically overlaid with aerial maps of the area, changes in reflectance, dedicated vegetation indices [6], or temperature fluctuations [62].

Limitation of the Study

The reported study is considered a pilot trial investigating the distribution of monoterpenes around infested trees at ground level and up to 5 m. To enhance the study, future research employing classical collection and analytical techniques should result in confirmation of the quantitative monoterpene distribution. The expanded study will involve a large-scale tree group, multiple replications for robust statistical analyses, and a focus on genetically relevant trees. To ensure control, infested and non-infested trees will be monitored simultaneously, maintaining consistent bark beetle infestation density. Standardized environmental conditions will be implemented to minimize variability, with the potential to explore environmental conditions as a variable.

5. Conclusions

In summary of this pilot study, VOCs, represented here by α-pinene, emitted by freshly attacked trees may act as detectable markers for timely infestation. The spatial distribution of their concentration in an open space follows a gradient pattern that can be analyzed using various collection techniques. However, this distribution is notably influenced by environmental factors. With further optimization and integration with other scanning methods, these VOCs emitted by freshly infested trees can be used to develop effective “early detection methods” for bark beetles. Real-time data distribution provides a strong foundation for implementing crucial scanning techniques in early attack detection strategies.

Supplementary Materials

The following supporting information can be downloaded at: https://www.mdpi.com/article/10.3390/f15010010/s1, Table S1. The averages of the temperature and humidity in the first data collection 30 June 2022 in two periods of collections (SPME and cartridge collection). Table S2. The averages of the temperature and humidity in the second data collection 24 August 2022 in two periods of collections (SPME and cartridge collection). Figure S1. The map of development of Norway spruce logging due to bark beetle infestation in the Czech Republic in the period 9/2021–7/2022. Figure S2. Calibration curve of α-pinene. Constructed using commercial standard of α-pinene diluted in hexane to 0.1; 0.5; 1; 10; 25; 50 and 100 µg/mL.

Author Contributions

B.S.: experimental work, data curation, statistical data processing, and writing draft. A.A.C.M.: experimental work, GC-FID analysis, and writing draft and editing. T.H.: experimental work, figures processing. M.L.: experimental work and attack expertise. P.S.: editing manuscript and supervision. A.J.: conceptualization, data sampling, formal analysis, writing, editing, and supervision. All authors contributed to the article and approved the submitted version. All authors have read and agreed to the published version of the manuscript.

Funding

The project was funded by “EXTEMIT-K”, No. CZ.02.1.01/0.0/0.0/15_003/0000433, Ministry of Education, Youth and Sport, Operational Programme Research, Development and Education, Internal Grant Commission BS [IGA A_21_01] at the Faculty of Forestry and Wood Sciences, Czech University of Life sciences, Prague, Czech Republic, and Internal Grant Commission ML [IGA A_23_17] at the Faculty of Forestry and Wood Sciences, Czech University of Life sciences, Prague, Czech Republic and EU project “UGC”, No. CZ.02.2.69/0.0/0.0/19_073/0016944 project number 75/2021 financed by OP RDE at the Czech University of Life Sciences, Prague, Czech Republic, and AJ and AACM were funded by the National Agency for Agricultural Research NAZV QK1910480.

Data Availability Statement

Data are available in the article and in the Supplementary Materials.

Acknowledgments

We thank Forests ČZU for providing the experimental plots and Karel Kuželka for the pointing of coordinates of the experimental plots, and to Jiří Trombík for assistance with graphical abstract.

Conflicts of Interest

The authors declare that the research was conducted in the absence of any commercial or financial relationships that could be construed as a potential conflict of interest.

References

  1. Biedermann, P.H.W.; Müller, J.; Grégoire, J.C.; Gruppe, A.; Hagge, J.; Hammerbacher, A.; Hofstetter, R.W.; Kandasamy, D.; Kolarik, M.; Kostovcik, M.; et al. Bark Beetle Population Dynamics in the Anthropocene: Challenges and Solutions. Trends Ecol. Evol. 2019, 34, 914–924. [Google Scholar] [CrossRef]
  2. Hlásny, T.; König, L.; Krokene, P.; Lindner, M.; Montagné-Huck, C.; Müller, J.; Qin, H.; Raffa, K.F.; Schelhaas, M.J.; Svoboda, M.; et al. Bark Beetle Outbreaks in Europe: State of Knowledge and Ways Forward for Management. Curr. For. Rep. 2021, 7, 138–165. [Google Scholar] [CrossRef]
  3. Hlásny, T.; Zimová, S.; Merganičová, K.; Štěpánek, P.; Modlinger, R.; Turčáni, M. Devastating Outbreak of Bark Beetles in the Czech Republic: Drivers, Impacts, and Management Implications. For. Ecol. Manag. 2021, 490, 119075. [Google Scholar] [CrossRef]
  4. Hlásny, T.; Barka, I.; Merganičová, K.; Křístek, Š.; Modlinger, R.; Turčáni, M.; Marušák, R. A New Framework for Prognosing Forest Resources under Intensified Disturbance Impacts: Case of the Czech Republic. For. Ecol. Manag. 2022, 523, 120483. [Google Scholar] [CrossRef]
  5. Kautz, M.; Schopf, R.; Ohser, J. The “Sun-Effect”: Microclimatic Alterations Predispose Forest Edges to Bark Beetle Infestations. Eur. J. For. Res. 2013, 132, 453–465. [Google Scholar] [CrossRef]
  6. Huo, L.; Persson, H.J.; Lindberg, E. Remote Sensing of Environment Early Detection of Forest Stress from European Spruce Bark Beetle Attack, and a New Vegetation Index: Normalized Distance Red & SWIR (NDRS). Remote Sens. Environ. 2021, 255, 112240. [Google Scholar] [CrossRef]
  7. Van Der Velde, I.R.; Van Der Werf, G.R.; Houweling, S.; Maasakkers, J.D.; Borsdorff, T.; Landgraf, J.; Tol, P.; Van Kempen, T.A.; Van Hees, R.; Hoogeveen, R.; et al. Vast CO2 Release from Australian Fires in 2019–2020 Constrained by Satellite. Nature 2021, 597, 366–369. [Google Scholar] [CrossRef]
  8. Stříbrská, B.; Hradecký, J.; Čepl, J.; Modlinger, R.; Tomášková, I.; Jirošová, A. Physiological and Biochemical Indicators in Norway Spruces Freshly Infested by Ips typographus: Potential for Early Detection Methods. Front. For. Glob. Chang. 2023, 6, 1197229. [Google Scholar] [CrossRef]
  9. Hüttnerová, T.; Paczkowski, S.; Neubert, T.; Jirošová, A.; Surový, P. Comparison of Individual Sensors in the Electronic Nose for Stress Detection in Forest Stands. Sensors 2023, 23, 2001. [Google Scholar] [CrossRef]
  10. Paczkowski, S.; Datta, P.; Irion, H.; Paczkowska, M.; Habert, T.; Pelz, S.; Jaeger, D. Evaluation of Early Bark Beetle Infestation Localization by Drone-Based Monoterpene Detection. Forests 2021, 12, 228. [Google Scholar] [CrossRef]
  11. Vošvrdová, N.; Johansson, A.; Turčáni, M.; Jakuš, R.; Tyšer, D.; Schlyter, F.; Modlinger, R. Dogs Trained to Recognise a Bark Beetle Pheromone Locate Recently Attacked Spruces Better than Human Experts. For. Ecol. Manag. 2023, 528, 120626. [Google Scholar] [CrossRef]
  12. Johansson, A.; Birgersson, G.; Schlyter, F. Using Synthetic Semiochemicals to Train Canines to Detect Bark Beetle–Infested Trees. Ann. For. Sci. 2019, 76, 1–10. [Google Scholar] [CrossRef]
  13. Boone, C.K.; Aukema, B.H.; Bohlmann, J.; Carroll, A.L.; Raffa, K.F. Efficacy of Tree Defense Physiology Varies with Bark Beetle Population Density: A Basis for Positive Feedback in Eruptive Species. Can. J. For. Res. 2011, 41, 1174–1188. [Google Scholar] [CrossRef]
  14. Franceschi, V.R.; Krokene, P.; Christiansen, E.; Krekling, T. Anatomical and Chemical Defenses of Conifer Bark against Bark Beetles and Other Pests. New Phytol. 2005, 167, 353–376. [Google Scholar] [CrossRef] [PubMed]
  15. Borg-Karlson, A.K.; Lindström, M.; Norin, T.; Persson, M.; Valterová, I. Enantiomeric Composition of Monoterpene Hydrocarbons in Different Tissues of Norway Spruce, Picea Ab/Es (L) Karst. A Multi-Dimensional Gas Chromatography Study. Acta Chem. Scand. 1993, 47, 138–144. [Google Scholar] [CrossRef]
  16. Netherer, S.; Kandasamy, D.; Jirosová, A.; Kalinová, B.; Schebeck, M.; Schlyter, F. Interactions among Norway Spruce, the Bark Beetle Ips typographus and Its Fungal Symbionts in Times of Drought. J. Pest Sci. 2021, 94, 591–614. [Google Scholar] [CrossRef] [PubMed]
  17. Stříbrská, B.; Hradecký, J.; Čepl, J.; Tomášková, I.; Jakuš, R.; Modlinger, R.; Netherer, S.; Jirošová, A. Forest Margins Provide Favourable Microclimatic Niches to Swarming Bark Beetles, but Norway Spruce Trees Were Not Attacked by Ips typographus Shortly after Edge Creation in a Field Experiment. For. Ecol. Manag. 2022, 506, 119950. [Google Scholar] [CrossRef]
  18. Lerdau, M.; Litvak, M.; Palmer, P.; Monson, R. Controls over Monoterpene Emissions from Boreal Forest Conifers. Tree Physiol. 1997, 17, 563–569. [Google Scholar] [CrossRef]
  19. Juráň, S.; Pallozzi, E.; Guidolotti, G.; Fares, S.; Šigut, L.; Calfapietra, C.; Alivernini, A.; Savi, F.; Večeřová, K.; Křůmal, K.; et al. Fluxes of Biogenic Volatile Organic Compounds above Temperate Norway Spruce Forest of the Czech Republic. Agric. For. Meteorol. 2017, 232, 500–513. [Google Scholar] [CrossRef]
  20. Baier, P.; Bader, R.; Rosner, S. Monoterpene Content and Monoterpene Emission of Norway Spruce (Pices abies L. Karst.) Bark in Relation to Primary Attraction of Bark Beetles (Col. Scolytidae). In Physiology and Genetics of Tree-Phytophage Interactions; Lieutier, F., Mattson, W.J., Wagner, M.R., Eds.; Les Colloques de l’INRA: Gujan, France, 1999; Volume 90, pp. 249–259. [Google Scholar]
  21. Marešová, J.; Majdák, A.; Jakuš, R.; Hradecký, J.; Kalinová, B.; Blaženec, M. The Short-Term Effect of Sudden Gap Creation on Tree Temperature and Volatile Composition Profiles in a Norway Spruce Stand. Trees 2020, 34, 1397–1409. [Google Scholar] [CrossRef]
  22. Amin, H.; Atkins, P.T.; Russo, R.S.; Brown, A.W.; Sive, B.; Hallar, A.G.; Hu, K.E. Effect of Bark Beetle Infestation on Secondary Organic Aerosol Precursor Emissions. Environ. Sci. Technol. 2012, 46, 5696–5703. [Google Scholar] [CrossRef] [PubMed]
  23. Joensuu, J.; Altimir, N.; Hakola, H.; Rostás, M.; Raivonen, M.; Vestenius, M. Role of Needle Surface Waxes in Dynamic Exchange of Mono- and Sesquiterpenes. Atmos. Chem. Phys. 2016, 16, 7813–7823. [Google Scholar] [CrossRef]
  24. Kivimäenpää, M.; Magsarjav, N.; Ghimire, R.; Markkanen, J.; Heijari, J.; Vuorinen, M.; Holopainen, J.K. Influence of Tree Provenance on Biogenic VOC Emissions of Scots Pine (Pinus sylvestris) Stumps. Atmos. Environ. 2012, 60, 477–485. [Google Scholar] [CrossRef]
  25. Cataldo, F.; Ursini, O.; Lilla, E.; Angelini, G.; Cataldo, F.; Ursini, O.; Lilla, E.; Angelini, G. Ozone: Science & Engineering Turpentine Oil Studied by Chirooptical Methods; Some Ozonolysis of α-Pinene, β-Pinene, d-and l-Turpentine Oil Studied by Chirooptical Methods; Some Implications on the Atmospheric Chemistry of Biogenic Volatile Organic Compo. Ozone Sci. Eng. 2010, 9512, 274–285. [Google Scholar] [CrossRef]
  26. Yu, H.; Holopainen, J.K.; Kivimäenpää, M.; Virtanen, A.; Blande, J.D. Potential of Climate Change and Herbivory to Affect the Release and Atmospheric Reactions of BVOCs from Boreal and Subarctic Forests. Molecules 2021, 26, 2283. [Google Scholar] [CrossRef] [PubMed]
  27. Jaakkola, E.; Gärtner, A.; Jönsson, A.M.; Olsson, K.L.P.; Holst, T. Spruce Bark Beetle (Ips typographus) Infestation Cause up to 700 Times Higher Bark BVOC Emission Rates from Norway Spruce (Picea abies). Biogeosci. Discuss 2022, 3, 1–32. [Google Scholar] [CrossRef]
  28. Ghimire, R.P.; Kivimäenpää, M.; Blomqvist, M.; Holopainen, T.; Lyytikäinen-Saarenmaa, P.; Holopainen, J.K. Effect of Bark Beetle (Ips typographus L.) Attack on Bark VOC Emissions of Norway Spruce (Picea abies Karst.) Trees. Atmos. Environ. 2016, 126, 145–152. [Google Scholar] [CrossRef]
  29. Raffa, K.F.; Andersson, M.N.; Schlyter, F. Host Selection by Bark Beetles: Playing the Odds in a High-Stakes Game. In Advances in Insect Physiology; Tittiger, C., Blomquist, G.J., Eds.; Academic Press: London, UK, 2016; Volume 50, pp. 1–74. ISBN 9780128027233. [Google Scholar]
  30. Erbilgin, N.; Powell, J.S.; Raffa, K.F. Effect of Varying Monoterpene Concentrations on the Response of Ips Pini (Coleoptera: Scolytidae) to Its Aggregation Pheromone: Implications for Pest Management and Ecology of Bark Beetles. Agric. For. Entomol. 2003, 5, 269–274. [Google Scholar] [CrossRef]
  31. Bohbot, J.D.; Vernick, S. He Emergence of Insect Odorant Receptor-Based Biosensors. Biosensors 2020, 10, 26. [Google Scholar] [CrossRef]
  32. Lehmanski, L.M.; Kandasamy, D.; Andersson, M.N.; Netherer, S.; Alves, E.G.; Huang, J.; Hartmann, H. Viewpoints Addressing a Century-Old Hypothesis – Do Pioneer Beetles of Ips typographus Use Volatile Cues to Find Suitable Host Trees? New Phytol. 2023, 238, 1762–1770. [Google Scholar] [CrossRef]
  33. Andersson, M.N.; Larsson, M.C.; Schlyter, F. Specificity and Redundancy in the Olfactory System of the Bark Beetle Ips typographus: Single-Cell Responses to Ecologically Relevant Odors. J. Insect Physiol. 2009, 55, 556–567. [Google Scholar] [CrossRef] [PubMed]
  34. Tholl, D.; Boland, W.; Hansel, A.; Loreto, F.; Ro, U.S.R. Practical Approaches to Plant Volatile Analysis. Plant J. 2006, 45, 540–560. [Google Scholar] [CrossRef] [PubMed]
  35. Tholl, D.; Weinhold, A.; Röse, U.S.R. Practical Approaches to Plant Volatile Collection and Analysis. In Biology of Plant Volatiles; CRC Press: Boca Raton, FL, USA, 2020; p. 24. [Google Scholar]
  36. Malik, T.G.; Sahu, L.K.; Gupta, M.; Mir, B.A.; Gajbhiye, T.; Dubey, R.; McCormick, A.C.; Pandey, S.K. Environmental Factors Affecting Monoterpene Emissions from Terrestrial Vegetation. Plants 2023, 12, 3146. [Google Scholar] [CrossRef] [PubMed]
  37. Perreca, E.; Gershenzon, J.; Eberl, F. Tree Volatiles. In Biology of Plant Volatiles; CRC Press: Boca Raton, FL, USA, 2020; p. 15. ISBN 9780429455612. [Google Scholar]
  38. Křůmal, K.; Mikuška, P.; Večeřová, K.; Urban, O.; Pallozzi, E.; Večeřa, Z. Wet Effluent Diffusion Denuder: The Tool for Determination of Monoterpenes in Forest. Talanta 2016, 153, 260–267. [Google Scholar] [CrossRef] [PubMed]
  39. Amin, H.S.; Russo, R.S.; Sive, B.; Hoebeke, E.R.; Dodson, C.; Mccubbin, I.B.; Hallar, A.G.; Huff, K.E. Monoterpene Emissions from Bark Beetle Infested Engelmann Spruce Trees. Atmos. Environ. 2013, 72, 130–133. [Google Scholar] [CrossRef]
  40. Birgersson, G.; Bergström, G. Volatiles Released from Individual Spruce Bark Beetle Entrance Holes Quantitative Variations during the First Week of Attack. J. Chem. Ecol. 1989, 15, 2465–2483. [Google Scholar] [CrossRef] [PubMed]
  41. Giunta, A.D.; Runyon, J.B.; Jenkins, M.J.; Teich, M. Volatile and Within-Needle Terpene Changes to Douglas-Fir Trees Associated with Douglas-Fir Beetle (Coleoptera: Curculionidae) Attack. Environ. Entomol. 2016, 45, 920–929. [Google Scholar] [CrossRef] [PubMed]
  42. Son, Y.; Kim, K.; Jung, I.; Lee, S.; Kim, J. Seasonal Variations and Emission Fluxes of Monoterpene Emitted from Coniferous Trees in East Asia: Focused on Pinus Rigida and Pinus Koraiensis. J. Atmos. Chem. 2015, 72, 27–41. [Google Scholar] [CrossRef]
  43. Komenda, M.; Koppmann, R.; Wald, H. Monoterpene Emissions from Scots Pine (Pinus sylvestris): Field Studies of Emission Rate Variabilities. J. Geophys. Res. Atmos. 2002, 107, ACH-1. [Google Scholar] [CrossRef]
  44. Janson, R.; Serves, C. De Acetone and Monoterpene Emissions from the Boreal Forest in Northern Europe. Atmos. Environ. 2001, 35, 4629–4637. [Google Scholar] [CrossRef]
  45. Raveane, L.; Tisato, F.; Isak, I.; Traldi, P. Analyses of BioVOCs Variation Related to Vegetation Predominance in the Natural Park of Ampezzo Dolomites, UNESCO World Heritage Area of Dolomites. J. For. Res. 2013, 24, 439–448. [Google Scholar] [CrossRef]
  46. Graus, M.; Hansel, A.; Wisthaler, A.; Lindinger, C.; Forkel, R.; Hauff, K.; Steinbrecher, R. A Relaxed-Eddy-Accumulation Method for the Measurement of Isoprenoid Canopy-Fluxes Using an Online Gas-Chromatographic Technique and PTR-MS Simultaneously. Atmos. Environ. 2006, 40, 43–54. [Google Scholar] [CrossRef]
  47. Pallozzi, E.; Guidolotti, G.; Ciccioli, P.; Brilli, F.; Feil, S.; Calfapietra, C. Does the Novel Fast-GC Coupled with PTR-TOF-MS Allow a Significant Advancement in Detecting VOC Emissions from Plants? Agric. For. Meteorol. 2016, 216, 232–240. [Google Scholar] [CrossRef]
  48. Ruuskanen, T.M.; Kolari, P.; Bäck, J.; Kulmala, M.; Rinne, J.; Hakola, H.; Taipale, R.; Raivonen, M.; Altimir, N.; Hari, P. On-Line Field Measurements of Monoterpene Emissions from Scots Pine by Proton-Transfer-Reaction Mass Spectrometry. Boreal. Environ. Res. 2005, 10, 553–567. [Google Scholar]
  49. Bouvier-Brown, N.C.; Goldstein, A.H.; Gilman, J.B.; Kuster, W.C.; De Gouw, J.A. In-Situ Ambient Quantification of Monoterpenes, Sesquiterpenes, and Related Oxygenated Compounds during BEARPEX 2007: Implications for Gas-and Particle-Phase Chemistry. Atmos. Chem. Phys. 2009, 9, 5505–5518. [Google Scholar] [CrossRef]
  50. Faiola, C.; Taipale, D. Impact of Insect Herbivory on Plant Stress Volatile Emissions from Trees: A Synthesis of Quantitative Measurements and Recommendations for Future Research. Atmos. Environ. X 2020, 5, 100060. [Google Scholar] [CrossRef]
  51. Sousa, M.; Birgersson, G.; Karlsson Green, K.; Pollet, M.; Becher, P.G. Odors Attracting the Long-Legged Predator Medetera Signaticornis Loew to Ips typographus L. Infested Norway Spruce Trees. J. Chem. Ecol. 2023, 49, 451–464. [Google Scholar] [CrossRef]
  52. Bergström, R.; Hallquist, M.; Simpson, D.; Wildt, J.; Mentel, T.F. Biotic Stress: A Significant Contributor to Organic Aerosol in Europe? Atmos. Chem. Phys. 2014, 14, 13643–13660. [Google Scholar] [CrossRef]
  53. Park, J.H.; Goldstein, A.H.; Timkovsky, J.; Fares, S.; Weber, R.; Karlik, J.; Holzinger, R. Eddy Covariance Emission and Deposition Flux Measurements Using Proton Transfer Reaction–Time of Flight–Mass Spectrometry (PTR-TOF-MS): Comparison with PTR-MS Measured Vertical Gradients and Fluxes. Atmos. Chem. Phys. 2013, 13, 1439–1456. [Google Scholar] [CrossRef]
  54. Hakola, H.; Taipale, D.; Praplan, A.; Schallhart, S.; Thomas, S.; Tykkä, T.; Helin, A.; Bäck, J.; Hellén, H. Emissions of Volatile Organic Compounds from Norway Spruce and Potential Atmospheric Impacts. Front. For. Glob. Chang. 2023, 6, 1116414. [Google Scholar] [CrossRef]
  55. NJ Health Alpha-PINENE. Available online: https://nj.gov/health/eoh/rtkweb/documents/fs/0052.pdf (accessed on 11 December 2023).
  56. Baker, J.; Arey, J.; Atkinson, R. Kinetics of the Gas-Phase Reactions of OH Radicals, NO3 Radicals and O3 with Three C 7-Carbonyls Formed from the Atmospheric Reactions of Myrcene, Ocimene and Terpinolene. J. Atmos. Chem. 2004, 48, 241–260. [Google Scholar] [CrossRef]
  57. Guenther, A. Biological and Chemical Diversity of Biogenic Volatile Organic Emissions into the Atmosphere. Int. Sch. Res. Not. 2013, 786290. [Google Scholar] [CrossRef]
  58. Duan, C.; Li, J.; Zhang, Y.; Ding, K.; Geng, X. Portable Instruments for On-Site Analysis of Environmental Samples. Trends Anal. Chem. 2022, 154, 116653. [Google Scholar] [CrossRef]
  59. Hummel, H.E.; Miller, T.A. Techniques in Pheromone Research; Springer Science & Business Media: New York, NY, USA, 2012; ISBN 978-1-4612-9743-7. [Google Scholar]
  60. McQuate, S. The Smellicopter Is an Obstacle-Avoiding Drone That Uses a Live Moth Antenna to Seek out Smells. Available online: https://www.washington.edu/news/2020/12/07/smellicopter-avoids-obstacles-uses-live-moth-antenna-to-smell/ (accessed on 11 December 2023).
  61. Pajares, G. Overview and Current Status of Remote Sensing Applications Based on Unmanned Aerial Vehicles (UAVs). Photogramm. Eng. Remote. Sens. 2015, 81, 281–330. [Google Scholar] [CrossRef]
  62. Smigaj, M.; Gaulton, R.; Suárez, J.C.; Barr, S.L. Forest Ecology and Management Canopy Temperature from an Unmanned Aerial Vehicle as an Indicator of Tree Stress Associated with Red Band Needle Blight Severity. For. Ecol. Manag. 2019, 433, 699–708. [Google Scholar] [CrossRef]
Figure 1. Volatile collection of α-pinene under laboratory conditions from fresh drilled logs of Picea abies. (a) The collection of α-pinene occurred across three height levels, namely L1, L2, and L3. (b) Top view of the log pile; black dots indicate distances between the bark surface and the point of collection of α-pinene for each level.
Forests 15 00010 g001
Figure 2. Study site for the first forest spatial VOC measurement around the infested tree (30 June 2022). Locality Forests ČZU close to Stříbrná Skalice, the Czech Republic (49.913 N, 14.863 E). Black points—sampling points around the sampled bark beetle-infested tree, in nuptial chamber infestation stadia; red points—Norway spruce infested trees in later stadia of infestation or dead; green—healthy Norway Spruce trees; blue points—Scot pines.
Forests 15 00010 g002
Figure 3. Study site for the second forest spatial VOC measurement around the infested tree (24 August 2022) for data in the ČZU Forests close to Vyžlovka, the Czech Republic (49.981 N, 14.801 E). Black points—sampling points; red points—Norway spruce infested trees; green—healthy Norway Spruce trees; brown points—dead Norway Spruce trees; blue points—Scot pines; yellow points—beech trees.
Forests 15 00010 g003
Figure 4. Established collection directions for VOCs around trees newly infested by bark beetles.
Forests 15 00010 g004
Figure 5. SPME laboratory data collections of α-pinene, three replications. (a) Abundance of α-pinene for lab experiment at different distances from drilled stem (5 cm and 30 cm); (b) abundance of α-pinene for lab experiment at different height levels from the ground (L1—20 cm; L2—60 cm; L3—100 cm). Small red squares—Means; green boxes—Means ± SE; Whiskers—Means ±1.96*SE. Lowercase letters above columns indicate significant differences between different distance or different height level. The p-values result from Kruskal–Wallis test; n = 72.
Forests 15 00010 g005
Figure 6. First field detection of α-pinene distribution around Ips typographus-infested spruce (30 June 2022). (a) Abundance of α-pinene collected by SPME in different distances from stem (5 cm; 100 cm; 900 cm); (b) abundance of α-pinene collected by SPME at different height levels from ground (130 cm; 260 cm; 400 cm); (c) abundance of α-pinene collected by SPME in cardinal directions (S—south; N—north; E—east; W—west); (d) abundance of α-pinene collected by HayeSep-Q® cartridges in different distances from stem (5 cm; 100 cm; 900 cm); (e) abundance of α-pinene collected by HayeSep-Q® cartridges at different height levels from ground (130 cm; 260 cm); (f) abundance of α-pinene collected by HayeSep-Q® cartridges in cardinal directions (S—south; N—north; E—east; W—west). Small red squares—Means; green boxes—Means ± SE; Whiskers—Means ±1.96*SE. Lowercase letters above columns indicate significant differences between different distance different height level, and different orientation. The p-values result from Kruskal–Wallis test. (n = 27 SPME samples) (cartridges n = 12).
Forests 15 00010 g006
Figure 7. 3D distribution of α-pinene collected by SPME in first field data collection (30 June 2022). More saturated color means a higher abundance of α-pinene. The numbers in circles are relative peak areas of α-pinene.
Forests 15 00010 g007
Figure 8. The second field detection of α-pinene distribution around Ips typographus-infested spruce (24 August 2022). (a) Abundance of α-pinene collected by SPME at different distances from stem (5 cm; 100 cm; 900 cm); (b) abundance of α-pinene collected by SPME at different height levels from ground (130 cm; 260 cm; 400 cm); (c) abundance of α-pinene collected by SPME in cardinal directions (S—south; N—north; E—east; W—west); (d) abundance of α-pinene collected by HayeSep-Q® cartridges at different distances from stem (5 cm; 100 cm; 900 cm); (e) abundance of α-pinene collected by HayeSep-Q® cartridges at different height levels from ground (130 cm; 260 cm), abundance of α-pinene collected by HayeSep-Q® cartridges in cardinal directions (S—south; N—north; E—east; W—west). Small red squares—Means; green boxes—Means ± SE; Whiskers—Means ±1.96*SE. Lowercase letters above columns indicate significant differences between different distance, different height level, and different orientation. The p-values result from Kruskal–Wallis test. (n = 22 SPME samples) (cartridges n = 12).
Forests 15 00010 g008
Figure 9. 3D distribution of α-pinene collected by SPME in second field data collection (24 August 2022). More saturated color means a higher amount of collected α-pinene. The numbers in circles are relative peak areas of α-pinene.
Forests 15 00010 g009
Table 1. Methods of VOC collection from conifers in forests.
Tree Species/Stress OccasionsSampling SpecificationCompound (Unit)Technical Parameters (Sorbent; Amount; Flow Rate)Time of SorptionAnalytical MethodSource
Picea abies/intact forestStem (not specify)Individual monoterpenesTenax TA, (35/60)30 minGC-MS[38]
5 m above the ground; stainless steel TD tubesα-pinene 3.07 ± 0.25 ppbv200 mg; 200 mL/min
Picea abies/attacked treesStemIndividual monoterpenesTenax-TA a Carbopack-B, (60/80)60 minGC-MS[28]
1.3 m above the ground; surrounded PET (25 × 38 cm) encloserα-pinene 62.8 ± 23.6 μg h−1 m−2 bark area100/100 mg; 200 mL/min
Picea engelmannii/attacked treesStemIndividual monoterpenesPorapak Q120 minGC-MS[39]
0.5 to 1.5 m above the ground; the trunk by dynamic sampling <1 cm from stem (sorbent trap)α-pinene 8.5 ± 2.1 ng L−1110 mg; 400 mL/min
Picea abies/attacked trees on forest edgeStem 3 hVerbenone (ng/3 h): α-pinene (μg/3 h)Porapak Q, (80/100)180 minGC-MS[40]
1–2 m above the ground; sanitized T gllas tube0.6 (ng/3 h): (μg/3 h)70 mg; 20 mL/min
Pseudotsuga menziesii/attacked treesBranchIndividual VOCsHayeSep-Q30 minGC-MS[41]
1.5 m above the ground; Teflon bag (50 × 75 cm)α-pinene 813.9 ± 482.29 ng h−1 g−1 fresh weight30 mg; 500 mL/min
Pinus rigida and Pinus koraiensis/intact forestBranchTotal monoterpenes emission (μgC gdw−1 h−1)Tenax TA, (60/80) and Carbotrap, (20/40)15–60 minGC-MS GC-FID[42]
20 L Tedlar bagPinus rigida 0.9 μgC gdw−1 h−1 Pinus koraiensis 0.4 μgC gdw−1 h−1200 mg; 100–200 mL/min
Pinus sylvestris/intact forestBranchIndividual monoterpenesTenax TA, (60/80) and Carbotrap, (20/40)60 minGC-MS GC-FID[43]
canopy height; (FEP) copolymer foil (50 μm thickness) mounted in cylindrical framesα-pinene 917 ± 58 ng h−1 g−1 (April) α-pinene 75 ± 12 ng h−1 g−1 (July)50–100 mg; 100 mL/min
Pinus sylvestris and Picea abies/intact forestBranchAcetone and α-pinene (ng gdw−1 h−1)Tenax TA12–40 minGC-MS GC-FID[44]
18 L all-Teflon chamber made of 0.05 mm transparent FEP-Teflon film enclosing a 20–30 cm branch segmentα-pinene 80 ng gdw−1 h−1 Monoterpene emission 900 ± 640 ng C gdw−1 h−1200 mg; 100 mL/min
Picea abies/attacked treesStemIndividual VOCs (μg m−2 h −1)Tenax TA and Carbograph 1TD30 minGC-MS[27]
1.3 m above the ground; tree trunk chamber connected with PTFE tubingα-pinene 911.14 μg m−2 h−1200 mL/min
Picea abies/stress from sun irradiationStemIndividual monoterpenesSPME60 min (from 1 to 2 p.m.)GC-MS[17]
3.5 m above the ground; aluminum chambersum of eight main MT 8.5 log10 VOC
Picea abies/attacked treesStemIndividual monoterpenesSPME60 min (from 1 to 2 p.m.)GC-MS[8]
3.5 m above the ground; aluminum chamberα-pinene 9.5 log10 sum peak area
Lerosa NP forest/conifer forest; 6 different plotsopen airIndividual VOCsSPME300 min (from 10 a.m. to 3 p.m.)GC-MS[45]
894 abundance relative to hexanal (%)
Disclaimer/Publisher’s Note: The statements, opinions and data contained in all publications are solely those of the individual author(s) and contributor(s) and not of MDPI and/or the editor(s). MDPI and/or the editor(s) disclaim responsibility for any injury to people or property resulting from any ideas, methods, instructions or products referred to in the content.

