


Cannabinoid-Induced Inhibition of Morphine Glucuronidation and the Potential for In Vivo Drug–Drug Interactions

Abstract
:1. Introduction
2. Materials and Methods
2.1. Chemicals and Materials
2.2. Inhibition Screenings of Cannabinoids and Their Metabolites as Inhibitors of UGT2B7
2.3. IC50 Determinations
2.4. UPLC-MS/MS Analysis
2.5. Static Mechanistic In Vitro to In Vivo Extrapolation IVIVE
2.6. Data Analysis
3. Results
4. Discussion
Supplementary Materials
Author Contributions
Funding
Data Availability Statement
Acknowledgments
Conflicts of Interest
References
- Clark, J.D. Chronic pain prevalence and analgesic prescribing in a general medical population. J. Pain Symptom. Manag. 2002, 23, 131–137. [Google Scholar] [CrossRef]
- Manchikanti, L.; Abdi, S.; Atluri, S.; Balog, C.C.; Benyamin, R.M.; Boswell, M.V.; Brown, K.R.; Bruel, B.M.; Bryce, D.A.; Burks, P.A.; et al. American Society of Interventional Pain Physicians (ASIPP) guidelines for responsible opioid prescribing in chronic non-cancer pain: Part I--evidence assessment. Pain Physician 2012, 15, S1–S65. [Google Scholar] [CrossRef]
- Donnelly, S.; Davis, M.P.; Walsh, D.; Naughton, M. Morphine in cancer pain management: A practical guide. Support. Care Cancer 2002, 10, 13–35. [Google Scholar] [CrossRef]
- Stone, A.N.; Mackenzie, P.I.; Galetin, A.; Houston, J.B.; Miners, J.O. Isoform selectivity and kinetics of morphine 3- and 6-glucuronidation by human udp-glucuronosyltransferases: Evidence for atypical glucuronidation kinetics by UGT2B7. Drug Metab. Dispos. 2003, 31, 1086–1089. [Google Scholar] [CrossRef]
- Coffman, B.L.; Rios, G.R.; King, C.D.; Tephly, T.R. Human UGT2B7 catalyzes morphine glucuronidation. Drug Metab. Dispos. 1997, 25, 1–4. [Google Scholar]
- Ohno, S.; Kawana, K.; Nakajin, S. Contribution of UDP-glucuronosyltransferase 1A1 and 1A8 to morphine-6-glucuronidation and its kinetic properties. Drug Metab. Dispos. 2008, 36, 688–694. [Google Scholar] [CrossRef] [PubMed]
- Wittwer, E.; Kern, S.E. Role of morphine’s metabolites in analgesia: Concepts and controversies. AAPS J. 2006, 8, E348–E352. [Google Scholar] [CrossRef] [PubMed]
- Kilpatrick, G.J.; Smith, T.W. Morphine-6-glucuronide: Actions and mechanisms. Med. Res. Rev. 2005, 25, 521–544. [Google Scholar] [CrossRef] [PubMed]
- Projean, D.; Morin, P.E.; Tu, T.M.; Ducharme, J. Identification of CYP3A4 and CYP2C8 as the major cytochrome P450 s responsible for morphine N-demethylation in human liver microsomes. Xenobiotica 2003, 33, 841–854. [Google Scholar] [CrossRef] [PubMed]
- Kurogi, K.; Chepak, A.; Hanrahan, M.T.; Liu, M.Y.; Sakakibara, Y.; Suiko, M.; Liu, M.C. Sulfation of opioid drugs by human cytosolic sulfotransferases: Metabolic labeling study and enzymatic analysis. Eur. J. Pharm. Sci. 2014, 62, 40–48. [Google Scholar] [CrossRef] [PubMed]
- National Conference of State Legislatures. State Medical Cannabis Laws. Available online: https://www.ncsl.org/health/state-medical-cannabis-laws (accessed on 21 December 2023).
- Mahabir, V.K.; Merchant, J.J.; Smith, C.; Garibaldi, A. Medical cannabis use in the United States: A retrospective database study. J. Cannabis Res. 2020, 2, 32. [Google Scholar] [CrossRef]
- Sexton, M.; Cuttler, C.; Finnell, J.S.; Mischley, L.K. A Cross-Sectional Survey of Medical Cannabis Users: Patterns of Use and Perceived Efficacy. Cannabis Cannabinoid Res. 2016, 1, 131–138. [Google Scholar] [CrossRef]
- Wilson, M.; Gogulski, H.Y.; Cuttler, C.; Bigand, T.L.; Oluwoye, O.; Barbosa-Leiker, C.; Roberts, M.A. Cannabis use moderates the relationship between pain and negative affect in adults with opioid use disorder. Addict. Behav. 2018, 77, 225–231. [Google Scholar] [CrossRef]
- Clem, S.N.; Bigand, T.L.; Wilson, M. Cannabis Use Motivations among Adults Prescribed Opioids for Pain versus Opioid Addiction. Pain Manag. Nurs. 2020, 21, 43–47. [Google Scholar] [CrossRef]
- Kumar, R.N.; Chambers, W.A.; Pertwee, R.G. Pharmacological actions and therapeutic uses of cannabis and cannabinoids. Anaesthesia 2001, 56, 1059–1068. [Google Scholar] [CrossRef]
- Adams, I.B.; Martin, B.R. Cannabis: Pharmacology and toxicology in animals and humans. Addiction 1996, 91, 1585–1614. [Google Scholar] [CrossRef]
- Pertwee, R.G. The diverse CB1 and CB2 receptor pharmacology of three plant cannabinoids: Δ9-tetrahydrocannabinol, cannabidiol and Δ9-tetrahydrocannabivarin. Br. J. Pharmacol. 2008, 153, 199–215. [Google Scholar] [CrossRef]
- Pellati, F.; Borgonetti, V.; Brighenti, V.; Biagi, M.; Benvenuti, S.; Corsi, L.L. Cannabis sativa L. and Nonpsychoactive Cannabinoids: Their Chemistry and Role against Oxidative Stress, Inflammation, and Cancer. Biomed. Res. Int. 2018, 2018, 1691428. [Google Scholar] [CrossRef] [PubMed]
- Cunha, J.M.; Carlini, E.A.; Pereira, A.E.; Ramos, O.L.; Pimentel, C.; Gagliardi, R.; Sanvito, W.L.; Lander, N.; Mechoulam, R. Chronic administration of cannabidiol to healthy volunteers and epileptic patients. Pharmacology 1980, 21, 175–185. [Google Scholar] [CrossRef] [PubMed]
- Vaughan, C.W.; Christle, M.J. An analgesic role for cannabinoids. Med. J. Aust. 2000, 173, 270–272. [Google Scholar] [CrossRef] [PubMed]
- Karst, M.; Bernateck, M. Pain relief with cannabinoids—The importance of endocannabinoids and cannabinoids for pain therapy. Anasthesiol. Intensivmed. Notfallmed. Schmerzther. 2008, 43, 522–528. [Google Scholar] [CrossRef] [PubMed]
- Malfait, A.M.; Gallily, R.; Sumariwalla, P.F.; Malik, A.S.; Andreakos, E.; Mechoulam, R.; Feldmann, M. The nonpsychoactive cannabis constituent cannabidiol is an oral anti-arthritic therapeutic in murine collagen-induced arthritis. Proc. Natl. Acad. Sci. USA 2000, 97, 9561–9566. [Google Scholar] [CrossRef] [PubMed]
- Patilea-Vrana, G.I.; Anoshchenko, O.; Unadkat, J.D. Hepatic Enzymes Relevant to the Disposition of (−)-∆9-Tetrahydrocannabinol (THC) and Its Psychoactive Metabolite, 11-OH-THC. Drug Metab. Dispos. 2019, 47, 249–256. [Google Scholar] [CrossRef] [PubMed]
- Lemberger, L.; Crabtree, R.E.; Rowe, H.M. 11-hydroxy-9-tetrahydrocannabinol: Pharmacology, disposition, and metabolism of a major metabolite of marihuana in man. Science 1972, 177, 62–64. [Google Scholar] [CrossRef] [PubMed]
- Mazur, A.; Lichti, C.F.; Prather, P.L.; Zielinska, A.K.; Bratton, S.M.; Gallus-Zawada, A.; Finel, M.; Miller, G.P.; Radomińska-Pandya, A.; Moran, J.H. Characterization of Human Hepatic and Extrahepatic UDP-Glucuronosyltransferase Enzymes Involved in the Metabolism of Classic Cannabinoids. Drug Metab. Dispos. 2009, 37, 1496–1504. [Google Scholar] [CrossRef] [PubMed]
- Jiang, R.; Yamaori, S.; Takeda, S.; Yamamoto, I.; Watanabe, K. Identification of cytochrome P450 enzymes responsible for metabolism of cannabidiol by human liver microsomes. Life Sci. 2011, 89, 165–170. [Google Scholar] [CrossRef]
- Huestis, M.A. Human Cannabinoid Pharmacokinetics. Chem. Biodivers. 2007, 4, 1770–1804. [Google Scholar] [CrossRef]
- Harvey, D.J.; Mechoulam, R. Metabolites of cannabidiol identified in human urine. Xenobiotica 1990, 20, 303–320. [Google Scholar] [CrossRef]
- Huestis, M.A.; Sempio, C.; Newmeyer, M.N.; Andersson, M.; Barnes, A.J.; Abulseoud, O.A.; Blount, B.C.; Schroeder, J.; Smith, M.L. Free and Glucuronide Urine Cannabinoids after Controlled Smoked, Vaporized and Oral Cannabis Administration in Frequent and Occasional Cannabis Users. J. Anal. Toxicol. 2020, 44, 651–660. [Google Scholar] [CrossRef]
- Taylor, L.; Gidal, B.; Blakey, G.; Tayo, B.; Morrison, G. A Phase I, Randomized, Double-Blind, Placebo-Controlled, Single Ascending Dose, Multiple Dose, and Food Effect Trial of the Safety, Tolerability and Pharmacokinetics of Highly Purified Cannabidiol in Healthy Subjects. CNS Drugs 2018, 32, 1053–1067. [Google Scholar] [CrossRef]
- Jancova, P.; Anzenbacher, P.; Anzenbacherova, E. Phase II drug metabolizing enzymes. Biomed. Pap. Med. Fac. Univ. Palacky Olomouc Czech Repub. 2010, 154, 103–116. [Google Scholar] [CrossRef]
- Evans, W.E.; Relling, M.V. Pharmacogenomics: Translating functional genomics into rational therapeutics. Science 1999, 286, 487–491. [Google Scholar] [CrossRef]
- Williams, J.A.; Hyland, R.; Jones, B.C.; Smith, D.A.; Hurst, S.; Goosen, T.C.; Peterkin, V.; Koup, J.R.; Ball, S.E. Drug-drug interactions for UDP-glucuronosyltransferase substrates: A pharmacokinetic explanation for typically observed low exposure (AUCi/AUC) ratios. Drug Metab. Dispos. 2004, 32, 1201–1208. [Google Scholar] [CrossRef] [PubMed]
- Kiang, T.K.; Ensom, M.H.; Chang, T.K. UDP-glucuronosyltransferases and clinical drug-drug interactions. Pharmacol. Ther. 2005, 106, 97–132. [Google Scholar] [CrossRef] [PubMed]
- McCance-Katz, E.F.; Rainey, P.M.; Jatlow, P.; Friedland, G. Methadone effects on zidovudine disposition (AIDS Clinical Trials Group 262). J. Acquir. Immune Defic. Syndr. Hum. Retrovirol 1998, 18, 435–443. [Google Scholar] [CrossRef] [PubMed]
- Nasrin, S.; Watson, C.J.W.; Perez-Paramo, Y.X.; Lazarus, P. Cannabinoid Metabolites as Inhibitors of Major Hepatic CYP450 Enzymes, with Implications for Cannabis-Drug Interactions. Drug Metab. Dispos. 2021, 49, 1070–1080. [Google Scholar] [CrossRef]
- Nasrin, S.; Watson, C.J.W.; Bardhi, K.; Fort, G.; Chen, G.; Lazarus, P. Inhibition of UDP-Glucuronosyltransferase Enzymes by Major Cannabinoids and Their Metabolites. Drug Metab. Dispos. 2021, 49, 1081–1089. [Google Scholar] [CrossRef]
- Jiang, R.; Yamaori, S.; Okamoto, Y.; Yamamoto, I.; Watanabe, K. Cannabidiol is a potent inhibitor of the catalytic activity of cytochrome P450 2C19. Drug Metab. Pharmacokinet. 2013, 28, 332–338. [Google Scholar] [CrossRef] [PubMed]
- Yamaori, S.; Kushihara, M.; Yamamoto, I.; Watanabe, K. Characterization of major phytocannabinoids, cannabidiol and cannabinol, as isoform-selective and potent inhibitors of human CYP1 enzymes. Biochem. Pharmacol. 2010, 79, 1691–1698. [Google Scholar] [CrossRef] [PubMed]
- Yamaori, S.; Okamoto, Y.; Yamamoto, I.; Watanabe, K. Cannabidiol, a major phytocannabinoid, as a potent atypical inhibitor for CYP2D6. Drug Metab. Dispos. 2011, 39, 2049–2056. [Google Scholar] [CrossRef]
- Yamaori, S.; Maeda, C.; Yamamoto, I.; Watanabe, K. Differential inhibition of human cytochrome P450 2A6 and 2B6 by major phytocannabinoids. Forensic Toxicol. 2011, 29, 117–124. [Google Scholar] [CrossRef]
- Yamaori, S.; Ebisawa, J.; Okushima, Y.; Yamamoto, I.; Watanabe, K. Potent inhibition of human cytochrome P450 3A isoforms by cannabidiol: Role of phenolic hydroxyl groups in the resorcinol moiety. Life Sci. 2011, 88, 730–736. [Google Scholar] [CrossRef] [PubMed]
- Bansal, S.; Maharao, N.; Paine, M.F.; Unadkat, J.D. Predicting the Potential for Cannabinoids to Precipitate Pharmacokinetic Drug Interactions via Reversible Inhibition or Inactivation of Major Cytochromes P450. Drug Metab. Dispos. 2020, 48, 1008–1017. [Google Scholar] [CrossRef] [PubMed]
- Cox, E.J.; Maharao, N.; Patilea-Vrana, G.; Unadkat, J.D.; Rettie, A.E.; McCune, J.S.; Paine, M.F. A marijuana-drug interaction primer: Precipitants, pharmacology, and pharmacokinetics. Pharmacol. Ther. 2019, 201, 25–38. [Google Scholar] [CrossRef] [PubMed]
- Dellinger, R.W.; Fang, J.-L.; Chen, G.; Weinberg, R.; Lazarus, P. Importance of UDP-glucuronosyltransferase 1A10 (UGT1A10) in the detoxification of polycyclic aromatic hydrocarbons: Decreased glucuronidative activity of the UGT1A10 (139LYS) isoform. Drug Metab. Dispos. 2006, 34, 943–949. [Google Scholar] [CrossRef] [PubMed]
- Peterson, A.; Xia, Z.; Chen, G.; Lazarus, P. In vitro metabolism of exemestane by hepatic cytochrome P450s: Impact of nonsynonymous polymorphisms on formation of the active metabolite 17. Pharmacol. Res. Perspect. 2017, 5, e00314. [Google Scholar] [CrossRef] [PubMed]
- Coffman, B.L.; King, C.D.; Rios, G.R.; Tephly, T.R. The glucuronidation of opioids, other xenobiotics, and androgens by human UGT2B7Y(268) and UGT2B7H(268). Drug Metab. Dispos. 1998, 26, 73–77. [Google Scholar] [PubMed]
- Rowland, A.; Gaganis, P.; Elliot, D.J.; Mackenzie, P.I.; Knights, K.M.; Miners, J.O. Binding of Inhibitory Fatty Acids Is Responsible for the Enhancement of UDP-Glucuronosyltransferase 2B7 Activity by Albumin: Implications for in Vitro-in Vivo Extrapolation. J. Pharmacol. Exp. Ther. 2007, 321, 137–147. [Google Scholar] [CrossRef]
- Miners, J.O.; Rowland, A.; Novak, J.J.; Lapham, K.; Goosen, T.C. Evidence-based strategies for the characterisation of human drug and chemical glucuronidation in vitro and UDP-glucuronosyltransferase reaction phenotyping. Pharmacol. Ther. 2021, 218, 107689. [Google Scholar] [CrossRef]
- Patilea-Vrana, G.I.; Unadkat, J.D. Quantifying Hepatic Enzyme Kinetics of (-)-∆9-Tetrahydrocannabinol (THC) and Its Psychoactive Metabolite, 11-OH-THC, through In Vitro Modeling. Drug Metab. Dispos. 2019, 47, 743–752. [Google Scholar] [CrossRef]
- Garrett, E.R.; Hunt, C.A. Physiochemical properties, solubility, and protein binding of delta9-tetrahydrocannabinol. J. Pharm. Sci. 1974, 63, 1056–1064. [Google Scholar] [CrossRef]
- FDA, U.S. Food & Drug Administration. In Vitro Drug Interaction Studies–Cytochrome P450 Enzyme–and Transporter-Mediated Drug Interactions Guidance for Industry; Food and Drug Administration: Rockville, MD, USA, 2020; pp. 1–46. [Google Scholar]
- Hasselström, J.; Säwe, J. Morphine pharmacokinetics and metabolism in humans. Enterohepatic cycling and relative contribution of metabolites to active opioid concentrations. Clin. Pharmacokinet. 1993, 24, 344–354. [Google Scholar] [CrossRef]
- Schwilke, E.W.; Schwope, D.M.; Karschner, E.L.; Lowe, R.H.; Darwin, W.D.; Kelly, D.L.; Goodwin, R.S.; Gorelick, D.A.; Huestis, M.A. Δ9-Tetrahydrocannabinol (THC), 11-Hydroxy-THC, and 11-Nor-9-carboxy-THC Plasma Pharmacokinetics during and after Continuous High-Dose Oral THC. Clin. Chem. 2009, 55, 2180–2189. [Google Scholar] [CrossRef]
- Bansal, S.; Paine, M.F.; Unadkat, J.D. Comprehensive Predictions of Cytochrome P450 (P450)-Mediated In Vivo Cannabinoid-Drug Interactions Based on Reversible and Time-Dependent P450 Inhibition in Human Liver Microsomes. Drug Metab. Dispos. Biol. Fate Chem. 2022, 50, 351–360. [Google Scholar] [CrossRef] [PubMed]
- De Gregori, S.; De Gregori, M.; Ranzani, G.N.; Allegri, M.; Minella, C.; Regazzi, M. Morphine metabolism, transport and brain disposition. Metab. Brain Dis. 2012, 27, 1–5. [Google Scholar] [CrossRef] [PubMed]
- Cheng, Z.; Radominska-Pandya, A.; Tephly, T.R. Studies on the substrate specificity of human intestinal UDP- lucuronosyltransferases 1A8 and 1A10. Drug Metab. Dispos. 1999, 27, 1165–1170. [Google Scholar] [PubMed]
- Green, M.D.; King, C.D.; Mojarrabi, B.; Mackenzie, P.I.; Tephly, T.R. Glucuronidation of amines and other xenobiotics catalyzed by expressed human UDP-glucuronosyltransferase 1A3. Drug Metab. Dispos. 1998, 26, 507–512. [Google Scholar] [PubMed]
- Miners, J.O.; Mackenzie, P.I.; Knights, K.M. The prediction of drug-glucuronidation parameters in humans: UDP-glucuronosyltransferase enzyme-selective substrate and inhibitor probes for reaction phenotyping and in vitro-in vivo extrapolation of drug clearance and drug-drug interaction potential. Drug Metab. Rev. 2010, 42, 196–208. [Google Scholar] [CrossRef] [PubMed]
- Atkins, W.M. Mechanisms of promiscuity among drug metabolizing enzymes and drug transporters. FEBS J. 2020, 287, 1306–1322. [Google Scholar] [CrossRef] [PubMed]
- Nadulski, T.; Pragst, F.; Weinberg, G.; Roser, P.; Schnelle, M.; Fronk, E.M.; Stadelmann, A.M. Randomized, double-blind, placebo-controlled study about the effects of cannabidiol (CBD) on the pharmacokinetics of Delta9-tetrahydrocannabinol (THC) after oral application of THC verses standardized cannabis extract. Ther. Drug Monit. 2005, 27, 799–810. [Google Scholar] [CrossRef] [PubMed]
- Manini, A.F.; Yiannoulos, G.; Bergamaschi, M.M.; Hernandez, S.; Olmedo, R.; Barnes, A.J.; Winkel, G.; Sinha, R.; Jutras-Aswad, D.; Huestis, M.A.; et al. Safety and Pharmacokinetics of Oral Cannabidiol When Administered Concomitantly With Intravenous Fentanyl in Humans. J. Addict. Med. 2015, 9, 204–210. [Google Scholar] [CrossRef] [PubMed]
- Sharma, P.; Murthy, P.; Bharath, M.M. Chemistry, metabolism, and toxicology of cannabis: Clinical implications. Iran. J. Psychiatry 2012, 7, 149–156. [Google Scholar] [PubMed]


Metabolite | Enzyme a | THC | 11-OH-THC | 11-COOH-THC | CBD | 7-OH-CBD | |||||
|---|---|---|---|---|---|---|---|---|---|---|---|
| IC50 | IC50,u b | IC50 | IC50,u b | IC50 | IC50,ub | IC50 | IC50,u b | IC50 | IC50,u b | ||
| Morphine-3-Glucuronide | rUGT2B7 | 20 ± 8.1 | 0.85 ± 0.34 | 12 ± 3.5 | 0.96 ± 0.27 | 47 ± 15 | 3.7 ± 1.2 c | 9.1 ± 4.3 | 0.35 ± 0.17 | 38 ± 27 | 3.0 ± 2.1 c |
| HLM | 24 ± 5.5 | 1.2 ± 0.27 | 18 ± 17 | 1.7 ± 1.6 | 184 ± 37 | 17 ± 3.5 c | 8.2 ± 4.5 | 0.42 ± 0.23 | 17 ± 6.1 | 1.6 ± 0.57 c | |
| Morphine-6-Glucuronide | rUGT2B7 | 8.1 ± 1.6 | 0.34 ± 0.07 | 12 ± 3.6 | 0.96 ± 0.28 | 55 ± 15 | 4.3 ± 1.2 c | 4.9 ± 1.7 | 0.19 ± 0.06 | 39 ± 9.0 | 3.0 ± 0.70 c |
| HLM | 15 ± 3.3 | 0.74 ± 0.16 | 13 ± 10 | 1.2 ± 0.95 | 104 ± 16 | 9.8 ± 1.5 c | 6.3 ± 2.6 | 0.32 ± 0.13 | 8.0 ± 2.5 | 0.75 ± 0.24 c | |
Inhibitor | Morphine-3-Glucuronide | Morphine-6-Glucuronide | ||
|---|---|---|---|---|
| Calculated Ki a (µM) | Calculated Ki,u b (µM) | Calculated Ki a (µM) | Calculated Ki,u b (µM) | |
| THC | 12.2 ± 2.77 | 0.59 ± 0.13 | 7.69 ± 1.63 | 0.37 ± 0.08 |
| 11-OH-THC | 8.82 ± 8.42 | 0.82 ± 0.79 | 6.61 ± 5.02 | 0.62 ± 0.47 |
| 11-COOH-THC | 91.6 ± 18.5 | 8.61 ± 1.74 c | 52.1 ± 8.16 | 4.89 ± 0.77 c |
| CBD | 4.11 ± 2.24 | 0.21 ± 0.11 | 3.16 ± 1.32 | 0.16 ± 0.07 |
| 7-OH-CBD | 8.59 ± 3.05 | 0.81 ± 0.29 c | 3.99 ± 2.54 | 0.38 ± 0.12 c |
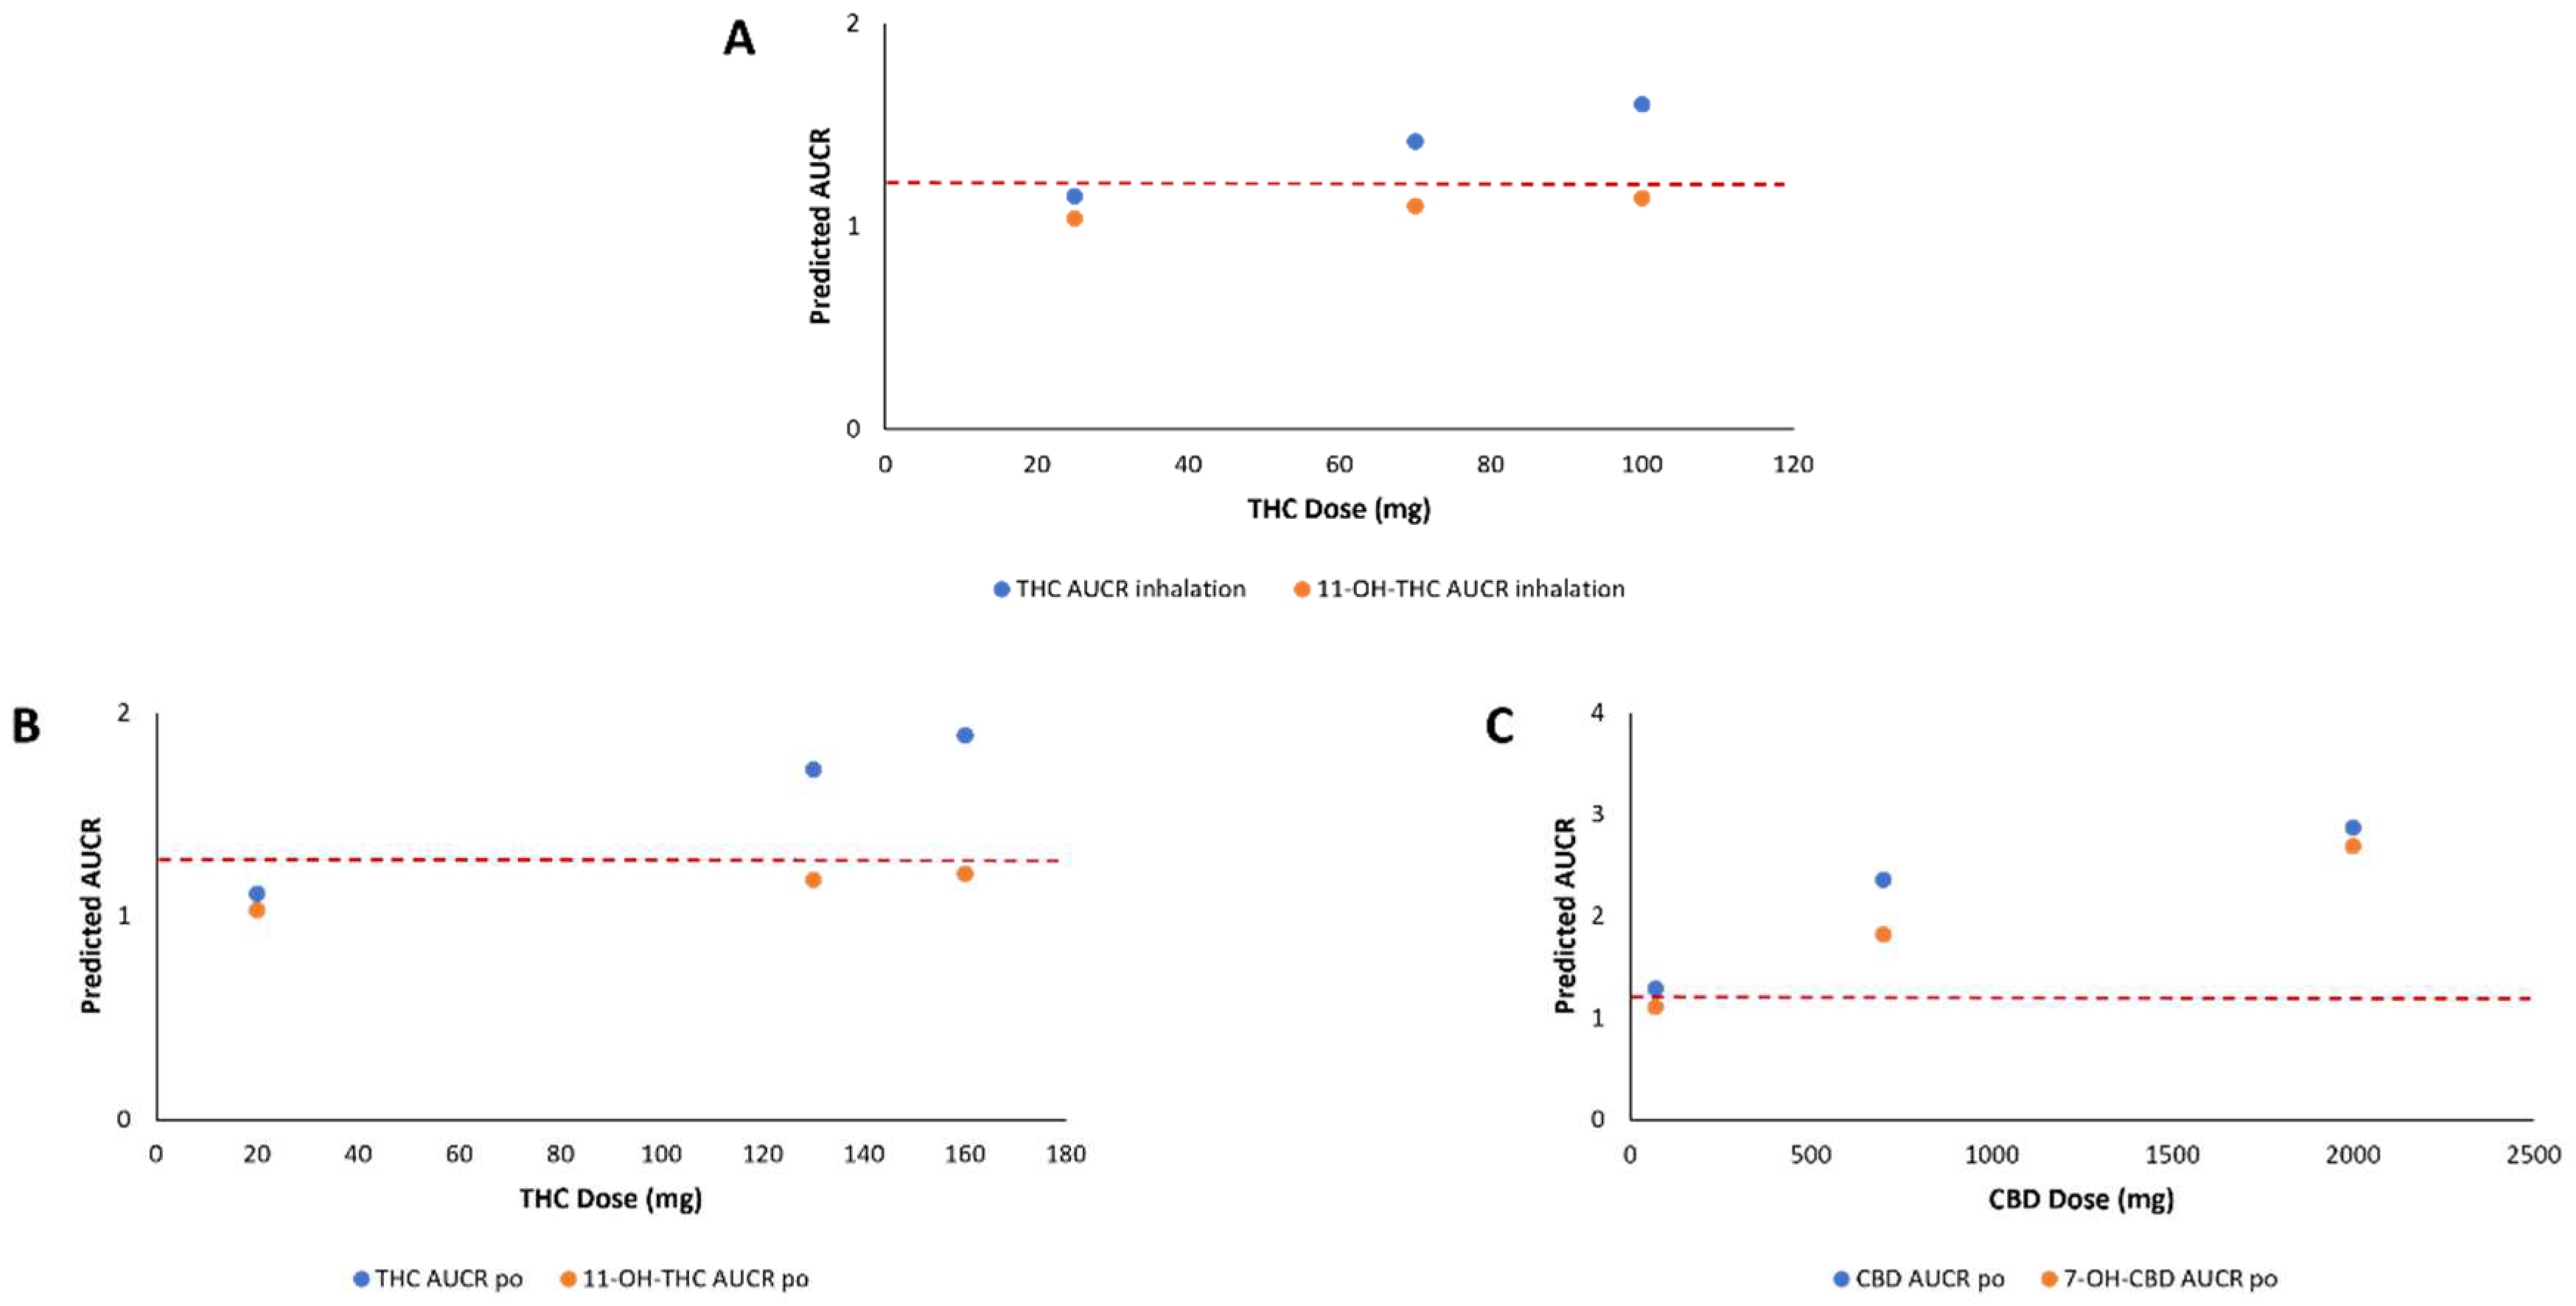
| Cannabinoid | Dose (mg) a | Route of Administration | Morphine AUCR c |
|---|---|---|---|
| THC | 20 | Oral | 1.07 |
| 130 | Oral | 1.41 b | |
| 160 | Oral | 1.48 | |
| 25 | Inhalation | 1.10 | |
| 70 | Inhalation | 1.26 | |
| 100 | Inhalation | 1.35 | |
| 11-OH-THC | 20 | Oral | 1.03 |
| 130 | Oral | 1.18 | |
| 160 | Oral | 1.21 | |
| 25 | Inhalation | 1.04 | |
| 70 | Inhalation | 1.10 | |
| 100 | Inhalation | 1.14 | |
| 11-COOH-THC | 20 | Oral | 1.01 |
| 130 | Oral | 1.03 | |
| 160 | Oral | 1.04 | |
| 25 | Inhalation | 1.01 | |
| 70 | Inhalation | 1.02 | |
| 100 | Inhalation | 1.02 | |
| CBD | 70 | Oral | 1.29 |
| 700 | Oral | 2.36 | |
| 2000 | Oral | 2.87 | |
| 19 | Inhalation | 1.10 | |
| 7-OH-CBD | 70 | Oral | 1.11 |
| 700 | Oral | 1.82 | |
| 2000 | Oral | 2.69 | |
| 19 | Inhalation | N.D. d |
Disclaimer/Publisher’s Note: The statements, opinions and data contained in all publications are solely those of the individual author(s) and contributor(s) and not of MDPI and/or the editor(s). MDPI and/or the editor(s) disclaim responsibility for any injury to people or property resulting from any ideas, methods, instructions or products referred to in the content. |
© 2024 by the authors. Licensee MDPI, Basel, Switzerland. This article is an open access article distributed under the terms and conditions of the Creative Commons Attribution (CC BY) license (https://creativecommons.org/licenses/by/4.0/).
Share and Cite
Coates, S.; Bardhi, K.; Lazarus, P. Cannabinoid-Induced Inhibition of Morphine Glucuronidation and the Potential for In Vivo Drug–Drug Interactions. Pharmaceutics 2024, 16, 418. https://doi.org/10.3390/pharmaceutics16030418
Coates S, Bardhi K, Lazarus P. Cannabinoid-Induced Inhibition of Morphine Glucuronidation and the Potential for In Vivo Drug–Drug Interactions. Pharmaceutics. 2024; 16(3):418. https://doi.org/10.3390/pharmaceutics16030418
Chicago/Turabian StyleCoates, Shelby, Keti Bardhi, and Philip Lazarus. 2024. "Cannabinoid-Induced Inhibition of Morphine Glucuronidation and the Potential for In Vivo Drug–Drug Interactions" Pharmaceutics 16, no. 3: 418. https://doi.org/10.3390/pharmaceutics16030418
APA StyleCoates, S., Bardhi, K., & Lazarus, P. (2024). Cannabinoid-Induced Inhibition of Morphine Glucuronidation and the Potential for In Vivo Drug–Drug Interactions. Pharmaceutics, 16(3), 418. https://doi.org/10.3390/pharmaceutics16030418