
First Generic Teriparatide: Structural and Biological Sameness to Its Reference Medicinal Product


 , , , , ,
Abstract
:1. Introduction
2. Materials and Methods
2.1. Drug Products
2.2. Peptide and Excipient Composition Assessment
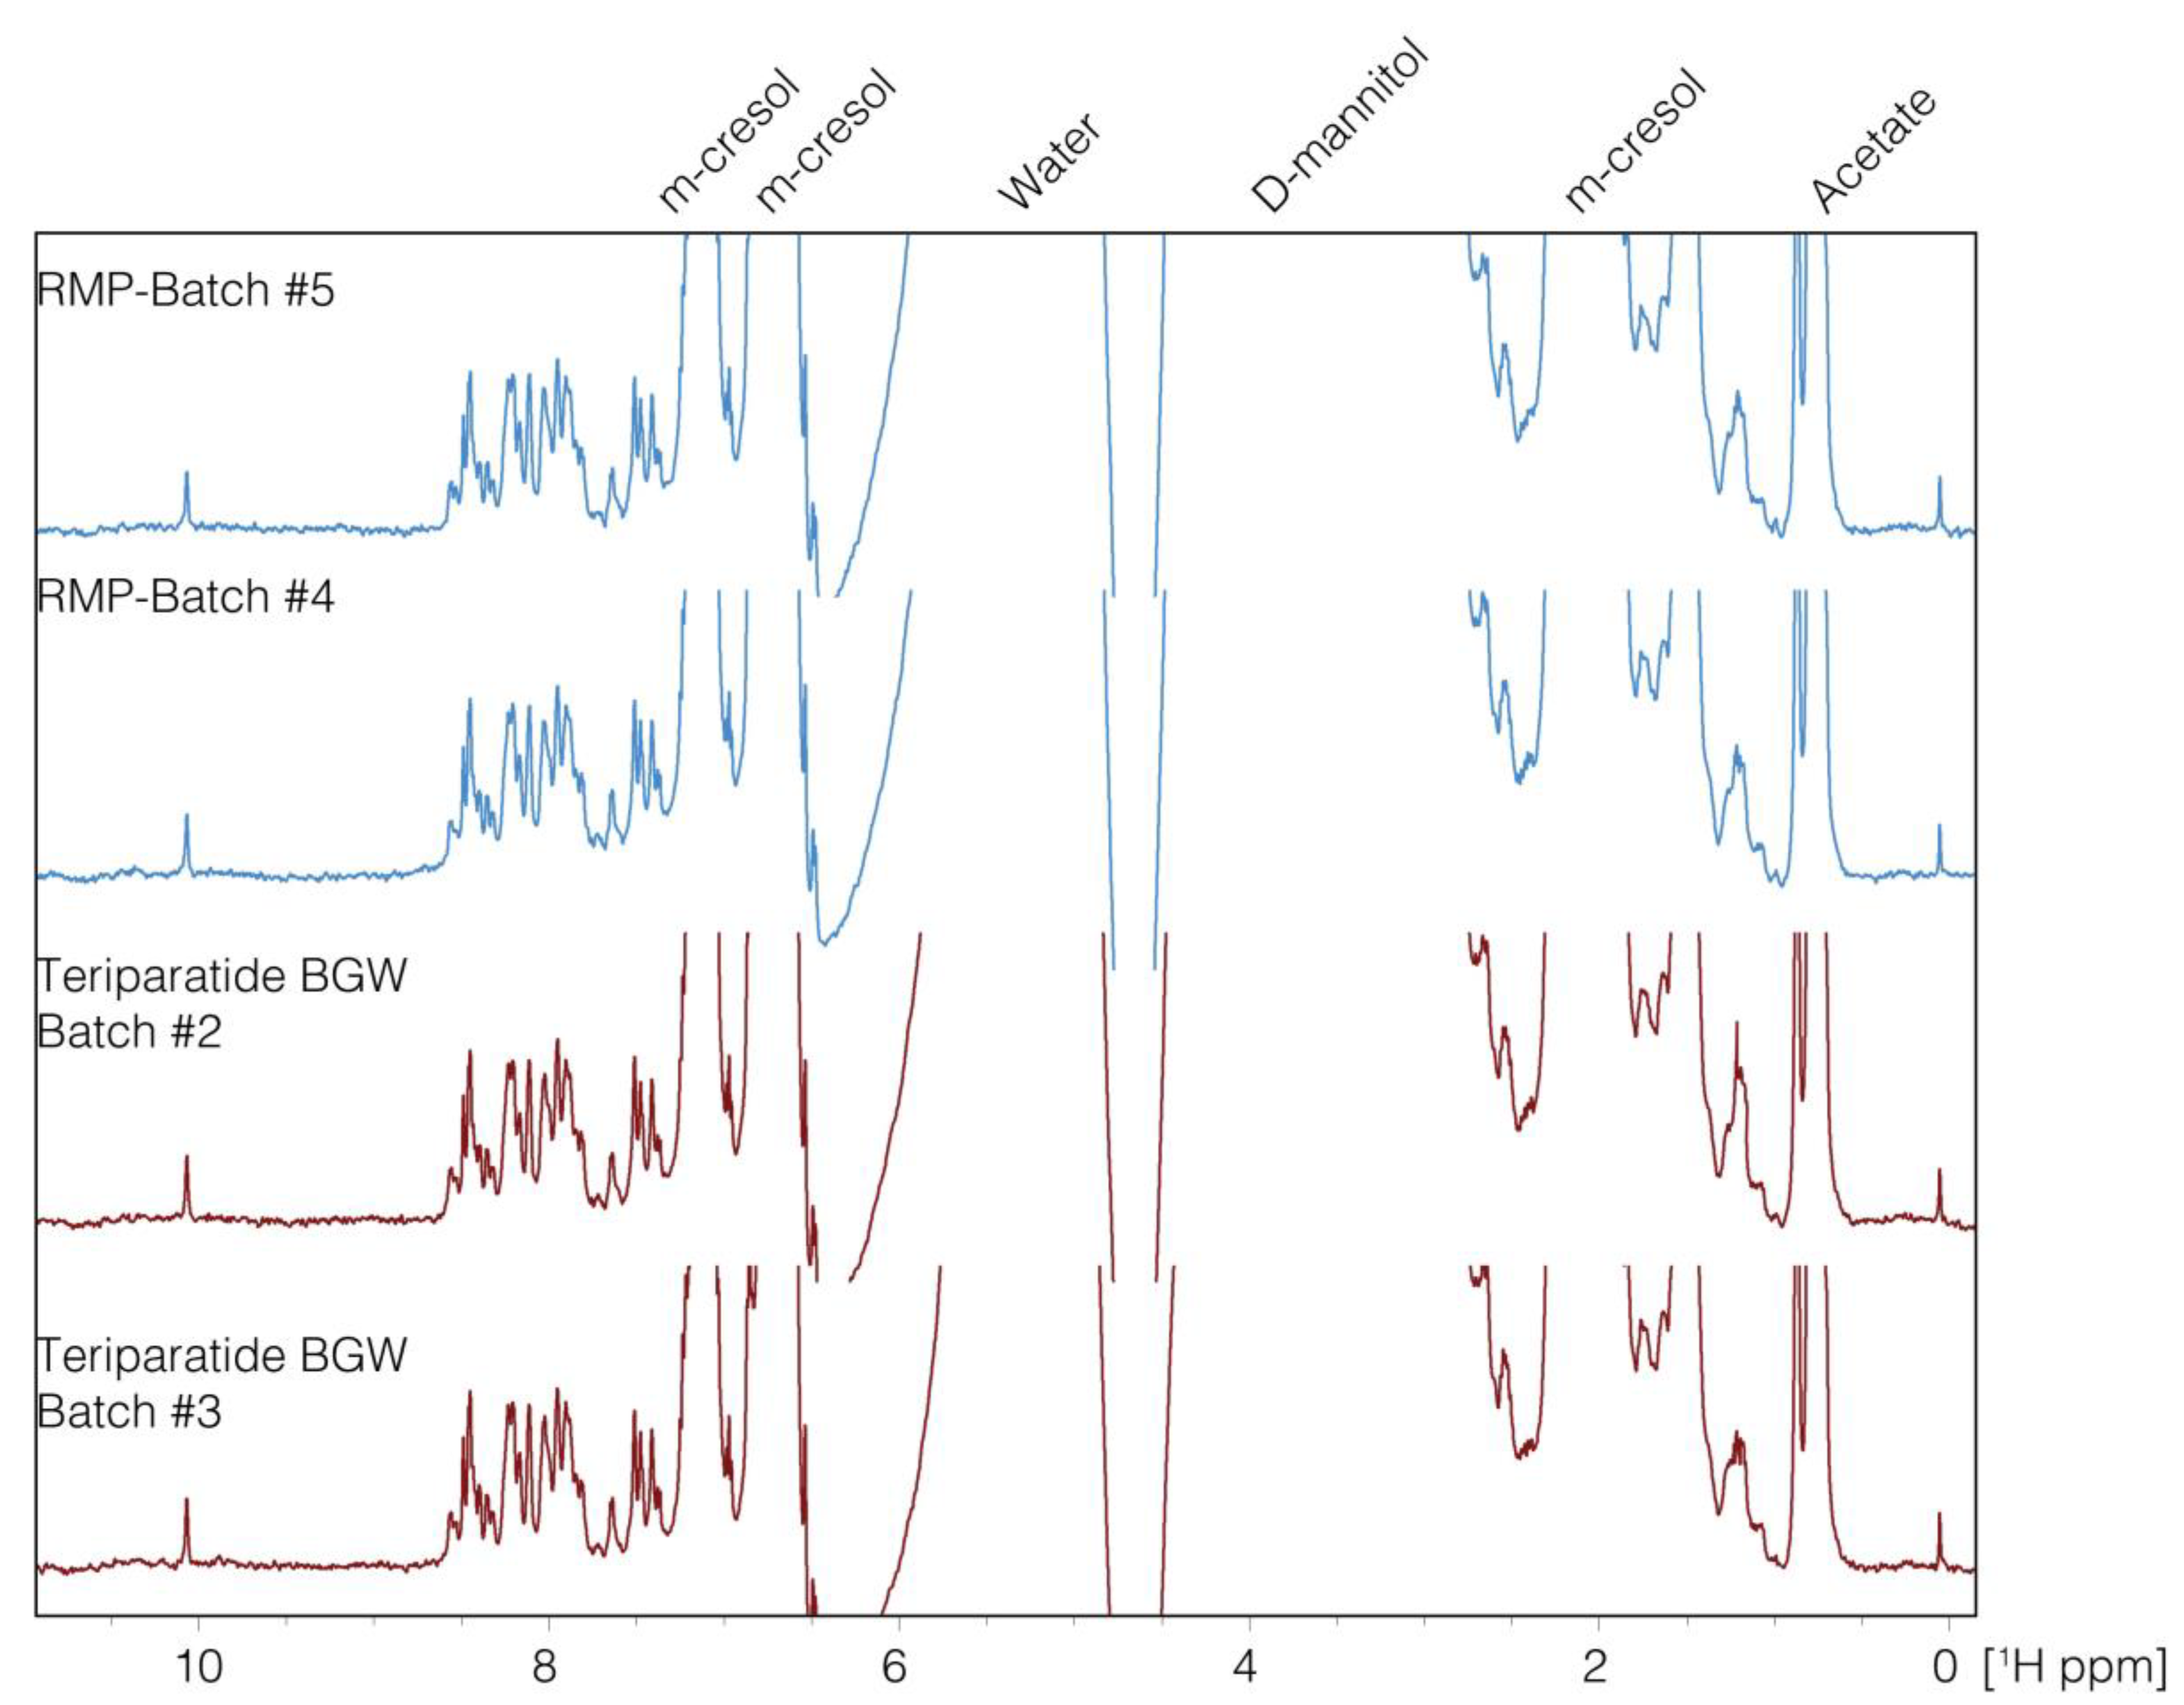
1D-NMR
2.3. High-Order Structure Assessment
2.3.1. 2D-NMR
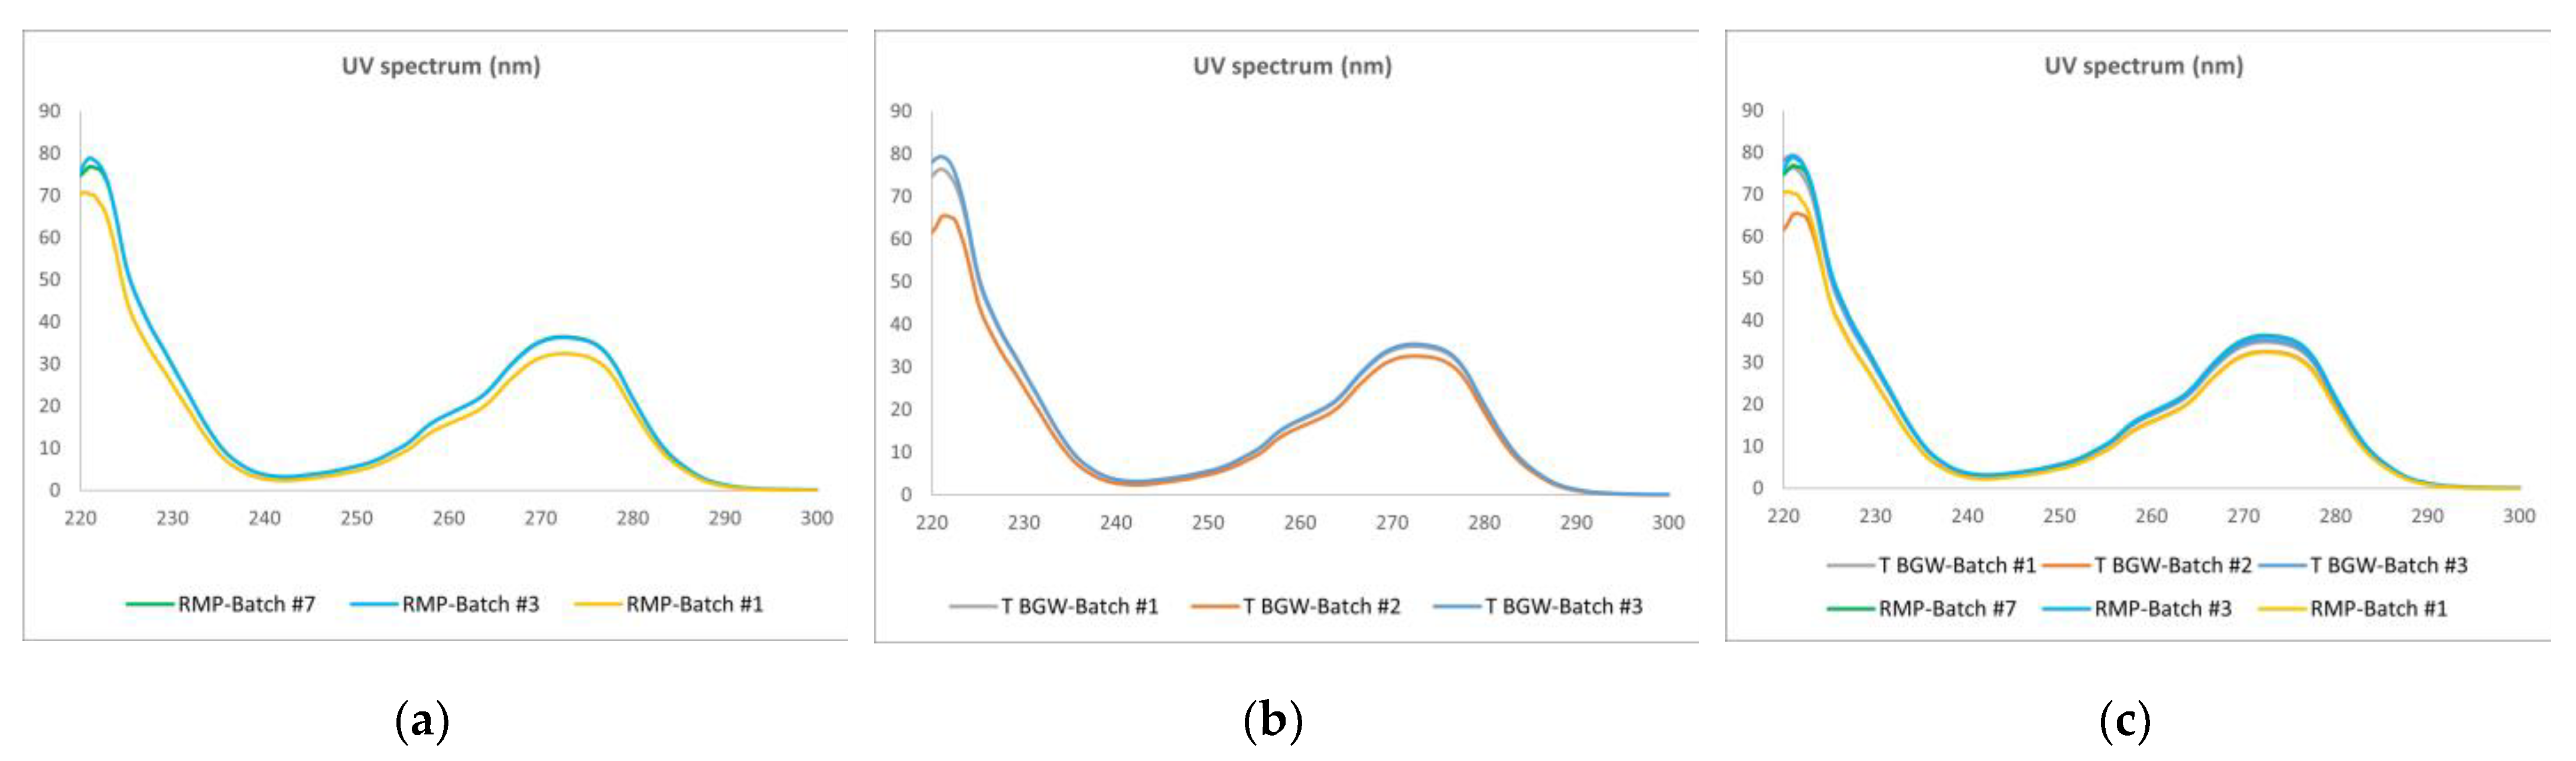
2.3.2. UV–Vis
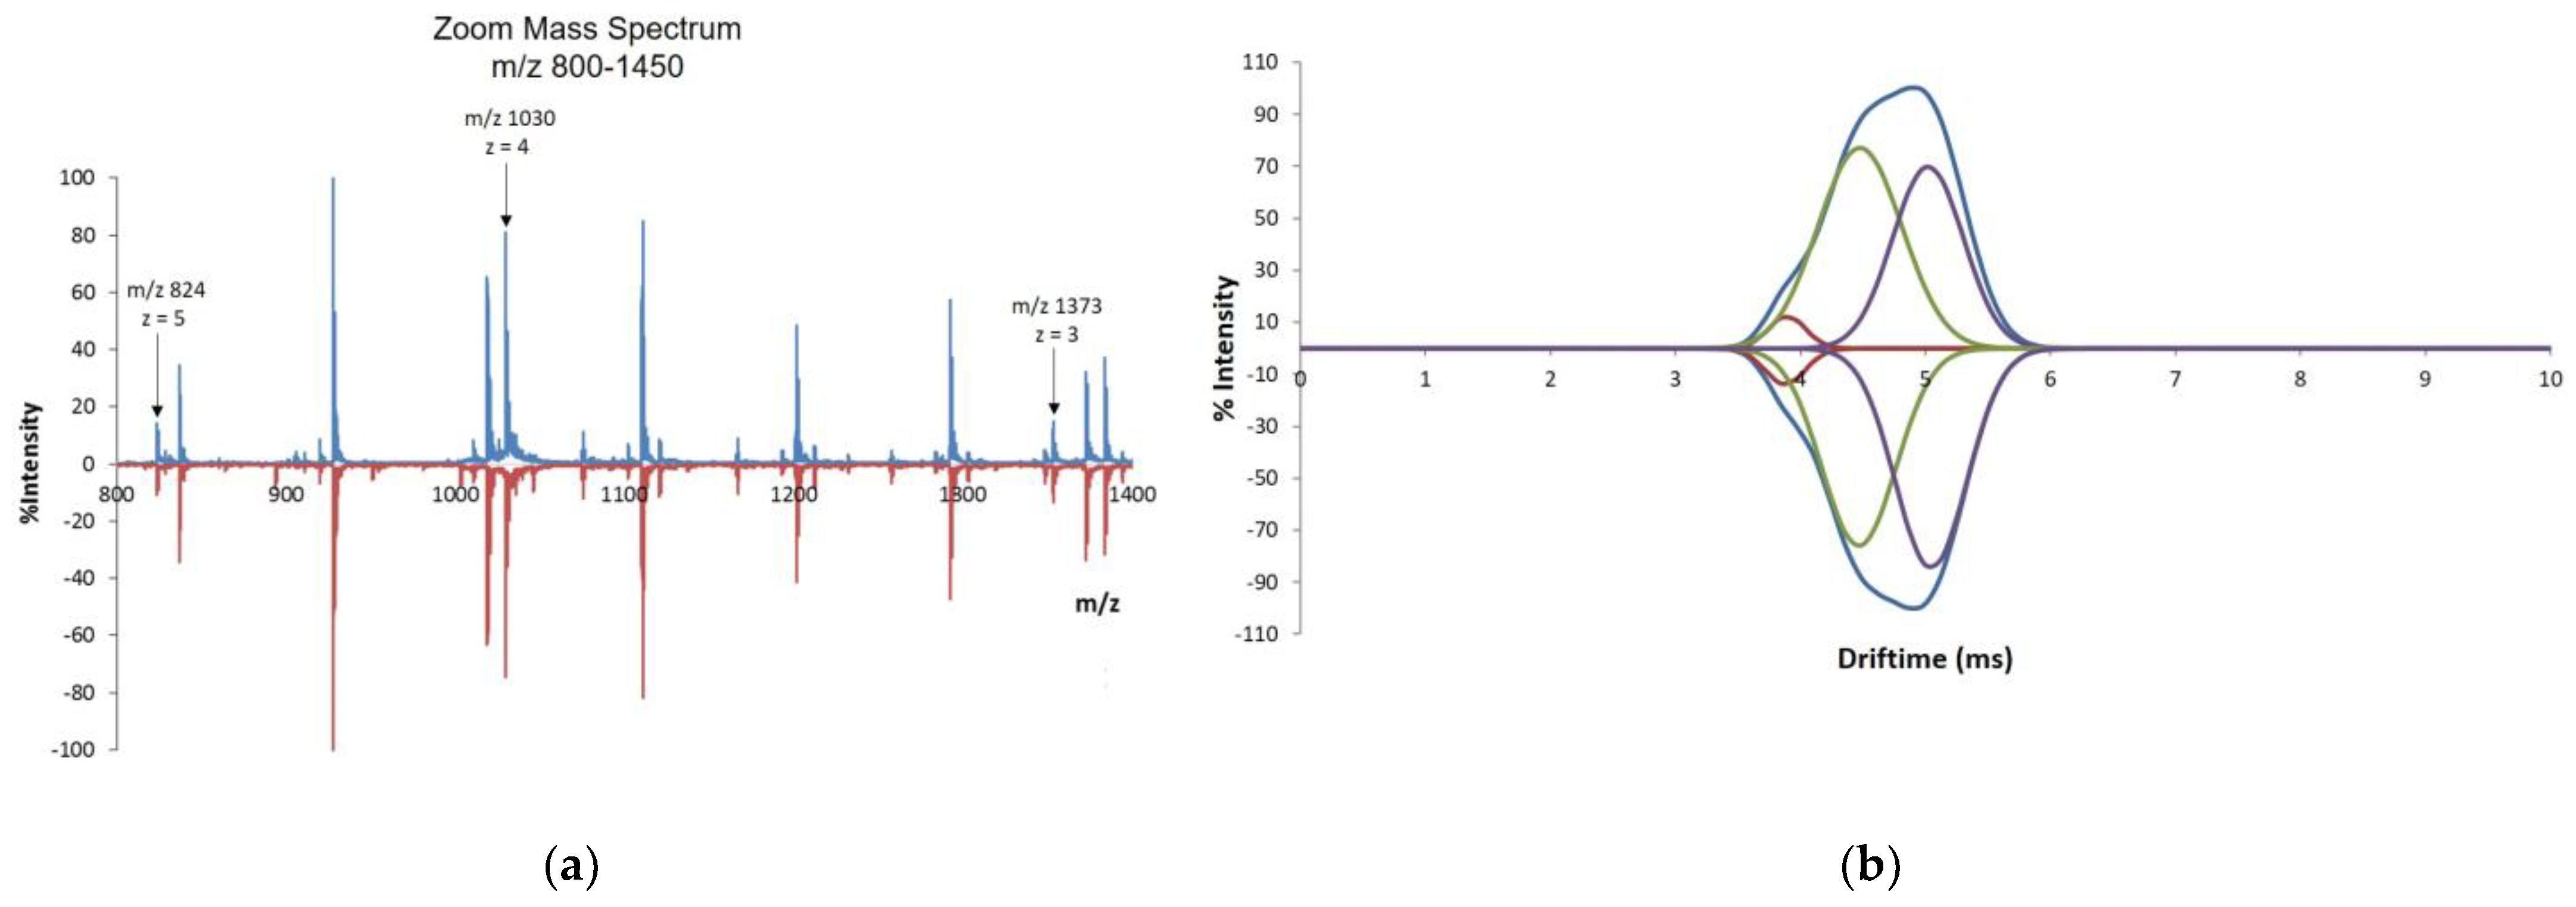
2.3.3. IM–MS
2.3.4. Circular Dichroism (CD) and Fourier Transform Infrared (FTIR)
2.4. Biological Activity Assessment
2.4.1. SaOS-2- PTH1R- Homogeneous Time Resolved Fluorescence (HTRF)
2.4.2. CHO-K1- PTH1R- Enzyme Fragment Complementation (EFC)
3. Results and Discussion
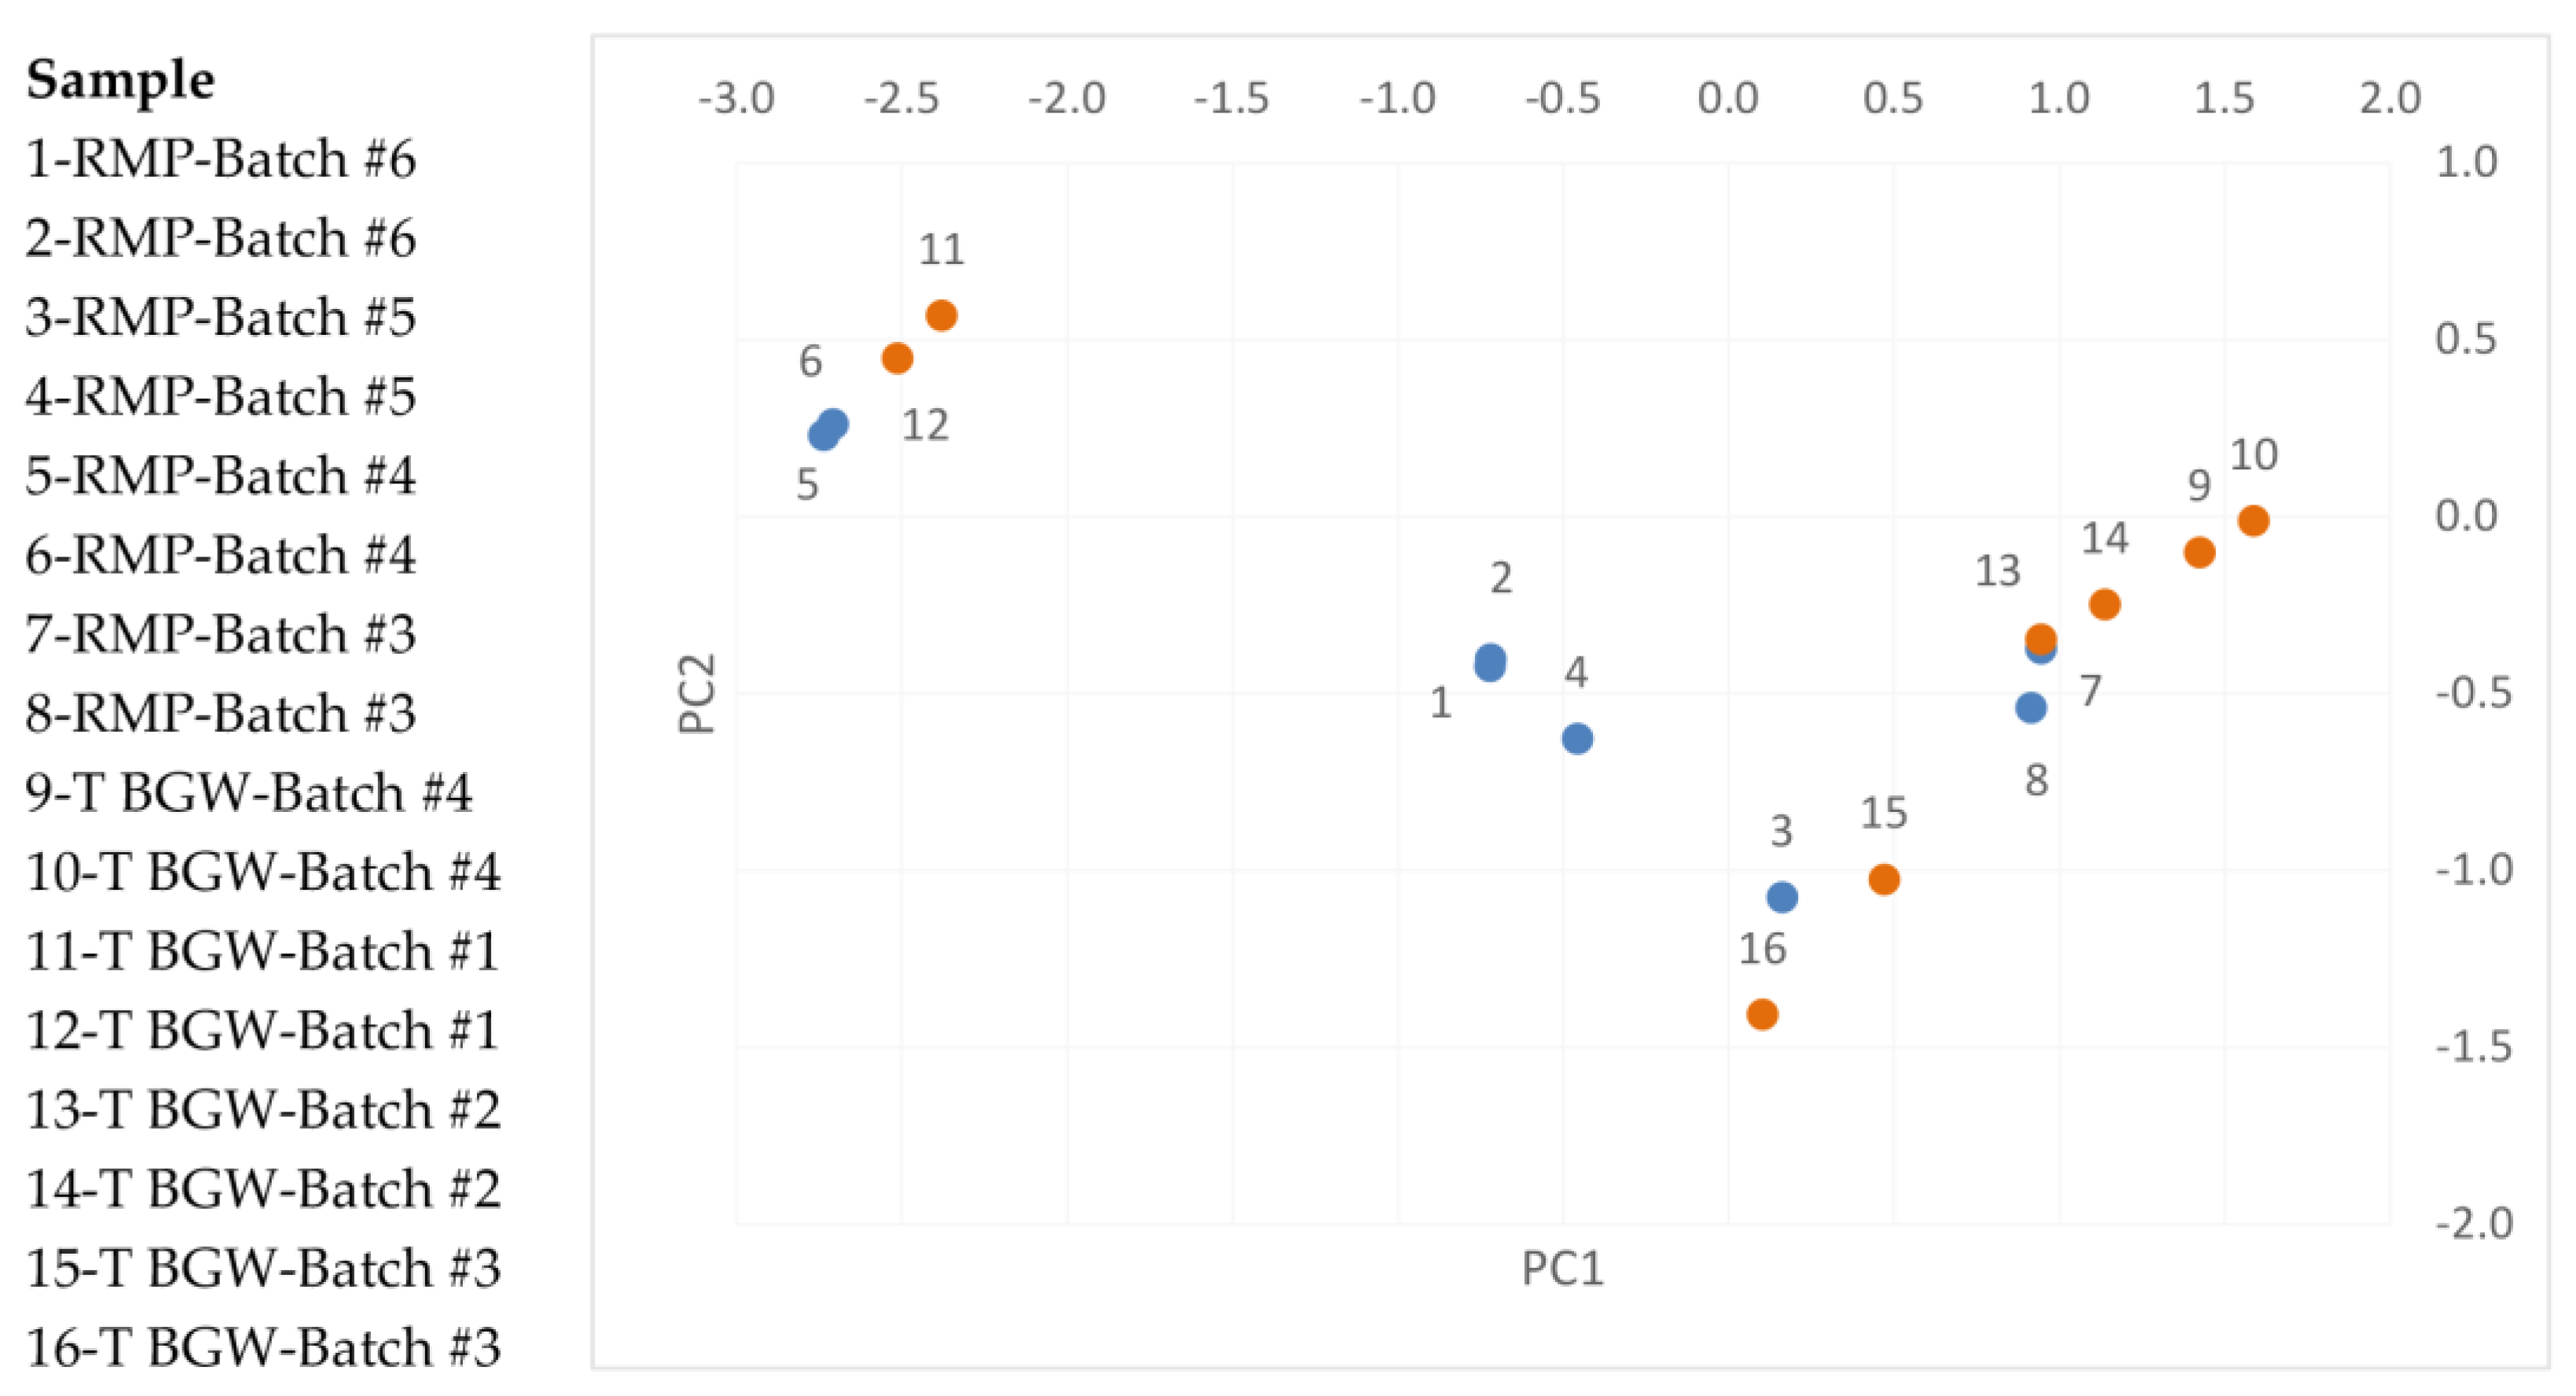
3.1. Comparative Analysis of the Peptide and Excipient Composition Assessment
1D-NMR + PCA
3.2. High-Order Structure Assessment
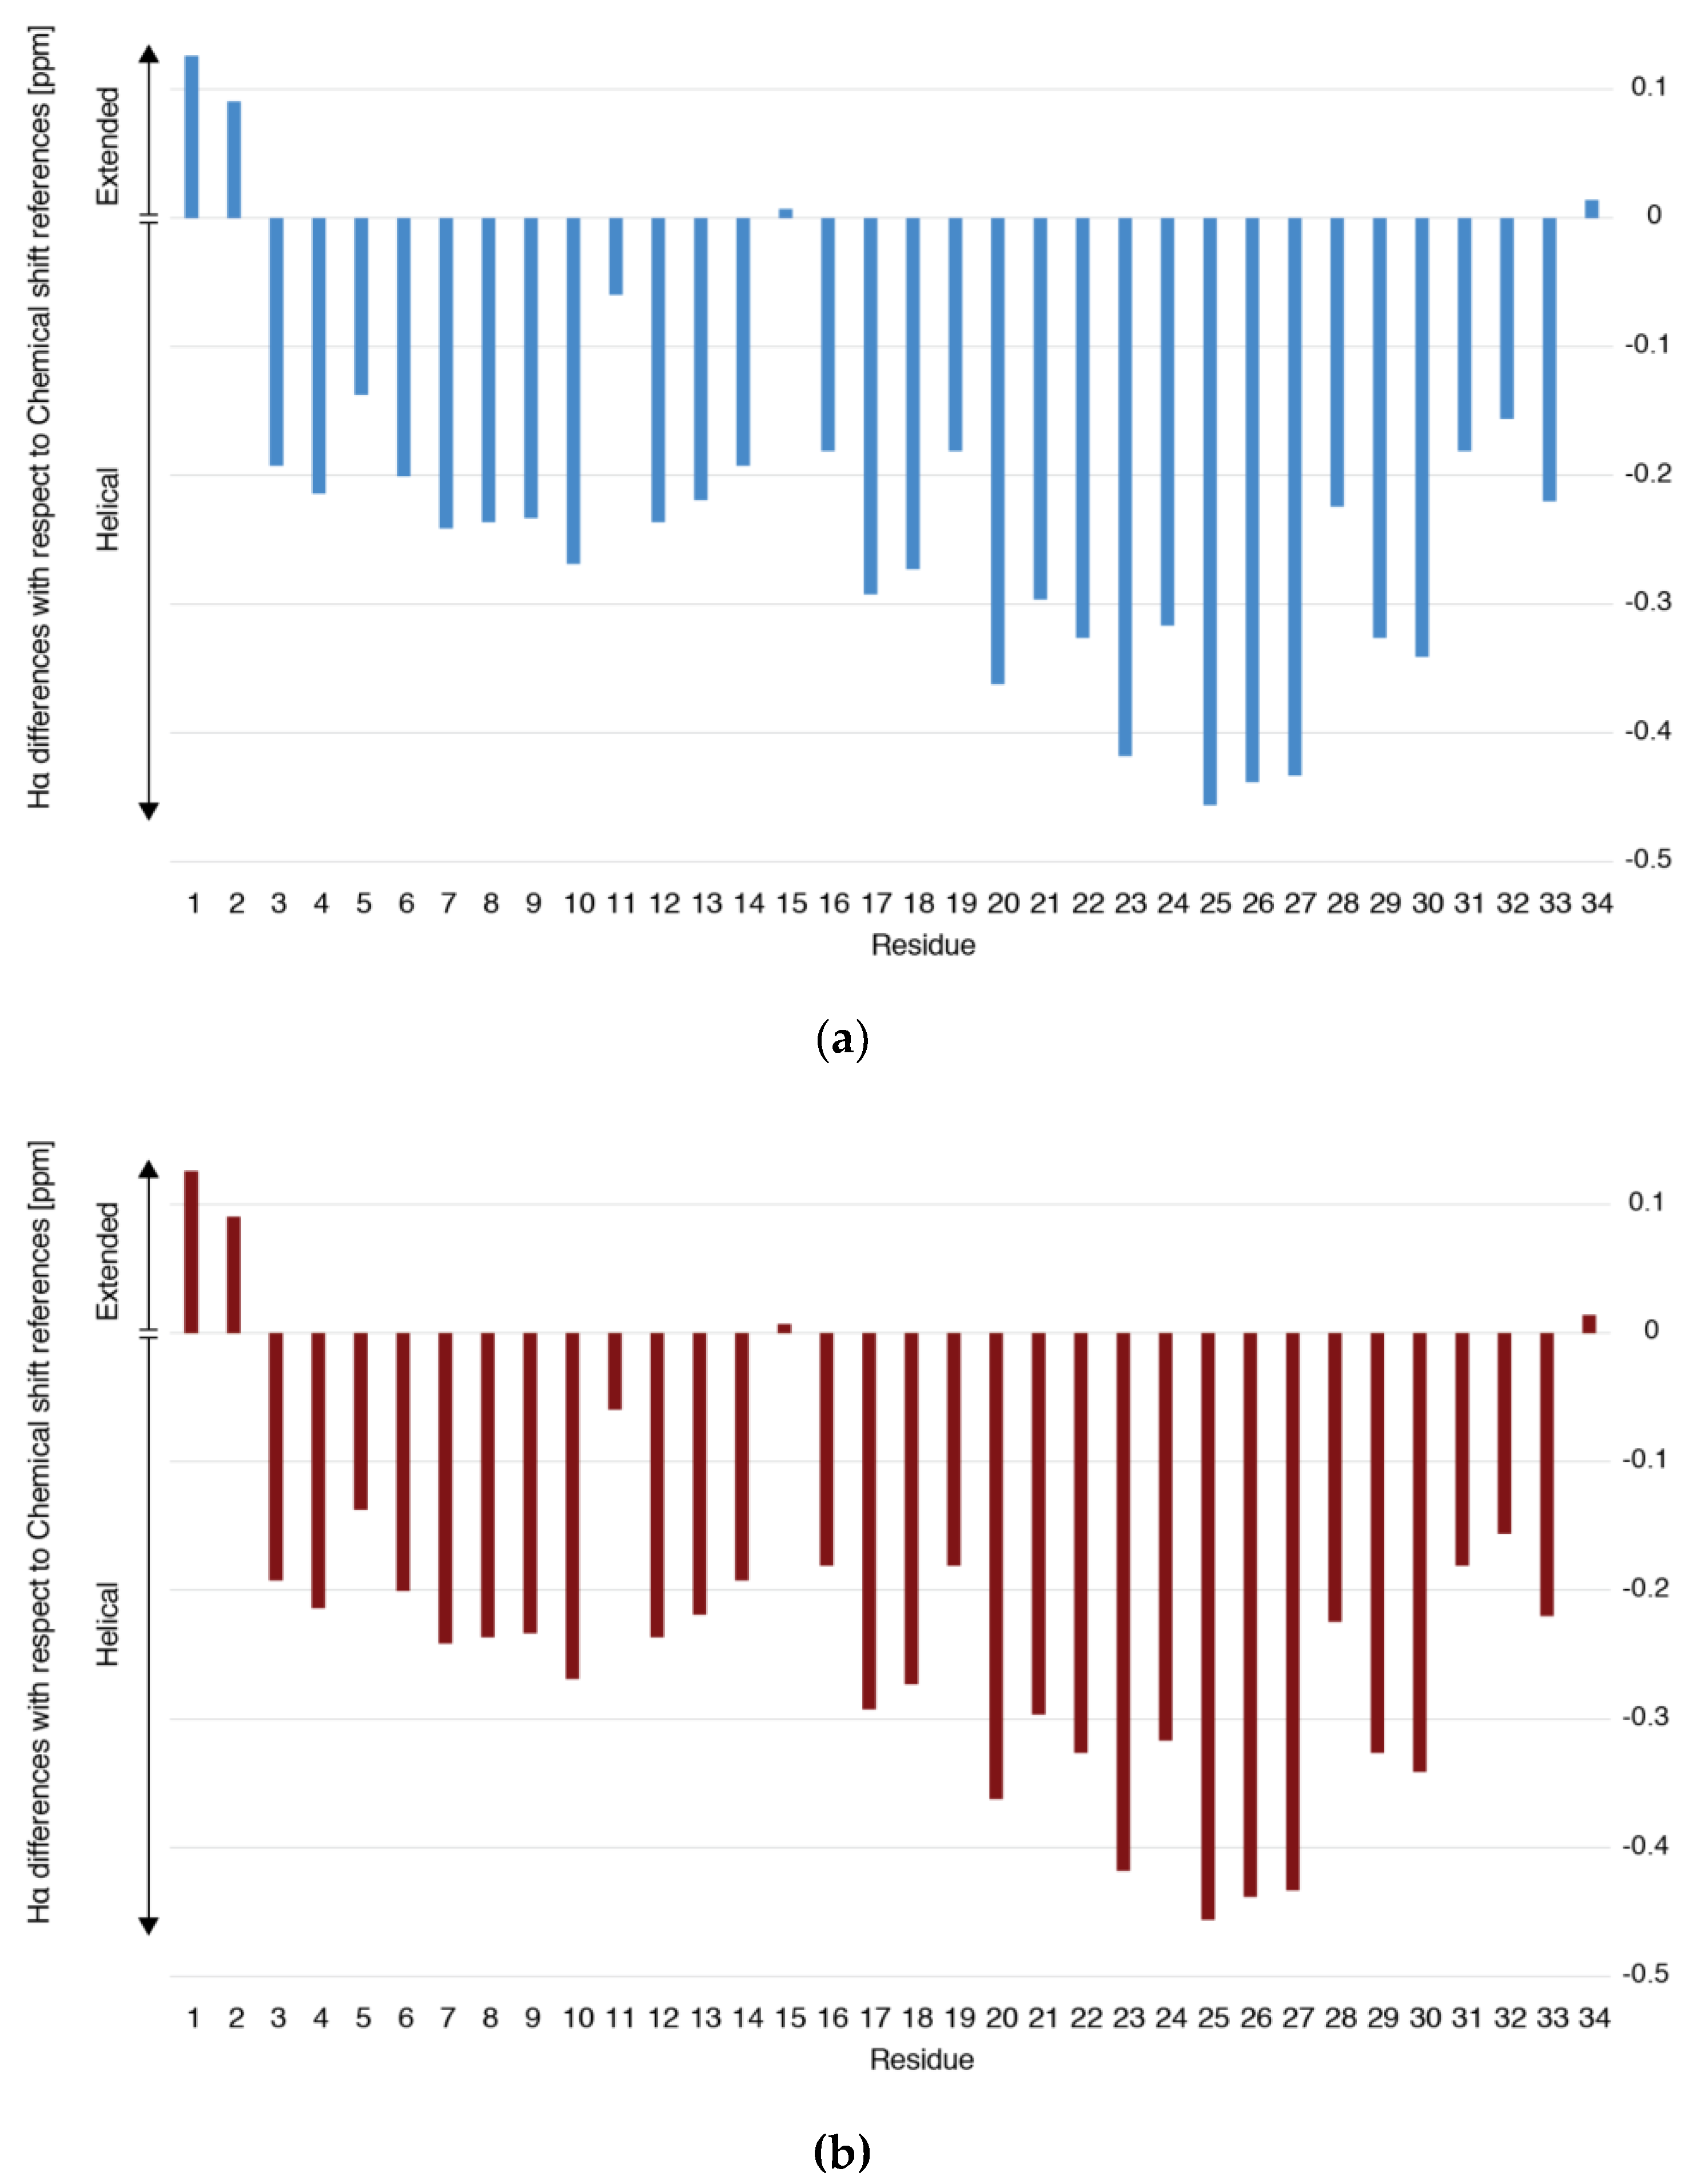
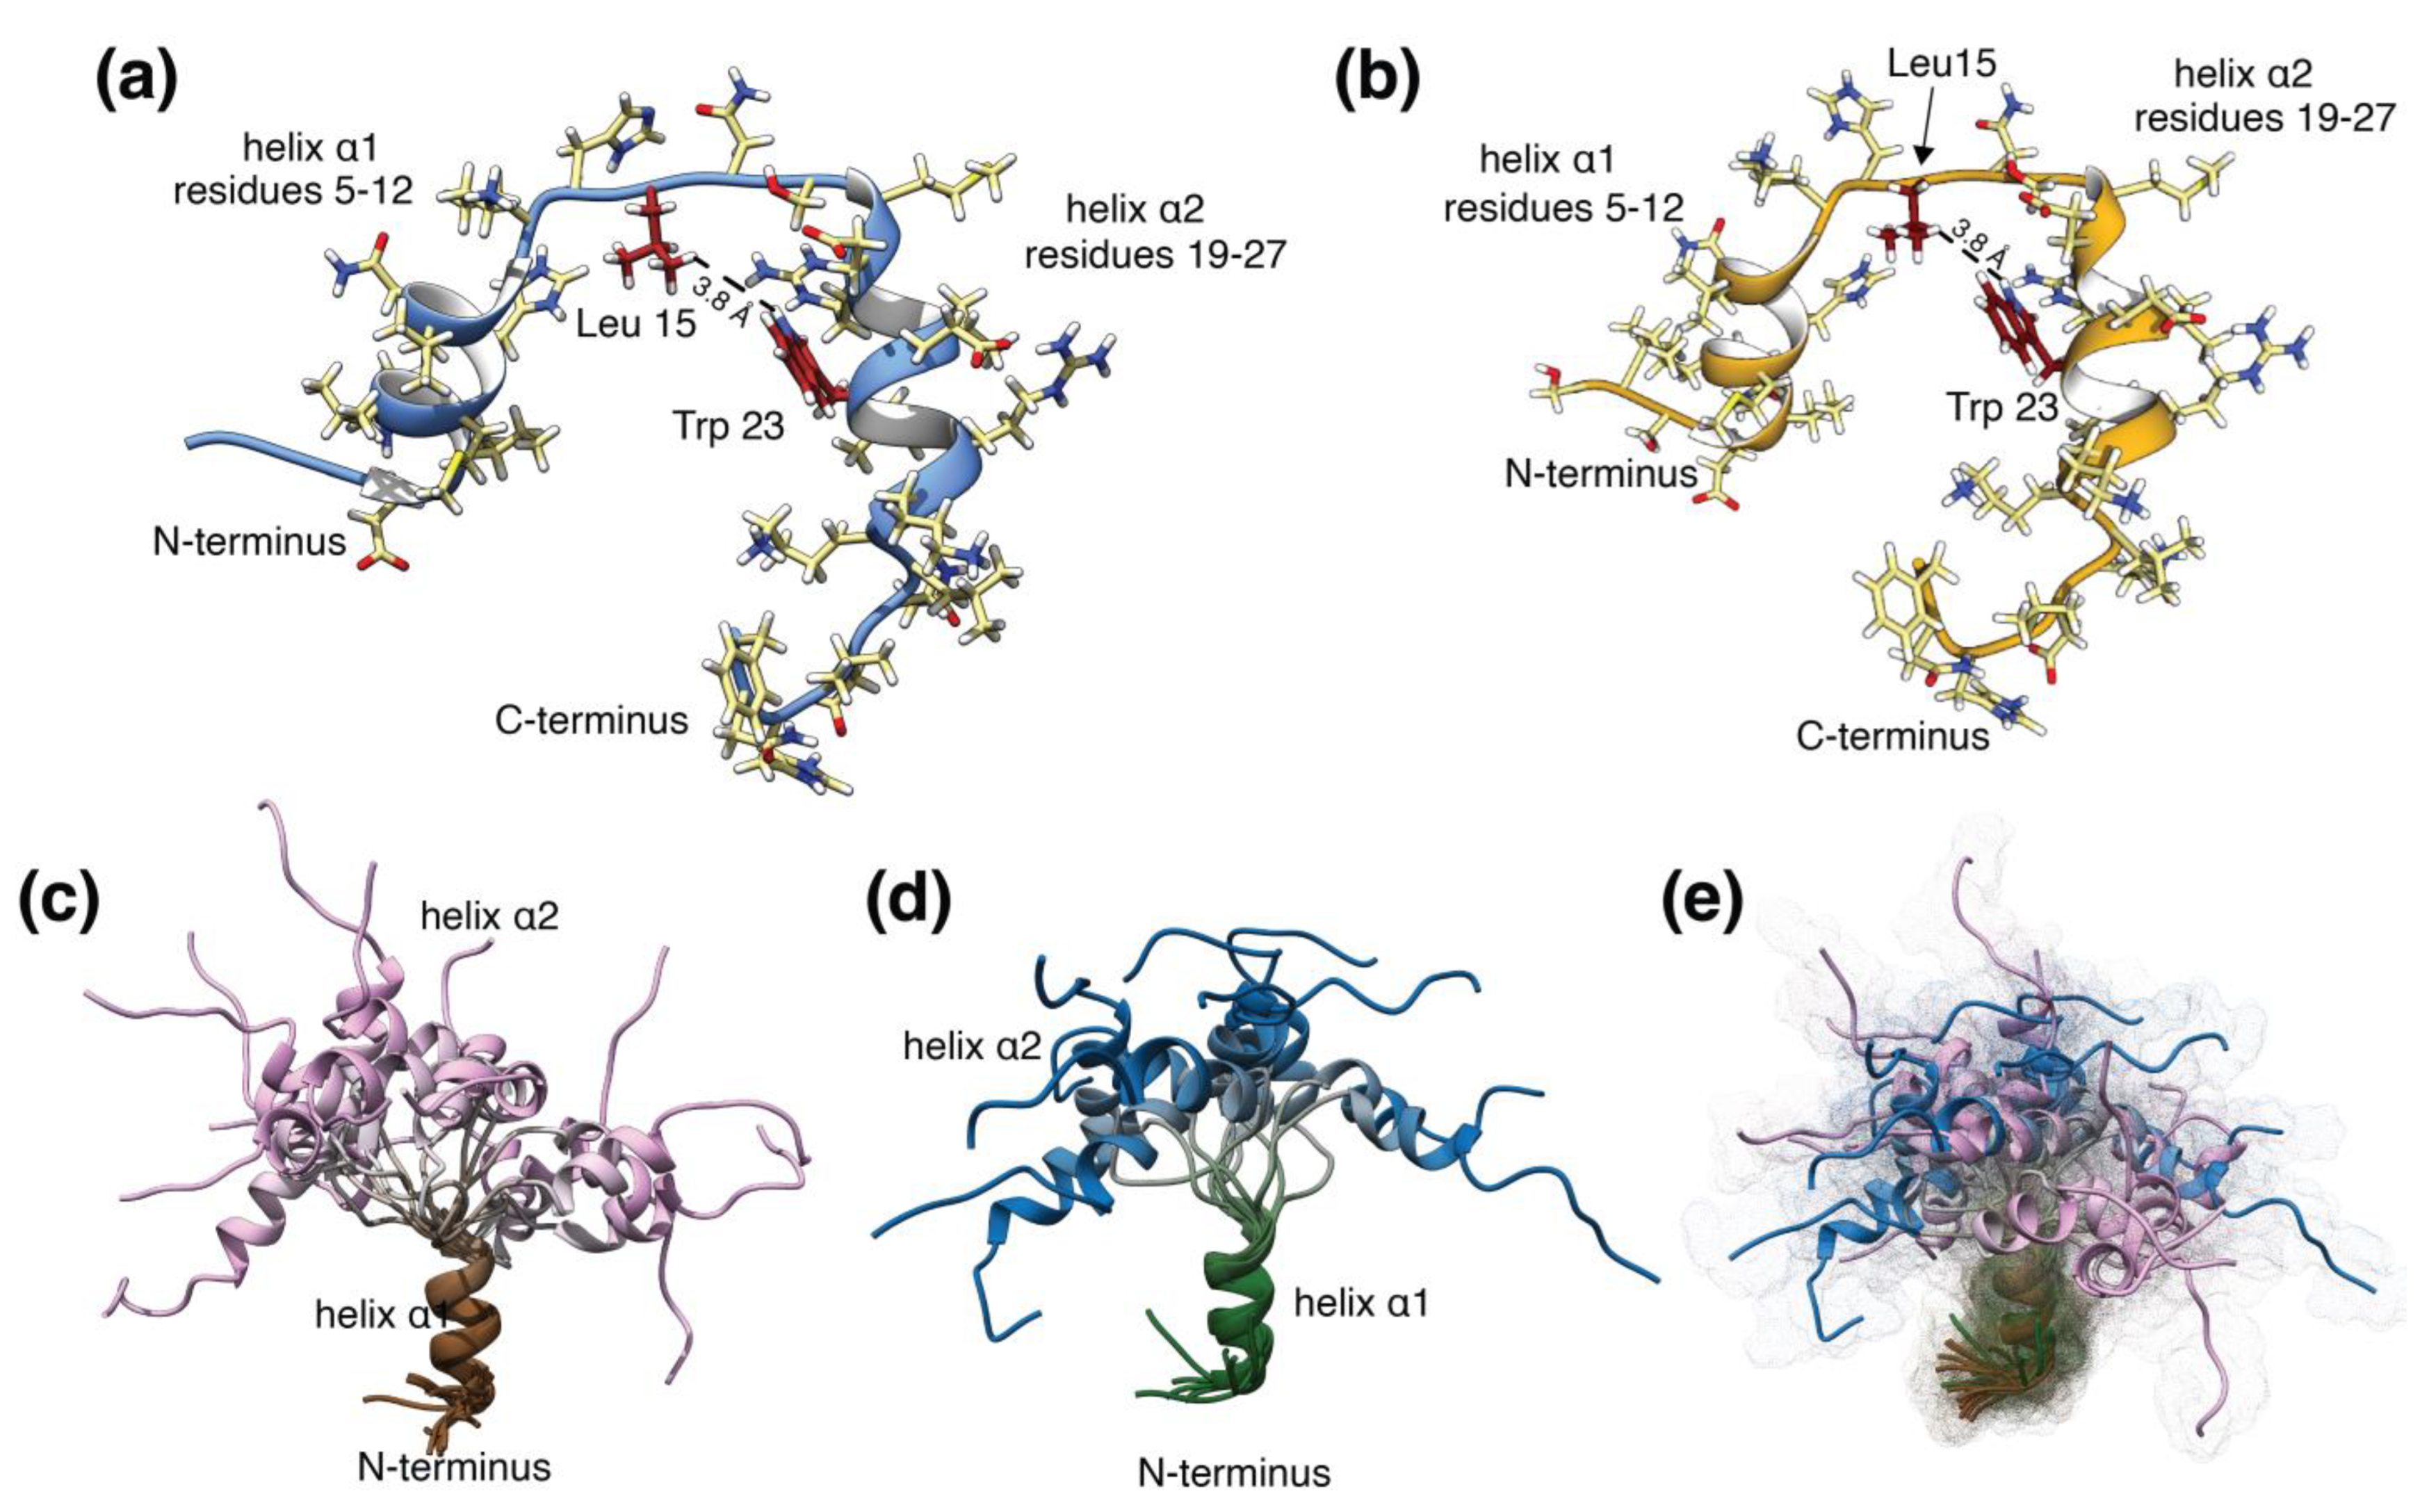
3.2.1. 2D-NMR
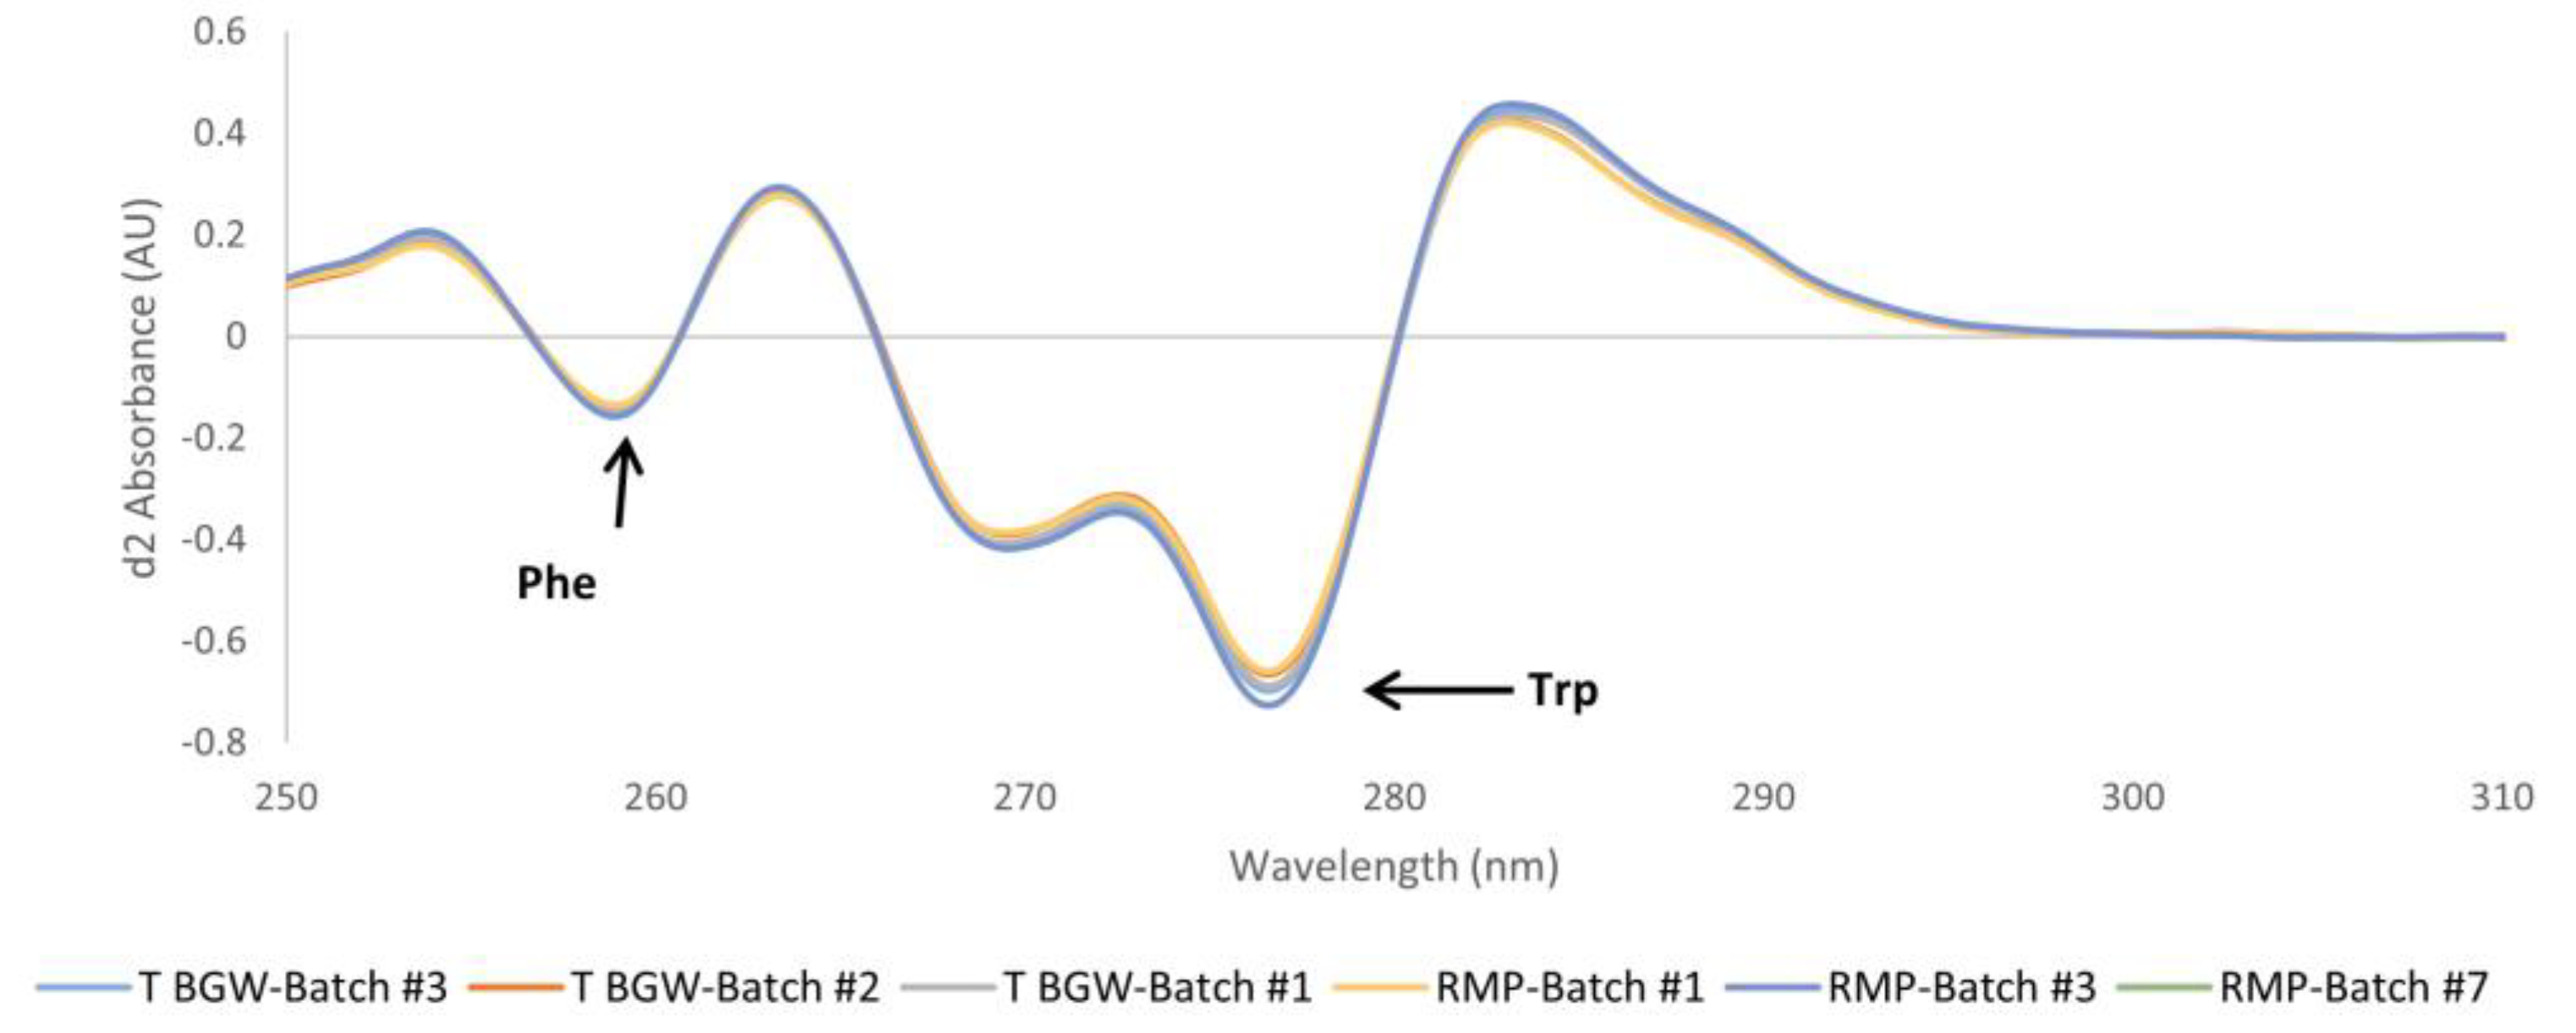
3.2.2. UV
3.2.3. IM–MS
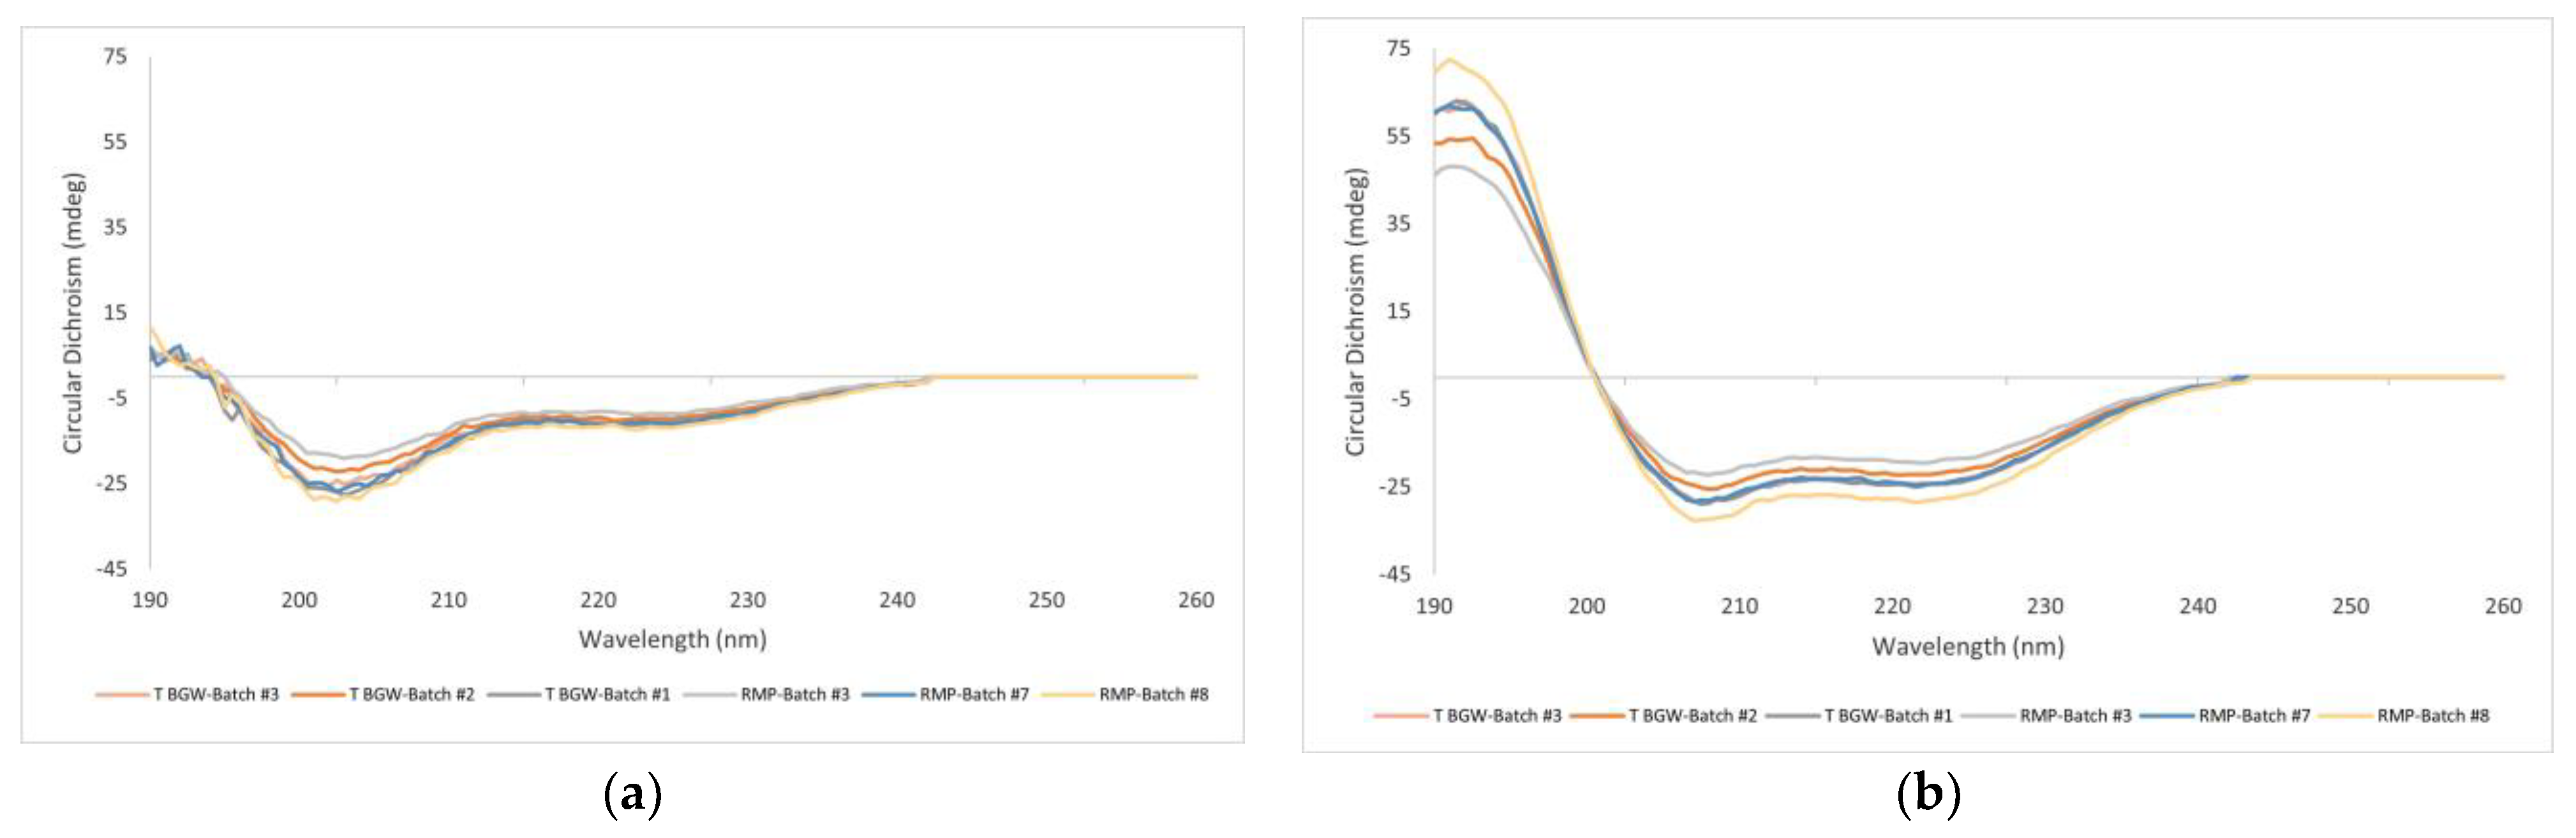
3.2.4. FTIR and CD
3.3. Biological Activity Assessment
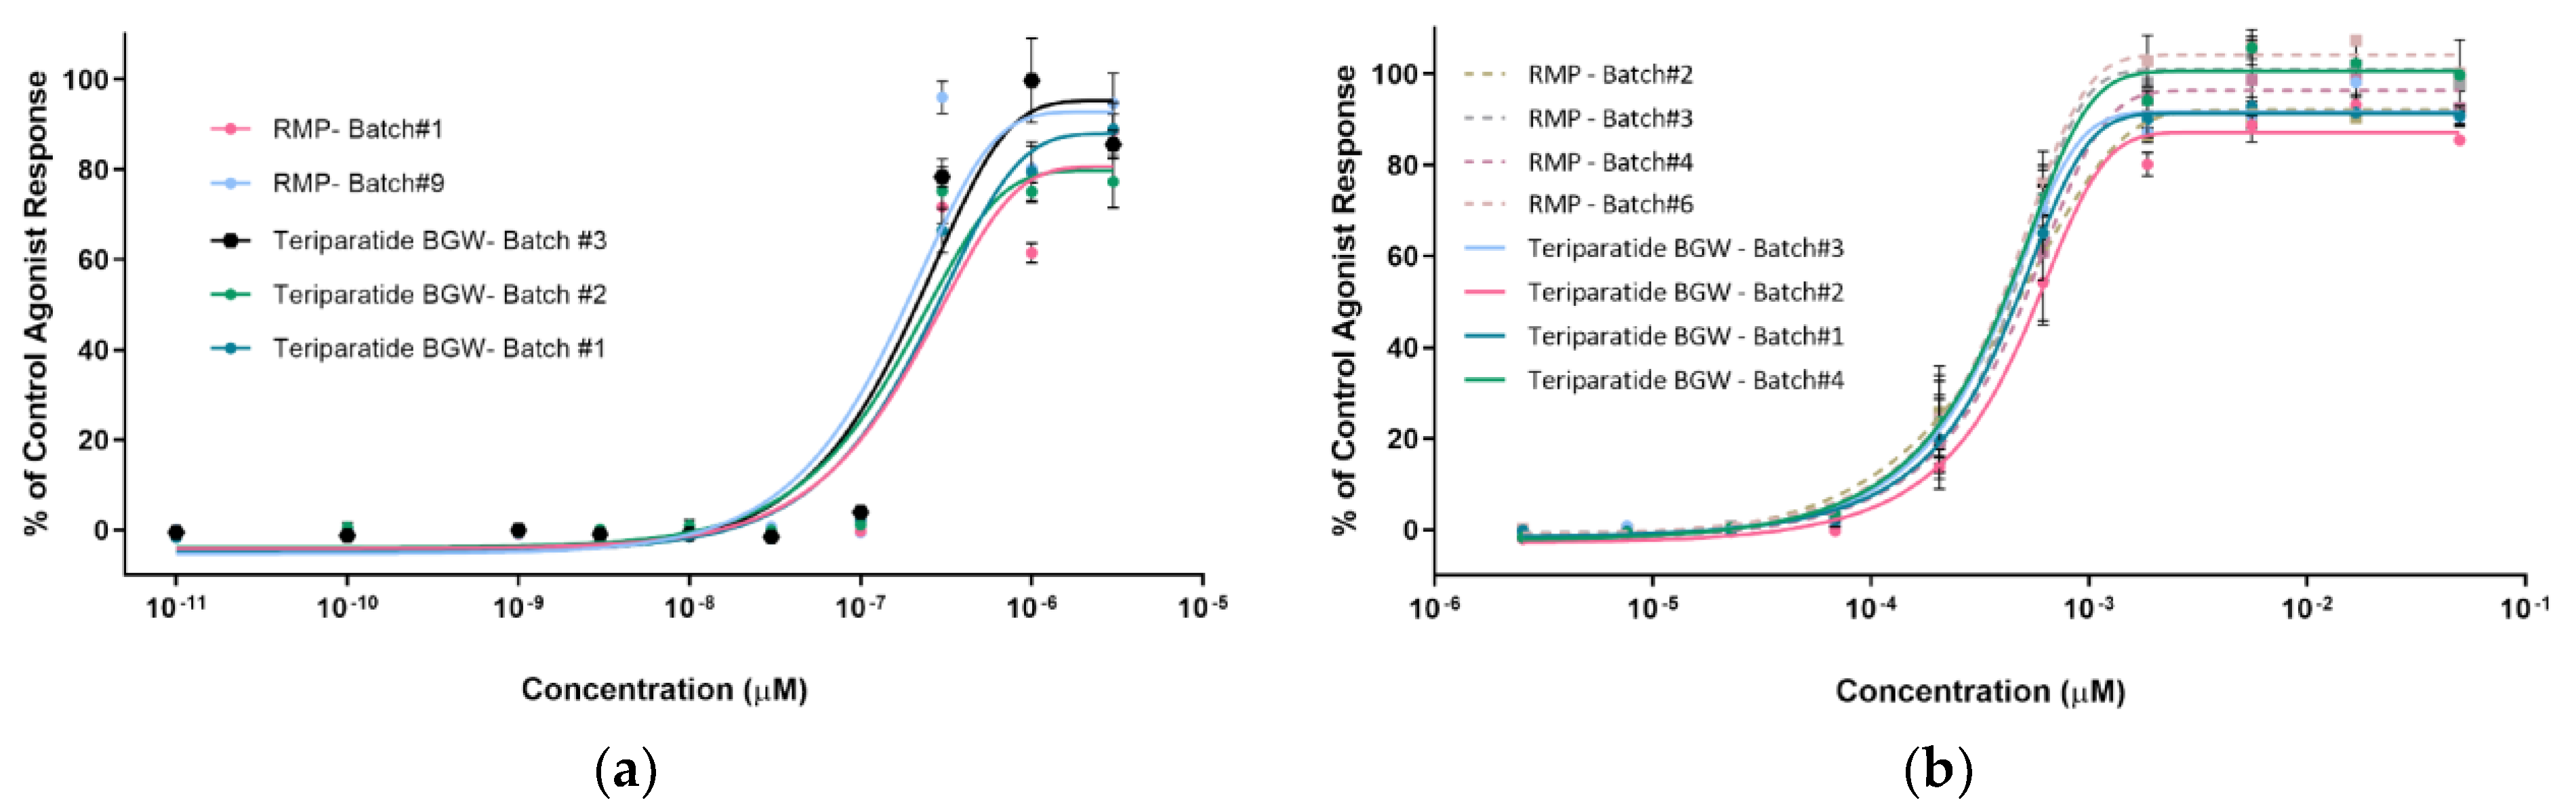
3.3.1. SaOS-2-PTH1R-HTRF
3.3.2. CHO-K1-PTH1R-EFC
3.4. Discussion
Supplementary Materials
Author Contributions
Funding
Data Availability Statement
Acknowledgments
Conflicts of Interest
References
- Eastell, R.; O’Neill, T.W.; Hofbauer, L.C.; Langdahl, B.; Reid, I.R.; Gold, D.T.; Cummings, S.R. Postmenopausal osteoporosis. Nat. Rev. Dis. Primers. 2016, 2, 16069. [Google Scholar] [CrossRef] [PubMed]
- Kanis, J.A.; Cooper, C.; Rizzoli, R.; Reginster, J.Y.; Scientific Advisory Board of the European Society for Clinical and Economic Aspects of Osteoporosis (ESCEO) and the Committees of Scientific Advisors and National Societies of the International Osteoporosis Foundation (IOF). European guidance for the diagnosis and management of osteoporosis in postmenopausal women. Osteoporos. Int. 2019, 30, 3–44, Erratum in Osteoporos. Int. 2020, 31, 209; Erratum in Osteoporos. Int. 2020, 31, 801. [Google Scholar] [CrossRef] [PubMed]
- Kanis, J.A.; Norton, N.; Harvey, N.C.; Jacobson, T.; Johansson, H.; Lorentzon, M.; McCloskey, E.V.; Willers, C.; Borgström, F. SCOPE 2021: A new scorecard for osteoporosis in Europe. Arch. Osteoporos. 2021, 16, 82. [Google Scholar] [CrossRef] [PubMed]
- Berg, C.; Neumeyer, K.; Kirkpatrick, P. Teriparatide. Nat. Rev. Drug Discov. 2003, 2, 257–258. [Google Scholar] [CrossRef] [PubMed]
- Jilka, R.L. Molecular and cellular mechanisms of the anabolic effect of intermittent PTH. Bone 2007, 40, 1434–1446. [Google Scholar] [CrossRef]
- Lilly, E. Summary of Product Characteristics: Forsteo (teriparatide). Utrecht, The Netherlands. 2013. Available online: https://www.ema.europa.eu/en/documents/product-information/forsteo-epar-product-information_en.pdf (accessed on 25 April 2023).
- Grover, H.S.; Luthra, S.; Maroo, S. Teriparatide: A novel means to ultimately achieve true regeneration!!! J. Clin. Diagn. Res. 2013, 7, 1820–1823. [Google Scholar] [CrossRef] [PubMed]
- Wang, L.; Wang, N.; Zhang, W.; Cheng, X.; Yan, Z.; Shao, G.; Wang, X.; Wang, R.; Fu, C. Therapeutic peptides: Current applications and future directions. Signal Transduct. Target. Ther. 2022, 7, 48. [Google Scholar] [CrossRef] [PubMed]
- Directive 2001/83/EC of the European Parliament and of the Council of 6 November 2001 on the Community Code Relating to Medicinal Products for Human Use. Available online: https://eur-lex.europa.eu/LexUriServ/LexUriServ.do?uri=CONSLEG:2001L0083:20121116:EN:PDF (accessed on 25 April 2023).
- Chen, K.; Park, J.; Li, F.; Patil, S.M.; Keire, D.A. Chemometric Methods to Quantify 1D and 2D NMR Spectral Differences among Similar Protein Therapeutics. AAPS PharmSciTech 2017, 19, 1011–1019. [Google Scholar] [CrossRef] [PubMed]
- Tao, L.; McLean, J.R.; McLean, J.A.; Russell, D.H. A collision cross-section database of singly-charged peptide ions. J. Am. Soc. Mass Spectrom. 2007, 18, 1232–1238, Erratum in J. Am. Soc. Mass Spectrom. 2007, 18, 1727–1728. [Google Scholar] [CrossRef]
- Ebrahimi, P.; Viereck, N.; Bro, R.; Engelsen, S.B. Chemometric Analysis of NMR Spectra. In Modern Magnetic Resonance; Webb, G., Ed.; Springer: Cham, Switzerland, 2018. [Google Scholar] [CrossRef]
- Brünger, A.T.; Adams, P.D.; Clore, G.M.; DeLano, W.L.; Gros, P.; Grosse-Kunstleve, R.W.; Jiang, J.S.; Kuszewski, J.; Nilges, M.; Pannu, N.S.; et al. Crystallography & NMR System: A New Software Suite for Macromolecular Structure Determination. Acta Crystallogr. D Biol. Crystallogr. 1998, 54, 905–921. [Google Scholar] [CrossRef] [PubMed]
- Marx, U.C.; Adermann, K.; Bayer, P.; Forssmann, W.-G.; Rösch, P. Solution Structures of Human Parathyroid Hormone Fragments hPTH(1–34) and hPTH(1–39) and Bovine Parathyroid Hormone Fragment bPTH(1–37). Biochem. Biophys. Res. Commun. 2000, 267, 213–220. [Google Scholar] [CrossRef] [PubMed]
- Shvartsburg, A.A.; Smith, R.D. Fundamentals of Traveling Wave Ion Mobility Spectrometry. Anal. Chem. 2008, 80, 9689–9699. [Google Scholar] [CrossRef] [PubMed]
- Zhou, M.; Robinson, C.V. Flexible membrane proteins: Functional dynamics captured by mass spectrometry. Curr. Opin. Struct. Biol. 2014, 28, 122–130. [Google Scholar] [CrossRef] [PubMed]
- Wang, B.; Zhang, J.; Chen, P.; Ji, Z.; Deng, S.; Li, C. Prediction of peptide drift time in ion mobility mass spectrometry from sequence-based features. BMC Bioinform. 2013, 14, S9. [Google Scholar] [CrossRef] [PubMed]
- Pellegrini, M.; Royo, M.; Rosenblatt, M.; Chorev, M.; Mierke, D.F. Addressing the Tertiary Structure of Human Parathyroid Hormone-(1–34). J. Biol. Chem. 1998, 273, 10420–10427. [Google Scholar] [CrossRef]
- Strickland, L.A.; Bozzato, R.P.; Kronis, K.A. Structure of human parathyroid hormone(1-34) in the presence of solvents and micelles. Biochemistry 1993, 32, 6050–6057. [Google Scholar] [CrossRef] [PubMed]
- Micsonai, A.; Wien, F.; Kernya, L.; Lee, Y.-H.; Goto, Y.; Réfrégiers, M.; Kardos, J. Accurate secondary structure prediction and fold recognition for circular dichroism spectroscopy. Proc. Natl. Acad. Sci. USA 2015, 112, E3095–E3103. [Google Scholar] [CrossRef] [PubMed]
- Merutka, G.; Murphy, B.M.; Payne, R.W.; Wilson, G.A.; Matsuura, J.E.; Henry, C.S.; Manning, M.C. Stability of lyophilized teriparatide, PTH(1-34), after reconstitution. Eur. J. Pharm. Biopharm. 2016, 99, 84–93. [Google Scholar] [CrossRef]
- Hohenstein, A.; Hebell, M.; Zikry, H.; El Ghazaly, M.; Mueller, F.; Rohde, J. Development and validation of a novel cell-based assay for potency determination of human parathyroid hormone (PTH). J. Pharm. Biomed. Anal. 2014, 98, 345–350. [Google Scholar] [CrossRef] [PubMed]
- Rixon, R.H.; Whitfield, J.F.; Gagnon, L.; Isaacs, R.J.; Maclean, S.; Chakravarthy, B.; Durkin, J.P.; Neugebauer, W.; Ross, V.; Sung, W.; et al. Parathyroid hormone fragments may stimulate bone growth in ovariectomized rats by activating adenylyl cyclase. J. Bone Miner. Res. 1994, 9, 1179–1189. [Google Scholar] [CrossRef]
- Yang, D.; Singh, R.; Divieti, P.; Guo, J.; Bouxsein, M.; Bringhurst, F. Contributions of parathyroid hormone (PTH)/PTH-related peptide receptor signaling pathways to the anabolic effect of PTH on bone. Bone 2007, 40, 1453–1461. [Google Scholar] [CrossRef] [PubMed]
- Mohan, S.; Kutilek, S.; Zhang, C.; Shen, H.; Kodama, Y.; Srivastava, A.; Wergedal, J.; Beamer, W.; Baylink, D. Comparison of bone formation responses to parathyroid hormone(1-34), (1-31), and (2-34) in mice. Bone 2000, 27, 471–478. [Google Scholar] [CrossRef] [PubMed]
- Whitfield, J.F.; Morley, P.; Willick, G.E.; Ross, V.; Barbier, J.R.; Isaacs, R.J.; Ohannessian-Barry, L. Stimulation of the growth of femoral trabecular bone in ovariectomized rats by the novel parathyroid hormone fragment, hPTH-(1–31)NH2 (Ostabolin). Calcif. Tissue Int. 1996, 58, 81–87. [Google Scholar] [CrossRef] [PubMed]
- Friedman, P.A.; Gesek, F.A.; Morley, P.; Whitfield, J.F.; Willick, G.E. Cell-specific signaling and structure-activity relations of parathyroid hormone analogs in mouse kidney cells. Endocrinology 1999, 140, 301–309. [Google Scholar] [CrossRef] [PubMed]
- Frelinger, A.L., 3rd; Zull, J.E. Oxidized forms of parathyroid hormone with biological activity. Separation and characterization of hormone forms oxidized at methionine 8 and methionine 18. J. Biol. Chem. 1984, 259, 5507–5513. [Google Scholar] [CrossRef] [PubMed]
- Fda.gov.2021.Guidance for Industry: ANDAs for Certain Highly Purified Synthetic Peptide Drug Products That Refer to Listed Drugs of rDNA Origin. Available online: https://www.fda.gov/regulatory-information/search-fda-guidance-documents/andas-certain-highly-purified-synthetic-peptide-drug-products-refer-listed-drugs-rdna-origin (accessed on 25 April 2023).
- Teriparatide Ratiopharm. Public Assessment Report. DE/H/4291/01/DC, DE/H/4292/01/DC, BfArM, Published May 2017. Available online: https://portal.dimdi.de/amguifree/am/docoutput/additionaldocs.xhtml?mpdidentifier=2194120 (accessed on 25 April 2023).
- Teriparatide Sun. European Public Assessment Report. 2022. Available online: https://www.ema.europa.eu/en/medicines/human/EPAR/teriparatide-sun (accessed on 25 April 2023).
- European Medicines Agency. Guideline on the Investigation of Bioequivalence. 2012. Available online: https://www.ema.europa.eu/en/investigation-bioequivalence-scientific-guideline#current-effective-version-section (accessed on 25 April 2023).
- Lamers, C. Overcoming the shortcomings of peptide-based therapeutics. Futur. Drug Discov. 2022, 4, FDD75. [Google Scholar] [CrossRef]
- World Health Organization. WHO Technical Report Series, 64th Report (No. 987)—Annex 4. Guidelines on the Quality, Safety and Efficacy of Biotherapeutic Protein Products Prepared by Recombinant DNA Technology (Replacement of Annex 3 of WHO Technical Report Series, No. 814). In WHO Technical Report Series; WHO Expert Committee on Biological Standardization, Ed.; WHO: Geneva, Switzerland, 2013; Available online: https://www.who.int/publications/m/item/recombinant-dna-annex-4-trs-no-987 (accessed on 25 April 2023).
- Händel, M.N.; Cardoso, I.; von Bülow, C.; Rohde, J.F.; Ussing, A.; Nielsen, S.M.; Christensen, R.; Body, J.-J.; Brandi, M.L.; Diez-Perez, A.; et al. Fracture risk reduction and safety by osteoporosis treatment compared with placebo or active comparator in postmenopausal women: Systematic review, network meta-analysis, and meta-regression analysis of randomised clinical trials. BMJ 2023, 381, e068033. [Google Scholar] [CrossRef] [PubMed]


| Quality Attribute | Analytical Methods | Study Purpose |
|---|---|---|
| Composition and strength | ||
| Peptide and excipients composition | 1D-NMR | To determine similarity between formulations by using chemometric methods |
| Peptide content 5 | RP-HPLC | To quantify peptide content 2 |
| Preservative content (m-cresol) 5 | RP-HPLC | To quantify m-cresol content |
| Primary structure 5 | ||
| Amino acid analysis | 2.2.56 EP method and <1052> USP method 1 | To determine amino acid composition |
| Peptide mapping | UV- and MS 1-based | To identify and verify primary structure |
| Peptide sequence | 2D-NMR (2D-TOCSY) | To confirm peptide sequence |
| Intact molecular mass | ESI-HRMS | To confirm identity and primary structure |
| High-order structures | ||
| Secondary and tertiary | 2D-NMR (2D TOCSY, 2D NOESY) | To qualitatively and quantitatively determine secondary and tertiary structures |
| Secondary and tertiary | IM–MS | To determine structure and conformation and non-covalent interactions in native MS |
| Secondary and tertiary | UV-vis | To determine peptide conformation |
| Secondary | FTIR 1 | To identify secondary structure |
| Secondary | CD 1 | To identify secondary structure |
| Purity profile 5 | ||
| Peptide-related variants | RP-HPLC | To determine charge variant impurities 2 |
| Peptide-related variants | RP-HPLC | To determine low MW impurities 2 |
| Oligomers/aggregates | SE-HPLC | To determine the presence of oligomers/aggregates |
| Oligomers/aggregates | SDS-PAGE | To determine the presence of oligomers/aggregates |
| Product-related impurities | RP-HPLC | To compare impurity profile between formulations 2 |
| Degradation profile | RP-HPLC | To compare impurity profile between formulations under extreme conditions (40 °C/75% RH) |
| Functional characteristics | ||
| Biological activity | SaOS-2 PTH1R cell-based bioassay 3 | To determine agonist response |
| Biological activity | CHO-K1 PTH1R cell-based bioassay 4 | To determine agonist response 2 |
| Sample | Specie | Charge State | m/z | Cross-Section (Power) Å2 * |
|---|---|---|---|---|
| Teriparatide BGW- Batch #1 | [M + 4H]4+ | 4 | 1029.7811 | 619 (C1) |
| [M + 4H]4+ | 4 | 1029.7811 | 666 (C2) | |
| [M + 4H]4+ | 4 | 1029.7811 | 710 (C3) | |
| Teriparatide BGW- Batch #2 | [M + 4H]4+ | 4 | 1029.7811 | 626 (C1) |
| [M + 4H]4+ | 4 | 1029.7811 | 675 (C2) | |
| [M + 4H]4+ | 4 | 1029.7811 | 716 (C3) | |
| Teriparatide BGW- Batch #3 | [M + 4H]4+ | 4 | 1029.7811 | 619 (C1) |
| [M + 4H]4+ | 4 | 1029.7811 | 666(C2) | |
| [M + 4H]4+ | 4 | 1029.7811 | 699 (C3) | |
| Teriparatide BGW- Batch #4 | [M + 4H]4+ | 4 | 1029.7811 | 628 (C1) |
| [M + 4H]4+ | 4 | 1029.7811 | 680 (C2) | |
| [M + 4H]4+ | 4 | 1029.7811 | 718 (C3) | |
| RMP- Batch #1 | [M + 4H]4+ | 4 | 1029.7811 | 628 (C1) |
| [M + 4H]4+ | 4 | 1029.7811 | 675 (C2) | |
| [M + 4H]4+ | 4 | 1029.7811 | 720 (C3) | |
| RMP- Batch #2 | [M + 4H]4+ | 4 | 1029.7811 | 627 (C1) |
| [M + 4H]4+ | 4 | 1029.7811 | 676 (C2) | |
| [M + 4H]4+ | 4 | 1029.7811 | 720 (C3) | |
| RMP- Batch #3 | [M + 4H]4+ | 4 | 1029.781125 | 630 (C1) |
| [M + 4H]4+ | 4 | 1029.781125 | 674 (C2) | |
| [M + 4H]4+ | 4 | 1029.7811 | 711 (C3) | |
| RMP- Batch #4 | [M + 4H]4+ | 4 | 1029.781125 | 628 (C1) |
| [M + 4H]4+ | 4 | 1029.781125 | 674 (C2) | |
| [M + 4H]4+ | 4 | 1029.781125 | 720 (C3) | |
| RMP- Batch #5 | [M + 4H]4+ | 4 | 1029.781125 | 625 (C1) |
| [M + 4H]4+ | 4 | 1029.781125 | 674 (C2) | |
| [M + 4H]4+ | 4 | 1029.781125 | 718 (C3) | |
| RMP- Batch #6 | [M + 4H]4+ | 4 | 1029.781125 | 625 (C1) |
| [M + 4H]4+ | 4 | 1029.781125 | 674 (C2) | |
| [M + 4H]4+ | 4 | 1029.781125 | 713 (C3) |
| BeStSel—Secondary Structure Prediction— Water | BeStSel—Secondary Structure Prediction— Water: TFE (1:1) | ||||||||
|---|---|---|---|---|---|---|---|---|---|
| Sample | Batch | α-helix (%) | β-sheet (%) | Turn (%) | Others (%) | α-helix (%) | β-sheet (%) | Turn (%) | Others (%) |
| Teriparatide BGW | #1 | 13.7 | 20.4 | 17.7 | 48.2 | 61.3 | 0.0 | 10.7 | 28.0 |
| #2 | 15.2 | 20.6 | 17.7 | 48.2 | 57.6 | 1.1 | 12.4 | 28.9 | |
| #3 | 14.9 | 19.2 | 18.3 | 47.5 | 61.5 | 0.0 | 11.0 | 27.5 | |
| RMP | #3 | 11.3 | 26.8 | 17.0 | 44.8 | 51.1 | 5.3 | 12.9 | 30.7 |
| #7 | 15.3 | 20.6 | 17.9 | 46.2 | 62.1 | 0.0 | 11.4 | 26.5 | |
| #8 | 15.8 | 17.3 | 18.4 | 48.5 | 68.6 | 0.0 | 9.1 | 22.4 | |
| Sample | Batch | EC50 (M) | pEC50 | Mean EC50 (M) | % vs. Mean RMP EC50 | |
|---|---|---|---|---|---|---|
| Teriparatide BGW | #1 | 3.93 × 10⁻¹⁰ | 9.41 | 4.03 × 10⁻¹⁰ | 96% | 99% |
| #2 | 4.85 × 10⁻¹⁰ | 9.31 | 119% | |||
| #3 | 3.52 × 10⁻¹⁰ | 9.45 | 86% | |||
| #4 | 3.82 × 10⁻¹⁰ | 9.42 | 94% | |||
| RMP | #2 | 3.94 × 10⁻¹⁰ | 9.40 | 4.08 × 10⁻¹⁰ | 97% | 100% |
| #3 | 4.07 × 10⁻¹⁰ | 9.39 | 100% | |||
| #4 | 4.52 × 10⁻¹⁰ | 9.34 | 111% | |||
| #6 | 3.78 × 10⁻¹⁰ | 9.42 | 93% | |||
Disclaimer/Publisher’s Note: The statements, opinions and data contained in all publications are solely those of the individual author(s) and contributor(s) and not of MDPI and/or the editor(s). MDPI and/or the editor(s) disclaim responsibility for any injury to people or property resulting from any ideas, methods, instructions or products referred to in the content. |
© 2024 by the authors. Licensee MDPI, Basel, Switzerland. This article is an open access article distributed under the terms and conditions of the Creative Commons Attribution (CC BY) license (https://creativecommons.org/licenses/by/4.0/).
Share and Cite
Fernández-Carneado, J.; Vallès-Miret, M.; Arrastia-Casado, S.; Almazán-Moga, A.; Macias, M.J.; Martin-Malpartida, P.; Vilaseca, M.; Díaz-Lobo, M.; Vazquez, M.; Sanahuja, R.M.; et al. First Generic Teriparatide: Structural and Biological Sameness to Its Reference Medicinal Product. Pharmaceutics 2024, 16, 537. https://doi.org/10.3390/pharmaceutics16040537
Fernández-Carneado J, Vallès-Miret M, Arrastia-Casado S, Almazán-Moga A, Macias MJ, Martin-Malpartida P, Vilaseca M, Díaz-Lobo M, Vazquez M, Sanahuja RM, et al. First Generic Teriparatide: Structural and Biological Sameness to Its Reference Medicinal Product. Pharmaceutics. 2024; 16(4):537. https://doi.org/10.3390/pharmaceutics16040537
Chicago/Turabian StyleFernández-Carneado, Jimena, Mariona Vallès-Miret, Sílvia Arrastia-Casado, Ana Almazán-Moga, Maria J. Macias, Pau Martin-Malpartida, Marta Vilaseca, Mireia Díaz-Lobo, Mayte Vazquez, Rosa M. Sanahuja, and et al. 2024. "First Generic Teriparatide: Structural and Biological Sameness to Its Reference Medicinal Product" Pharmaceutics 16, no. 4: 537. https://doi.org/10.3390/pharmaceutics16040537