Article

An Analysis of Vehicle-to-Grid in Sweden Using MATLAB/Simulink †

by
Jennifer Leijon
1,*,
Jéssica Santos Döhler
1,
Johannes Hjalmarsson
1,
Daniel Brandell
2,
Valeria Castellucci
1 and
Cecilia Boström
1
1
Division of Electricity, Department of Electrical Engineering, Ångström Laboratory, Uppsala University, 75237 Uppsala, Sweden
2
Department of Chemistry, Ångström Laboratory, Uppsala University, 75237 Uppsala, Sweden
*
Author to whom correspondence should be addressed.
Presented at the 36th International Electric Vehicle Symposium and Exhibition (EVS36), Sacramento, CA, USA, 11–14 June 2023.
World Electr. Veh. J. 2024, 15(4), 153; https://doi.org/10.3390/wevj15040153
Submission received: 1 March 2024 / Revised: 4 April 2024 / Accepted: 5 April 2024 / Published: 8 April 2024

Abstract

:
With more electric vehicles introduced in society, there is a need for the further implementation of charging infrastructure. Innovation in electromobility may result in new charging and discharging strategies, including concepts such as smart charging and vehicle-to-grid. This article provides an overview of vehicle charging and discharging innovations with a cable connection. A MATLAB/Simulink model is developed to show the difference between an electric vehicle with and without the vehicle-to-grid capabilities for electricity grid prices estimated for Sweden for three different electric vehicle user profiles and four different electric vehicle models. The result includes the state-of-charge values and price estimations for the different vehicles charged with or without a bidirectional power flow to and from the electric grid. The results show that there is a greater difference in state-of-charge values over the day investigated for the electric vehicles with vehicle-to-grid capabilities than for vehicles without vehicle-to-grid capabilities. The results indicate potential economic revenues from using vehicle-to-grid if there is a significant variation in electricity prices during different hours. Therefore, the vehicle owner can potentially receive money from selling electricity to the grid while also supporting the electric grid. The study provides insights into utilizing vehicle-to-grid in society and taking steps towards its implementation.

1. Introduction

The increased number of electric vehicles (EVs) in society suggests the further development and implementation of new charging infrastructure and charging strategies, as well as the development of charging standards [1]. New ways of using and charging EVs may drive the transition towards electromobility. This article aims to provide an overview of the concepts of smart charging, vehicle-to-grid (V2G), vehicle-to-home (V2H), and vehicle-to-everything (V2X) [2]. An example of modeling EV charging and discharging to a grid in MATLAB/Simulink is presented. The analysis of the charging and discharging strategies includes potential pros and cons for different actors and what data could be of particular interest. The main goal is to contribute to the ongoing research discussion on future charging strategies of EVs. While there are many different types of charging strategies [3], this study is focused on cable charging (i.e., conductive charging), and it does not include an analysis of, e.g., wireless charging or battery swapping. While many previous studies focus on a larger international perspective on V2G, this study focuses on the modeling of V2G for the charging and discharging of new EVs to the Swedish electricity market as there has been a significant variation in electricity prices for the Swedish market recently, a strong interest in renewable energy sources (RES), as well as an ongoing trend toward introducing more EVs and implementing national charging infrastructure.

1.1. Charging Strategies for Electric Vehicles

Controlling the charging or discharging of EVs can potentially provide benefits in terms of, for example, lower charging costs, environmental aspects if charging occurs when there is a significant amount of RES feeding electricity to the grid, and providing grid balancing or ancillary services. However, a drawback of utilizing variable energy sources is a lower degree of utilization due to the intermittent nature of the RES, and therefore, energy storage could be used together with RES, as highlighted in, e.g., [4]. In [5], the different types of EV charging strategies are described as either uncontrolled or controlled charging and discharging strategies, where the controlled strategies are further divided into the subgroups: (i) indirect control, (ii) intelligent control, (iii) bidirectional control, and (iv) multistage control [5].
Controlled (unidirectional) charging, where the charging event is controlled in time, is often called smart charging. This is in contrast to uncontrolled charging, where the EV user charges whenever it is suitable based on the driving pattern [6]. In this context, the willingness of the driver to utilize, or not utilize, controlled charging is of interest [6]. One main benefit of smart charging for the EV owner is economical, which entails charging the vehicle when the cost of electricity is low rather than charging directly when the EV is connected to the charger. Smart charging could include starting and stopping the charging at certain times, or the power level of the charging is decreased or increased over the charging period. Depending on whether a customer has a variable or fixed-rate tariff, the cost optimization will look a bit different—but the fundamental purpose is the same: to minimize the total costs of charging. Smart charging could be beneficial for the grid owners too if the loads of the grid would be adapted to contribute to load balancing rather than charging all vehicles simultaneously. Controlled charging would therefore limit power peaks in the grid. This in turn could result in a limited need to reinforce the distribution grid and thus save money on installations and maintenance. However, controlled charging may affect the lifetime of the EV battery if the charging includes variable power levels. Smart charging may also include enhanced data-sharing. This suggests a concern for data protection and safety aspects in charging [7].

1.2. Vehicle-to-Grid

Bidirectional power flow between EVs and the distribution grid is often referred to as V2G. Certain EV models may provide discharging capabilities, such as the Nissan Leaf and Mitsubishi Outlander [8]. V2G operation is dependent on the inverter of the battery energy storage system (BESS), which has to be able to feed the current back to the grid [2]. There are several potential benefits of V2G considering the services provided to the grid [9]. V2G could potentially support the grid with ancillary services such as frequency regulation or peak shaving. The operation strategies may be differently applicable to various types of EVs, where V2G may be an interesting opportunity, e.g., for commercial EV fleets [10].
Recent research supports the fact that V2G technology has the potential to benefit electric utilities and microgrids, facilitating the integration of RES. Uncoordinated EV charging has a crucial impact on power systems [11], and extensive research has been conducted to analyze opportunities for the smart charging and discharging of EVs. V2G scenarios have been examined on a university campus [12], concluding that both V2G and stationary battery systems can be economical if the battery cost and electricity rates are considered.
From the user perspective, V2G functionality may contribute to extra revenue if the electricity can be sold back to the grid, especially during periods of electricity price peaks [13]. Looking at the techno-economic assessment of V2G in a microgrid, the authors in [14] highlight that several parameters impact the feasibility of V2G, e.g., the price of the chargers and the available capacity per car. Moreover, there are sociotechnical aspects of V2G that need to be further investigated, including, e.g., aspects regarding the motivation of the drivers in utilizing V2G and the driver’s view on data sharing in the charging/discharging events [15]. For example, a comprehensive survey concluded that the income of users highly affects EV ownership and public interest in participating in V2G services [16]. The safety aspects of both charging and discharging to and from the grid are important to consider to ensure the protection of both the electric grid and the EV. Furthermore, the lack of concrete business models slows down V2G adoption [17]. V2G was investigated for the New York electricity market in [18] based on economic aspects and the availability of time for the charging.
When it comes to V2H, this concept enables house owners to utilize their EVs for energy storage at their homes. The EV would be both charged and discharged at the household. V2H could be an opportunity for EV owners to be more self-sustained, for example, when used together with photovoltaic (PV) systems on the roof of the house, and to ensure access to electricity even if the electric grid is not functioning properly. Vehicle-to-vehicle (V2V) enables charging and discharging between different EVs, whereas V2X is a broader concept including charging, discharging, and communication with EVs to the surrounding environment and society.
There are several safety and security aspects to consider for future EVs, especially if V2G is utilized. The risk of cyberattacks when utilizing EVs for load frequency control, and the need to detect and mitigate attacks, has been highlighted and modeled to support resilience [19,20]. Moreover, sensor attacks of the adaptive cruise control of vehicles could cause severe issues, as analyzed along with a proposed model in [19]. A recent review article discusses the benefits, challenges, and limitations of bidirectional charging and suggests research development directions [20]. In conclusion, the need for further research to address these challenges is compelling if the aim is to unleash the full potential of V2G. Technical aspects and also environmental, social, economic, and legal aspects need to be considered to make V2G a reality [21].

1.3. Resilience of the Grid and Ancillary Services

The main objective of vehicles is traditionally to transport people or goods if they are larger vehicles. Thus, EVs are typically treated as loads in power system analysis. Due to the possibility of utilizing EVs as mobile energy storage, it is of interest and relevance to investigate how EVs could increase resilience and manage distribution in grids and microgrids. Resilience includes the ability of a system to readapt after some disturbance [22]. In power systems, resilience is the capability of the system to prepare, adapt, withstand, and recover from any power outage [23]. In this regard, EVs can contribute to more reliable power systems by supporting the grid during typical outages and also support a more resilient power system that can sustain high-impact events [24]. These resilience-oriented events are generally known as low-probability high-impact events (for example, natural disasters and extreme weather events). Nowadays, such events may be increasing due to climate change, and the increase may be in both intensity and frequency, posing challenges to power systems. During certain events, the public might be evacuated. If so, EVs may not be available on-site, but EVs from nearby areas—not affected by the event—may be used [25]. During outages, EV batteries can be used as a backup resource, while after outages, EV batteries can be used to restore normal operation. The reliable charging of EVs during unusual events, including crises or natural disasters, could be analyzed more in future research. On a smaller scale, microgrids can be utilized for resilient power systems as long as they can survive critical loads and recover to normal operation after the events. Microgrids may provide good conditions for the development and implementation of solutions for grid resilience enhancement [26].
There are several interesting cases where EVs are used for grid applications. Firstly, EVs can be used efficiently for peak shaving and load to reduce the grid impact from a larger load. If the load has a high load factor originally, it could be reduced by implementing controlled charging and V2G. This is illustrated and analyzed in [27,28]. Secondly, EVs could also be used strategically in smaller energy systems consisting of one or a few loads together with local generation from, e.g., solar PV, potentially operating in island mode using the car batteries to balance the system. This would require an efficient and reliable control strategy for the inverters of the batteries in order to maintain the local grid’s stability. Furthermore, if a large amount of EV chargers is operated by an aggregator, the cumulative capacity could be used strategically for more extensive grid applications. The capacity could be provided to the distribution system operator (DSO) or traded in available markets for ancillary services for power system stability or balancing purposes, e.g., frequency regulation services or balancing reserves.
It needs to be highlighted that EV batteries have a non-negligible cost. Also, EV owners may show a certain degree of skepticism in participating in ancillary services. EV batteries are considered degraded and not suitable for EVs when their capacity is reduced by 20–30%. However, the remaining 70–80% capacity can be used, after refurbishment, for less demanding purposes as a stationary storage system [29]. Thus, EV battery packs can contribute to grid resilience during their so-called second-life. Reusing batteries does not only enhance resilience, but it is also an environmentally friendly choice that can recover up to 20% of the initial battery cost [30]. However, there may be relevant aspects with regards to, e.g., the safety of the system or environmental aspects when refurbishing the batteries that need to be investigated further for second-life applications, and appropriate performance tests of retired batteries are important before reuse in other applications [31].

1.4. Vehicle Batteries and Stationary Batteries: Ageing

Providing V2G may result in the increased cycling of EV batteries depending on the use case, and this is relevant to estimate. However, if the vehicle battery is cycled more times, battery degradation becomes relevant to consider [13], and EV battery packs constitute a major part of the EV cost. Hence, it is important to evaluate battery aging when investigating V2G or V2X technology implementation. To ensure a long lifetime for the batteries and ensure safe usage, the state of charge (SOC) should be carefully estimated, as described, e.g., in [32], as well as the state of health (SOH) to better understand the aging process of the battery. The aging of the battery depends not only on how many times it has been charged and discharged but also under what circumstances it was charged and discharged (i.e., temperature, power level, etc.), and this relates to the cycle aging. When evaluating the aging of batteries in EVs due to increased cycling, it is often relevant to separate calendar aging from cycle aging. Gaining knowledge about the health of a used or retired EV battery can open up opportunities for the safe reuse of EV batteries in second-use applications [31]. In [33], empirical tests for capacity life loss were conducted on Li-ion cells for a selection of scenarios with varying C-rates, depth of discharge (DoD), and cell temperature. The results include several interesting aspects: first, the authors conclude that for lower C-rates the aging is not as dependent on the DoD effect as for higher C-rates. Second, capacity life loss models are presented for the chosen C-rates which can be implemented to estimate the capacity life loss for given conditions. According to [33], the capacity life loss can be estimated by Equation (1) when discharging with a current corresponding to C/2, that is
Q l o s s = 30.330 · exp 31500 8.314 · T A h 0.552
In Equation (1), Q l o s s is the estimated capacity loss (%), T is the absolute cell temperature, and Ah the energy throughput which is the product of the cycle number, DoD for the considered cycle (%), and the cell energy capacity (ampere hours). This is shown in Equation (2):
A h = c y c l e   n u m b e r · D o D · C e l l   c a p a c i t y .
Furthermore, when the current corresponds to C-rates higher than C/2, the capacity life loss model becomes more complex and can be described as
Q l o s s = B · exp 31700 + 370.3 · C r a t e R · T A h 0.55 .
In Equation (3), R is the gas constant, T is the absolute temperature, and B is a pre-exponential factor which decreases with increased C-rates and is determined in the fitting process of the capacity life loss model estimation. The values of B can be found in [33]. Another parameter relevant when modeling EV charging and discharging is the SOC in percentage. The method of SOC estimation includes the initial energy capacity E 0 ( t ) as the motor capacity of an EV is measured in kW. In this way, the relationship is given in [15] as
S O C ( t ) = S O C ( t 0 ) 1 E 0 ( 0 ) · 0 t P i t d t ,
where E 0 ( 0 ) and P i ( t ) are the initial energy capacity and the instantaneous power fed from the battery into the load, respectively.

2. Methodology

The research design includes simulations in MATLAB/Simulink with study cases on the unidirectional charging and bidirectional charging of EVs in Sweden. The cases modeled in the simulations are based on the ongoing electrification in Sweden, where the electricity prices were significantly volatile at the end of 2022, resulting in higher household electricity costs during the winter months in 2022. Also, there is a significant number of EVs in Sweden. The novelty and the contribution of the model include an investigation of V2G charging based on estimated electricity prices in Sweden for several different EV owner user profiles in comparison to EV charging without V2G capabilities. The aim of the model is to gain knowledge on charging and discharging several EVs to the grid, with a control based on estimated local electricity prices. The objective of the V2G model is to investigate how V2G could function for a system of different vehicles, to compare the potential of EVs with and without V2G compatibilities, and to potentially enhance the economic revenue from charging and discharging EVs with V2G due to price variations.

2.1. Modeling Charging and Discharging of Vehicles in MATLAB/Simulink

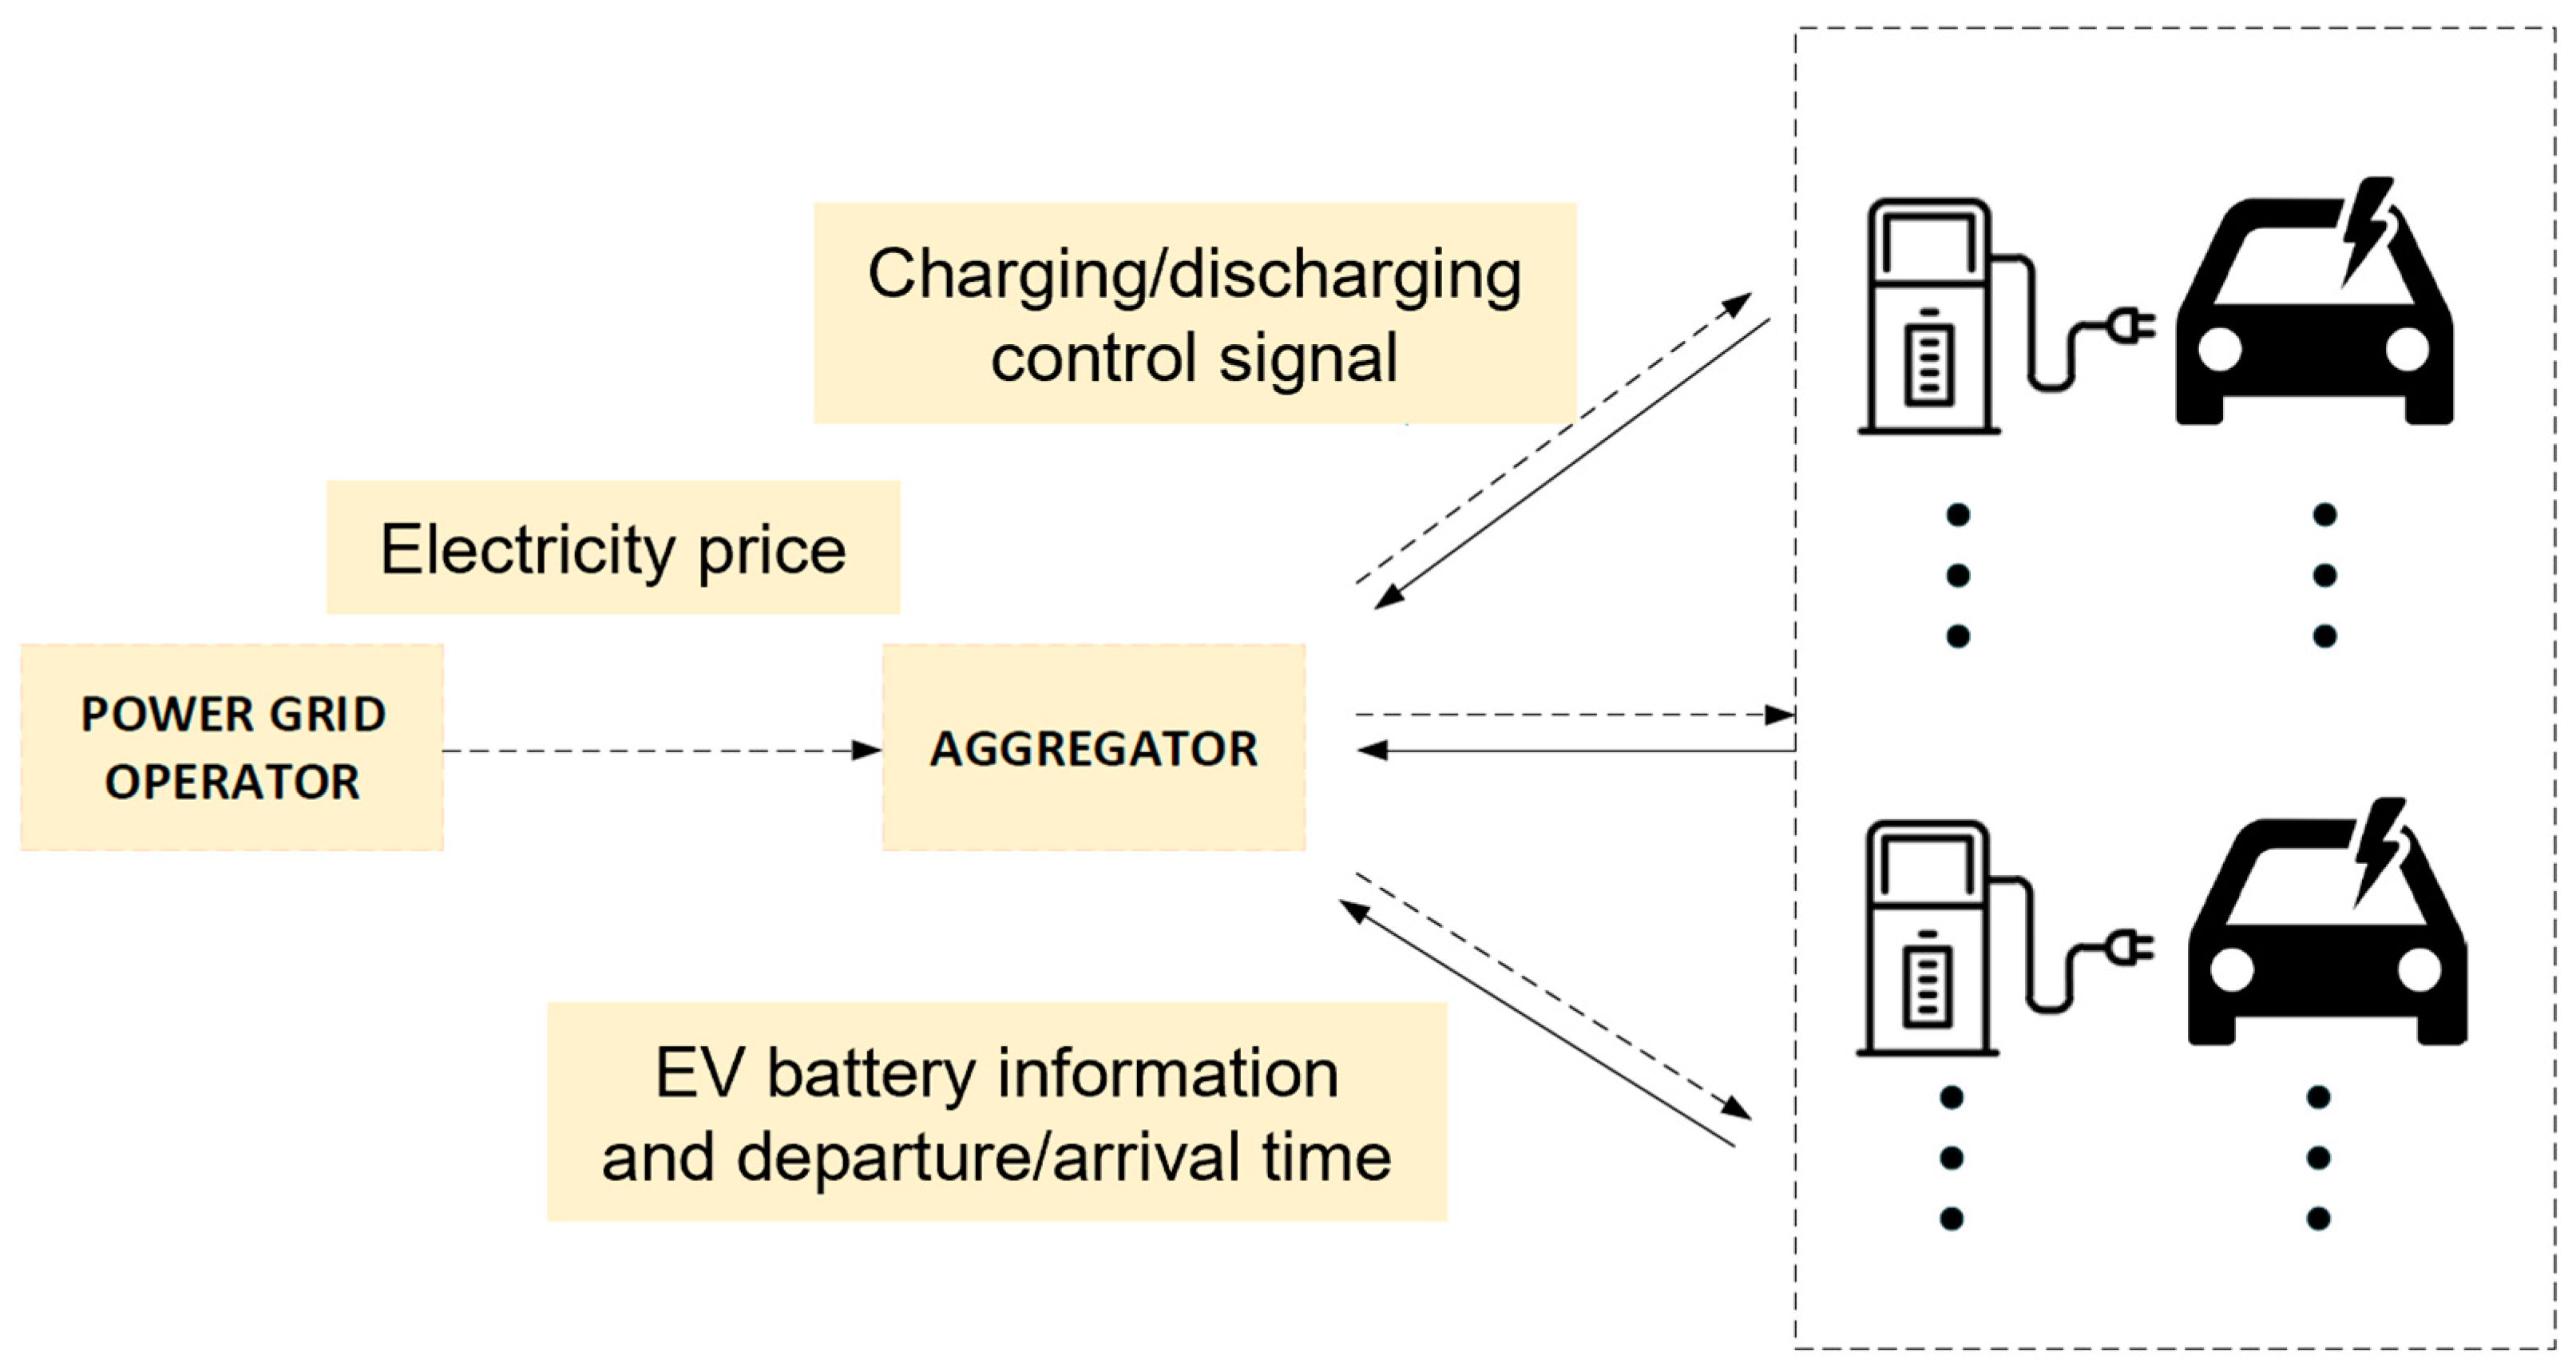
The electric grid is represented in MATLAB/Simulink as a three-phase AC grid. The EV can be modeled in MATLAB/Simulink as a battery system. Therefore, the AC from the grid needs to be converted to DC for the battery, utilizing a converter. Thus, the converter system needs to be bidirectional to ensure a power flow in both directions. Input data to the model includes, for example, available data on EVs from [8]. To illustrate how EV chargers could operate dynamically by responding to an external control signal, the system is shown in Figure 1, where an aggregator plans the charging and discharging.
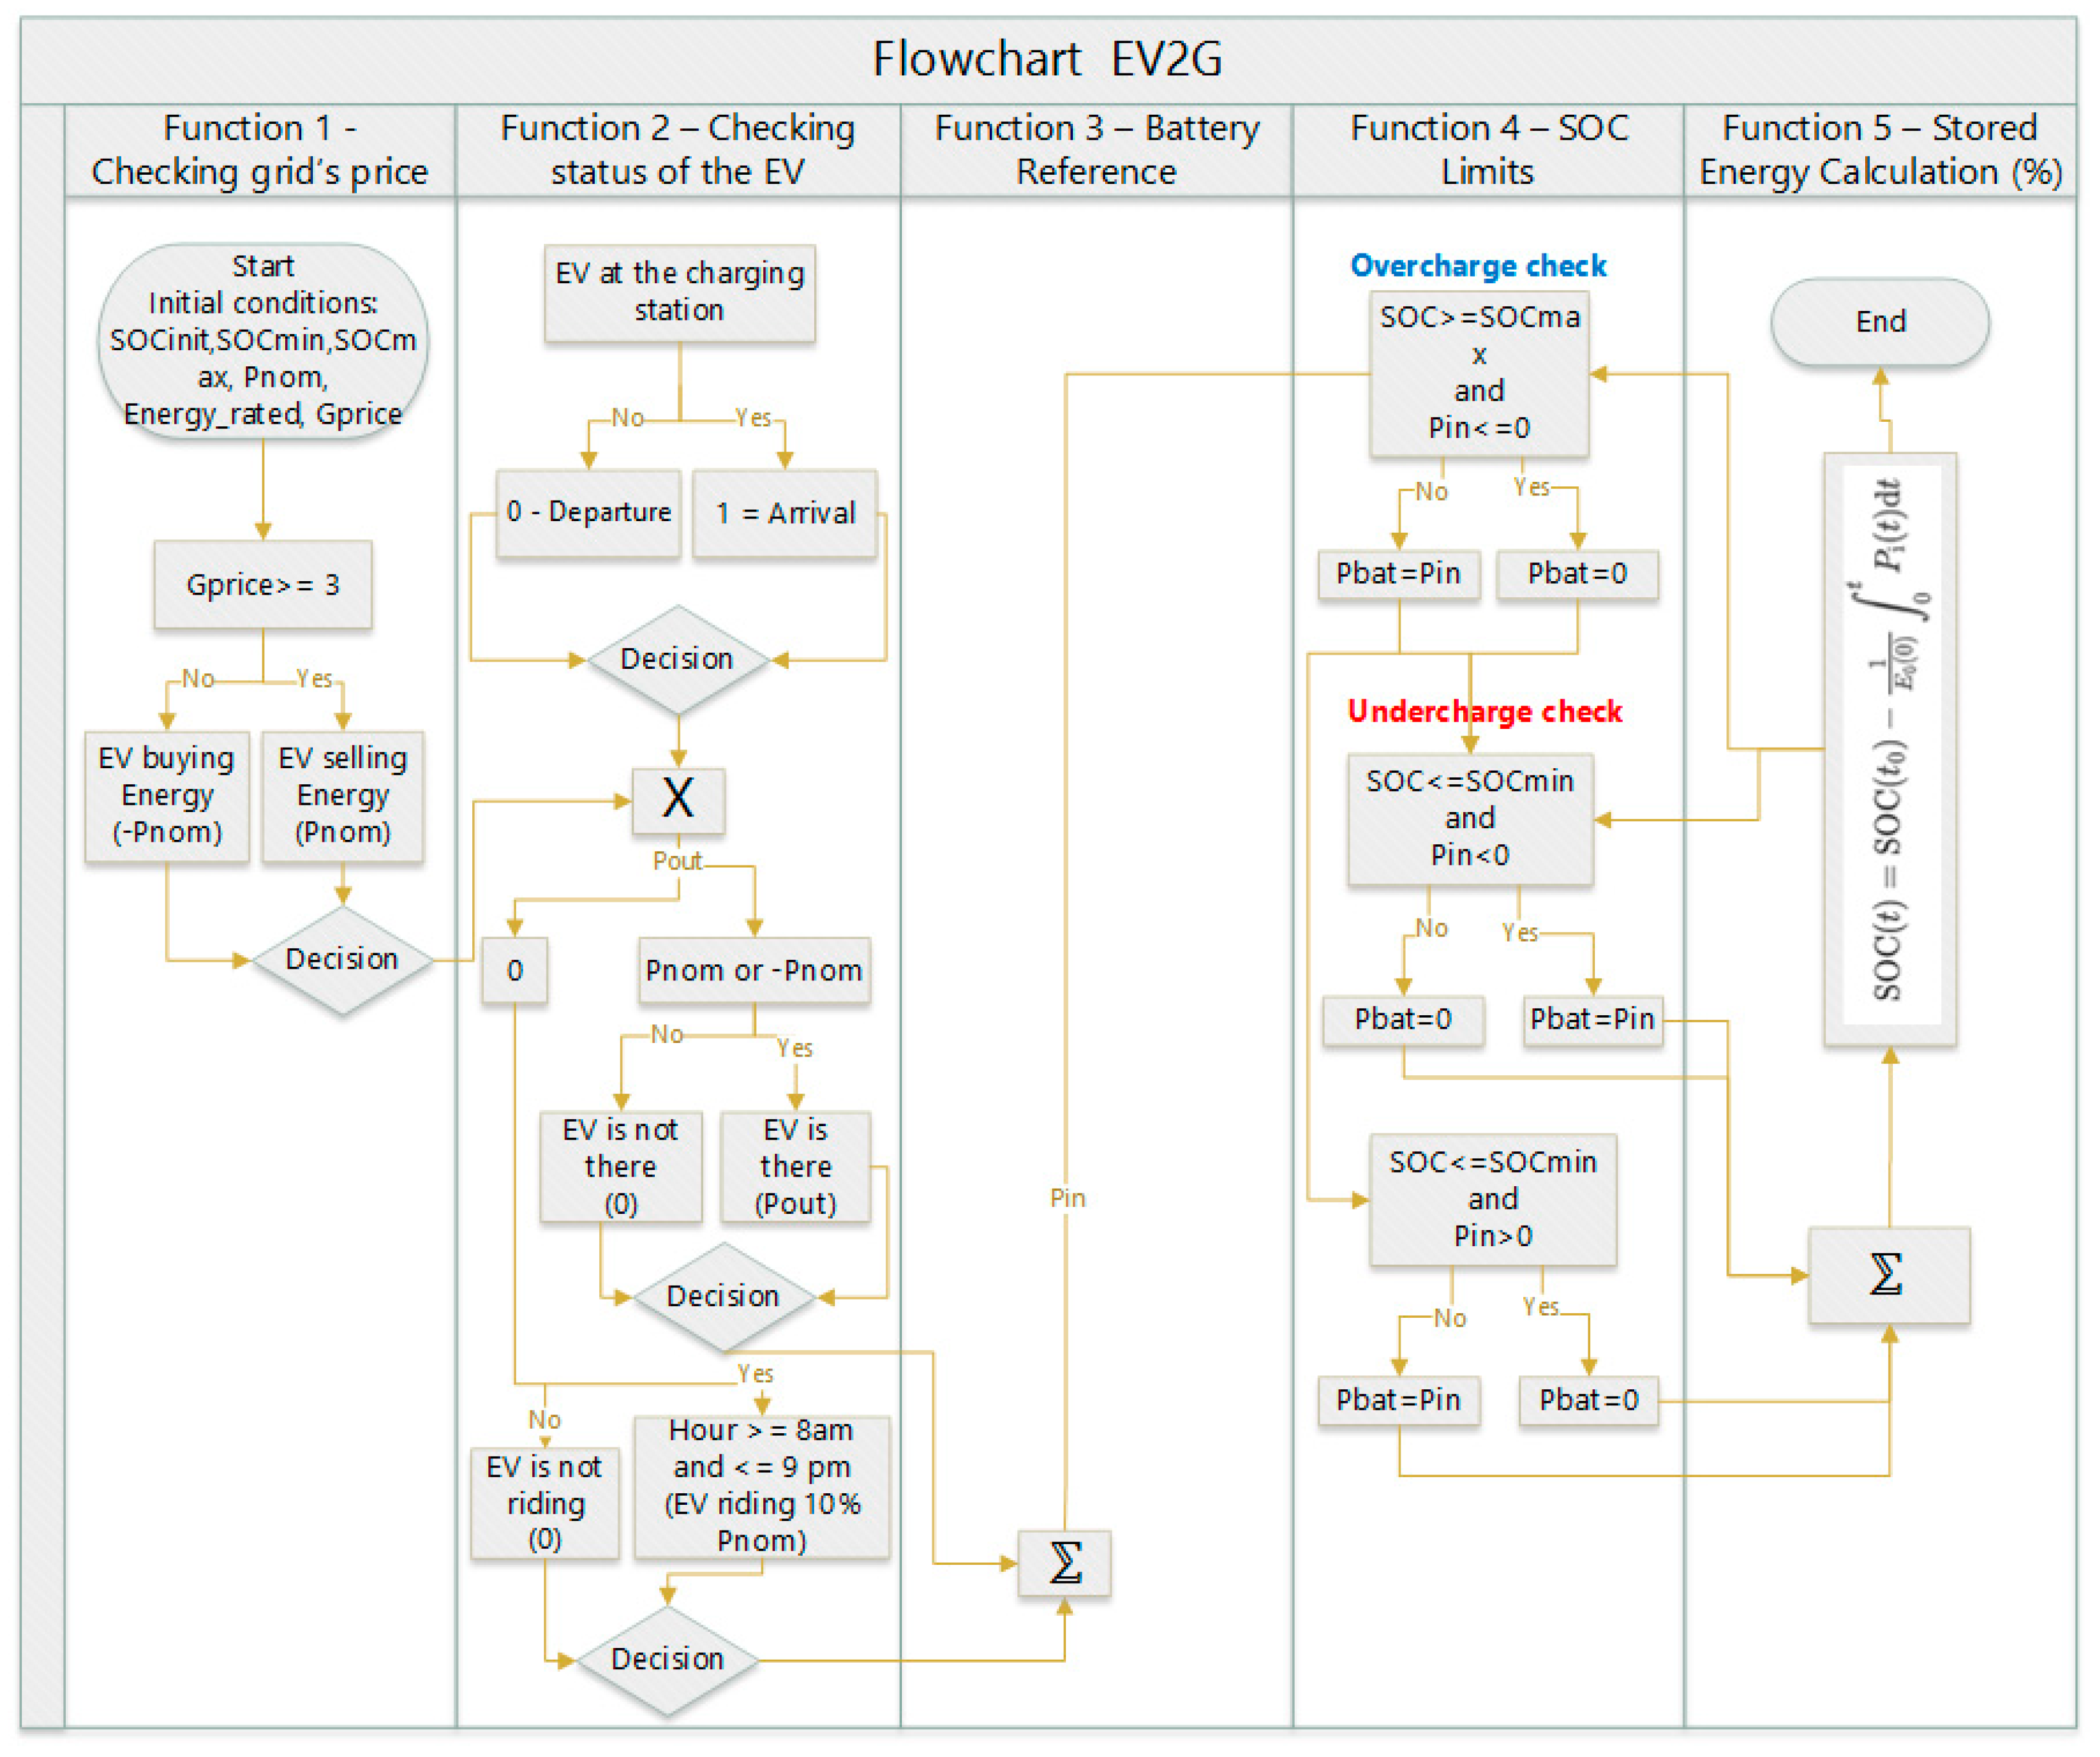
A set of chargers was modeled with varying characteristics. The EV charging was simulated for 24 h. The flowchart in Figure 2 presents the model with the different algorithms divided into different functions. An overview of the functionality of the proposed V2G model is also provided in Table 1.
Function 1 describes the initial conditions, including, e.g., the initial SOC value of each EV, as well as the electricity price set-point for when to sell or buy electricity (meaning when to charge or discharge the EV). The estimated electricity price in Sweden during a day with large hourly fluctuations was chosen to show how the chargers would operate during significantly different conditions. A price set-point was chosen in this simulation as 3 SEK/kWh (in Function 1), according to which the chargers would evaluate their operation mode. If the estimated electricity price exceeded the set-point, the chargers promoted the V2G mode, and for low prices, the chargers promoted the charging mode, as shown in Function 1 in the flowchart in Figure 2. Five of the vehicles in the simulation model could use the V2G mode (meaning that these vehicles could buy and sell electricity from or to the grid based on the estimated electricity price), and another five vehicles did not have this capability.
In Function 2, it is determined whether the EV is parked and connected to a charger or not. If the EV is connected to a charger, there is an opportunity to use it for V2G with a set value of nominal power for charging and discharging, provided that the overall conditions (e.g., limits on SOC value, estimated electricity price, etc.) are fulfilled. If the EV is not parked, i.e., not connected to a charged, during the hours: 08:00 to 21:00, it is assumed that the EV is being driven and that the SOC value is dropping based on a set value.
In Function 3, the results from Functions 1 and 2 are summed up to decide whether the vehicle can be used for V2G or not.
In Function 4, the SOC of the EV is analyzed to find out if it is below or above the lower or upper SOC limits, set to 20% and 80%, respectively. The decision on whether to charge or discharge the EV depends also on the results from the previous functions.
Finally, in Function 5, the SOC of the EV battery is calculated based on Equation (4). The overall decision making for the vehicles in the model depends on all five functions described in the flowchart.

2.2. Input Data to the Case Study

The first version of the MATLAB/Simulink model for charging and discharging includes ten EVs, each with different estimated and assumed values regarding their battery systems (note that these values could vary), namely, three Nissan Leaf cars with BESS capacities of 40 kWh and an assumed 10 kW rated power for charging and discharging; two Mitsubishi Outlander, plug-in hybrids, with battery capacities of 13.8 kWh and a 3.7 kW rated power for charging and discharging; three Volvo cars, with a battery capacity of 69 kWh and an assumed 11 kW rated power for charging; and two Tesla cars with batteries of 57.5 kWh and an assumed 11 kW rated power for charging. The modeled EVs can be changed in user profiles (if the EVs are at home or away), initial SOC, maximum and minimum SOC, rated power for the charging and discharging, and battery capacity, to name a few configuration possibilities. This enables the modeling of different user profiles and different types of EVs. There is a trade-off between utilizing the car for personal transportation needs and enhancing the economic revenue from charging and discharging when there is a significant fluctuation in the electricity price.
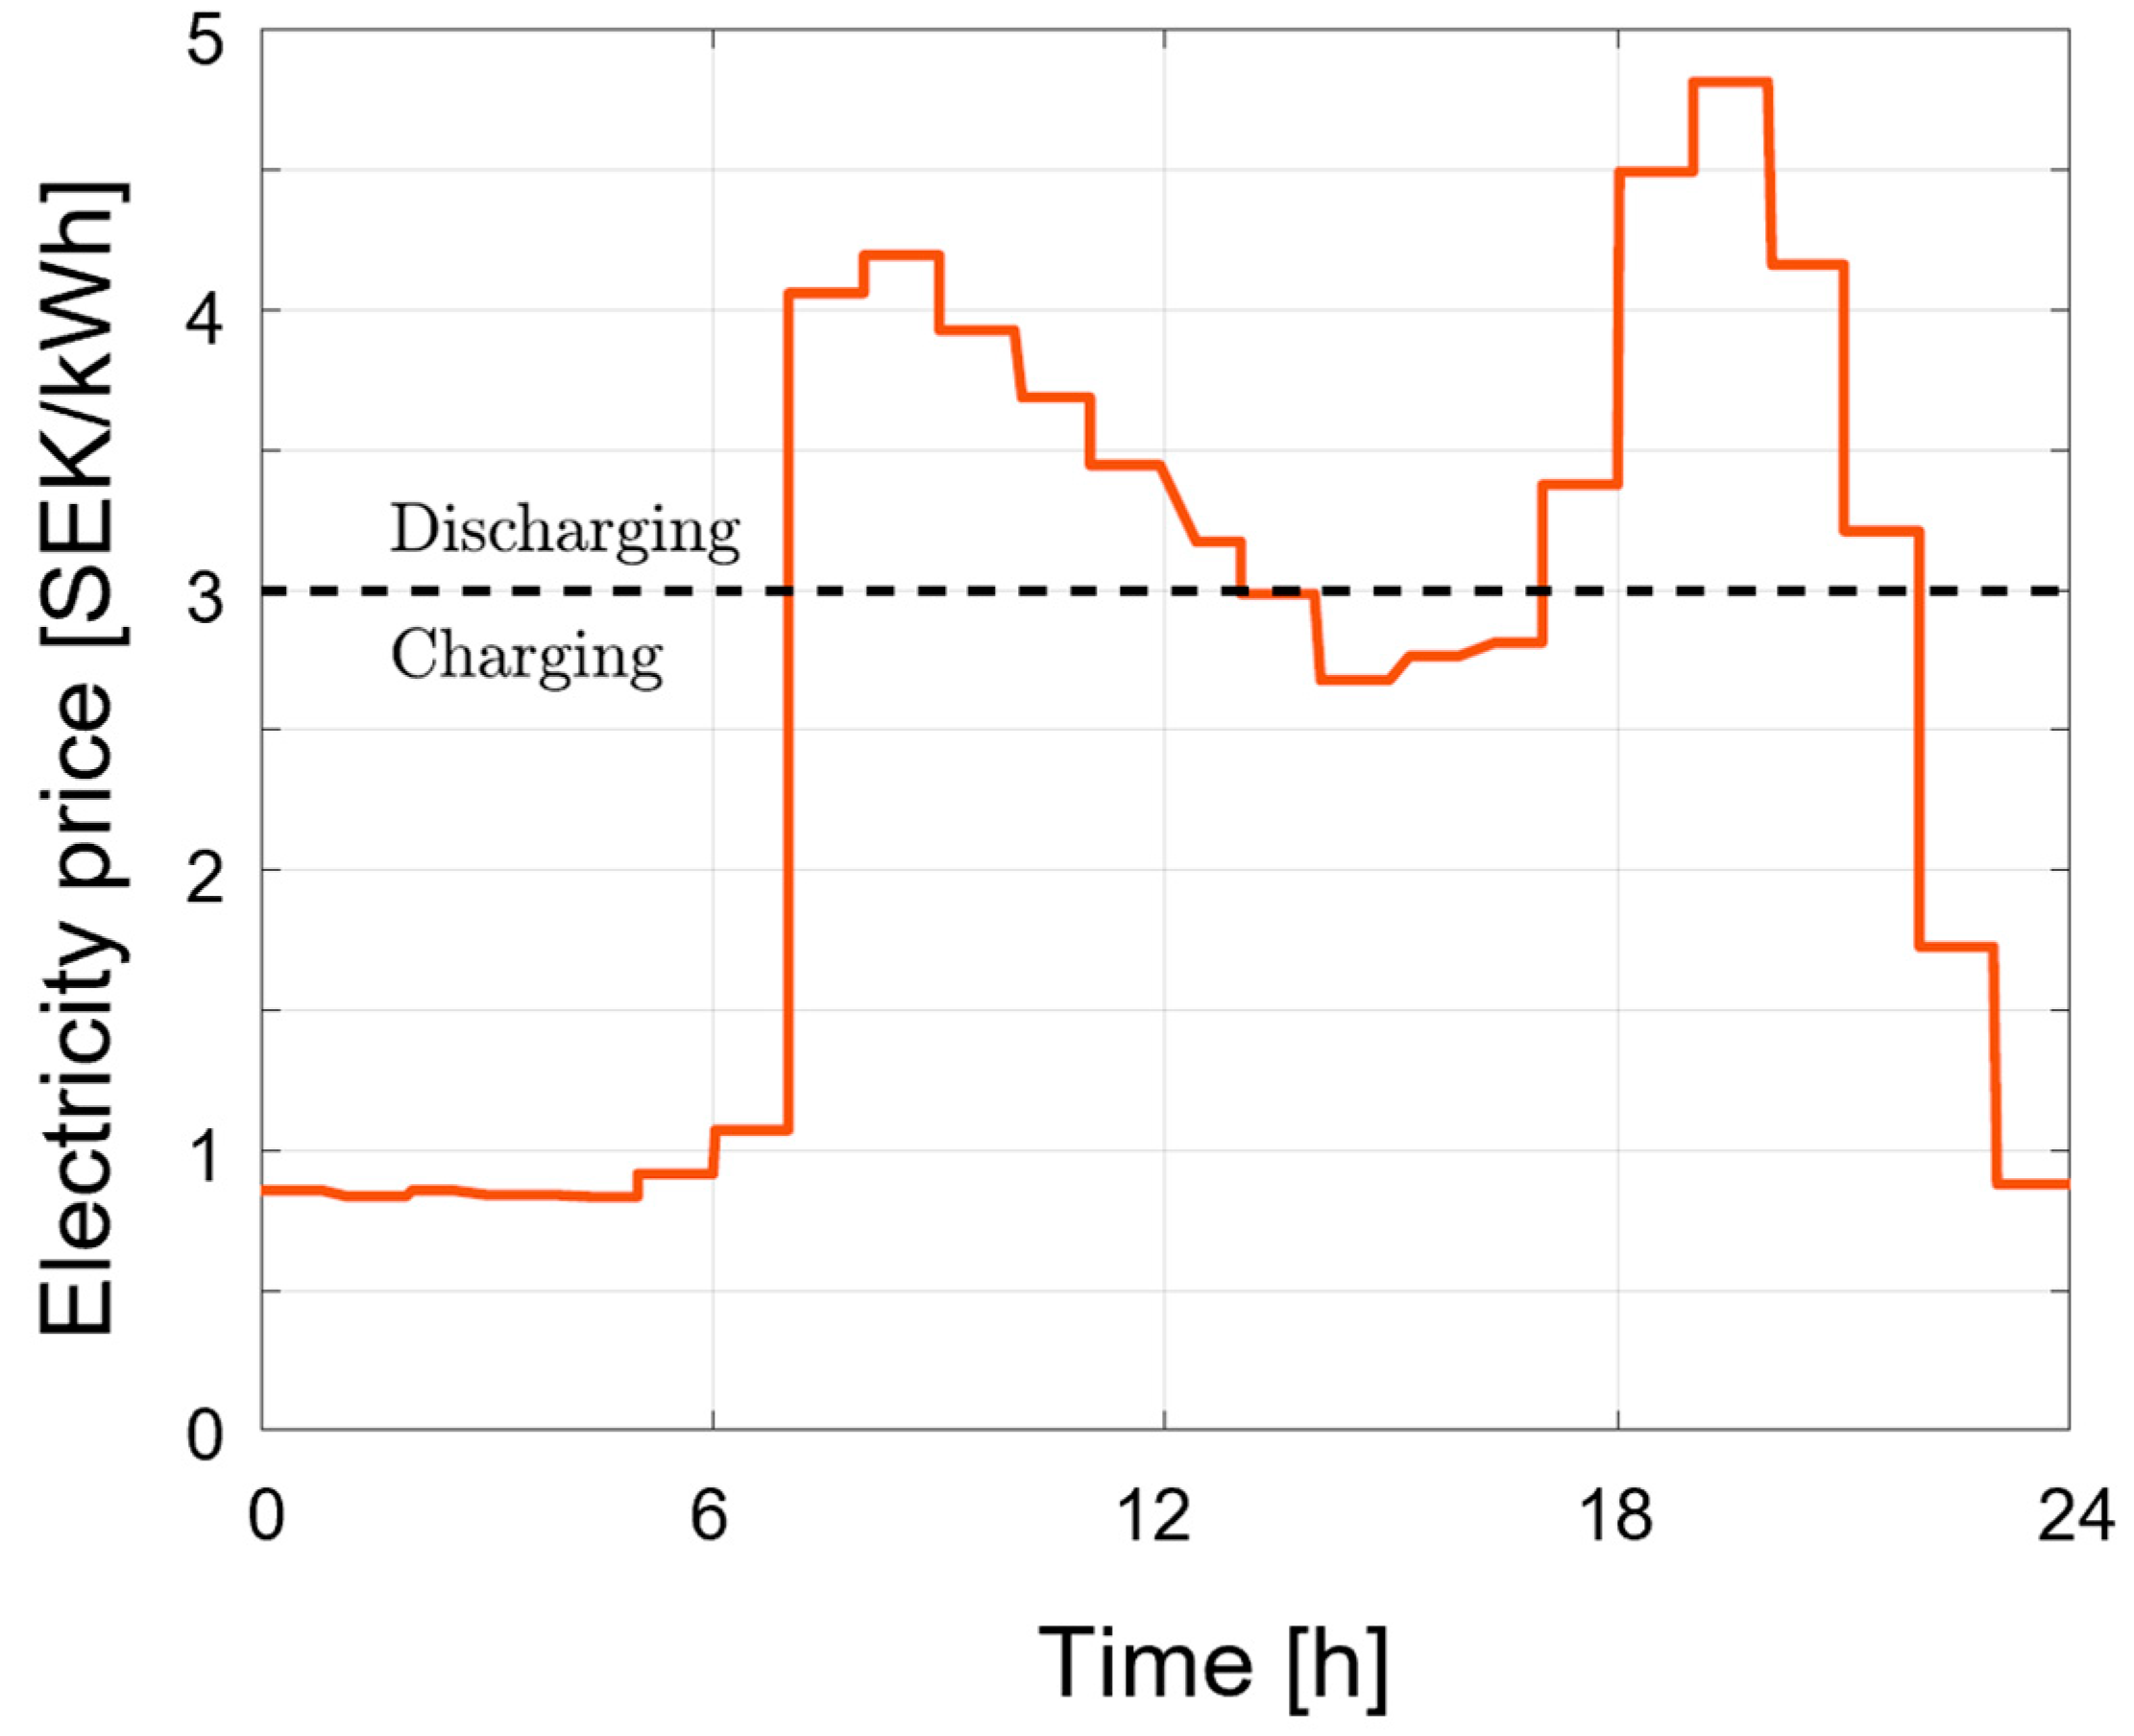
The simulation model is a charging and discharging model of EVs based on a design approach, using MATLAB/Simulink in the phasor simulation type in 50 Hz for 24 h. This includes four different types of EVs, two of them in the charging and discharging mode (V2G) and the other two types in only the charging mode (EV). Three different user profiles are distributed among the vehicles. The model takes the estimated electricity price and user profile as input and generates the command to the vehicle. The case study focuses on the Swedish energy system. The electricity price over one day estimated for Sweden is used as input data to the model, and the estimation is shown in Figure 3. Electricity prices for different regions can be found on, e.g., Nord Pool [34] and in publications. The electricity price is based on the demand for electricity during the different hours. Based on Figure 3, the set-point of 3 SEK/kWh was chosen for this simulation (indicated by a dashed line). The high values of the estimated electricity price match a high national electricity demand, and the EVs could, at these moments, possibly contribute by selling additional electricity to the grid for support. Also, the opposite could occur, where the EV owner buys electricity from the grid when the estimated price is lower. The electricity price in Sweden varies with the days and seasons. The estimated price in Figure 3 varies over different days, where generally the prices are higher in the winter than in the summer. The electricity prices relate to the electricity production, with a significant amount of variable RES such as hydropower, wind power, and solar power in Sweden [35]. For a household with a PV system installed, the electricity purchased from the grid could be reduced in the summer, due to more sunlight and longer days, than in the winter.
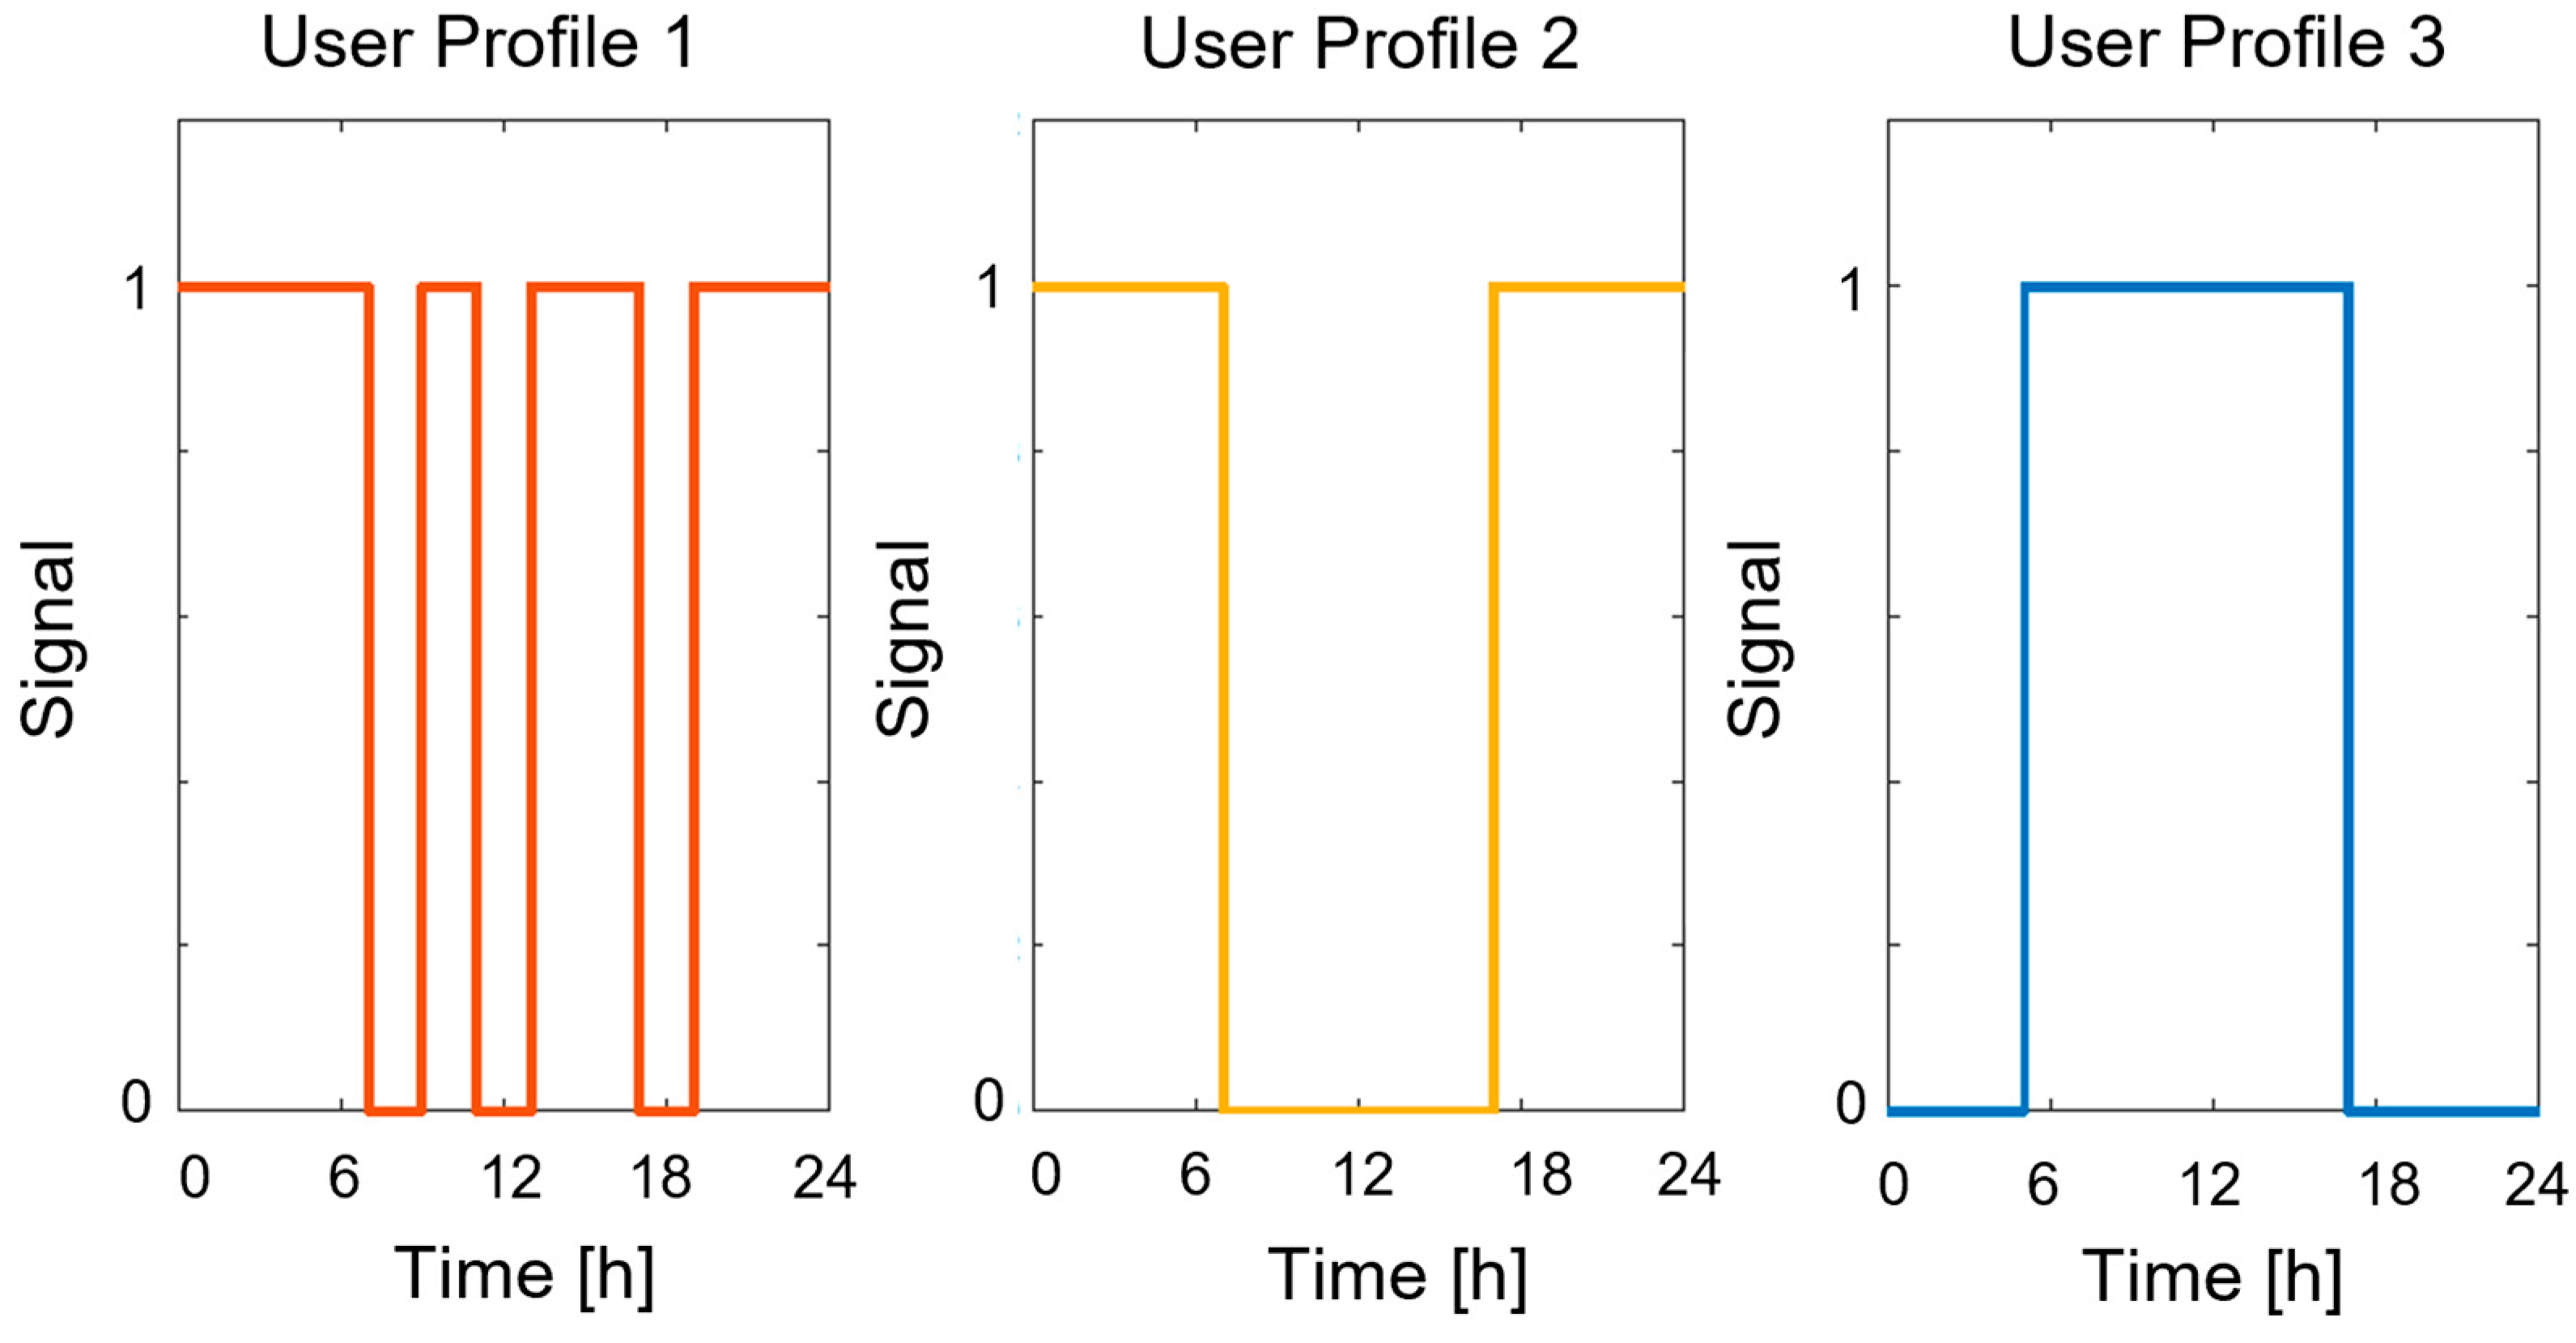
The user profile of the EV owner decides when the EV is at home, where an available bidirectional charger is assumed, or when the EV is not at home. The typical charging profiles of EVs vary (for example, if it is a weekend or weekday, the season, and type of life of the EV owner). Three user profiles utilized in this model are shown in Figure 4.
Considering the user profiles in Figure 4, the profiles follow patterns according to the following description; Profile 1: the car is parked for charging/discharging either at home or at work during some hours, and in between, it is driven a certain distance between the two locations. Profile 2: the car is parked at home in the morning and the evening, but during the daytime, there is no charging possibility at work. Profile 3: this profile corresponds to persons who work night shifts, where the car is parked at home during the daytime and parked at work during the nighttime with no charging possibilities. The three profiles are distributed among the ten EVs as follows: Profile 1 is added to Users 1, 6, 8, and 10; Profile 2 is added to Users 3, 7, and 9; and Profile 3 is added to Users 2, 4, and 5. The initial SOC is set to 50% for all ten cars, and the maximum and minimum SOC limits are set to 80% and 20%, respectively.

3. Results and Discussion

The results from the simulations include, e.g., the SOC when using the EVs for bidirectional or unidirectional charging strategies, presented in Figure 5 and 
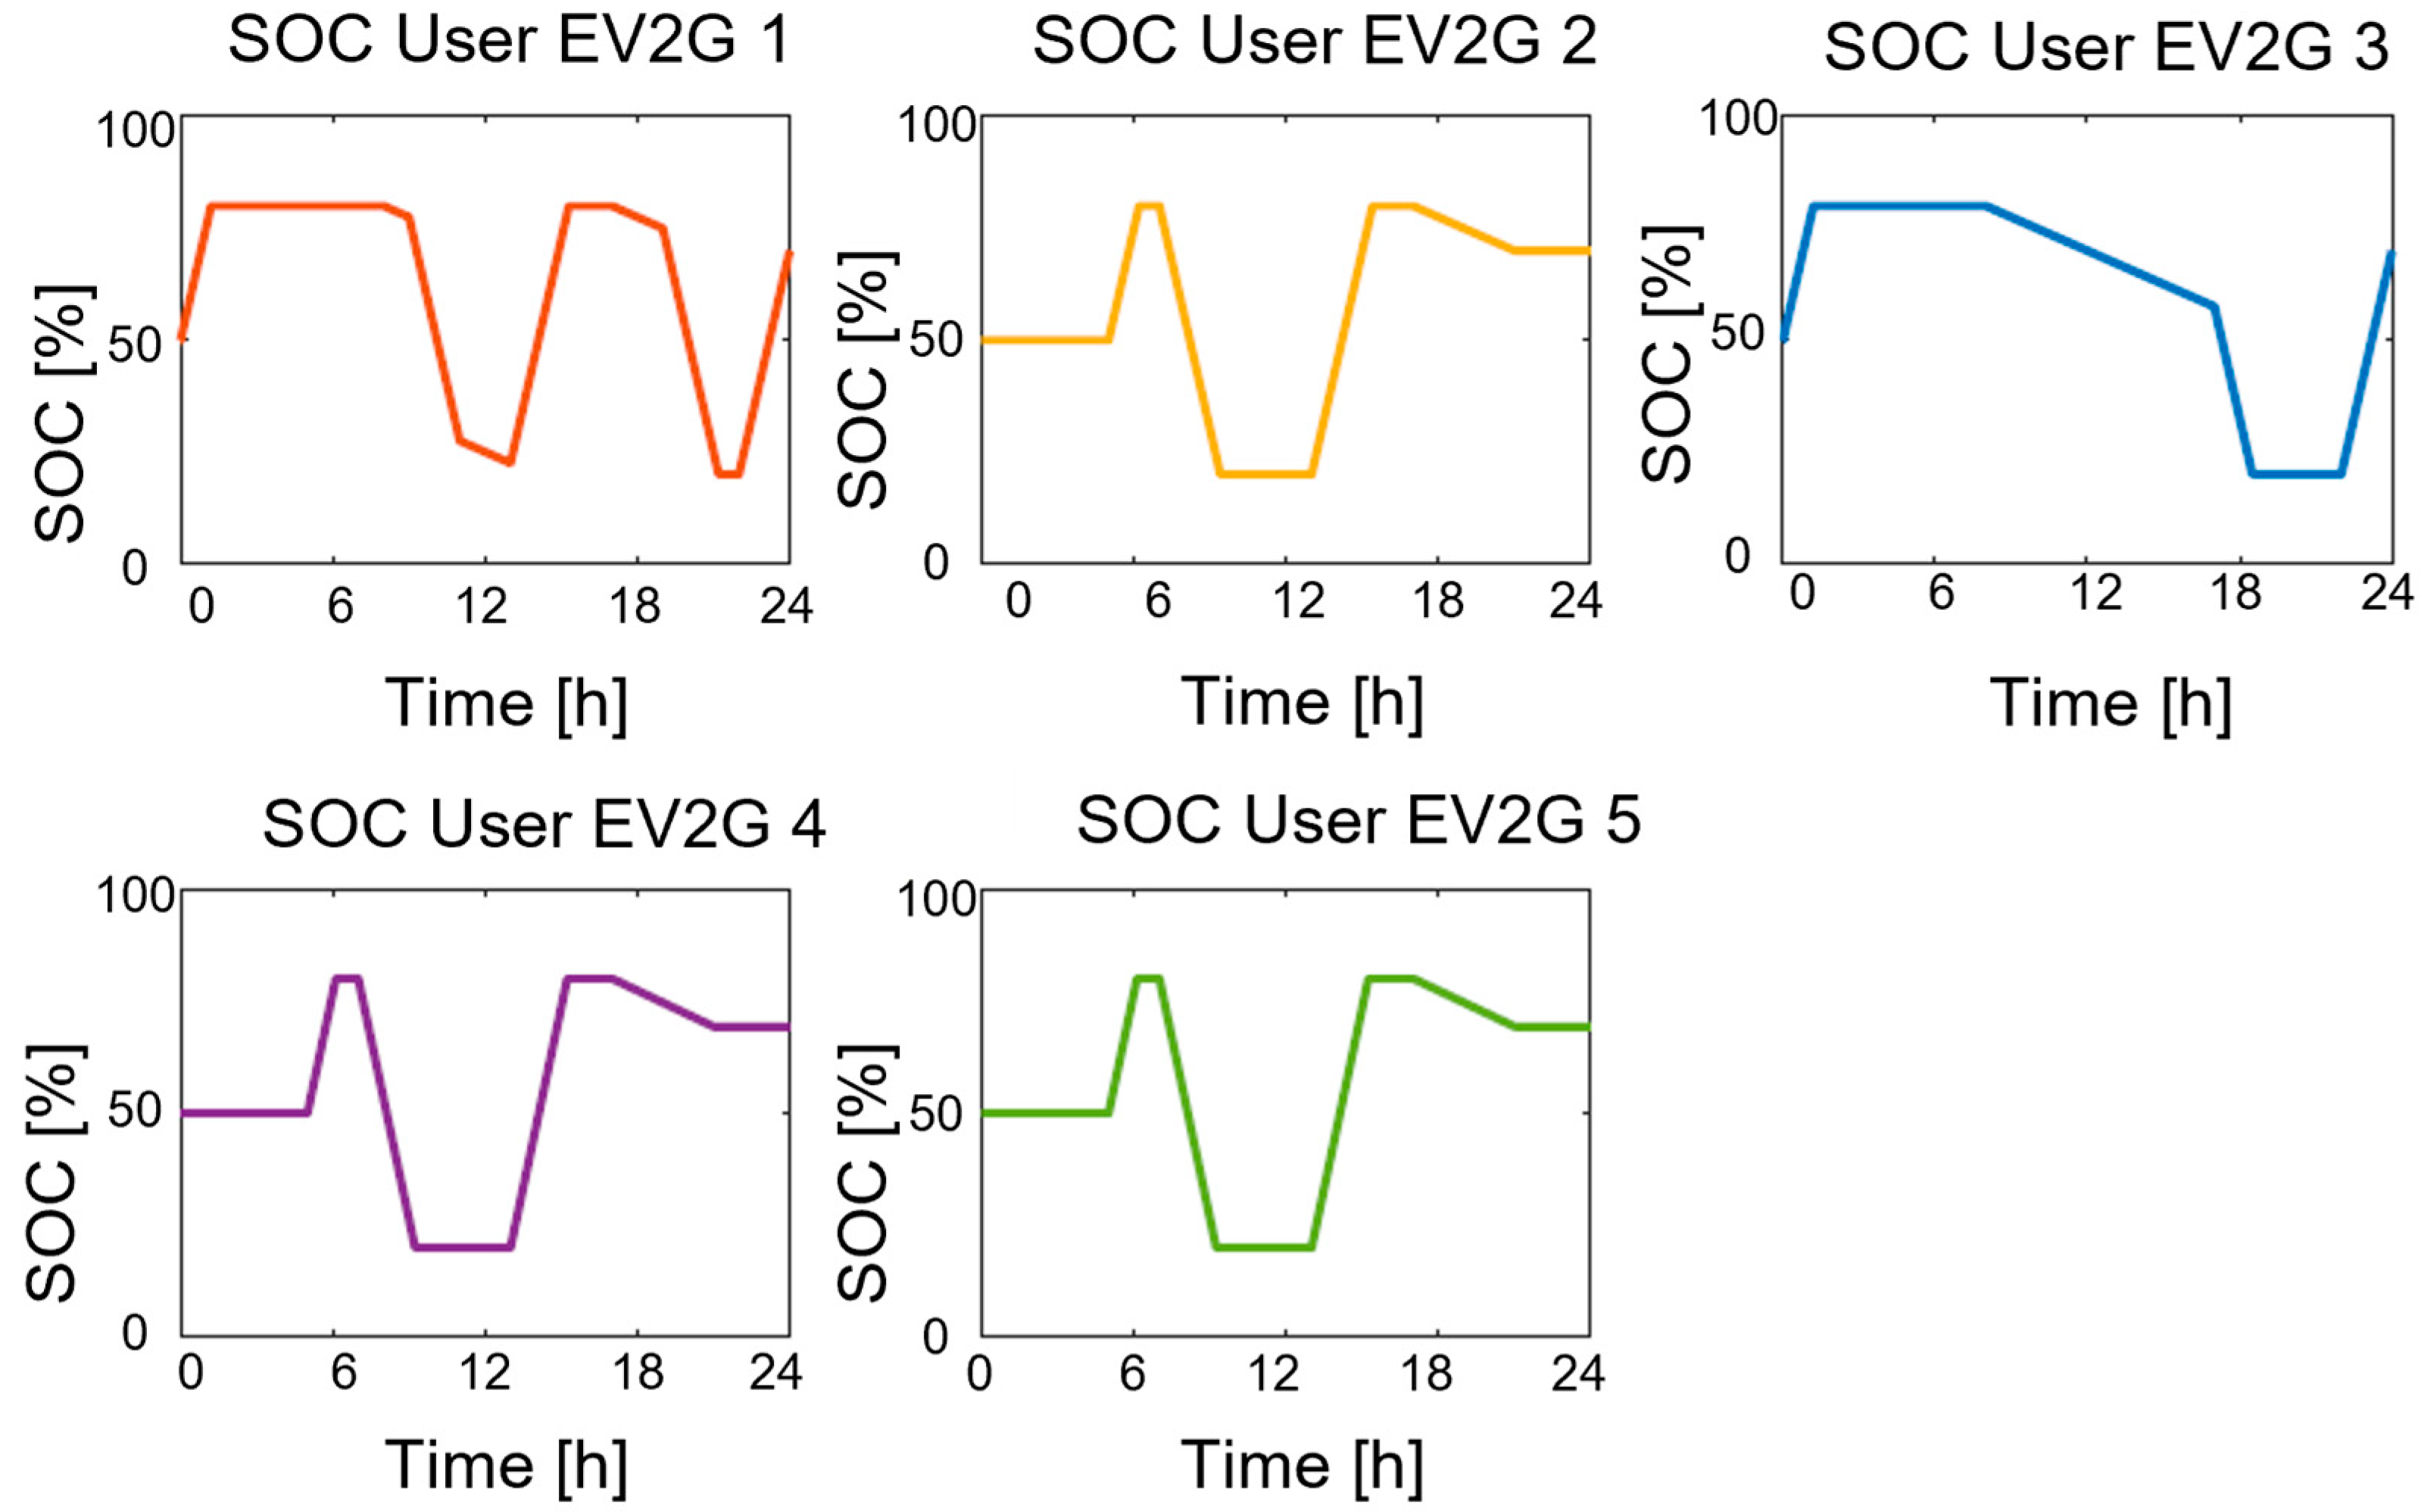
Figure 6. The SOC values estimated for the EVs of the types Nissan Leaf and Mitsubishi Outlander, for different user profiles, are modeled and shown in Figure 5. These EVs are simulated to both charge from and discharge back to the grid, with V2G capabilities.
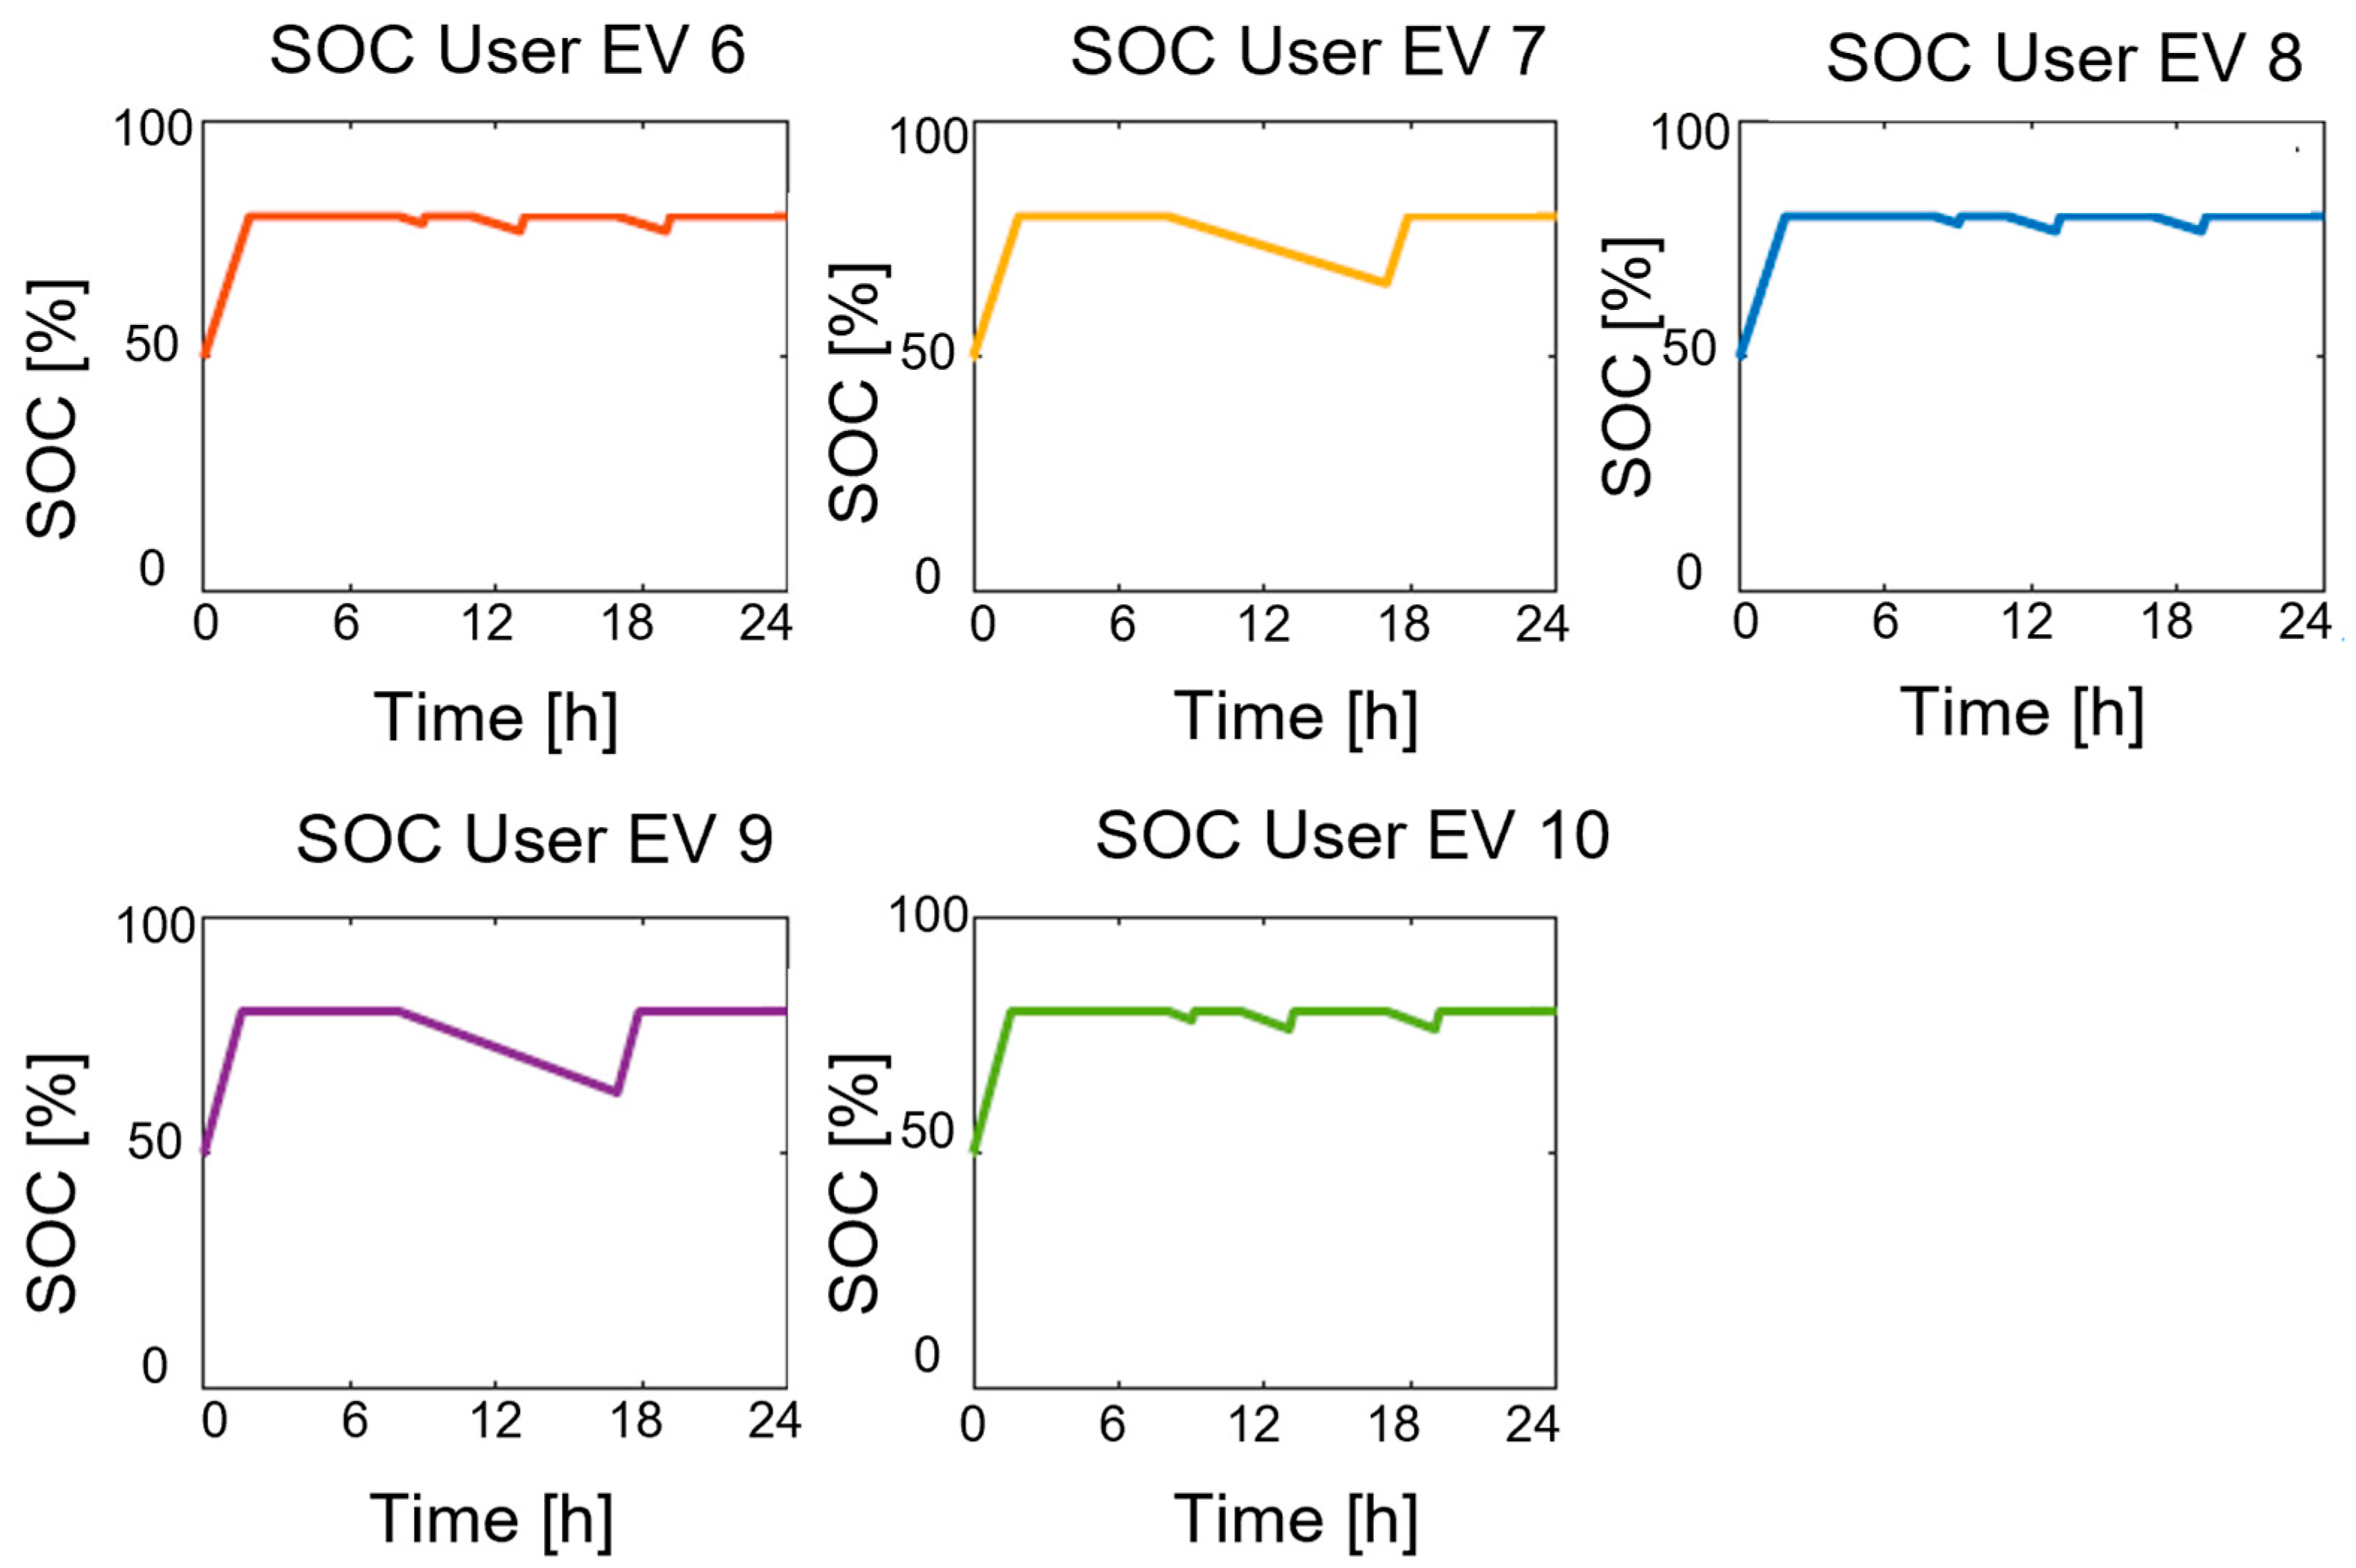
The SOC values estimated for the EVs of the types Volvo and Tesla are modeled and shown in Figure 6. It is noted that these EVs are only charged from the grid, with no V2G capabilities.
The different time periods of Figure 5 and Figure 6 can be analyzed. According to Figure 3, before 07:00, the electricity price is below 3 SEK/kWh, allowing the vehicles only to charge until reaching the upper limit of the SOC. If the vehicle is not charging during this period, this is because of the user profile, meaning a car that is not connected to the charging station. This is the case for User 2, User 4, and User 5 (Profile 3 in Figure 4), presented in Figure 5.
During the period 07:00 to 13:00, the vehicles only discharge as the electricity price is above 3 SEK/kWh, selling electricity to the grid until reaching the lower limit of SOC. However, it can be noticed that User 1, User 3, User 6, User 7, User 8, User 9, and User 10 in Figure 5 and Figure 6 are discharging, even though the vehicles are not at the charging station. This occurs due to the vehicles traveling and discharging at an assumed 10% of the nominal power.
During the period 13:00 to 16:00, the vehicles only charge as the electricity price is below 3 SEK/kWh, buying the electricity from the grid until reaching the upper limit of SOC. However, it can be noticed that User 3, User 7, and User 9 (Profile 2 in Figure 4) are discharging because each vehicle is not connected to the charger and traveling, discharging at 10% of the nominal power.
From 16:00 to 21:00, the vehicles only discharge as the electricity price is above 3 SEK/kWh, selling the electricity to the grid until reaching the lower limit of SOC. From 21:00 to 07:00, the vehicles only charge as the electricity price is below 3 SEK/kWh, buying the electricity from the grid until reaching the upper limit of SOC. It can be noted that when the vehicle is not at the charging station, the SOC is constant, different from the other scenarios where the vehicles were traveling and discharging at 10% of the nominal power. This is due to the possibility of traveling during a certain period (from 08:00 to 21:00).
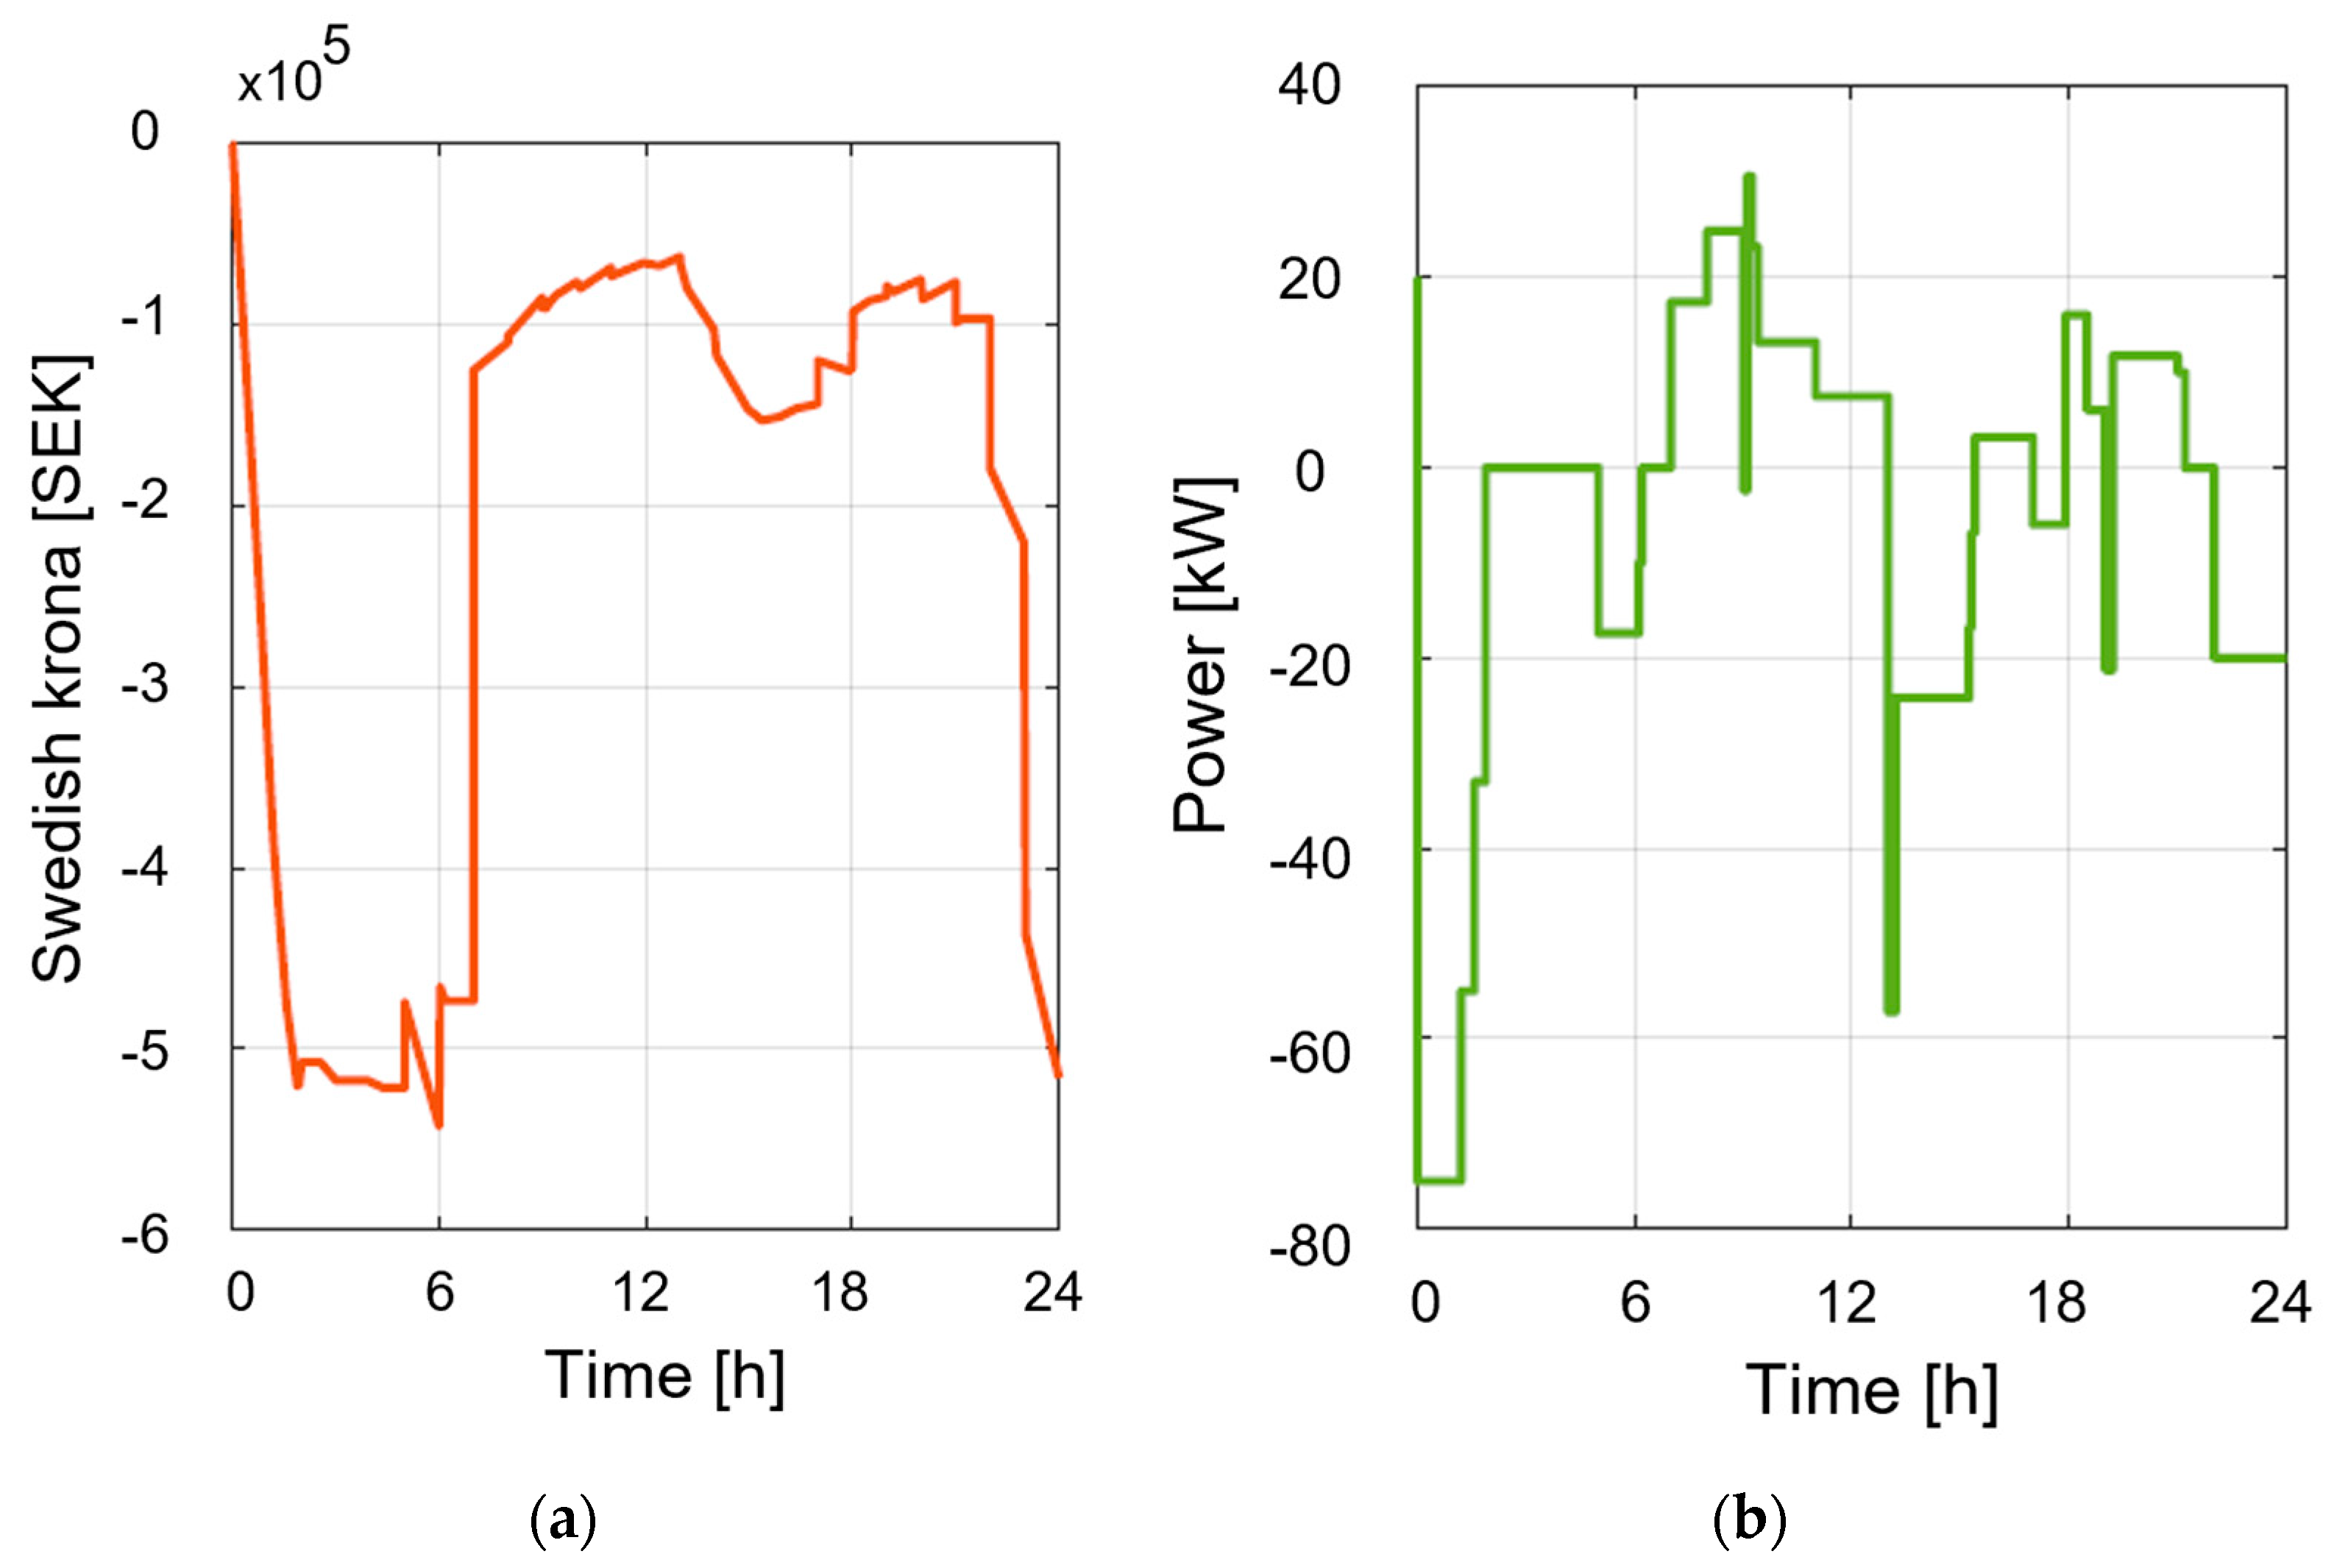
Aggregating the ten EVs to the grid, where half of the EVs provide V2G, the estimated cost of the charging or revenues from discharging and the power (kW) to and from the grid over one day are shown in Figure 7a,b.
From hour 00:00 to 07:00, in Figure 7a, the electricity price is below 3 SEK/kWh, and the EVs are charging (buying electricity from the grid). The negative signal represents that the grid is earning money from EV users. From hour 07:00 to 13:00, the electricity price is above 3 SEK/kWh, meaning that some of the EVs (i.e., the EVs with V2G capabilities parked at the charging station—User 1, 2, 3, 4, and 5) will sell electricity back to the grid, as can be indicated by the rise of the red curve in Figure 7a. But, the curve is still negative due to an imbalance between the electricity being sold to and bought from the electric grid. This variation (i.e., imbalance) in buying and selling electricity from and to the grid with all the EVs in the model is also shown in the final hours 13:00 to 24:00 in Figure 7a. Figure 7b shows the power to and from the electric grid based on the rated power for each EV for charging and discharging, presented in Section 2.2. The grid sells more electricity for charging the EVs than buys electricity from the EVs, which is reasonable since the grid buys only when the electricity price in this model is higher than 3 SEK/kWh, and only half of the EVs have V2G capabilities in the model. Charging and discharging based on the electricity price could be controlled by an aggregator to provide support to the electric grid. The charging and discharging of EVs will affect the power system. EV charging at high power levels, to provide a short charging time, can create power peaks in the electric grid. To use V2G on a large scale in society requires a robust electric grid, and V2G can also support the electric grid with balancing services and enhanced flexibility.
While the main objective of this study is to investigate the potential economic revenues from V2G based on estimated local electricity price variations, future research could include an in-depth investigation of how the large-scale adoption of V2G may impact the electric grid (including, e.g., the load profiles of the grid). The benefits from utilizing V2G may not only be the economic revenues for each EV owner. V2G could potentially also support the local electric grid with grid balancing services, contribute with additional electricity at remote locations, or support the self-sufficiency of the EV owner if charged and discharged to a household.
However, the EV battery could be affected by this new bidirectional charging strategy. The lifetime of the EV batteries is affected by several factors, such as the ambient temperature and charging/discharging power levels. It is complex to estimate the SOH of an EV battery. Thus, the potential economic revenue from different charging strategies such as V2G is hard to estimate and varies from different specific cases. From the Swedish perspective, winters often provide negative ambient temperatures, and the charging or discharging of EVs outdoors may degrade the batteries faster, especially if the charging or discharging is carried out at high power levels (i.e., fast charging).
It is a challenge to propose a suitable economic compensation to an EV owner utilizing V2G as it should include both economic compensation for the electricity sold to the grid and for the potential EV battery wear. The opportunity to use V2G may also affect the warranty time of the EV, as well as the price of the EV on the second-hand market. The opportunities and challenges with implementing V2G in Sweden require further research, including both modeling and experimental work, to provide a deeper understanding of V2G from technical and economic perspectives.
As described in Section 2, the results presented are based on the charging and discharging of the ten vehicles during 24 h modeled in the MATLAB/Simulink simulation framework, with a phasor simulation type with 50 Hz. The model includes an algorithm for deciding when to charge or discharge the EV, including input data, e.g., SOC, estimated electricity price, EV type, and charging and discharging power levels. The simulation model is still at an early stage of development. In this first version of the model, all EVs have the same initial SOC, the analysis is only conducted for one day, the SOC lowered due to driving the EV is only roughly estimated, etc. This can be modified for in future versions, to simulate EVs driving a certain distance when it is not parked at home. Additional functionality can be included and added to the model to better simulate different types of EVs and V2G. Future simulations will be conducted with a real-time simulator, and so far, only first trials have been carried out to, for example, simulate transients. Choosing an appropriate control signal for V2G can sometimes result in a conflict of interest, e.g., if the estimated electricity price is low during local high-demand hours, which would suggest charging when the grid is already stressed. Therefore, it may be a good idea to prioritize the order of objectives if the chargers target both economic and technical objectives.

4. Conclusions

There are different charging and discharging strategies presented in the scientific literature, including smart charging strategies such as V2G, where the EV is not only charged from the electric grid but also discharged back to the grid. A simulation model of the charging and discharging of ten vehicles has been designed in MATLAB/Simulink. The model includes an algorithm for deciding when to charge or discharge the EV. The charging strategy for V2G capability in the model is related to the estimated electricity price, with the goal to charge the EV when the price is low and discharge when the price is high. The model also includes EVs with no V2G capabilities, meaning that these can only be charged from the grid. The results show how the SOC for different user profiles could vary over a day.
The maximum SOC value for using V2G was set to 80%, whereas the minimum value was 20%, and the starting value of each EV was 50%. The value 3 SEK/kWh was chosen as a set-point for when to charge (if the price was lower than 3 SEK/kWh) or when to discharge if V2G was an option (if the price was higher than 3 SEK/kWh). It was concluded that the model of V2G resulted in larger SOC differences (from 20% to 80% SOC) than if the V2G capability was not included. V2G can potentially support the power grid with grid balancing services.
The electricity price can vary with, e.g., different seasons and days due to the amount of RES connected to the electric grid. Therefore, the revenue from using the V2G will vary with different seasons and days. The electricity usage pattern may, however, be more or less similar for a workday in any season. If there are great variations in the electricity prices due to, for example, seasons with significant variations in electricity production from RES, the economic revenue from V2G will increase as the EV owner can buy electricity when the price is low and sell when the price is high. If the electricity price is more or less stable, which could be the case during some seasons, the financial incitements from using V2G will decrease. Generally, the electricity need in Sweden is greater in the winter than in the summer, and therefore, the V2G could be more important in the winter than in the summer.
While the estimated electricity price and variations over the day provide opportunities to create additional revenues, the battery system of the EV may be aged faster due to additional battery cycling. The results from the simulation show that the grid sells more electricity, due to EV charging, than buys electricity from the EVs due to V2G. There are limitations with this study, e.g., it is only based on MATLAB/Simulink simulations with no real experimental data from EV charging, and no experiments are included, and there are assumptions made on the type of EVs and the charging and discharging rates. Future research can include, e.g., improved estimations on discharging during driving, include a validation of simulated values in comparison to real-life data from EV charging, or include experiments on V2G in society. There are several barriers limiting the acceptance of V2G technologies, such as technical, economic, regulatory, social, political, and environmental challenges. Additionally, other important issues need to be addressed for the successful implementation of V2G, such as coordination among stakeholders, standardization, the deployment of charging stations, and the design of public policy incorporating EVs. This study investigates some of these aspects, bringing V2G technologies one step closer to more widespread implementation. This is the first step in modeling and understanding more about the opportunities and challenges with the charging and discharging of future EVs.

Author Contributions

Methodology, J.L., J.S.D. and J.H.; software, J.S.D.; validation, J.L., J.S.D. and J.H.; formal analysis, J.L., J.S.D., J.H., V.C., D.B. and C.B.; writing—original draft preparation, J.L, J.S.D., J.H. and V.C.; writing—review and editing, J.L., J.S.D., J.H., V.C., D.B. and C.B; visualization, J.S.D. and J.H.; supervision, C.B.; project administration, J.L. All authors have read and agreed to the published version of the manuscript.

Funding

This research was funded by Swedish Electromobility Centre (SEC), project: “Data exchange between vehicle and power system for optimal charging”, the Swedish Energy Agency project: “Resource-efficient energy system solutions for airports with a high share of electric aviation (RES-Flyg)” grant number: P52433-1, the Resilient Competence Centre project: “Interregional Perspectives on Infrastructure Investment Optimization for Flight Electrification and Decarbonization—Uppsala University (iFED-UU)”, SweGRIDS by the Swedish Energy Agency, Vattenfall AB, and E.ON, the Swedish Energy Agency project: “The impact of charging strategies on the electric car’s battery system”, grant number: P2022-01305, (in Swedish: “Laddningsstrategins inverkan på elbilens batterisystem (LIEB)”) and the SASUF project “Renewable energy sources for powering electric vehicles in South Africa”. This project is conducted within the STandUP for Energy framework.

Data Availability Statement

The original contributions presented in the study are included in the article, further inquiries can be directed to the corresponding author.

Conflicts of Interest

The authors declare no conflicts of interest.

References

  1. Das, H.S.; Rahman, M.M.; Li, S.; Tan, C.W. Electric Vehicles Standards, Charging Infrastructure, and Impact on Grid Integration: A Technological Review. Renew. Sustain. Energy Rev. 2020, 120, 109618. [Google Scholar] [CrossRef]
  2. Islam, S.; Iqbal, A.; Marzband, M.; Khan, I.; Al-wahedi, A.M.A.B. State-of-the-Art Vehicle-to-Everything Mode of Operation of Electric Vehicles and Its Future Perspectives. Renew. Sustain. Energy Rev. 2022, 166, 112574. [Google Scholar] [CrossRef]
  3. Leijon, J.; Boström, C. Charging Electric Vehicles Today and in the Future. World Electr. Veh. J. 2022, 13, 139. [Google Scholar] [CrossRef]
  4. Sun, C.; Negro, E.; Vezzù, K.; Pagot, G.; Cavinato, G.; Nale, A.; Herve Bang, Y.; Di Noto, V. Hybrid Inorganic-Organic Proton-Conducting Membranes Based on SPEEK Doped with WO3 Nanoparticles for Application in Vanadium Redox Flow Batteries. Electrochim. Acta 2019, 309, 311–325. [Google Scholar] [CrossRef]
  5. Solanke, T.U.; Ramachandaramurthy, V.K.; Yong, J.Y.; Pasupuleti, J.; Kasinathan, P.; Rajagopalan, A. A Review of Strategic Charging–Discharging Control of Grid-Connected Electric Vehicles. J. Energy Storage 2020, 28, 101193. [Google Scholar] [CrossRef]
  6. Kubli, M. EV Drivers’ Willingness to Accept Smart Charging: Measuring Preferences of Potential Adopters. Transp. Res. D Transp. Env. 2022, 109, 103396. [Google Scholar] [CrossRef]
  7. Johnson, J.; Berg, T.; Anderson, B.; Wright, B. Review of Electric Vehicle Charger Cybersecurity Vulnerabilities, Potential Impacts, and Defenses. Energies 2022, 15, 3931. [Google Scholar] [CrossRef]
  8. Schram, W.; Brinkel, N.; Smink, G.; Van Wijk, T.; Van Sark, W. Empirical Evaluation of V2G Round-Trip Efficiency. In Proceedings of the SEST 2020—3rd International Conference on Smart Energy Systems and Technologies, Istanbul, Turkey, 7–9 September 2020. [Google Scholar] [CrossRef]
  9. Tan, K.M.; Ramachandaramurthy, V.K.; Yong, J.Y. Integration of Electric Vehicles in Smart Grid: A Review on Vehicle to Grid Technologies and Optimization Techniques. Renew. Sustain. Energy Rev. 2016, 53, 720–732. [Google Scholar] [CrossRef]
  10. Englberger, S.; Abo Gamra, K.; Tepe, B.; Schreiber, M.; Jossen, A.; Hesse, H. Electric Vehicle Multi-Use: Optimizing Multiple Value Streams Using Mobile Storage Systems in a Vehicle-to-Grid Context. Appl. Energy 2021, 304, 117862. [Google Scholar] [CrossRef]
  11. Shariff, S.M.; Iqbal, D.; Saad Alam, M.; Ahmad, F. A State of the Art Review of Electric Vehicle to Grid (V2G) Technology. IOP Conf. Ser. Mater. Sci. Eng. 2019, 561, 012103. [Google Scholar] [CrossRef]
  12. Clarke, A.D.; Makram, E.B. A Comprehensive Analysis of Plug in Hybrid Electric Vehicles to Commercial Campus (V2C). J. Power Energy Eng. 2015, 3, 24–36. [Google Scholar] [CrossRef]
  13. Bhoir, S.; Caliandro, P.; Brivio, C. Impact of V2G Service Provision on Battery Life. J. Energy Storage 2021, 44, 103178. [Google Scholar] [CrossRef]
  14. Van Kriekinge, G.; De Cauwer, C.; Van Mierlo, J.; Coosemans, T.; Messagie, M. Techno-Economical Assessment of Vehicle-to-Grid in a Microgrid: Case Study. In Proceedings of the 33nd Electric Vehicle Symposium (EVS33), Portland, OR, USA, 14–17 June 2020. [Google Scholar]
  15. Bibak, B.; Tekiner-Moğulkoç, H. A Comprehensive Analysis of Vehicle to Grid (V2G) Systems and Scholarly Literature on the Application of Such Systems. Renew. Energy Focus 2021, 36, 1–20. [Google Scholar] [CrossRef]
  16. Sovacool, B.K.; Kester, J.; Noel, L.; de Rubens, G.Z. Income, Political Affiliation, Urbanism and Geography in Stated Preferences for Electric Vehicles (EVs) and Vehicle-to-Grid (V2G) Technologies in Northern Europe. J. Transp. Geogr. 2019, 78, 214–229. [Google Scholar] [CrossRef]
  17. Mojumder, M.R.H.; Ahmed Antara, F.; Hasanuzzaman, M.; Alamri, B.; Alsharef, M. Electric Vehicle-to-Grid (V2G) Technologies: Impact on the Power Grid and Battery. Sustainability 2022, 14, 13856. [Google Scholar] [CrossRef]
  18. Zheng, Y.; Shao, Z.; Shang, Y.; Jian, L. Modeling the Temporal and Economic Feasibility of Electric Vehicles Providing Vehicle-to-Grid Services in the Electricity Market under Different Charging Scenarios. J. Energy Storage 2023, 68, 107579. [Google Scholar] [CrossRef]
  19. Hu, Z.; Su, R.; Zhang, K.; Xu, Z.; Ma, R. Resilient Event-Triggered Model Predictive Control for Adaptive Cruise Control under Sensor Attacks. IEEE/CAA J. Autom. Sin. 2023, 10, 807–809. [Google Scholar] [CrossRef]
  20. Zhou, Y.; Li, X. Vehicle to Grid Technology: A Review. In Proceedings of the 34th Chinese Control Conference, Hangzhou, China, 28–30 July 2015. [Google Scholar]
  21. Taranto Rodrigues, L.; Gillott, M.; Waldron, J.; Naylor, S.; Rodrigues, L.; Shipman, R. Towards an Electric Revolution: A Review on Vehicle-to-Grid, Smart Charging and User Behaviour. In Proceedings of the 18th International Conference on Sustainable Energy Technologies—SET 2019, Kuala Lumpur, Malaysia, 20–22 August 2019. [Google Scholar]
  22. Hussain, A.; Bui, V.H.; Kim, H.M. Microgrids as a Resilience Resource and Strategies Used by Microgrids for Enhancing Resilience. Appl Energy 2019, 240, 56–72. [Google Scholar] [CrossRef]
  23. Panteli, M.; Trakas, D.N.; Mancarella, P.; Hatziargyriou, N.D. Power Systems Resilience Assessment: Hardening and Smart Operational Enhancement Strategies. Proc. IEEE 2017, 105, 1202–1213. [Google Scholar] [CrossRef]
  24. Hussain, A.; Musilek, P. Resilience Enhancement Strategies For and Through Electric Vehicles. Sustain. Cities Soc. 2022, 80, 103788. [Google Scholar] [CrossRef]
  25. Wang, Y.; Rousis, A.O.; Strbac, G. On Microgrids and Resilience: A Comprehensive Review on Modeling and Operational Strategies. Renew. Sustain. Energy Rev. 2020, 134, 110313. [Google Scholar] [CrossRef]
  26. Castellucci, V.; Wallberg, A.; Flygare, C. Potential of Load Shifting in a Parking Garage with Electric Vehicle Chargers, Local Energy Production and Storage. World Electr. Veh. J. 2022, 13, 166. [Google Scholar] [CrossRef]
  27. Wallberg, A.; Flygare, C.; Waters, R.; Castellucci, V. Peak Shaving for Electric Vehicle Charging Infrastructure—A Case Study in a Parking Garage in Uppsala, Sweden. World Electr. Veh. J. 2022, 13, 152. [Google Scholar] [CrossRef]
  28. Flygare, C.; Wallberg, A.; Hjalmarsson, J.; Fjellstedt, C.; Aalhuizen, C.; Castellucci, V. The Potential Impact of a Mobility House on a Congested Distribution Grid—A Case Study in Uppsala, Sweden. In Proceedings of the CIRED Workshop on E-Mobility and Power Distribution Systems, Porto, Portugal, 2–3 June 2022. [Google Scholar]
  29. Debnath, U.K.; Ahmad, I.; Habibi, D. Gridable Vehicles and Second Life Batteries for Generation Side Asset Management in the Smart Grid. Int. J. Electr. Power Energy Syst. 2016, 82, 114–123. [Google Scholar] [CrossRef]
  30. Debnath, U.K.; Ahmad, I.; Habibi, D. Quantifying Economic Benefits of Second Life Batteries of Gridable Vehicles in the Smart Grid. Int. J. Electr. Power Energy Syst. 2014, 63, 577–587. [Google Scholar] [CrossRef]
  31. Xu, J.; Sun, C.; Ni, Y.; Lyu, C.; Wu, C.; Zhang, H.; Yang, Q.; Feng, F. Fast Identification of Micro-Health Parameters for Retired Batteries Based on a Simplified P2D Model by Using Padé Approximation. Batteries 2023, 9, 64. [Google Scholar] [CrossRef]
  32. Sun, J.; Jiang, T.; Yang, G.; Tang, Y.; Chen, S.; Qiu, S.; Song, K. A Novel Charging and Active Balancing System Based on Wireless Power Transfer for Lithium-Ion Battery Pack. J. Energy Storage 2022, 55, 105741. [Google Scholar] [CrossRef]
  33. Wang, J.; Liu, P.; Hicks-Garner, J.; Sherman, E.; Soukiazian, S.; Verbrugge, M.; Tataria, H.; Musser, J.; Finamore, P. Cycle-Life Model for Graphite-LiFePO4 Cells. J. Power Sources 2011, 196, 3942–3948. [Google Scholar] [CrossRef]
  34. Nord Pool. Available online: https://www.nordpoolgroup.com/ (accessed on 4 April 2024).
  35. Dong, S.; Li, H.; Wallin, F.; Avelin, A.; Zhang, Q.; Yu, Z. Volatility of Electricity Price in Denmark and Sweden. In Proceedings of the Energy Procedia; Elsevier Ltd.: Amsterdam, The Netherlands, 2019; Volume 158, pp. 4331–4337. [Google Scholar]
Figure 1. Parts of the model in MATLAB/Simulink, with several EVs, modeled as battery systems, connected to the three-phase grid. The different arrows show interconnection between the different parts of the figure and the dots represent several vehicles.
Wevj 15 00153 g001
Figure 2. A sketch of a logic diagram of the reference to EV2G, providing an overview of the model for both charging and discharging.
Wevj 15 00153 g002
Figure 3. The electricity price estimated for a day in Swedish krona per kWh (SEK/kWh).
Wevj 15 00153 g003
Figure 4. Three different user profiles of the EV owner, visualizing if the EV is parked or away. Signal 1 indicates that the car is at the charging station, whereas signal 0 means that it is not there.
Wevj 15 00153 g004
Figure 5. The state-of-charge value (%) over one day (hour) related to EV2G.
Wevj 15 00153 g005
Figure 6. The state-of-charge value (%) over one day (hour) related to EV.
Wevj 15 00153 g006
Figure 7. The price (SEK) in (a) and power (kW) to or from the grid in (b) to cover the charging and discharging of the 10 EVs over one day (hour).
Wevj 15 00153 g007
Table 1. Overview of the functionality of the proposed V2G model.
FunctionFunctionality
Function 1
  • Presents the initial parameters for the EVs, e.g., initial SOC, SOC limits, charging and discharging power, and electricity price set-point;
  • Evaluates current estimated electricity price to decide if the value is above or below the electricity price set-point.
Function 2
  • Identifies if the EV is parked and connected to a charger or if the EV is being driven, with a limitation in time.
Function 3
  • Summarizing the results from Functions 1 and 2 in order to set a power reference for the battery.
Function 4
  • Identifies the current SOC value and evaluates this based on SOC limits;
  • Determines whether the EV should be charged or discharged.
Function 5
  • A new SOC value is calculated.
Disclaimer/Publisher’s Note: The statements, opinions and data contained in all publications are solely those of the individual author(s) and contributor(s) and not of MDPI and/or the editor(s). MDPI and/or the editor(s) disclaim responsibility for any injury to people or property resulting from any ideas, methods, instructions or products referred to in the content.

