Article

Power Signal Analysis for Early Fault Detection in Brushless DC Motor Drivers Based on the Hilbert–Huang Transform

by
David Marcos-Andrade
1,
Francisco Beltran-Carbajal
2,*,
Eduardo Esquivel-Cruz
1,
Ivan Rivas-Cambero
1,
Hossam A. Gabbar
3 and
Alexis Castelan-Perez
1
1
Departamento de Posgrado, Universidad Politécnica de Tulancingo, Tulancingo 43629, Mexico
2
Departamento de Energía, Unidad Azcapotzalco, Universidad Autónoma Metropolitana, Azcapotzalco, Mexico City 02200, Mexico
3
Faculty of Engineering and Applied Science, Ontario Tech University (UOIT), Oshawa, ON L1G 0C5, Canada
*
Author to whom correspondence should be addressed.
World Electr. Veh. J. 2024, 15(4), 159; https://doi.org/10.3390/wevj15040159
Submission received: 9 February 2024 / Revised: 28 March 2024 / Accepted: 5 April 2024 / Published: 10 April 2024
(This article belongs to the Special Issue Dynamic Control of Traction Motors for EVs)

Abstract

:
Brushless DC machines have demonstrated significant advantages in electrical engineering by eliminating commutators and brushes. Every year, these machines increase their presence in transportation applications. In this sense, early fault identification in these systems, specifically in the electronic speed controllers, is relevant for correct device operation. In this context, the techniques reported in the literature for fault identification based on the Hilbert–Huang transform have shown efficiency in electrical systems. This manuscript proposes a novel technique for early fault identification in electronic speed controllers based on the Hilbert–Huang transform algorithm. Initially, currents from the device are captured with non-invasive sensors in a time window during motor operation. Subsequently, the signals are processed to obtain pertinent information about amplitudes and frequencies using the Hilbert–Huang transform, focusing on fundamental components. Then, estimated parameters are evaluated by computing the error between signals. The existing electrical norms of a balanced system are used to identify a healthy or damaged driver. Through amplitude and frequency error analysis between three-phase signals, early faults caused by system imbalances such as current increasing, torque reduction, and speed reduction are detected. The proposed technique is implemented through data acquisition devices at different voltage conditions and then physical signals are evaluated offline through several simulations in the Matlab environment. The method’s robustness against signal variations is highlighted, as each intrinsic mode function serves as a component representation of the signal and instantaneous frequency computation provides resilience against these variations. Two study cases are conducted in different conditions to validate this technique. The experimental results demonstrate the effectiveness of the proposed method in identifying early faults in brushless DC motor drivers. This study provides data from each power line within the electronic speed controller to detect early faults and extend different approaches, contributing to addressing early failures in speed controllers while expanding beyond the conventional focus on motor failure analysis.

1. Introduction

Within modern power systems, fault identification and classification is an actual challenge where different tools such as the Hilbert–Huang transform can be used to develop techniques to find failures in complex AC systems [1]. These systems often integrate distributed networks, causing problems such as high impedance faults, variations in current, and others where the Hilbert–Huang transform’s main features for analyzing nonlinear and nonstationary data integrated with learning techniques entail developing better strategies to detect these issues [2]. This method has become popular for fault diagnosis, extending its use for mechanical systems concerning nonlinear dynamics [3]. Within this context, one strategy to identify faults in brushless DC motors includes measuring three-phase current signals and normalizing them using statistical tools such as the mean, variance, and energy-based index, which can be calculated to compute variations and make fault diagnoses. It can be implemented online due to its simplicity [4]. In the context of the Hilbert–Huang transform applications, vibration analysis for excited nonlinear vibrating systems can be addressed with this useful method for parameter identification [5]. Online methods for fault diagnosis and detection contribute to the efficient operation of electric motors by monitoring the operating condition of the electrical system. In [6], a method utilizing this transform is proposed for diagnosing faults in the stator structure under different load and speed conditions. Furthermore, ref. [7] suggests a variation using the Hilbert–Huang transform in combination with a convolutional neural network for autonomous fault detection in synchronous motors. Huang et al. [8] introduced the empirical mode decomposition (EMD) technique and its application in nonlinear and nonstationary data. The EMD is a method used to decompose a time series into components called intrinsic mode functions (IMF) that capture the nonlinear and nonstationary structures present in data. This technique is integrated with the Hilbert Spectrum to provide a more detailed representation of information in time series data, which can be valuable in various applications, including signal processing and environmental data analysis.
Due to the increased demand in production worldwide, electrical motors are subjected to complex operating conditions like overload, overheating, and other conditions, resulting in stator faults. A better way to understand different failures on brushless DC motor systems is to categorize them into critical areas, such as drivers, batteries, data-driven methods, and motor faults. This division allows information about their effects on systems like electric vehicles [9,10]. An innovative fault diagnosis system is presented in [11] to recognize different faults in brushless DC motors. The system employs a feature ranking and differential evolution approach for feature selection. Initial feature extraction involves the Hilbert–Huang transform applied to four Hall sensor signals. Ref. [12] presents a novel approach for early fault diagnosis in brushless DC motors. The method uses a fitness function in differential evolution to optimize feature selection based on the Hilbert–Huang transform from Hall sensors. Most brushless motor drives can present commutation errors due to the pulse width modulation (PWM) switching delay, which causes low-frequency current oscillations and power losses. New commutation strategies, like carrier-synchronized PWM, are being developed. This strategy can eliminate errors by switching the delay at high-speed motor rotation [13]. The increasing use of brushless DC motors has led to studies to improve their operational efficiency, focusing on enhancements in control signals. Most control devices introduce unwanted harmonics into the currents, decreasing generated machine torque. Additionally, rotor position detection remains a topic of study, with the incorporation of methods for detecting faults in motor position sensors, which is crucial to ensure optimal system operation [14,15,16,17].
DC motor replacement in automotive cooling systems positions brushless motors as an option to enhance the efficiency of the electrical system. The high efficiency of these machines allows for better utilization of the energy provided by the battery. Ref. [18] proposes a theoretical guide for designing and manufacturing automotive cooling fans based on brushless DC motors. Challenges related to fault detection and diagnosis in synchronous motor drivers have taken greater significance due to the increasing demand for these devices and regulatory requirements for user safety. Ref. [19] provides a detailed review of recent methods for fault analysis in drivers for this type of motor. Different techniques have been developed for parameter estimation in signals containing multiple harmonics. Algebraic estimation approaches offer the advantage of not relying on initial conditions. This method can be applied to different signals and be implemented in real-time. Furthermore, these techniques can be employed to analyze undesirable harmonics in electrical systems, aiding in diagnosing potential failures [20]. Moreover, artificial intelligence can improve these methods for high precision and adaptability under a neural networks approach [21]. The experimental platform used in this manuscript is described in [22]. Some approaches for fault detection are based on the fast Fourier transform (FFT) and wavelet transform to detect electrical and mechanical failures by analyzing the frequency spectrum through vibrations generated by induction motors [23,24]. In addition, these methods based on different tools for signal analysis are being integrated with artificial intelligence (AI) [25,26]. In the same way, electric machine drive systems have similar structures where fault diagnosis is highly required. Failures such as open-circuit faults are presented in any motor driver device where its detection plays an important role in keeping the correct motor operation [27].
When electrical motors are powered by electronic controllers and are used in transport applications, fault diagnosis in these devices is relevant for increasing safe operation. The proposed method presented in this research manuscript is based on current signals analysis. The first step involves obtaining electrical currents from the electronic speed controller (ESC) without knowing the previous device state. Then, the Hilbert–Huang transform is employed to estimate amplitudes and frequency parameters. The main advantage of using this algorithm is the adaptability over signal variations since the empirical mode decomposition allows for identifying each intrinsic mode function; instantaneous frequency enables the detection of any frequency change along the time in the signal. These changes are commonly presented in motor drivers since speed manipulation in the device results in amplitude and frequency changes. The next step is to calculate the percentage error between each signal parameter. According to international electrical standards, the imbalance for mid-tension and low-tension systems should be below 10 percent [28]. The error between signals is computed with amplitudes and frequencies from signals’ fundamental components. If the error exceeds the allowed percentage, early faults can be identified. Instantaneous frequency is employed to obtain data about the speed changes over time, meaning that signals can be obtained in any time window. This paper is organized as follows: Section 2 provides a detailed method description and a brief insight into the Hilbert–Huang transform algorithm employed to develop this technique. A simulated case is conducted to demonstrate the effectiveness of the proposed method. Section 3 provides a comprehensive overview of the experimental platform and the devices used in this study. Moreover, a detailed description of how to implement this methodology in any brushless DC motor speed control device is given. In Section 4 the obtained results are presented. This analysis aims to identify any deviations or abnormalities in the power lines that may impact the motor’s operational conditions through amplitude and frequency estimation using the Hilbert–Huang transform. Through extensive experimental tests in different operation conditions, parameters can be compared to establish the system where faults are present. Lastly, the conclusions are addressed in Section 5. This approach proves its simplicity and potential for extension to various electrical fault diagnoses. This innovative approach can detect early faults in electronic speed controllers used in brushless DC motors.

2. Early Fault Detection in Motors’ Electrical Systems Based on the Hilbert–Huang Transform

In the context of motor drivers, switch devices commonly present faults due to high-frequency operation, power stress, and other operation conditions. Open-circuit faults commonly occur for gate signal failure or wire disconnecting. The consequence of this fault is that the drive system loses balance and the motor’s rotor is subjected to an imbalanced force, resulting in bad behavior. Short-circuit faults often result from high voltage, overheating, or errors in gate signals; the power consumption increases while the complete system is damaged. In these situations, protection circuits in the device suffer central damage, often needing to be replaced [10]. In this sense, early fault identification techniques are crucial in reducing these issues.
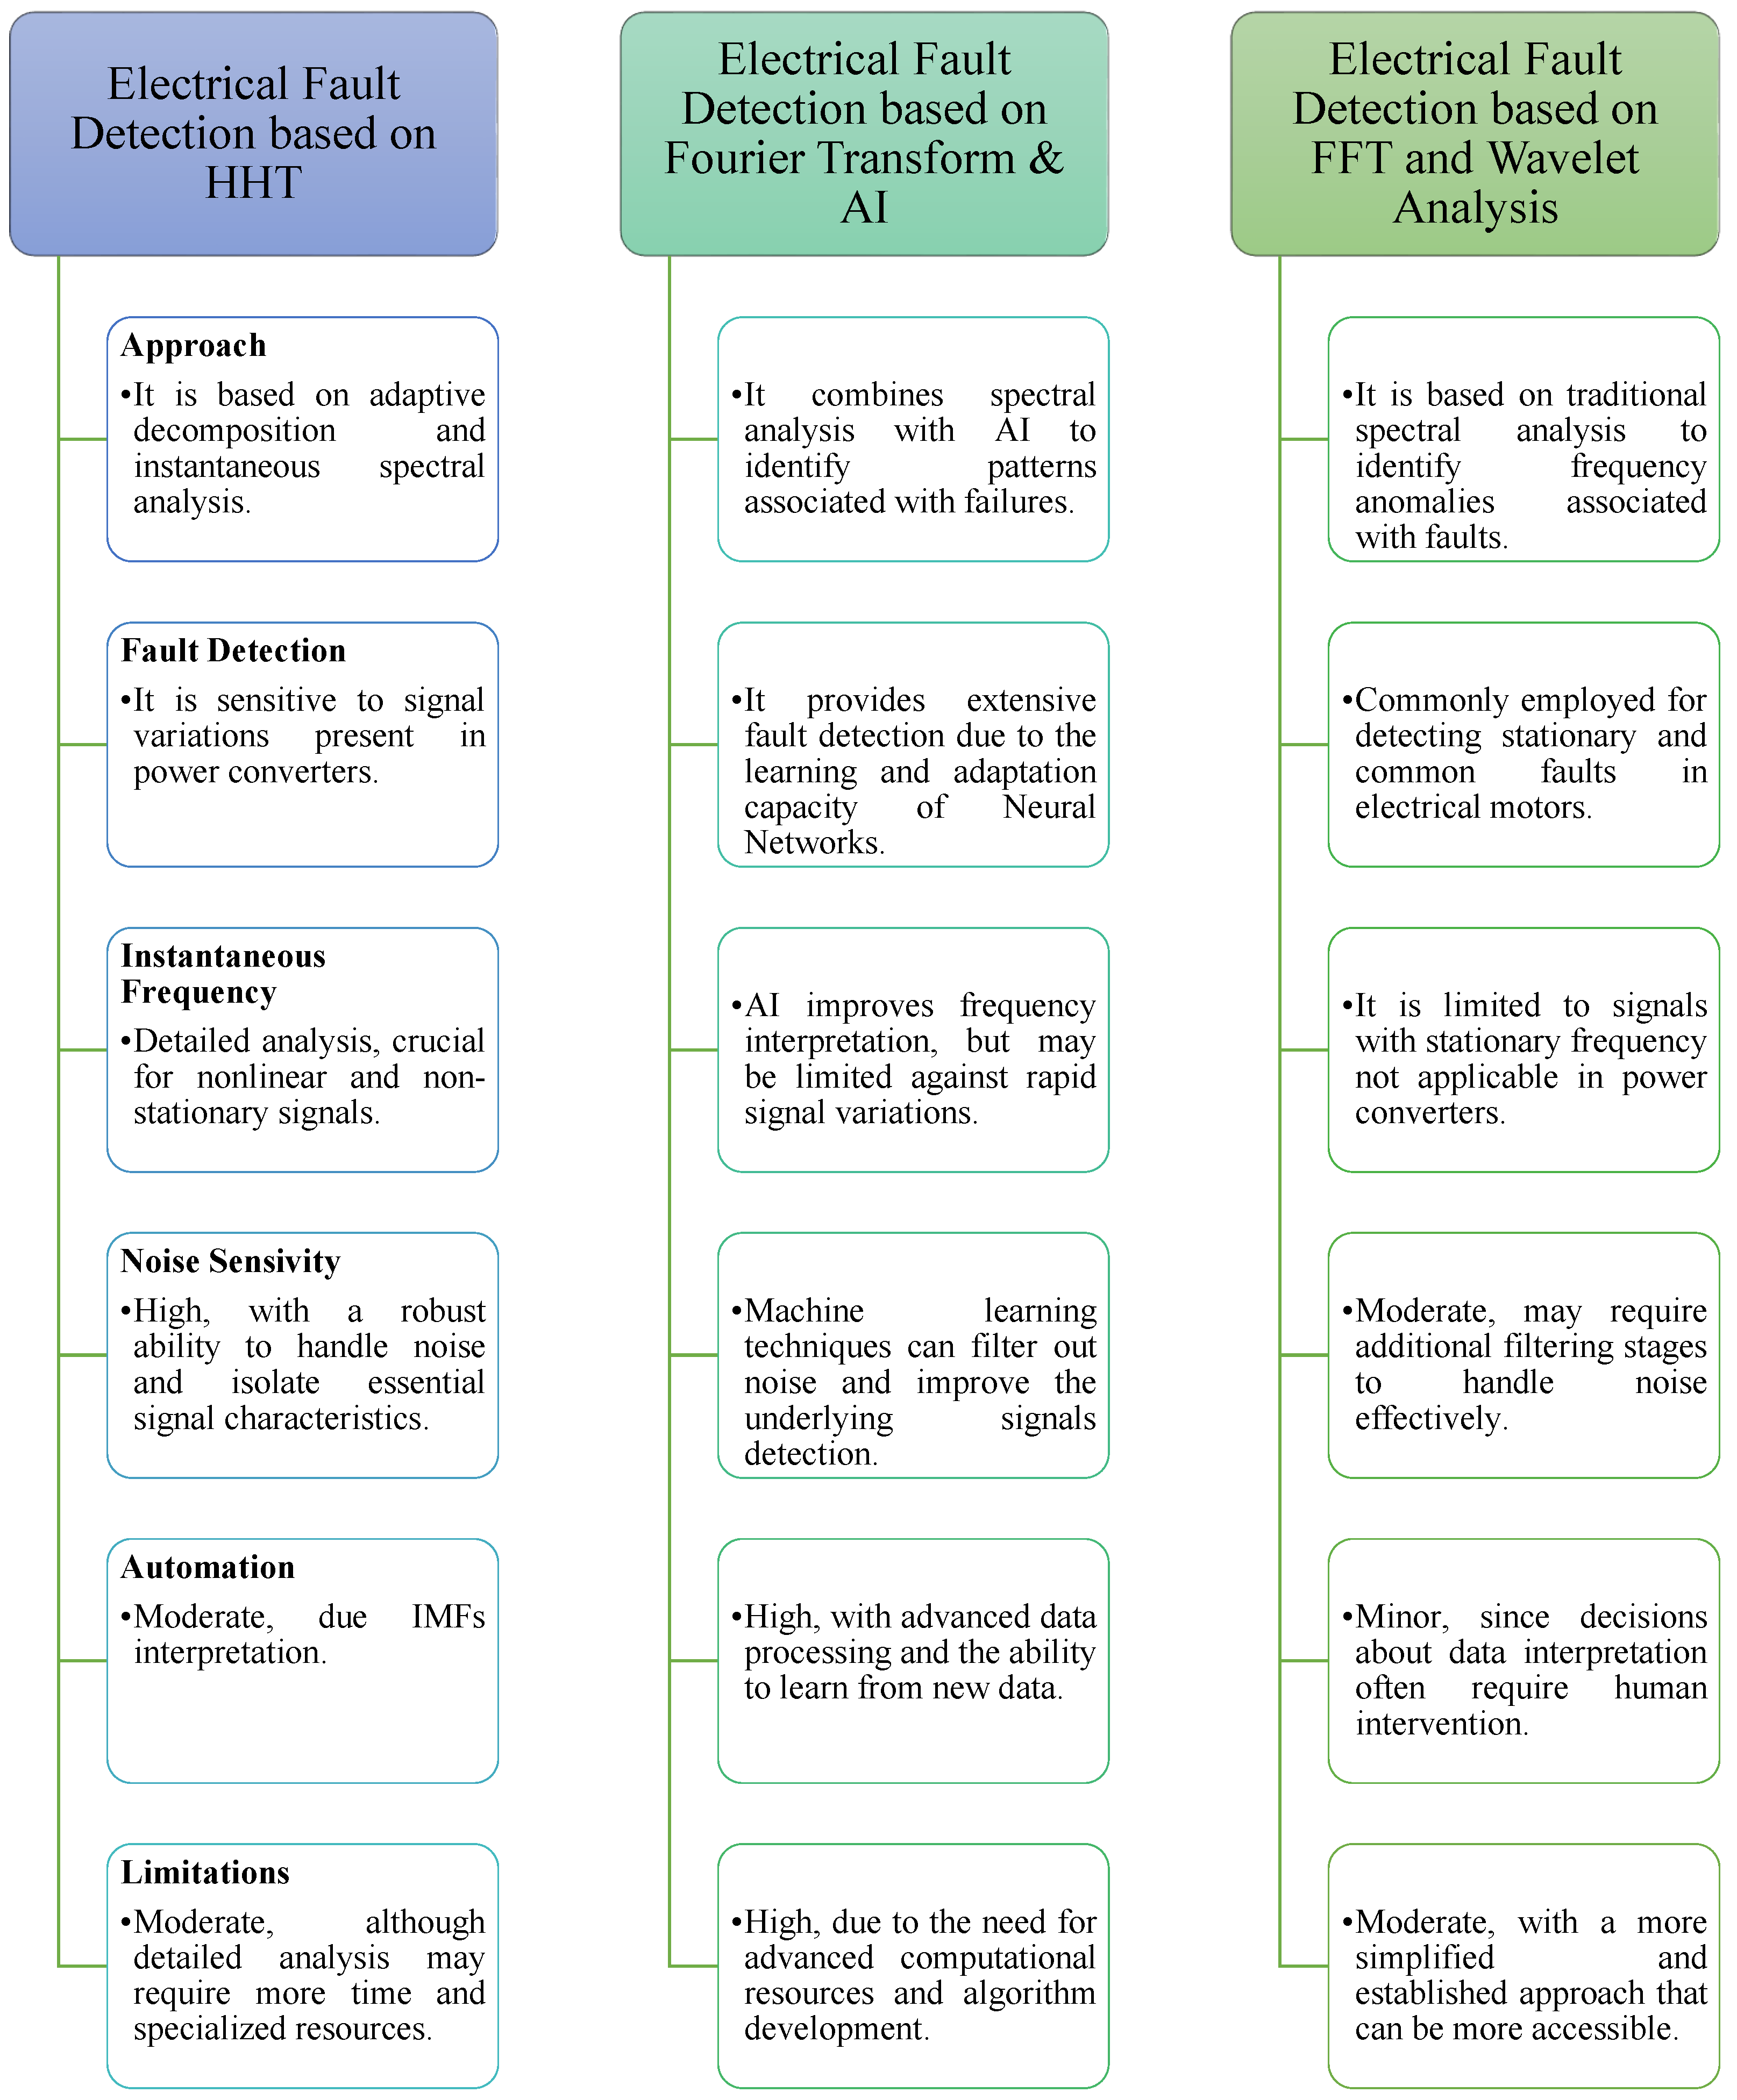
The challenges for solving these problems in motor drivers entail developing different approaches with various signal processing tools. Some approaches reported in the literature for detecting faults in electric motor systems use the Hilbert–Huang transform, the FFT, wavelet analysis, IA, and others. Commonly, vibration data are employed to detect mechanical faults [23], while electrical signals are analyzed to estimate specific parameters and detect faults in the motor and the driver [24,25,26,27]. In Figure 1, a comparison between different approaches for electrical fault identification is depicted.

2.1. The Hilbert–Huang Transform

The Hilbert–Huang transform is a method that combines two steps to analyze non-linear and non-stationary signals. The first step involves the EMD, which decomposes a signal, f ( t ) , into a set of intrinsic mode functions I M F i ( t ) . For a component to be considered as an IMF, it must satisfy two conditions: first, the difference between the number of extrema (maxima and minima) and the number of zero crossings must be zero or one. Second, the mean of the high and low envelopes, defined respectively by the local maxima and minima, must be a value less than the stopping criteria value and approaching zero at any point of the signal.The decomposition process begins with f ( t ) local extreme identification followed by envelope generation through local maximum and minimum interpolation. After extracting the envelope’s mean, the resulting signal is examined to determine if it meets the features to be an IMF. This process is repeated on the residual signal obtained until it does not satisfy the criteria to be considered an IMF or represents only a non-significant trend modulation. These IMFs represent different oscillation modes present in the original signal as follows:
f ( t ) = i = 1 n I M F i ( t ) + r ( t )
where r ( t ) is the residual trend. Once these oscillating modes are obtained, the Hilbert Transform is applied to each one to obtain each oscillation mode’s instantaneous envelope and phase. This procedure can be expressed as
A i ( t ) = I M F i ( t ) 2 + H [ I M F i ( t ) ] 2
Ψ i ( t ) = arctan H [ I M F i ( t ) ] I M F i ( t )
where A i ( t ) is the instantaneous amplitude and Ψ i ( t ) is the instantaneous phase. The instantaneous frequency Ω i ( t ) can be extracted from the instantaneous phase. The formula to determine this frequency is
Ω i ( t ) = d Ψ i ( t ) d t
although “instantaneous phase” and “instantaneous frequency” are often used indistinctly, it is important to mention the difference between them in this context. The instantaneous phase includes information about how this phase varies in time, while the instantaneous angle could be generally referred to as the instantaneous signal orientation in the complex plane. This distinction is fundamental when the instantaneous frequency is analyzed, which means that the point of interest is how the signal orientation (phase) changes over time. The instantaneous envelope provides information on how the amplitude and phase of each mode vary over time. The result is a time-frequency representation of the original signal, where each oscillation mode is represented by its instantaneous envelope and frequency [8].

2.2. Proposed Method

This article segment presents a simulated situation where the proposed method for early fault identification is applied to a complex signal obtained in the context of a balanced three-phase electrical system. Consider the balanced system described by Equations (5)–(7). This simulated system can be taken as a reference for ESC outputs. For simulation purposes, three harmonics are considered in each signal.
i a = k = 1 4 A k sin ( 2 π f k t )
i b = k = 1 4 A k sin ( 2 π f k t + φ 1 )
i c = k = 1 4 A k sin ( 2 π f k t + φ 2 )
where A k is the signal amplitude, f k is the frequency, t is the time, and φ is the phase. The amplitude values used for this simulation are A 1 = 0.5 , A 2 = 0.01 , A 3 = 0.05 , and A 4 = 0.005 and the frequencies values are chosen as f 1 = 10 Hz, f 2 = 100 Hz, f 3 = 200 Hz, and f 4 = 500 Hz. And for this specific case, phases values are established as φ 1 = 2 π 3 and φ 2 = 2 π 3 
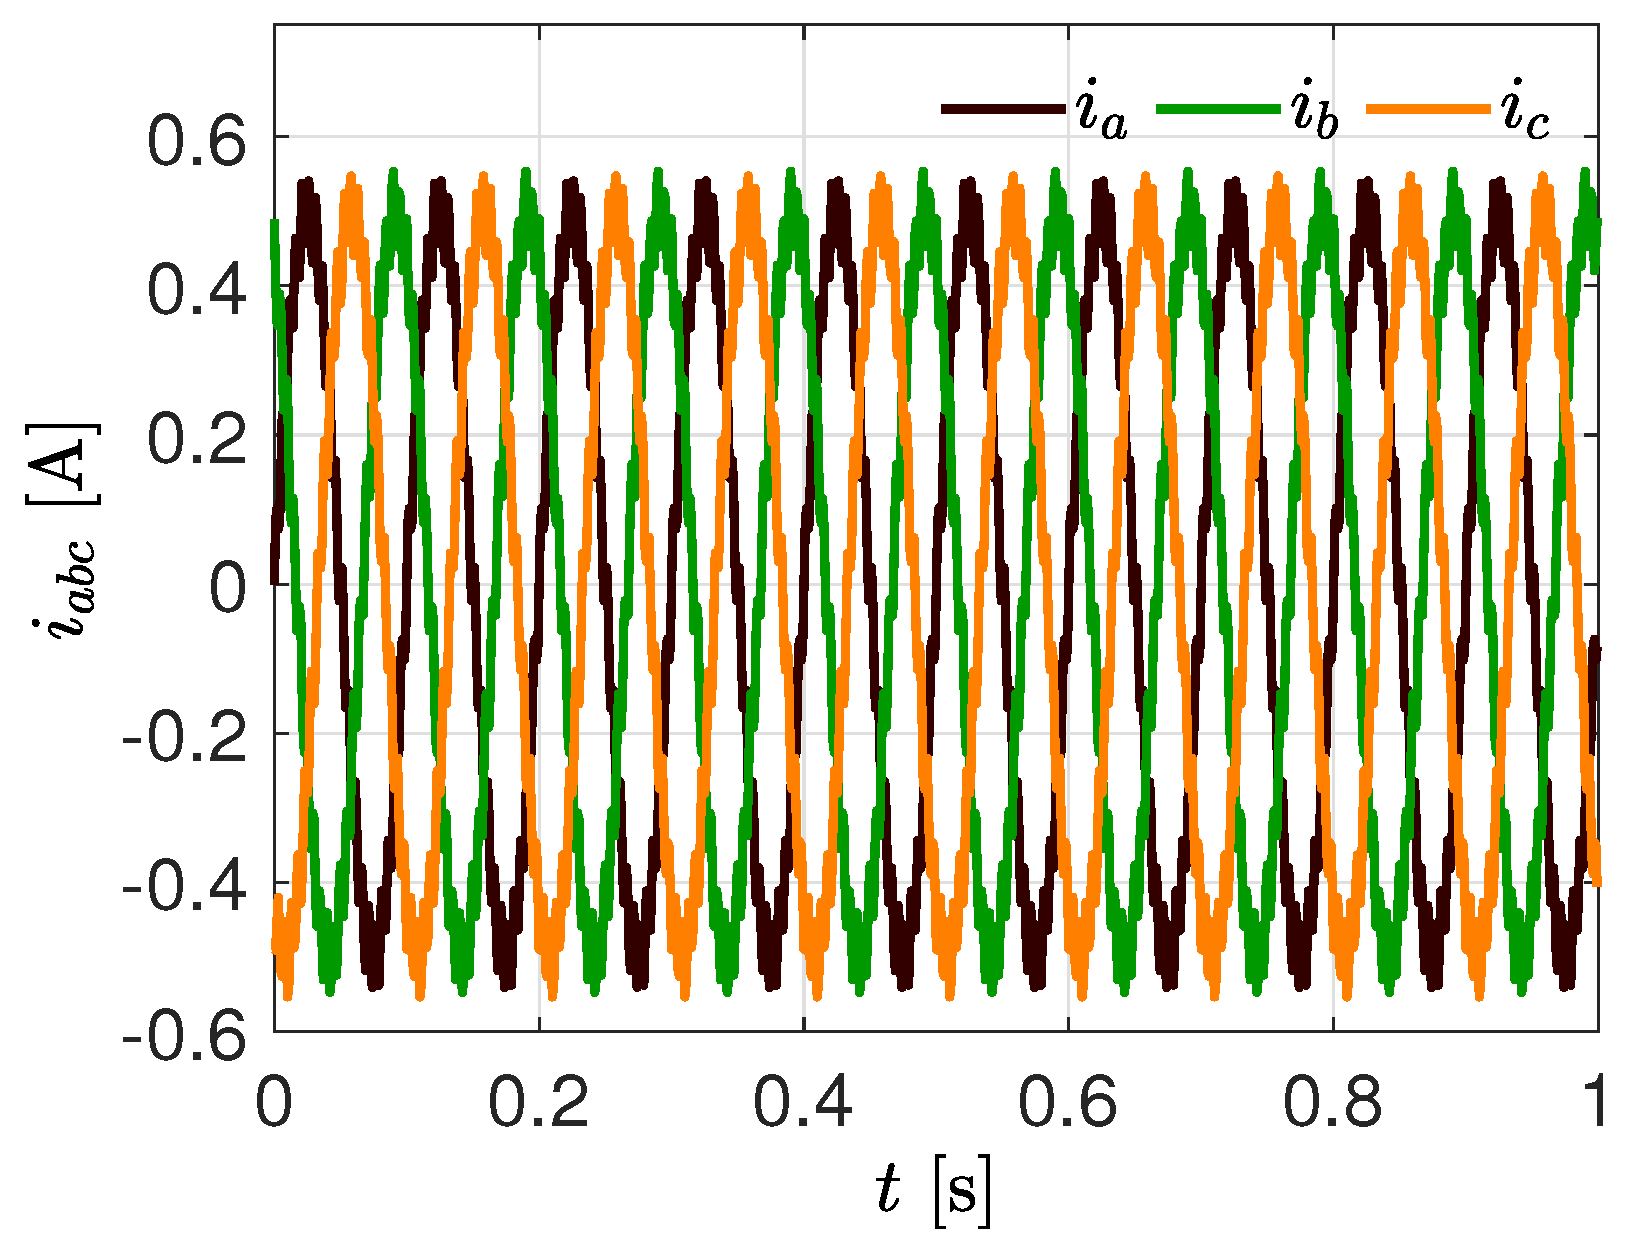
. From the initial signals i a , i b , and i c , representing a three-phase system shown in Figure 2, its oscillating modes will be extracted with the Hilbert–Huang transform. The algorithm developed for the EMD was improved by including stoppage criteria to obtain each signal component [5].
Once the estimated parameters have been obtained, percentage amplitudes and frequency errors are calculated to establish a healthy system. For different applications, a balance system is described as A i a = A i b = A i c [29,30]. However, real electrical systems do not present this property. Disturbances could occur in three-phase systems for the following reasons: asymmetry in load distribution per phase, connection of single-phase or two-phase loads, operation of single-phase protection devices or capacitor banks, and asymmetry in the arrangement of the phases in the load center facilities. Voltage and current imbalances affect the quality and reliability of the electrical supply. They produce overheating and undesirable vibration in the rotating electrical machinery, overheat the transformers and conductors, reduce the useful life of the electronic components, increase the losses due to the Joule effect in the system’s transmission and distribution, and affect the operation of protection systems. The current imbalance in three-phase systems is expressed as a percentage and is defined as
% I u n b = M a x ( | i a v i a | , | i a v i b | , | i a v i c | ) i a v 100
with
I a v = i a + i b + i c 3
where i a , i b , and i c 
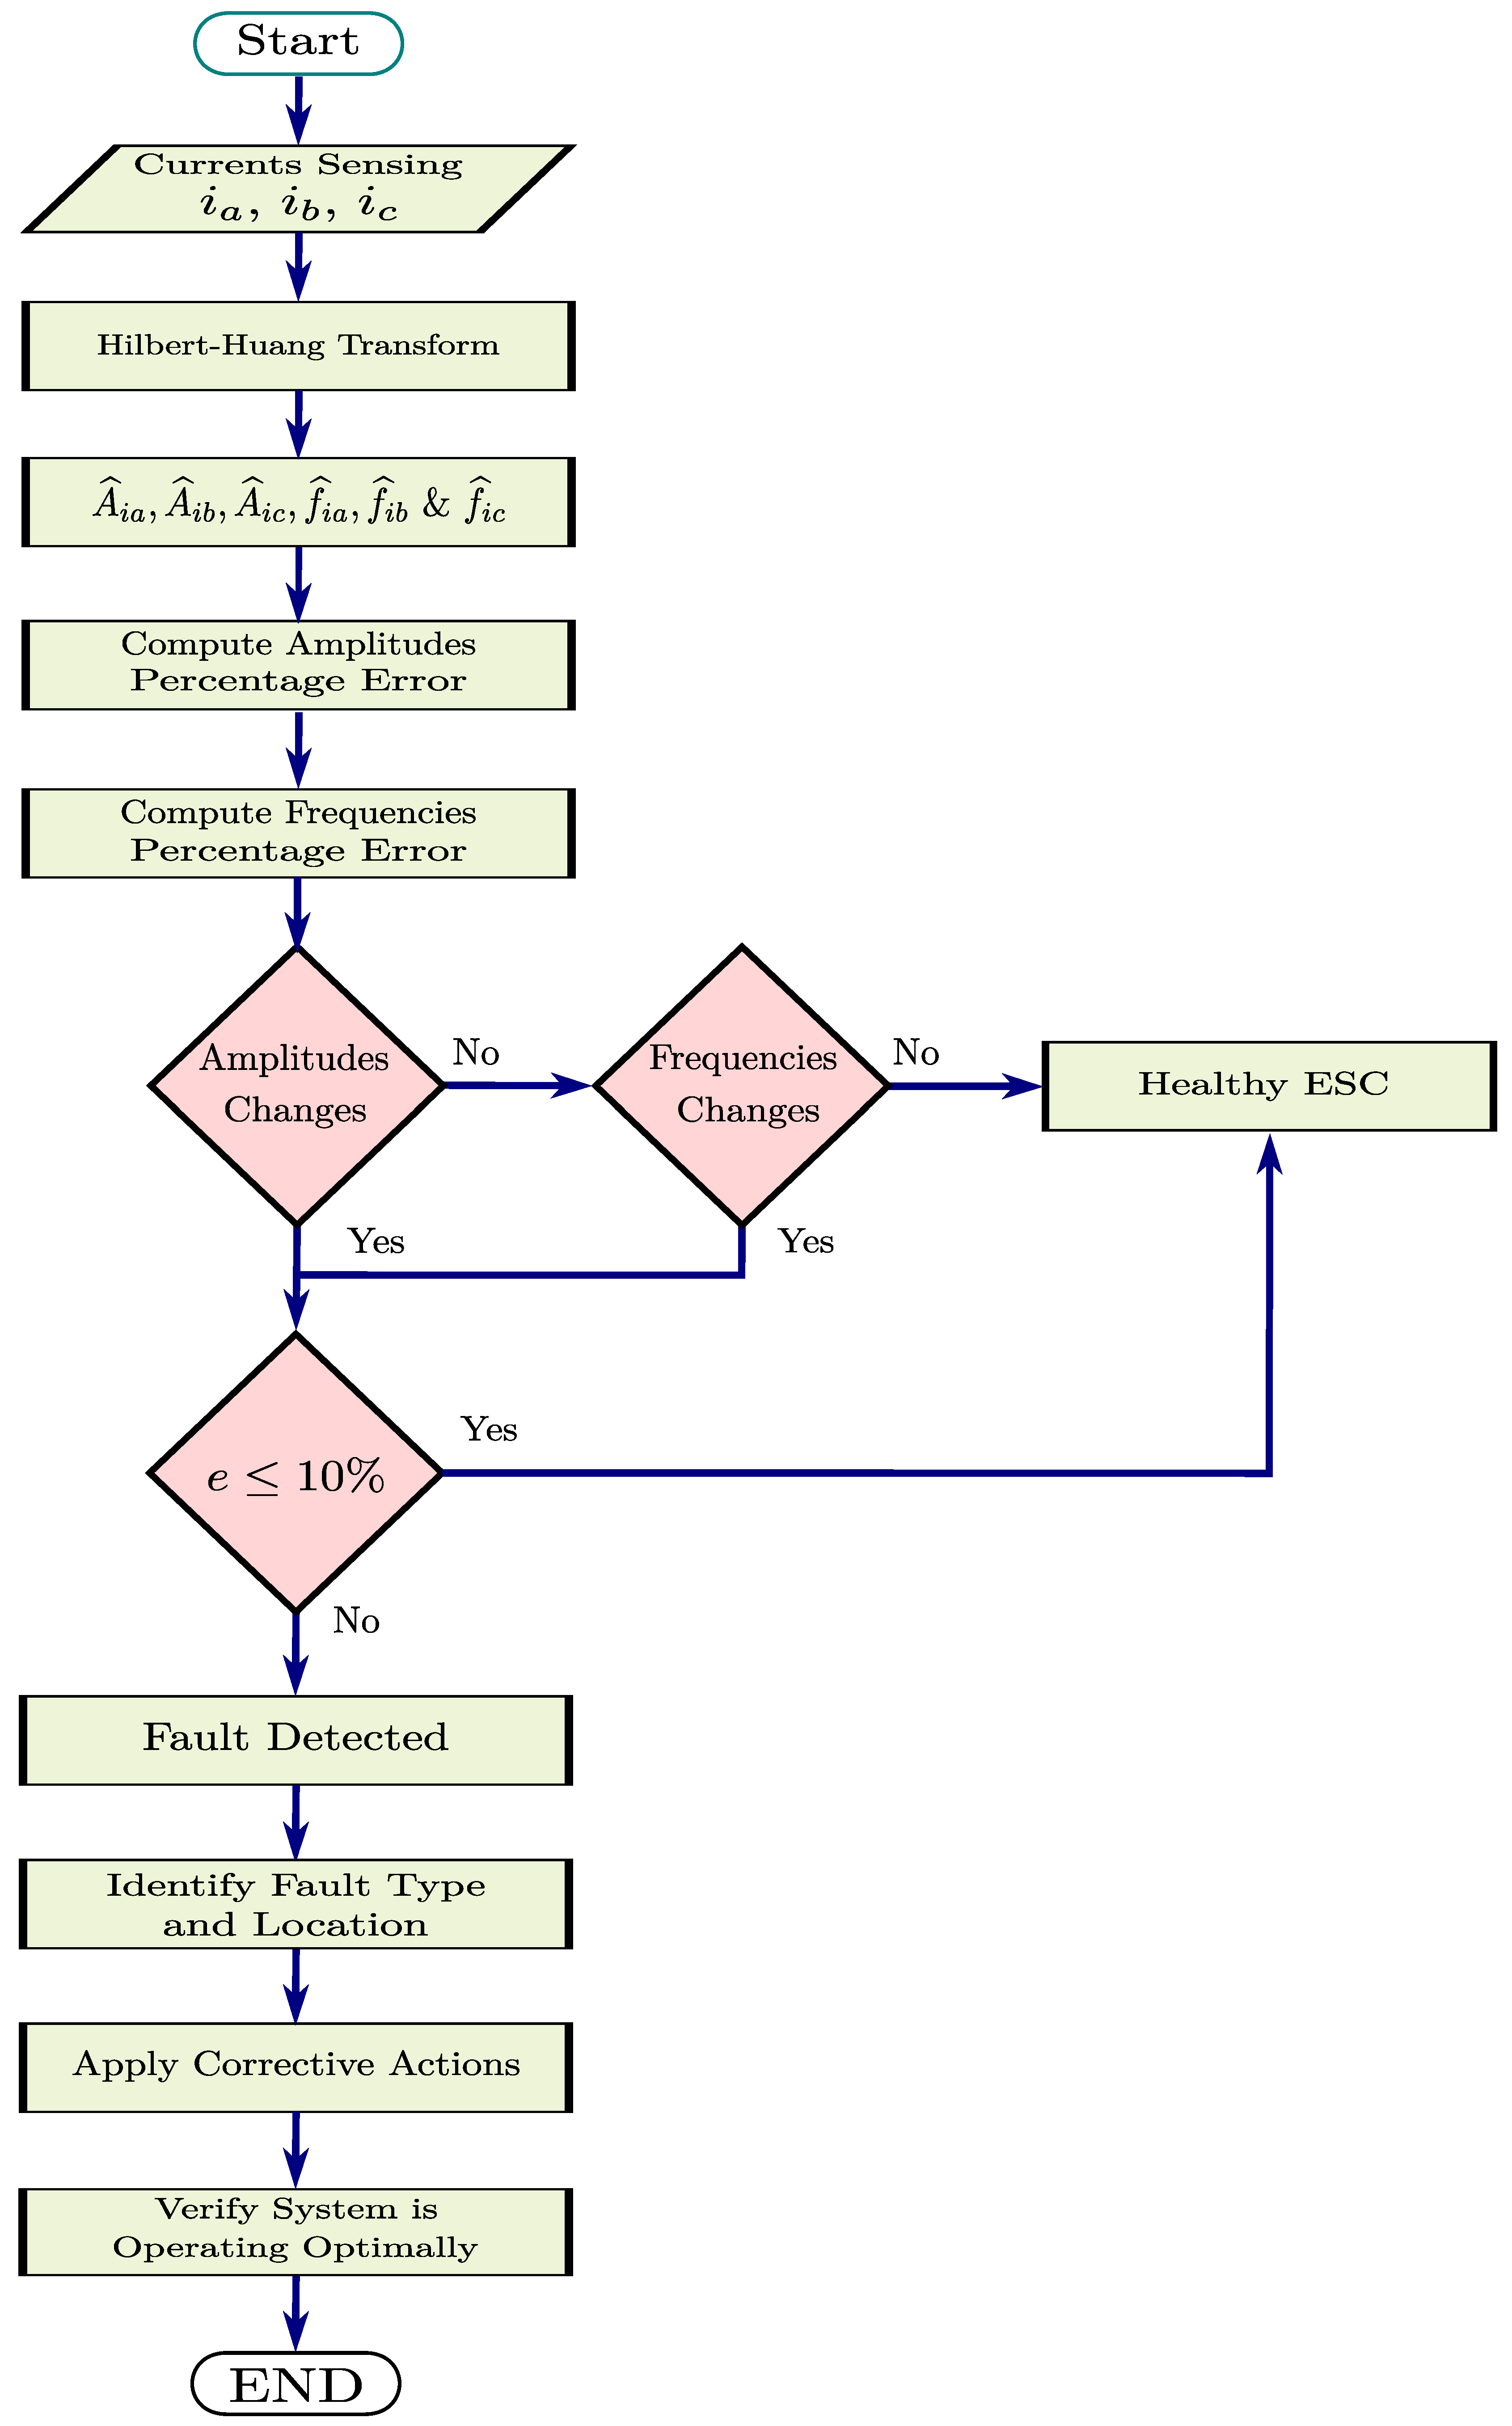
are the RMS magnitude of each phase. These indicators are based on international standards such as IEEE-519-2014 where for high tension imbalance should be below 2% for mid-tension and below 10% [28] for low-tension. The threshold can be selected below 10 % for low tension in this context. Any current anomaly allows for the fault location in the specific power line as each signal error is compared. Once the fault is located, maintenance actions must be carried out. This procedure is shown in the following diagram in Figure 3.
As previously mentioned, power transistors present most electrical faults in motor drivers; a short-circuit fault means the switch is always closed and replacement of this component is often the fault solution. Open-circuit faults are a common problem in general electrical motor drivers; errors in switching signals or gate drivers entail failures in transistors. Thus, the electrical system affects the motor’s operation [27]. Moreover, the signal variations occur in the ESC outputs when a different speed is required due to the gate manipulation inputs; the signal parameters changes at these instants can be addressed by the Hilbert–Huang transform. Then, once the errors have been calculated, an early fault is identified, taking Table 1 as reference, different issues can be described. By taking the threshold for fault identification, each line error allows for finding the specific line where the issue is happening. The faults can be classified within the short-circuit and open-circuit contexts. By evaluating these differences, the failures can be classified; an error in the amplitude can cause undesirable behavior in the motor, such as a reduction in torque and an increase in current demand, indicating a possible short-circuit fault. Moreover, although the driver changes frequency due to speed motor manipulation, the balance between them should be the same for the three signals. However, after amplitude anomalies have been detected, a frequency diminution will manifest in motor speed reduction.

2.3. Simulated Case Study Analysis

The main objective of this analysis is to obtain relevant and detailed information about the signal and its fundamental characteristics. The previously described process is applied, which involves decomposing the signal into three distinct oscillatory functions. This decomposition uses the Hilbert–Huang transform, known for its high precision in representing complex and nonlinear signals.
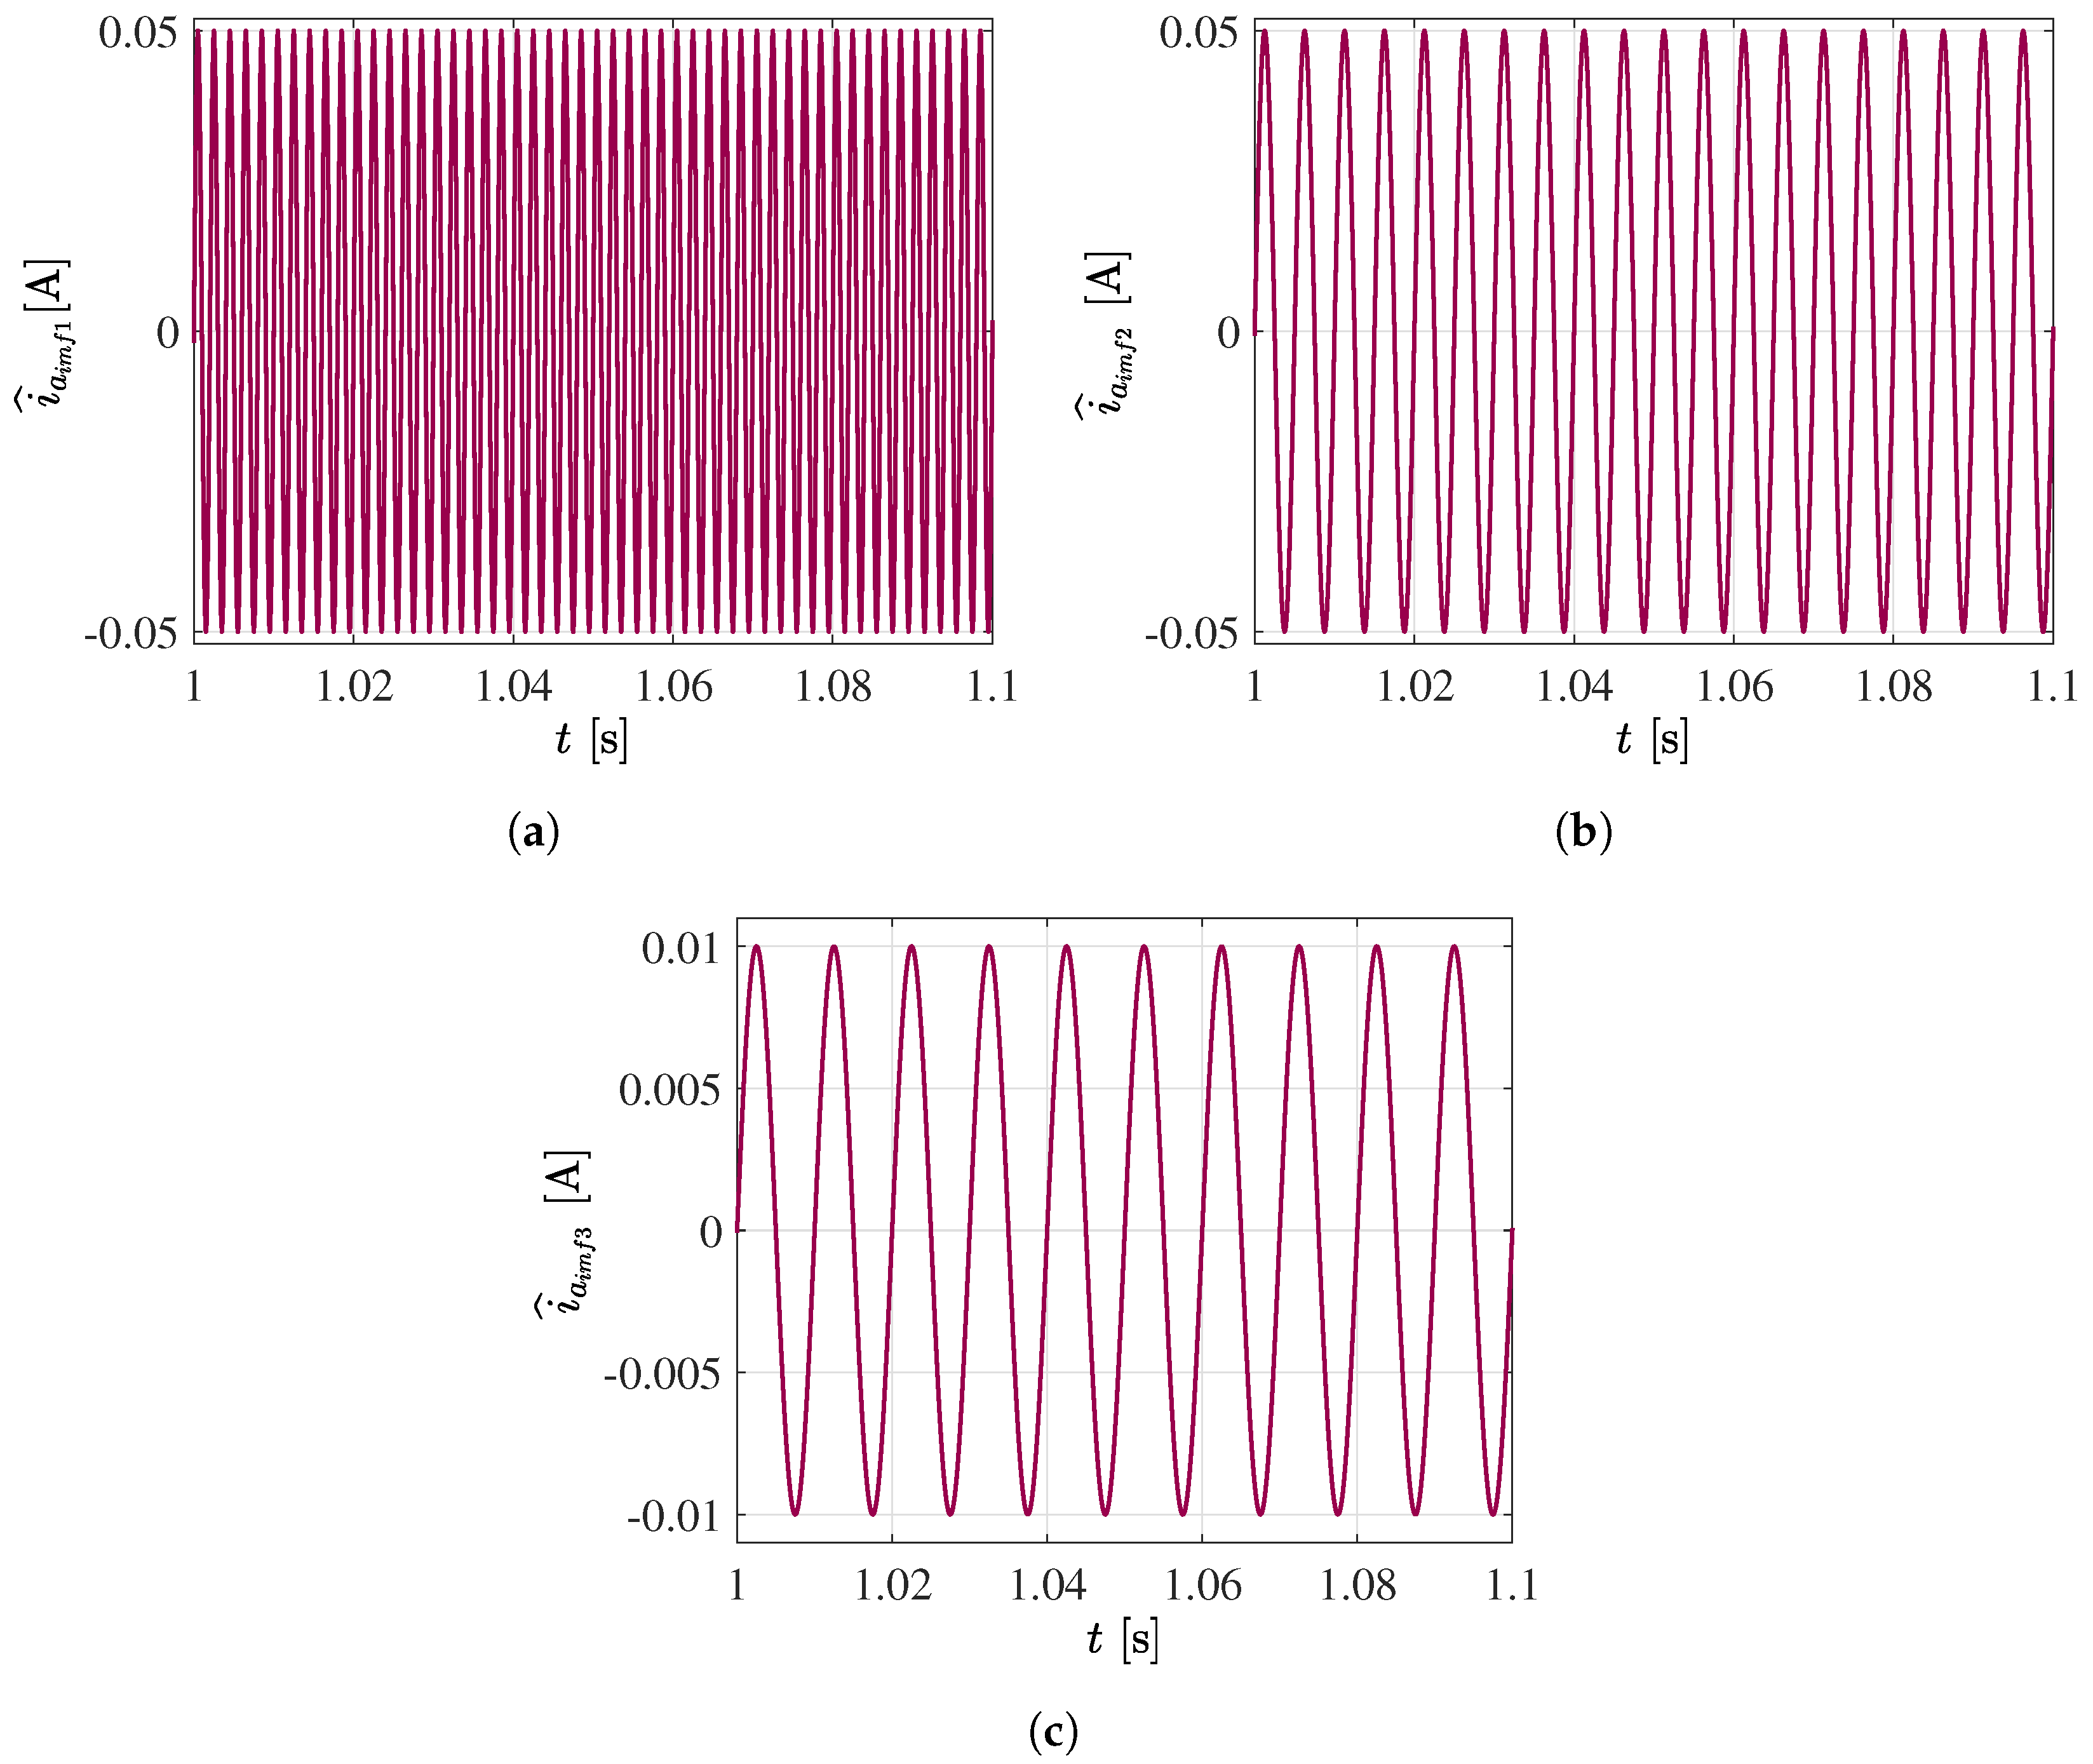
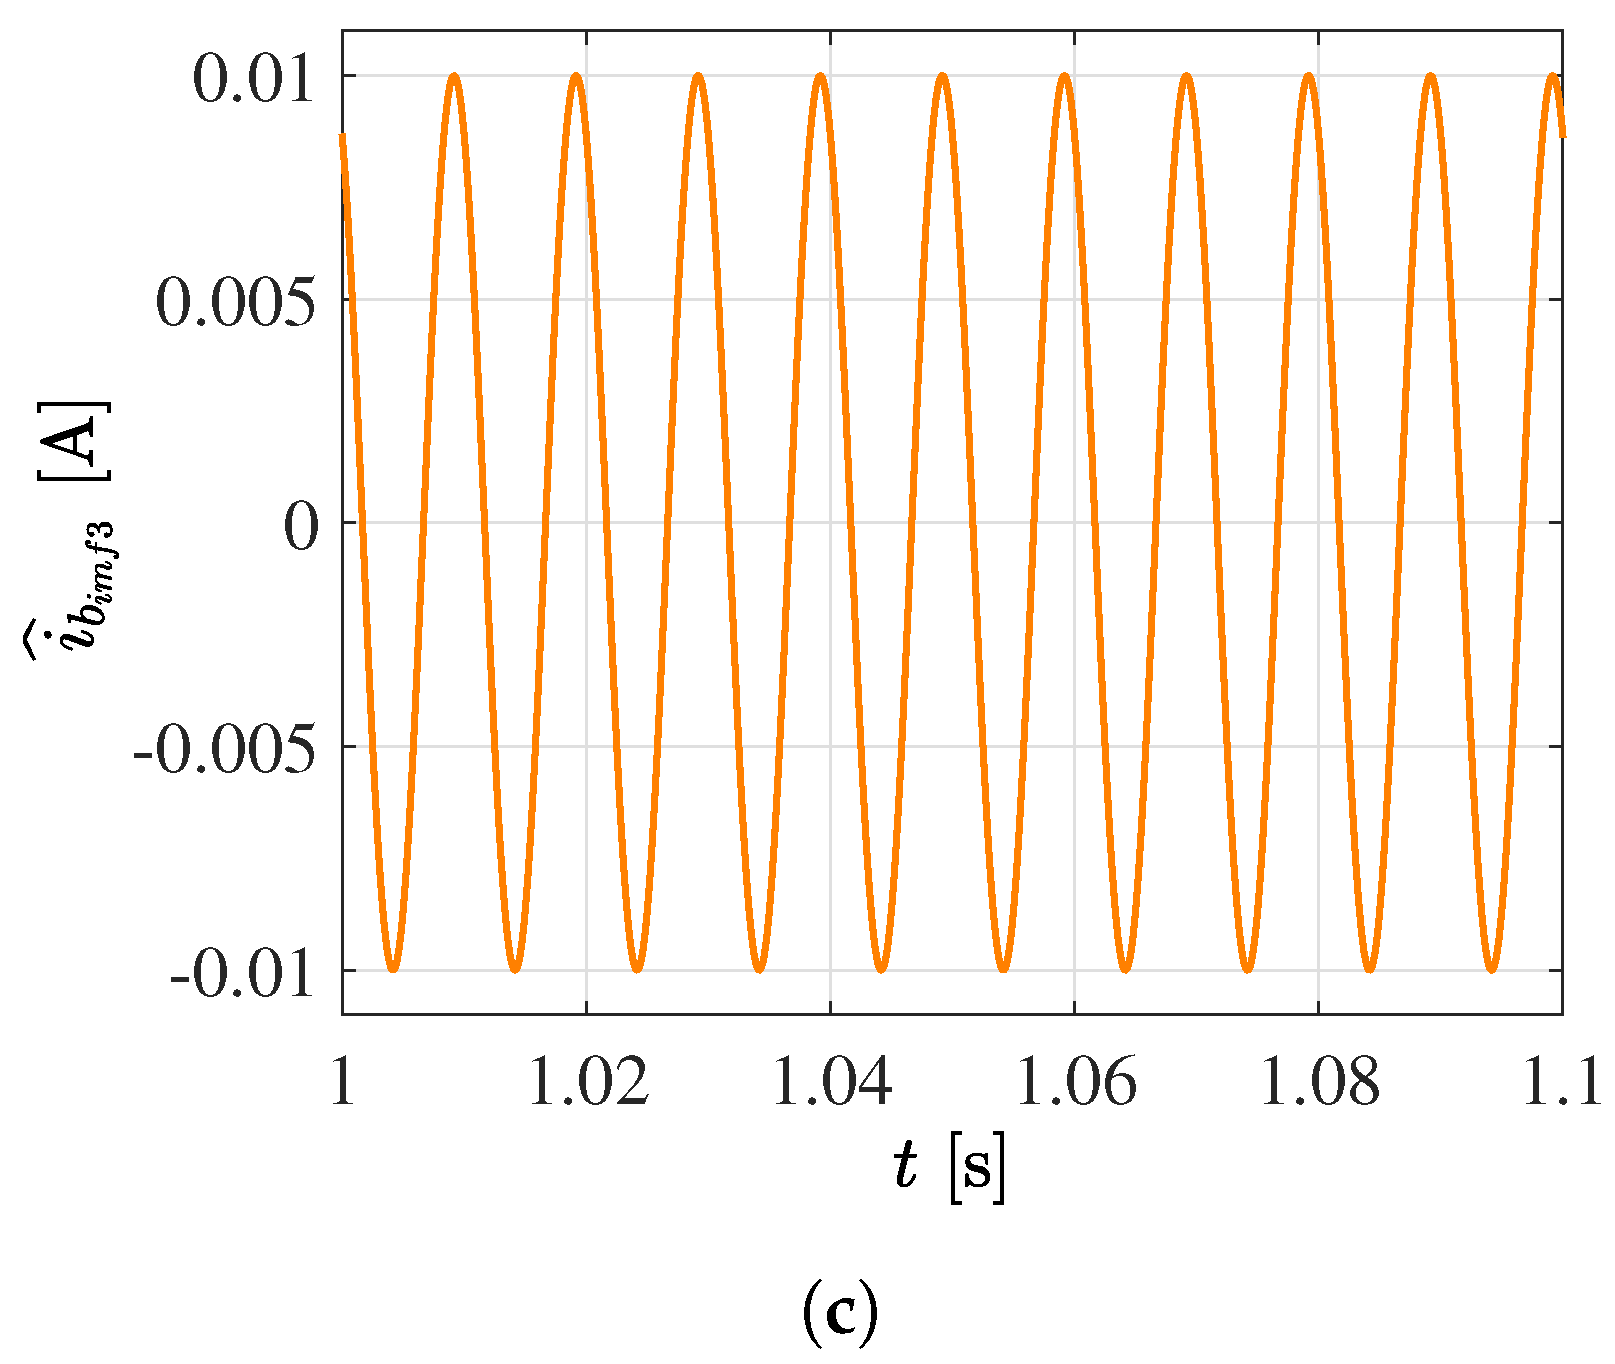
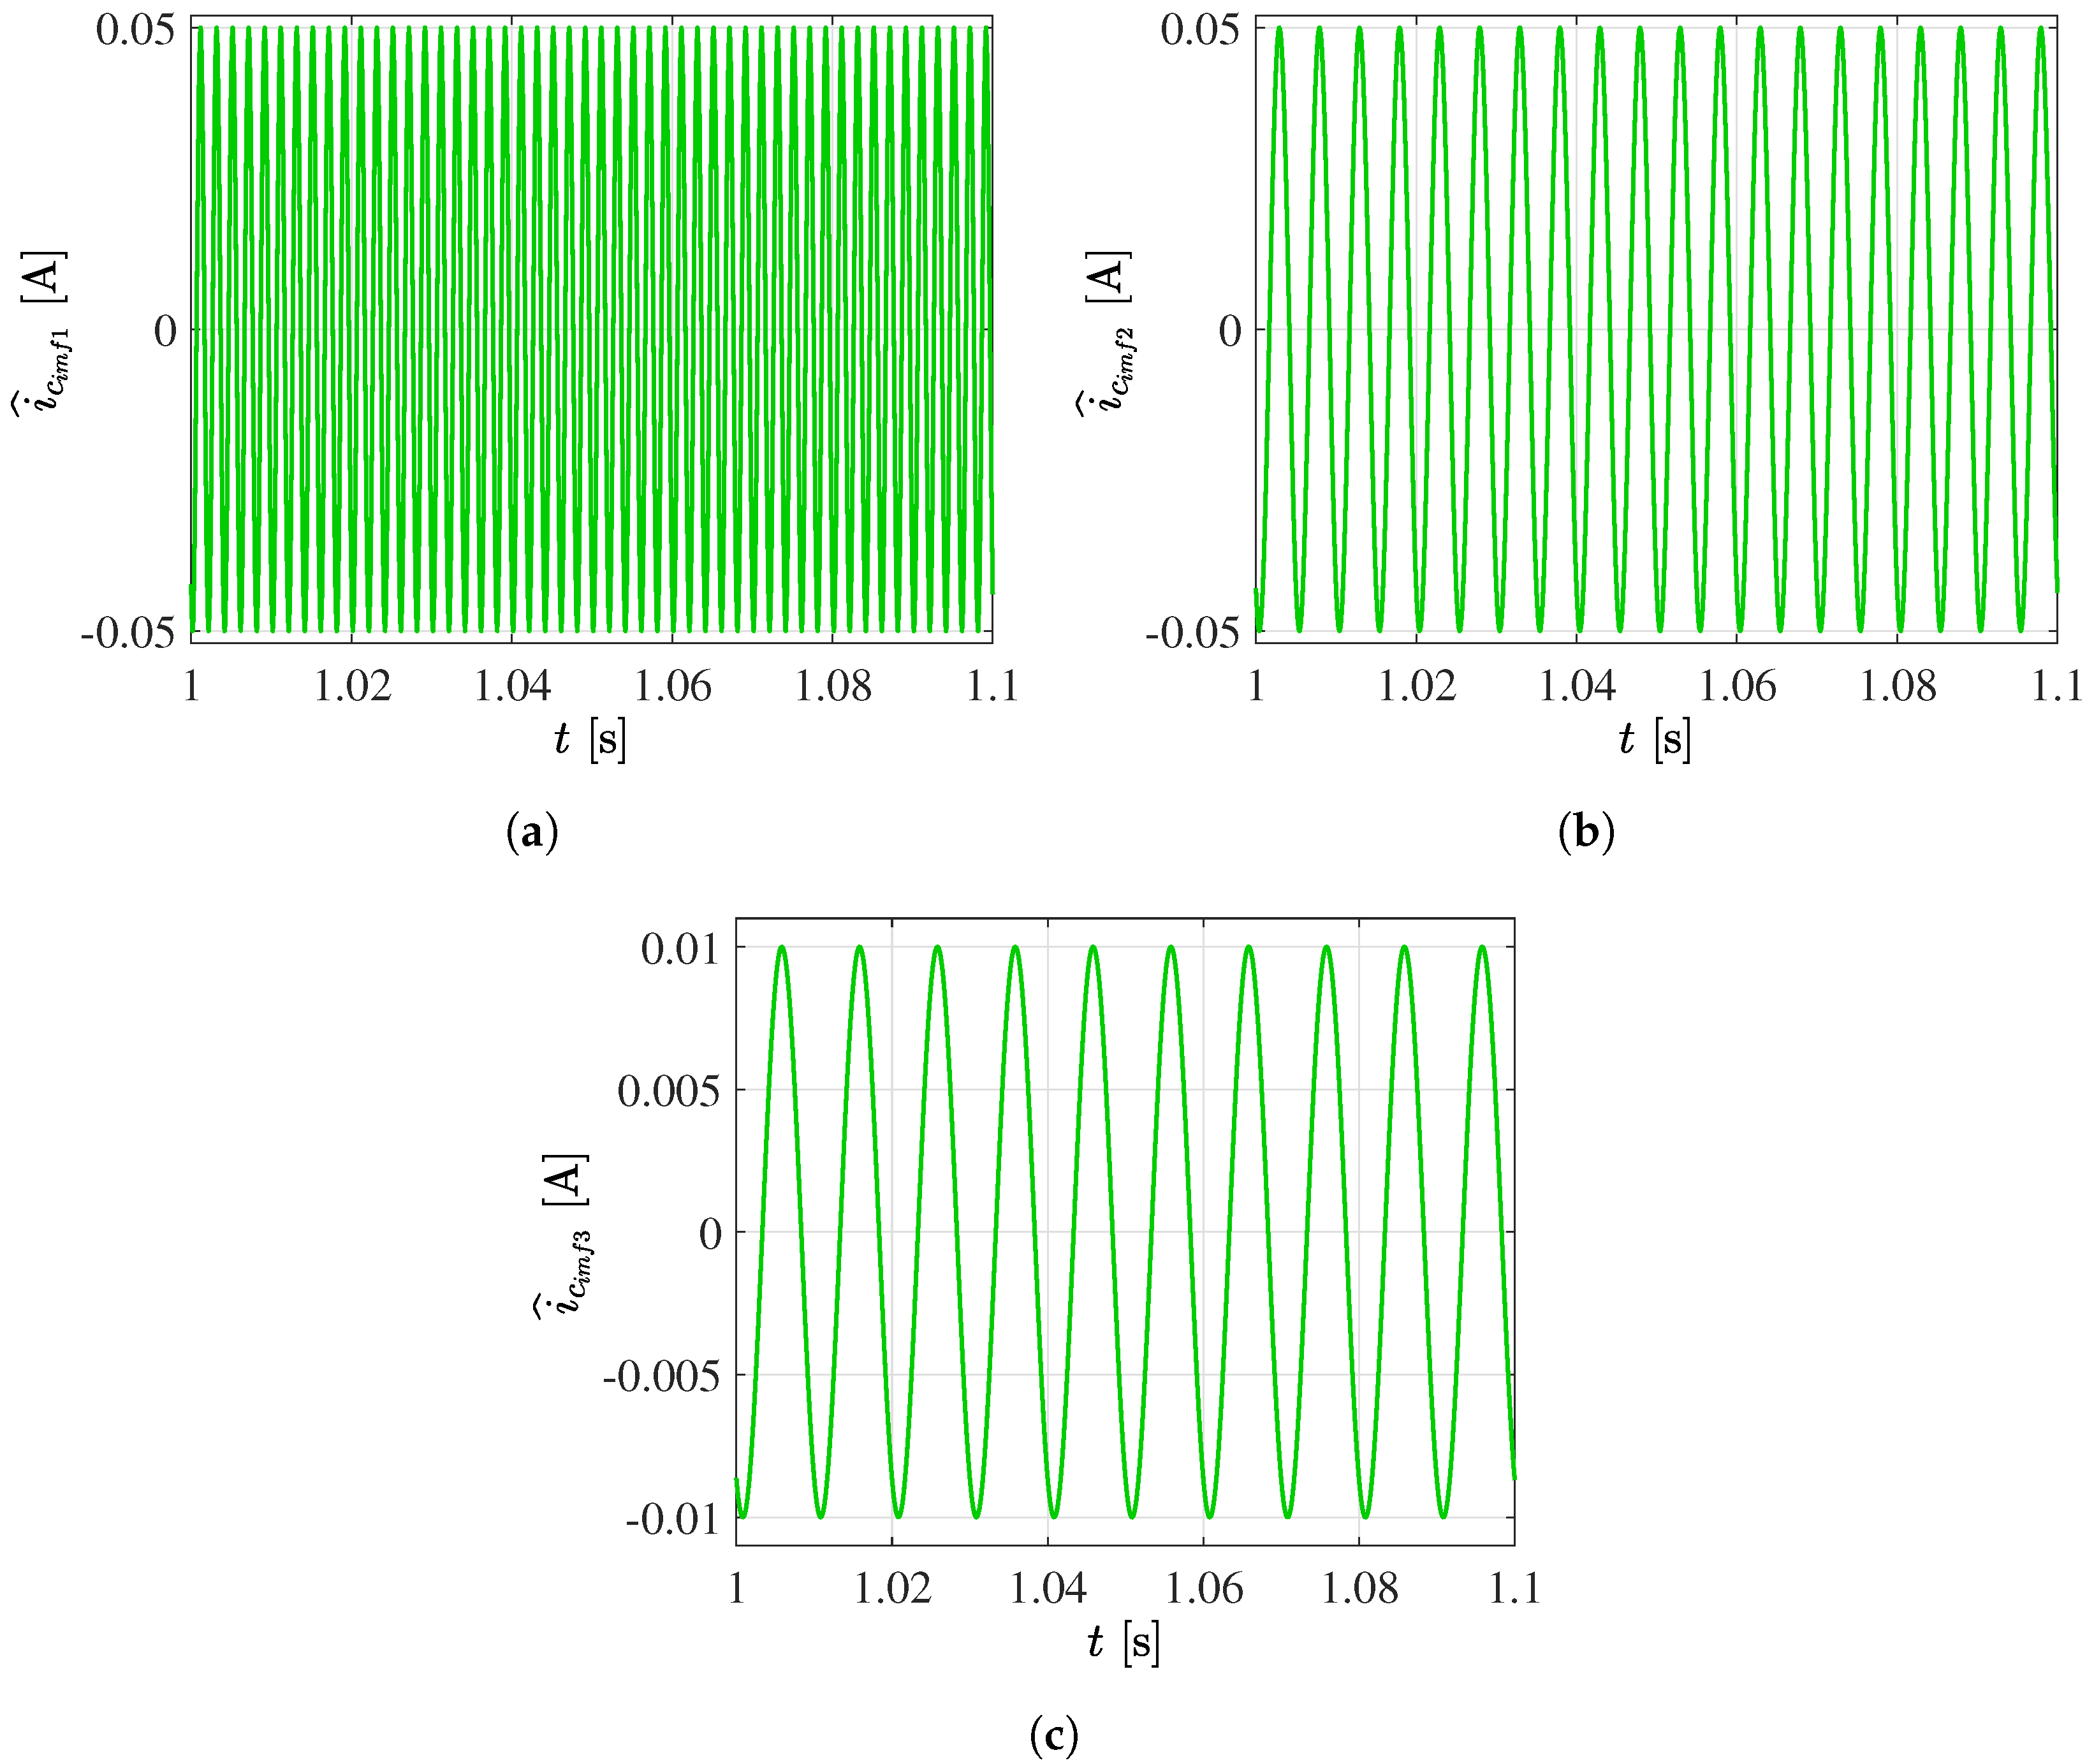
 Figure 4, Figure 5 and Figure 6 illustrate how the Hilbert–Huang transform decomposes the original high-frequency signal into its oscillatory components. Each component represents an oscillation or mode present in the original signal. This capability to separate the signal into its fundamental components is essential for the detailed analysis of complex signals in various fields. An important point to emphasize is the Hilbert–Huang transform’s high precision in estimating these oscillatory components. This affirmation is evident in this approach to signal decomposition and analysis provides valuable insights into the nature of the signal.
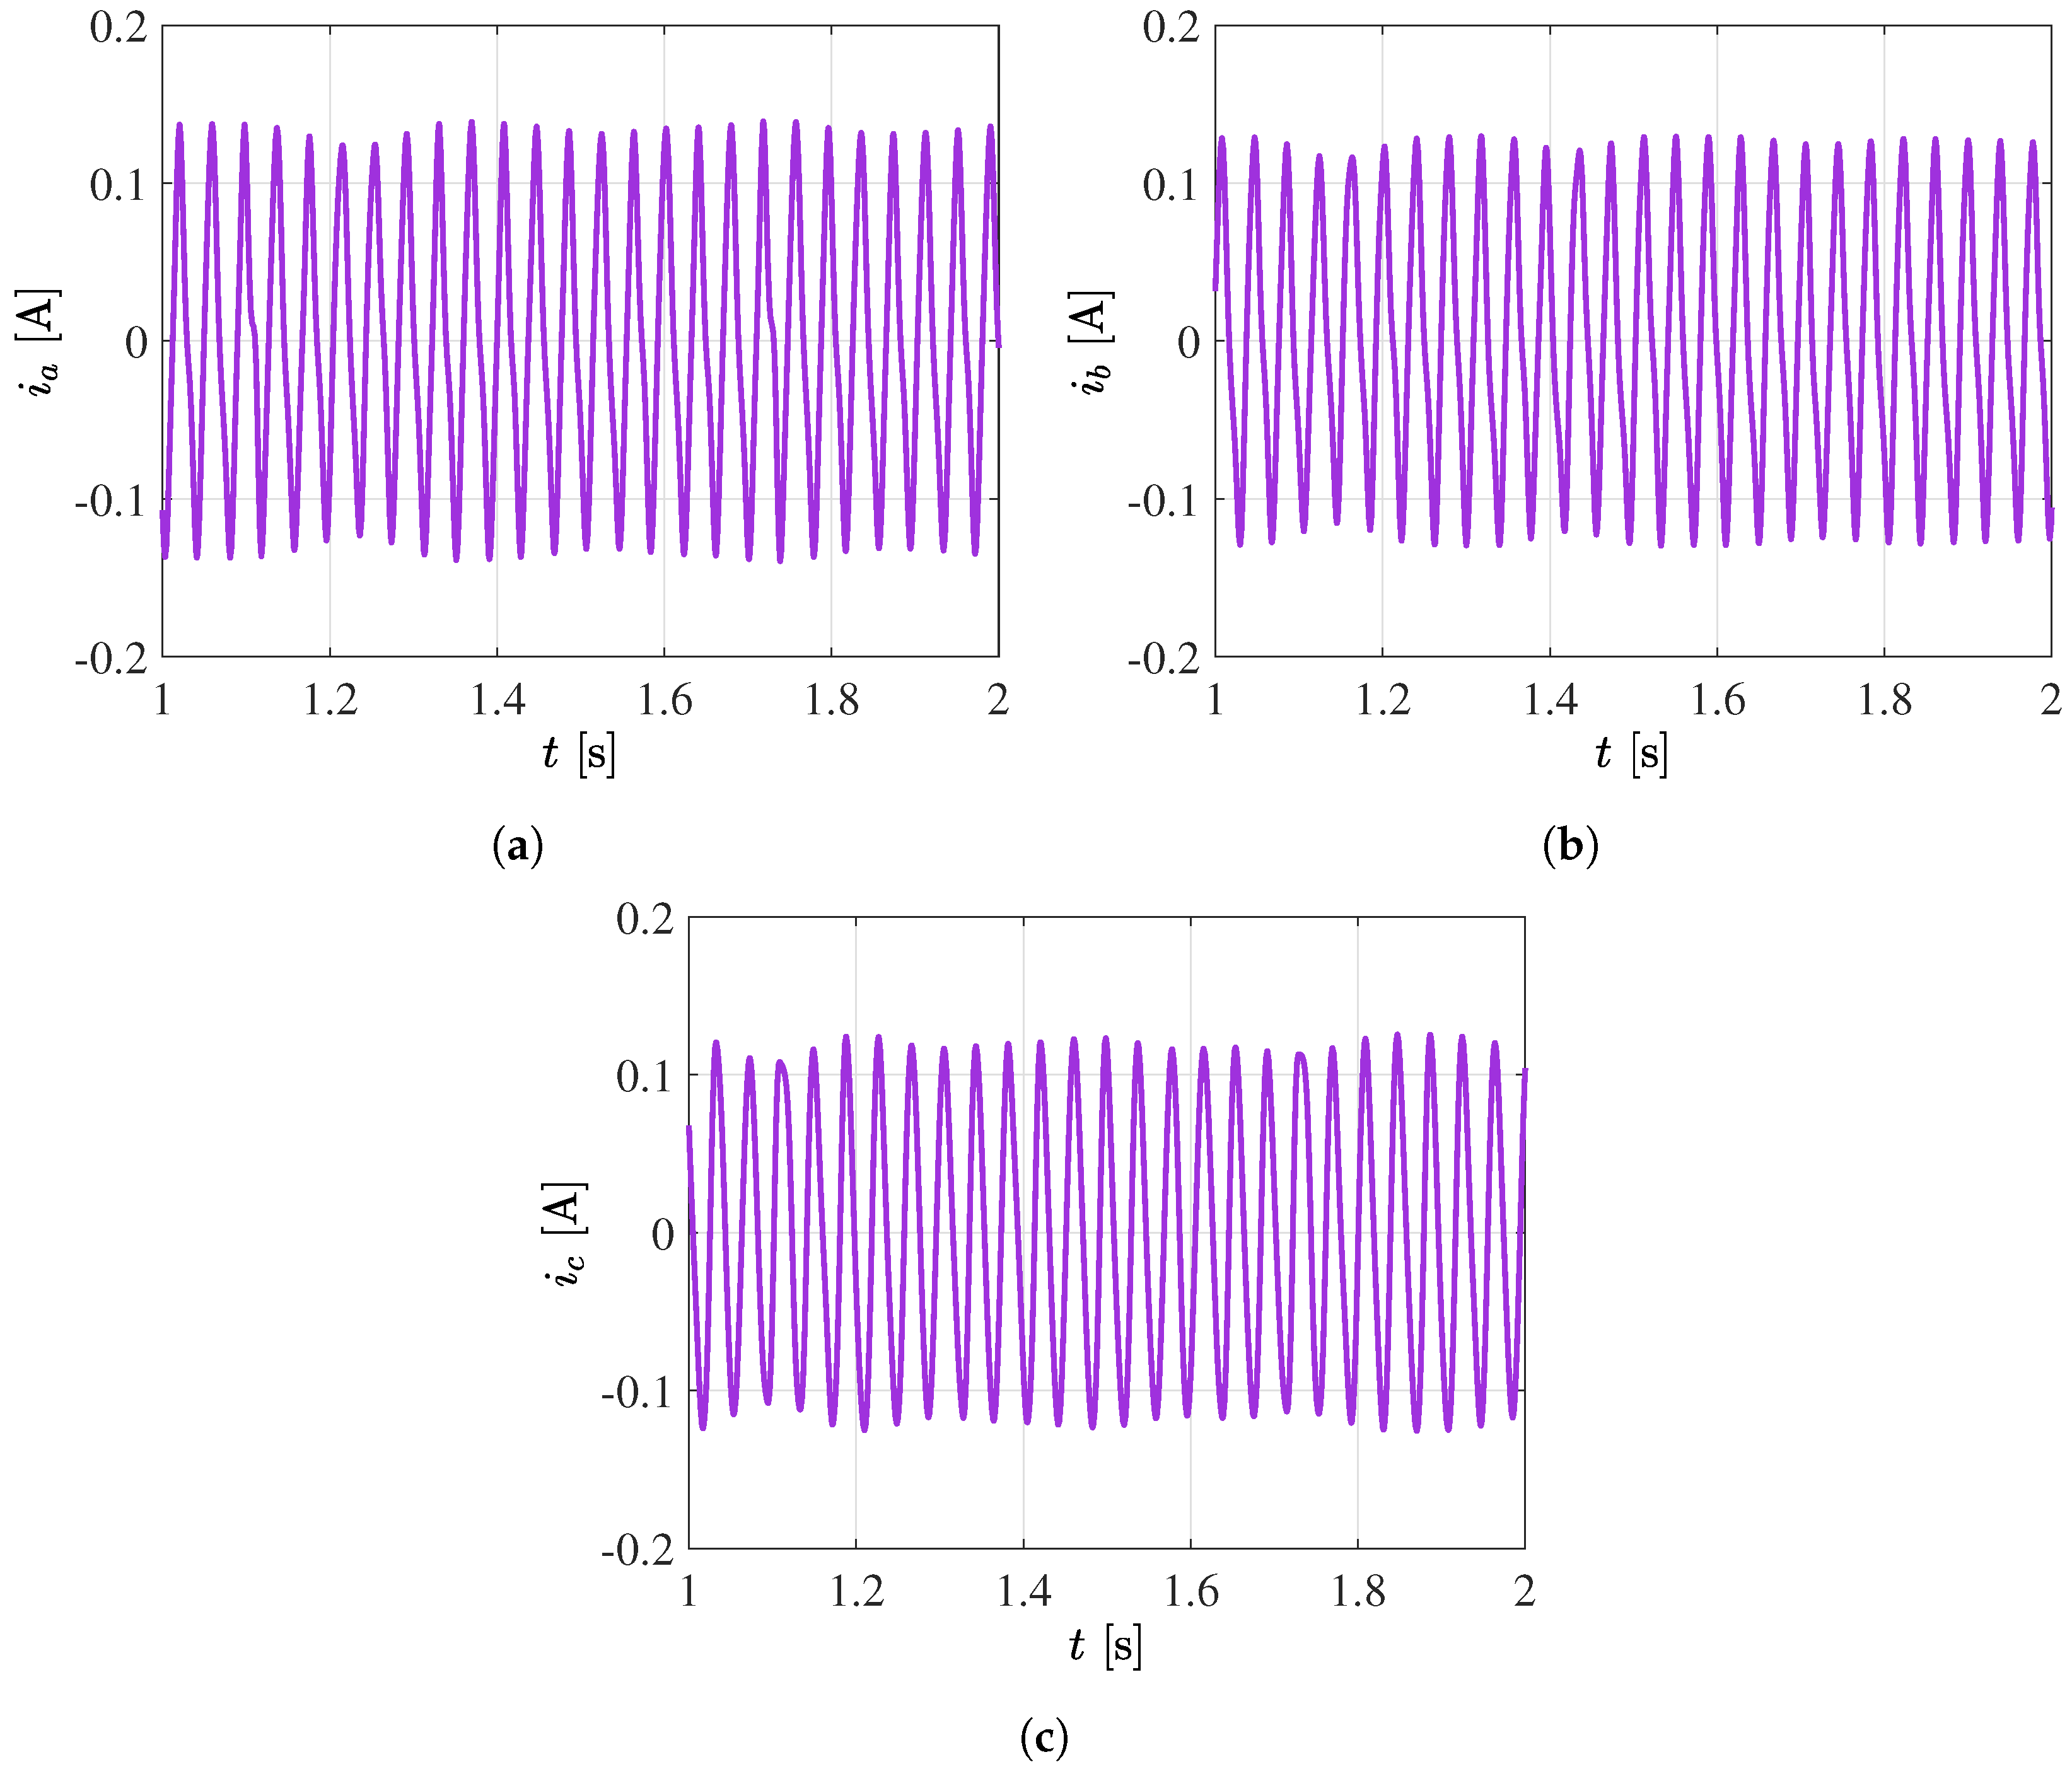
The initial modes extracted exhibit signals with very high frequencies and small amplitudes. Thus, they can be ignored in the analysis of this system. Nevertheless, it is noteworthy that the method, despite encompassing multiple frequencies, precisely extracts the components, leaving only the primary current signal for parameter analysis Figure 7.
From estimated signal oscillatory components i k , their frequencies can be extracted through the instantaneous phase angle derivative calculation and signal’s average value computation, as illustrated in the previous study conducted by [5]. This frequency extraction process is fundamental for gaining insights into the signal’s nature and underlying components. 
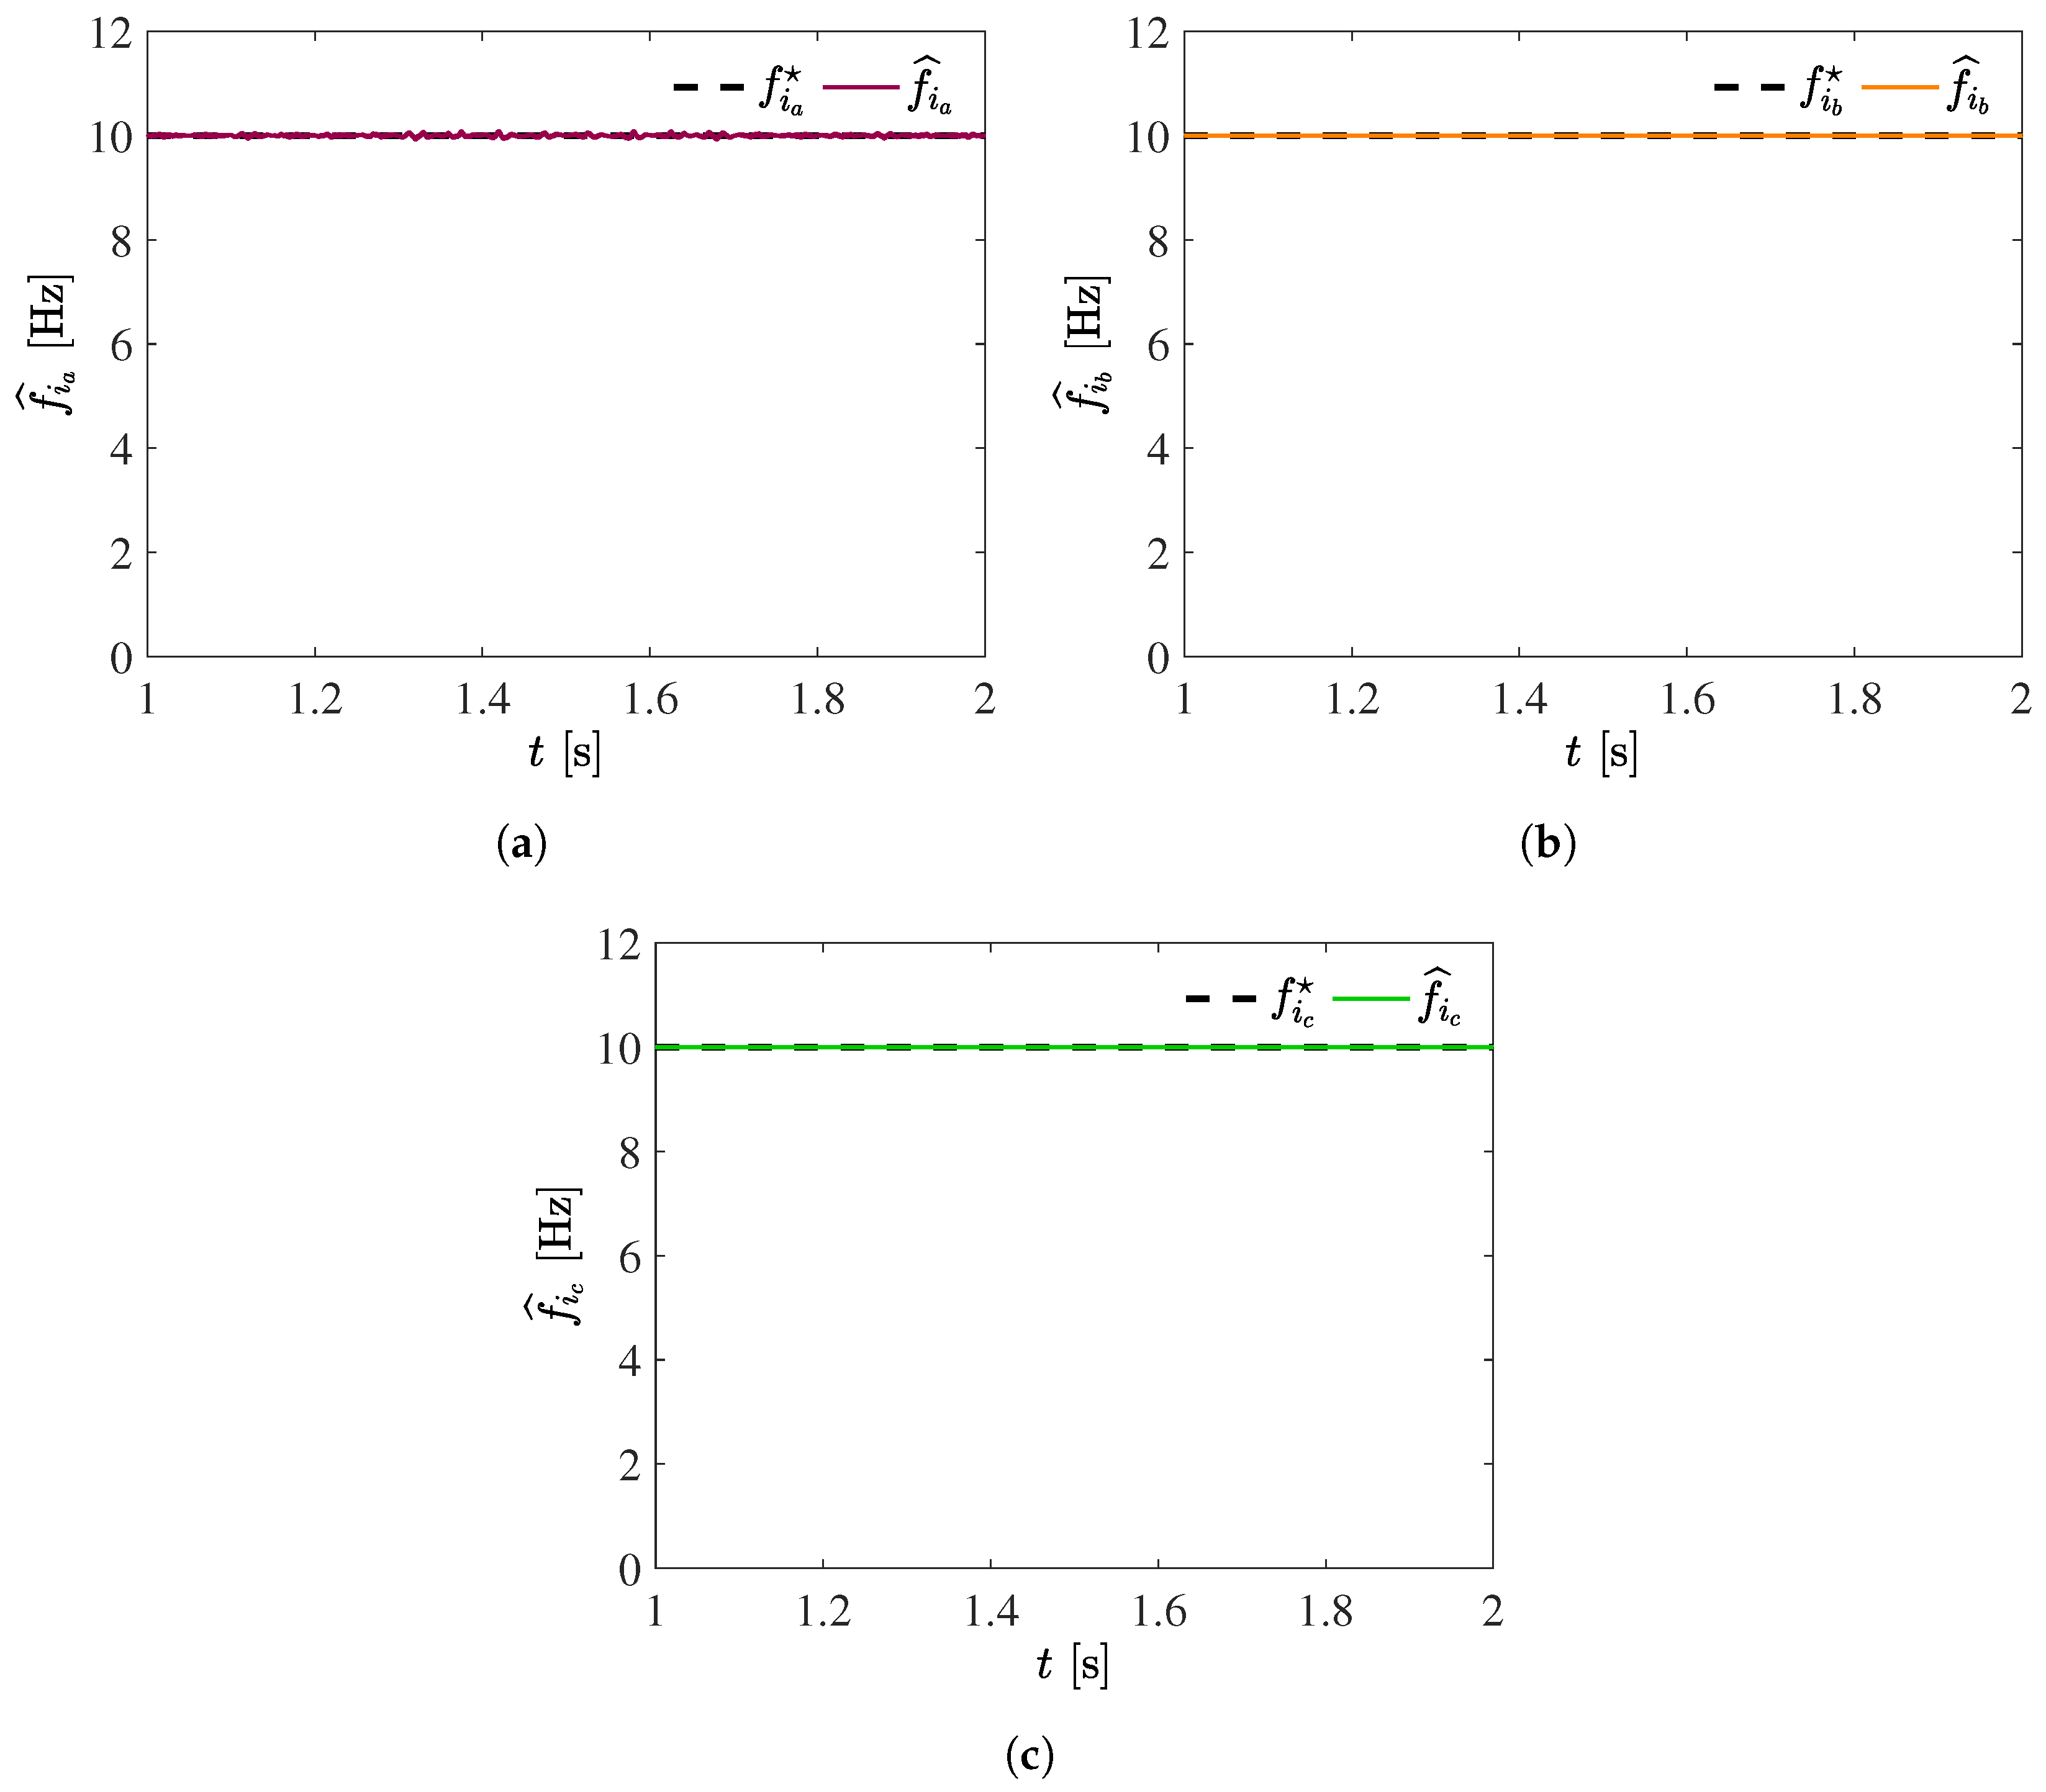
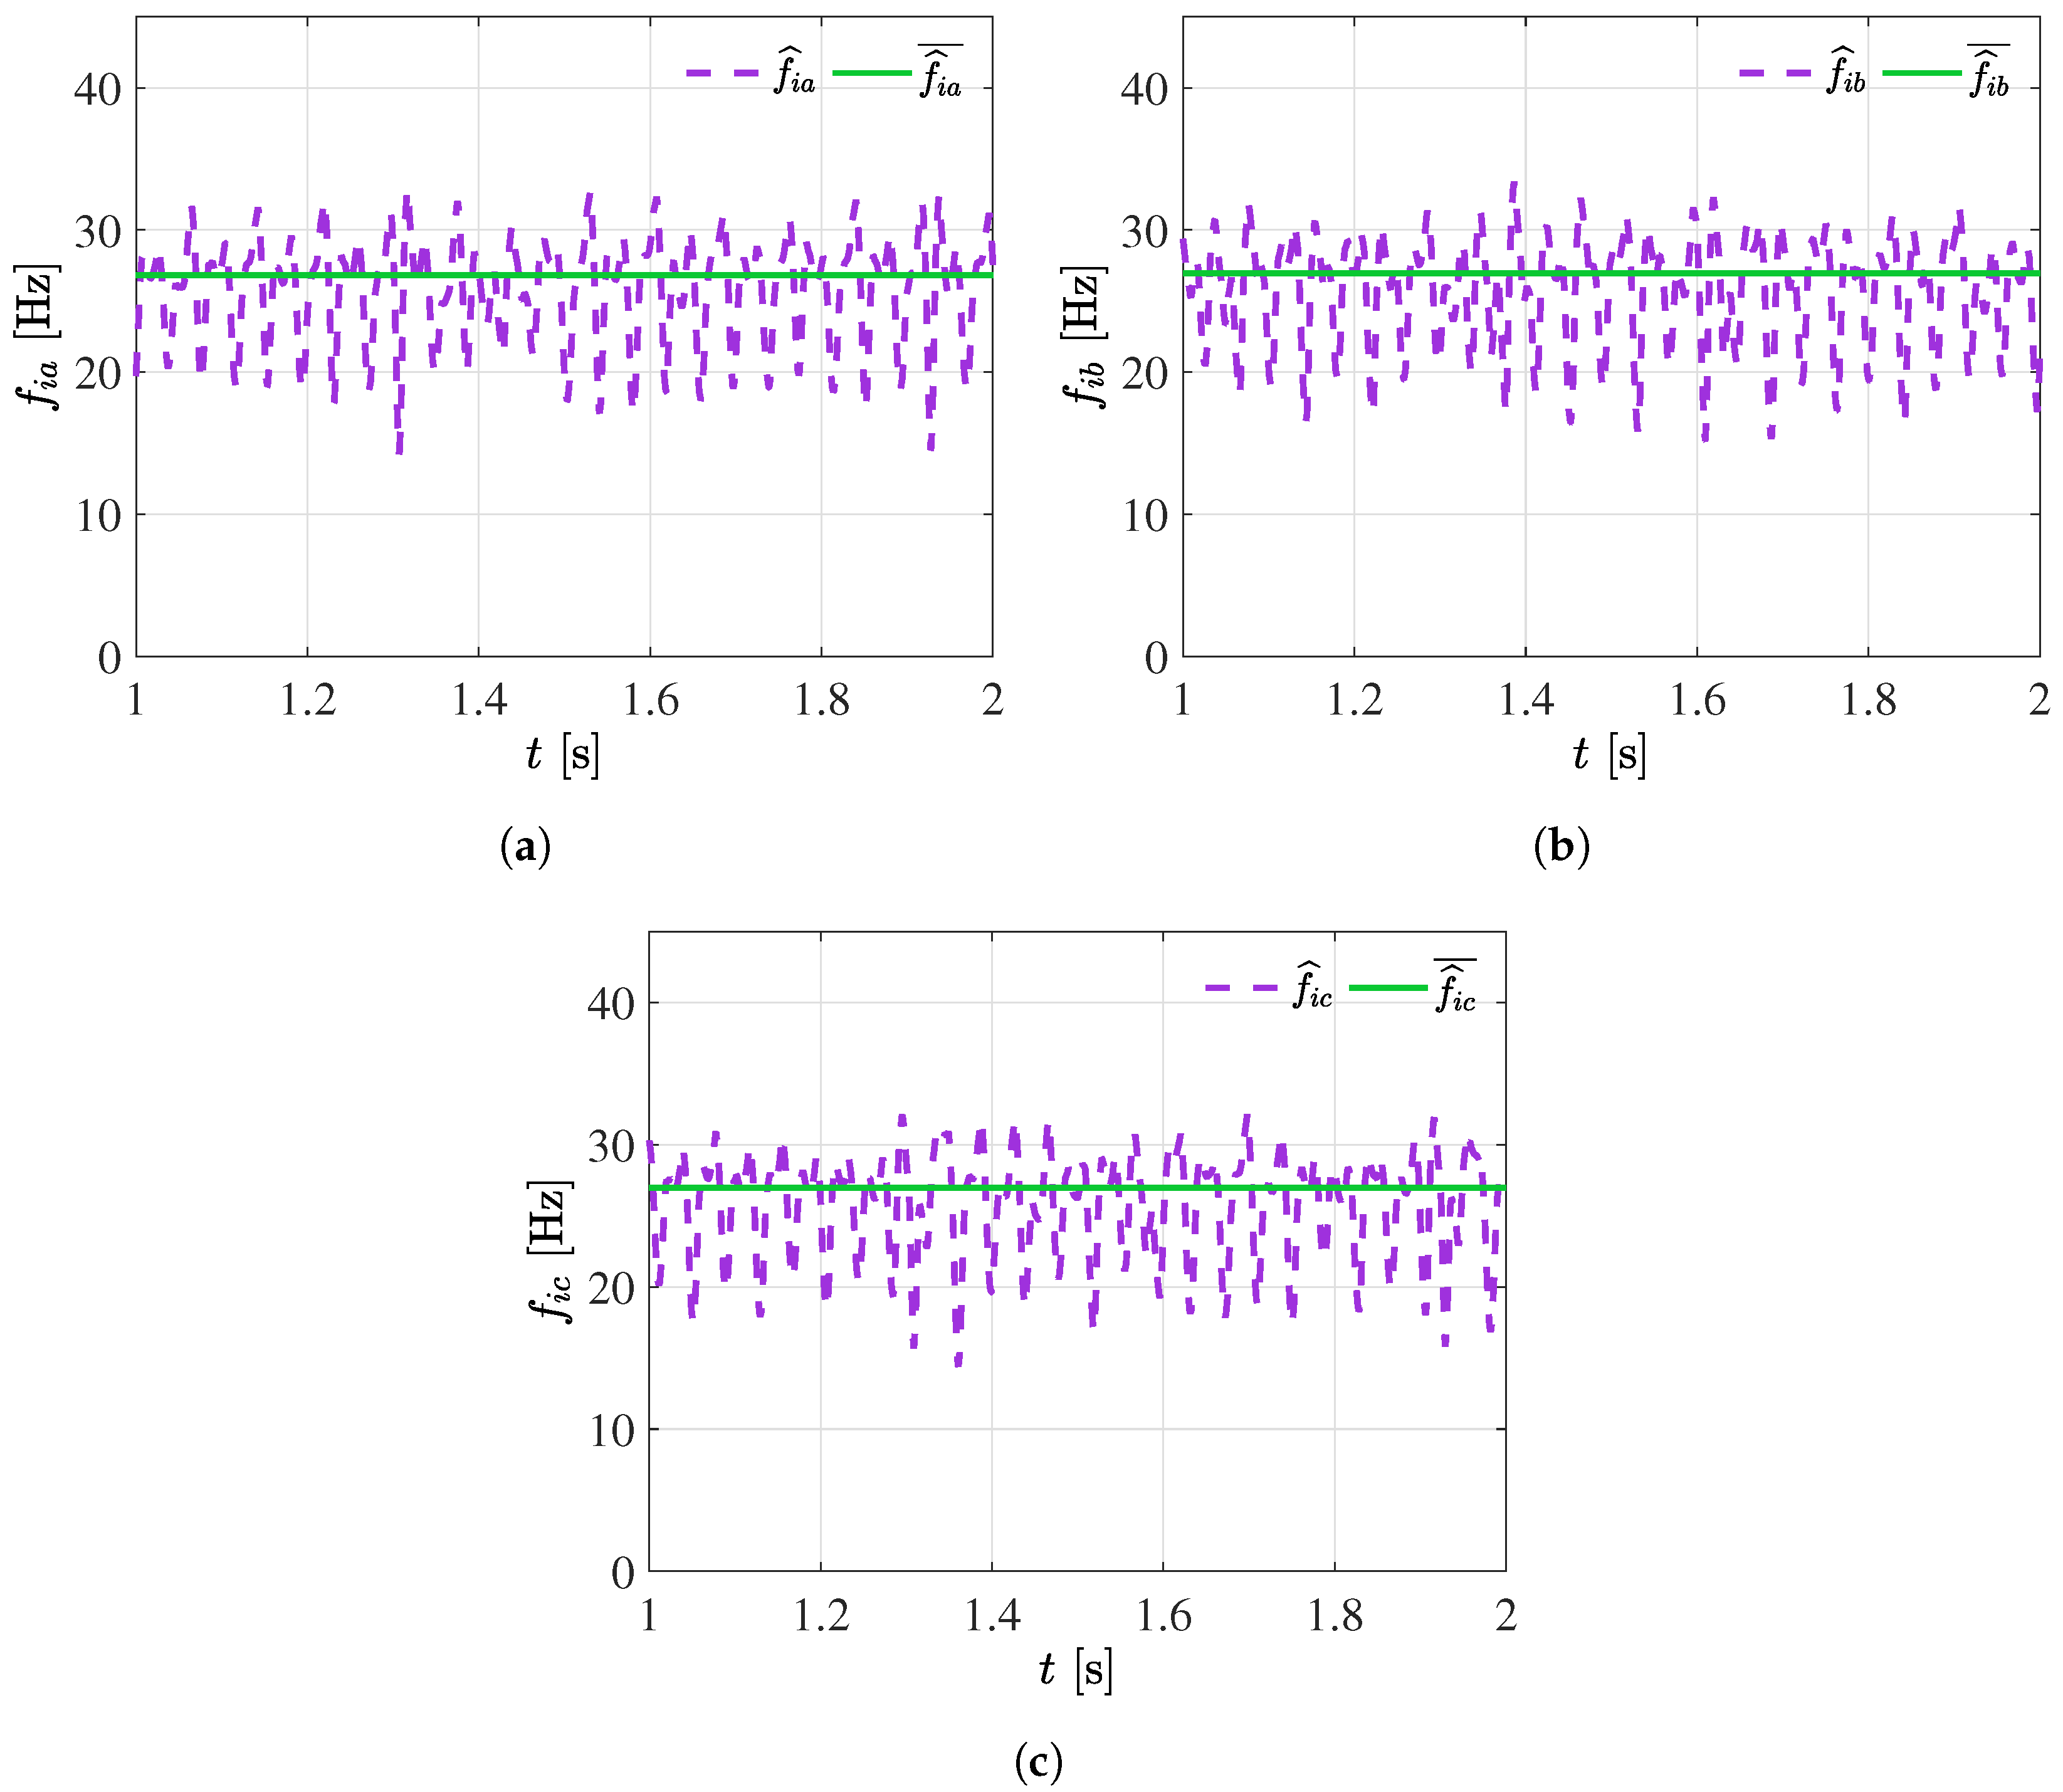
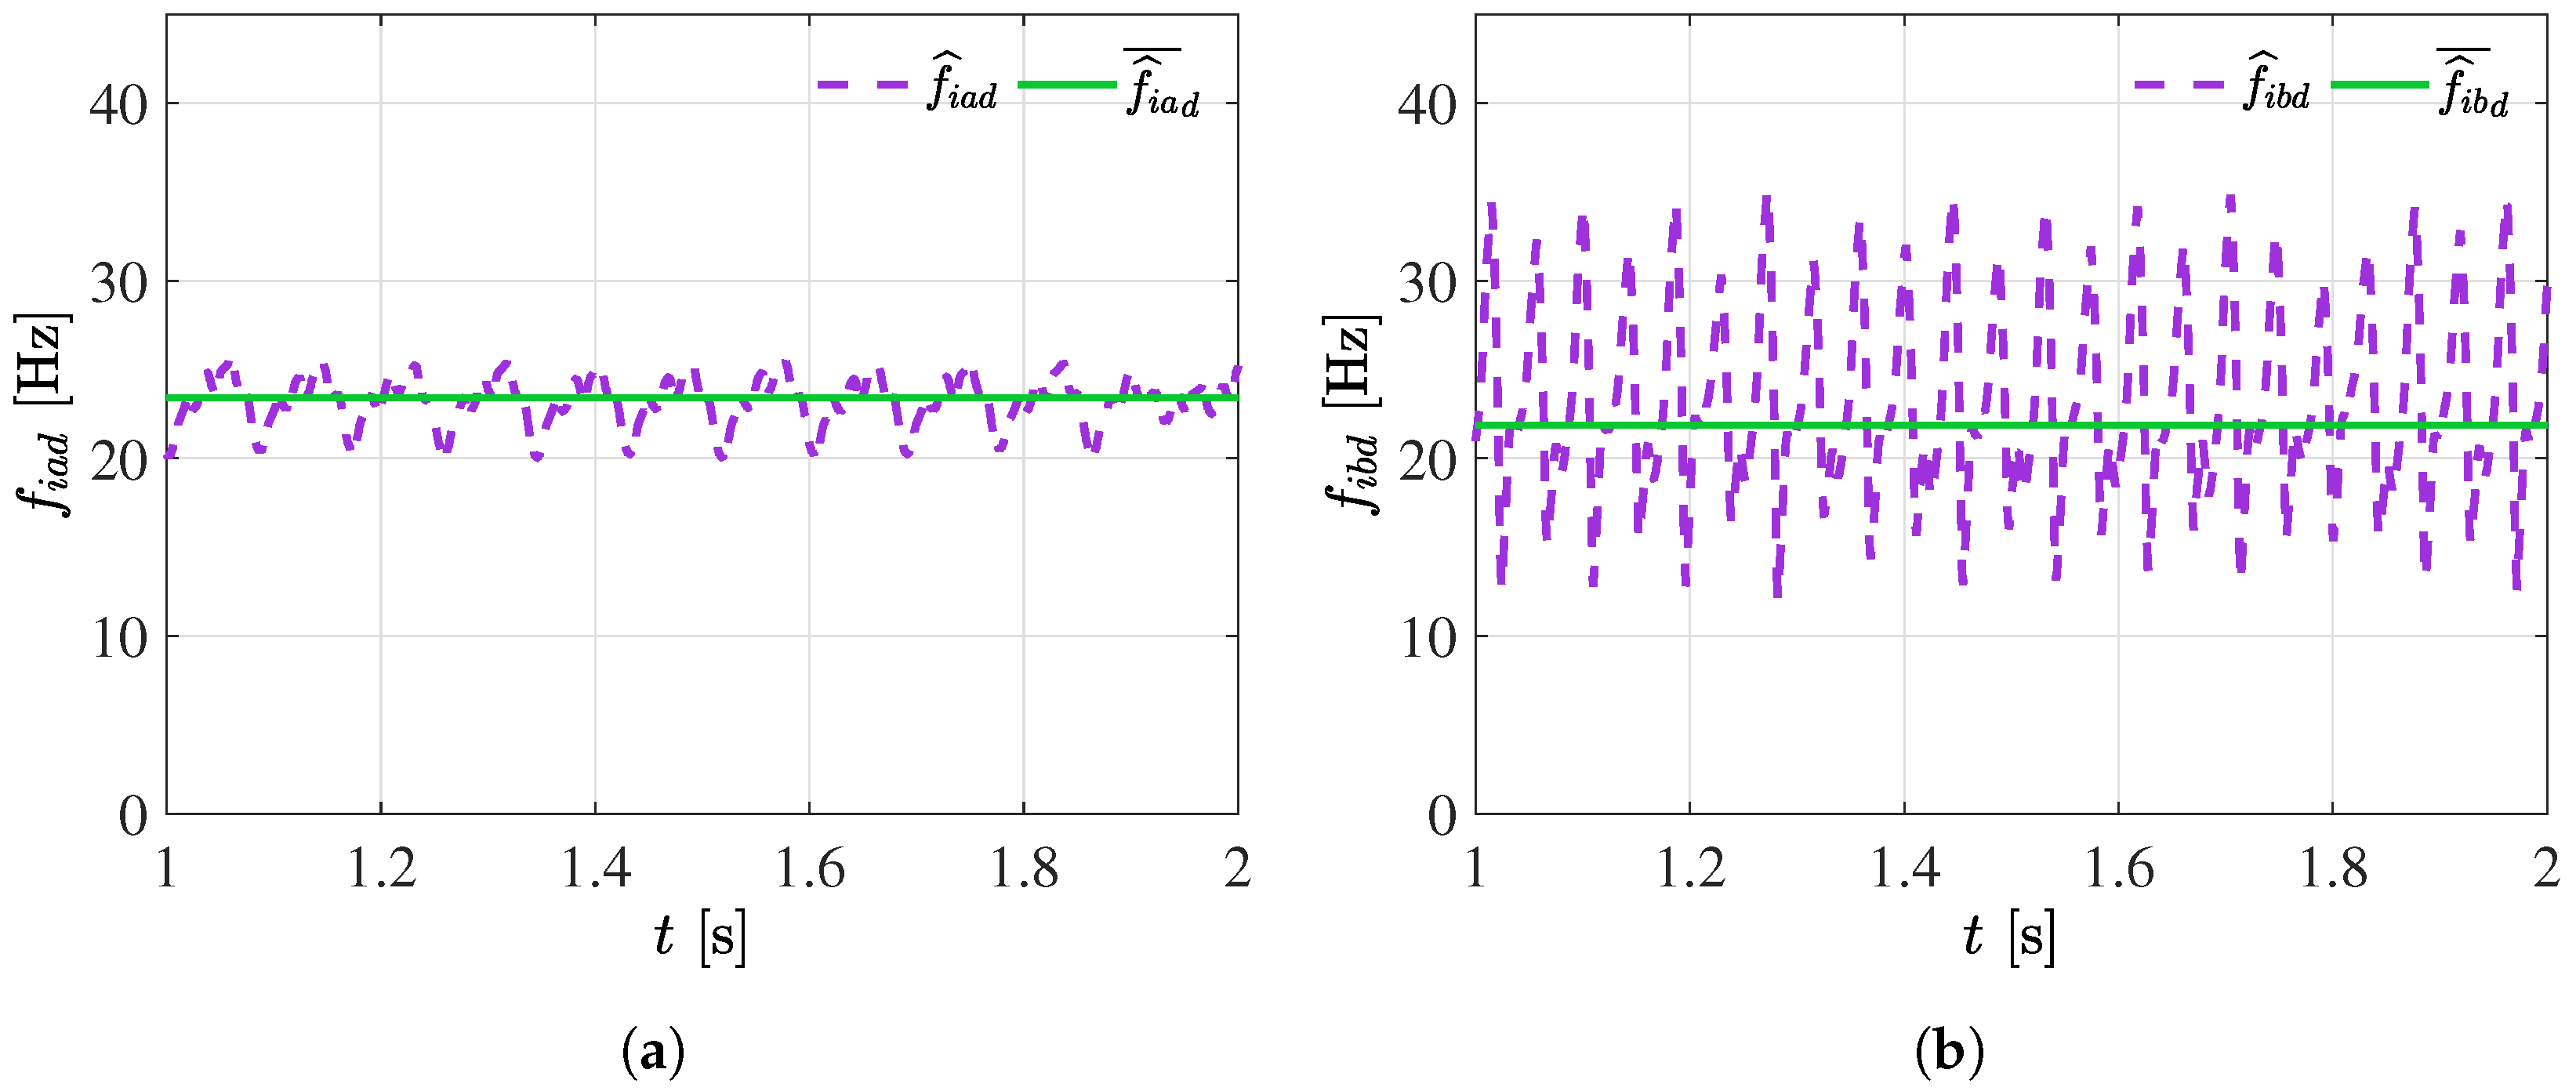
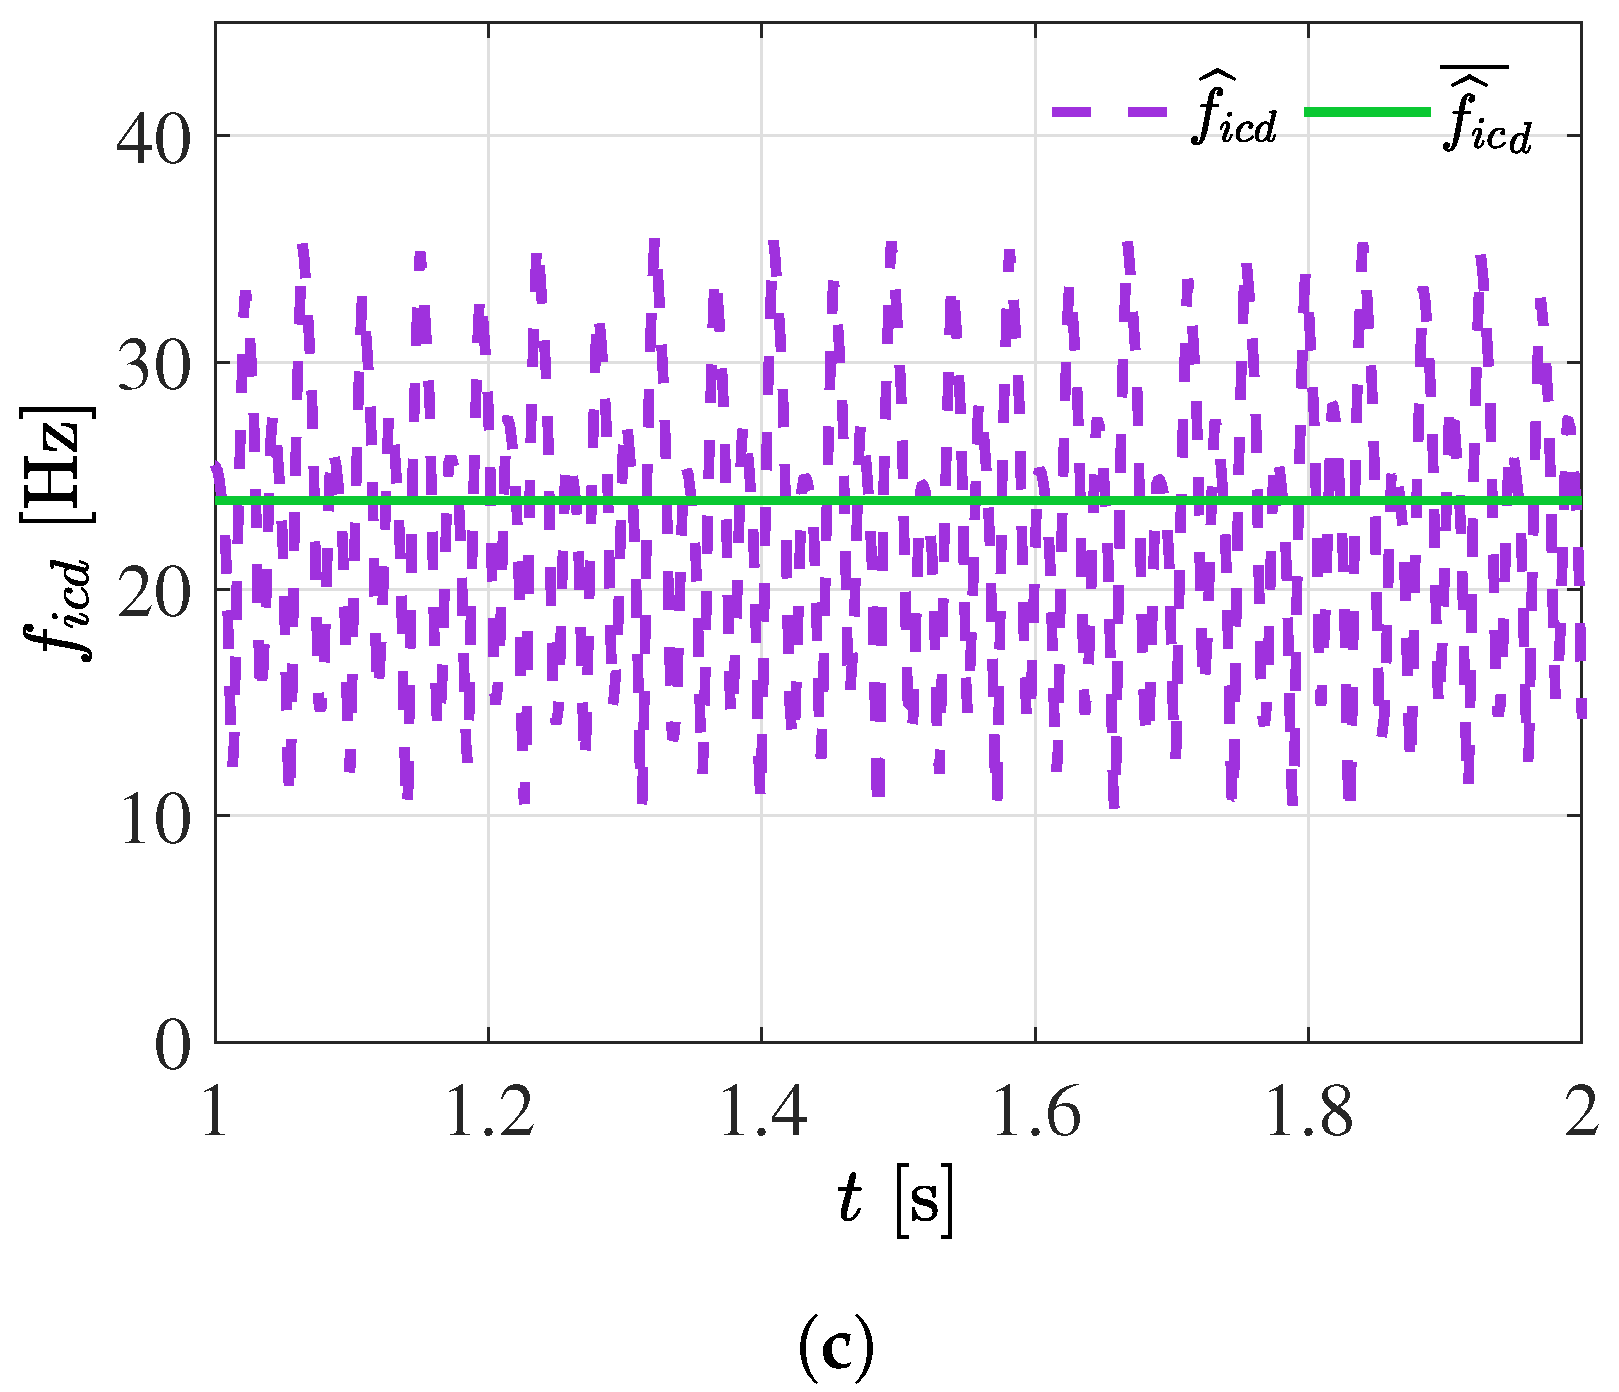
Figure 8 presents an original signal frequency visual representation, where f ^ i a b c represents the fundamental signal components. The estimated frequencies from process analysis using the Hilbert Transform are represented by f ^ i a b c . Averaged frequencies are computed by taking the estimated frequencies mean over time. These averaged frequencies offer a more stable and representative insight into the signal’s frequency characteristics, which can be highly valuable in signal analysis applications, requiring a more general and simplified description. All of these frequencies are depicted in Figure 8a–c.
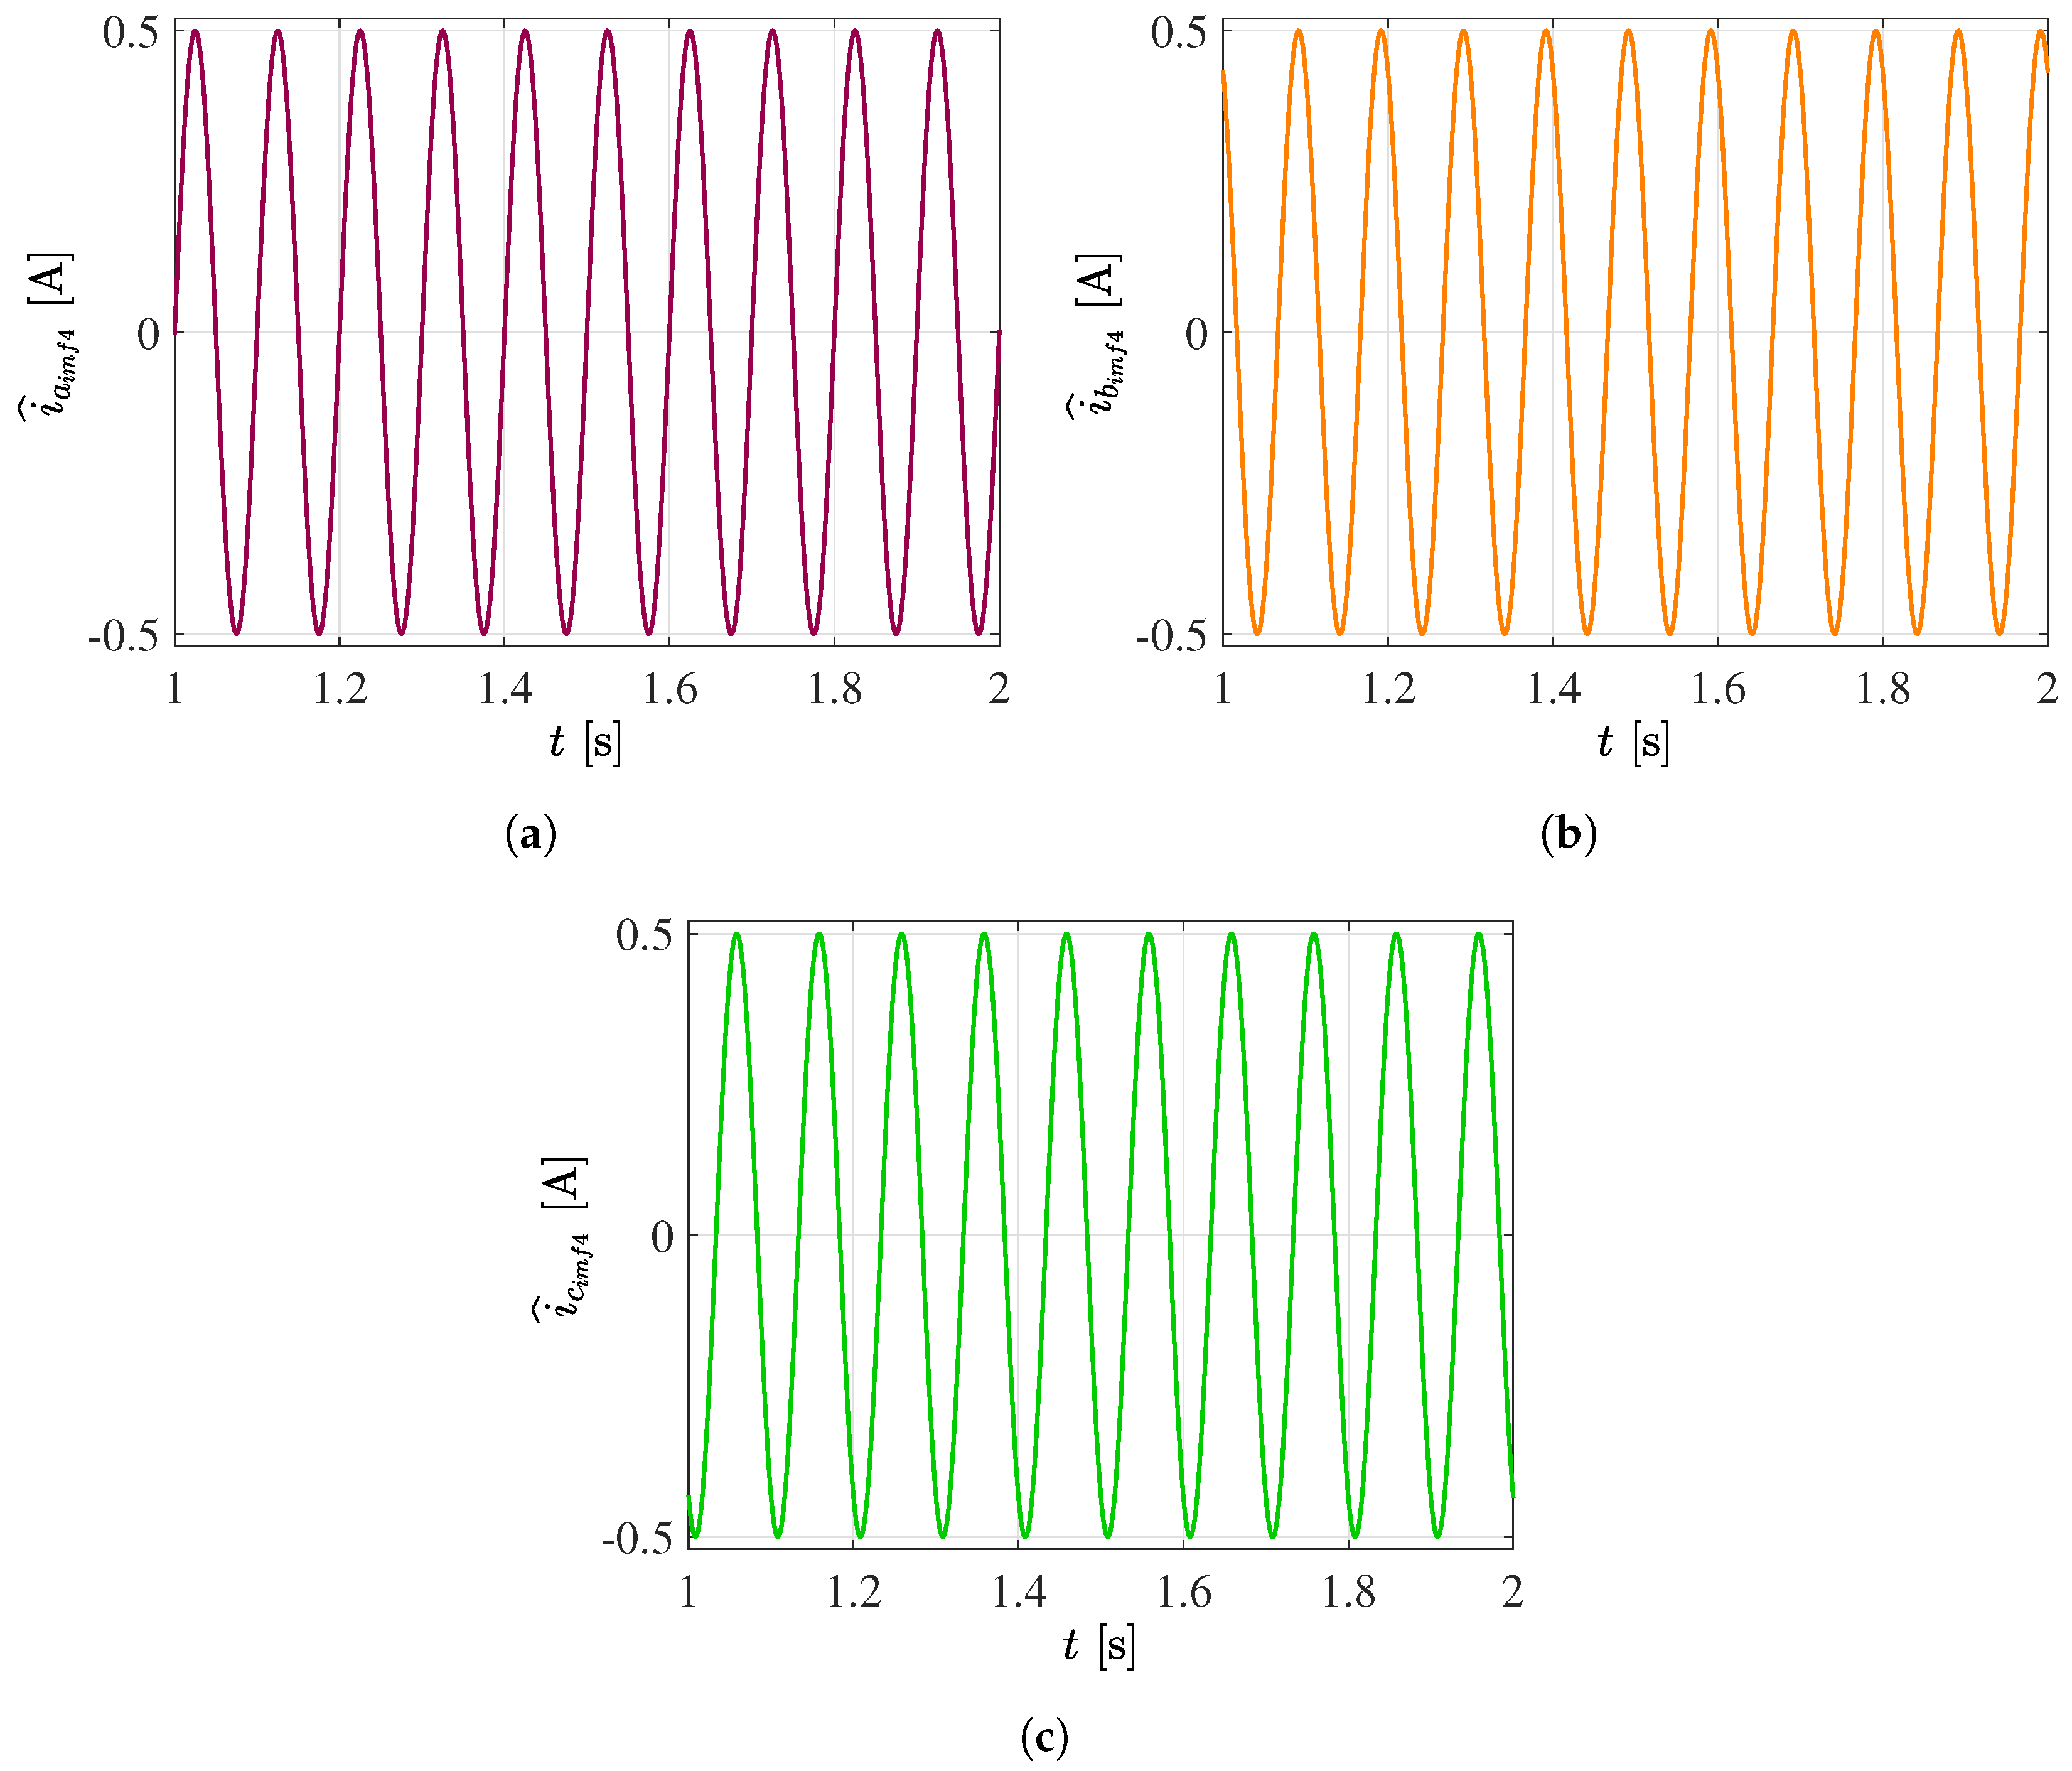
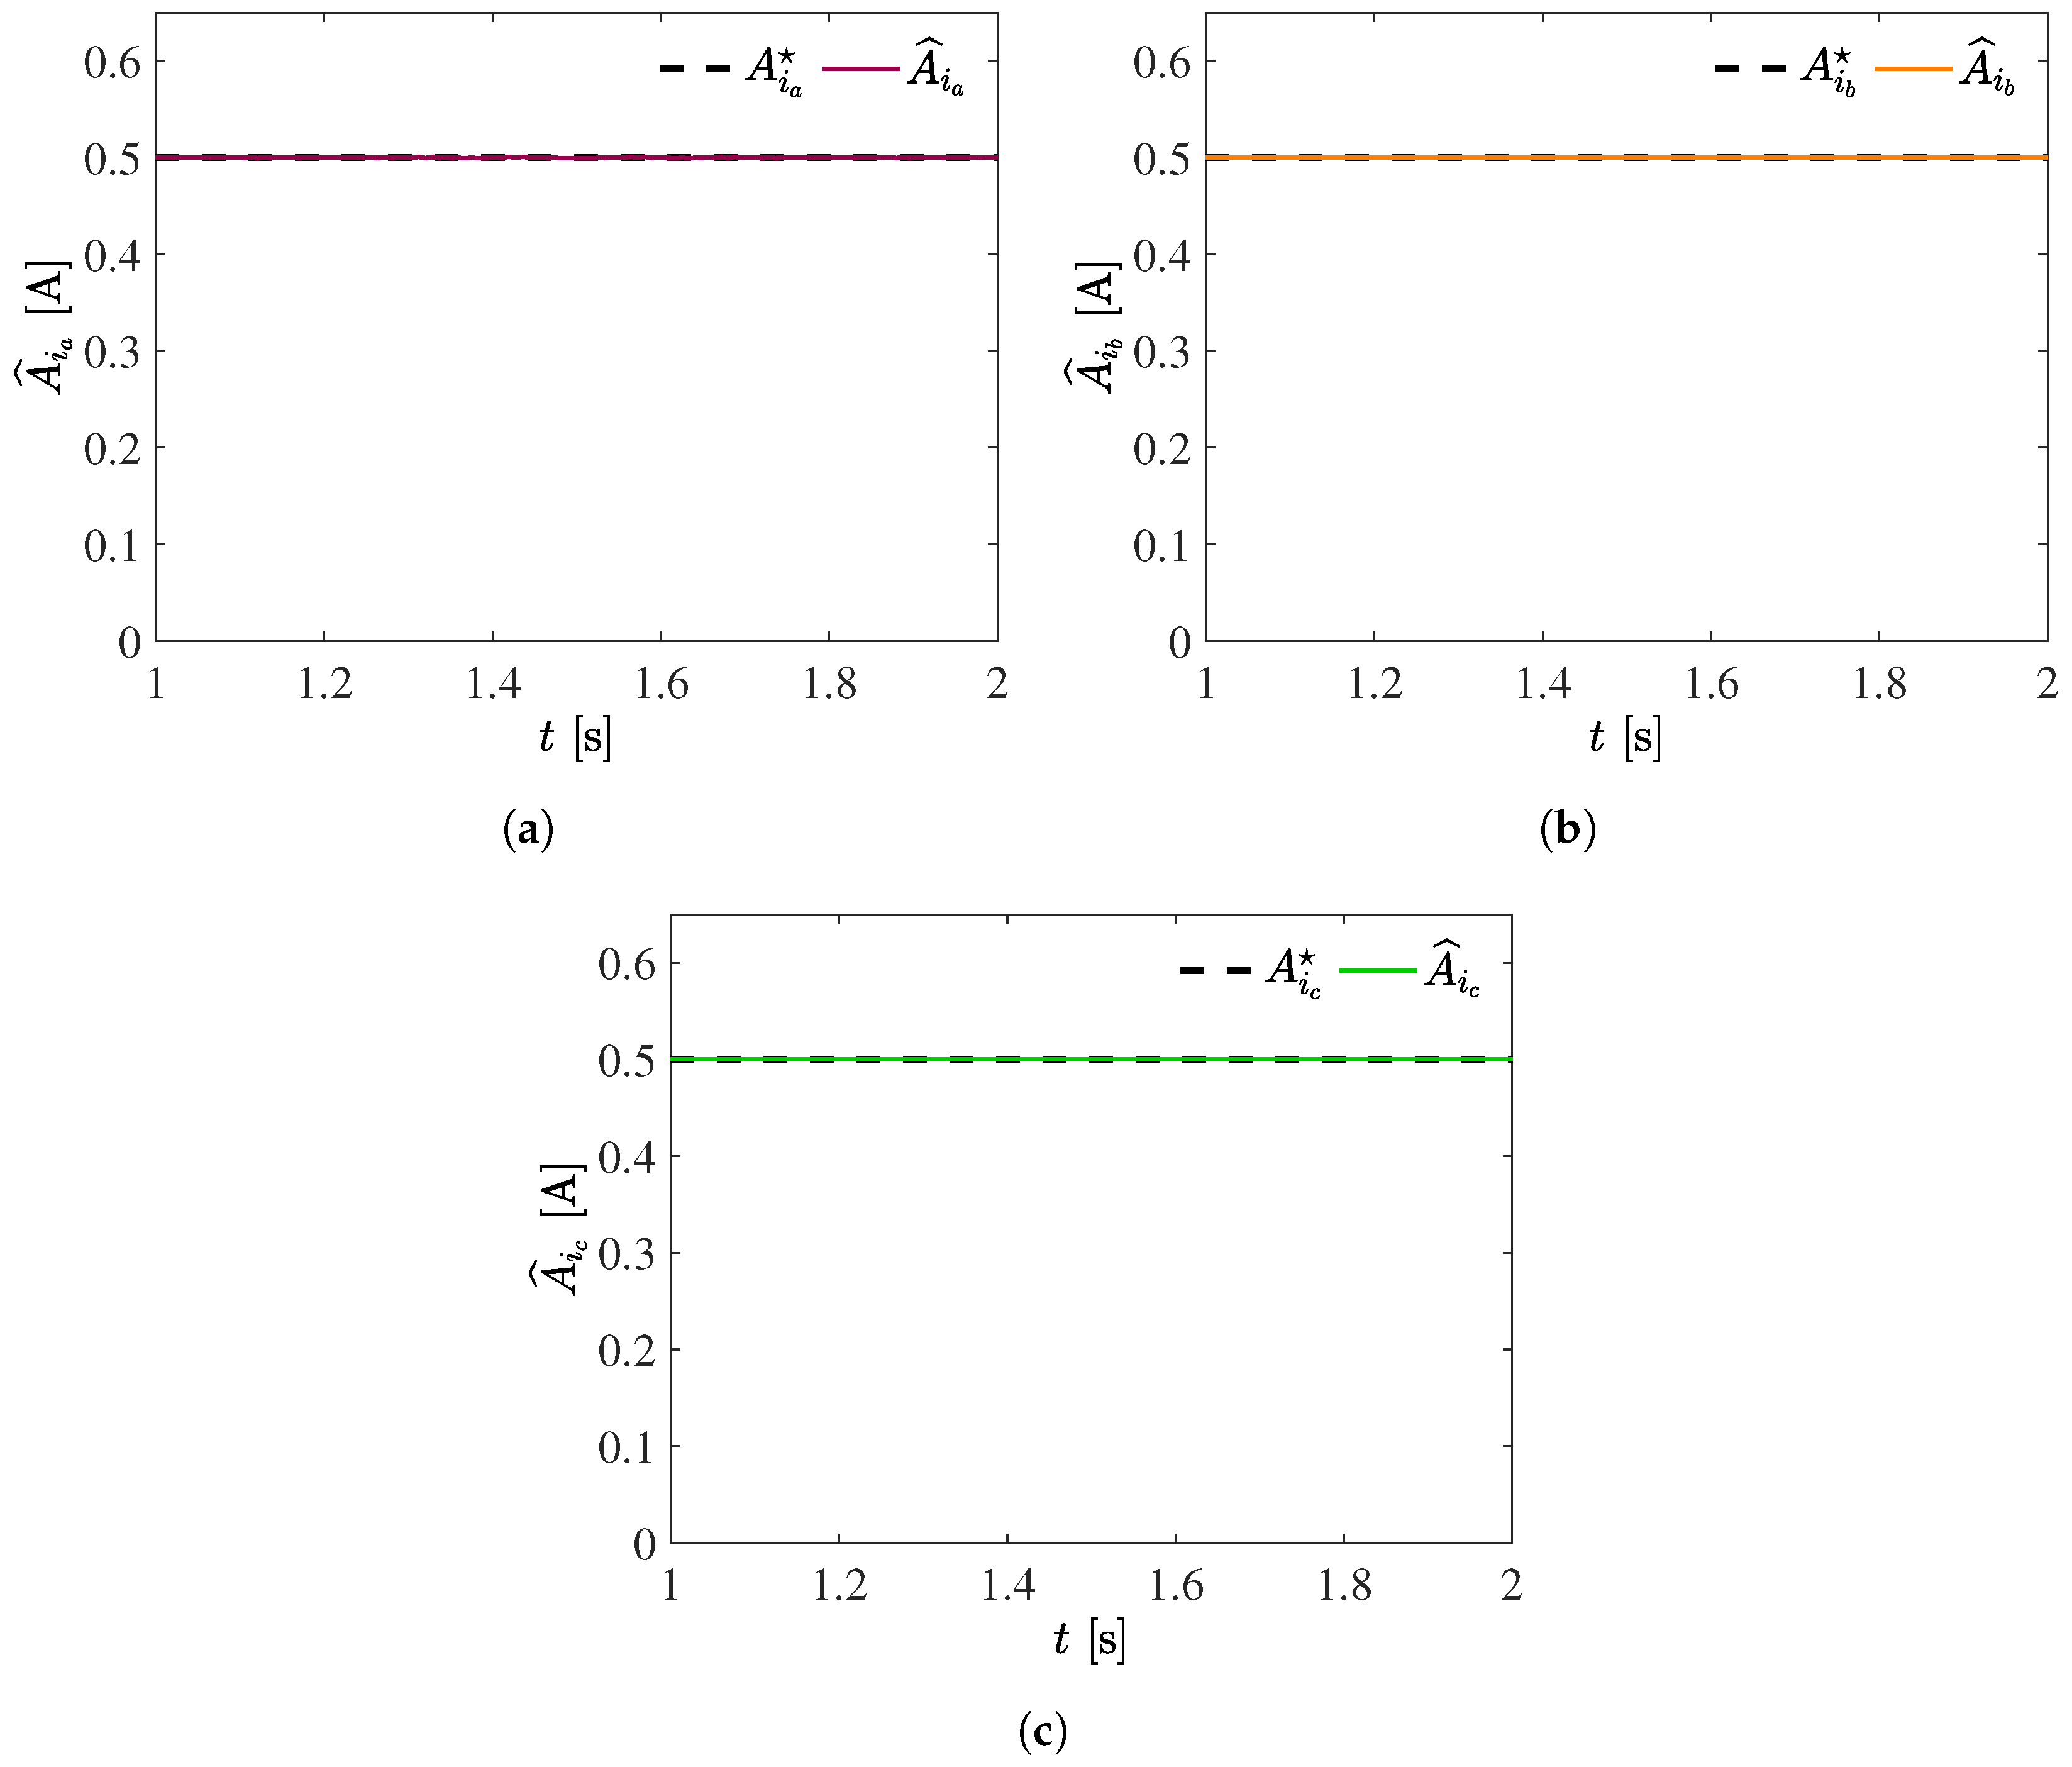
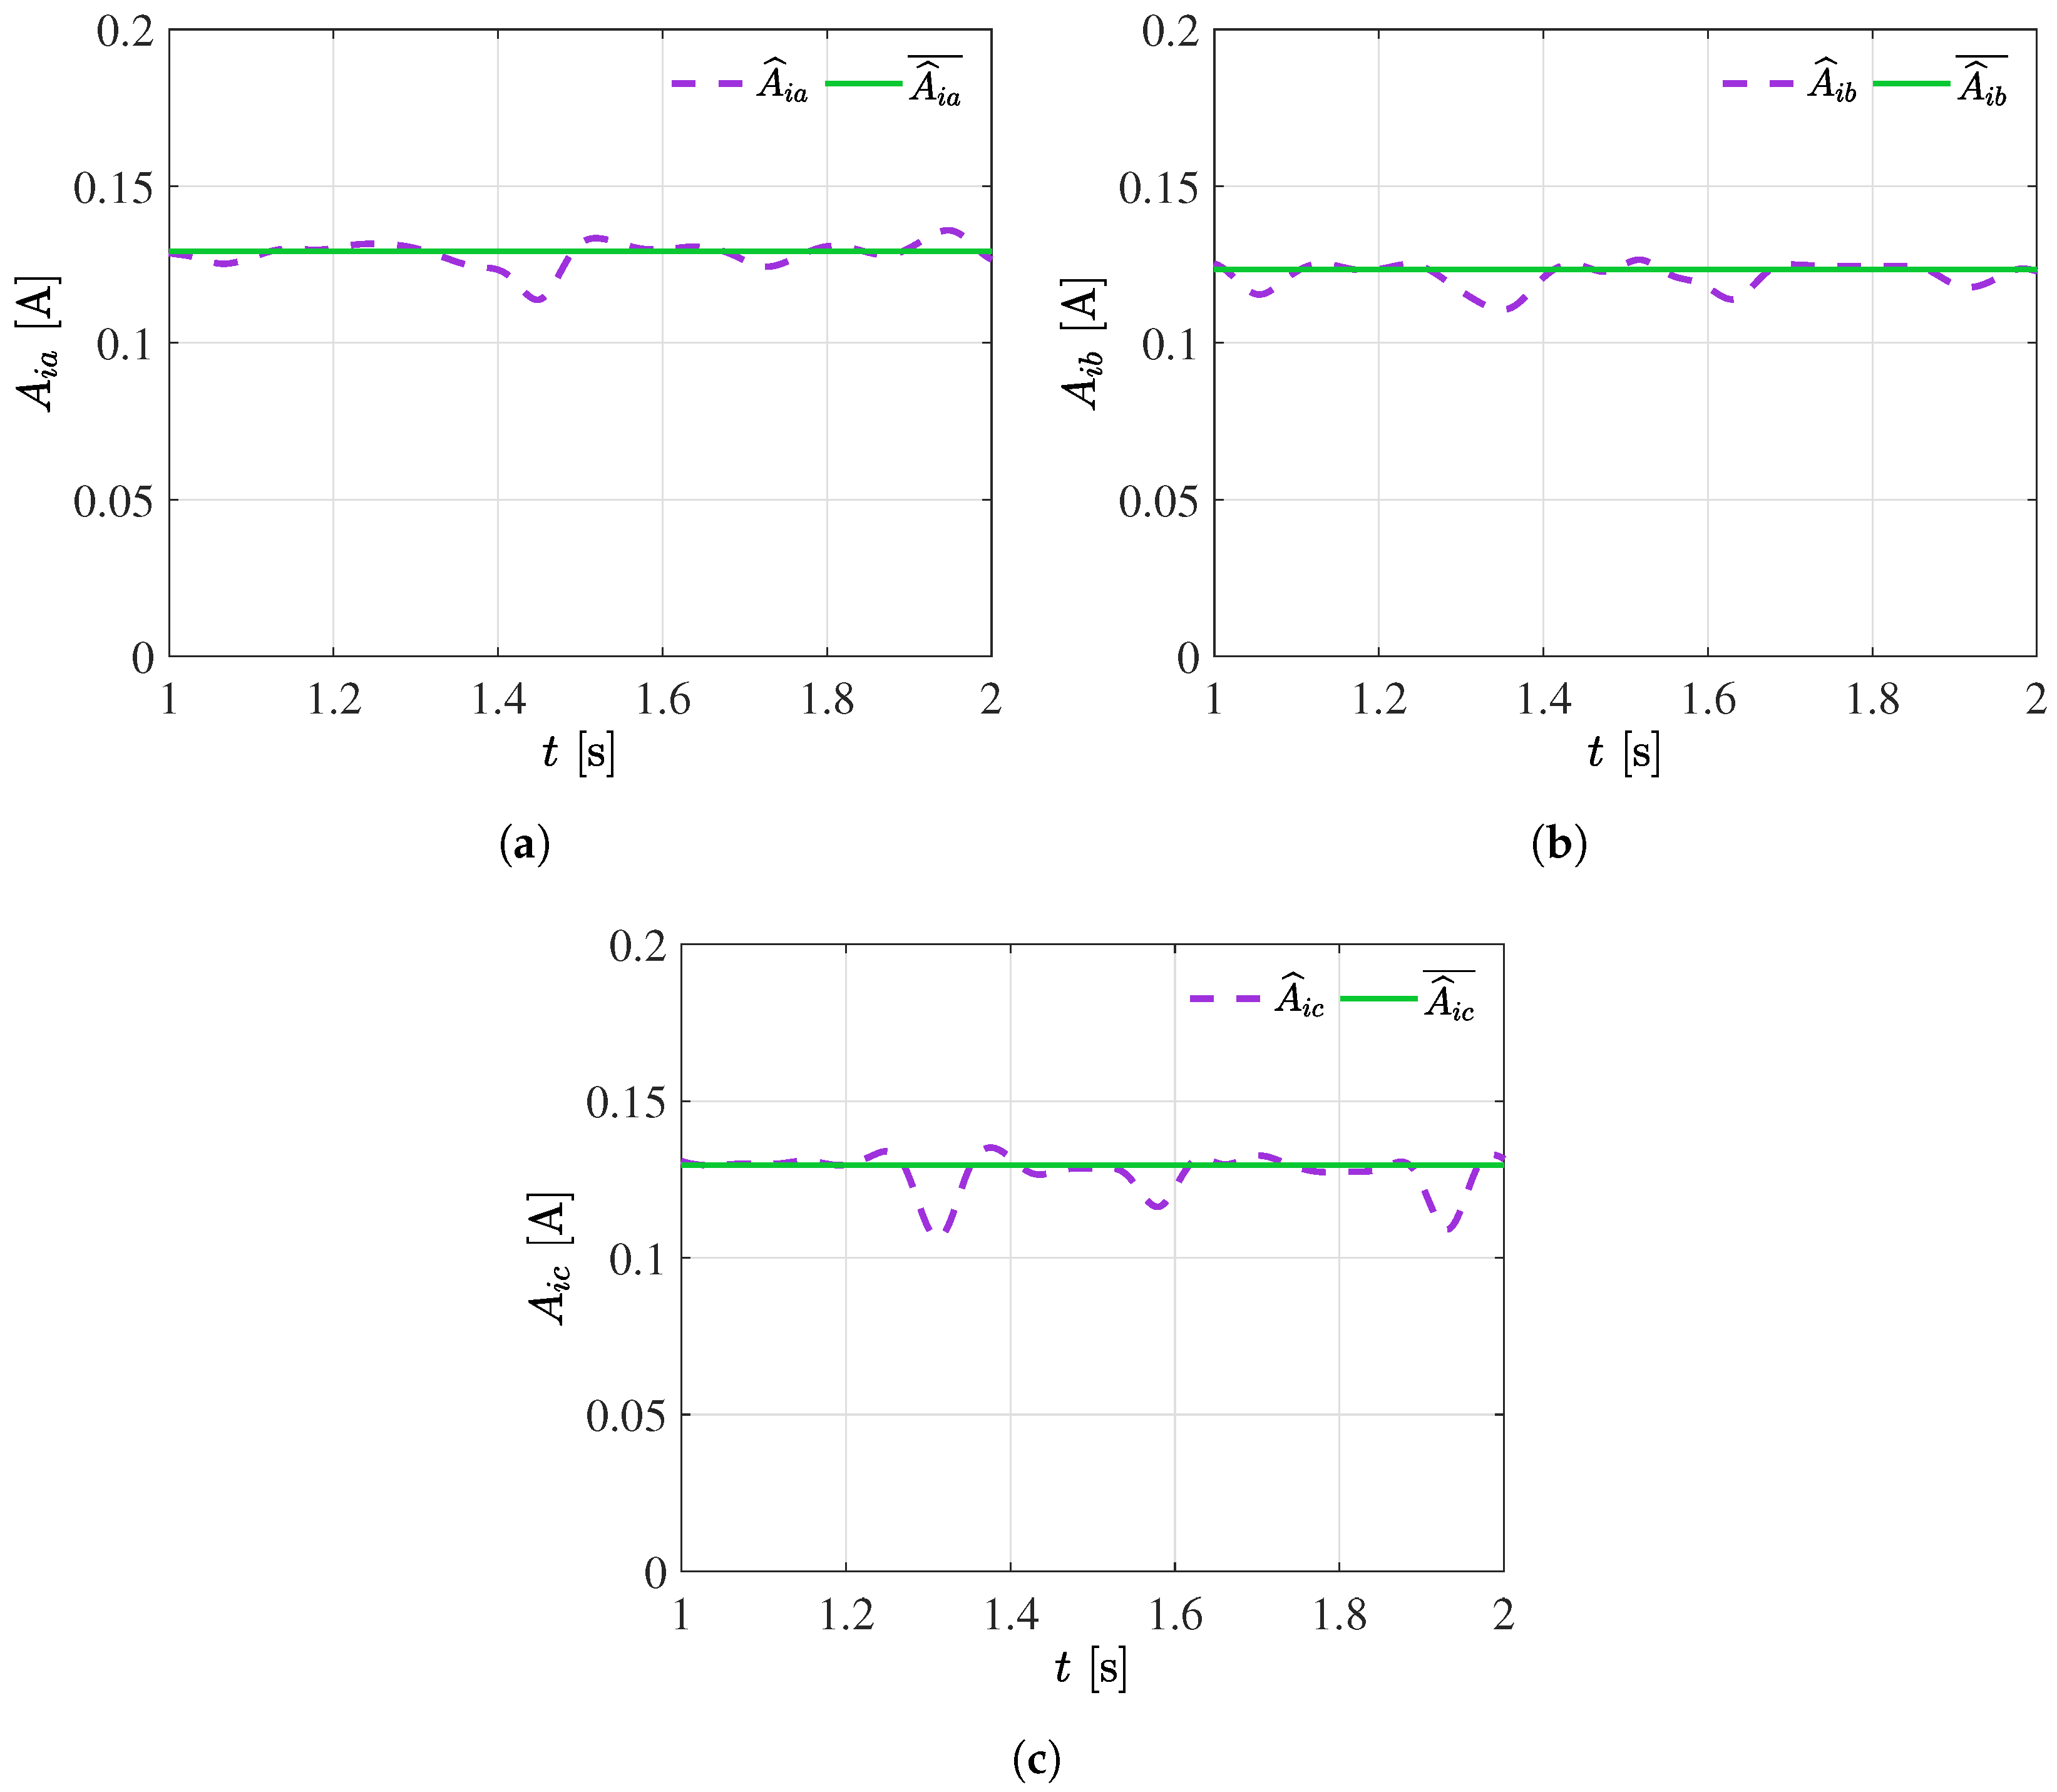
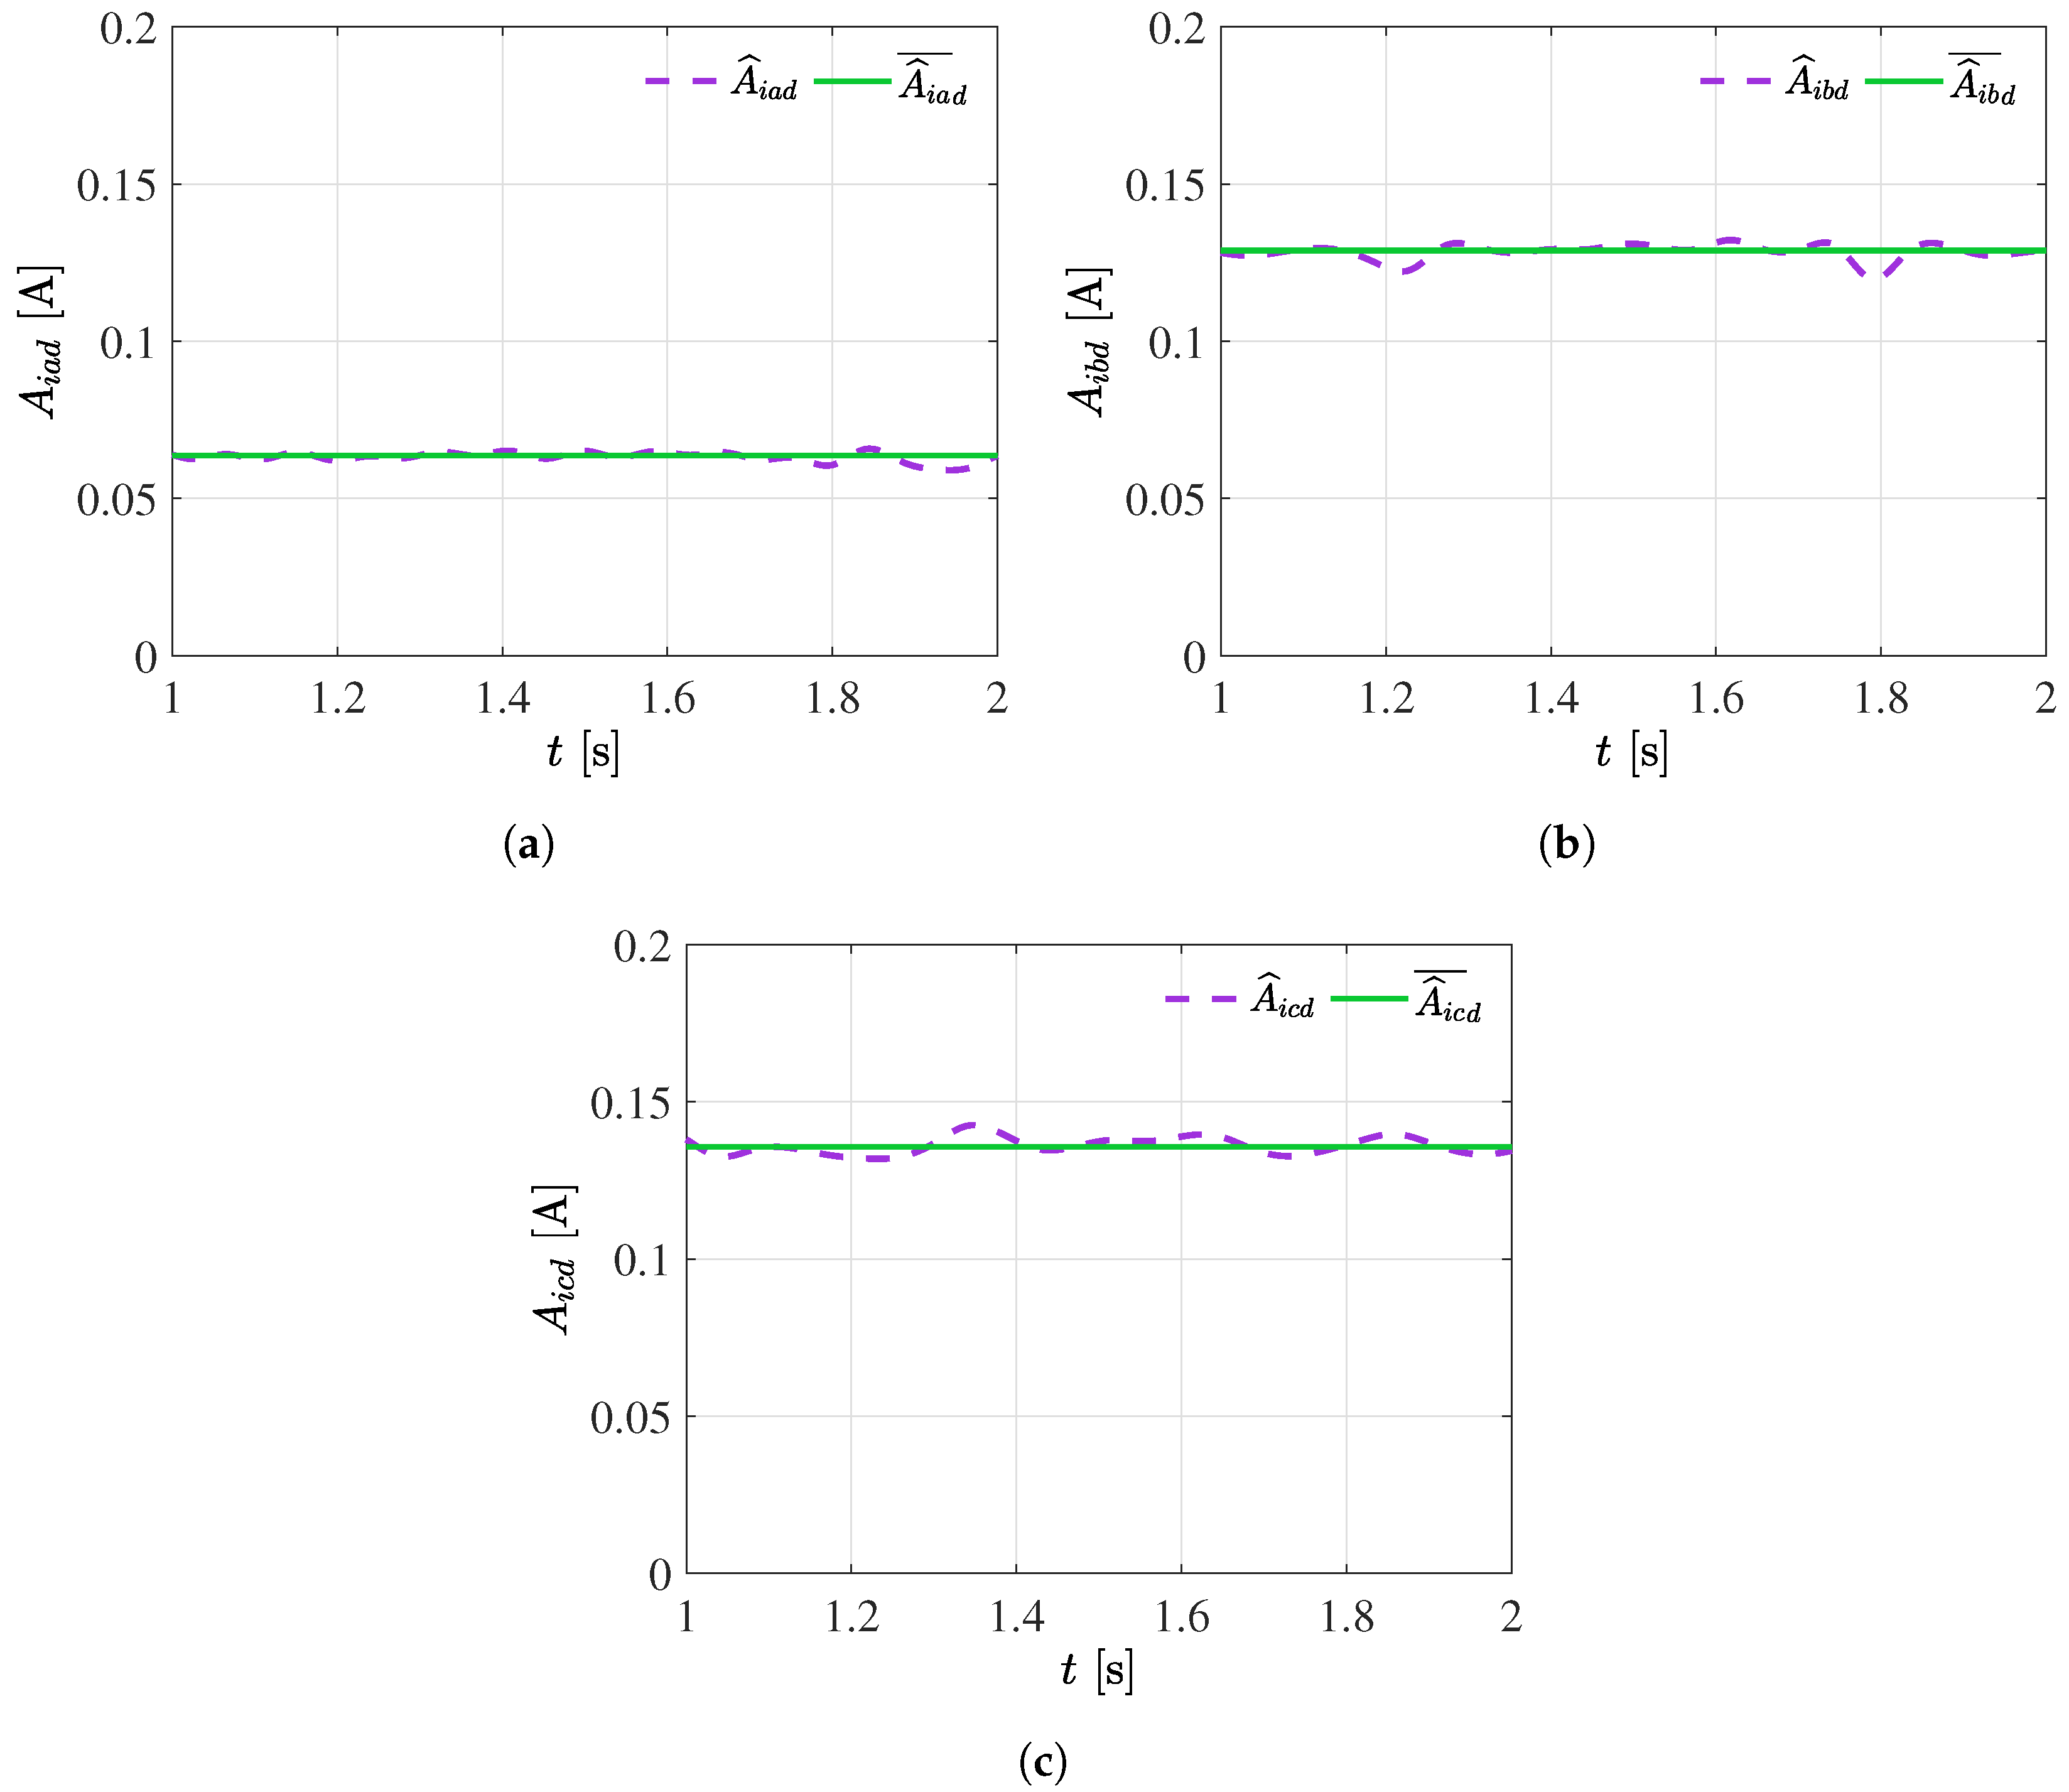
The amplitude extraction process is based on the absolute value calculation of each oscillatory signal. This stage is fundamental for accurately quantifying oscillatory components’ intensity. Original amplitudes’ obtention, denoted as A i a b c , allows the signal’s intrinsic characteristics to be known before processing. These original amplitudes represent the magnitude of each fundamental component presented in the original signal. On the other hand, the estimated amplitudes, represented as A ^ i a b c , are the analysis process results using the Hilbert–Huang transform. The comparison of original amplitudes and estimated amplitudes is essential for evaluating the analysis process’s effectiveness and quantifying signal changes or disturbances. Figure 9a–c shows each amplitudes’ computation process.
All these features are presented in detail in Table 2, which includes information about the estimated frequencies and amplitudes of the identified oscillatory components in the processed signal. Furthermore, the percentage error value has been computed for each parameter and it is worth noting that all these error values are below one percent, considering these signals to be a healthy system. This low error rate demonstrates the effectiveness and precision of the method that can be used to identify early faults in electronic speed controllers.

3. Case Study: Proposed Method Application for Early Fault Detection in Electronic Speed Controllers

This case study explores the proposed method application for early fault detection in electronic speed controllers used in brushless DC motors. Several tests were conducted using different devices, obtaining similar results. The rest of the document describes the main results of two ESCs. This analysis allows for comparing the operational ESC parameters, demonstrating the method’s efficiency in fault detection. Below, the values of the operating motor used in the experimental stage are provided.
  • Nominal voltage: 160 V;
  • Nominal Speed: 3000 rpm.;
  • Power: 157 W;
  • Winding type: Delta, four poles;
  • Position detection: Hall effect sensors.
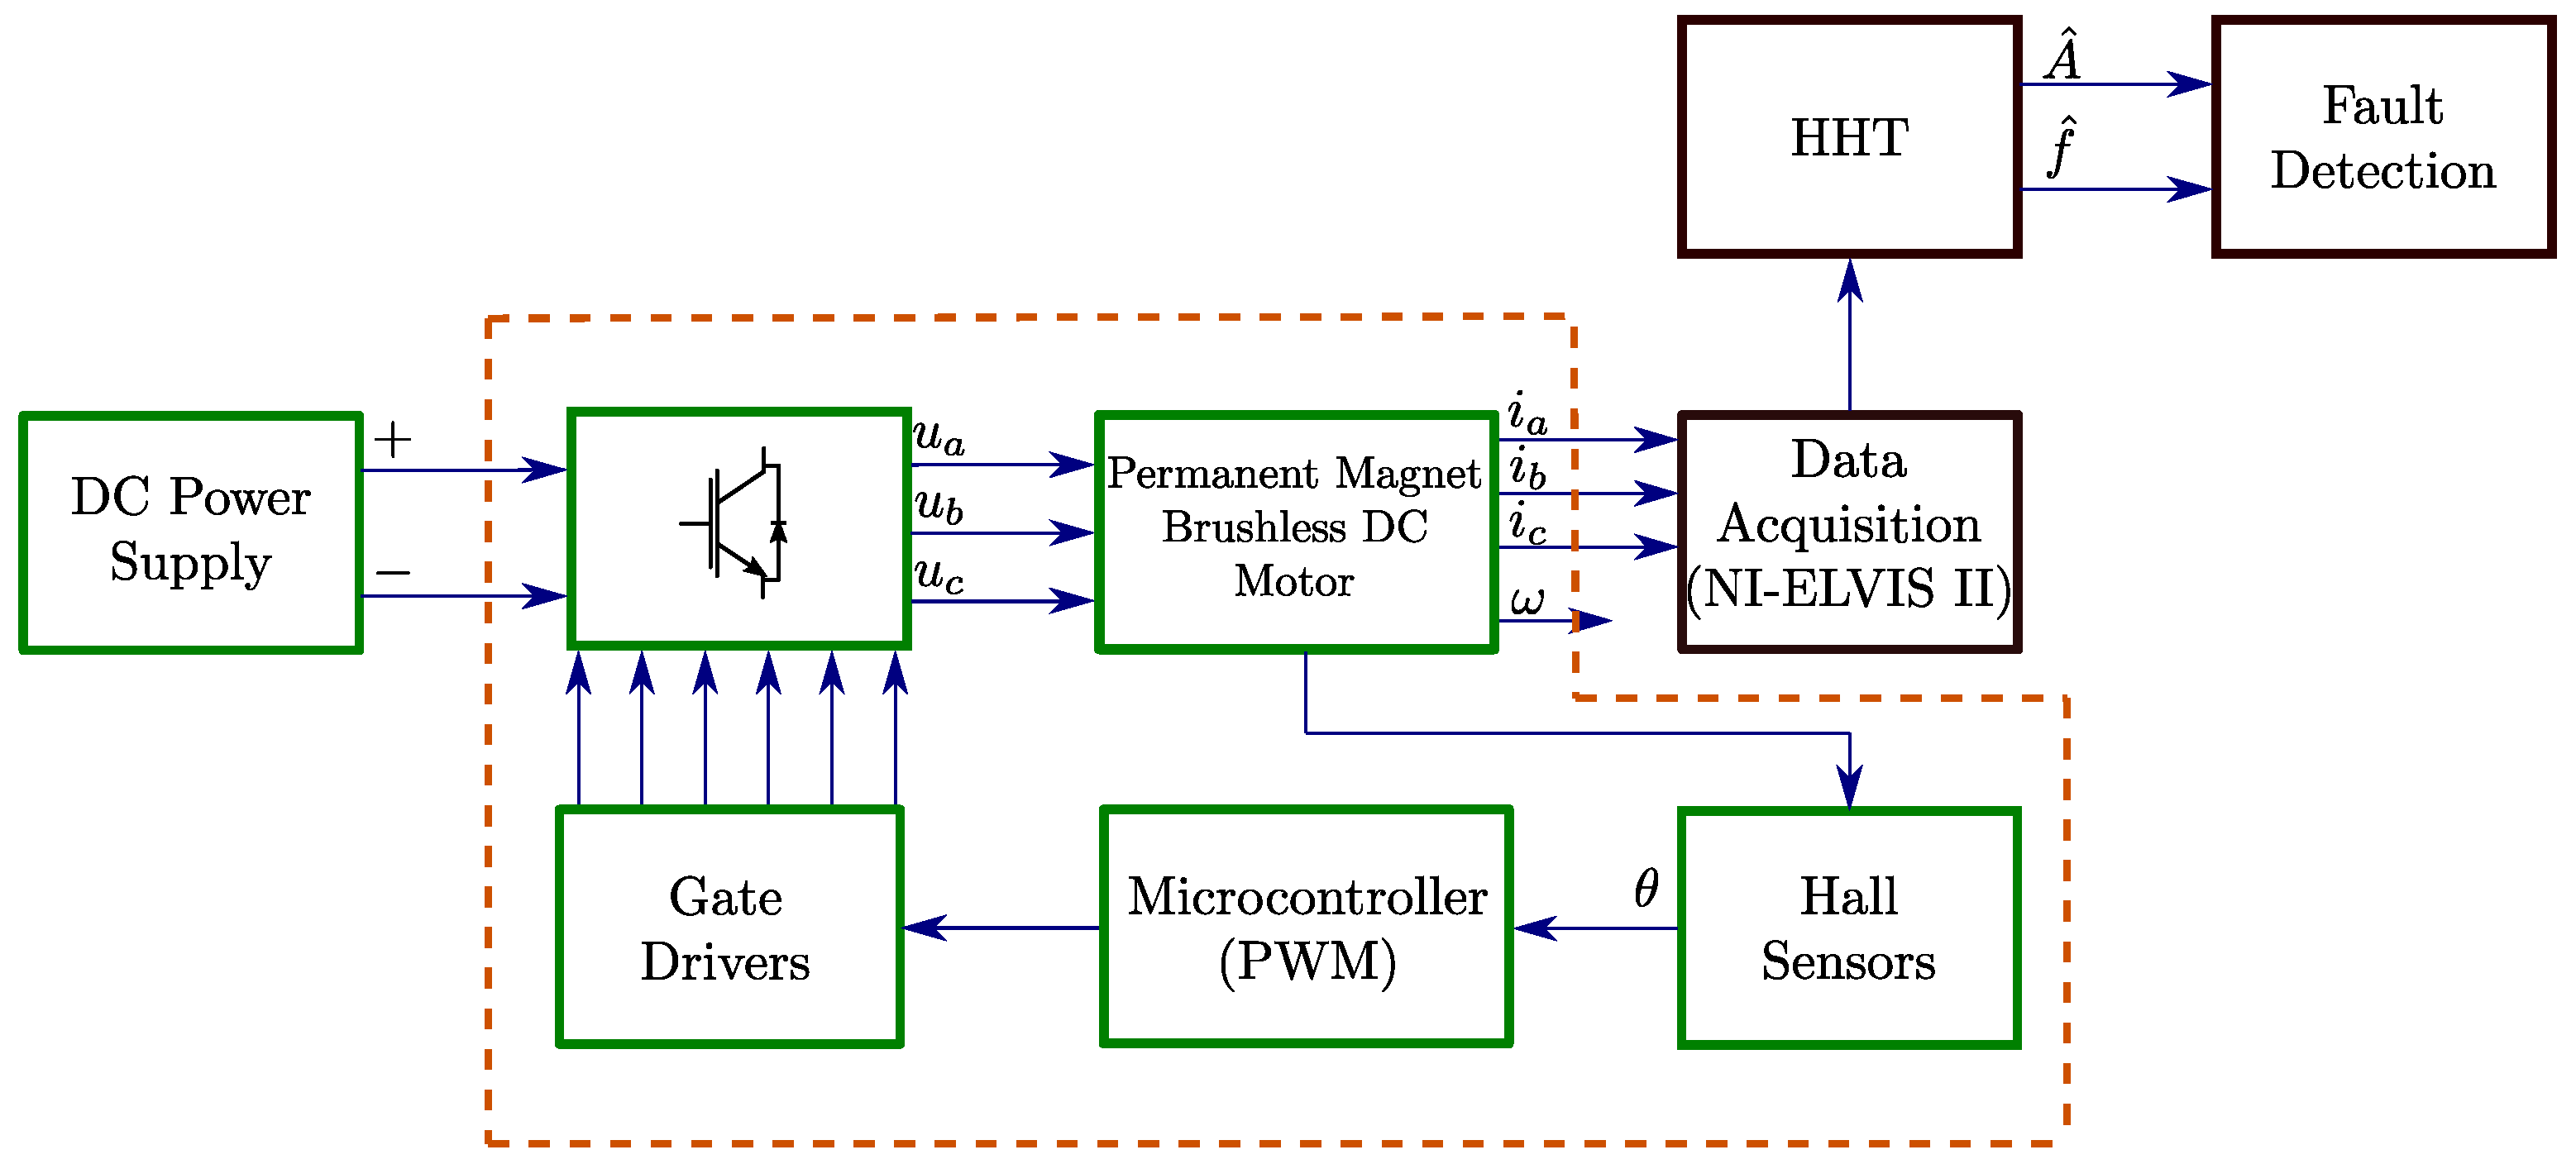
The scheme illustrated in Figure 10 outlines the methodology applied to the ESC system. Initially, a brief description of the ESC system is provided, wherein the motor’s position is determined through Hall effect sensors. The acquired position data are the foundation for generating pulse-width modulation signals compatible with a wide range of data acquisition boards. The precise duty cycle control is achieved using a microcontroller with analog input capabilities. A lookup table is constructed based on sensor data to further enhance the accuracy of the brushless DC motor’s speed and position control. This table is a reference guide, ensuring the motor receives the exact voltages necessary for precise control, as outlined in [22]. The diagram in green represents this comprehensive description of the ESC operation.
Current extraction can be conducted with any industrial sensor. ACS712 sensors sourced from Digikey, Mexico City, Mexico, are employed in this study. Subsequently, signal processing is carried out using NI-ELVIS II hardware within Matlab version 2020a. environment, facilitating the capture of current signals. The Hilbert–Huang transform can now be used as was described in Section 2 to analyze ESC signals, obtaining crucial amplitude and frequency parameters represented in the diagram in red color. Amplitude changes allow for identifying specific motor lines where the fault is present. Thus, a non-balanced three-phase system has a consequence of overheating present in power devices. Moreover, frequency changes reduce the speed and low torque the machine delivers. This approach represents a straightforward implementation and is a highly effective means of early fault detection in ESCs.
The current signals extracted from the physical system are denoted by i a , i b , i c . u a , u b , and u c , which are the supply voltages from ESC. θ represents motor’s position, ω represents the motor’s speed, A ^ is the estimated currents’ amplitude, and f ^ are the estimated frequencies. If the error exceeds the established threshold, a power line failure exists. The Hilbert–Huang transform is an effective method since it does not need any signal parameter. These parameters will be estimated and then a damaged system can be detected by comparing both signal groups.
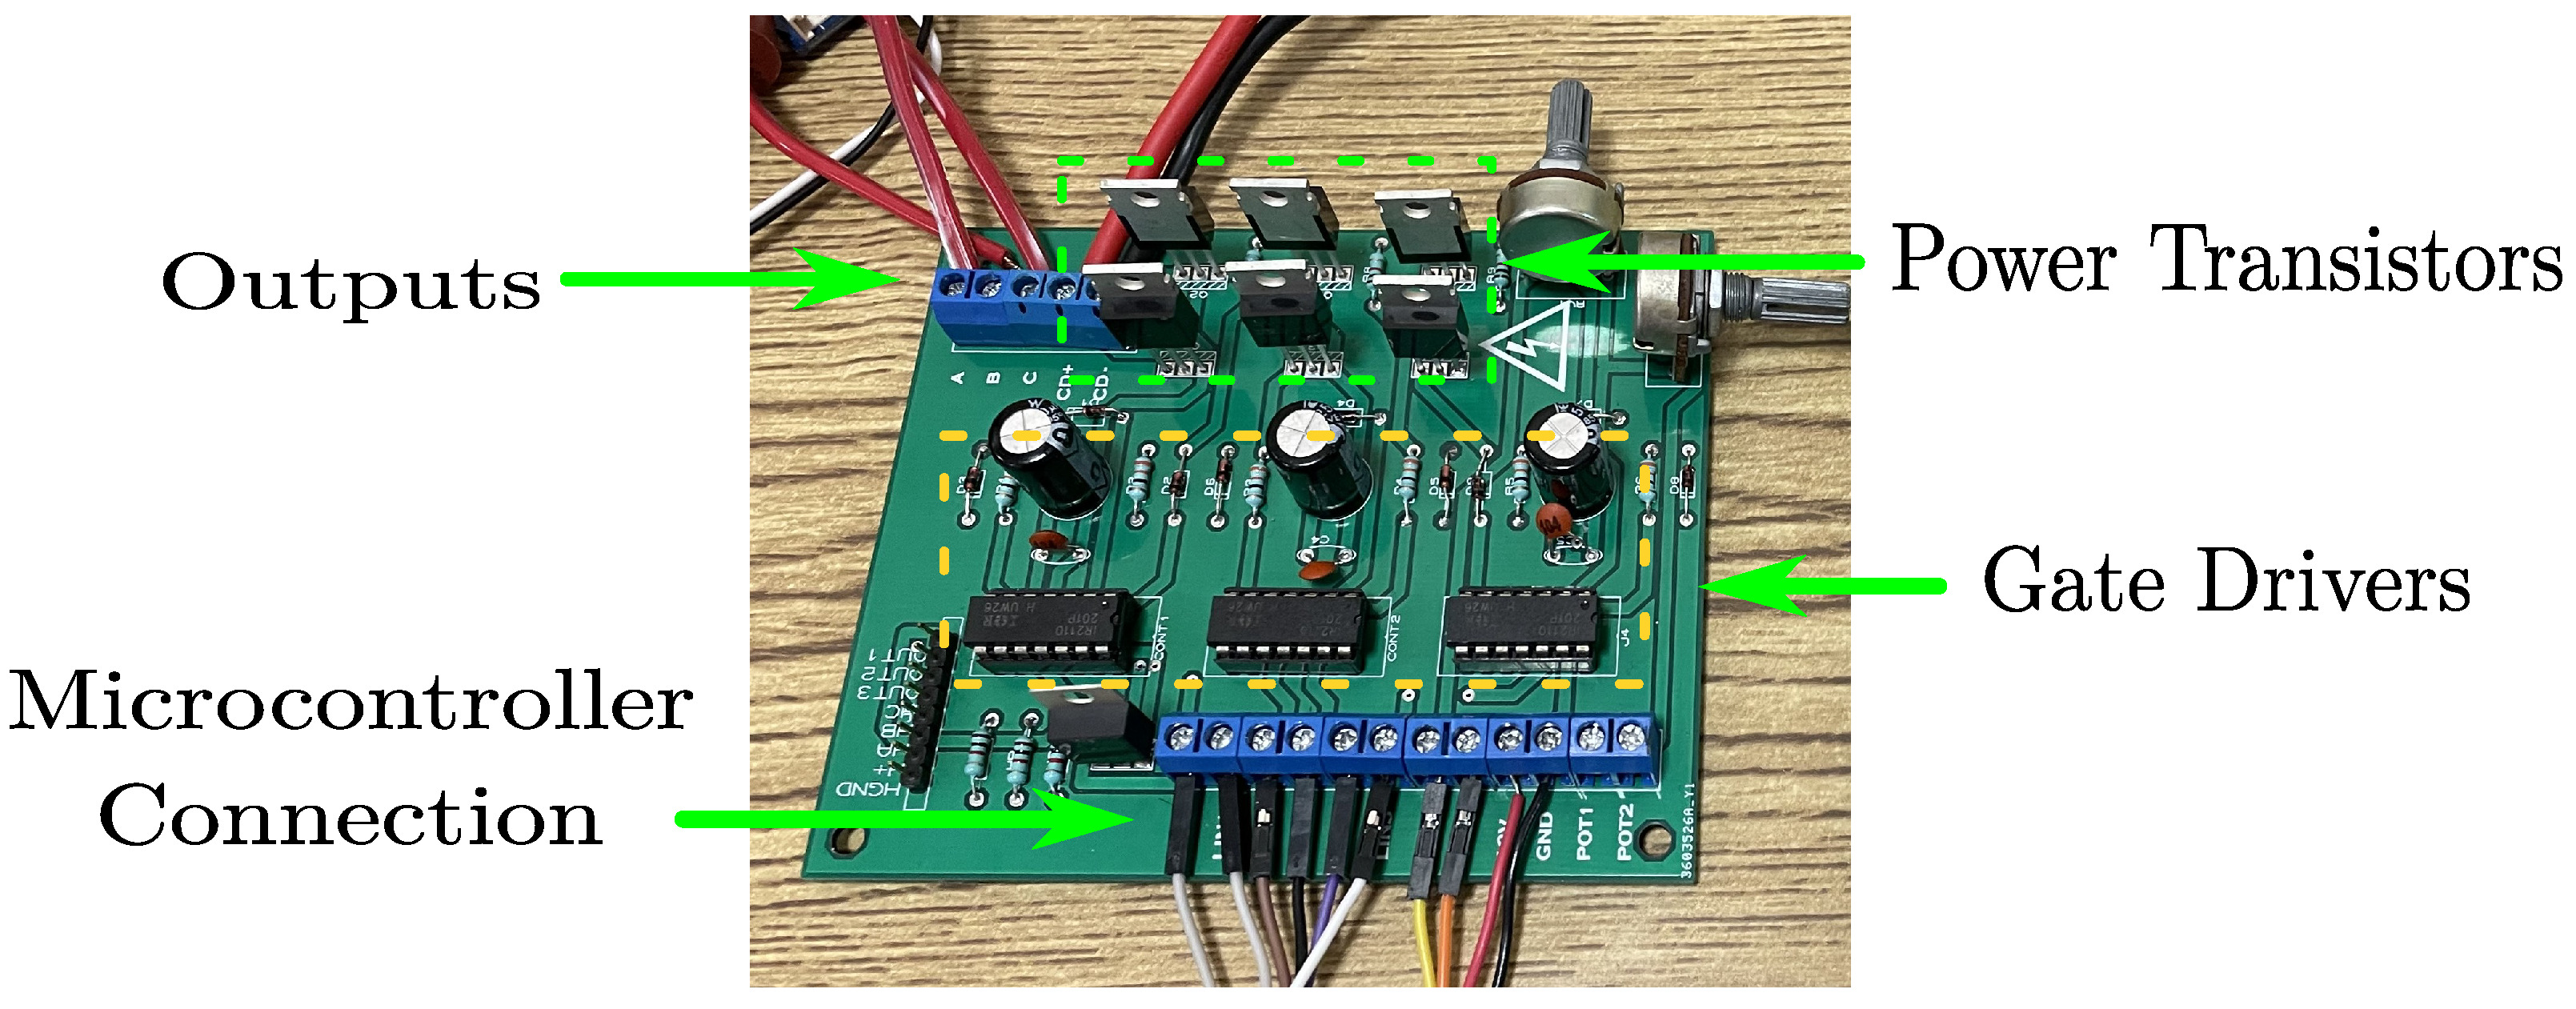
In most modern systems where electrical motors are employed, control panels concentrate and distribute connection devices, requiring qualified personnel to realize maintenance tasks. In this context, the information of these systems is often given through interfaces where data access is restricted. Nevertheless, physical connections are always available to collect electrical data with any device [10]. So, for this study, Figure 11 shows the physical ESC. A pair of switches control each phase of the system, which means that any transistor could present failure at any time. In the experimental test conducted on a healthy system, no irregularities in motor operation were detected. However, when dealing with a damaged system, the brushless motor exhibits noticeable vibrations and a significant speed reduction. A thorough examination shows that a specific transistor tends to experience overheating issues that directly affect line A.
In the context of brushless DC machines, parameter changes are common in motor control devices due to speed manipulation. As the speed increases or decreases, amplitudes and frequencies will be affected in each transition. The Hilbert–Huang transform can adapt to these changes; the EMD decomposes the signal in IMFs, allowing the fundamental components at any voltage range to always be the focus. In the same way, instantaneous frequency can capture disparities at any motor’s speed. The main ESC features used in experimental stages are described as follows.
  • Voltage range: 12 V–300 V;
  • Nominal current: 5 A;
  • Switches: MOSFET (IRF840);
  • Bootstrap-Source: 12 V;
  • PWM generation: At-Mega328;
  • Control: Manual mode.
Several tests were performed with different voltages. Equation (10) is a reference to determine frequencies corresponding to the voltages and currents. This formula can be employed for each experimental test case to calculate the waited speed through the system’s estimated frequency and number of pair poles.
ω = 60 f p
The motor’s speed is represented by ω in rpm, f is the signal frequency in Hertz, and 
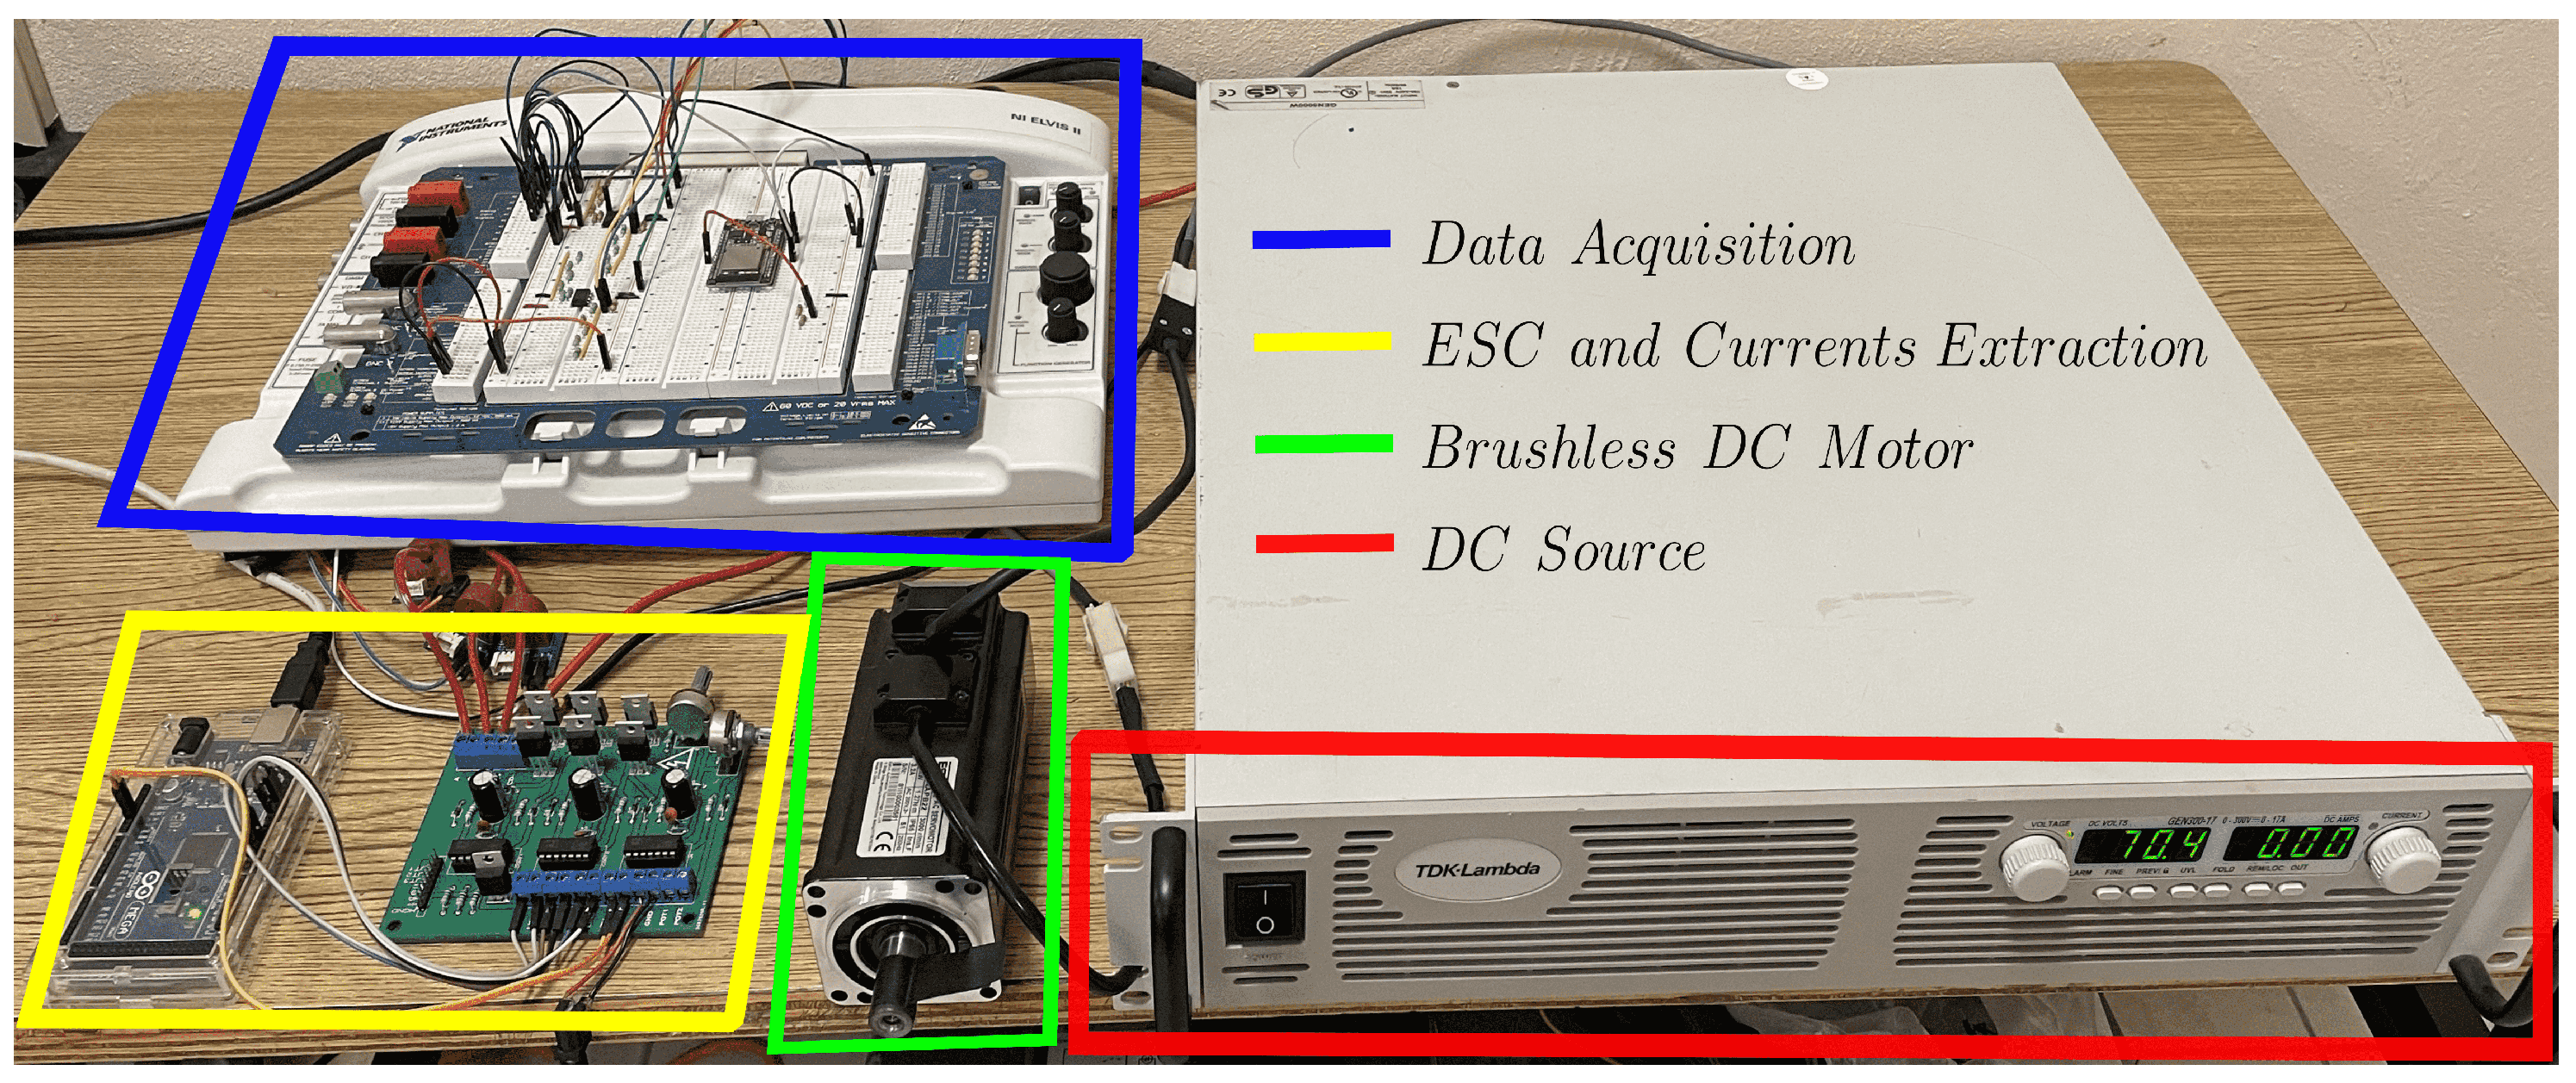
p is the number of motor pole pairs. Physical tests aim to extract current signals from a device that is in good condition and a damaged circuit. When signals are obtained, multiple harmonic components are observed. Figure 12 shows physical devices for the experimental stage.

4. Experimental Results and Discussion

The current signals extracted from the brushless DC motor were processed firstly using the EMD to detect the main component current signal, suppressing the oscillating signals in the system. The EMD allows focus on the main signal and a clear view of the optimal system conditions. In Figure 13, the motor current signals corresponding to phases A, B, and C are presented. Upon closer signal analysis in Figure 13a–c, key patterns and characteristics of a well-functioning brushless DC motor can be identified. These features include a smooth and stable current in the phases, a balanced distribution of load among the phases, and the absence of significant peaks or anomalies in the signals. These are essential indicators of optimal motor operation, providing a fundamental reference for detecting potential issues or faults, in accordance with (4).

4.1. Fault Detection for the First ESC

As previously described, once the current signals have been obtained, the next step involves estimating the amplitude values for each current signal. After applying the EMD, maximums are computed for each signal. Due to slight variations, the average is computed, obtaining the estimated amplitude values to be compared In Figure 14 where A ^ i a , A ^ i b , and   A ^ i c are the estimated amplitudes and A ^ i a ¯ , A ^ i b ¯ , and   A ^ i c ¯ denote averaged amplitudes as depicted in Figure 14a–c.
In this case, the signals exhibit minor variations, which are characteristic of regular motor operation. These fluctuations reflect the inherent dynamics of a brushless DC motor under normal operating conditions. These variations are typically part of the expected behavior of the system. They are influenced by load, rotational speed, and other operational parameters. Analyzing the instantaneous and averaged frequencies is essential to assess these signals. These frequencies provide crucial insights into the electrical system’s rotational speed and inherent oscillations. Figure 15 denotes f ^ i a , f ^ i b , and   f ^ i c and f ^ i a ¯ , f ^ i b ¯ , and   f ^ i c ¯ , These signals shown in Figure 15a–c serve as exemplary references for the regular operation of the BLDC motor.

4.2. Fault Detection for the Second ESC

In the second experimental stage, the focus shifted to examining the brushless DC motor behavior under different voltages, mainly when a malfunctioning ESC introduced anomalies. As previously discussed, the primary objective was to assess how the motor and ESC would interact under these altered circumstances. This stage allowed for a more comprehensive systemic response exploration of abnormalities. Once again, three current signals, represented in Figure 16, were extracted and analyzed. These signals provided insights into the motor’s performance when subjected to ESC-related issues. Unlike the first experimental stage, where the motor operated optimally, this stage introduced controlled deviations to simulate real-world scenarios where ESCs might malfunction or experience problems. By studying the signals in Figure 16a–c, patterns and characteristics associated with motor behavior under ESC anomalies became apparent. These included irregularities in the current waveforms, unexpected fluctuations, and potential phase imbalances.
As observed in the amplitude graphs depicted in Figure 17, where A ^ i a d , A ^ i b d , and   A ^ i c d represent the estimated amplitudes and A ^ i a d ¯ , A ^ i b d ¯ , and   A ^ i c d ¯ denote the averaged amplitudes, as shown in Figure 17a; phase-A exhibits a distinct behavior. This behavior indicates anomalies within the electronic speed controller. Despite these irregularities, the motor continues to operate at a significantly reduced efficiency level, as evident in Figure 17b,c. The power consumption increases, leading to an imbalance in the system and a decrease in the motor’s efficiency. These observations indicate an ESC malfunction, demonstrating the capability of this approach to detect and diagnose issues in the brushless DC motor drive system.
By analyzing the Hilbert Transform and obtaining its frequency components, depicted in Figure 18, a significant alteration is observed across all frequencies shown in Figure 18a–c, with a reduction from reference value (26.5 Hz) to 23.1 Hz presenting a 12.8% error. Additionally, through Equation (7), a reference value of 795 rpm was reduced to 690 rpm in the motor’s speed. Through this evaluation, it becomes evident that there is a fault in the power stage’s feed line. These results show the usefulness of the Hilbert–Huang transform in detecting early faults and identifying potential issues in the brushless DC motor system.
Finally, each test datum is compared as is shown in Table 3, which displays the estimated current amplitude values for each voltage operation range and the three–phase system error, and Table 4 shows the frequencies computed in both systems. The detection of a fault in phase A is demonstrated, characterized by an anomaly in amplitude, resulting in a reduction in motor speed and, consequently, in the frequency of all phases. Additionally, this fault increases current consumption as the system compensates for the reduced motor performance, as indicated by the estimated amplitude. This comprehensive analysis effectively highlights the capability of the proposed method for detecting and diagnosing anomalies in the brushless DC motor drive system.
The results demonstrate the proposed method’s effectiveness in detecting early faults in ESCs based on the Hilbert–Huang transform. The main advantage of this approach is the adaptability to signal variations over time since the current extraction can be made at any motor’s speed. The control devices present these changes at any speed manipulation and additional signals present can be detected with the Hilbert–Huang transform. The signal measurements were conducted at 10 KHz frequency, considering a 1s time window to apply the EMD. The selected time was chosen to capture a wide range of frequencies, which is important in the fault detection context. A longer window time allows more data acquisition and thus, higher resolution is obtained for comparison purposes. The approaches mentioned in [23,24] based on the fast Fourier transform and wavelet analysis to detect faults through vibration analysis present the disadvantage of high sensitivity to noise, requiring filters to eliminate non-desired frequencies. In addition to this issue, the bandwidth is a limitation for present signal variations, where the solution is the integration of both techniques, increasing computational cost. Moreover, although AI provides adaptability for fault detection in motor systems, processing speed also represents an issue, as mentioned in [25]. The proposed approach in this study can solve these problems since the Hilbert–Huang transform does not need an additional process. The EMD decomposes each signal component in an adaptive process that can detect additional components present in the signal. Moreover, bandwidth is not a concern when using instantaneous frequency, as it can detect rapid and recent changes occurring in the signal. However, it is important to notice that these tools could present advantages due to their integration. Nowadays, improved algorithms have been developed to mix FFT with IA for complex signals for their processing. Artificial intelligence is a valuable tool that can be integrated with classical tools such as Hilbert–Huang transform, FFT, and wavelet analysis [31,32,33,34].

5. Conclusions

In this study, a novel approach based on the Hilbert–Huang transform was developed for early fault detection in brushless DC motor drivers. First, current signals were extracted from the system without previous knowledge of its state. Then, amplitude and frequency parameters were estimated using the Hilbert–Huang transform. The international electrical standards were used to establish a threshold by calculating the error between the three-phase currents and the motor’s performance. After computing the error, the imbalance threshold should be below 10 percent. Once the parameter error is calculated, a healthy or damaged system is identified, and early faults can be identified in the specific motor line. Rigorous simulations and experimental tests in different voltage conditions validate the proposed method. The early faults detected in the system involve the imbalance in power supply due to discrepancies in estimated amplitudes; this problem also results in torque reduction and increasing current demand. Also, the frequency diminution identifies the reduction in motor speed. These issues in the driver occurred due to power transistor damages. The Hilbert–Huang transform presents advantages over signal variations. However, although the EMD can decompose each signal component, a filter process is recommended. The approach proposed in this study has the advantage that data can be collected from motor drivers without stopping their operation at any time window, allowing for early fault detection in motor drivers. The platform presented in this study can be used with other important techniques for detecting faults, such as Fourier transform, artificial intelligence, FFT, and wavelet analysis for future work, which will be implemented to improve the systems for fault detection.

Author Contributions

Conceptualization, D.M.-A., F.B.-C., I.R.-C., E.E.-C. and H.A.G.; methodology, D.M.-A., E.E.-C., H.A.G. and A.C.-P.; software, D.M.-A., E.E.-C. and A.C.-P.; validation, D.M.-A., E.E.-C. and H.A.G.; formal analysis, D.M.-A., F.B.-C., I.R.-C., E.E.-C., H.A.G. and A.C.-P.; investigation, D.M.-A., F.B.-C., I.R.-C., E.E.-C., H.A.G. and A.C.-P.; resources, F.B.-C. and I.R.-C.; data curation, D.M.-A., E.E.-C. and A.C.-P.; writing—original draft preparation, D.M.-A., F.B.-C. and I.R.-C.; writing—review and editing, D.M.-A., F.B.-C., I.R.-C., E.E.-C. and H.A.G.; visualization, D.M.-A., A.C.-P., E.E.-C. and H.A.G.; supervision, F.B.-C., I.R.-C. and H.A.G.; project administration, F.B.-C.; funding acquisition, F.B.-C. and I.R.-C. All authors have read and agreed to the published version of the manuscript.

Funding

This research received no external funding.

Data Availability Statement

The original contributions presented in the study are included in the article, further inquiries can be directed to the corresponding author.

Acknowledgments

The authors would like to thank Consejo Nacional de Humanidades, Ciencias y Tecnologías (CONAHCYT), for support provided to developing this work.

Conflicts of Interest

The authors declare no conflicts of interest.

References

  1. Anand, A.; Affijulla, S. Hilbert-Huang transform based fault identification and classification technique for AC power transmission line protection. Int. Trans. Electr. Energy Syst. 2020, 30, e12558. [Google Scholar] [CrossRef]
  2. Nsaif, Y.M.; Hossain Lipu, M.S.; Hussain, A.; Ayob, A.; Yusof, Y.; Zainuri, M.A.A. A novel fault detection and classification strategy for photovoltaic distribution network using improved Hilbert–Huang transform and ensemble learning technique. Sustainability 2022, 14, 11749. [Google Scholar] [CrossRef]
  3. Lu, Z. Review on mechano-electronic device fault diagnosis based on Hilbert-Huang Transformation. J. Phys. Conf. Ser. 2022, 2351, 012033. [Google Scholar] [CrossRef]
  4. Jafari, A.; Faiz, J.; Jarrahi, M.A. A simple and efficient current-based method for interturn fault detection in BLDC motors. IEEE Trans. Ind. Inform. 2020, 17, 2707–2715. [Google Scholar] [CrossRef]
  5. Beltran-Carbajal, F.; Esquivel-Cruz, J.E.; Yañez-Badillo, H.; Rivas-Cambero, I.D.J.; Sotelo, D.; Sotelo, C. Multiple-Frequency Force Estimation of Controlled Vibrating Systems with Generalized Nonlinear Stiffness. Mathematics 2023, 11, 2838. [Google Scholar] [CrossRef]
  6. Torabi, M.; Beromi, Y.A. An effective Hilbert-Huang transform-based approach for dynamic eccentricity fault diagnosis in double-rotor double-sided stator structure axial flux permanent magnet generator under various load and speed conditions. Turk. J. Electr. Eng. Comput. Sci. 2023, 31, 53–76. [Google Scholar] [CrossRef]
  7. Al-Greer, M.; Bashir, I.; Demirel, A.; Keysan, O. Autonomous fault detection and diagnosis for permanent magnet synchronous motors using combined variational mode decomposition, the Hilbert-Huang transform, and a convolutional neural network. Comput. Electr. Eng. 2023, 110, 108894. [Google Scholar]
  8. Huang, N.E.; Shen, Z.; Long, S.R.; Wu, M.C.; Shih, H.H.; Zheng, Q.; Yen, N.C.; Tung, C.C.; Liu, H.H. The empirical mode decomposition and the Hilbert spectrum for nonlinear and non-stationary time series analysis. Proc. R. Soc. Lond. A 1998, 454, 903–995. [Google Scholar] [CrossRef]
  9. Shifat, T.A.; Hur, J.W. An effective stator fault diagnosis framework of BLDC motor based on vibration and current signals. IEEE Access 2020, 8, 106968–106981. [Google Scholar] [CrossRef]
  10. Khaneghah, M.Z.; Alzayed, M.; Chaoui, H. Fault Detection and Diagnosis of the Electric Motor Drive and Battery System of Electric Vehicles. Machines 2023, 11, 713. [Google Scholar] [CrossRef]
  11. Lee, C.Y.; Hung, C.H. Feature ranking and differential evolution for feature selection in brushless DC motor fault diagnosis. Symmetry 2021, 13, 1291. [Google Scholar] [CrossRef]
  12. Lee, C.Y.; Hung, C.H.; Le, T.A. Intelligent fault diagnosis for BLDC with incorporating accuracy and false negative rate in feature selection optimization. IEEE Access 2022, 10, 69939–69949. [Google Scholar] [CrossRef]
  13. Yang, L.; Zhu, Z.Q.; Gong, L.; Bin, H. PWM switching delay correction method for high-speed brushless DC drives. IEEE Access 2021, 9, 81717–81727. [Google Scholar] [CrossRef]
  14. Yang, L.; Zhu, Z.Q.; Bin, H.; Gong, L. Spectral Analysis and Sideband Harmonic Cancellation of Six-Step Operation with Low Carrier–Fundamental Frequency Ratio for High-Speed Brushless DC Drives. IEEE Trans. Ind. Electron. 2020, 68, 7778–7792. [Google Scholar] [CrossRef]
  15. Papathanasopoulos, D.A.; Giannousakis, K.N.; Dermatas, E.S.; Mitronikas, E.D. Vibration monitoring for position sensor fault diagnosis in brushless dc motor drives. Energies 2021, 14, 2248. [Google Scholar] [CrossRef]
  16. Bin, L.; Abrar, M.; Abdul Muqeet, H.; Shahzad, M.; Zulfiqar, M.; Hussain, M.M. A novel approach to design of a power factor correction and total harmonic distortion reduction-based BLDC motor drive. Front. Energy Res. 2023, 10, 963889. [Google Scholar] [CrossRef]
  17. Saha, S.; Kar, U. Signal-Based Position Sensor Fault Diagnosis Applied to PMSM Drives for Fault-Tolerant Operation in Electric Vehicles. World Electr. Veh. J. 2023, 14, 123. [Google Scholar] [CrossRef]
  18. Ren, K.; Chen, H.; Sun, H.; Wang, Q.; Sun, Q.; Jin, B. Design and Analysis of a Permanent Magnet Brushless DC Motor in an Automotive Cooling System. World Electr. Veh. J. 2023, 14, 228. [Google Scholar] [CrossRef]
  19. Orlowska-Kowalska, T.; Wolkiewicz, M.; Pietrzak, P.; Skowron, M.; Ewert, P.; Tarchala, G.; Krzysztofiak, M.; Kowalski, C.T. Fault diagnosis and fault-tolerant control of PMSM drives–state of the art and future challenges. IEEE Access 2022, 10, 59979–60024. [Google Scholar] [CrossRef]
  20. Beltran-Carbajal, F.; Silva-Navarro, G. A fast parametric estimation approach of signals with multiple frequency harmonics. Electr. Power Syst. Res. 2017, 144, 157–162. [Google Scholar] [CrossRef]
  21. Beltran-Carbajal, F.; Tapia-Olvera, R. An adaptive neural online estimation approach of harmonic components. Electr. Power Syst. Res. 2020, 186, 106406. [Google Scholar] [CrossRef]
  22. Andrade, D.M.; Cambero, I.D.J.R.; Cruz, J.E.E.; Núñez, J.H.A. Conmutación de una Máquina Brushless de Corriente Directa Motor/Generador Eléctrico (Commutation of a Current Direct Brushless Machine Motor/Electric Generator). Pist. Educ. 2021, 43. Available online: https://pistaseducativas.celaya.tecnm.mx/index.php/pistas/article/view/2661 (accessed on 25 March 2024).
  23. Vázquez, M.A.S.; Salas, R.A.; Pina, F.J.V.; Garcıa, M.A.G.; Galindo, V.M.C.; Azúa, H.M. Detección de Fallas Mecánicas en el Motor de Inducción Trifásico. Available online: https://pistaseducativas.celaya.tecnm.mx/index.php/pistas/article/view/2962/2240 (accessed on 25 March 2024).
  24. Velasco, E.R.; Piña, F.J.V.; Malanche, J.A.R.; Zárate, C.H.S. Detección de Fallas de Cortocircuito en Motores de Inducción Trifásicos (Short-Circuit Fault Detection in Three Phase Induction Motors). Pist. Educ. 2022, 44. Available online: https://pistaseducativas.celaya.tecnm.mx/index.php/pistas/article/view/2962 (accessed on 25 March 2024).
  25. Wang, L.H.; Zhao, X.P.; Wu, J.X.; Xie, Y.Y.; Zhang, Y.H. Motor Fault Diagnosis Based on Short-time Fourier Transform and Convolutional Neural Network. Chin. J. Mech. Eng. 2017, 30, 1357–1368. [Google Scholar] [CrossRef]
  26. Piña, F.J.V.; Salas, R.Á. Algoritmo robusto para el diagnóstico de fallas eléctricas en el motor de inducción trifásico basado en herramientas espectrales y ondeletas. Rev. Iberoam. Automática Informática Ind. 2015, 12, 292–303. [Google Scholar] [CrossRef]
  27. Gmati, B.; Ben Rhouma, A.; Meddeb, H.; Khojet El Khil, S. Diagnosis of Multiple Open-Circuit Faults in Three-Phase Induction Machine Drive Systems Based on Bidirectional Long Short-Term Memory Algorithm. World Electr. Veh. J. 2024, 15, 53. [Google Scholar] [CrossRef]
  28. Diario Oficial de la Federación. Publication Number: 836. 2021. Available online: https://dof.gob.mx/2021/CRE/CRE_311221.pdf (accessed on 25 March 2024).
  29. Krause, P.C.; Wasynczuk, O.; Sudhoff, S.D. Analysis of Electric Machinery and Drive Systems; Wiley: Danvers, MA, USA, 2013. [Google Scholar]
  30. Rashid, M.H. Power Electronics: Circuits, Devices, and Applications; Pearson: Harlow, UK, 2009. [Google Scholar]
  31. Shah, F.A.; Tantary, A.Y.; Zayed, A.I. A convolution-based special affine wavelet transform. Integral Transform. Spec. Funct. 2021, 32, 780–800. [Google Scholar] [CrossRef]
  32. Moro, S.; Takamatsu, K. A method to find periodic solutions in nonautonomous nonlinear circuits using Haar wavelet transform. Nonlinear Theory Its Appl. IEICE 2020, 11, 561–570. [Google Scholar] [CrossRef]
  33. Xi, Y.; Wu, X.; Wu, Y.; Cai, Y.; Zhao, Y. A novel algorithm for multi-signals deinterleaving and two-dimensional imaging recognition based on short-time PRI transform. In Proceedings of the 2019 Chinese Automation Congress (CAC), Hangzhou, China, 22–24 November 2019; pp. 4727–4732. [Google Scholar]
  34. Saigre-Tardif, C.; Faqiri, R.; Zhao, H.; Li, L.; del Hougne, P. Intelligent meta-imagers: From compressed to learned sensing. Appl. Phys. Rev. 2022, 9, 011314. [Google Scholar] [CrossRef]
Figure 1. Comparative of fault detection methods based on the Hilbert–Huang transform, fast Fourier transform, and wavelet analysis.
Wevj 15 00159 g001
Figure 2. Simulation of a three–phase current system with four unknown harmonic components for the illustrative case study.
Wevj 15 00159 g002
Figure 3. Schematic representation of the proposed method for early fault identification in electronic speed controllers based on the Hilbert–Huang transform.
Wevj 15 00159 g003
Figure 4. Oscillating components of the estimated current signals extracted by performing adaptive empirical mode decomposition. (a) Component i ^ a i m f 1 at 500 Hz frequency. (b) Component i ^ a i m f 2 at 200 Hz frequency. (c) Component i ^ a i m f 3 at 100 Hz frequency.
Wevj 15 00159 g004
Figure 5. Oscillating components of the estimated current signals extracted by performing adaptive empirical mode decomposition. (a) Component i ^ b i m f 1 at 500 Hz frequency. (b) Component i ^ b i m f 2 at 200 Hz frequency. (c) Component i ^ b i m f 3 at 100 Hz frequency.
Wevj 15 00159 g005aWevj 15 00159 g005b
Figure 6. Oscillating components of the estimated current signals extracted by performing adaptive empirical mode decomposition. (a) Component i ^ c i m f 1 at 500 Hz frequency. (b) Component i ^ c i m f 2 at 200 Hz frequency. (c) Component i ^ c i m f 3 at 100 Hz frequency.
Wevj 15 00159 g006
Figure 7. Primary signals representing the balanced three–phase system. (a) Current of Winding a. (b) Current of Winding b. (c) Current of Winding c.
Wevj 15 00159 g007
Figure 8. Frequency parameters calculated by applying the Hilbert transform to the extracted oscillatory components from the signal i a b c ^ are compared with the original reference signals. (a) First component frequencies i a . (b) Second component frequencies i b . (c) Last component frequencies i c .
Wevj 15 00159 g008
Figure 9. Amplitude parameters calculated by applying the Hilbert Transform to the extracted oscillatory components from the signal i a b c ^ are compared with the original reference signals. (a) First component amplitude i a . (b) Second component amplitude i b . (c) Last component amplitude i c .
Wevj 15 00159 g009
Figure 10. Block diagram for current signal extraction in a complete permanent magnet brushless DC motor drive system.
Wevj 15 00159 g010
Figure 11. Experimental 6-pulse electronic speed controller for brushless DC motor evaluation.
Wevj 15 00159 g011
Figure 12. Test bench for current data acquisition in brushless motors used for ESC fault diagnosis.
Wevj 15 00159 g012
Figure 13. Fundamental currents extracted from the first ESC obtained using the empirical mode decomposition (EMD). (a) Phase–A current signal processed with EMD. ( i a ) (b) Phase–B current signal processed with EMD. ( i b ) (c) Phase–C current signal processed with EMD. ( i c ).
Wevj 15 00159 g013
Figure 14. Amplitude parameters calculated by applying the Hilbert Transform to the extracted oscillatory components from the healthy ESC signals. (a) Estimated amplitude of the oscillating component i a . (b) Estimated amplitude of the oscillating component i b . (c) Estimated amplitude of the oscillating component i c .
Wevj 15 00159 g014
Figure 15. Frequency parameters calculated by applying the Hilbert Transform to the extracted oscillatory components from the healthy ESC signals. (a) Estimated frequency of the oscillating component i a . (b) Estimated frequency of the oscillating component i b . (c) Estimated frequency of the oscillating component i c .
Wevj 15 00159 g015
Figure 16. Estimated principal currents using the empirical mode decomposition method extracted from the damaged ESC line power supply. (a) Signal of Phase–A Current extracted from damaged ESC and processed using the empirical mode decomposition method i a . (b) Signal of Phase–B Current extracted from damaged ESC and processed using the empirical mode decomposition method i b . (c) Signal of Phase–C Current extracted from damaged ESC and processed using the empirical mode decomposition method i c .
Wevj 15 00159 g016
Figure 17. Amplitude parameters calculated by applying the Hilbert Transform to the extracted oscillatory components from the damaged ESC signals. (a) Estimated amplitude of the oscillating component i a . (b) Estimated amplitude of the oscillating component i b . (c) Estimated amplitude of the oscillating component i c .
Wevj 15 00159 g017
Figure 18. Frequency parameters calculated by applying the Hilbert Transform to the extracted oscillatory components from the healthy ESC Signals. (a) Estimated frequency of the oscillating component i a . (b) Estimated frequency of the oscillating component i b . (c) Estimated frequency of the oscillating component i c .
Wevj 15 00159 g018aWevj 15 00159 g018b
Table 1. Summary of Early Fault Identification in ESC by Employing the proposed method.
Fault TypeFault LocationError DifferenceThreshold for Fault Identification
--(Amplitude)-
ImbalanceLine A e i a e i b e i c e  10%
Line B e i b e i a e i c e  10%
Line C e i c e i a e i b e  10%
--(Amplitude)-
TorqueLine A e i a e i b e i c e  10%
Line B e i b e i a e i c e  10%
Line C e i c e i a e i b e  10%
--(Amplitude)-
CurrentLine A e i a e i b e i c e  10%
Line B e i b e i a e i c e  10%
Line C e i c e i a e i b e  10%
Table 2. Parameter values of multiple-frequency oscillating signals i ^ calculated by applying HHT in the original signal.
ParameterOriginalEstimationError
Amplitude(A)(A)[%]
A i a 0.5 0.49−0.02
A i b 0.5 0.49−0.02
A i c 0.5 0.49−0.02
Frequency(Hz)(Hz)[%]
f i a 109.99−0.01
f i b 109.99−0.01
f i c 109.99−0.01
Table 3. Amplitude values obtained from currents analysis in healthy and damaged systems.
ParameterHealthy SystemErrorDamaged SystemError
Currents at 31 V(A)[%](A)[%]
A 1 0.1244 2.860.060243.13
A 2 0.1188 0.1265
A 3 0.1237 0.1309
Currents at 50 V(A)[%](A)[%]
A 1 0.1604 0.270.080242.38
A 2 0.1598 0.1665
A 3 0.1597 0.1709
Currents at 60 V(A)[%](A)[%]
A 1 0.1688 1.680.100234.02
A 2 0.1658 0.1765
A 3 0.1713 0.1789
Currents at 70 V(A)[%](A)[%]
A 1 0.1864 3.710.110232.05
A 2 0.1738 0.1865
A 3 0.1813 0.1899
Table 4. Frequency values obtained from currents analysis in healthy and damaged systems.
ParameterHealthy SystemDamaged System
Frequency at 31 V(Hz)(Hz)
f 1 26.5 23.1
f 2 26.4 22.2
f 3 26.9 23.37
Frequency at 50 V(Hz)(Hz)
f 1 42.3 38.72
f 2 42.4 38.71
f 3 42.6 38.87
Frequency at 60 V(Hz)(Hz)
f 1 50.5 45.35
f 2 50.4 45.28
f 3 50.9 45.37
Frequency at 70 V(Hz)(Hz)
f 1 60.3 52.46
f 2 60.4 52.45
f 3 60.8 52.51
Disclaimer/Publisher’s Note: The statements, opinions and data contained in all publications are solely those of the individual author(s) and contributor(s) and not of MDPI and/or the editor(s). MDPI and/or the editor(s) disclaim responsibility for any injury to people or property resulting from any ideas, methods, instructions or products referred to in the content.

