Abstract
It is generally agreed that green space has a positive effect on the health and well-being of urban residents. A number of papers have studied the relationship between green space and various sociodemographic characteristics; however, little is known about how perceptions of green space affect health and well-being differently between men and women. Such knowledge is significant for informing policy makers in designing urban green space to benefit the health and well-being of all people. In addition, urban greening has rarely been studied in the context of the UN 2030 Agenda and the UN New Urban Agenda. This study examines gender disparities in perceived green space and health and well-being, the effect of perceived green space, personal, and family variables on subjective health and well-being, and the interactive effects of perceived green space, personal, and family variables on health and well-being. The analyses were based on a survey of 9325 participants in 40 Chinese cities, using the Geographical Detector method. The results suggest that men tend to have a higher perception of green space but lower subjective health and well-being than women. Compared to health, well-being is more affected by perception of urban green space and personal and family factors. Perception of urban green space has a higher effect on men’s health and well-being than women’s. Women’s health and well-being tends to be more affected by personal and family factors than men’s. There are clear interactive effects of perceived green space, personal, and family variables on health and well-being. The combined effect is greater than the sum of individual effects on health and well-being, suggesting complexity in sustainable urban green space development with attention to gender equality in the context of the UN Agendas for sustainable development.
1. Introduction
In our current fight against the COVID-19 pandemic, urban greening plays an important role in reducing stress and anxiety and contributing to residents’ well-being [1]. For example, ethnic minorities in Britain have been shown to be at a greater risk of COVID-19 mortality due to poor social and economic conditions. Compared to the ethnic majority population, ethnic minorities experienced overcrowded housing with 11 times less accessible green space [2]. Urban greening in particular would help the poor neighborhood and thus enhance health equity [3,4,5]. In fact, urban greening has been widely promoted as it positively impacts residents’ physical and mental health [3]. For example, it helps to reduce psychological stress, enhance immune function, promote physical activity and social integration, and improve air quality [6,7,8,9,10,11,12]. However, the effect of urban green space on health is still inadequately understood [13]. Furthermore, this effect may vary between men and women, possibly due to differences in the perception of green spaces with regards to safety, accessibility, species diversity, and usage patterns between genders [14,15,16]. It has also been reported that the perception of urban green space has a significant impact on residents’ subjective health and well-being [17,18,19]. Yet, further studies of such an impact are needed [15,16,20,21]. While many strategies for sustainable urban greening [22] and forms of urban green equity have been developed with recognition of the different stakeholders involved, these studies have largely failed to consider gender equality in green space [23].
Furthermore, current urban greening literature rarely refers to the UN 2030 Agenda [24] and the UN New Urban Agenda (NUA) [25]. The 2030 Agenda provides guidance for countries to achieve sustainable development goals (SDGs) by 2030 [24]. Interconnected and interdependent, many of the 17 SDGs are directly or indirectly related to urban greening. For example, SDG 11 requires the provision of “universal access to safe, inclusive and accessible, green and public spaces,” as urban greening contributes to the development of sustainable, inclusive cities and communities (SDG 11) and climate actions (SDG 13). In addition, SDGs 3 and 5 stress the need to “ensure healthy lives and promote well-being for all” as well as to “achieve gender equality and empower all women”. The NUA provides a new road-map for sustainable urban development. It was designed to support the achievement of the 2030 Agenda SDGs, particularly SDG 11. As such, the NUA follows the same inclusive theme as the 2030 Agenda to ensure equity, health, and well-being for all. It is critical that sustainable urban greening is guided by these UN Agenda. The aim of this study was to examine the effect of green space perception on subjective health and well-being with attention to gender inequalities in the context of the UN Agendas. This paper specifically intends to answer three questions: (1). Are there gender differences, or other differences, in perceived green space and self-rated health and well-being? (2). How do perceived green space, personal, and family variables affect subjective health and well-being? (3). What are the interactive effects of perceived green space, personal, and family variables on subjective health and well-being? Answers to these questions will provide valuable knowledge and contribute to better understanding of sustainable urban greening that will help ensure healthy lives and well-being for all genders. There are many definitions of perception. Our definition here is the understanding or recognition of something, a mental impression. “Perceived” means “recognized through the senses” (https://www.merriam-webster.com/dictionary/perceived). It is used in this paper interchangeably with “recognized” and “recognition” to refer to the overall perception of green space quality that includes perceived accessibility, size, authenticity, and usefulness of the green space.
2. Methods
2.1. Study Design
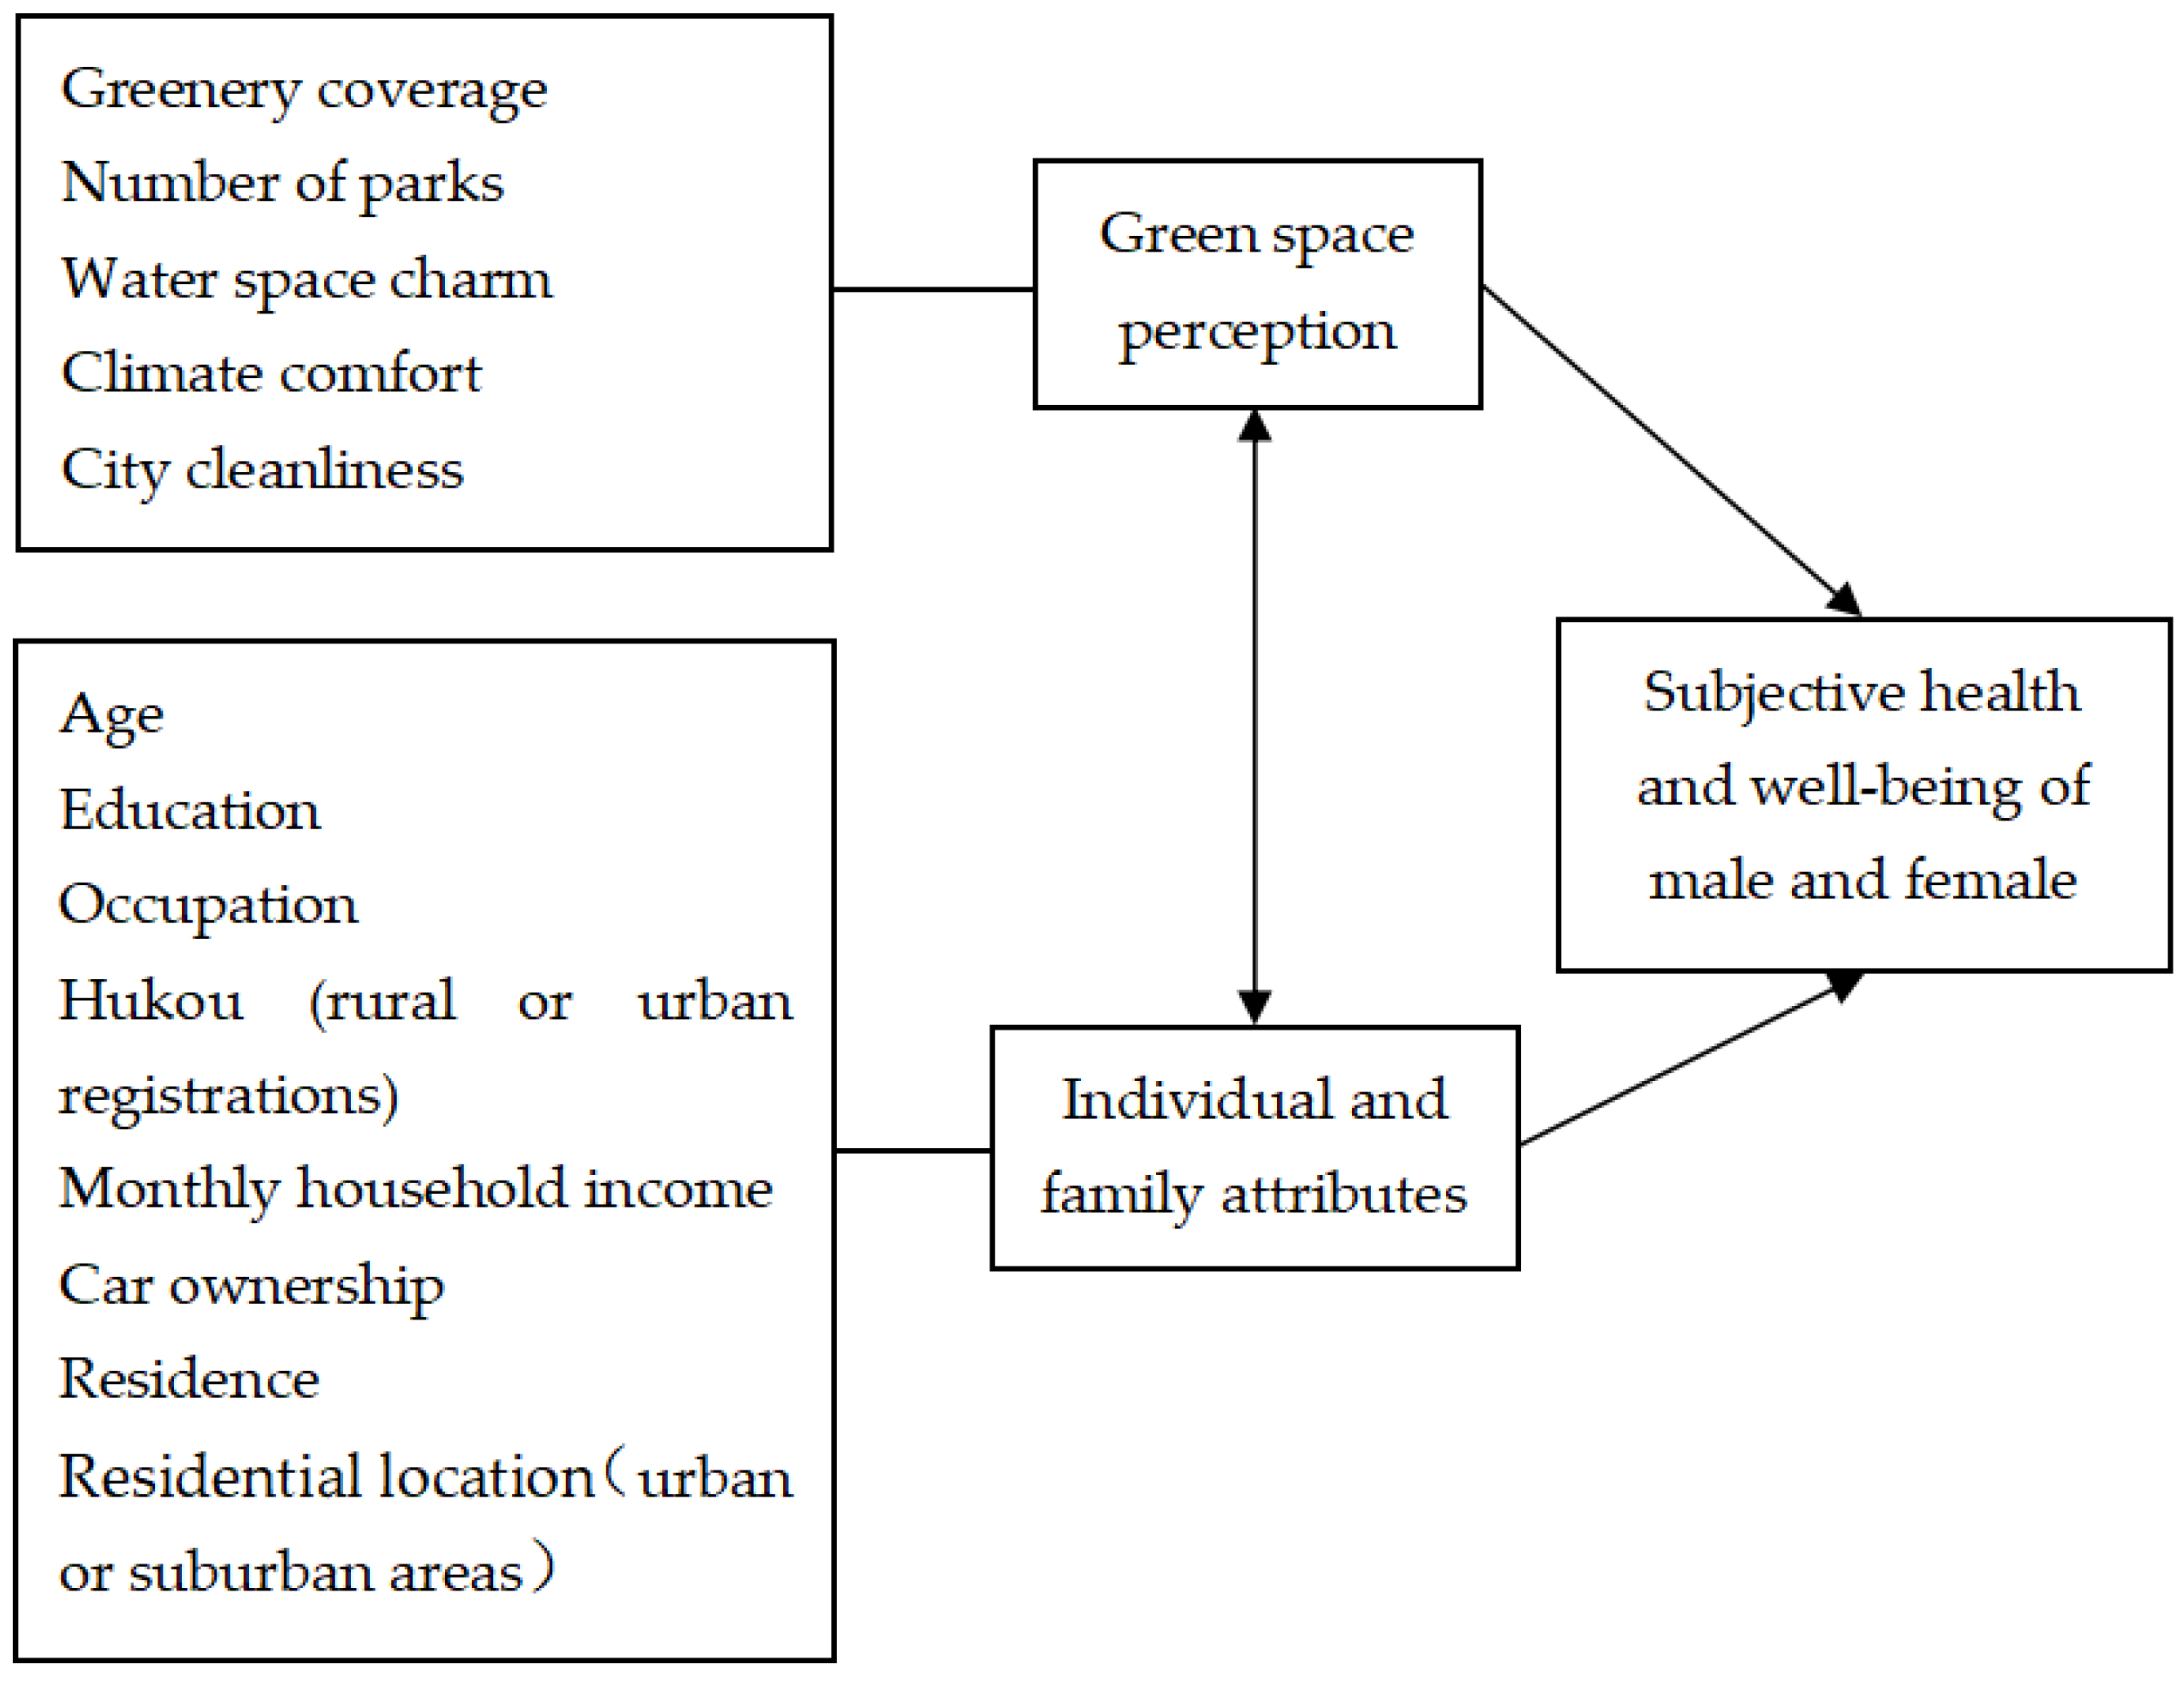
According to the ecological model of health, residents’ subjective health and well-being are influenced by various factors such as the built environment, social environment, and individual and family attributes, which may interact in a complicated process [26,27,28]. This study was designed to consider these factors (Figure 1). Specifically, green space perception is influenced by five factors: greenery coverage, number of parks, water space charm, climate comfort, and city cleanliness. Individual and family attributes are affected by eight elements: age, education, occupation, Hukou (rural or urban household registration), monthly household income, car ownership, residence, and residential location. The assumptions are that both green space perception and individual and family attributes affect subjective health and well-being, and they interact with one another in complex ways. Such interactions may have an even stronger impact on subjective health and well-being.
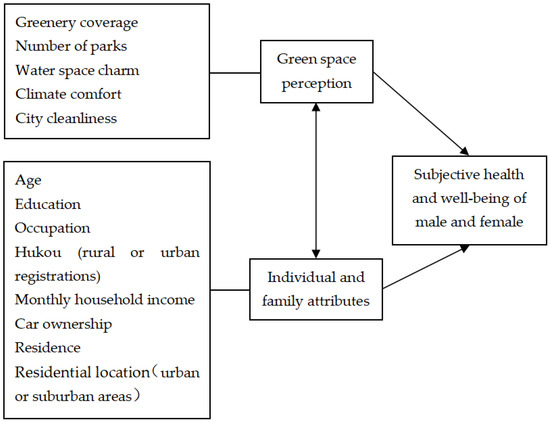
Figure 1.
Factors that influence subjective health and well-being.
2.2. Data Source and an Explanation of Variables
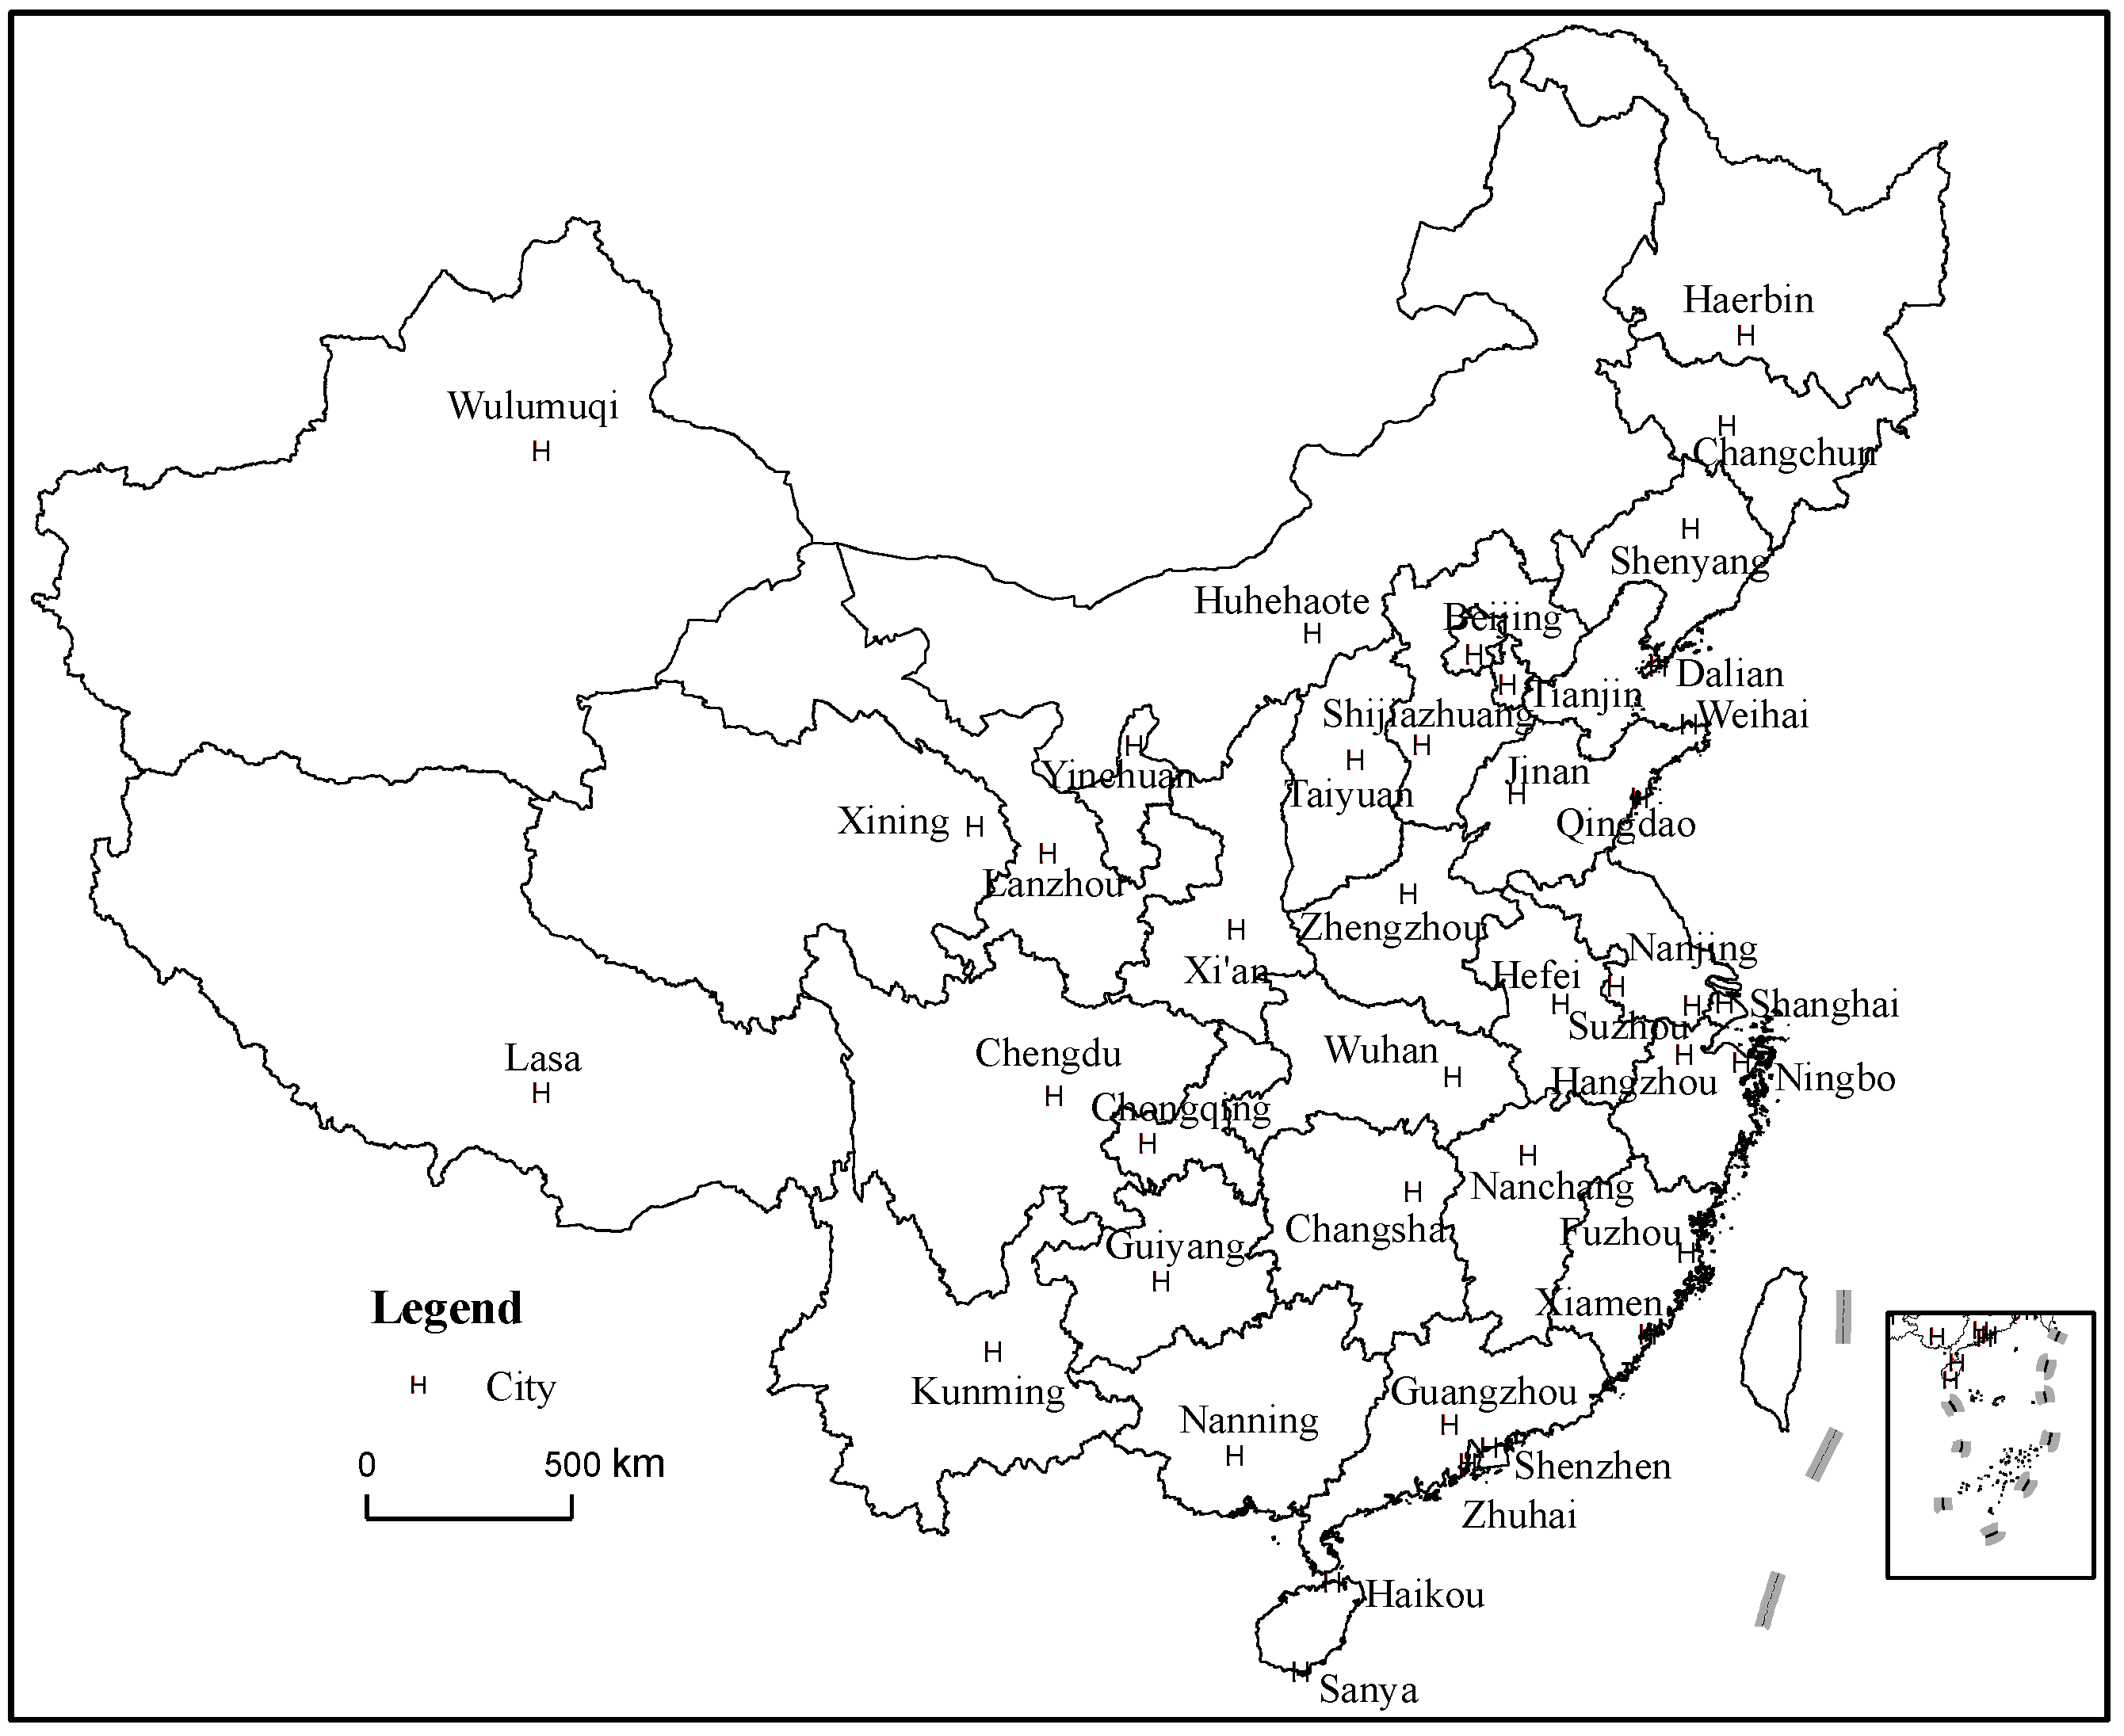
The data are from the sample survey of the Livable City Evaluation Survey conducted by the Livable Cities Research Group of the Institute of Geographical Sciences and Resources of the Chinese Academy of Sciences in 40 major cities nationwide in 2015 (Figure 2). The population surveyed were residents who had lived in the city for more than half a year. A total of 12,000 questionnaires were distributed, with 9325, or 77.7%, of them completed. The survey included questions on all 15 variables presented in Figure 1. These variables were selected by the Livable Cities Research Group at the Chinese Academy of Sciences according to principles [29]. Major cities were used for the survey according to their population sizes and geographic location. Respondents answered questions on perceived green space and subjective health and well-being using a five-point scale, from 1 (least favorable) to 5 (most favorable). In order to reduce the impact of age, the subjective questions asked the respondents to evaluate their health and well-being in comparison to other people their age.
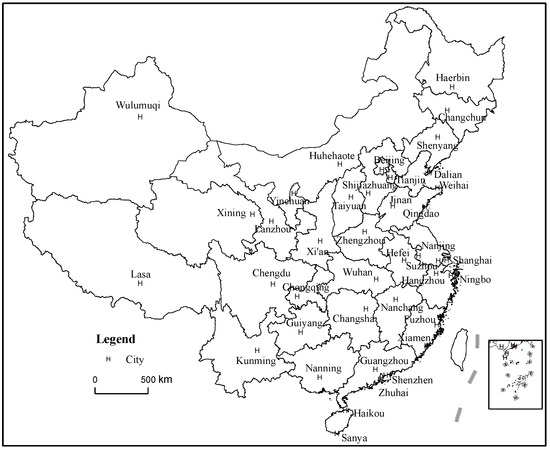
Figure 2.
Location of the 40 major Chinese cities surveyed.
2.3. Statistical Method
Statistical analyses were conducted using the Geographical Detector method, a set of statistical models for detecting spatial differentiation, and its drivers, including risk, factor, ecological, and interactive detections [30]. This method is able to effectively overcome the limitations of traditional statistical methods in working with categorical variables. It has been applied to a wide range of fields in natural to social sciences [31,32,33,34,35]. This study hypothesizes that subjective health and well-being are affected by green space perception, individual and family attributes, and the interaction of these factors. Therefore, the Geographical Detectors method is appropriate for this study as it has been used in other studies with similar datasets [36,37,38,39]. This paper mainly uses the three modules of geographic detection: factor detection, risk detection, and interactive detection.
(1) Factor detection quantitatively measures the interpretation degree of different factors influencing subjective health and well-being. Its model is
where is the explanatory power of the impact factor f on subjective health and well-being s, and are the sample size and variance of the subjective health and well-being of the study area, respectively, nf,I and are the sample size and variance of the subjective health and well-being of the i (i = 1,2,…, m) layer, that is, each city, respectively. value range is [0,1]. A larger value indicates that the factor has a stronger influence on subjective health and well-being. A value of 0 indicates that the factor is not related to subjective health and well-being. A value of 1 indicates that the influencing factor fully explains the self-assessment.
(2) Risk detection is used to reveal which types of variables are high or low values to subjective health and well-being. It can be measured by r-value test:
In the formula, rij is the t-test value, Mi and Mj are the mean of the subjective health and well-being of i and I, respectively; and are the variance of the subjective health and well-being of i and j, respectively; ni and nj are the sample sizes of i and j.
(3) Interactive detection is used to detect the relationship between the two impact factors on subjective health and well-being. It consists of the following expressions: if F (x∩y) <min (F (x), F (y)), this means that the influence of x and y interaction is nonlinear weakening; if min (F (x), F (y)) <F (x∩ y) <max (F (x), F (y)), the influence is a single linear weakening; if F (x∩y)> max (F (x), F (y)), the influence is bi-linearly enhancement; if F (x∩y) > F (x) + F (y), the influence is non-linearly enhancement; if F (x∩y) = F (x) + F (y), the factors of x and y are independent of each other.
3. Results
3.1. Variable Descriptive Statistics
The survey respondents included slightly more men (51.7%) than women (48.3%), the majority of whom were under 40 years old. Most respondents were college-educated, urban technical professionals, with an annual family income between CNY 5000 and 15,000 (US$700 and 2200), and who owned an apartment. Approximately half of them were car owners, slightly more among men than women. Women tended to have a higher perception of subjective health and well-being than men (Table 1). However, men rated their greenery coverage and climate comfort slightly higher than women did. Furthermore, Table 2 indicates that green space variables affected subjective health and well-being differently between the genders. The effects were also different between men and women. Green space variables affected men significantly in perceived subjective health but not as much among women. The gender differences were smaller in well-being.

Table 1.
Variable descriptive statistics.

Table 2.
The correlation between green space variables and variables of subjective health and well-being.
3.2. Factor Detection Results
Men’s subjective health is significantly affected by their perception of number of parks, city cleanliness, and greenery coverage (Table 3). However, women’s health is only affected by city cleanliness and number of parks. Male well-being is significantly affected by the number of parks, city cleanliness, climate comfort, greenery coverage, and water space charm. On the other hand, female well-being is affected by only the number of parks, water space charm, and climate comfort. Four individual and family attributes are important to male health: residential location, age, car ownership, and Hukou. However, female health is affected by a greater number of factors. In addition to residential location, age, car ownership, and Hukou, female health is also impacted residence, education, and occupation. Male well-being is affected by residential location, residence, education, age, Hukou, and car ownership. Female well-being is affected by the same attributes with the addition of occupation. In sum, the factors of green space perception and individual and family attributes have a greater impact on well-being than health. Green space perception factors have a greater impact on men than women, who particularly care more about the number of parks. Women also tend to be more affected by individual and family factors than men.

Table 3.
Factor Detection results of subjective health and well-being (unit: %).
3.3. Risk Detection Results
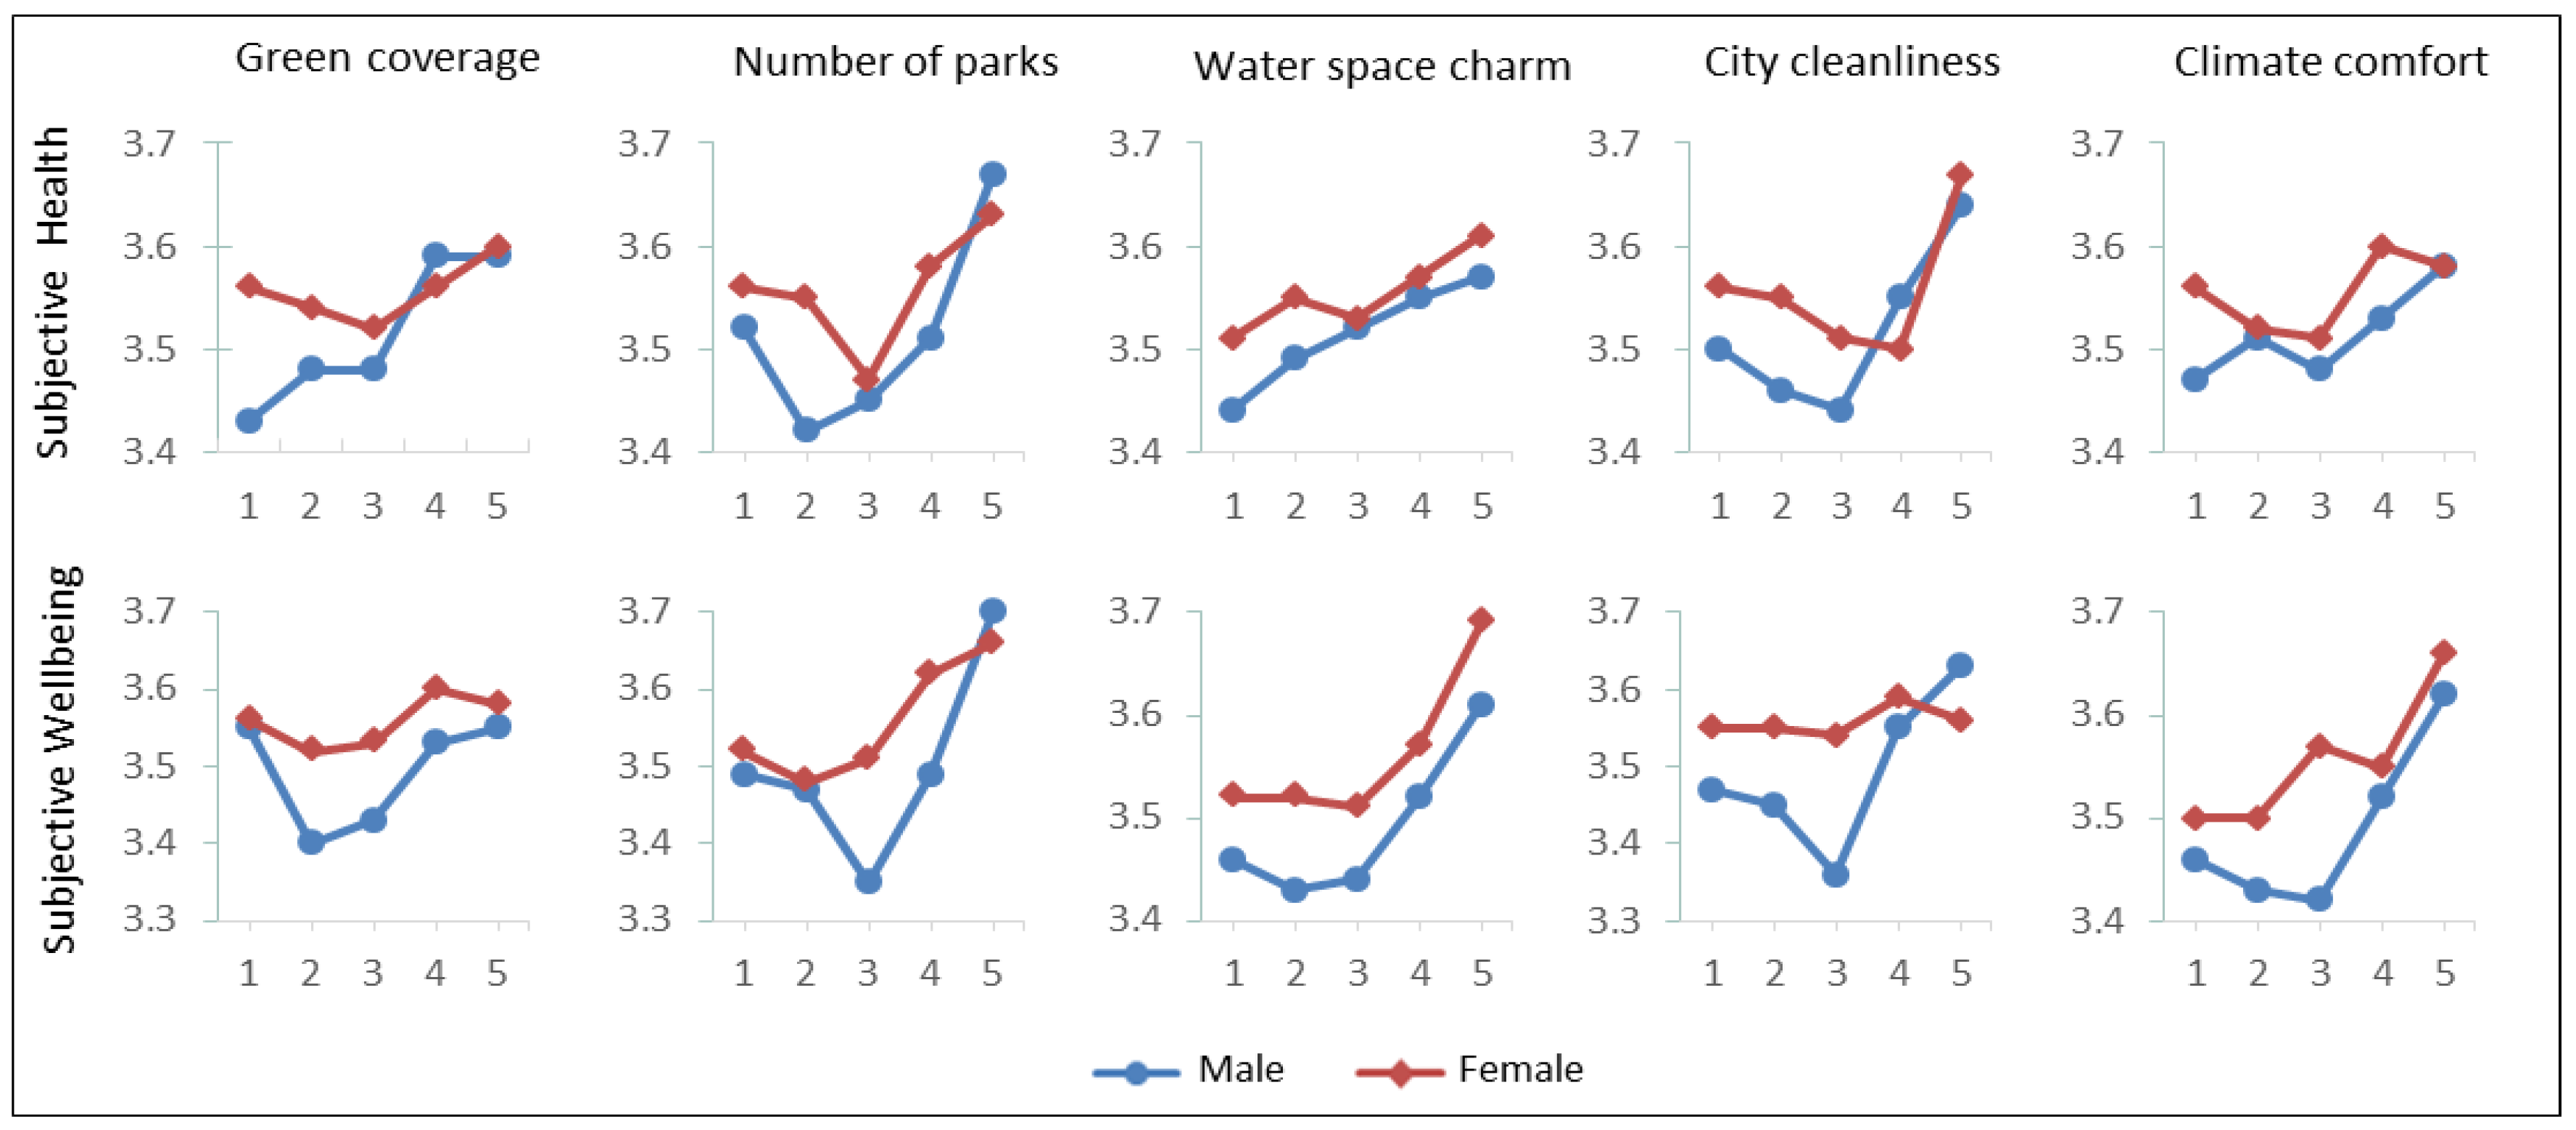
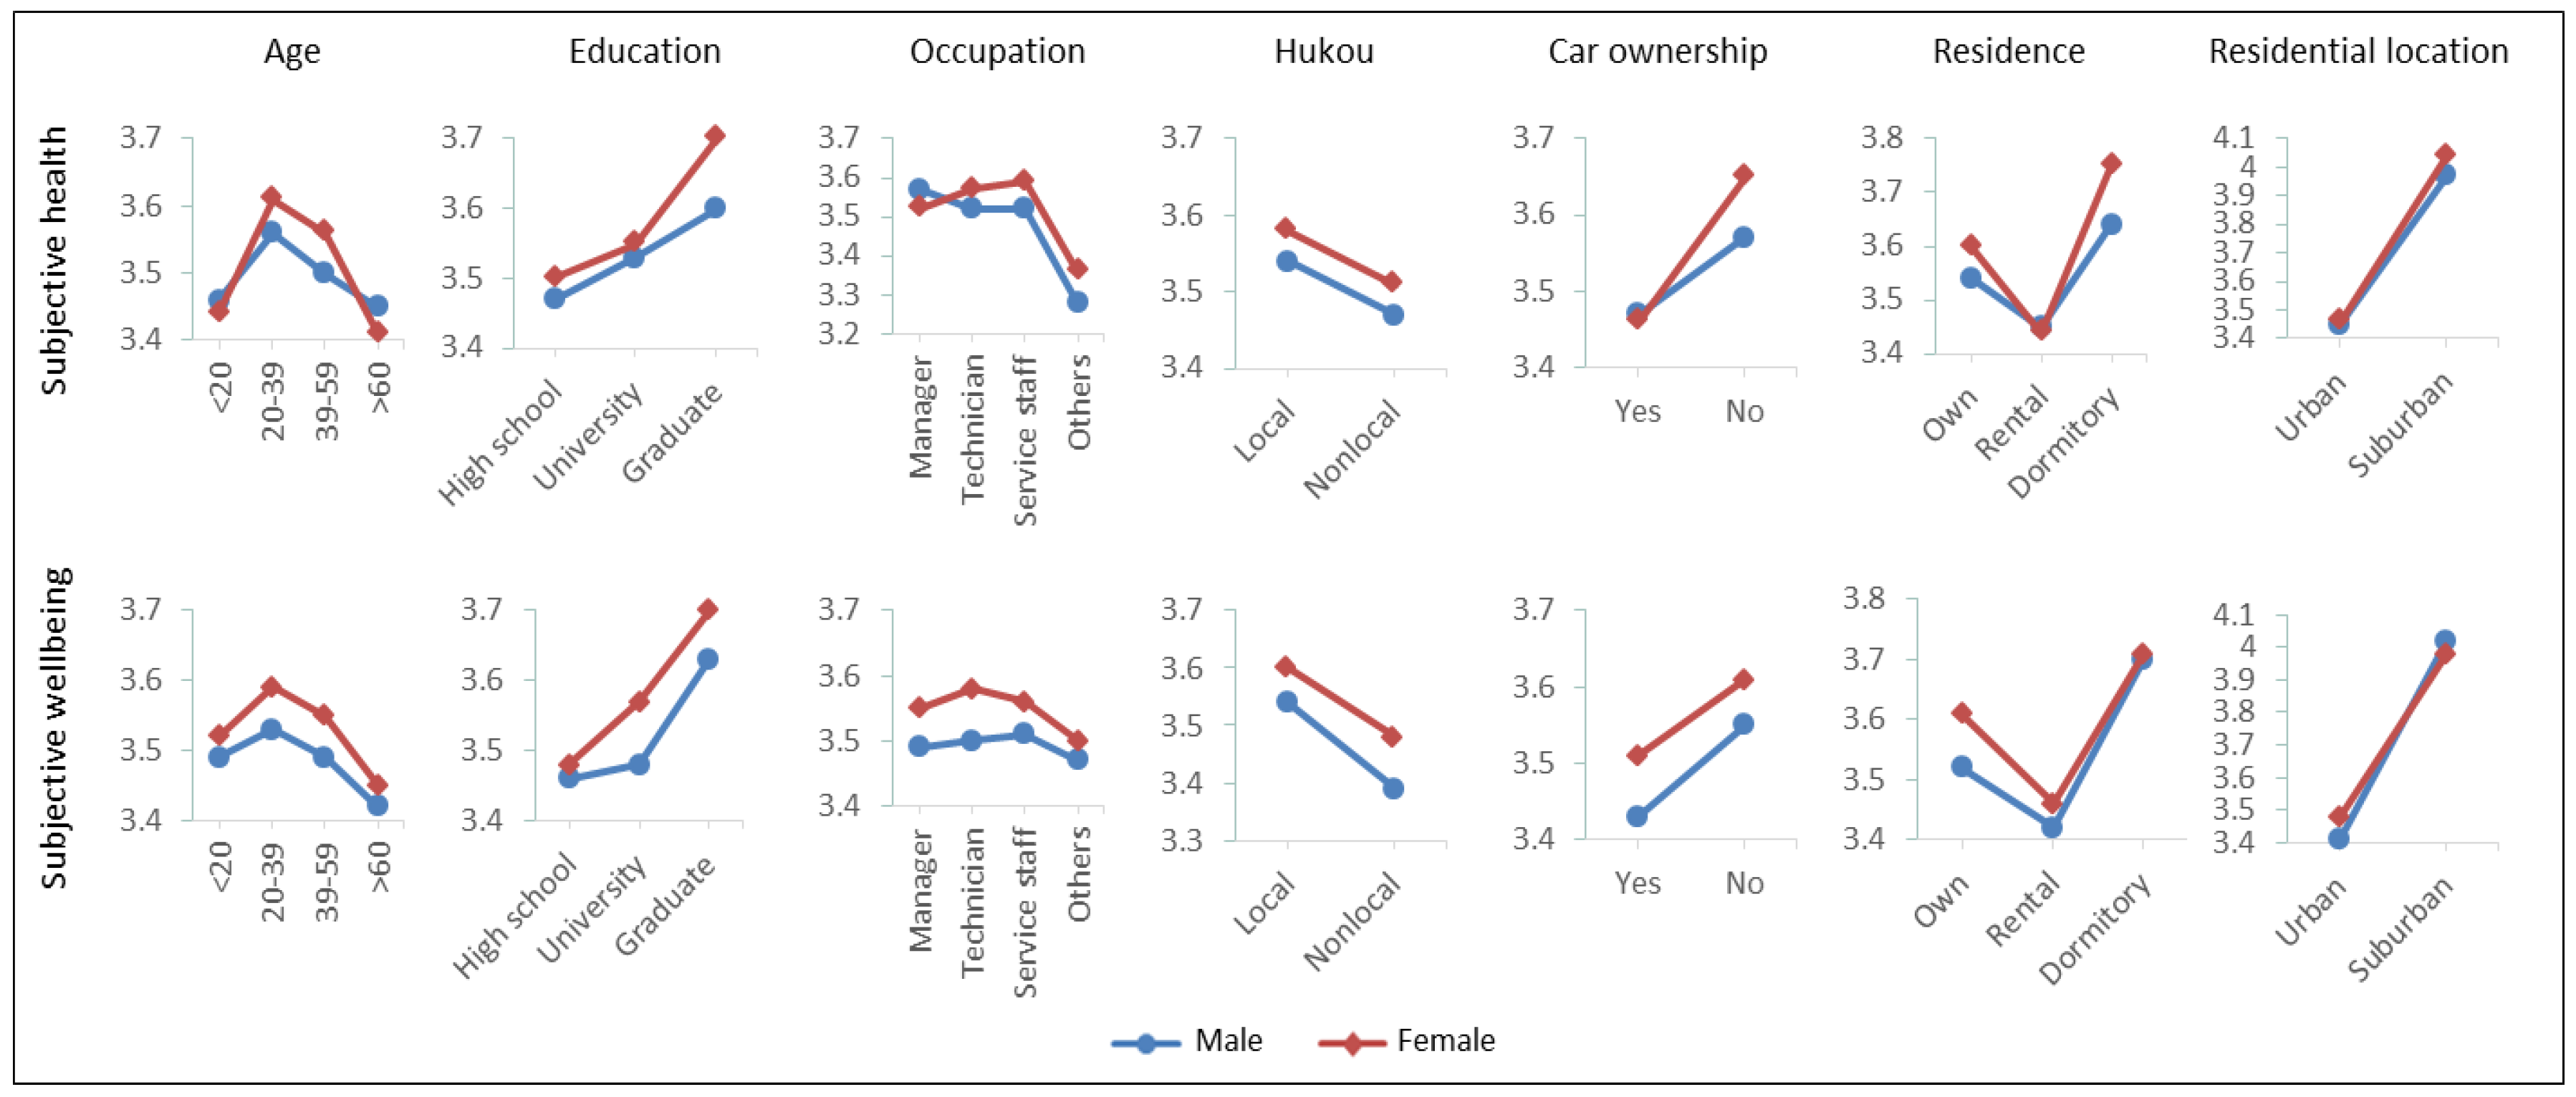
Risk detection identified the impact of different factors on subjective health and well-being. The results indicate a U shape for the impact of each perceived factor on well-being among men, a trend that first declines and then increases. (Figure 3). Thus, there is an inflection point effect, that is, the “very dissatisfied” score is slightly higher, the “general” score is the lowest, and the “very satisfied” score is the highest. The impact of number of parks and city cleanliness also exhibited a U-shaped curve on subjective health. Greenery coverage is positively correlated with subjective health. Subjective health improves with increase in satisfaction with greenery coverage. Furthermore, an inverted U shape indicates that as the age increases, health and well-being first increase and then decrease, peaking with the 20–39-year-old group (Figure 4). Other factors are reflected in the relatively high health and well-being of residents as well, including living in suburban areas, local Hukou, and car ownership. In addition, men with higher levels of education who lived in dormitories tended to have higher subjective well-being.
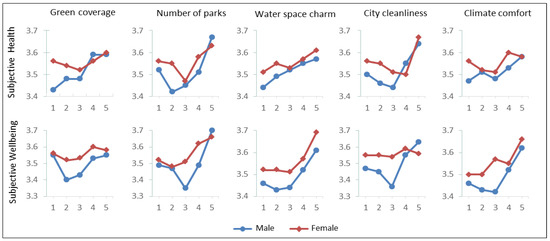
Figure 3.
The impact of different perceived greenspace factors on subjective health and well-being (1 = very dissatisfied; 2 = dissatisfied; 3 = general; 4 = satisfied; 5 = very satisfied).
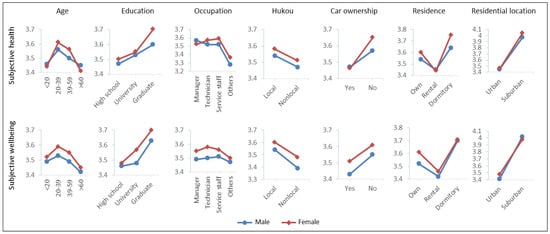
Figure 4.
The impact of individual and family attributes factors on subjective health and well-being.
As for women, a U-shaped curve exists between health and well-being and the affecting factors including water space charm, climate comfort, number of parks, and city cleanliness. Similar to men, women aged 20–39 years old have the best subjective health and well-being. In addition to age, other positive factors include better education, urban Hukou, not owning a car, and suburban living as compared to living in urban centers.
3.4. Interaction Detection Results
Interaction effects on men’s health are clear (Table 4). For example, the interaction explanatory power is 1.4% for the number of parks (0.7%) and green coverage (0.4%) and 1.1% for age (0.4%) and water space charm (0.2%). For women, the interaction explanatory power is 0.6% for the number of parks (0.3%) and green coverage (0.1%) and1.0% for age (0.5%) and water space charm (0.1%). Similarly, there are also interaction effects on well-being (Table 5). For example, the interaction explanatory power is 2.2% for men’s perception of number of parks (1.2%) and green coverage (0.4%) and 1.7% for age (0.5%) and water space charm (0.4%). For women, the interaction explanatory power is 0.8% for the number of parks (0.4%) and green coverage (0.1%) and 1.6% for age (0.5%) and water space charm (0.4%). In general, any single resident’s health and well-being are constrained by many factors. In addition, the interaction explanatory power of all factors on male health and well-being is significantly greater than that on female. For both genders, the interaction explanatory power of all factors is significantly greater on well-being than on health.

Table 4.
Interaction detection results of subjective health (unit: %).

Table 5.
Interaction detection result of subjective well-being (unit: %).
4. Discussions
The findings support earlier reports that urban greening enhances residents’ health and well-being [1,3]. In particular, the findings support the literature on gender disparities in the effects of urban greening [14,15,16]. This study contributes to the literature by demonstrating that men and women may experience and utilize urban green space in different ways, as men tend to have higher perceptions of green space but lower perception of subjective health and well-being than women. The findings could be explained by earlier reports that women tend to be restricted in their exercise behavior compared to men [40] and use public parks less often [41,42]. In addition, women tended to be more concerned about their personal safety than men when visiting green spaces [43,44]. The implications are that gender equality should be considered in strategies for sustainable urban greening [22,23]. In addition, our findings illustrated the complexity of gender disparity and sustainable urban greening. Our study suggests that it may be more important for cities to increase the number of parks rather than the total areas of parks, in particular for female residents. Ownership of material goods, namely apartments or cars, did not have as much of a positive impact on improving subjective health and well-being as we had anticipated. Instead, it seems that improving the cleanliness of the city, education opportunities, and reducing urban-rural inequality in residential status may be more helpful. This finding supports the UN Agendas that emphasize equality rather than material wealth in developing inclusive societies. Urban greening should follow the UN Agendas to enhance the development of sustainable, inclusive cities and communities and ensure the provision of “universal access to safe, inclusive and accessible, green and public spaces”. Current COVID-19 pandemic mitigations tend to cause or reinforce inequities in health and well-being [2,45].
5. Limitations
Several limitations need to be pointed out, though they should not affect the validity of the findings. First, we should note that the results indicated statistically significant effects of perceived green space on health and well-being, but the strength of the effect seems relatively small, which is an indication that many other factors which were out of the scope of this study may have played a role. Secondly, this study was limited to the quantity and quality of perceived green space, which may not fully account for all factors affecting the use of green spaces. It has been reported that proximity to green space, easiness of access, and perceived safety are all important affecting factors in health outcomes [14,46,47]. This study measured the quality of green space in terms of water space charm, climate comfort, and city cleanliness. However, proximity to green space and perceived safety were not measured. Further studies should include the additional factors for a more comprehensive result. Thirdly, our findings indicate associations between perceived green space and health but not necessarily a cause–effect relationship. Further research is needed for determining whether a cause–effect relationship exists. Fourthly, most respondents to the survey used in this study were college-educated, urban technical professionals, with middle-level income and a relatively stable lifestyle. As a result, our findings were likely to limit the generality of the conclusions. Fifthly, GDM method has been widely used with variations from study to study. Our method and design followed the correct principle theory with some variations in approach. The datasets we had limited our ability to fully explore the spatial options. Further research will need to collect data with additional spatial variables. Finally, it is important to point out that the incorporation of the syndemic approach with social-spatial justice is only preliminary. As such, the proposed integrated model of syndemics with social-spatial justice requires further debate and validation to fully enhance health policy making and management.
6. Conclusions
This study was designed to explore green space perception among urban Chinese residents and its impact on subjective health and well-being, with attention to gender equality in the context of the UN 2030 Agenda. We found a significant level of interaction between urban green space perception, individual and family attributes, and residents’ subjective health and well-being. There was also clear gender inequality in urban residents’ perception of green space and their health and well-being. Male perception of green space was significantly higher than that of female, but their subjective health and well-being were lower. Urban green space had a more significant impact on male subjective health and well-being, while individual and family attribute factors had a more significant impact on female health.
In addition, our findings illustrated the complexity of sustainable urban greening, which must pay attention to gender equity and other factors. Our study suggests that it may be more important for cities to increase the number of parks rather than the total areas of parks, in particular for female residents. Closeness to parks would especially encourage women to visit the parks as they tend to be busy with household work. We found that ownership of material wealth such as an apartment or cars do not help as much as we had expected in improving subjective health and well-being. Instead, improving education and reducing inequality in residential status may be more helpful. Hopefully, innovative sustainable urban greening with attention to gender equality will play a more important role in promoting healthy lives and well-being for all.
Author Contributions
Conceptualization, X.L. and L.L.; methodology, Z.Z.; software, Y.F.; validation, L.L., Z.Z. and X.L.; formal analysis, Z.Z.; investigation, W.Z.; resources, W.Z.; W.Z.; data curation, D.L.; writing—original draft preparation, X.L.; writing—review and editing, L.L.; visualization, Z.Z.; supervision, D.L.; project administration, D.L.; funding acquisition, X.L. All authors have read and agreed to the published version of the manuscript.
Funding
This study was carried out within the project of National Social Science Foundation of China (grant #17BMZ082); Social Science Planning Project of Liaoning Province (grant #L20BGL049, L20BXW020); Philosophy and Social Science Planning Project of Guangdong Province (grant #GD19CGL36).
Acknowledgments
The authors wish to thank the three anonymous reviewers for their comments and suggestions and Tiffany Z Liu for editing.
Conflicts of Interest
The authors declare no conflict of interest.
References
- Samuelsson, K.; Barthel, S.; Colding, J.; Macassa, G.; Giusti, M. Urban nature as a source of resilience during social distancing amidst the coronavirus pandemic. Landsc. Urban Plan. 2020. [Google Scholar] [CrossRef]
- Khan, O. Coronavirus Exposes How Riddled Britain is with Racial Inequality. The Guardian. 20 April 2020. Available online: https://www.theguardian.com/commentisfree/2020/apr/20/coronavirus-racial-inequality-uk-housing-employment-health-bame-covid-19 (accessed on 30 May 2020).
- Kondo, M.C.; Mueller, N.; Locke, D.; Roman, L.A.; Rojas-Rueda, D.; Schinasi, L.H.; Gascon, M.; Nieuwenhuijsen, M.J. Health impact assessment of Philadelphia’s 2025 tree canopy cover goals. Lancet Planet. Health 2020, 4, e149–e157. [Google Scholar] [CrossRef]
- Zhang, Z.; Liu, L. Environmental Health and Justice in a Chinese Environmental Model City. J. Environ. Health 2018, 80, E1–E9. [Google Scholar]
- Liu, L. The Dusty Lung Crisis in China: Rural-Urban Health Inequity as Social and Spatial Injustice. Soc. Sci. Med. 2019, 223, 218–228. [Google Scholar] [CrossRef]
- Hartig, T.; Mitchell, R.; De Vries, S.; Frumkin, H. Nature and Health. Annu. Rev. Public Health 2014, 35, 207–228. [Google Scholar] [CrossRef]
- Frumkin, H.; Bratman, G.N.; Breslow, S.J.; Cochran, B.; Kahn, P.H., Jr.; Lawler, J.J.; Levin, P.S.; Tandon, P.S.; Varanasi, U.; Wolf, K.L.; et al. Nature Contact and Human Health: A Research Agenda. Environ. Health Perspect. 2017, 125, 075001. [Google Scholar] [CrossRef]
- Kondo, M.C.; Fluehr, J.M.; McKeon, T.; Branas, C.C. Urban Green Space and Its Impact on Human Health. Int. J. Environ. Res. Public Health 2018, 15, 445. [Google Scholar] [CrossRef]
- Dzhambov, A.; Hartig, T.; Markevych, I.; Tilov, B.; Dimitrova, D. Urban residential green space and mental health in youth: Different approaches to testing multiple pathways yield different conclusions. Environ. Res. 2018, 160, 47–59. [Google Scholar] [CrossRef]
- Moore, T.; Kesten, J.; López-López, J.; Ijaz, S.; McAleenan, A.; Richards, A.; Gray, S.; Savović, J.; Audrey, S. The effects of changes to the built environment on the mental health and well-being of adults: Systematic review. Health Place 2018, 53, 237–257. [Google Scholar] [CrossRef]
- Norwood, M.F.; Lakhani, A.; Fullagar, S.; Maujean, A. A narrative and systematic review of the behavioral, cognitive and emotional effects of passive nature exposure on young people: Evidence for prescribing change. Landsc. Urban Plan. 2019, 189, 71–79. [Google Scholar] [CrossRef]
- Vujcic, M.; Tomicevic-Dubljevic, J.; Živojinović, I.; Tošković, O. Connection between urban green areas and visitors’ physical and mental well-being. Urban For. Urban Green. 2019, 40, 299–307. [Google Scholar] [CrossRef]
- Adhikari, B.; Mishra, S.; Dirks, K. Green space, health, and well-being: Considerations for South Asia. Lancet Planet. Health 2020, 4, e13543. [Google Scholar] [CrossRef]
- Jorgensen, A.; Hitchmough, J.; Calvert, T. Woodland spaces and edges: Their impact on perception of safety and preference. Landsc. Urban Plan. 2002, 60, 135–150. [Google Scholar] [CrossRef]
- Jiang, B.; Chang, C.-Y.; Sullivan, W.C. A dose of nature: Tree cover, stress reduction, and gender differences. Landsc. Urban Plan. 2014, 132, 26–36. [Google Scholar] [CrossRef]
- Bos, E.H.; Van Der Meulen, L.; Wichers, M.; Jeronimus, B.F. A Primrose Path? Moderating Effects of Age and Gender in the Association between Green Space and Mental Health. Int. J. Environ. Res. Public Health 2016, 13, 492. [Google Scholar] [CrossRef]
- Hinds, J.; Sparks, P.; Kruger, D.J.; Nesse, R.M. The Affective Quality of Human-Natural Environment Relationships. Evol. Psychol. 2011, 9, 451–469. [Google Scholar] [CrossRef]
- Thompson, C.J.; Boddy, K.; Stein, K.; Whear, R.; Barton, J.; Depledge, M.H. Does participating in physical activity in outdoor natural environments have a greater effect on physical and mental well-being than physical activity indoors? A systematic review. Environ. Sci. Technol. 2011, 45, 1761–1772. [Google Scholar] [CrossRef]
- Sang, Å.O.; Knez, I.; Gunnarsson, B.; Hedblom, M. The effects of naturalness, gender, and age on how urban green space is perceived and used. Urban For. Urban Green. 2016, 18, 268–276. [Google Scholar] [CrossRef]
- Richardson, E.A.; Mitchell, R. Gender differences in relationships between urban green space and health in the United Kingdom. Soc. Sci. Med. 2010, 71, 568–575. [Google Scholar] [CrossRef]
- Sander, H.A.; Ghosh, D.; Hodson, C.B. Varying age-gender associations between body mass index and urban green space. Urban For. Urban Green. 2017, 26, 1–10. [Google Scholar] [CrossRef] [PubMed]
- Jim, C.Y. Sustainable urban greening strategies for compact cities in developing and developed economies. Urban Ecosyst. 2013, 16, 741–761. [Google Scholar] [CrossRef]
- Nesbitt, L.; Meitner, M.J.; Girling, C.; Sheppard, S.R. Urban green equity on the ground: Practice-based models of urban green equity in three multicultural cities. Urban For. Urban Green. 2019, 44, 71–79. [Google Scholar] [CrossRef]
- UN (United Nations). Transforming Our World: The 2030 Agenda for Sustainable Development. 2015. Available online: https://sustainabledevelopment.un.org/content/documents/21252030%20Agenda%20for%20Sustainable%20Development%20web.pdf (accessed on 13 June 2020).
- UN. New Urban Agenda: Quito Declaration on Sustainable Cities and Human Settlements for All. 2016. Available online: http://nua.unhabitat.org/uploads/DraftOutcomeDocumentofHabitatIII (accessed on 30 May 2020).
- Barton, H.; Grant, M. A health map for the local human habitat. J. R. Soc. Promot. Health 2006, 126, 252–253. [Google Scholar] [CrossRef] [PubMed]
- Sallis, J.F.; Cervero, R.; Ascher, W.L.; Henderson, K.A.; Kraft, M.K.; Kerr, J. An Ecological Approach to Creating Active Living Communities. Annu. Rev. Public Health 2006, 27, 297–322. [Google Scholar] [CrossRef] [PubMed]
- Coutts, C.; Hahn, M. Green Infrastructure, Ecosystem Services, and Human Health. Int. J. Environ. Res. Public Health 2015, 12, 9768–9798. [Google Scholar] [CrossRef]
- Zhang, W.Z.; Yu, J.H.; Zhan, D.S.; Ma, R.F. A Study of Livable Cities in China; Science Press: Beijing, China, 2016. [Google Scholar]
- Wang, J.F.; Xu, C.D. Geodetector: Principle and prospective. Acta Geogr. Sinica 2017, 72, 116–134. [Google Scholar]
- Liu, Y.; Yang, R. Spatial characteristics and mechanisms of county level urbanization in China. Acta Geogr. Sinica 2012, 67, 1011–1020. [Google Scholar]
- Luo, W.; Jaroslaw, J.; Tomasz, S.; Wang, J.F.; Xu, C.D.; Cang, X.Z. Spatial association between dissection density and environmental factors over the entire conterminous United States. Geophys. Res. Lett. 2015, 43, 692–700. [Google Scholar] [CrossRef]
- Lou, C.-R.; Liu, H.; Li, Y. Socioeconomic Drivers of PM2.5 in the Accumulation Phase of Air Pollution Episodes in the Yangtze River Delta of China. Int. J. Environ. Res. Public Health 2016, 13, 928. [Google Scholar] [CrossRef]
- Zhang, Y.; Zhang, K.; An, Z.; Yu, Y. Quantification of driving factors on NDVI in oasis-desert ecotone using geographical detector method. J. Mt. Sci. 2019, 16, 2615–2624. [Google Scholar] [CrossRef]
- Bai, L.; Jiang, L.; Yang, D.-Y.; Liu, Y.-B. Quantifying the spatial heterogeneity influences of natural and socioeconomic factors and their interactions on air pollution using the geographical detector method: A case study of the Yangtze River Economic Belt, China. J. Clean. Prod. 2019, 232, 692–704. [Google Scholar] [CrossRef]
- Ye, Y.S.; Qi, Q.W.; Jiang, L.L.; Zhang, A. Impact factors of grain output from farms in Heilongjiang reclamation area based on geographical detector. Geogr. Res. 2018, 37, 171–182. [Google Scholar]
- Zhan, D.S.; Zhang, W.Z.; Dang, Y.X.; Qi, W.; Liu, Q.Q. Urban livability perception of migrants in China and its effects on settlement intention. Prog. Geogr. 2017, 36, 1250–1259. [Google Scholar]
- Zhan, D.S.; Zhang, W.Z.; Yu, J.H.; Meng, B.; Dang, Y.X. Analysis of influencing mechanism of residents’ livability satisfaction in Beijing using geographical detector. Prog. Geogr. 2015, 34, 966–975. [Google Scholar]
- Ding, Y.; Cai, J.M.; Ren, Z.P.; Yang, Z.S. Spatial disparities of economic growth rate of China’s National-level ETDZs and their determinants based on geographical detector analysis. Prog. Geogr. 2014, 33, 658–666. [Google Scholar]
- Popham, F. Leisure time exercise and personal circumstances in the working age population: Longitudinal analysis of the British household panel survey. J. Epidemiol. Community Health 2006, 60, 270–274. [Google Scholar] [CrossRef]
- Cohen, D.A.; McKenzie, T.L.; Sehgal, A.; Williamson, S.; Golinelli, D.; Lurie, N. Contribution of Public Parks to Physical Activity. Am. J. Public Health 2007, 97, 509–514. [Google Scholar] [CrossRef]
- Hutchison, R. Women and the elderly in Chicago’s public parks. Leis. Sci. 1994, 16, 229–247. [Google Scholar] [CrossRef]
- O’Brien, E.A. Publics and woodlands in England: Well-being, local identity, social learning, conflict and management. Forestry 2005, 78, 321–336. [Google Scholar] [CrossRef]
- Foster, C.; Hillsdon, M.; Thorogood, M. Environmental perceptions and walking in English adults. J. Epidemiol. Community Health 2004, 58, 924–928. [Google Scholar] [CrossRef] [PubMed]
- ONS. Black People Four Times More Likely to Die from Coronavirus than Whites; Office of National Statistics: London, UK, 2020. Available online: https://www.ons.gov.uk/peoplepopulationandcommunity/birthsdeathsandmarriages/deaths/articles/coronavirusrelateddeathsbyethnicgroupenglandandwales/2march2020to10april2020 (accessed on 7 May 2020).
- Hillsdon, M.; Panter, J.; Foster, C.; Jones, A. The relationship between access and quality of urban green space with population physical activity. Public Health 2006, 120, 1127–1132. [Google Scholar] [CrossRef] [PubMed]
- Jones, A.P.; Hillsdon, M.; Coombes, E. Greenspace access, use, and physical activity: Understanding the effects of area deprivation. Prev. Med. 2009, 49, 500–505. [Google Scholar] [CrossRef] [PubMed]
Publisher’s Note: MDPI stays neutral with regard to jurisdictional claims in published maps and institutional affiliations. |
© 2020 by the authors. Licensee MDPI, Basel, Switzerland. This article is an open access article distributed under the terms and conditions of the Creative Commons Attribution (CC BY) license (http://creativecommons.org/licenses/by/4.0/).

