1. Introduction
Global Climate Change (GCC) has generated an increase in hydrometeorological phenomena, which have intensified and become more frequent, increasing the risk of flooding mainly in coastal areas, causing human, socioeconomic and environmental losses that are aggravated by the conditions of marginalization, poverty and the social gap [
1,
2,
3,
4,
5]. Floods (pluvial, fluvial or coastal) are considered the most common disaster worldwide, with a 34% occurrence and a 40% loss of all global natural disasters [
6,
7]. A flood is an increase in water above the level of the channel and is caused by various natural factors—the overflow of a river due to extreme weather conditions-morphological conditions of the land, among others—and those influenced by human activities—changes in land use, climate change, etc. [
8,
9,
10].
In coastal rural areas where the population density is low compared to cities, the impacts of a flood can be severe due to the close relationship that exists with natural resources, for example, the loss of crops for personal consumption or trade [
11,
12]. The limited or lack of adaptive and coping capacities in rural areas increases vulnerability to climate-related hazards, such as floods [
13]. The development and location of coastal rural villages are based on natural resources, one of the main ones being water from rivers that provides villagers with their water supply and opportunities for economic growth through agricultural, livestock, aquaculture and other activities [
11]. Rural areas are particularly vulnerable to flood hazards due to their high dependence on natural resources; communities face non-climatic stressors, such as social, economic, physical, political, spatial and natural factors, which exacerbate this problem [
14,
15]. Low human development, poor infrastructure, high dependence on natural resources, and low government attention are factors that elevate the vulnerability of rural areas [
13]. A single such natural event can affect an entire rural town, unlike in cities, where only some areas are prone to flooding and damage is mitigated more quickly and effectively [
16,
17].
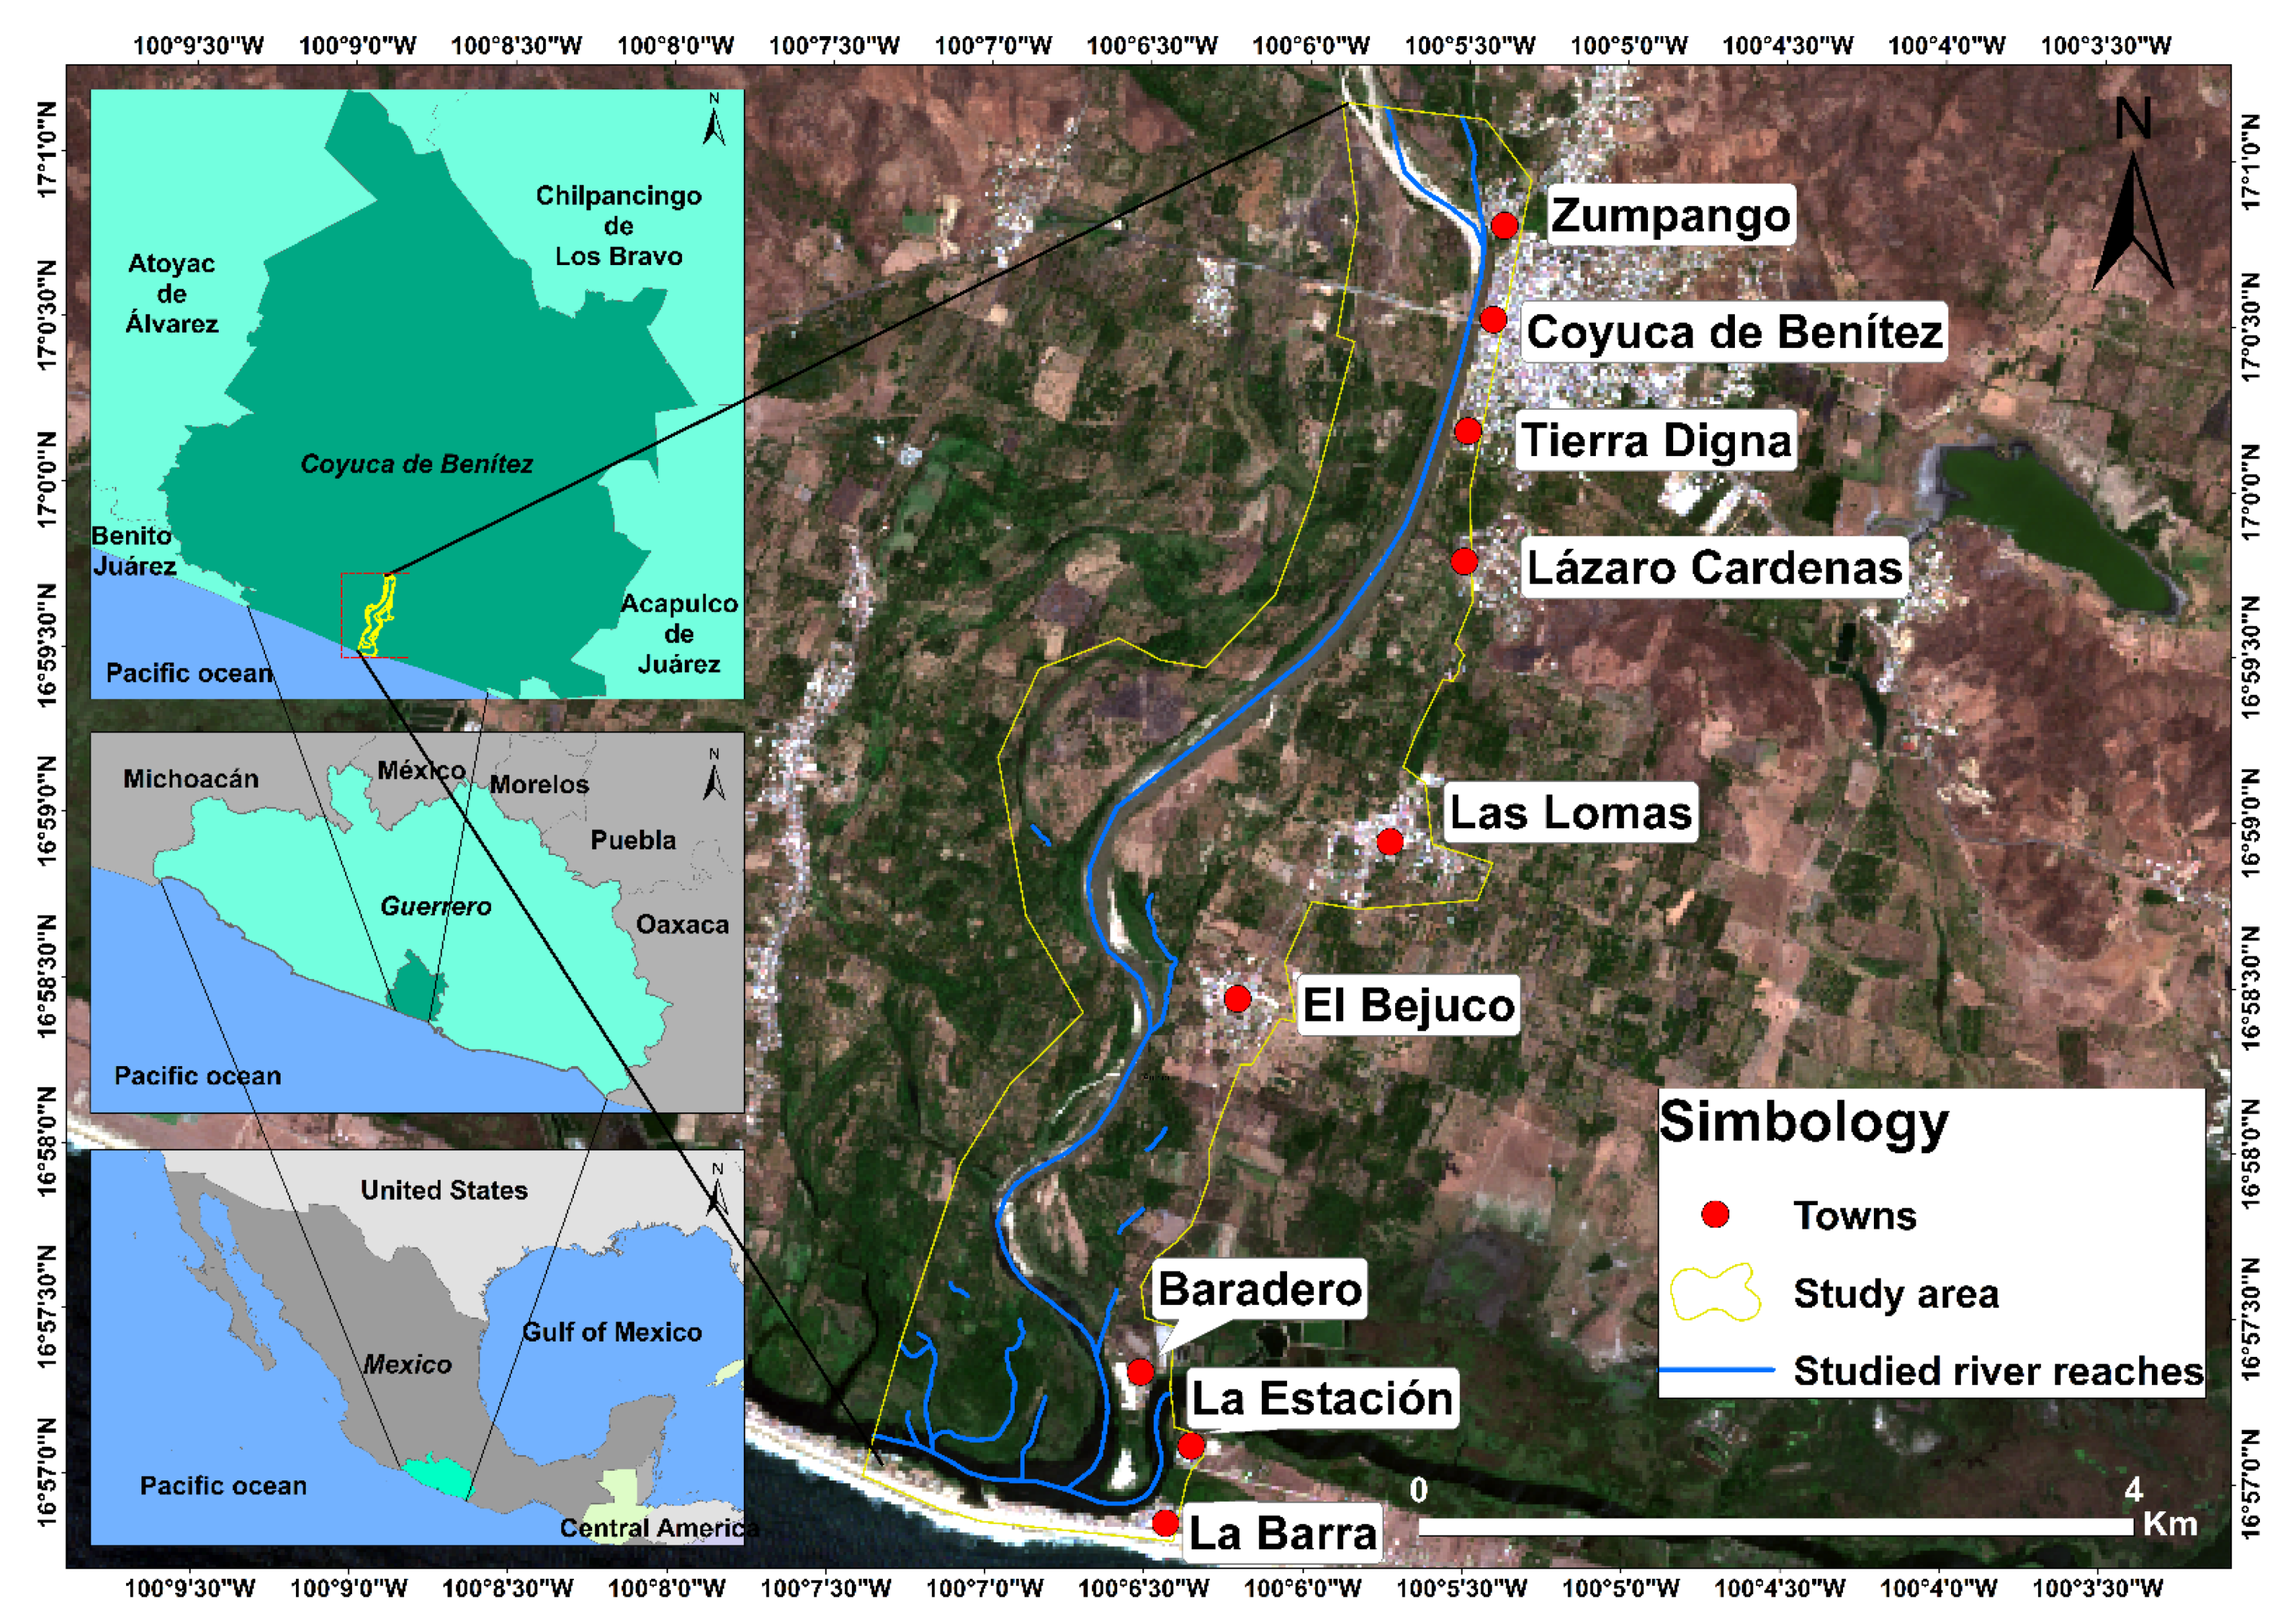
In Mexico, the state of Guerrero has 11 municipalities classified as “Very high” and “High” flood risk due to the rainy season and tropical cyclones [
18]. Coyuca de Benítez is classified as the most vulnerable to GCC in the entity [
19] to which the towns of Coyuca, Las Lomas, El Bejuco, Zumpango, Baradero, La Estación and La Barra belong, which have been classified as having a high flood risk and the largest number of declarations issued: emergency and contingency due to floods. The last declarations were issued on September 2013 due to the flooding caused by hurricanes Ingrid and Manuel [
20,
21].
Additionally, the municipal civil protection body has economic, operational, technical, and equipment limitations that prevent it from performing adequately and carrying out preventive, mitigation, and/or safeguarding activities for the residents living in the surroundings of the Coyuca River. The chances of suffering losses due to floods tend to increase due to the lack of a flood management plan, risk maps, susceptibility maps or another study that facilitates decision-making and planning strategies in flood management [
12,
22,
23,
24]. Flood susceptibility maps are tools for identifying flood-prone areas and categorizing them into susceptibility levels in order to design prevention and/or mitigation strategies [
25,
26]. According to Hosseini et al. [
27], having instruments such as risk maps, hazard maps, vulnerability maps and flood susceptibility maps can increase people’s awareness and perception of floods. This represents an effective method in the modern management of floods and the mitigation of the damage they cause.
A set of methods used to assess flood components have been identified in the literature. They can be grouped into four categories [
6,
7,
28]. The first is the statistical analysis of historical flood data to estimate risk; however, it may be difficult to obtain or non-existent depending on the time period [
29,
30]. The second is multi-criteria decision analysis (MCDA), which is based on the calculation of weights of factors influencing the problem [
31,
32,
33,
34]. Among the most common are the Analysis Hierarchy Process (AHP) and its variants, and the Weighted Overlap Method (WOM). The use of this MCDA method is recommended for regional studies in relatively small areas, such as the study area [
17,
35,
36]. The third category, which is also used in this analysis, is Geographic Information Systems (GIS) and Remote Sensing (RS) techniques [
37,
38,
39]. Finally, the hydraulic modeling method is widely used in flood hazard mapping. Hydraulic simulations can provide detailed information, such as flood extent for different return periods, as well as water levels, critical tie rods, potential flooding points, water discharge, velocity, and sediment transport [
40,
41,
42,
43].
MCDA has been widely used in natural disaster management through resilience index estimation, flood hazard assessment, flood risk index assessment, and policy development [
44,
45,
46,
47]. Kumar et al. [
48] defines it as a process of evaluating daily life situations based on various quantitative/qualitative criteria in certain/risky environments to find a suitable strategy among various options (2010). Zavadskas et al. [
49] conclude that its implementation can assist researchers and practitioners in solving real-life problems (2014).
In recent years, several flood researchers have employed MCDA and hybrid methods: Chen et al. [
50] developed GIS flood risk zoning for Nanjing, China (2021). Ullah and Zhang [
51] employed it in conjunction with GIS in the hazard zoning of the Panjkora River basin, Pakistan (2020). Fernandes et al. [
52] used it in Portugal to support decision makers in water quality prioritization (2021). Kourgialas and Karatzas [
53] used MCDA and artificial neural network techniques in flood hazard assessment in a GIS environment in Greece (2017). (2017) Morrison et al. [
54] used it to explore flood risk management policy preferences in Canadian localities (2019). Santos et al. [
55] built on this analysis to develop a flood susceptibility model at the national scale (Portugal, 2019). (2019) Ajjur and Mogheir [
56], identify flood-prone areas in Gaza using GIS and MCDA. Their research reveals the importance and reliability of applying GIS-MCDA techniques in mapping these areas (2020). Khosravi et al. [
57] compared it against the machine learning method and created flood susceptibility maps of one of the most flood-prone regions in China, Ningdu Basin (2019). Rafiei-Sardooi et al. [
58] conducted a flood risk assessment using machine learning and decision-making methods (TOPSIS) (2021). Gigović et al. [
59] employed three AHP modalities to perform the risk zone mapping of flood-prone areas in urban areas of the Palilula community in Serbia (2017). Taromideh et al. [
60] use a variant, semi-subjective Analytical Hierarchy Process (AHP), which integrates subjective and objective evaluations, to help organize the framework of the flood risk problem (2022). Chen et al. [
61] presented a simple flood risk assessment using GIS-MCDA in a floodplain in Japan (2015); in their study, they determined weights for six influencing factors and validated them through sensitivity analysis. The results were compared against a 2004 flood event map. Samanta et al. [
62] evaluated the use of MCDA through a flood risk analysis of a low river course in Papua, New Guinea (2016). Their results suggested that this approach is suitable for flood assessment in any region, specifically in data-poor regions, and can be useful for researchers and planners in flood mitigation strategies. Fernandez et al. [
63] applied MCDA in conjunction with GIS, determining the social vulnerability to flood risk in a municipality in Portugal (2016); their results demonstrated the importance of an urban scale approach rather than a river basin scale for urban flood risk management plans.
Based on this evidence, there is a clear need to develop and apply methodologies that generate information to identify the variables of flood risk and propose possible solutions capable of minimizing damage in areas such as the lower course of the Coyuca River, which is an area devoid of information and in which no studies on floods or other hydrological hazards have been developed, despite the major impacts they have had in recent decades [
64,
65,
66].
The purpose of this study is to identify areas susceptible to flooding and the prediction of flood hazards at the urban and neighborhood scales. For this purpose, the MCDA was selected, and hydraulic modeling was included. With the MCDA, specifically the AHP, the evaluation of the influencing factors (conditioning and triggering factors) was carried out by groups. This method is quick to apply, useful in areas deprived of information such as the study area and also integrates subjective and objective evaluations in one framework [
56,
59,
60]. The main challenge is the assignment of weights to the influencing factors. This generates a human judgment that leaves a certain level of uncertainty. To rule out this uncertainty, it was addressed using the consistency index and multicollinearity analysis. MCDA is appropriate for a local scale compared to recent global flood models, which are not appropriate at regional and local scales [
58]. The use of remote sensing techniques with UAVs allowed us to obtain highly detailed maps that, in conjunction with the hydraulic modeling of different return periods, can provide detailed information on the identification of flood risk zones: which critical tie rods can lead to the flooding, the respective flood levels in the area and potential flooding points. Therefore, the application of this study can facilitate the analysis of the area with respect to flood risk at the neighborhood scale, local scale and micro-watershed scale, since it can identify the factors that promote susceptibility to flooding, the causes of runoff and their consequences.
5. Discussion
Although the effectiveness of the applied methodology (MCDA/AHP) was confirmed by a very good agreement (AUC = 0.845) between the flood-susceptible zones and the flood inventory, in addition to the hydraulic modeling performed for the return periods of 10, 100 and 1000 years, the possible limitations and sources of uncertainty of the project should be discussed.
In this study, five flood influence factors were selected, of which four are conditioning factors and one is a triggering factor. Authors such as Samanta et al. [
62] and Ramathi et al. [
7] used four factors, while Kourgialas and Karatzas [
53] used six influence factors. Others, such as Vojtek and Vojteková [
98], used seven flood influence factors. In addition, ten parameters were used, for example, that of Khosravi et al. [
89]. Thus, it can be said that there is no agreement or standard defining the number or type of factors to be considered in flood susceptibility mapping. The selected influencing factors have a fundamental role in the analysis of this zone, for example, hydrography factors: distance to the river; morphometric factors, such as slope and height; permeability factors: normalized difference vegetation index and triggering factors, such as precipitation. In this sense, the inclusion of permeability factors and triggering factors gives rise to a more accurate flood susceptibility mapping. The unevenness in the number of factors considered per category may be considered a limitation that underestimates or overestimates some categories of flood influence factors [
95]. As a result, the importance of evaluating the model influence factors by means of statistical techniques should be noted, for example, multicollinearity analysis and other techniques that determine whether the variables adequately influence the flood susceptibility model.
Another important issue in the estimation of flood susceptibility zones using MCDA is the process of assigning relative importance to the influencing factors. In this study, the degree of distance to the river was assigned the greatest relative importance, indicating that it is the most important conditioning factor for finding areas susceptible to flooding. The relative importance of the other conditioning factors used in this study is reduced as follows: slope, height, and normalized vegetation index. Authors such as Samanta et al. [
62] found that distance to the river is the most influential factor, followed by slope and elevation. For Ramathi et al. [
7], height and slope were found to be the most important factors, while Vojtek and Vojteková [
98] find that slope is the most important factor, followed by river density, distance to river, elevation and other variables. Authors such as Hadian et al. [
72] found that elevation is the most influential factor, followed by distance to the river. Therefore, it can be said that the distance to the river will not always be the most important factor, but it is one of the most important and should be considered in flood studies. The determination of the most influential flood factor will depend on the selection and the characteristics of each area.
Regarding the validation of results, the validation of areas susceptible to flooding requires official data or records to serve as validation points. In areas lacking this type of information, the participation of residents and decision makers is of great importance. Fieldwork through the application of interviews, questionnaires or other instruments can be of great help, describing the historical flooding of an area, identifying flooding points and other data that allow the creation of flood inventories, maps of past events, validation points of the resulting susceptibility zones [
16,
25,
26,
62,
72,
104].
Another important aspect of this issue is the scale of flood susceptibility studies and their input data; generally, the input data are appropriate for regional, national or international studies. The authors believe that urban-scale flood susceptibility studies are more effective when creating mitigation and adaptation measures for urban flood risk management plans [
63]. Therefore, efforts should be made to make the input data more accurate in terms of scale and detail; the creation of the data using unmanned aerial vehicles (UAVs) proves to be highly accurate and accessible. Therefore, in the future, the use of high-resolution input data is recommended, as well as the inclusion of a greater number of influencing factors, and the comparison of the AHP technique with other methodologies (mentioned in
Section 1) is also recommended in order to find the best alternative in the evaluation of areas susceptible to flooding. Regarding hydraulic modelling, it is recommended to compare its performance with new machine learning methods, such as the one developed by Choubin et al. [
105], which takes into account the return period.
The information obtained can be valuable to decision makers and residents in the design of flood preparedness/mitigation measures where there is limited or non-existent information [
87,
106,
107,
108,
109].


 ,
, 


