Article

Have Climate Factor Changes Jeopardized the Value of Qinghai Grassland Ecosystem Services within the Grass–Animal Balance?

1
School of Humanities, Southwest Jiaotong University, Chengdu 610031, China
2
Academy of Animal Husbandry and Veterinary Sciences, Qinghai University, Xining 810016, China
*
Author to whom correspondence should be addressed.
Sustainability 2024, 16(19), 8463; https://doi.org/10.3390/su16198463 (registering DOI)
Submission received: 14 August 2024 / Revised: 22 September 2024 / Accepted: 24 September 2024 / Published: 28 September 2024

Abstract

:
Internal and external environmental changes have led to changes in the service value of plateau ecosystems. Plateau ecosystems are facing a risk of falling into “recession”. Meanwhile, climate change has become an important factor affecting the service value of plateau grassland ecosystems. In this paper, from the perspective of how changes in climate factors inhibit the value of ecosystem services of plateau grasslands, we adopt the equivalent factor method to measure the value of grassland ecosystem services in eight municipal levels in Qinghai Province from 2000 to 2021. We also construct a fixed utility model to test how changes in climate factors affect the value of ecosystem services and use the grass–animal balance as a mediating effect model for the test. The results of the study showed that (1) the increase in temperature and precipitation among the changes in climate factors significantly suppresses the ecosystem service value of grassland in the plateau. (2) The mediation test shows that the grass–livestock balance helped suppress the effects of climate factor changes on the ecological service value of plateau grassland. (3) The heterogeneity test shows that the area containing the Three-River-Source National Park is more resistant to climate factor changes. Climate factor changes have a greater impact on the ecosystem service value of plateau grassland in high altitude areas and have a significant positive effect on sustained low grassland carrying pressure index status. Therefore, in the protection of plateau grassland ecosystems, we should pay attention to the inputs in the ecosystems as well as appropriate grazing. At the same time, this study can provide a reference value for the decision-making with respect to ecological natural resources protection or restoration in plateau grassland under the effects of climate factors.

1. Introduction

Climate change brings many challenges and opportunities for nature and human beings, especially for the stability and resilience of ecosystems with high vulnerability and sensitivity, which have important impacts [1]. Improving the service capacity of ecosystems and ecological security patterns is crucial for regional economies and societies. In China, the area of grassland ecosystems, second only to forest ecosystems, is distributed in arid and semi-arid ecologically fragile and ecological security barrier areas in western and northern China. Grasslands provide product supply, regulation services, and ornamental values. Existing studies on the value of ecosystem services have found that anthropogenic factors such as land use change, urbanization, and crop cultivation can affect the value of ecosystem services. Some scholars have shifted their research perspectives to external abiotic factors and human economic production activities, of which climate change is a vital component. Human economic production activities in grassland ecosystems are mainly livestock production and tourism product service provision. Livestock production is an important part of the coupled and coordinated development of grassland ecosystems. A good balance between grass and livestock is important to maintain the cycle of grassland ecosystems and guarantee the value of ecosystem services. Unlike the influence of human factors on grassland ecosystems, the abiotic environment is characterized by a large spatial scale and a long duration for grassland ecosystems. However, the constant human demands on nature and global greenhouse gas emissions caused by climate warming, the frequent occurrence of extreme weather, and the northward shift of the precipitation line (Northern Hemisphere) constantly threaten the human living environment and the spatial and temporal decline of ecosystems [2,3]. With the deepening impact of climate change, it is more and more important to clarify the relationship between climate change and grassland ecosystems. The relationship between climate change and ecosystems has become a hotspot of academic research and an urgent issue for governments to solve [4]. Based on this, taking Qinghai Province (89°35′–103°04′–31°9′–39°19′) as an example in Figure 1, it is essential to elaborate the response mechanism of highland grassland ecosystem services to climate change in the context of ecologically sustainable development. Furthermore, it is also essential to clarify the relationship of the grass–animal equilibrium with respect to these two factors.
The value of ecosystem services, as one of the hotspots of research in the field of ecology, has achieved a series of excellent research results. First, the relationship between land use change and service value is much-anticipated [5,6]. As the carrier of ecosystems, land use changes reflect the development and evolution of ecosystems at spatial and temporal scales. On the one hand, relevant studies have quantitatively analyzed the value of ecosystem services in terms of changes to types of farmland [7,8], forests [9], watersheds [10,11], built-up land and grasslands [12], etc. Scholars have analyzed the value of ecosystem services in terms of synergies between land use changes and ecosystem services. On the other hand, the relationship between changes in land use types and the value of services is explained from different perspectives [13]. Second, research mainly focuses on ecosystem service value assessment methods and determination models. Methods for estimating ecosystem services are mainly equivalent factor methods [14], functional value methods [15], and modeling calculation methods [16,17]. The equivalent factor method categorizes ecosystem service function in terms of regulating service, supporting service, provisioning service, etc. It has the advantage of less data usage. It can also measure ecological service value at different regional scales, but this method ignores the vegetation type, irregular spatial and temporal distribution, and insufficient dynamics. Functional value approaches are the direct market approach, the alternative market approach, and the simulated market approach. The modeling approach is based on GIS technology and remote sensing data using software to assess the value of ecosystem services [18]. Third, the study of the relationship between ecosystem services and other ecological functions and ecosystems focuses on a variety of spatial synergistic effects. Scholars mainly focus on the perspective of regionally coordinated evolution, spatial coupling relationships, correlation analysis of ecological security patterns, ecological barriers, ecological restoration, biodiversity and ecosystem services, and other perspectives [19,20]. Therefore, promoting the growth of the value of ecosystem services is a key tool for achieving ecological security. The value of ecosystem services needs to be correctly measured, taking into account the impacts of climate change and human activities.
Climate change is directly related to changes in ecosystem services, and it has been explored by researchers from different perspectives. First, climate is the core factor affecting ecosystem services. Moreover, climate change significantly affects the structure and function of ecosystems by altering the conditions of light, temperature, water, and heat, which, in turn, cause changes in ecosystem services [21]. At the same time, climate change affects the integrity of ecosystem services. It also directly affects the function of ecosystem provisioning services. Furthermore, it also reduces the capacity of most ecosystem provisioning services [22]. Climate change will change the regulating capacity of agroecosystems and weaken the realization of cultural services, and subsystems such as agroecosystems, forest ecosystems, and marine ecosystems will be vulnerable to climate change [23,24]. Second, climate change affects ecosystem services at the spatial scale. It also directly or indirectly affects ecosystems’ spatial distribution and ability to provide ecological services through the movement of water and energy, alteration of hydrological processes, and temperature changes [25]. Research mainly focuses on mountain landscapes, rivers, and lakes in different geomorphic regions, with occasional studies on the spatial and temporal distribution of the ecosystem service value of grasslands and forests and their relationship to climate factors [26]. Third, scenario modeling is used to analyze the role and relationship of climate change services to different types of ecology and the process of valuing ecological services affected by climate change [27,28]. Fourth, the impact of climate change on vegetation: vegetation is extremely sensitive to climate change, especially precipitation and temperature [29]. One part of a study shows that grassland vegetation is negatively correlated with temperature. Precipitation shows a positive correlation. Another part of the study finds that the correlation between NDVI (Normalized Differential Vegetation Index) and temperature is greater, and the correlation with precipitation is not significant. Scholars have pointed out that the correlation between vegetation and temperature shows a fluctuating increase from the south to the north. In addition, the correlation with precipitation from the south to the north shows a clear decreasing trend [30]. In light of this, this paper will explore how climate change affects the value of ecosystem services and the pathways through which it does so. In addition, we are also examining whether differences in urban geography and resource endowments will lead to differential impacts from climate change on the value of ecosystem services.
Represented by the above studies, scholars at home and abroad have published abundant research results around climate factor changes and ecosystem services and their interaction. However, there are still problems, such as an unclear mechanism with respect to how the value of grassland ecosystem services responds to changes in climate factors, and insufficient research on how the grass–livestock balance, as a mediating effect, affects the relationship between the two. Based on this, this paper tries to provide the following marginal contributions: (1) At present, there are relatively few studies on the relationship between climate factor changes and grassland ecological service value in the academic world. Few scholars have used the grass–animal balance as a mediating variable to study the relationship between climate factor changes and grassland ecological service value. Moreover, the study of the relationship between climate factor changes and grassland ecological service value from the perspective of the grass–animal balance enriches the relevant theories. (2) The existing literature only focuses on typical facts and spatial–temporal heterogeneity analyses of climate factor changes and grassland ecological service value. However, this paper’s study is more helpful in exploring the intrinsic mechanism of climate factor changes and grassland ecological service value, and it can explain the correlation between the two more clearly. (3) In terms of theoretical and empirical perspectives, this paper studies the relationship between climate factor changes and the value of grassland ecological services. It also reveals the mechanism by which regional climate factor changes affect the value of grassland ecological services, and it provides ideas for study of changes in the value of regional grassland ecosystem services. (4) In its selection and measurement of indicators, this paper combines “space-area” data from 2000–2021 to form the consolidated database required by this paper, and it also corrects the index related to the grass–animal balance in in terms of the measurement of indicators to ensure the robustness of the empirical research.

2. Theoretical Analysis and Research Hypothesis

2.1. The Role of Climate Factor Change in the Value of Grassland Ecological Services

Whether climatic factor change, as the main factor in abiotic environmental change, can play a suppressive role in the value of grassland ecological services is not conclusive [31]. Climate factor change refers to the alteration of the abiotic environment directly through temperature and precipitation. Temperature and precipitation as climate factors are the basis for the survival of the ecological environment, directly affecting the adaptability of ecosystems, biodiversity, soil environment, etc. Ecosystems can adapt to the increase in precipitation and temperature to realize a dynamic balance. Ecosystems have the ability to self-adapt and regulate, and the value of ecosystem services is also in dynamic balance within the situation of temperature increase and precipitation increase. It is a changing, dynamic equilibrium. When the biotic and abiotic factors of the grassland ecosystem form a relatively stable state through interaction, the output of the grassland ecosystem service value is also relatively stable, and its value changes with changes related to temperature rise and precipitation increase. However, when biological factors and the disturbances of anthropogenic economic activities that maintain the value of grassland ecosystem services are in a stable state, the rise in temperature and the increase in precipitation break the original equilibrium state. They affect the circulation of material flow, energy flow, and information flow of grassland ecosystem service value. They also impede the ecosystem’s self-recovery and resilience. Finally, the leveling mechanism is broken, which influences the value of grassland ecosystem services in terms of the subfunctions of the output coefficient.
H1a: 
Temperature change can significantly inhibit the growth of grassland ecological service value.
H1b: 
Precipitation changes can significantly inhibit the growth of grassland ecological service value.

2.2. The Mediating Role of the Grass–Animal Balance

Grass–animal imbalance directly affects the grassland ecosystem and its service capacity. Long-term grass–livestock imbalance leads to a reduction in grassland ecosystem biomass [32]. Related scholars have pointed out that grasslands around the world are being degraded due to overgrazing and climate change [33]. Related studies have also pointed out that grassland imbalance directly reduces grassland biomass by 30–50%. Vegetation reduction and change are also some of the factors that affect and reduce the value of ecosystem services. Secondly, the effect of grass–animal imbalance on the composition of grassland ecosystems is quantifiable. By calculating the carrying capacity of livestock in the alpine grasslands of the Tibetan Plateau, the grass–animal balance of wild hoofed animals and domestic grazing hoofed animals is analyzed, indicating that the regional grass–animal distribution is extremely unbalanced [34]. It is found that grazing enhances soil inorganic nitrogen effectiveness in arid areas and that herbivore excreta play an important role in altering the ecological stoichiometry of plants and soils [35].
Climate is a crucial factor influencing the growth and productivity of grasslands. Prolonged droughts and extreme climatic change can lead to reduced yields, while higher temperatures and insufficient precipitation create antagonistic conditions that exacerbate grassland degradation. When the grass–livestock balance and other factors interact in the formation of a relatively stable state, the function of grassland ecological service value reaches a relatively stable balance state. Its value in terms of its subfunctions continues to stabilize the output. The most direct effect of grass–animal imbalance is the biological production of grassland, where overconsumption curtails its growth pattern and self-recovery ability. Egoh pointed out that human ecosystem services experience overconsumption and supply reduction because they are utilized free of charge due to the abundance and unlimited supply provided to the public [36,37]. In a state of grass–animal imbalance, the structure and function of grassland ecosystems tend to be affected. Changes in the structure of grassland ecosystems will directly lead to the decline of the regulating, supporting, and provisioning services of ecosystem service value. These changes also indirectly affect the habitats of other biological species. At the same time, structural changes cause a decrease in stability, diversity, resilience and recovery. They also exacerbate the imbalance between grasses and livestock, affecting overall ecosystem service value. From this, Hypothesis 2 can be formulated.
H2: 
The more balanced the grass animals are, the less influence the changes from climate factors have on the increase in the value of grassland ecological services.

2.3. Heterogeneity in Space

2.3.1. Spatial-Based Heterogeneity Test

With respect to the relationship between the spatial distribution of ecosystems and the value of ecosystem services, relevant scholars have produced a lot of research. According to existing relevant studies, the influence of the spatial distribution of grassland ecosystems on the value of grassland ecosystem services can be categorized according to two aspects. The first one is the regional protected area distribution in the horizontal direction, and the second one is the regional elevation spatial distribution in the vertical direction. Horizontally oriented regional protected area distribution means that the state establishes relevant regulations on regional ecosystems and provides funds to support regional ecosystem restoration to promote the growth of regional ecological service value. Sustained anthropogenic energy inputs and internal system restoration make the service value of grassland ecosystems in protected areas more resilient to changes in temperature and increases in precipitation. The spatial distribution of regional elevation in the vertical direction means that an increase in elevation drastically reduces the temperature. The service value of grassland ecosystems changes with an increase in elevation in terms of the size of its ecosystem composition, structure, and function. At the same time, due to the increase in elevation, ecosystems are more sensitive to changes in temperature and precipitation, and ecosystems at low elevations provide greater and more stable service value. With the distribution of regional protected areas in the horizontal direction and the spatial distribution of regional elevation in the vertical direction over a long period, changes in climatic factors will affect the ecological service value of grassland to different degrees. Therefore, a heterogeneity test is conducted according to the distribution of horizontally oriented regional protected areas and vertically oriented regional elevation spatial distribution in Qinghai Province. The Three-River-Source National Park, located in western China, in the heart of the Qinghai-Tibet Plateau and southern Qinghai Province, includes three park areas: the Yangtze River source, the Yellow River source, and the Lancang River (Mekong River) source. When there is a Three-River-Source National Park in the region, ability to cope with external disturbances is strong. Moreover, the service value of grassland ecological services will increase year by year. When the region is at a high altitude, the value of grassland ecological services is poor in its ability to cope with climate change. Finally, there will be a decrease in the value of grassland ecological services. From this, Hypotheses 3 and 4 can be proposed.
H3: 
Not belonging to Three-River-Source National Park, climate change is more able to inhibit the growth of grassland ecological service value.
H4: 
When the elevation is in a lower state, climate change factors inhibit the grassland ecological service value more.

2.3.2. Heterogeneity of the Duration of Low Grassland Carrying Pressure Index

Whether the grassland carrying pressure index state is continuous or not affects the ecological changes in the region where it is located. The duration of a region’s grassland stress index impacts regional ecological change. Areas with a shorter and less frequent grassland carrying pressure index experience higher levels of regulating, provisioning, and water conservation services. These areas also provide a more sustained and stable supply of food for grazing livestock. Conversely, regions experiencing frequent fluctuations in the grassland carrying pressure index and high environmental sensitivity are more susceptible to the effects of natural environmental changes. The ecosystem service value of grasslands in such frequently changing areas is more significantly impacted compared to those with greater stability. In addition, the area of Qinghai Province is large. Moreover, there are differences in the distribution of resource elements and resource use in different regions. Specifically, the group with a reasonable distribution of grass and livestock has better location advantages and grazing resource conditions. It is less affected by grassland productivity, which can better promote the growth of grassland ecological service value. In addition, compared with overloaded areas of grass and livestock, the advantageous effect is not significant. As a result, Hypothesis 5 can be proposed.
H5: 
Climate change factors are better able to promote the growth of grassland ecological service value when the grassland is in a state of low carrying pressure.

3. Research Design

3.1. Sample Selection and Data Sources

Grassland NPP (Net Primary Productivity) data were obtained from the MOD17A3HGF data product (https://ladsweb.modaps.eosdis.nasa.gov. format: 5 October 2023). The remote sensing data were selected from the images in the range of h25v05 and h26v05. Their projections were converted with the help of Moderate Resolution Imaging Spectroradiometer (MODIS) reprojection tools (MRT). Additionally, the HDF format was converted to the available TIFF format. After cropping, splicing, and converting the computations, the NPP data were obtained at a resolution of 500 m, and the unit was g C·m−2·a−1. The unit is g g C·m−2·a−1. In this paper, the combined livestock–climate-area-level data of Qinghai Province from 2000 to 2021 were used. The statistics on livestock distribution in Qinghai Province were obtained from the Qinghai Statistical Yearbook (2000–2021). Precipitation data were obtained from the ERA5-Land dataset (https://cds.climate.copernicus.eu. format: 12 October 2023.) published by the European Union and European Centre for Medium-Range Weather Forecasts and other organizations. Temperature data were obtained from the National Tibetan Plateau Science Data Center (http//data.tpdc.ac.cn. format: 12 October 2023.) by performing an ArcGIS-based overlay on grassland-type data and precipitation data to obtain the grassland precipitation and temperature data. The land cover utilization classification data were obtained from the first Landsat-derived Chinese annual land cover dataset (CLCD) produced by professors Jie Yang and Xin Huang on the Google Earth Engine (GEE) platform, with a spatial resolution of 30 m. All the grassland types in the dataset were extracted in the study (numbered 4) [38].

3.2. Variable Measures

3.2.1. Grass–Animal Balance

Grassland resource supply: the NPP calculated from the MOD17A3HGF data from 2000–2021 after the conversion projection was superimposed with the grassland distribution data extracted from the land cover utilization classification data to obtain the notation NPP of grassland ecosystems in the study area. The value of above-ground net primary productivity (ANPP) was estimated by Gao et al. [39]. SNPP (Supplied Net Primary Productivity) represents the total amount of edible forage (kg C·a−1) available for grazing livestock at each level of the district; the formula follows in Equation (1). The grassland resource supply (SNPP) of the host area represents the total amount of edible forage available for grazing livestock in each level of administration, i.e., grassland resource supply (kg C a−1); the equation follows in Equation (1). Actual livestock carrying capacity: taking livestock statistics as the estimation of actual livestock carrying capacity (A2), the grazing livestock (sheep, cattle, and horses) in the whole province were converted to standard sheep units through the conversion coefficients in the “Calculation of Reasonable Livestock Carrying Capacity of Natural Grassland”. Furthermore, the conversion coefficients of cattle were specially set at 5 considering the actual situation of the study area. The conversion coefficients of the various types of grazing livestock used in the study for the conversion to standard sheep units appear in Table 1. Additionally, in terms of a modified grass–animal balance index among the two main estimation methods available, namely the grass–animal balance index and grassland carrying capacity, the grass–animal balance index was used in this study, considering its generality and standardization. Grass–animal balance refers to the condition of the grass–animal balance that can be measured in a certain area. The index is called the grass–animal balance index (GLB). However, at present, China refers to NY/T635-2002 domestically [40]. This is a standard that is used without symbols to differentiate the calculation of un-overloaded and overloaded. According to the actual calculation and repeated verification, it is included in the original formula. It does not change the meaning of the actual calculation, and it can also be a powerful screening of the situation in terms of the grass–animal balance. The formula is as follows (2):
S N N P = ( λ × φ × N P P ) × δ 2
G L B = A 2 A 1 A 1 × 100 %
The coefficient λ in Equation (1) is derived from the BNPP (Subterranean Net Primary Productivity)/ANPP coefficient of alpine meadows of 8.99, obtained from the measured results of the Qinghai-Tibetan Plateau [41]. Therefore, the value of λ is taken to be 0.11. γ denotes the coefficient of edible pasture. The coefficient is based on the results of the study on the yield of natural grassland resources in Qinghai Province. δ is the spatial resolution of SNPP (500 m). In Equation (2), A1 represents the theoretical livestock carrying capacity and A2 represents the actual livestock carrying capacity.

3.2.2. Ecosystem Service Value Calculation Model

Among the two main ecosystem service value estimation methods, the method based on the value equivalent factor per unit area is widely used because of its convenient calculation. Considering its generalizability, this study adopts this method to calculate the ecosystem service value of grassland in Qinghai Province. Its calculation formula is as follows:
G E S V = 1 n L × f m V C
where “GESV” is the ecosystem service value; “L” is the area of grassland type of land use (hm2); “n” is the total amount of land use type; “ f m V C ” is the ecological service value coefficient of grassland type of land use (hm2); “−”is the coefficient of the f th service function value of grassland type of land use (hm2); and “m” is the total amount of ecosystem service types for a given land use. Cited in this paper are the updated global ecosystem service value coefficients by Costanza et al. (Table 2) [42].

3.2.3. Baseline Model and Mediation Effect Model

Based on the above analysis, a regression model was constructed to test the direct effect of climate factor changes on the value of grassland ecological services and the mediating effect of the grass–animal balance:
l n G E S V i j = α 11 + α 12 l n P R C P i j + M i j β 1 + γ 1 j + ε 1 i j
l n G E S V i j = α 21 + α 22 l n T M E D i j + M i j β 2 + γ 2 j + ε 2 i j
l n G L B i j = α 31 + α 32 l n P R C P i j + M i j β 3 + γ 3 j + ε 3 i j
l n G L B i j = α 41 + α 42 l n T M E D i j + M i j β 4 + γ 4 j + ε 4 i j
l n G E S V i j = α 51 + α 52 l n P R C P i j + α 53 l n G L B 1 i j + M i j β 5 + γ 5 j + ε 6 i j
l n G E S V i j = α 61 + α 62 l n T M E D i j + α 63 l n G L B 2 i j + M i j β 6 + γ 6 j + ε 6 i j
where lnGESVij represents the logarithm of the total ecological service value of grassland for region i in year j. The higher its value, the greater the ecological service value of grassland in the region. GLBij represents the grass–livestock balance index of region i in year j as a measure of the grass–livestock balance. PRCPij, and TMEDij represent the logarithm of the average annual temperature and average annual precipitation of region i in year j. Mij represents the control variables of this paper. The higher the value of the logarithm of the mean annual temperature and mean annual precipitation, the higher the mean annual temperature and the higher the mean annual precipitation of the region. Mij represents the control variables in this paper. In addition, γij is added in this paper, and εij is a random disturbance term.
Control variables: According to changes in climatic factors, the related research results of factors influencing the value of ecosystem services of plateau grassland, the total output value of agriculture and animal husbandry, the contribution rate of the animal husbandry industry to primary industry, the amount of regional animal husbandry, the supply of grassland resources, per capita gross domestic product, the number of livestock per capita, the level of industrial structure, and the density of technology are selected as the control variables of the model in the present study. Specific variables and indicators are shown in Table 3.
Table 4 reports the descriptive statistics of the main variables. The mean value of the logarithm of the total value of grassland ecological services is 10.96. It is slightly lower than the median value of 10.947. In addition, the sample distribution is left skewed. Most of the data concentrates in the region of the median value, reflecting the stability of overall grassland ecosystem services in Qinghai Province. In addition, the minimum value of the total value of grassland ecosystem services is 9.104, the maximum value is 12.66, and the standard deviation is 1.153. They show that there are large differences in overall grassland ecosystem services in Qinghai Province. The mean value of the grass–animal balance index is −0.445, which is greater than the median value of −0.545. Moreover, the samples are right skewed, with a maximum value of 1 and a minimum value of −2.108. This indicates that the grass–animal balance index varies significantly in different regions and that the ecology of some regions might have experienced a rapid decline.

4. Results

4.1. Spatial and Temporal Analysis of Ecosystem Service Value of Plateau Grassland

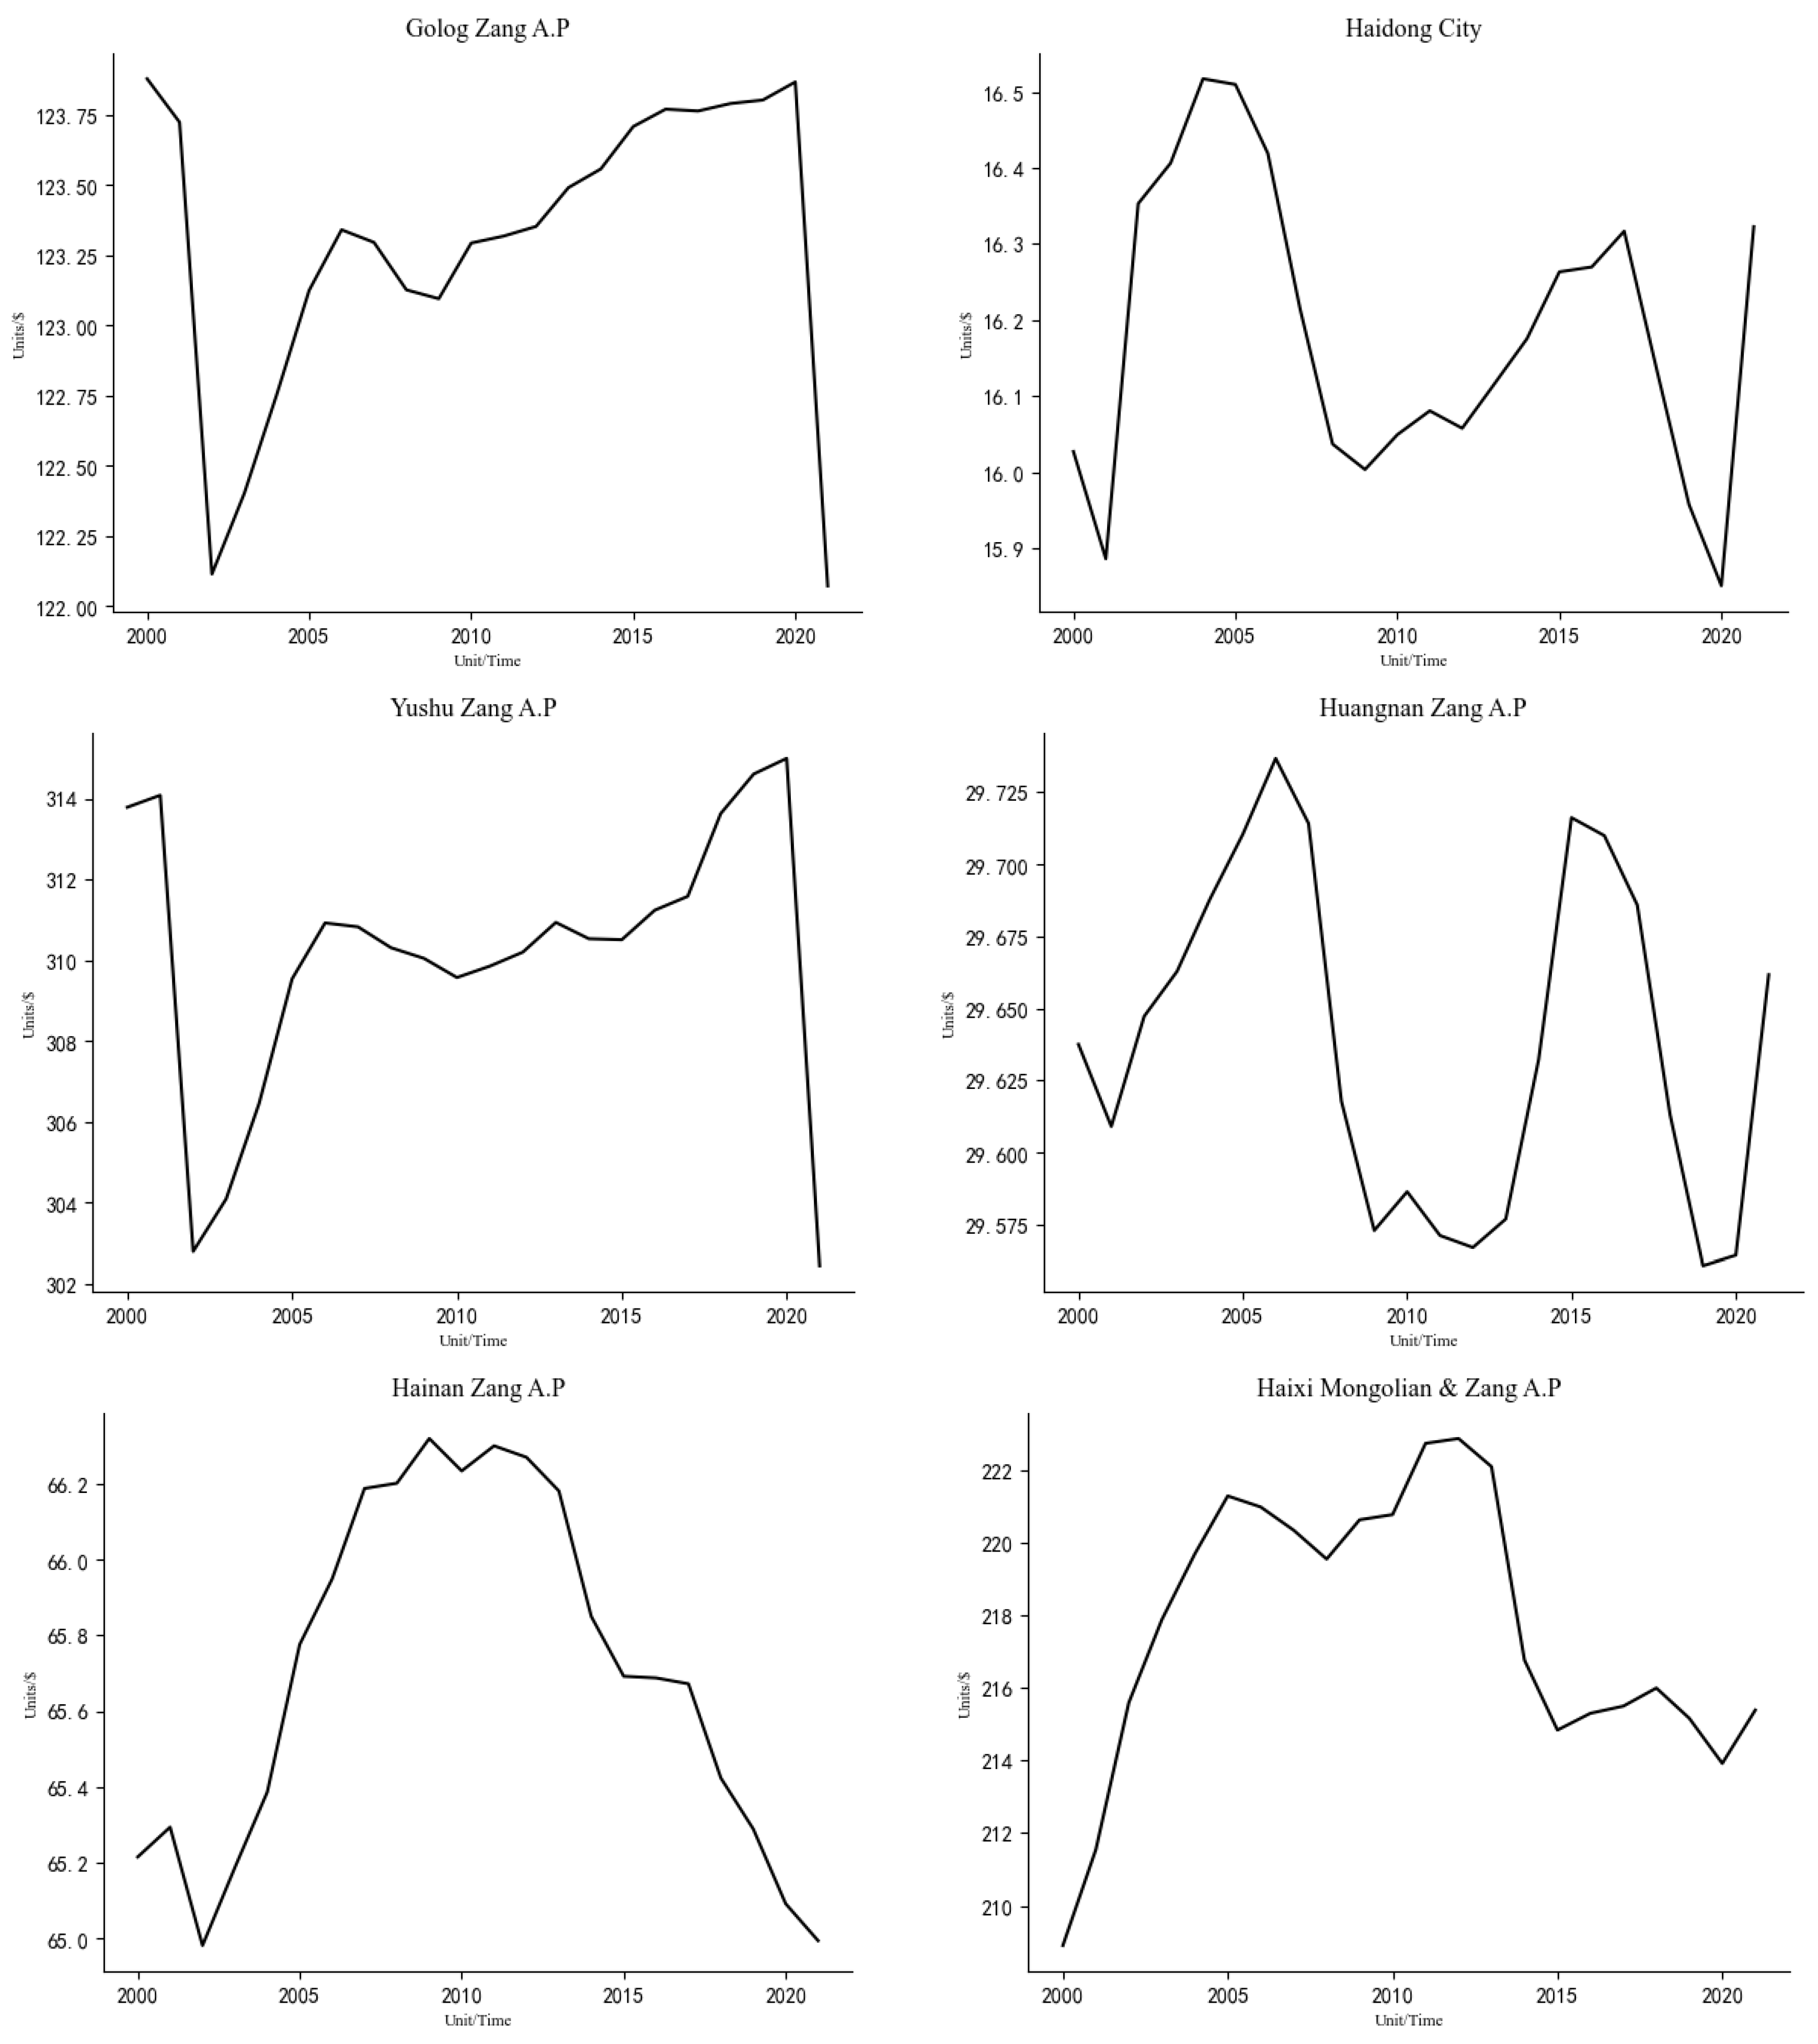
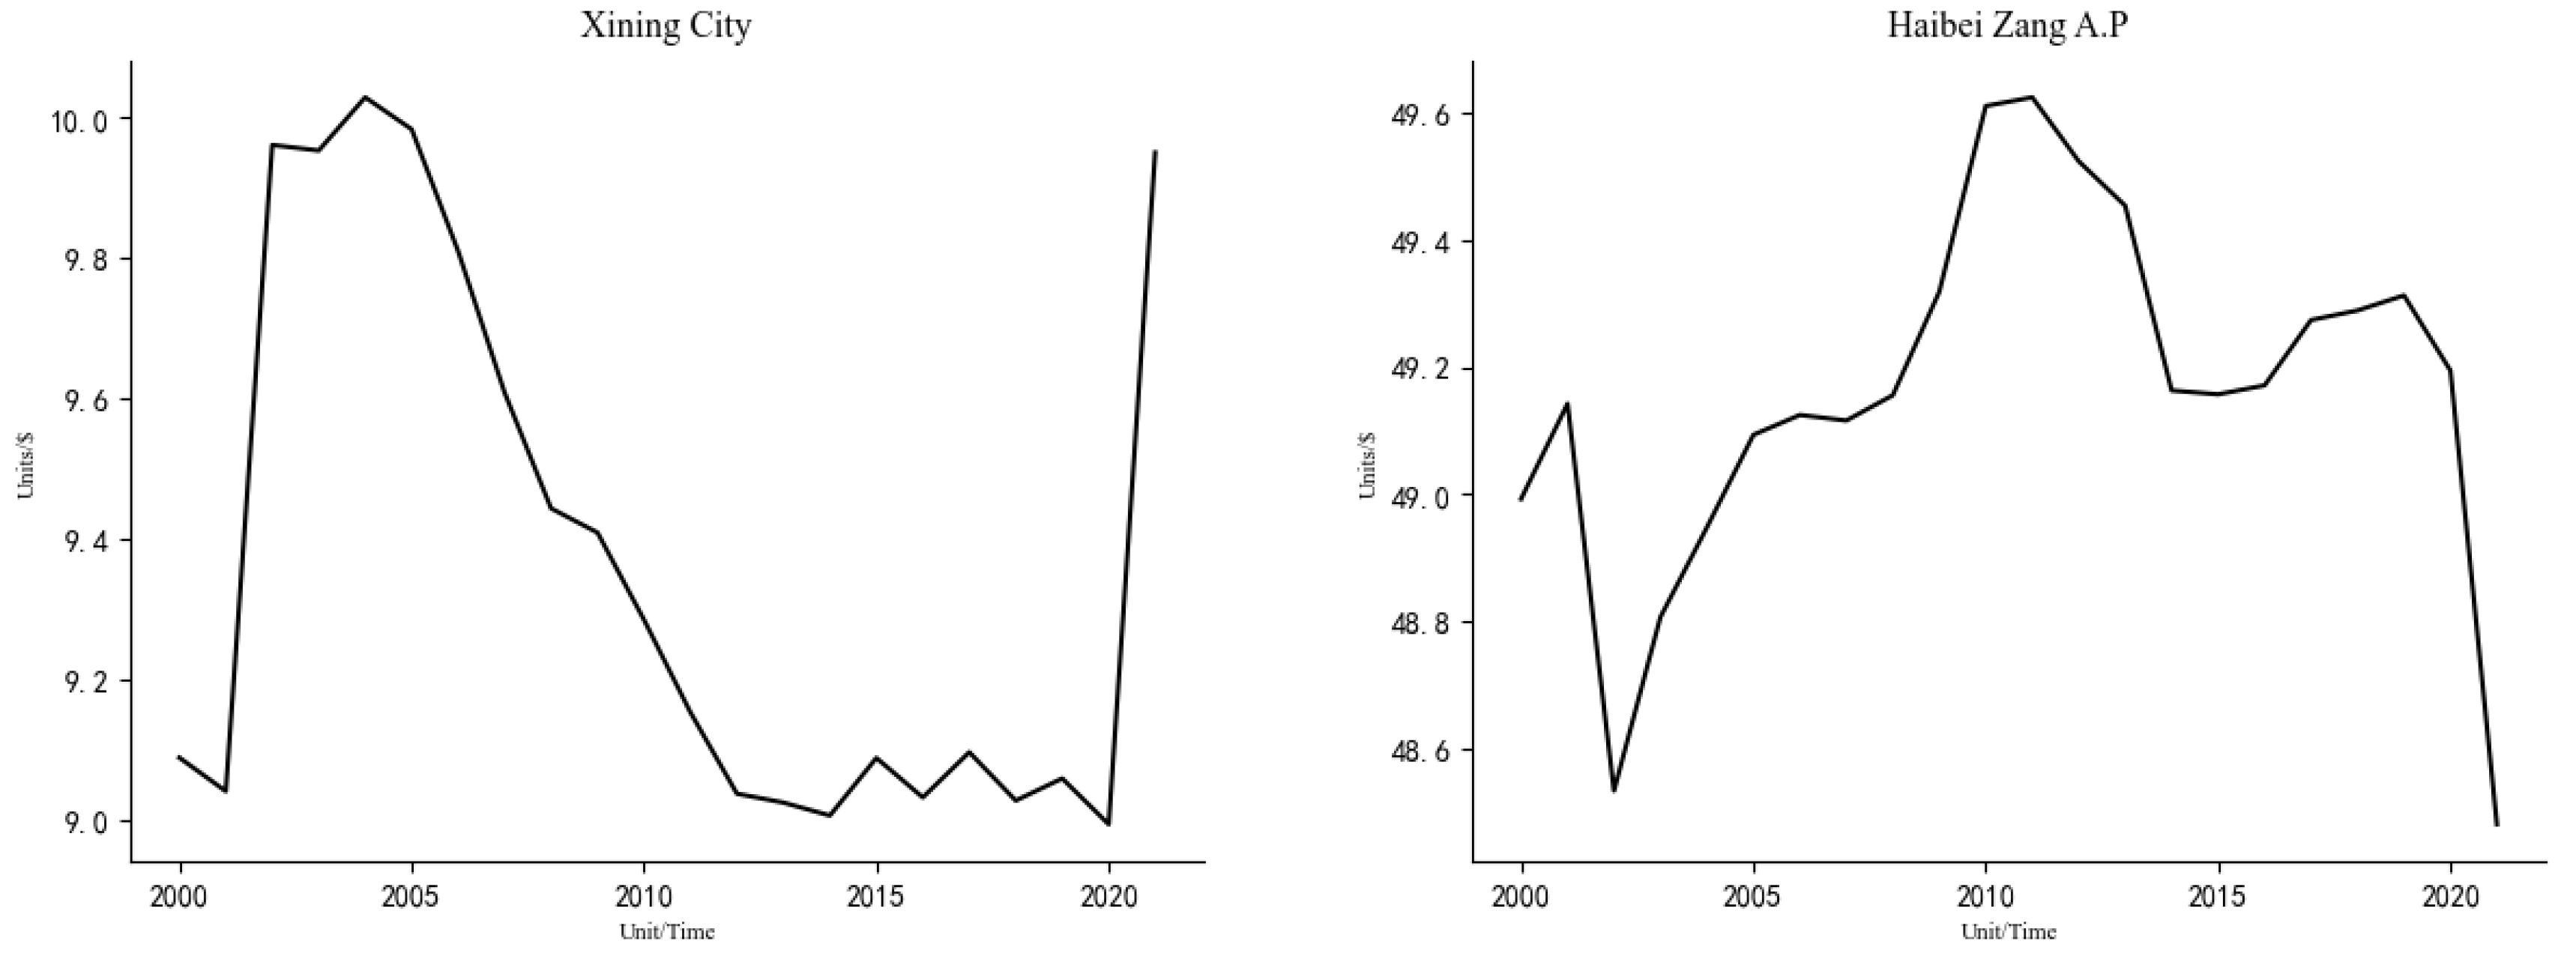
The spatial distribution of grassland ecosystem service value (Figure 2) shows that the ecological service value of Qinghai Province is mainly concentrated in Haixi Tibetan Autonomous Prefecture and Yushu Tibetan Autonomous Prefecture in the western part of the province, with the value of grassland ecosystem services in these two regions amounting to USD 52.5–53.5 billion, accounting for 64.1–64.5% of the total value, and that of the eastern part of the province amounting to USD 29.1–295 billion, accounting for 35.5–35.9%. The value of grassland ecosystem services in the eastern part of Qinghai Province is USD 29.1 to 29.5 billion, accounting for 35.5% to 35.9% of the total. From 2000–2021, the total value of grassland ecosystem services in the eastern and western regions of Qinghai Province has a slowly rising and then slowly declining trend. There are differences in the magnitude of the rise and change in the composition. Guoluo Tibetan Autonomous Prefecture and Yushu Tibetan Autonomous Prefecture are in a linear downturn scenario. Furthermore, the city of Xining City is in a linear upward trend, and Haixi Tibetan Autonomous Prefecture, Huangnan Tibetan Autonomous Prefecture, and the Haidong City are in a wave-like upward and downward trend. Hainan Tibetan Autonomous Prefecture and Haibei Tibetan Autonomous Prefecture are in a rising and then falling trend. Overall, the service value of grassland ecosystems shows a rising and then declining trend.
On a time scale, the value of grassland ecosystem services in Qinghai Province from 2000 to 2021 experiences a fluctuating change process of increasing and then decreasing. Additionally, in terms of trends related to change, 2004, 2009, and 2016 are the wave peaks, and they are also turning points from high to low. The highest total amount of USD 82.66 billion appears in 2009, 2010, and 2011. The trend in terms of change is to increase and then decrease. The value of ecosystem services of grassland meadows decreases compared with that of 2000.
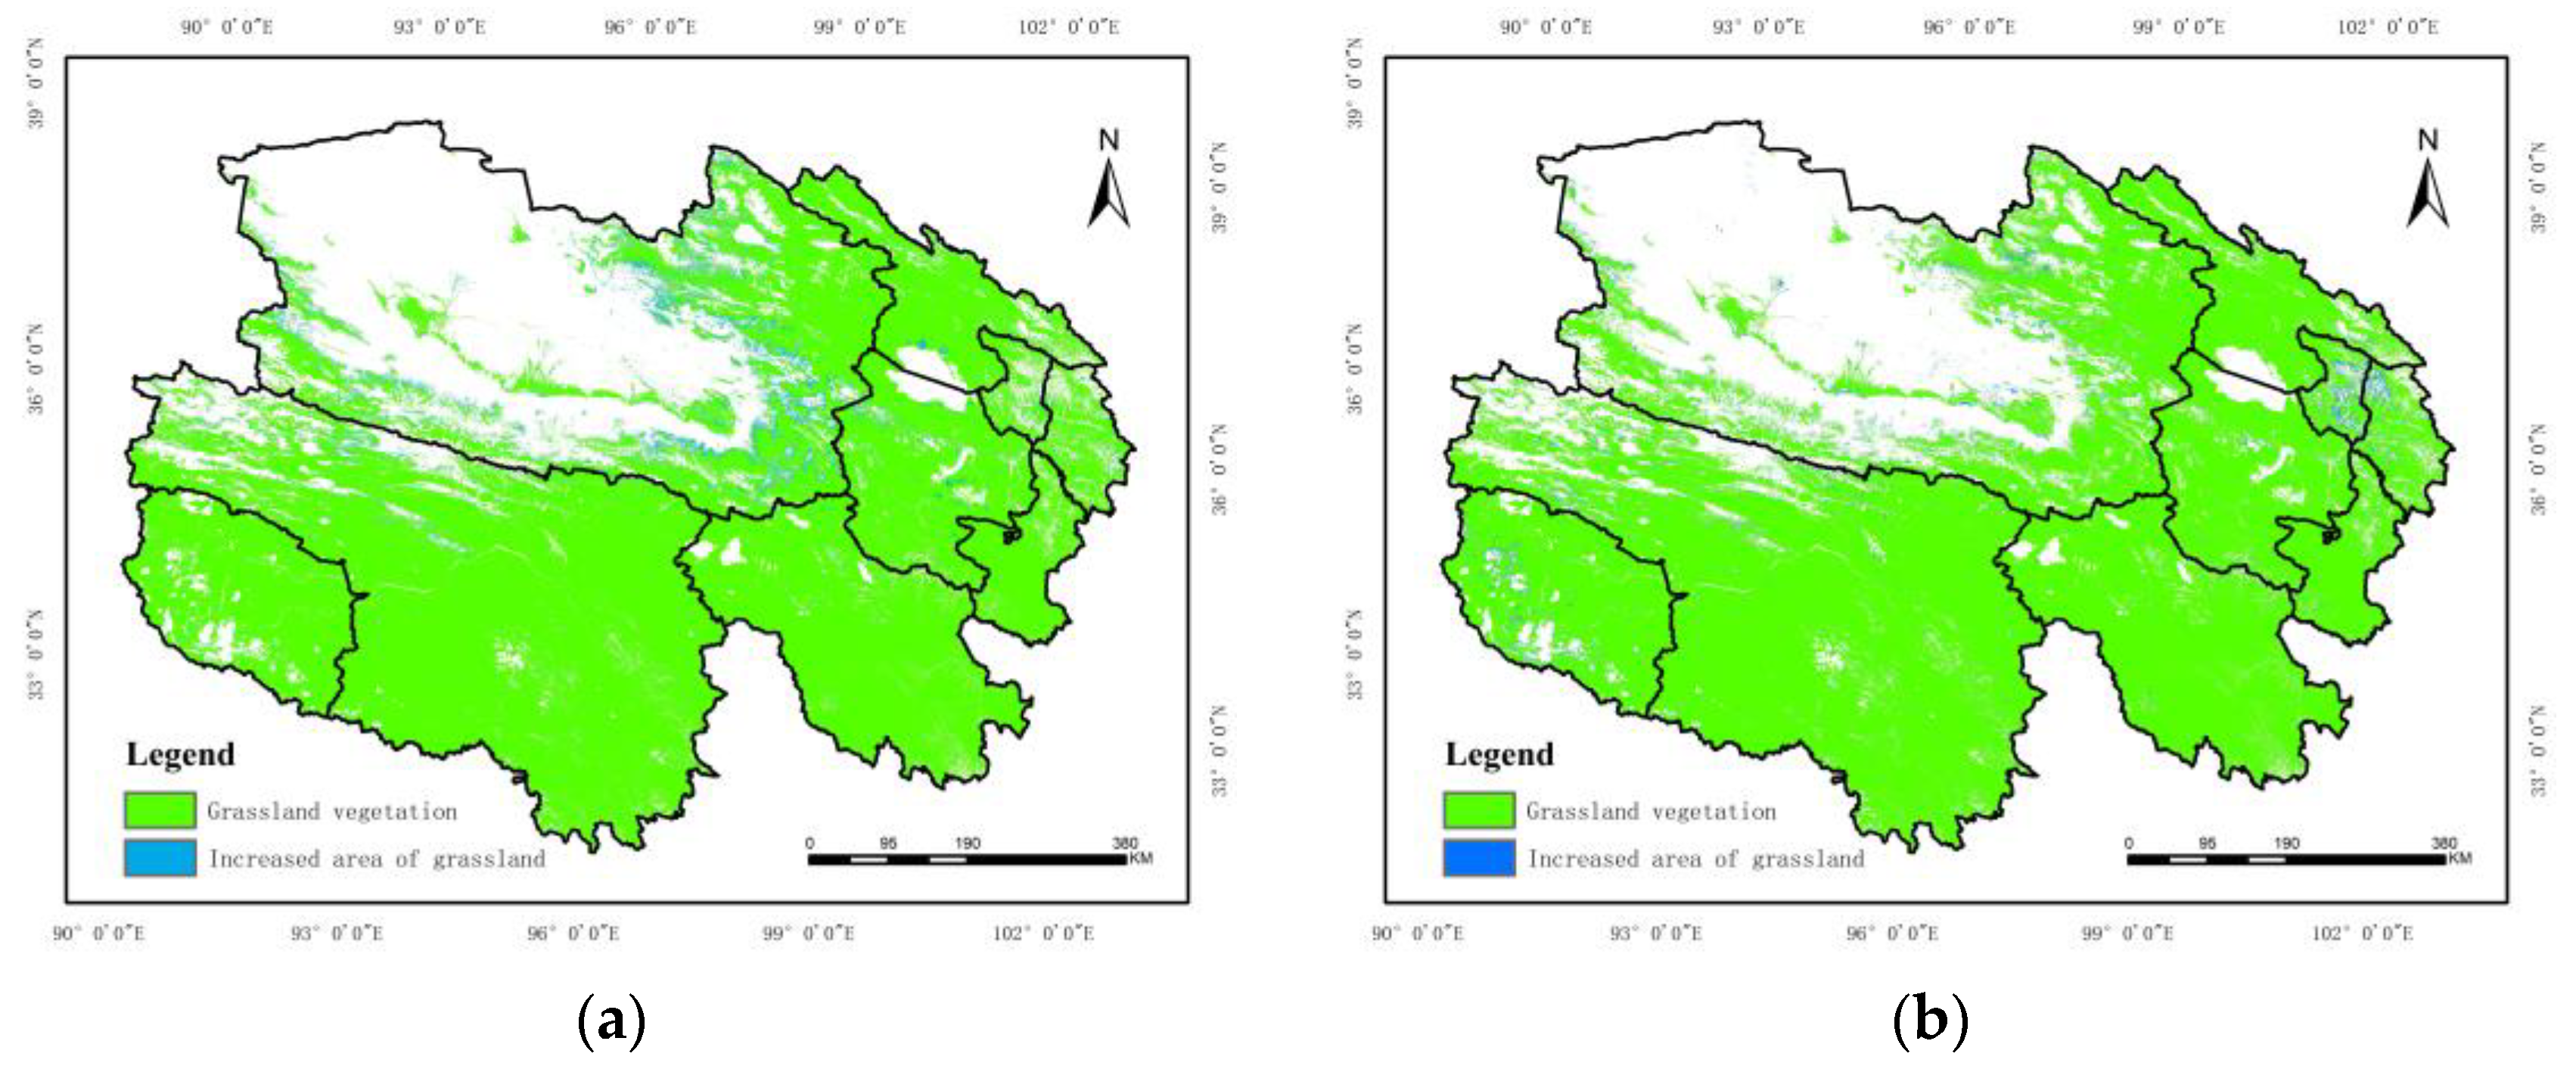
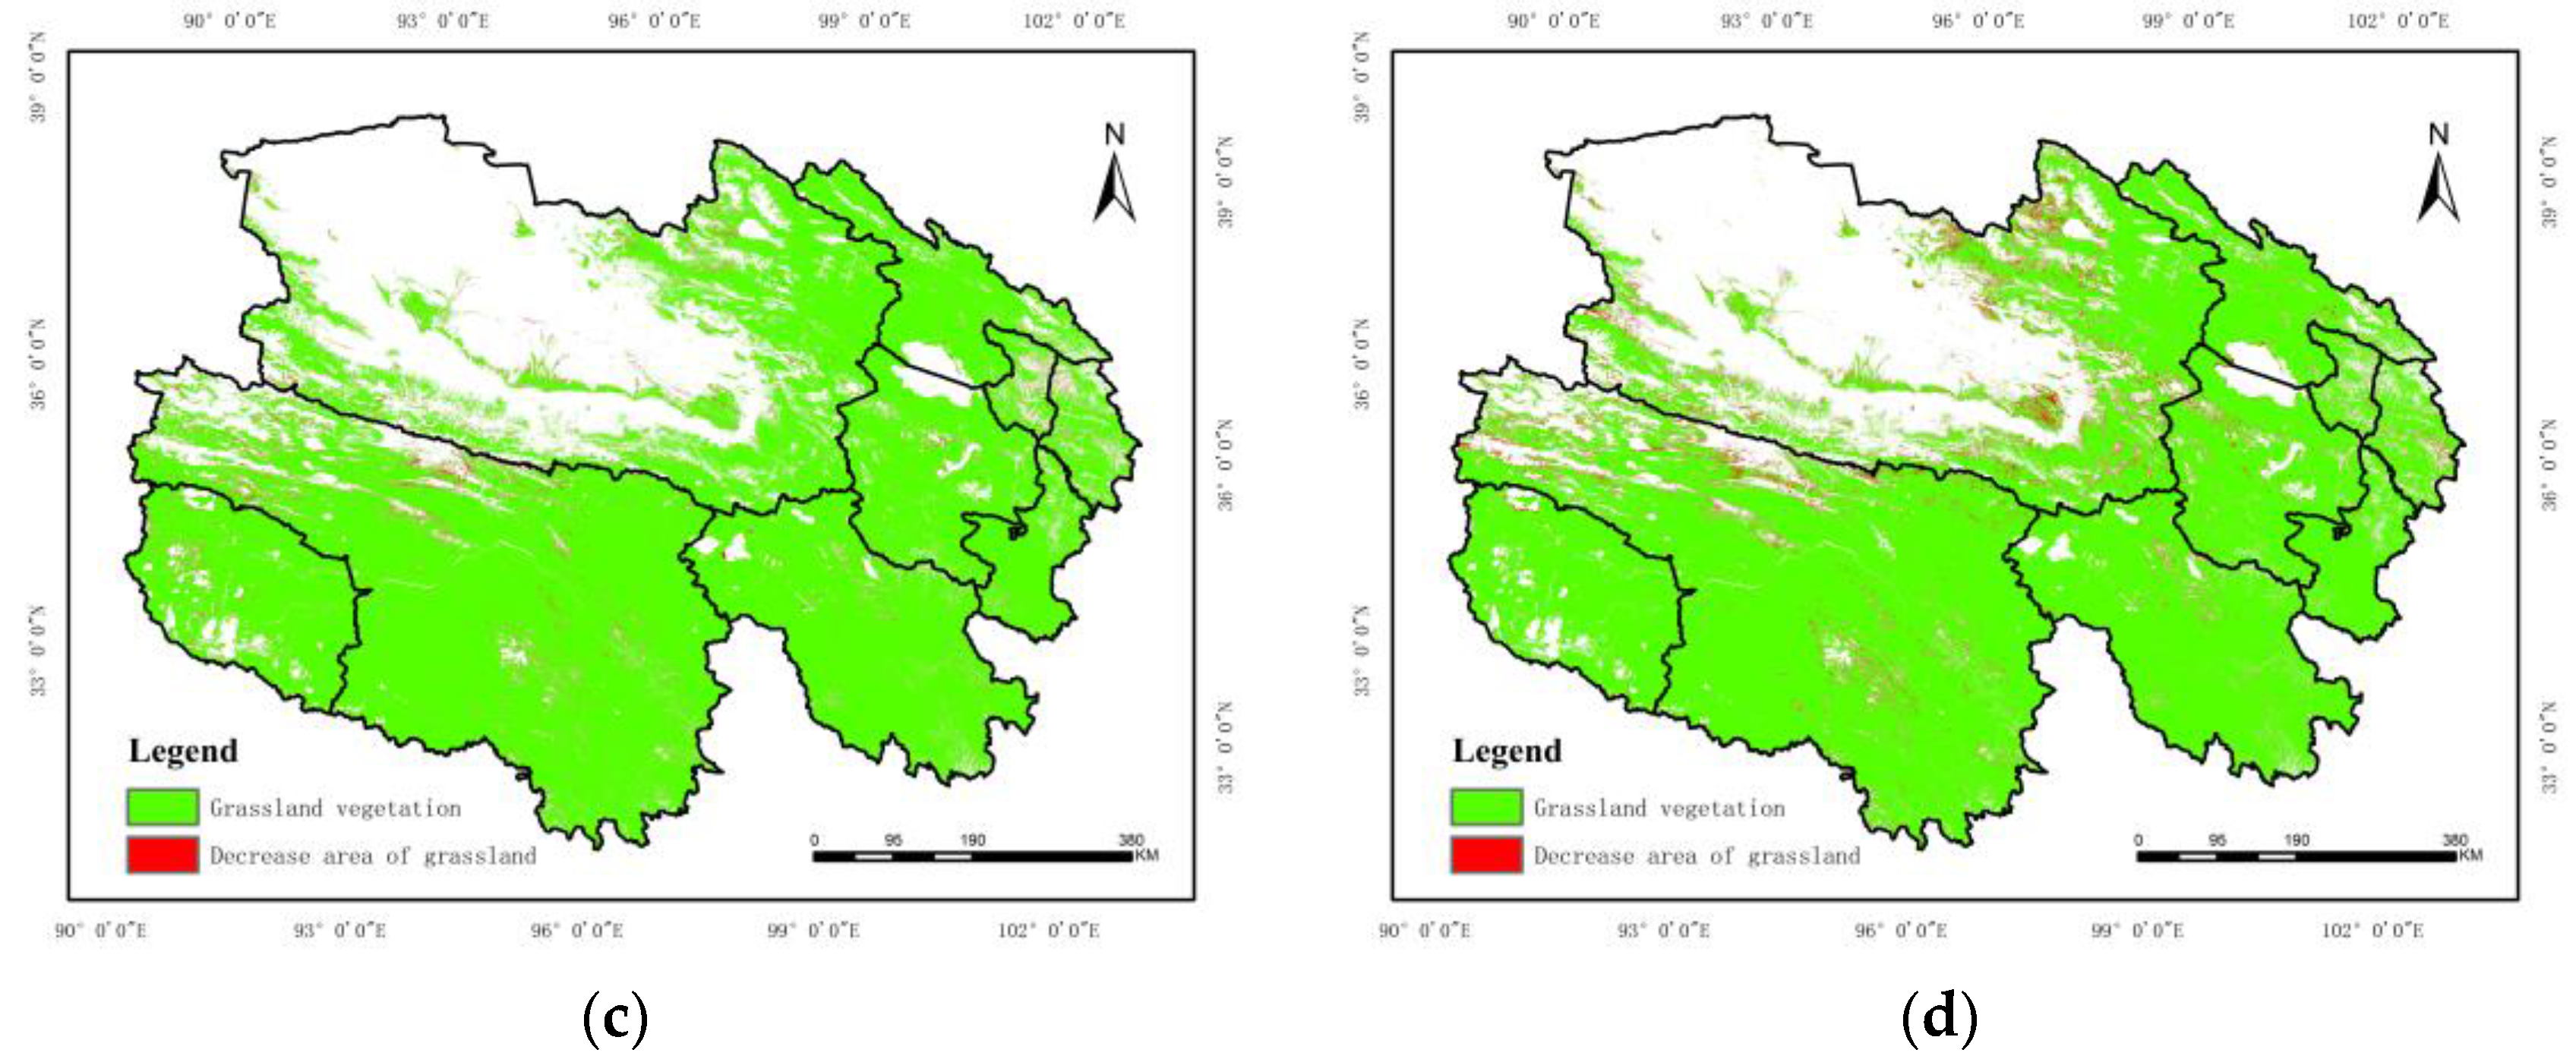
The time scale of grassland land use type is shown in Figure 3. From 2000 to 2010, the land use type of Qinghai Province has been transformed continuously, in which the area transformed from grassland to other land use types is 11,520 hm2. The area transformed mainly into desert or semi-desert is 8938 hm2. The area transformed into farmland and water area is 823 hm2 and 596 hm2, respectively. Other land use types are transformed into grassland areas of 17,853 hm2, into desert or semi-desert transformation areas of 15,945 hm2, followed by farmland areas of 128 hm2. Grassland-type area has increased by 6332 hm2. From 2010 to 2021 in Qinghai Province, the transformation amplitude of land use types was greater compared to the previous decade. The largest change involved 21,735 hm2 of grassland being converted to other land use types. Specifically, 19,057 hm2 of grassland were transformed into desert or semi-desert areas. Additionally, 979 hm2 were converted to farmland, 763 hm2 to water, and 541 hm2 to shrubland. The area transformed from other land use types to grassland is 11,923 hm2, and the area transformed mainly from desert or semi-desert is 8986 hm2, followed by farmland and shrubs at, respectively, 979 hm2, 763 hm2, and 541 hm2. The area transformed from other land use types to grassland is 11,923 hm2, and the area transformed mainly from desert or semi-desert is 8986 hm2, followed by the area of agricultural land at 1781 hm2, respectively.

4.2. Benchmark Regression Results

Firstly, the model is regressed using mixed effects, random effects, and fixed effects, respectively, and the mixed effects model is excluded by F-test and LM-test. Secondly, the Hausman test and the results show that the selection of the fixed effects model is preferable to the random effects model. Table 5 reports the regression results of the fixed effect models of temperature increase and precipitation increase, before and after adding the control variables in turn. The regression results of the time fixed effects of temperature increase on the ecosystem service value of grassland meadows before adding control variables are given in Table 5, Model 1 and Model 2, respectively. This paper mainly focuses on the estimation results of the temperature coefficients. Model 1 in Table 5 does not add control variables. The results show a 1% level of significance. Furthermore, temperature increase is negatively related to the change in the ecosystem service value of grassland meadows. Model 2 adds control variables, and the coefficient of temperature is −1.0857, which is significantly positive at a 5% level. Additionally, the regression results show that temperature increase reduces the value of ecosystem services of grassland meadows. Model 3 and Model 4, respectively, give the regression results of the time fixed effects on the value of ecosystem services of grassland meadows before adding the control variables. This paper mainly focuses on the estimation results of the coefficient of precipitation. Model 3 does not add the control variables. Moreover, the results show that the increase in precipitation is negatively related to the change in the value of ecosystem services of grassland meadows under the significance level of 5%. Model 4 adds control variables. The results of temperature are significantly positive under the 5% level, which shows that the increase in temperature decreases the value of ecosystem services of grassland meadows. Model 4 adds control variables. The coefficient of temperature is −2.6185, which is significantly positive at a 1% level. The regression results show that the increase in temperature decreases the ecosystem service value of grassland meadows. This verifies previous theoretical analysis and research Hypotheses H1a and H1b.

4.3. Robustness Tests

(i) Reverse causality resolution: To further enhance the robustness of the findings and mitigate the impact of reverse causality endogeneity, this paper lags the core explanatory variables by one period and then conducts regression tests again. We also adopt the lagged annual average temperature and precipitation as explanatory variables and conducting regressions. The test results are shown in columns Model 5 and Model 6 of Table 6. According to Model 5 and Model 6, the core explanatory variables are still significantly positive at the 1% level after one period of lagging, which enhances the robustness of the findings of this paper.
(ii) Resolution of omitted variables: To control the impact of potential omitted variables on the estimation results as much as possible, this paper mitigates the impact of omitted variables by controlling for more high-dimensional fixed effects as well as control variables. Based on the baseline regression, this paper further controls for region–time fixed effects to account for factors that are common to different regions and do not vary over time. The regression results are shown in columns Model 7 and Model 8 of Table 6. After controlling for region–time fixed effects, the annual average temperature coefficients of the core explanatory variables remain significantly negative at the 10% level. However, the coefficient of mean annual precipitation for the core explanatory variable is not significant.
(iii) Addressing endogeneity using instrumental variables: Using either lags of the core explanatory variables or controlling for fixed effects in higher dimensions can only mitigate endogeneity to some extent. To ensure the robustness of the results, and to further address the possible omitted variables and reverse causality, it is necessary to use instrumental variables to solve the problem. The difficulty of this operation lies in the selection of instrumental variables. The appropriate instrumental variables need to meet the requirements of correlation and homogeneity at the same time. Based on this, this paper selects the coefficient of air circulation and humidity as the instrumental variables of annual average temperature and annual average precipitation, respectively. Theoretically, when the temperature is the same, the plateau grassland ecosystem in the area with a low air circulation coefficient (ACC) will be affected more. Moreover, the ACC only depends on regional climate conditions and other natural phenomena. So, it can be said that the ACC affects the value of plateau grassland ecosystem services through the influence of the annual average temperature. Average humidity and the value of ecosystem services of plateau grassland are directly related. The higher the average humidity, the higher the value of ecosystem services of plateau grassland. Because the vegetation of plateau grassland and the amount of water needed for the growing environment tend to limit the growth of ecosystem services of plateau grassland, it can be said that average humidity is one of the necessary conditions to limit the increase in ecosystem services of plateau grassland. Firstly, using Hausman’s test of the instrumental variables of air flow coefficient and average humidity, the results reject the original hypothesis. The selected instrumental variables of air flow coefficient and average humidity are related to the core explanatory variables, but they are not related to the error term. The results of the two-stage regression test are shown in Table 6, according to columns Model 9 and Model 10. The instrumental variables are significantly negative and positive at the 1% level. This indicates that the lower the air flow coefficient and average humidity, the higher the value of grassland ecosystem services.

4.4. Heterogeneity Test

(i) Heterogeneity of whether there is a Three-River-Source National Park protected area within the administrative area: According to whether there is a Three-River-Source National Park within the area, the eight administrative areas are divided into two groups, including Three-River-Source National Park and not containing Three-River-Source National Park. The group containing Three-River-Source National Park is assigned a value of 1 and the group not containing Three-River-Source National Park is assigned a value of 0, after which the group regression is carried out. Finally, the results are shown in Table 7. In Model 11 and Model 12 of Table 7, the relationship between temperature increase and the area containing the Three-River-Source National Park is not significant. This indicates that in the Three-River-Source National Park, temperature increase does not significantly inhibit the ecological service value of grassland ecosystems. This is probably due to the continuous protection of the Three-River-Source National Park and ecosystem restoration, which makes the highland grassland ecosystems in the reserve more stable. The relationship between temperature increase and areas not including the Three-River-Source National Park is negatively significant at the 5% level. This indicates that temperature increase has the effect of suppressing the service value of plateau grassland ecosystems in areas not including the Three-River-Source National Park. In Model 13 and Model 14, the regression coefficient of the area containing the Three-River-Source National Park is 0.0153, which is significant at the 10% level. This indicates that an increase in precipitation has the effect of increasing the ecosystem service value of plateau grassland in the area containing the Three-River-Source National Park. In addition, this indicates that in the area containing the Three-River-Source National Park, an increase in precipitation has the effect of increasing the ecological service value of plateau grassland. In the area not containing the Three-River-Source National Park, this effect is not significant. This is probably due to the horizontal distribution of latitude. The Three-River-Source National Park is in the south and east of Qinghai Province. The area not containing the Three-River-Source National Park is close to the water-scarce Heshi Corridor and Taklamakan Desert. Additionally, there is also the arid Tsaidam Basin. Therefore, the effect of the increase in precipitation on the ecological service value of plateau grassland in the area not containing the Three-River-Source National Park is not obvious. Therefore, part of Hypothesis H3 is verified.
(ii) Distinguishing altitude heterogeneity: To further explore the heterogeneity of mean altitude in vertical distribution, the eight administrative districts are divided into two groups, a high-altitude group and a low-altitude group, with a mean altitude of 3300 m as the boundary to test the difference of the influence of high altitude and low altitude on the ecosystem service value of plateau grassland. The low-altitude group is assigned a value of 1 and the high-altitude group is assigned a value of 0 to carry out the subgroup regression. The results are shown in Table 8. From Model 15 and Model 16, it can be seen that the regression coefficients of temperature increase in high- and low-altitude groups are significant at a 5% level. However, the coefficient of the high-altitude group is −0.6511, which is 283.27% lower than that of the low-altitude group. From columns Model 17 and Model 18, it can be seen that the regression coefficient of increased precipitation is significant at a 1% level for the low-altitude group and insignificant for the high-altitude group. A possible reason is that the grassland vegetation and ecosystems at high altitude decrease with the increase in altitude. Meanwhile, the water loss at altitude is serious, and there is less space for the role of precipitation increase in the ecosystem service value of plateau grassland, which verifies Hypothesis H4.
(iii) Temporal heterogeneity of the continuous grassland carrying pressure index: To test whether the different states of the grassland carrying pressure index promote the ecosystem service value of plateau grassland and whether the value is different due to the continuous state of the grassland carrying pressure index, the median value of the continuous state (intermediate uninterrupted) in years (11 years) is divided into two groups. The area of a continuous low grassland carrying pressure index state is assigned a value of 1. The state of a discontinuous low grassland carrying pressure index is assigned a value of 0. Moreover, group regression is carried out. Finally, the results are shown in Table 9. The results show that the regression coefficients of a continuous low stress index on the ecosystem service value of plateau grassland are positively significant at the levels of 5% and 1% for increases in temperature and precipitation, respectively. This indicates that the low stress of plateau grassland is favorable to the growth of the ecosystem service value of plateau grassland from climatic factor changes. The regression coefficients of the carrying pressure index state of plateau grassland and discontinuous grassland on the ecosystem service value of plateau grassland are not significant. Therefore, it can be concluded that the continuous grassland low-bearing pressure index state brings more value to the plateau grassland ecosystem and promotes the growth of regional ecosystem service value.

4.5. Analysis of the Mechanism of Action

Table 10 shows the specific regression results of the mediation model. Among them, firstly, Model 23 and Model 24 are the explanatory variables of the grass–animal balance index. The results show that the coefficients of temperature increase and precipitation increase on the grass–animal balance index are significantly negative, indicating that temperature increase and precipitation increase significantly reduce the supply capacity of grassland resources. Secondly, Model 25 and Model 26 are the regression results of the second step of the mediation model. Compared with the service value of plateau grassland ecosystems with respect to temperature increase and precipitation increase, the coefficients of temperature and precipitation increase are 56.75% and 65.80%, respectively. Model 25 and Model 26 are the regression results of the second step of the mediating effect model. Compared with the increase in temperature and precipitation, the coefficients of temperature and precipitation increase are 56.75% and 65.80%, respectively. This shows that the positive index of the grass–animal balance significantly inhibits the service value of grassland ecosystems in plateau grassland in terms of the increase in temperature and precipitation. It can be judged that the grass–animal balance plays a mediating role in the relationship between climate factor changes and the service value of the plateau grassland ecosystem. Thus, Hypothesis H2 is verified.

5. Discussion

Climate change is the main factor affecting the value of ecosystem services in upland grasslands, which is consistent with the results of numerous studies [43,44,45]. However, different from their findings is the finding that higher temperatures and increased precipitation inhibit the value of ecosystem services. This is because climate change directly affects the vegetation growth cycle. Firstly, in the plateau region of the Tibetan Plateau, vegetation has adapted to a specific low-temperature environment after a long period of evolution, whereas excessively high temperatures may, on the contrary, lead to the growth restriction or death of certain plant species. Secondly, high temperatures accelerate the evaporation of soil moisture, which affects the growth of plants. This can lead to a decrease in the vegetation cover of the grassland and accelerate the reproduction rate of some pests and diseases, which can cause harm to grassland plants. Thirdly, the Tibetan Plateau is a drought-tolerant area. An increase in precipitation may reduce the number of plants that are adapted to arid environments. Fourthly, extreme rainfall may exacerbate soil erosion and reduce grassland productivity.
An important factor in the sustainable development of grassland is the balance of grass and livestock. A reasonable grassland carrying capacity is one of the core factors ensuring that grassland ecosystems can maintain a healthy vegetation cover and soil quality [46]. However, this is in conflict with Ren et al., who state that human activities are the main cause of grassland degradation [47]. Reasonable grazing is an important guarantee in terms of coping with an increase in precipitation because it promotes the renewal and regeneration of grassland plants, restores damaged ecosystems, increases the content of organic matter in the soil, improves the soil structure, and increases the water storage capacity and fertility of the soil. Meanwhile, this helps grassland ecosystems to better cope with changes in precipitation patterns, especially in arid or semi-arid areas.
The greater resilience of the ecosystems of the Three-River-Source National Park in response to climate change is consistent with the results of previous research on nature reserves [48]. This is because the Three-River-Source National Park is located in the hinterland of the Qinghai-Tibetan Plateau and possesses rich natural resources and vast, fragile ecosystems. It has rich biodiversity and ecosystem diversity, maintaining stability and resilience in the face of environmental change. Ecosystem interactions enhance the ecological resilience of the entire region. The implementation of ecological restoration projects has improved the self-recovery capacity of ecosystems.
There is a significant difference between the resilience of high- and low-altitude regions in the face of changes from climate factors. Compared with the results of previous studies, it was found that high-altitude regions deal with a greater number of factors affecting the value of ecosystem services due to climate change [49,50]. This difference is mainly determined by geographic and ecological characteristics with lower temperatures at high altitudes. Small changes in temperature may have a significant impact on ecosystems. Precipitation is low and erratic at high altitudes. Moreover, changes in precipitation patterns affect vegetation growth and ecosystem stability. Ecosystems at high altitudes tend to be more fragile and have longer recovery periods once damaged.

6. Conclusions and Recommendations for Countermeasures

6.1. Conclusions

Based on the panel data of eight administrative districts in Qinghai Province from 2000–2021, the model parameters are calibrated using the air flow coefficient and annual average humidity. On this basis, the grass–animal balance index is introduced to study the impacts of natural factors and anthropogenic activity factors on the ecological service value of plateau grassland. (1) The ecological service value of grassland is spatially concentrated in the west. The change in ecological service value is larger in some areas. The ecological service value of grassland fluctuates over time by increasing and then decreasing. Land use type changes are mainly desert or semi-desert, farmland, and wetland. (2) Increased temperature and precipitation among the changes in climatic factors suppresses the ecosystem service value of plateau grassland, and this result is verified by multiple robustness tests and endogeneity tests. (3) The grass–animal balance index acts as a mediator in the role of climate factor changes in the service value of plateau grassland ecosystems. It can effectively mitigate the adverse effects of climate factor changes. (4) The establishment of Three-River-Source National Park is more conducive to the protection of plateau grassland ecosystems; low-altitude areas are more sensitive to changes in climatic factors; and successive low grassland carrying pressure is more conducive to the output of plateau grassland ecosystem values.

6.2. Suggestions and Shortcomings

The above conclusions provide some new ideas for the protection and utilization of plateau grassland ecosystems. The impacts of climate factor changes are wide-ranging and long-lasting. The restoration of plateau grassland ecosystems has a certain lagging effect. Specific measures can be focused on the following three aspects: Firstly, the government should have foresight and precedence when it is planning a conservation program of plateau ecosystems in order to stabilize and build an articulation system between external energy input and internal balanced development. Secondly, the government should formulate a compensation mechanism for the balance of grass and livestock according to differences in regional characteristics in order to improve the income of herdsmen and increase their motivation to protect the grassland. Thirdly, the government should improve the prediction level of climate factor changes, use the prediction results to plan the ecological protection and industrial structure of the plateau, and improve the use of science and technology in the protection of ecosystems so that managers can adjust the amount of rainfall artificially and accurately.
At the same time, there are some limitations in this paper: (1) The coefficient of ecological service value used in this paper is 2014. Due to changes in the ecosystem itself and regional heterogeneity, the coefficient of ecological value is effective, and this study uses 2014, which is 9 years ago. (2) Regarding the grassland LULC classification, this paper puts all grasslands under the natural grassland level one classification. There is an accounting error for the grass production capacity of grasslands and the refinement of the ecological service value of different types of grasslands. (3) Due to the lack of data, this paper adds the grass production capacity of forbidden areas to the total grass production capacity.

Author Contributions

Conceptualization, J.Z. and P.C.; methodology, P.C.; software, J.Z.; validation, P.C.; formal analysis, J.Z.; investigation, J.Z.; resources, J.Z.; data curation, J.Z. and P.C.; writing—original draft preparation, J.Z. and P.C.; writing—review and editing, P.C.; visualization, J.Z.; supervision, J.Z.; project administration, P.C.; funding acquisition, J.Z. All authors have read and agreed to the published version of the manuscript.

Funding

This study was funded by the project the Humanities and Social Sciences Fund of Ministry of Education of China (21YJC790021).

Institutional Review Board Statement

Not applicable.

Informed Consent Statement

Not applicable.

Data Availability Statement

The data presented in this study are available on request from the corresponding author.

Conflicts of Interest

The authors declare no conflicts of interest.

References

  1. Li, H.M.; Wang, X.C.; Zhao, X.F.; Qi, Y. Understanding systemic risk induced by climate change. Adv. Clim. Change Res. 2021, 12, 384–394. [Google Scholar] [CrossRef]
  2. Sheng, Z.G.; Zhu, X.Z.; Hui, W.Y. Adaptation of terrestrial ecosystems to global change. Adv. Earth Sci. 2004, 19, 642. [Google Scholar]
  3. Zhan, W.; Du, D.; Ding, J.; Zhang, W.; Zheng, M.; Li, L.; Kong, Q.; Chen, M.; Shi, F.; Xu, Z. Research on urban safety early warning systems and emergency response mechanisms in snowstorms. Emerg. Manag. Sci. Technol. 2023, 3, 10. [Google Scholar] [CrossRef]
  4. Wang, J.; Liu, Y.; Cao, W.; Li, W.; Wang, X.; Zhang, D.; Shi, S.; Pan, D.; Liu, W. Effects of grazing exclusion on soil respiration components in an alpine meadow on the north-eastern Qinghai-Tibet Plateau. CATENA 2020, 194, 104750. [Google Scholar] [CrossRef]
  5. Guo, Y.R.; Ning, J.; Lou, S.N.; Zhang, C.; Zhu, W.H.; Hou, F.J. Grazing regulates soil N cycling of annual pastures by enhancing soil N turnover in arid climate condition. Land Degrad. Dev. 2023, 34, 5733–5743. [Google Scholar] [CrossRef]
  6. Bai, L.; Tian, J.; Peng, Y.; Huang, Y.; He, X.; Bai, X.; Bai, T. Effects of climate change on ecosystem services and their components in southern hills and northern grasslands in China. Environ. Sci. Pollut. Res. 2021, 28, 44916–44935. [Google Scholar] [CrossRef]
  7. Gao, H.M.; Jiang, F.; Chi, X.W.; Li, G.Y.; Cai, Z.Y.; Qin, W.; Zhang, J.J.; Wu, T.; Zhang, T.Z. The carrying pressure of livestock is higher than that of large wild herbivores in Yellow River source area, China. Ecol. Model. 2020, 431, 109163. [Google Scholar] [CrossRef]
  8. Ren, Y.H.; Zhu, Y.P.; Baldan, D.; Fu, M.D.; Wang, B.; Li, J.S.; Chen, A.P. Optimizing livestock carrying capacity for wild ungulate-livestock coexistence in a Qinghai-Tibet Plateau grassland. Sci. Rep. 2021, 11, 3635. [Google Scholar] [CrossRef]
  9. Xu, Y.; Xiao, F. Assessing Changes in the Value of Forest Ecosystem Services in Response to Climate Change in China. Sustainability 2022, 14, 4773. [Google Scholar] [CrossRef]
  10. Fenta, A.A.; Tsunekawa, A.; Haregeweyn, N.; Tsubo, M.; Yasuda, H.; Shimizu, K.; Kawai, T.; Ebabu, K.; Berihun, M.L.; Sultan, D.; et al. Cropland expansion outweighs the monetary effect of declining natural vegetation on ecosystem services in sub-Saharan Africa. Ecosyst. Serv. 2020, 45, 101154. [Google Scholar] [CrossRef]
  11. Li, Q.F.; Wang, L.; Du, G.M.; Faye, B.; Li, Y.K.; Li, J.C.; Liu, W.; Qu, S.J. Dynamic Variation of Ecosystem Services Value under Land Use/Cover Change in the Black Soil Region of Northeastern China. Int. J. Environ. Res. Public Health 2022, 19, 7533. [Google Scholar] [CrossRef] [PubMed]
  12. Zheng, W.X.; Zhang, J. Study on the Spatial and Temporal Evolution of Ecosystem Service Values and Driving Mechanism in the Yan River Basin from 1990 to 2020. Sustainability 2023, 15, 12550. [Google Scholar] [CrossRef]
  13. He, Z.; Shang, X.; Zhang, T.; Yun, J. Coupled regulatory mechanisms and synergy/trade-off strategies of human activity and climate change on ecosystem service value in the loess hilly fragile region of northern Shaanxi, China. Ecol. Indic. 2022, 143, 109325. [Google Scholar] [CrossRef]
  14. Costanza, R.; d’Arge, R.; de Groot, R.; Farber, S.; Grasso, M.; Hannon, B.; Limburg, K.; Naeem, S.; O’Neill, R.V.; Paruelo, J.; et al. The value of the world’s ecosystem services and natural capital. Nature 1997, 387, 253–260. [Google Scholar] [CrossRef]
  15. Richter, F.; Jan, P.; El Benni, N.; Lüscher, A.; Buchmann, N.; Klaus, V.H. A guide to assess and value ecosystem services of grasslands. Ecosyst. Serv. 2021, 52, 101376. [Google Scholar] [CrossRef]
  16. VanderWilde, C.P.; Newell, J.P. Ecosystem services and life cycle assessment: A bibliometric review. Resour. Conserv. Recycl. 2021, 169, 105461. [Google Scholar] [CrossRef]
  17. Nemec, K.T.; Raudsepp-Hearne, C. The use of geographic information systems to map and assess ecosystem services. Biodivers. Conserv. 2013, 22, 1–15. [Google Scholar] [CrossRef]
  18. Terrado, M.; Acuna, V.; Ennaanay, D.; Tallis, H.; Sabater, S. Impact of climate extremes on hydrological ecosystem services in a heavily humanized Mediterranean basin. Ecol. Indic. 2014, 37, 199–209. [Google Scholar] [CrossRef]
  19. 19. Ding, X.; Liu, H.; Zhang, J.; Shen, Y.; Yang, G. Does the local government multi-objective competition intensify the transfer of polluting industries in the Yangtze River Economic Belt? Environ. Res. 2024, 245, 118074. [Google Scholar]
  20. Müller, F.; Bicking, S.; Ahrendt, K.; Dang, K.B.; Zelen, J. Assessing ecosystem service potentials to evaluate terrestrial, coastal and marine ecosystem types in Northern Germany—An expert-based matrix approach. Ecol. Indic. 2020, 112, 106116. [Google Scholar] [CrossRef]
  21. Schroter, D.; Cramer, W.; Leemans, R.; Prentice, I.; Araujo, M.; Arnell, N.; Bondeau, A.; Bugmann, H.; Carter, T.; Gracia, C. Ecosystem service supply and vulnerability to global change in Europe. Science 2005, 310, 1333–1337. [Google Scholar] [CrossRef] [PubMed]
  22. Briner, S.; Elkin, C.; Huber, R. Evaluating the relative impact of climate and economic changes on forest and agricultural ecosystem services in mountain regions. J. Environ. Manag. 2013, 129, 414–422. [Google Scholar] [CrossRef] [PubMed]
  23. Alva-Basurto, J.C.; Arias-González, J.E. Modelling the effects of climate change on a Caribbean coral reef food web. Ecol. Model. 2014, 289, 1–14. [Google Scholar] [CrossRef]
  24. Rocca, M.E.; Miniat, C.F.; Mitchell, R.J. Introduction to the regional assessments: Climate change, wildfire, and forest ecosystem services in the USA. For. Ecol. Manag. 2014, 327, 265–268. [Google Scholar] [CrossRef]
  25. Dai, E.; Yin, L.; Wang, Y.; Ma, L.; Tong, M. Quantitative Assessment of the Relative Impacts of Land Use and Climate Change on the Key Ecosystem Services in the Hengduan Mountain Region, China. Sustainability 2020, 12, 4100. [Google Scholar] [CrossRef]
  26. Peng, J.; Tian, L.; Zhang, Z.; Zhao, Y.; Meersmans, J. Distinguishing the impacts of land use and climate change on ecosystem services in a karst landscape in China. Ecosyst. Serv. 2020, 46, 101199. [Google Scholar] [CrossRef]
  27. Sun, Z.G.; Sun, C.M.; Zhou, W.; Ju, W.M.; Li, J.L. Classification and Net Primary Productivity of the Southern China’s Grasslands Ecosystem Based on Improved Comprehensive and Sequential Classification System (CSCS) Approach. J. Integr. Agric. 2014, 13, 893–903. [Google Scholar] [CrossRef]
  28. Reside, A.E.; Vanderwal, J.; Moran, C. Trade-offs in carbon storage and biodiversity conservation under climate change reveal risk to endemic species. Biol. Conserv. 2017, 207, 9–16. [Google Scholar] [CrossRef]
  29. Linlin, G.; Xiaohua, G.; Yang, D.; Zhenqian, W.; Fu, G.; Fang, W. Increased growth of Qinghai spruce in northwestern China during the recent warming hiatus. Agric. For. Meteorol. 2018, 260, 9–16. [Google Scholar]
  30. Mina, M.; Bugmann, H.; Cordonnier, T.; Irauschek, F.; Klopcic, M.; Pardos, M.; Cailleret, M. Future ecosystem services from European mountain forests under climate change. J. Appl. Ecol. 2017, 54, 389–401. [Google Scholar] [CrossRef]
  31. Sarukhan, J.; Whyte, A.; Hassan, R.; Scholes, R.; Ash, N.; Carpenter, S.T.; Pingali, P.L.; Bennett, E.M.; Zurek, M.B.; Chopra, K. Millenium Ecosystem Assessment: Ecosystems and Human Well-Being; Island Press: Washington, DC, USA, 2005. [Google Scholar]
  32. Bestelmeyer, B.T.; Estell, R.E.; Havstad, K.M. Big Questions Emerging from a Century of Rangeland Science and Management. Rangel. Ecol. Manag. 2012, 65, 543–544. [Google Scholar] [CrossRef]
  33. Shao, Q.; Cao, W.; Fan, J.; Huang, L.; Xu, X. Effects of an ecological conservation and restoration project in the Three-River Source Region, China. J. Geogr. Sci. 2017, 27, 183–204. [Google Scholar] [CrossRef]
  34. Zhang, J.; Zhang, L.; Liu, W.; Qi, Y.; Wo, X. Livestock-carrying capacity and overgrazing status of alpine grassland in the Three-River Headwaters region, China. J. Geogr. Sci. 2014, 24, 303–312. [Google Scholar] [CrossRef]
  35. Song, X.P. Global Estimates of Ecosystem Service Value and Change: Taking Into Account Uncertainties in Satellite-based Land Cover Data. Ecol. Econ. 2018, 143, 227–235. [Google Scholar] [CrossRef]
  36. Egoh, B.; Rouget, M.; Reyers, B.; Knight, A.T.; Cowling, R.M.; Jaarsveld, A.S.V.; Welz, A. Integrating Ecosystem Services into Conservation Assessments: A Review; Elsevier: Amsterdam, The Netherlands, 2007. [Google Scholar]
  37. Xie, G.; Zhang, C.; Zhen, L.; Zhang, L. Dynamic changes in the value of China’s ecosystem services–ScienceDirect. Ecosyst. Serv. 2017, 26, 146–154. [Google Scholar] [CrossRef]
  38. Yang, J.; Huang, X. The 30 m annual land cover dataset and its dynamics in China from 1990 to 2021. Earth Syst. Sci. Data 2022, 13, 3907–3925. [Google Scholar] [CrossRef]
  39. Gao, J.; Zhao, X.-Q.; Liu, W.-T.; Yang, X.-X.; Zhang, C.-P.; Yu, Y.; Cao, Q.; Liu, Y.-Z.; Zhang, X.; Dong, Q.-M. Spatio-temporal analysis of the alpine grassland carrying capacity in Qinghai Province considering a supply-consumption relationship. Acta Prataculturae Sin. 2023, 32, 1. [Google Scholar]
  40. NY/T635-2002; Calculation of Proper Carrying Capacity of Rangelands. Agricultural Industry Standard of the People’s Republic of China: Beijing, China, 2002.
  41. Meng, L.I.; Yong-Tao, H.E.; Lin-Bo, Z.; Jian, S.; Pei-Li, S.; Xian-Zhou, Z. Dynamics of Grassland ANPP and Its’ Relationship with Climate Change and Carrying Capacity in the Three River Headwater Region. Chin. J. Grassl. 2017, 39, 49–56. [Google Scholar]
  42. Costanza, R.; Groot, R.D.; Sutton, P.; Ploeg, S.V.D.; Anderson, S.J.; Kubiszewski, I.; Farber, S.; Turner, R.K. Changes in the Global Value of Ecosystem Services; Elsevier: Amsterdam, The Netherlands, 2014. [Google Scholar]
  43. Brander, L.M.; de Groot, R.; Schägner, J.P.; Guisado-Goñi, V.; van ‘t Hoff, V.; Solomonides, S.; McVittie, A.; Eppink, F.; Sposato, M.; Do, L.; et al. Economic values for ecosystem services: A global synthesis and way forward. Ecosyst. Serv. 2024, 66, 101606. [Google Scholar] [CrossRef]
  44. Wang, H.; Zhou, S.; Li, X.; Liu, H.; Chi, D.; Xu, K. The influence of climate change and human activities on ecosystem service value. Ecol. Eng. 2016, 87, 224–239. [Google Scholar] [CrossRef]
  45. Xu, Y.; Xiao, F.; Liao, Y. Assessment of Grassland Ecosystem Service Value in Response to Climate Change in China. Diversity 2022, 14, 160. [Google Scholar] [CrossRef]
  46. Pettinotti, L.; de Ayala, A.; Ojea, E. Benefits from Water Related Ecosystem Services in Africa and Climate Change. Ecol. Econ. 2018, 149, 294–305. [Google Scholar] [CrossRef]
  47. Ren, H.; Liu, Y.; Wen, Z.; Shi, H.; Zhou, R.; Wang, Z.; Kareem, H.A.; Zhang, W. Untangling the effects of climate variation and human interference on grassland dynamics in North China. Land Degrad. Dev. 2024, 35, 467–483. [Google Scholar] [CrossRef]
  48. Zhang, J.; Wang, F.; Ding, X. Can agricultural mechanization promote carbon reduction in countries along the Belt and Road? J. Environ. Plan. Manag. 2024, 1–23. [Google Scholar] [CrossRef]
  49. Sannigrahi, S.; Zhang, Q.; Joshi, P.K.; Sutton, P.C.; Keesstra, S.; Roy, P.S.; Pilla, F.; Basu, B.; Wang, Y.; Jha, S.; et al. Examining effects of climate change and land use dynamic on biophysical and economic values of ecosystem services of a natural reserve region. J. Clean. Prod. 2020, 257, 120424. [Google Scholar] [CrossRef]
  50. Li, J.; Wang, W.; Hu, G.; Wei, Z. Changes in ecosystem service values in Zoige Plateau, China. Agric. Ecosyst. Environ. 2010, 139, 766–770. [Google Scholar] [CrossRef]
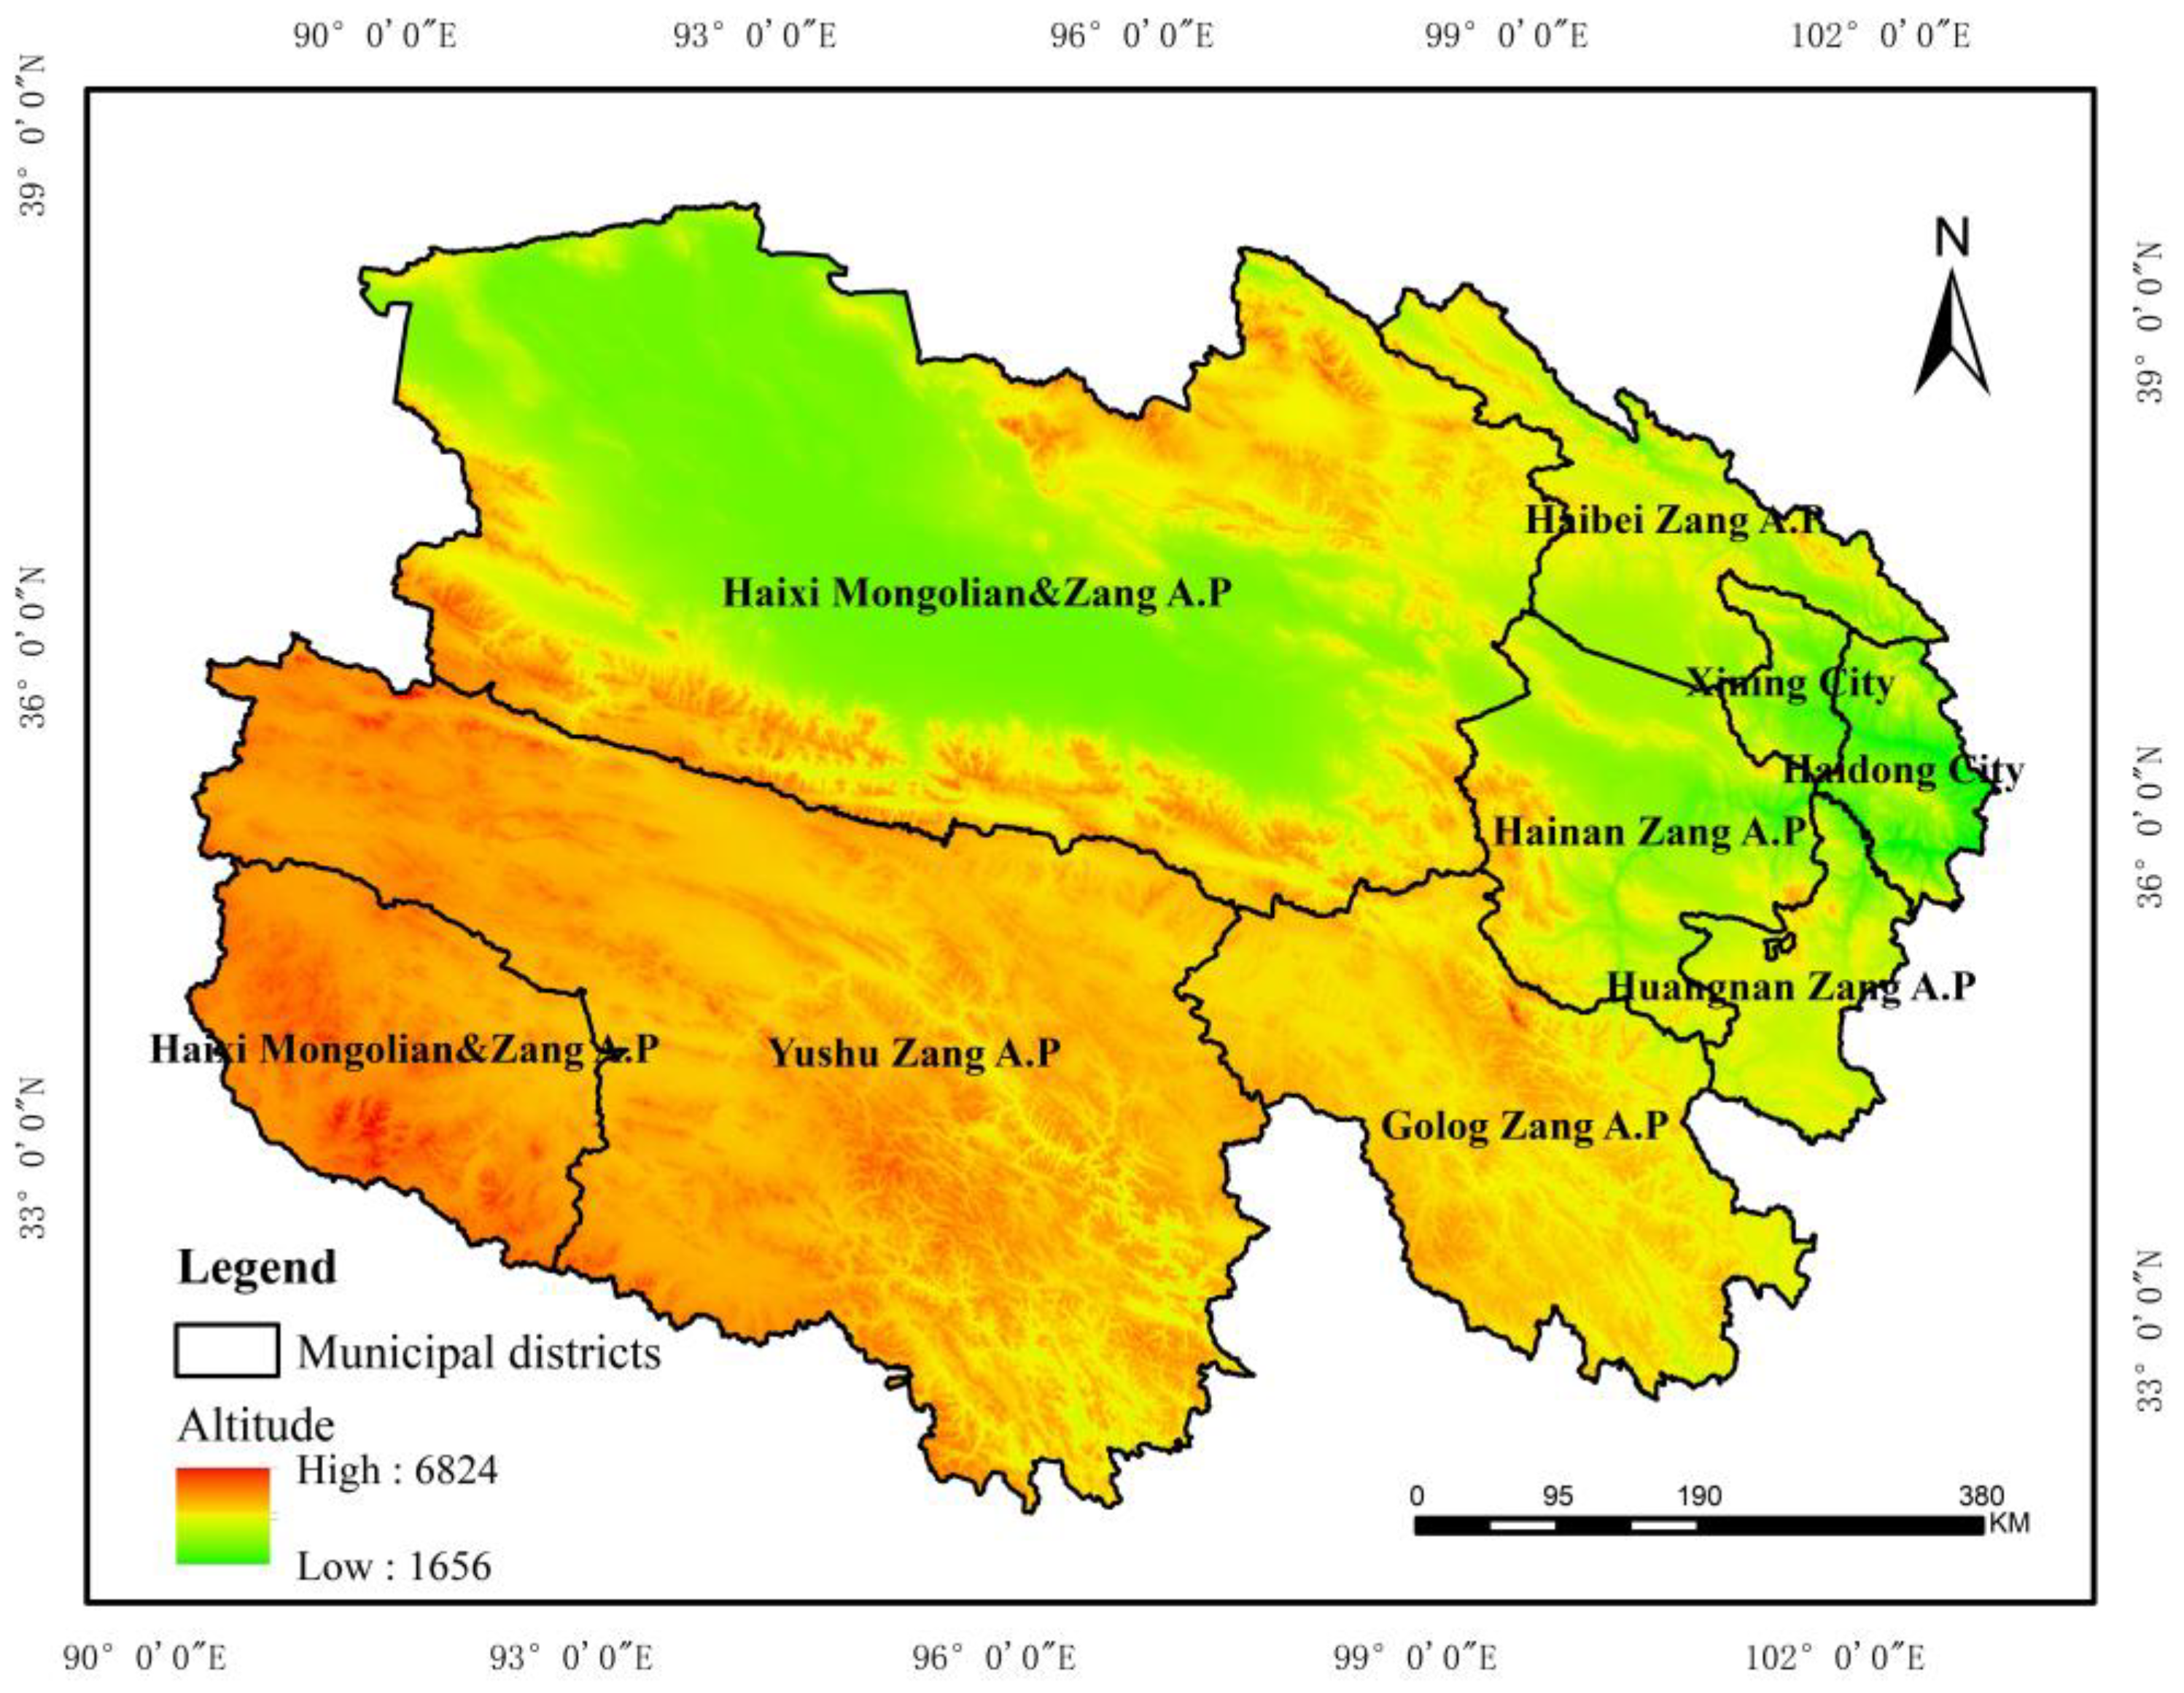
Figure 1. Location and digital elevation model (DEM) of Qinghai Province.
Sustainability 16 08463 g001
Figure 2. Ecological service value of grassland folding map.
Sustainability 16 08463 g002aSustainability 16 08463 g002b
Figure 3. Changes in land use in Qinghai, 2000–2021. (a) Increase in area of grassland in 2010 over 2000; (b) increase in area of grassland in 2021 over 2010; (c) decrease in area of grassland in 2010 over 2000; (d) decrease in area of grassland in 2021 over 2010.
Sustainability 16 08463 g003aSustainability 16 08463 g003b
Table 1. Conversion coefficients of sheep units.
Type of LivestockSheepCattleHorsesOther Large Livestock
Conversion factor1563
Table 2. Coefficients of ecosystem service values for grasslands [42].
TypeEcosystems ServicesGrass ($/hm2)
RegulatingAir regulation2.00
Climate regulation899.82
Disturbance regulation2.00
Water regulation2.00
Erosion control235.43
Waste disposal869.44
Pollination49.61
Biological control73.54
SupportingHabitat1105.21
Soil formation1.45
Nutrient cycling0.00
Water supply54.58
ProvisioningFood sources1085.09
Raw materials49.18
Genetic resources1105.21
CulturalRecreation23.67
Culture152.03
Table 3. Variable definition list.
Variable CategoryVariableSymbol
Explained variableValue of grassland ecosystem serviceslnGESV
Core explanatory variablesAverage annual precipitationlnPRCP
Average annual temperaturelnTMED
ModeratorGrassland–livestock balanceGLB
Control variableGross domestic product of
animal husbandry industry
lnGOV
Contribution rate of
animal husbandry to
primary industry
CRAH
Number of livestocklnNL
Grassland resource supplylnSNNP
Per capita GDPlnpcGDP
Per capita livestock quantityNAHpc
Industrial structure levelStru
Table 4. Descriptive statistics for key variables, 2000–2021.
VariableNMeanSDMinMedianMax
lnGESV17610.961.1539.10410.94712.66
GLB176−0.4450.579−2.108−0.5451
lnTMED1761.0350.541−0.4901.1331.765
lnPRCP1760.5750.290−0.2480.6481.031
lnGOV17611.640.8549.96111.69813.32
CRAH1760.8130.1570.3190.8520.997
lnSNNP17620.711.80919.2520.61842.60
lnpcGDP1769.7881.0247.8649.82112.78
NAHpc17615.2611.440.87116.53151.02
Stru1760.7700.1630.3180.7870.977
Table 5. Baseline regression results.
VARIABLESDependent Variable: Value of Grassland Ecosystem Services
Model 1Model 2Model 3Model 4
lnTMED−1.6322 ***
(−4.50)
−1.0857 **
(−2.97)
lnPRCP −1.9704 **
(−3.03)
−2.6185 ***
(−6.64)
lnGOV −1.2183 **
(−3.49)
−0.9899 ***
(−5.32)
CRAH 0.0655
(0.10)
1.4740 ***
(3.64)
lnNL 1.0926
(1.89)
−0.0604
(−0.16)
lnSNNP 0.0461
(0.92)
0.0334
(1.53)
lnpcGDP 0.8975 **
(3.46)
0.1090
(0.52)
NAHpc −0.0566 **
(−2.41)
0.0019
(0.24)
Stru −3.2072 **
(−2.61)
−5.1011 ***
(−8.51)
Constant12.6503 ***
(37.02)
13.1319 **
(2.39)
12.0930 ***
(35.60)
25.2925 ***
(8.01)
TIMEYesYesYesYes
IDNoNoNoNo
Observations176176176176
R-squared0.55590.87430.23620.9397
Robust t-statistics in parentheses, *** p < 0.01, ** p < 0.05.
Table 6. Robustness test regression results.
VARIABLESLag TermHigh-Dimensional FixationAir Movement IndexMean Humidity
Model 5Model 6Model 7Model 8Model 9Model 10
L.lnTMED−1.6096 ***
(−9.56)
L.lnPRCP −2.7928 ***
(−6.36)
lnTMED −0.0258 *
(−1.94)
−4.9782 ***
(−2.90)
lnPRCP −0.0071
(−0.29)
−2.8386 ***
(−12.21)
lnsun6.1292 ***
(4.67)
−0.3909
(−0.23)
0.0635
(1.15)
0.0529
(0.91)
10.9519 **
(2.39)
−3.8435 ***
(−6.45)
lnGOV−0.8469 ***
(−4.11)
−0.9639 ***
(−4.62)
0.0218 *
(1.91)
0.0195 *
(1.69)
0.7598
(0.90)
−0.6626 ***
(−5.23)
CRAH−0.5452
(−1.00)
1.5473 **
(3.21)
−0.0005
(−0.03)
−0.0020
(−0.12)
0.8579
(1.60)
1.1462 ***
(5.58)
lnNL0.6387
(1.37)
−0.0437
(−0.09)
0.0648 ***
(3.98)
0.0638 ***
(3.85)
0.6977
(1.40)
0.6827 ***
(3.16)
lnpcGDP0.3651 *
(2.09)
0.1259
(0.51)
0.0457 ***
(5.13)
0.0472 ***
(5.24)
−0.5075
(−0.74)
0.6135 ***
(6.28)
NAHpc−0.0409 *
(−2.26)
0.0037
(0.28)
−0.0027 ***
(−4.07)
−0.0025 ***
(−3.80)
−0.0726 ***
(−3.78)
0.0054
(0.63)
Stru−1.5169 ***
(−3.62)
−5.1388 ***
(−8.15)
−0.0610 *
(−1.75)
−0.0696 **
(−1.99)
7.0620
(1.39)
−4.3572 ***
(−9.65)
Constant−31.0360 ***
(−3.57)
28.6045 **
(2.49)
9.4780 ***
(20.32)
9.5624 ***
(19.47)
−83.3590 **
(−2.05)
42.7595 ***
(8.62)
TimeYesYesYesYesYesYes
IDNoNoYesYesNoNo
Observations168168176176176176
R-squared0.90380.93900.99990.99990.13240.8812
Robust t-statistics in parentheses, *** p < 0.01, ** p < 0.05, * p < 0.1.
Table 7. Regression of grouping whether the Three-River-Source National Park is included or not.
VARIABLESDependent Variable: Value of Grassland Ecosystem Services
Model 11Model 12Model 13Model 14
lnTMED0.0001
(0.04)
−0.0438 **
(2.37)
lnPRCP 0.0153 *
(1.91)
0.0002
(0.01)
lnsun0.0572 ***
(4.32)
−0.0986 *
(−1.74)
0.0723 ***
(5.64)
−0.0746
(−1.02)
lnGOV−0.0029
(−1.19)
−0.0257 ***
(−3.26)
−0.0027
(−1.13)
−0.0209 **
(−2.45)
CRAH0.0056
(0.86)
0.0661 ***
(3.84)
0.0050
(0.82)
0.0655 ***
(3.62)
lnNL−0.0143 *
(−1.88)
0.0983 ***
(4.01)
−0.0166 **
(−2.24)
0.0994 ***
(3.96)
lnpcGDP0.0055
(1.70)
0.0343 ***
(5.53)
0.0060 *
(1.83)
0.0312 ***
(4.78)
NAHpc0.0006 **
(2.44)
−0.0087 ***
(−13.23)
0.0006 **
(2.78)
−0.0088 ***
(−14.27)
Stru−0.0126
(−0.74)
−0.2143 ***
(−5.54)
−0.0132
(−0.75)
−0.2044 ***
(−5.15)
Constant11.0530 ***
(98.19)
10.7862 ***
(21.83)
10.9326 ***
(101.89)
10.6217 ***
(16.67)
Observations88888888
R-squared1.00000.99981.00000.9998
Robust t-statistics in parentheses, *** p < 0.01, ** p < 0.05, * p < 0.1.
Table 8. Regression of different average altitude groups.
VARIABLESDependent Variable: Value of Grassland Ecosystem Services
Model 15Model 16Model 17Model 18
lnTMED−2.9496 **
(−3.67)
−0.6511 **
(−3.98)
lnPRCP −1.9654 ***
(−12.90)
−1.0655
(−1.27)
lnsun−0.5296
(−0.32)
1.0675
(1.05)
−0.1546
(−0.13)
−2.2398 *
(−2.82)
lnGOV−1.2553 **
(−3.76)
−0.8069 **
(−5.19)
−0.8497 **
(−4.47)
−0.9700 ***
(−7.31)
CRAH−1.6888 **
(−3.73)
2.4189 **
(4.85)
0.0200
(0.05)
2.3063 **
(5.13)
lnNL1.1669 *
(2.54)
1.7673 ***
(7.08)
0.5701 *
(2.53)
1.7309 ***
(6.19)
lnpcGDP0.0798
(0.49)
−0.1070
(−0.57)
0.4478
(1.78)
−0.1639
(−0.80)
NAHpc−0.0409
(−0.93)
−0.0399 **
(−4.72)
0.0062
(1.33)
−0.0310 **
(−4.29)
Stru5.5379 **
(3.50)
−3.1240 **
(−4.33)
−2.2505
(−1.46)
−4.2158 ***
(−6.58)
Constant22.7233 *
(2.72)
3.3924
(0.45)
16.7093
(2.31)
32.9759 ***
(5.85)
Observations88888888
R-squared0.96360.97330.98970.9622
Robust t-statistics in parentheses, *** p < 0.01, ** p < 0.05, * p < 0.1.
Table 9. Regression test of the heterogeneity of the grassland carrying pressure index.
VARIABLESDependent Variable: Value of Grassland Ecosystem Services
Model 19Model 20Model 21Model 22
lnTMED0.0101 **
(2.29)
−0.0066
(−0.61)
lnPRCP 0.0450 ***
(2.88)
−0.0169
(−0.93)
lnsun0.0334
(0.94)
0.0002
(0.01)
0.0872 ***
(3.89)
−0.0204
(−0.50)
lnGOV−0.0049
(−0.50)
−0.0247 ***
(−3.62)
−0.0039
(−0.47)
−0.0253 ***
(−3.78)
CRAH−0.0611 **
(−2.78)
0.0648 ***
(3.66)
−0.0519 **
(−2.56)
0.0632 ***
(3.92)
lnNL−0.0213
(−1.21)
0.0654 ***
(3.79)
−0.0164
(−1.02)
0.0670 ***
(4.16)
lnpcGDP0.0052
(0.52)
0.0281 ***
(4.39)
0.0065
(0.72)
0.0279 ***
(4.38)
NAHpc0.0009 **
(2.44)
−0.0031 ***
(−3.62)
0.0007 *
(2.01)
−0.0031 ***
(−3.64)
Stru−0.0018
(−0.06)
−0.1017 *
(−1.89)
−0.0087
(−0.30)
−0.0972 *
(−1.73)
Constant12.1196 ***
(38.97)
9.9028 ***
(29.90)
11.6290 ***
(51.23)
10.0655 ***
(27.13)
Observations6611066110
R-squared0.99950.99950.99960.9995
Robust t-statistics in parentheses, *** p < 0.01, ** p < 0.05, * p < 0.1.
Table 10. Mediating effect of grass balance.
VARIABLESGLBlnGESV
Model 23Model 24Model 25Model 26
GLB 1.2570 ***
(22.90)
1.0492 ***
(12.26)
lnTMED−0.4901 ***
(−4.68)
−0.4696 ***
(−6.31)
lnPRCP −1.6424 ***
(−15.14)
−0.8954 ***
(−4.98)
lnGOV−0.8727 ***
(−9.72)
−0.6428 ***
(−10.88)
−0.1214
(−1.59)
−0.3155 ***
(−3.84)
CRAH−0.3797 *
(−1.72)
0.4487 ***
(2.93)
0.5428 ***
(3.67)
1.0032 ***
(6.15)
lnNL−0.4399 ***
(−3.24)
−1.1001 ***
(−11.72)
1.6456 ***
(17.64)
1.0937 ***
(8.09)
lnSNNP0.0620 ***
(3.98)
0.0511 ***
(4.90)
−0.0319 ***
(−2.93)
−0.0202 *
(−1.73)
lnpcGDP0.1898 ***
(3.24)
−0.3210 ***
(−6.03)
0.6589 ***
(16.37)
0.4457 ***
(7.24)
NAHpc−0.0269 ***
(−5.43)
0.0081 **
(2.13)
−0.0229 ***
(−6.36)
−0.0066
(−1.64)
Stru−2.1296 ***
(−4.53)
−2.7526 ***
(−11.32)
−0.5303
(−1.59)
−2.2131 ***
(−6.42)
Constant12.1186 ***
(7.44)
18.4073 ***
(18.58)
−2.1013 *
(−1.66)
5.9801 ***
(3.18)
Observations176176176176
R-squared0.75290.88940.97280.9704
Robust t-statistics in parentheses, *** p < 0.01, ** p < 0.05, * p < 0.1.
Disclaimer/Publisher’s Note: The statements, opinions and data contained in all publications are solely those of the individual author(s) and contributor(s) and not of MDPI and/or the editor(s). MDPI and/or the editor(s) disclaim responsibility for any injury to people or property resulting from any ideas, methods, instructions or products referred to in the content.