Article

Sparse SAR Imaging Algorithm in Marine Environments Based on Memory-Augmented Deep Unfolding Network

1
School of Information Engineering, Guangdong University of Technology, Guangzhou 510006, China
2
National Key Laboratory of Scattering and Radiation, Beijing 100854, China
3
Beijing Institute of Environment Features, Beijing 100854, China
4
China Telecom Satellite Application Technology Research Institute, Beijing 100035, China
5
Suzhou Key Laboratory of Microwave Imaging, Processing and Application Technology, Suzhou 215000, China
6
Suzhou Aerospace Information Research Institute, Suzhou 215000, China
7
National Key Laboratory of Microwave Imaging Technology, Beijing 100190, China
8
Aerospace Information Research Institute, Chinese Academy of Sciences, Beijing 100190, China
9
School of Electronic, Electrical and Communication Engineering, University of Chinese Academy of Sciences, Beijing 100190, China
*
Author to whom correspondence should be addressed.
Remote Sens. 2024, 16(7), 1289; https://doi.org/10.3390/rs16071289
Submission received: 21 February 2024 / Revised: 29 March 2024 / Accepted: 3 April 2024 / Published: 5 April 2024
(This article belongs to the Special Issue Radar Signal Processing and Imaging for Ocean Remote Sensing)

Abstract

:
Oceanic targets, including ripples, islands, vessels, and coastlines, display distinct sparse characteristics, rendering the ocean a significant arena for sparse Synthetic Aperture Radar (SAR) imaging rooted in sparse signal processing. Deep neural networks (DNNs), a current research emphasis, have, when integrated with sparse SAR, attracted notable attention for their exceptional imaging capabilities and high computational efficiency. Yet, the efficiency of traditional unfolding techniques is impeded by their architecturally inefficient design, which curtails their information transmission capacity and consequently detracts from the quality of reconstruction. This paper unveils a novel Memory-Augmented Deep Unfolding Network (MADUN) for SAR imaging in marine environments. Our methodology harnesses the synergies between deep learning and algorithmic unfolding, enhanced with a memory component, to elevate SAR imaging’s computational precision. At the heart of our investigation is the incorporation of High-Throughput Short-Term Memory (HSM) and Cross-Stage Long-Term Memory (CLM) within the MADUN framework, ensuring robust information flow across unfolding stages and solidifying the foundation for deep, long-term informational correlations. Our experimental results demonstrate that our strategy significantly surpasses existing methods in enhancing the reconstruction of sparse marine scenes.

1. Introduction

Synthetic Aperture Radar (SAR) plays an extremely important role in marine observation. SAR is a high-resolution radar system that possesses all-weather and all-time capabilities, enabling it to observe the ocean under cloud cover, at night, and in adverse weather conditions [1]. Its applications are vital and diverse, ranging from dynamic ocean monitoring (such as surface wind, waves, and ocean currents) and ship detection, to marine pollution surveillance, sea ice observation, and the mapping of coastlines and islands [2]. However, despite the significant potential applications of SAR systems in oceanic observation, the imaging process encounters challenges related to data processing and image quality, especially regarding the demands for data intensity and image reconstruction precision in large-scale marine environments.
In this context, the integration of sparse signal processing theory into SAR imaging algorithms represents a key enhancement in the capabilities of SAR systems. By breaking through the limitations imposed by the Nyquist sampling theorem, sparse SAR imaging technology reduces data acquisition requirements [3]. This approach treats SAR imaging as an inverse problem, addressing it through regularization methods that simplify system complexity, reduce data rates, and enhance image quality. Ocean scenes that are inherently sparse in nature, such as ships, oil spills, icebergs, and islands, become the primary focus for the application of sparse SAR imaging technology [4,5].
With the rapid advancement of deep learning, the fusion of Deep Neural Networks (DNNs) with sparse signal processing for SAR imaging has emerged as a cutting-edge research domain. The incorporation of DNNs offers enhanced computational efficiency and eliminates the need for extensive parameter tuning. Among the myriad approaches that combine deep neural networks with sparse signal processing for SAR imaging, methods based on Deep Unfolding Networks (DUNs) [6] represent a key innovation, bolstering traditional iterative model-driven imaging techniques. Diverging from end-to-end networks that aim to directly learn from echo data to final imagery, DUNs employ a sophisticated strategy that amalgamates model-driven and data-driven approaches, adeptly navigating the challenges of interpretability often associated with the opaque nature of conventional end-to-end networks and thereby elevating imaging precision [7]. DUNs have found widespread application in the field of SAR imaging, as demonstrated in [8,9,10,11,12].
However, the performance of SAR imaging algorithms based on DUNs is compromised by the high demand for information throughput, primarily due to the single-channel transmission mode for inputs and outputs at each stage of DUN, which leads to the loss of multi-channel information constructed during feature extraction, transformation, and inter-stage operations. This not only results in a reduction in details but also impairs imaging accuracy. Moreover, the inherent sequential cascading structure of DUN stage modules facilitates the transition from the output of one stage to the input of the next, limiting the comprehensive utilization of information from earlier stages and thus diminishing the quality of reconstruction results achieved by DUN-based SAR imaging algorithms. The intrinsic architecture of DUNs impedes the smooth exchange of multi-channel and cross-stage information, thereby reducing the efficacy of DUN-based algorithms in capturing the intricate details of sparse scenes.
To overcome these limitations, we introduce the Memory-Augmented Deep Unfolding Network (MADUN) [13] and propose a sparse SAR imaging algorithm leveraging MADUN, specifically designed for reconstructing sparse marine scenes. MADUN represents a significant advancement in deep learning by incorporating both short-term and long-term memory enhancement mechanisms—where inter-stage multi-channel information transfer is considered short-term memory, and cross-stage information interaction exemplifies long-term memory—thereby addressing the inherent memory transmission challenges within the DUN’s structural design. Notably, MADUN has demonstrated considerable effectiveness in complex imaging applications, including MRI. Architecturally, MADUN consists of two key modules: a gradient descent module and a proximal mapping module. In [13], MADUN is a real-valued network, whereas SAR images are complex-valued data. To accommodate this difference, in the gradient descent module, we adopt a method of splitting the data into real and imaginary components. This separation provides tailored inputs for the proximal mapping module, enabling it to more effectively process complex-valued data in subsequent stages. The proximal mapping module integrates dual mechanisms for memory enhancement: High-throughput Short-term Memory (HSM) and Cross-stage Long-term Memory (CLM) [13]. The HSM introduces a parallel channel for the transmission of multi-channel information, markedly boosting the volume of data conveyed between successive stages of DUN. Meanwhile, the CLM mechanism accounts for long-range dependencies by establishing connections across stages. This feature substantially improves the ability of later stages to utilize information from earlier stages, facilitating a harmonious balance between past and present signal states. Collectively, our method enriches the quality of marine sparse SAR images, enhancing the performance of SAR image reconstruction. The main contributions of this paper are:
(1)
A sparse SAR imaging algorithm designed specifically for reconstructing sparse maritime scenes is introduced, employing the Memory-Augmented Deep Unfolding Network (MADUN). This architecture is characterized by two key modules—a gradient descent module and a proximal mapping module;
(2)
A gradient descent module tailored to meet MADUN’s requirements for processing complex-valued signals is proposed. This is achieved by dividing the data into its real and imaginary components, thus enabling the more effective processing of complex-valued radar signals;
(3)
By integrating High-throughput Short-term Memory (HSM) and Cross-stage Long-term Memory (CLM) enhancement mechanisms into the SAR imaging algorithm based on DUN, enhancing the proximal mapping module by improving the efficiency of multi-channel information transmission and strengthening the processing of long-distance dependencies between stages is achieved;
(4)
Extensive experiments have validated that our proposed MADUN-based sparse SAR imaging algorithm significantly outperforms traditional sparse reconstruction algorithms like ISTA and deep unfolding imaging methods such as ISTA-Net+ in reconstructing sparse marine scenes.
The structure of this paper is outlined as follows: Section 2 provides an overview of the sparse SAR imaging model and introduces our novel sparse SAR imaging approach, which leverages the MADUN algorithm. Section 3 details the outcomes of both simulated experiments, ablation studies and measured experiments, showcasing the efficacy of our method. Section 4 delves into a comprehensive discussion of the findings and the limitations of our approach. Finally, Section 5 concludes the paper and outlines future work.

2. Materials and Methods

2.1. Sparse Imaging Model for SAR

In the operation of SAR, the data acquisition phase entails the collection of echo data from the target area, which include two-dimensional data across the range and azimuth dimensions, represented as Y C P × Q . The objective of sparse SAR imaging is to utilize the echo data to reconstruct the imaging scene’s scattering coefficients, represented by X C M × N . To accurately describe the correlation between SAR echo data and the scattering distribution of the imaging scene, it is possible to model this relationship through a sparse SAR imaging model. This model can be expressed as a linear observation model, represented by the equation:
y = Φ x + n
where y C P Q × 1 is the vectorized echo signal Y . Similarly, x C M N × 1 is the vectorized complex-valued scattering coefficient X , Φ C P Q × M N is the measurement matrix, and n C P Q × 1 represents the additive noise introduced during measurement.
In sparse SAR imaging challenges, regularization algorithms play a crucial role, and can be expressed as follows:
x ^ = min x 1 2 y Φ x 2 2 + λ R x
where x ^ approximates the true vectorized complex-valued scattering coefficient x , R x is the regularization term, and λ > 0 is a scalar regularization parameter.
To achieve a sparse solution within the framework of compressive sensing, it is common to employ the L1 norm as the regularization term, which leads to the formulation,
x ^ = min x 1 2 y Φ x 2 2 + λ x 1
Equation (3) is also recognized in the field of statistics as the Least Absolute Shrinkage and Selection Operator (LASSO) problem [14]. Techniques such as the Iterative Shrinkage-Thresholding Algorithm (ISTA) [15] and the Alternating Direction Method of Multipliers (ADMM) [16] are capable of resolving the LASSO problem effectively.

2.2. Deep Unfolding Network Based on ISTA

ISTA, when integrated with deep neural networks, becomes a potent tool for addressing the reconstruction of scene scattering coefficients. This synergy has led to the development of an ISTA-based deep unfolding network, known as ISTA-Net+ [17]. Figure 1 depicts the overarching architecture of ISTA-Net+, which is segmented into two principal components: the gradient descent part and the proximal mapping part. The formulation for the gradient descent component is given by:
r k = x k 1 ρ k Φ T Φ x k 1 y
where k denotes the iteration step, and ρ k is the step size for the k-th stage. The result of the gradient descent process, r k , serves as a residual representation at the k-th stage. Therefore, the proximal mapping phase aims to reintegrate these high-frequency elements. The formula for the proximal mapping stage is expressed as:
x ^ k = r k + P V ˜ s o f t V U r k , θ k
where P · and U · signify linear convolution operations, V · represents a nonlinear transformation, and its pseudo-inverse V ˜ · satisfies V ˜ V = I ( I is the identity operator). s o f t · , θ k is a soft thresholding operator, and θ k is the threshold. The application of these operators in combination enables the effective extraction and restoration of the desired target [17].

2.3. Sparse SAR Imaging Algorithm Based on Memory-Augmented Deep Unfolding Network

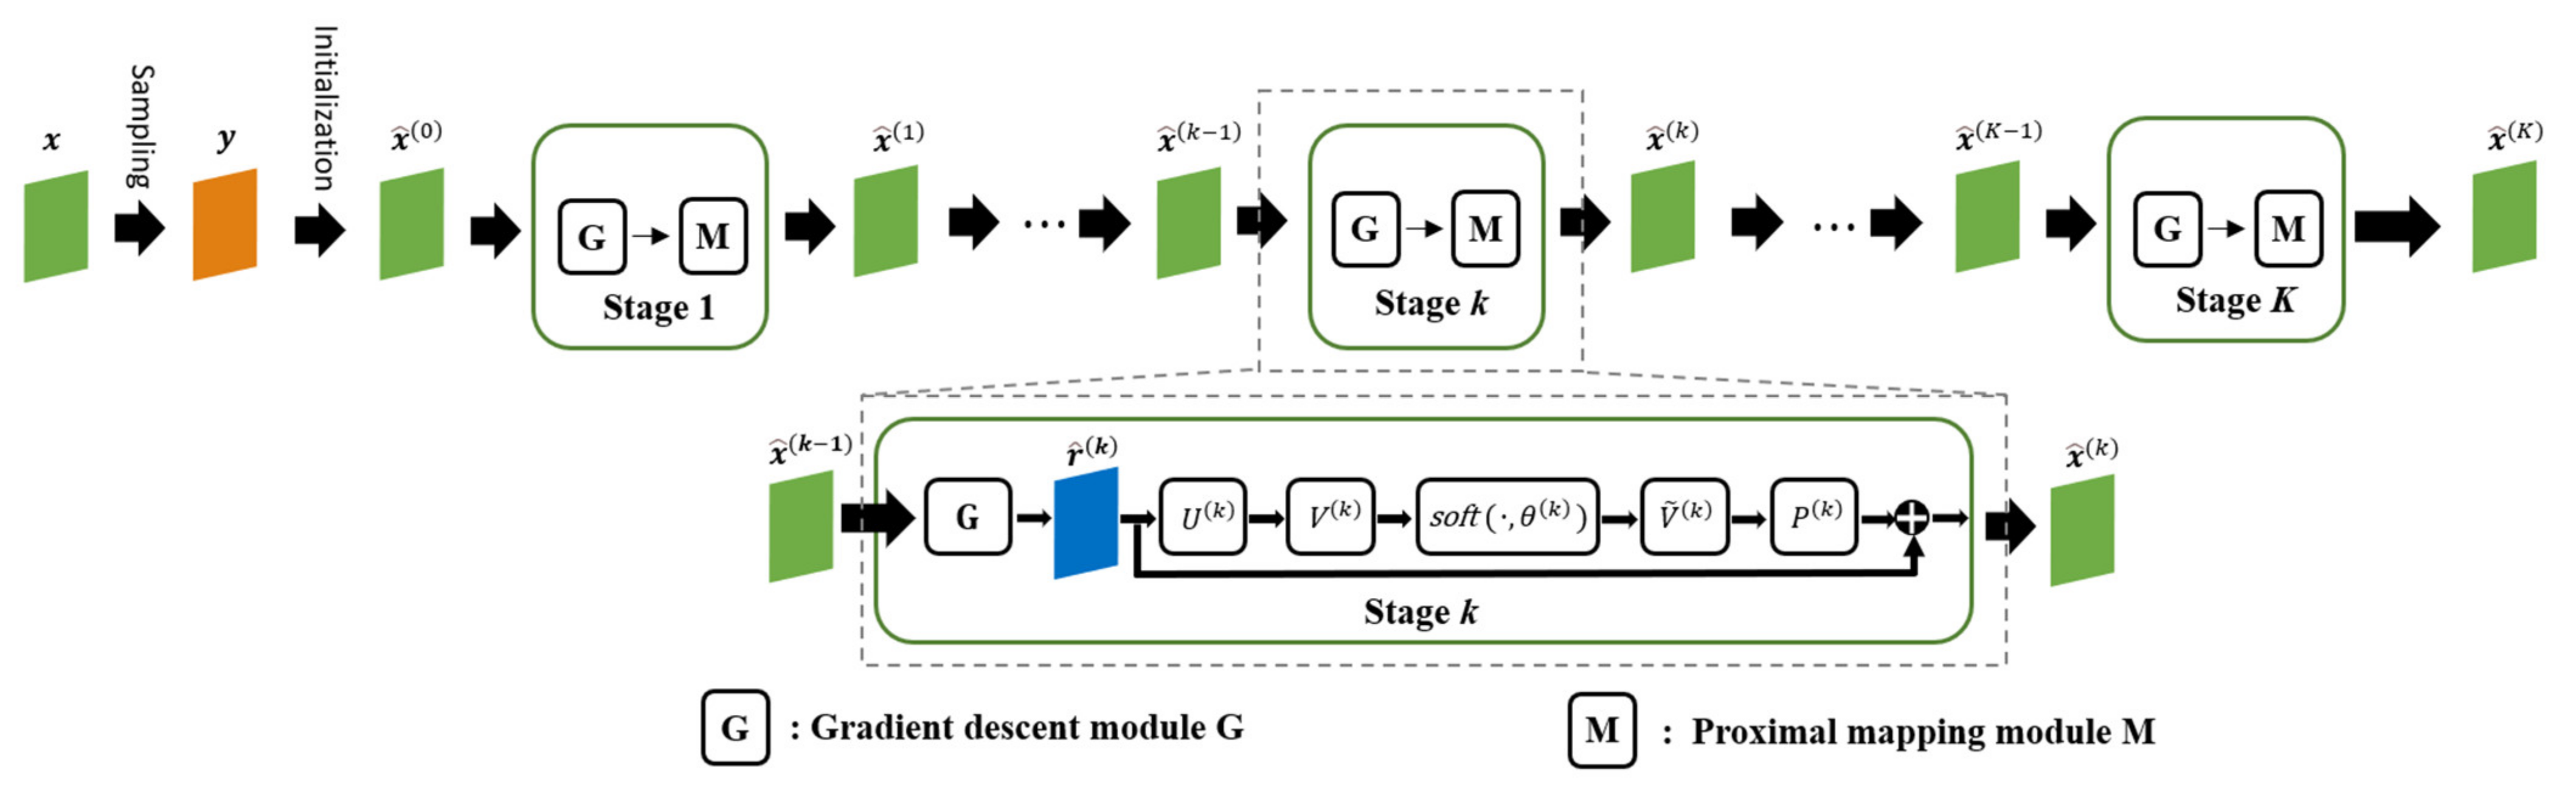
The deep unfolding network inspired by ISTA exhibits a sequential, stage-by-stage architecture. However, this design, characterized by single-channel information flow between stages, inadvertently leads to the omission of critical information, mirroring a shortfall in short-term memory capabilities. Moreover, the linear, cascaded structure that links the output of one stage directly to the input of the next can cause a progressive attenuation of information transfer. This effect hampers the effective transmission of vital features identified in earlier stages to later ones, indicative of a lack of a robust long-term memory mechanism. To address these limitations and bolster the network’s capacity for information retention across stages, the introduction of a memory enhancement mechanism is imperative. Such a mechanism is designed to amplify the network’s ability to leverage data correlations, thereby elevating the quality of SAR imaging outcomes.
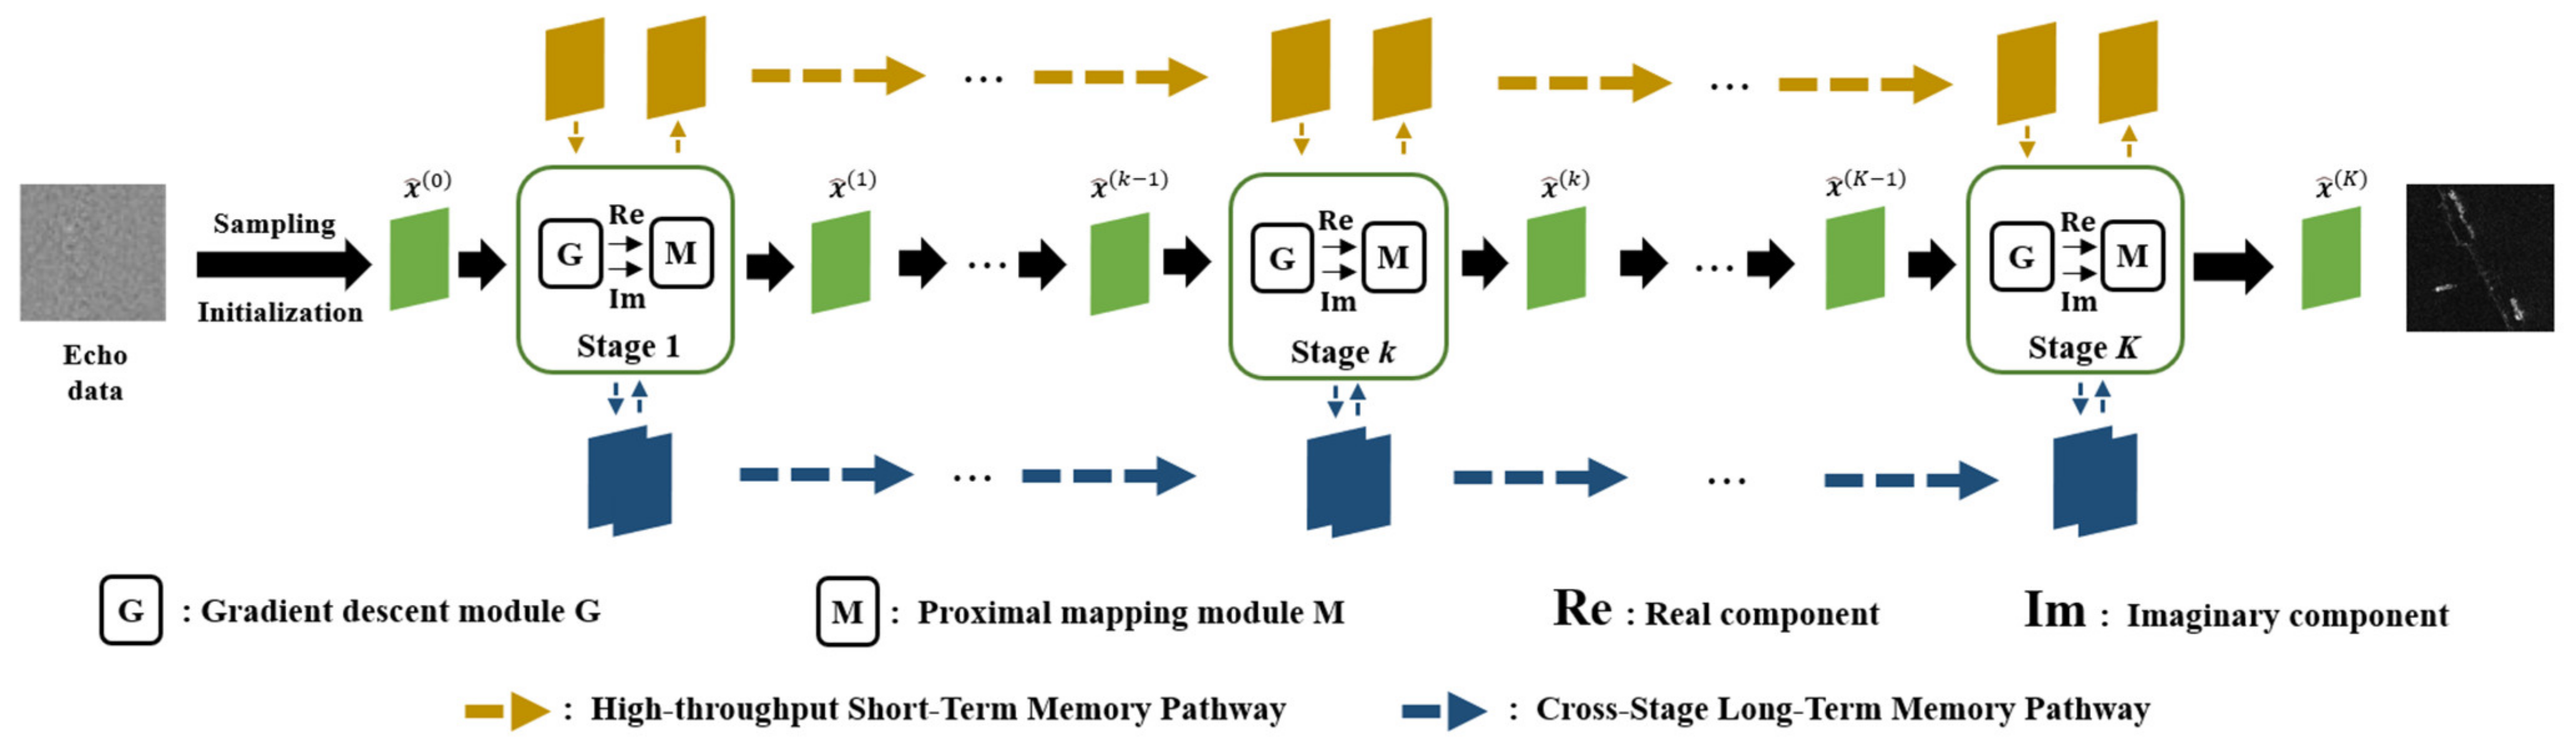
In response to this need, we introduce an innovative sparse SAR imaging algorithm embodied in a MADUN. Rooted in the ISTA-based deep unfolding framework, MADUN incorporates a novel memory enhancement feature. This algorithm enhances the traditional ISTA algorithm’s performance by integrating a deep learning framework and incorporating a memory augmentation mechanism. It represents an advanced hybrid method that synergizes convex optimization theory with deep learning techniques [18]. As depicted in Figure 2, the architecture of MADUN is composed of two core components: a gradient descent module and a proximal mapping module. The gradient descent module is tasked with independently processing the real and imaginary components of the radar signal. Concurrently, the proximal mapping module is designed to fortify both short-term and long-term memory through dual pathways. These pathways are intricately woven into the primary information flow, ensuring dynamic interaction at each stage. The short-term memory pathway aims to mitigate the loss of information during the transition between adjacent stages, whereas the long-term memory pathway is devoted to overcoming the absence of inter-stage connectivity. This approach, integrating dual memory enhancement mechanisms, not only preserves the integrity of information through successive stages, but also enhances the algorithm’s capacity to reconstruct high-fidelity SAR images by effectively utilizing the inherent correlations within the data.

2.3.1. Gradient Descent Module

Given the inherently complex-valued nature of radar signals, adept handling of these complex signals is imperative. Consequently, the data are bifurcated into their real and imaginary components, effectively partitioning Equation (4) into two segments: r k = R e r k + j I m r k . Here, R e · signifies the real part, and I m · the imaginary part of the matrix. By adhering to complex arithmetic principles, the formulation for the gradient descent module can be deduced as follows:
R e r k = R e x ^ k 1 + ρ k R e Φ H R e y I m Φ H I m y ρ k R e Φ H Φ R e x ^ k 1 I m Φ H Φ I m x ^ k 1
I m r k = I m x ^ k 1 + ρ k R e Φ H I m y + I m Φ H R e y ρ k R e Φ H Φ I m x ^ k 1 + I m Φ H Φ R e x ^ k 1
Therefore, the configuration of the gradient descent module for the k-th stage is illustrated in Figure 3.

2.3.2. Proximal Mapping Module Combined with Memory Enhancement Mechanisms

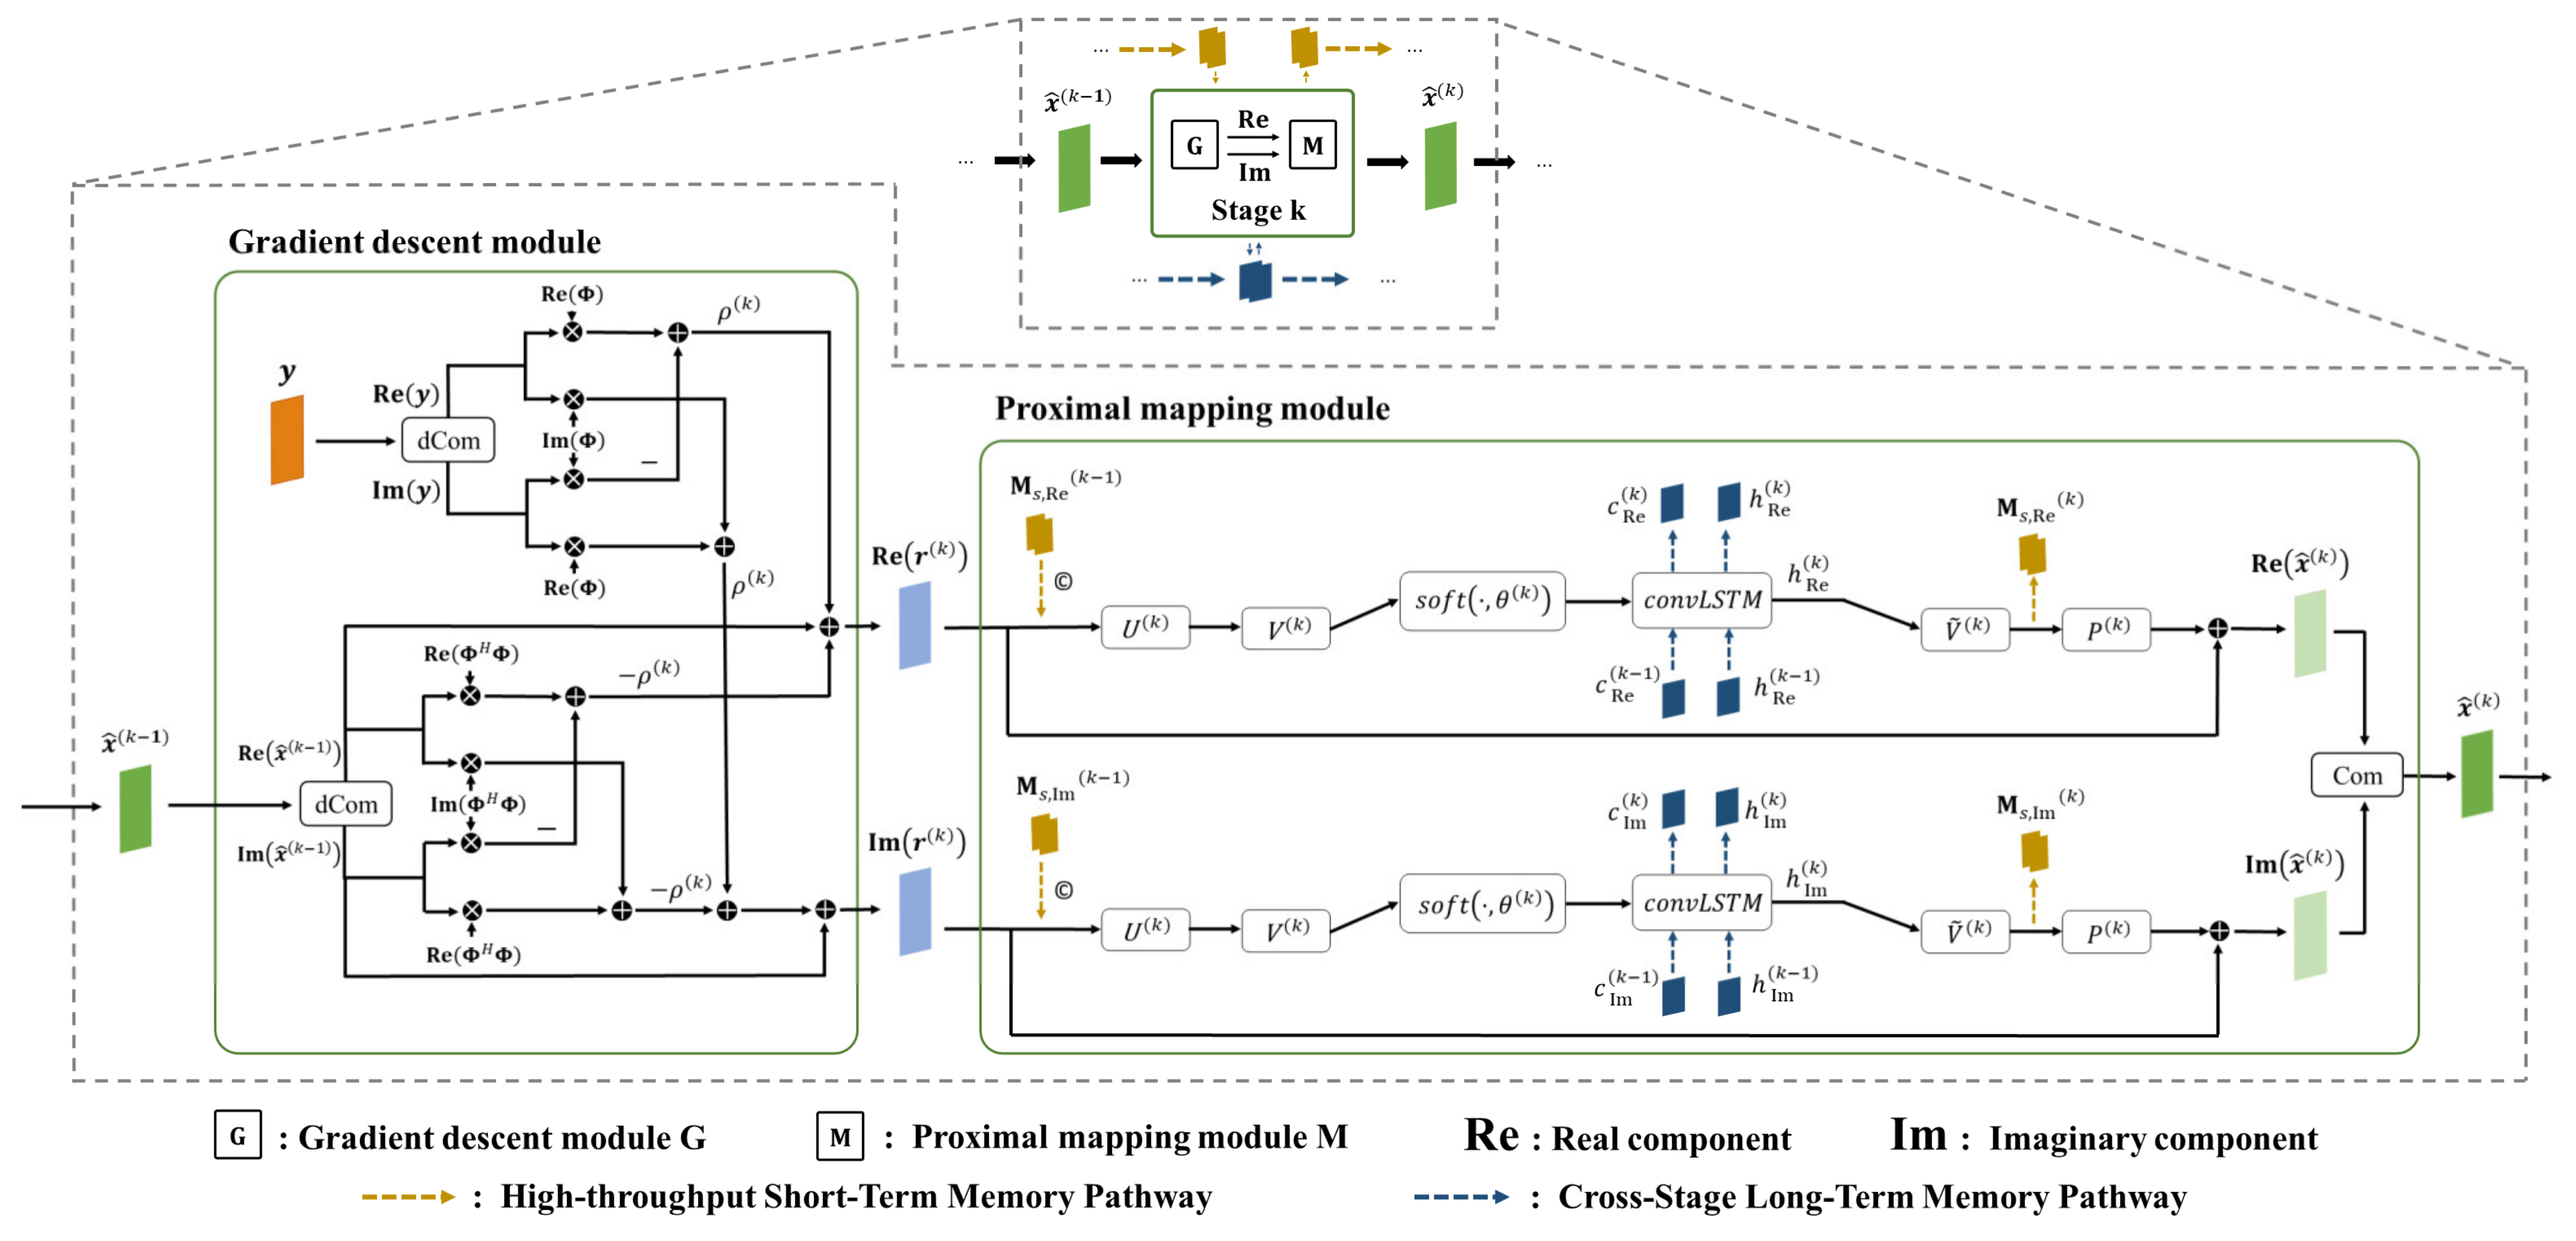
Considering the gradient mapping module’s role in bifurcating radar signals into their real and imaginary components, it is imperative for the subsequent proximal mapping module to individually process these constituents. The architecture of the proximal mapping module, endowed with dual memory augment strategies, is depicted in Figure 3. The nonlinear transformation V · is conceptualized as the synergy of two linear convolution operations and a ReLU function, specifically V · = C 2 ReLU C 1 · , where both linear convolution operators C 1 · and C 2 · can be implemented by filter banks. Analogously, V ˜ · is represented as V ˜ · = C 2 ˜ ReLU C 1 ˜ · . The operators C 1 · and C 2 · denote a series of N f filters, each with dimensions 3 × 3 × N f . U · is facilitated by a filter sized 3 × 3 × N f , and P · pertains to a collection of N f filters, each measuring 3 × 3 . Short-term memory is integrated prior to U k , being captured and stored before engagement with P k . Long-term memory leverages a ConvLSTM [19] mechanism, necessitating the inclusion of a ConvLSTM unit subsequent to the s o f t · , θ k . The default setting for N f is 32.
A. High Throughput Short-term Memory
The short-term memory enhancement mechanism introduced, denoted as M s k 1 , features dimensions H × W × C . This facilitates the storage of multi-channel information, where H and W denote the image’s height and width, respectively. Initially, the short-term memory mechanism generates feature maps from SAR echo data. Specifically, the echo data y , after being processed through the measurement matrix Φ , are passed through a single convolution layer to produce a C -channel feature map, M s 0 , as follows:
M s 0 = C 0 Φ T y
where C 0 · is a single convolution layer with a filter kernel size of 3 × 3 .
The HSM facilitates multi-channel information transmission across nearly every stage of the proximal mapping module. Its primary function at the current stage is to capture and preserve multi-channel feature information. Though information transmission between two adjacent stages remains single-channel, the feature information saved earlier is reintroduced at the next stage. This process ensures continuous high-throughput information transmission and significantly enhances the network’s short-term memory capabilities. As shown in Figure 3, for stage k as an example, M s k can be represented as
M s , Re k = V ˜ k ConvLSTM s o f t V k U k R e r k | | M s , Re k 1 , θ k
M s , Im k = V ˜ k ConvLSTM s o f t V k U k I m r k | | M s , Im k 1 , θ k
where “ | | ” denotes feature concatenation. M s k 1 transmits high-throughput information from the previous level to the current one, where short-term memory M s k 1 is concatenated with r k along the channel dimension. After memory integration is completed, it passes through the deep unfolding network’s hierarchy in coordination with r k and, after passing through the nonlinear transformation V ˜ k · , generates high-throughput information for stage k, used in memory integration for stage k + 1.
B. Cross-stage Long-term Memory
Since the ConvLSTM model can maintain continuity of information across cascaded stages, balancing past stored information with the current state, it establishes long-range cross-stage connections through ConvLSTM within CLM. Specifically, as depicted in Figure 3, a ConvLSTM layer is interposed between the soft thresholding operation s o f t · , θ k and the nonlinear transformation V ˜ k · . Here, the output from the soft thresholding operation feeds into the ConvLSTM network, generating a combination of hidden states and memory cells, h k , c k :
h Re k , c Re k = ConvLSTM s o f t V k U k R e r k , θ k , h Re k 1 , c Re k 1
h Im k , c Im k = ConvLSTM s o f t V k U k I m r k , θ k , h Im k 1 , c Im k 1
We employed the ConvLSTM · architecture, where denotes convolution and represents the Hadamard product, with W s i , W h i ,…, W h o as filter weights, b i , b f ,…, b o as biases, and σ · and tanh · representing the sigmoid and tanh functions, respectively.
The input gate i k is regulated by the current input s k , the output from the preceding ConvLSTM module h k 1 , the module state c k 1 , and bias b i :
i k = σ W s i s k + W h i h k 1 + b i
The forget gate f k decides which parts of the previous cell state c k 1 to forget:
f k = σ W s f s k + W h f h k 1 + b f
The cell state c k , acting as a state information accumulator, updates as follows:
c k = f k c k 1 + i k tanh W s c s k + W h c h k 1 + b c
The output gate o k is described by:
o k = σ W s o s k + W h o h k 1 + b o
The module output h k , determined by the latest cell state c k and output gate o k , is:
h k = o k tanh c k
This cross-stage long-term memory utilization is aimed at establishing dependencies from the initial stage through all subsequent stages of information flow, without the necessity of introducing additional memory information at the commencement of this path, allowing for h 0 , c 0 to be initialized to zero. The dimensions of h k and c k are both H × W × C . The output of the cross-stage long-term memory module for a given stage, h k , serves as the input to the nonlinear transformation V ˜ · on the main information flow path, and both h k and the latest cell state c k progress to stage k + 1 through the long-term memory mechanism, transmitting high-level features across different stages to bolster deep information association.
Consequently, the proximal mapping module, augmented with dual memory enhancement mechanisms, is articulated as:
R e x k = R e r k + P k V ˜ k ConvLSTM s o f t V k U k R e r k M s , Re k 1 , θ k
I m x k = I m r k + P k V ˜ k ConvLSTM s o f t V k U k I m r k M s , Im k 1 , θ k
where “||” denotes feature concatenation. At the end of the proximal mapping module, the results from both the real and imaginary components are combined, x k = R e x k + j I m x k , to obtain the reconstructed result for that stage.

2.4. Network Parameters and Loss Function

The learnable parameters of the MADUN are denoted as the set Γ = C 0 · , ρ k , θ k , U k , P k , V k , V ˜ k , ConvLSTM k k = 1 K , where the parameters requiring updates within V k and V ˜ k are C 1 · , C 2 · , and C 1 ˜ · , C 2 ˜ · , and those within ConvLSTM k are the filter weights W i and W o as well as bias terms b i , b f ,…, b o . Their updates can be achieved through the training process by minimizing the loss function L . Given training data pairs y j ,   x j j = 1 J , where x j represents the ground truth and y j represents the measured input, the network generates reconstructed result x ^ j K . Besides reducing the discrepancy between the reconstructed result x ^ j K and the label value x j , constraints on V · and V ˜ · are also required to satisfy the symmetry relationship: V ˜ V = I , and thus the loss function is defined as:
L Γ = L 1 + γ L 2
L 1 = 1 J N j = 1 J x ^ j K x j 2 2
L 2 = 1 2 J N j = 1 J k = 1 K V ˜ k V k R e r j k R e r j k 2 2 + 1 2 J N j = 1 J k = 1 K V ˜ k V k I m r j k I m r j k 2 2
where γ = 0.01 is the weight parameters, J represents the total number of training samples, N is the size of each x j , and K is the total number of stages in MADUN.

3. Results

In this section, we meticulously detail the experimental framework and outcomes that underscore the efficacy of the MADUN for sparse SAR imaging. Our assessment juxtaposes the performance of MADUN against the conventional sparse ISTA algorithm and the advanced ISTA-Net+-based deep SAR sparse imaging approach in the context of marine sparse scenes. Our experimental evaluation bifurcates into two segments: analyses utilizing simulated data and those employing measured data. For the simulated dataset, we leverage synthetic echoes derived from the publicly accessible AIR-SARShip dataset [20]. Preliminary experiments are conducted to ascertain the optimal configuration of stages and training iterations for MADUN. Subsequently, we elucidate the imaging outcomes for marine sparse scenes at varying sampling ratios. Through comparative analysis, the superior imaging performance of our proposed methodology is vividly demonstrated. Concurrently, we also conduct an evaluation of the performance of the proposed method in terms of the reconstruction quality of the phase of the complex scattering coefficient. Furthermore, we execute ablation studies to validate the pivotal contribution of the HSM and CLM mechanisms in enhancing the performance of sparse SAR imaging algorithms. In the measured experiments, we employ authentic echo data from diverse marine sparse scenes, sourced from Sentinel-1 and GF-3 satellites. The results from these real-world scenarios emphatically affirm the practical applicability and effectiveness of our proposed MADUN approach in accurately capturing and imaging sparse marine scenes.
The metrics used to evaluate the reconstruction performance of the algorithms in this section include: Normalized Mean Square Error (NMSE), Peak Signal-to-Noise Ratio (PSNR), Structural Similarity Index Measure (SSIM) and Image Entropy (ENT). These are defined as follows:
NMSE = x ^ x F 2 x F 2
where x ^ represents the SAR image reconstructed from sampled echo data, while x represents the corresponding ground truth.
PSNR = 10 log 10 x ^ max 2 x ^ x F 2 / N x
where x ^ max represents the range of pixel values in the reconstructed image, and N x is the total number of pixels in image x .
SSIM = 2 μ 1 μ 2 + c 1 2 σ 12 + c 2 μ 1 2 + μ 2 2 + c 1 σ 1 2 + σ 2 2 + c 2
where μ 1 and μ 2 are the mean values of the two images, σ 1 and σ 2 are the variances of the two images, σ 12 is the covariance of the two images, and c 1 and c 2 are constants added for division stability.
ENT = 1 E x ^ i , j x ^   i , j K 2 ln x ^   i , j K 2 + ln E x ^
where E x ^ = x ^ 2 2 , and x ^   i , j K denotes the value at i , j in the reconstructed image x ^ .
The system parameters for the simulation and measured experiments are shown in Table 1.

3.1. Simulated Experiments

In the simulated experiments conducted within this study, the AIR-SARShip public dataset was selected as the primary data source. Specifically, marine sparse scenes were extracted from this dataset to compile the training set. The images sourced from the AIR-SARShip dataset were cropped and resized to a uniform resolution of 256 × 256 pixels. These adjusted images served as the basis for generating simulated echo data, which were then utilized to train the network. The dataset for network training comprised 1000 slices designated as the training set and an additional 100 slices allocated for the test set. For the training process, all models underwent training for a total of 150 epochs, adhering to a consistent training regime. The Adam optimizer was chosen for its effectiveness in handling sparse gradients on noisy problems, a common characteristic of SAR imaging tasks. The training was conducted with a batch size of 64, optimizing computational efficiency while allowing for sufficient gradient approximation. The learning rate was set at 0.0001, a value that balances the need for convergence speed with the risk of overshooting minimal loss regions. This configuration ensures a thorough exploration of the parameter space and encourages the models to converge towards optimal solutions for the task of sparse SAR imaging. The experiments were accelerated using a Quadro RTX 8000 GPU.

3.1.1. Optimization of Network Phases and Training Epochs

To ascertain the optimal configuration for the MADUN network, specifically regarding the number of stages, it is essential to examine how varying the stage count influences the reconstruction quality. This study undertook such an investigation by employing data from the test set and conducting experiments at a 50% sampling ratio. This approach allowed for a direct comparison between the performance of the proposed MADUN method and that of ISTA-Net+ under varying conditions. The results of these experiments are illustrated in Figure 4, which plots the PSNR performance of both methods against the number of stages. Analysis of the graph reveals a trend where the reconstruction quality for both methods shows improvement as the number of stages increases. However, a notable distinction is that the PSNR associated with our proposed MADUN method consistently outperforms that of ISTA-Net+ across all examined stage counts.
A critical observation from these experiments is that the increase in reconstruction quality becomes less pronounced beyond a certain point, particularly when the number of stages surpasses 9. Beyond this threshold, the PSNR curve begins to level off, indicating diminishing returns in terms of quality enhancement with additional stages. This plateau suggests that further increases in the number of stages contribute marginally to improvement while adding computational burden. Taking into account both the need for high-quality reconstruction and the practical considerations of computational efficiency, the decision was made to set the default number of stages for the MADUN network at 9. This choice represents an optimal balance, ensuring that the network achieves a high level of reconstruction accuracy without incurring unnecessary computational complexity.
Just as with evaluating the optimal number of network stages, it is crucial to investigate the effect of varying the number of training epochs on the reconstruction quality to identify the most suitable training duration. This aspect of the study mirrors the approach taken for assessing the impact of stage count, utilizing a 50% sampling rate and setting the number of stages to 9 for consistency. The comparative analysis between the proposed DUN-based method and ISTA-Net+ under these conditions is encapsulated in Figure 5. This figure demonstrates the evolution of PSNR performance for both methods across different training epochs. A notable observation from Figure 5 is that the DUN-based method consistently surpasses ISTA-Net+ in terms of PSNR throughout the training process. Furthermore, a key insight is that the PSNR curves for both methods tend to reach a plateau after approximately 150 epochs, indicating a stabilization in reconstruction quality. The stabilization of the PSNR curves suggests that extending the training beyond 150 epochs does not contribute significantly to further improvements in reconstruction quality. Instead, it could potentially lead to overfitting or unnecessary computational resource expenditure. Based on these findings, setting the default number of training epochs to 150 represents an optimal compromise. This decision effectively balances the need for achieving high-quality reconstruction outcomes against the imperative to manage computational complexity efficiently. Therefore, for practical applications and future experiments within this framework, 150 epochs are recommended as the standard training duration to ensure both effective and efficient network training.

3.1.2. Results under Different Sampling Ratios

In this subsection, we assess the reconstruction capabilities of our proposed algorithm across a comprehensive range of sampling ratios, extending from 10% to 90%, as well as considering the scenario of full sampling. We configured the imaging network with 9 stages and employed the regularized iterative optimization algorithm ISTA, alongside the deep learning-based ISTA-Net+, as benchmarks for comparative analysis. This experimentation involved varying sampling ratios, achieved through the random selection of echo data subsets at predetermined ratios. From the test dataset, we chose two distinct scenes for evaluation: one featuring only ships and another depicting a dock. In the ships scene, the targets are relatively isolated and dispersed, offering a clear contrast to the dock scene. Despite being more densely populated than the ship scene, the dock scene still exhibits characteristics of sparsity. In this experiment, we selected results from two sampling ratios, 80% and 50%, where the differences in reconstruction quality were particularly pronounced, to illustrate the specific outcomes of the reconstruction process.
In our study, we are initially concentrating on maritime targets that are relatively isolated, and conduct experiments on SAR imaging at various sampling ratios. Figure 6 depicts the SAR imaging outcomes under different sampling ratio scenarios. At an 80% sampling ratio, the performance of ISTA-Net+ surpasses that of the ISTA algorithm. The images reconstructed using the ISTA method appear blurred and distorted, whereas those processed with ISTA-Net+ exhibit significant improvements. In comparison to the first two methods, our proposed approach produces images of superior quality, characterized by sharper edges. When the sampling rate was reduced to 50%, there was a noticeable degradation in the quality of image reconstruction across all methods, marked by an increase in noise levels. However, our proposed method continued to outperform in terms of enhanced reconstruction capability, particularly with regard to preserving structural integrity and reducing noise.
Table 2 presents a quantitative analysis of the ships scene reconstruction outcomes across various data sampling ratios. The results demonstrate that the proposed methodology yields high performance across both elevated and diminished sampling ratios. Both PSNR and SSIM metrics reflect the reconstruction’s fidelity. In comparison with conventional approaches such as ISTA and ISTA-Net+, our technique registers a PSNR improvement of approximately 3 to 9 dB. Regarding the SSIM metric, our method shows an incremental enhancement ranging from 3% to 15%. These findings underscore our method’s ability to not only preserve but also improve the overall image resemblance and structural integrity, thereby confirming its robustness and reliability under scenarios of reduced sampling ratios.
Figure 7 illustrates the comparative reconstruction efficacy of the three methodologies at varied sampling ratios (ranging from 10% to 90%) as well as at full sampling, depicted through curves representing various averaged metrics. These results elucidate that the reconstruction quality of all methods escalates as the sampling ratio increases. Notably, our proposed method consistently surpasses the performance of both ISTA and ISTA-Net+ algorithms across the entire range of sampling ratios, indicating its superior reconstruction capability.
The subsequent analysis focuses on the dock scene. Figure 8 illustrates the SAR reconstruction outcomes of the three methodologies at 80% and 50% sampling ratios. It is evident that, across both higher and lower sampling ratios, the reconstruction quality of the proposed method surpasses that of both ISTA and ISTA-Net+. The reconstruction results from the ISTA algorithm display significant speckle noise, compromising the integrity of the image and obscuring critical features. Although the ISTA-Net+ method offered improved scene reconstruction quality, its lack of memory enhancement mechanisms led to the loss of fine details in the reconstructed images. Conversely, the method introduced in this study excelled in SAR scene reconstruction, adeptly capturing and preserving nuanced details. Moreover, ISTA and ISTA-Net+ experienced varying levels of edge blurriness at a lower sampling ratio, a flaw not observed in the method proposed here under identical conditions. These findings underscore our method’s exceptional ability to maintain reconstruction accuracy and detail fidelity even at reduced sampling ratios.
Table 3 presents the metrics for the reconstruction outcomes of this scene, with the study’s proposed method showing higher PSNR and SSIM values in comparison to ISTA and ISTA-Net+, thereby validating its enhanced accuracy in reconstruction and superior capability in detail restoration. Similarly, Figure 9 displays the average performance metrics of the three methods across different sampling ratios (from 10% to 90%) as well as at full sampling for the dock scene, further evidencing the proposed method’s dominance in image reconstruction quality. Through imaging experiments conducted in the aforementioned scenes at varied sampling ratios, our study ascertains that the proposed algorithm consistently achieves high-quality imaging results in sparse marine environments with diverse target distribution densities, showcasing remarkable robustness.

3.1.3. Evaluation of Phase Reconstruction Quality

In addition to focusing on the amplitude and geometric quality of scene reconstruction, assessing the performance of phase reconstruction in the complex scattering coefficient is equally critical. In a single SAR image, the phase of each pixel is typically random. Therefore, while training, we generated simulated echoes with random phases. In the experiments conducted in this section, we chose the dock scene used in Section 3.1.2, at a sampling ratio of 80%, to evaluate the phase reconstruction quality of our proposed method, comparing it against the ISTA and ISTA-Net+ algorithms.
Figure 10 displays the performances of the three algorithms in phase reconstruction within the dock scene. It is evident that our proposed method surpasses the other two in phase reconstruction capability, demonstrating the superior preservation of phase information. Conversely, both the ISTA and ISTA-Net+ algorithms experience varying degrees of phase information loss during the reconstruction process, leading to inferior phase reconstruction performance.

3.1.4. Ablation Experiments

In this section, to further elucidate the contributions of the memory enhancement mechanism to the task of image reconstruction, we executed ablation studies on the algorithm, particularly focusing on two pivotal elements of the memory enhancement mechanism within the algorithm: HSM and CLM. While maintaining the other parameters of the deep unfolding network, we established a sampling ratio of 50% and training epochs at 150. Our adjustments were confined to the integration of short-term and long-term memory components, facilitating a comparative analysis among sparse SAR imaging algorithms based on MADUN, ISTA-Net+ alone, ISTA-Net+ augmented with HSM, and ISTA-Net+ enhanced with CLM. PSNR, SSIM and NMSE were selected as the metrics for evaluation, enabling the assessment of each algorithm’s reconstruction capability across varying numbers of unfolding stages.
Figure 11 and Table 4 illustrate the trends in overall reconstruction quality and the specific quantitative outcomes for the four algorithms, with the stage count serving as a variable. The line charts vividly delineate that our proposed methodology excels across all stages, securing superior reconstruction results even with a reduced number of stages. Notably, ISTA-Net+ supplemented with HSM and ISTA-Net+ integrated with CLM significantly surpassed the performance of ISTA-Net+ devoid of memory enhancement mechanisms, as evidenced by their average PSNR and SSIM scores. Our approach, which incorporates both memory enhancements, distinctly outshined the other three methodologies. For instance, at the standard stage count of K = 9, our method realized PSNR improvements of approximately 6 dB over ISTA-Net+, 4 dB over HSM, and 3 dB over CLM, respectively, and achieved a 3–8% elevation in the SSIM index, as well as a 0.01–0.03 improvement in the NMSE index. This suite of findings robustly validates the efficacy of both HSM and CLM in the context of SAR scene imaging tasks, corroborating that the concurrent application of these two strategies can synergistically amplify the performance of SAR scene reconstruction.
Additionally, we evaluated the imaging times of four methods with an ablation study. Table 5 compares the imaging times of these methods under the default setting of nine stages (K = 9). Among them, the ISTA-Net+ method is the fastest, while our proposed method is the slowest. The imaging times for ISTA-Net+ with HSM and ISTA-Net+ with CLM are longer than that for ISTA-Net+ alone. This increase in time can be attributed to the fact that HSM and CLM enhance reconstruction quality by, respectively, increasing the amount of information transmission between stages of the model, and establishing long-range connections across stages through the introduction of the ConvLSTM module. Both approaches add to the computational load, thereby slowing down the imaging speed.

3.2. Measured Experiments

To assess the applicability of the MADUN-based sparse SAR imaging algorithm in marine sparse scenes, its efficacy in real-data imaging must be established. In the experiment, sparse marine scenes captured by Sentinel-1 and GF-3 satellites were selected for training. Each dataset comprised 1100 echo data slices of dimensions 256 × 256, with 1000 slices allocated for training and 100 slices designated for testing. Ground truth images were generated using the conventional Range-Doppler Algorithm (RDA) for imaging, which was then subjected to feature enhancement, sidelobe suppression, and noise reduction techniques to diminish noise levels [21]. Three distinct scenarios—ships, islands, and waves—were chosen to evaluate the algorithm’s reconstruction capabilities in these contexts and to benchmark them against ISTA and ISTA-Net+. The Entropy (ENT) metric was employed for quantitative assessment. Figure 12 and Table 6 showcase the SAR reconstruction outcomes and evaluation metrics for the three scenes across various sampling rates.
In Scene 1, the ships scene, it was noted that the ISTA algorithm yielded reconstructions of lower quality at 80% and 50% sampling ratios, with boundary blurring evident at lower sampling ratios. Conversely, both ISTA-Net+ and the proposed algorithm delivered superior performance, with the proposed algorithm preserving clear boundaries even at reduced sampling ratios. Table 6 indicates that at an 80% sampling ratio, the proposed method exhibited lower ENT values than the ISTA and ISTA-Net+ algorithms by 1.16 and 0.47, respectively, demonstrating more pronounced quality enhancements at a 50% sampling ratio, where the ENT was lower by 1.35 and 0.6, respectively.
For Scene 2, the islands scene, the proposed algorithm surpassed ISTA and ISTA-Net+ in the restoration of image details. Despite a loss of some details at a 50% sampling ratio compared to the higher ratio, the method consistently maintained the island’s surface uniformity and continuity. For Scene 3, the sea waves scene, both ISTA and ISTA-Net+ exhibited suboptimal performance in delineating details such as wave structures, whereas the proposed algorithm facilitated a clearer observation of precise wave structures. At an 80% sampling ratio, ISTA-Net+ managed to capture certain wave structures; however, the absence of a memory enhancement mechanism led to feature loss at a lower sampling ratio, thus diminishing its capacity for detail resolution. In contrast, our algorithm maintained a greater level of detail even at a reduced sampling ratio. The ENT metrics presented in Table 6 further substantiate that, relative to ISTA and ISTA-Net+, the proposed method achieves superior reconstruction performance in sparse scenes, such as islands and sea waves.

4. Discussion

In this study, through simulations and measured data experiments, we thoroughly assessed the reconstruction capabilities of our proposed algorithm in sparse marine SAR environments. The simulated tests employed simulated echo data to compare the performance of our algorithm with other methods, validating its effectiveness through detailed ablation studies. The outcomes of both simulation and ablation experiments unequivocally demonstrate the importance of the HSM and CLM in enhancing the quality of SAR scene reconstructions. In measured experiments, our algorithm outperformed ISTA and ISTA-Net+ by producing reconstructions with clearer edges in ship area imaging. Furthermore, in scenarios featuring islands and sea surfaces with waves, our algorithm preserved internal structures and details even at lower sampling ratios. This not only showcased the algorithm’s superior ability in edge preservation and detail restoration through improved inter-stage information transfer and the establishment of long-term dependencies within the network, but also highlighted its versatility in addressing a variety of sparse marine SAR imaging tasks.
In our proposed method, the division of SAR data into real and imaginary components within the gradient descent module enables the MADUN to more effectively process complex-valued data. However, this approach somewhat neglects the interaction between the real and imaginary parts, potentially leading to partial information loss or insufficient integration, which could adversely affect the final imaging quality. Furthermore, in our research, although the ConvLSTM within the CLM module successfully establishes connections across various stages, its efficacy in maintaining the influence of initial inputs diminishes with an increasing number of stages. This results in a gradual attenuation of information from earlier stages. Therefore, there is room for improvement in the method’s ability to balance historical and contemporary information effectively.

5. Conclusions

This work has introduced a sparse SAR imaging algorithm based on MADUN for marine scene imaging tasks, encompassing elements such as waves, islands, and ships. The deep unfolding network, a prominent deep learning strategy used for addressing the inverse problem in sparse SAR imaging, is traditionally challenged by information loss across single-channel stage transitions and the absence of long-range, cross-stage connectivity, impacting the quality of SAR reconstructions. To overcome these challenges, we integrated a memory enhancement mechanism within MADUN. Specifically, the gradient descent module within MADUN is tailored to accommodate the complex characteristics of radar signals by processing data into real and imaginary components. Meanwhile, the proximal mapping module introduces HSM and CLM, with the former addressing the gaps in information transfer between adjacent stages, and the latter establishing vital long-term cross-stage links. The experimental outcomes demonstrate that our proposed method significantly elevates the reconstruction performance in sparse marine scenes, surpassing traditional ISTA approaches and the deep unfolding method ISTA-Net+. We anticipate that this memory-augmented deep unfolding methodology will find broad application in marine SAR imaging and beyond.
In our study, we encounter limitations in processing complex-valued radar data and in the ability of long-term memory mechanisms to effectively balance and integrate historical and current information. Thus, future research and improvements may pursue the following avenues: (1) The design and incorporation of complex network structures or alternative methods capable of preserving more complex information during decomposition and processing. (2) The integration of attention mechanisms, which enable the model to dynamically focus on different parts of the input sequence when processing each output. This enhances the model’s ability to capture long-term dependencies and manage long-distance relationships, thereby further improving imaging performance.

Author Contributions

Conceptualization, Z.Z. and H.T.; methodology, Y.Z. and Y.T.; software, Y.T. and C.O.; writing—original draft preparation, Y.Z. and C.O.; writing—review and editing, B.W.-K.L. and Y.Z.; supervision, B.W.-K.L. and Z.Z.; funding acquisition, Z.Z. All authors have read and agreed to the published version of the manuscript.

Funding

This research was funded by the Natural Science Foundation of Guangdong Province under Grant 2021A1515012009.

Data Availability Statement

The data utilized in the simulated experiments of this study were sourced from the AIR-SARShip, which can be found here: (https://radars.ac.cn/web/data/getData?newsColumnId=d25c94d7-8fe8-415f-a897-cb88657a8141&pageType=en, accessed on 20 February 2024). The Sentinel-1 satellite data used in this study can be found here: (https://dataspace.copernicus.eu/browser, accessed on 20 February 2024). The GF-3 satellite data used in this study are not publicly available, as they were purchased.

Conflicts of Interest

The authors declare no conflicts of interest.

References

  1. Wei, X.Y.; Zheng, W.; Xi, C.P.; Shang, S. Shoreline Extraction in SAR Image Based on Advanced Geometric Active Contour Model. Remote Sens. 2021, 13, 18. [Google Scholar] [CrossRef]
  2. Li, C.L.; Kim, D.J.; Park, S.; Kim, J.; Song, J. A self-evolving deep learning algorithm for automatic oil spill detection in Sentinel-1 SAR images. Remote Sens. Environ. 2023, 299, 14. [Google Scholar] [CrossRef]
  3. Donoho, D.L. Compressed sensing. IEEE Trans. Inf. Theory 2006, 52, 1289–1306. [Google Scholar] [CrossRef]
  4. Dong, X.; Zhang, Y.H. SAR Image Reconstruction from Undersampled Raw Data Using Maximum A Posteriori Estimation. IEEE J. Sel. Top. Appl. Earth Obs. Remote Sens. 2015, 8, 1651–1664. [Google Scholar] [CrossRef]
  5. Xu, G.; Xia, X.G.; Hong, W. Nonambiguous SAR Image Formation of Maritime Targets Using Weighted Sparse Approach. IEEE Trans. Geosci. Remote Sens. 2018, 56, 1454–1465. [Google Scholar] [CrossRef]
  6. Monga, V.; Li, Y.L.; Eldar, Y.C. Algorithm Unrolling: Interpretable, Efficient Deep Learning for Signal and Image Processing. IEEE Signal Process Mag. 2021, 38, 18–44. [Google Scholar] [CrossRef]
  7. Zhang, J.; Chen, B.; Xiong, R.Q.; Zhang, Y.B. Physics-Inspired Compressive Sensing: Beyond deep unrolling. IEEE Signal Process Mag. 2023, 40, 58–72. [Google Scholar] [CrossRef]
  8. Zhao, Y.; Huang, W.K.; Quan, X.Y.; Ling, W.K.; Zhang, Z. Data-driven sampling pattern design for sparse spotlight SAR imaging. Electron. Lett. 2022, 58, 920–923. [Google Scholar] [CrossRef]
  9. Wei, Y.K.; Li, Y.C.; Ding, Z.G.; Wang, Y.; Zeng, T.; Long, T. SAR Parametric Super-Resolution Image Reconstruction Methods Based on ADMM and Deep Neural Network. IEEE Trans. Geosci. Remote Sens. 2021, 59, 10197–10212. [Google Scholar] [CrossRef]
  10. Hu, C.Y.; Li, Z.; Wang, L.; Guo, J.; Loffeld, O. Inverse Synthetic Aperture Radar Imaging Using a Deep ADMM Network. In Proceedings of the 20th International Radar Symposium (IRS), Ulm, Germany, 26–28 June 2019; pp. 1–9. [Google Scholar]
  11. Xiong, K.; Zhao, G.H.; Wang, Y.B.; Shi, G.M. SPB-Net: A Deep Network for SAR Imaging and Despeckling with Downsampled Data. IEEE Trans. Geosci. Remote Sens. 2021, 59, 9238–9256. [Google Scholar] [CrossRef]
  12. An, H.Y.; Jiang, R.L.; Wu, J.J.; Teh, K.C.; Sun, Z.C.; Li, Z.Y.; Yang, J.Y. LRSR-ADMM-Net: A Joint Low-Rank and Sparse Recovery Network for SAR Imaging. IEEE Trans. Geosci. Remote Sens. 2022, 60, 14. [Google Scholar] [CrossRef]
  13. Song, J.; Chen, B.; Zhang, J. Memory-Augmented Deep Unfolding Network for Compressive Sensing. In Proceedings of the 29th ACM International Conference on Multimedia, Virtual Event, Chengdu, China, 20–24 October 2021; pp. 4249–4258. [Google Scholar]
  14. Tibshirani, R. Regression Shrinkage and Selection Via the Lasso. J. R. Stat. Soc. Ser. B (Methodol.) 1996, 58, 267–288. [Google Scholar] [CrossRef]
  15. Beck, A.; Teboulle, M. A Fast Iterative Shrinkage-Thresholding Algorithm for Linear Inverse Problems. SIAM J. Imag. Sci. 2009, 2, 183–202. [Google Scholar] [CrossRef]
  16. Li, C.B.; Yin, W.T.; Jiang, H.; Zhang, Y. An efficient augmented Lagrangian method with applications to total variation minimization. Comput. Optim. Appl. 2013, 56, 507–530. [Google Scholar] [CrossRef]
  17. Zhang, J.; Ghanem, B. ISTA-Net: Interpretable Optimization-Inspired Deep Network for Image Compressive Sensing. In Proceedings of the 31st IEaEE/CVF Conference on Computer Vision and Pattern Recognition (CVPR), Salt Lake City, UT, USA, 18–23 June 2018; pp. 1828–1837. [Google Scholar]
  18. Xu, G.; Zhang, B.J.; Yu, H.W.; Chen, J.L.; Xing, M.D.; Hong, W. Sparse Synthetic Aperture Radar Imaging from Compressed Sensing and Machine Learning: Theories, applications, and trends. IEEE Geosci. Remote Sens. Mag. 2022, 10, 32–69. [Google Scholar] [CrossRef]
  19. Shi, X.J.; Chen, Z.R.; Wang, H.; Yeung, D.Y.; Wong, W.K.; Woo, W.C. Convolutional LSTM Network: A Machine Learning Approach for Precipitation Nowcasting. In Proceedings of the 29th Annual Conference on Neural Information Processing Systems (NIPS), Montreal, QC, Canada, 7–12 December 2015. [Google Scholar]
  20. Sun, X.; Wang, Z.R.; Sun, Y.R. AIR-SARShip-1.0: High Resolution SAR Ship Detection Dataset. J. Radars 2019, 8, 852–862. [Google Scholar]
  21. Zhang, H.W.; Ni, J.C.; Li, K.M.; Luo, Y.; Zhang, Q. Nonsparse SAR Scene Imaging Network Based on Sparse Representation and Approximate Observations. Remote Sens. 2023, 15, 28. [Google Scholar] [CrossRef]
Figure 1. Illustration of the ISTA-Net+ framework.
Remotesensing 16 01289 g001
Figure 2. Illustration of sparse SAR imaging algorithm based on MADUN.
Remotesensing 16 01289 g002
Figure 3. Illustration of the k-th stage in MADUN. “©” denotes concatenation along the channel dimension. “dCom” represents the decomposition of a complex number into its real and imaginary parts, while “Com” represents the inverse operation of “dCom”.
Remotesensing 16 01289 g003
Figure 4. Comparison of average PSNR at different stages between ISTA-Net+ and proposed method.
Remotesensing 16 01289 g004
Figure 5. Comparison of average PSNR at different epochs between ISTA-Net+ and proposed method.
Remotesensing 16 01289 g005
Figure 6. Imaging results for simulated data ships scene. From left to right are the results from the ISTA-based CS Imaging Algorithm, ISTA-Net+, and the Proposed Method. The first row displays results with subsampling at η = 80%, and the second row with subsampling at η = 50%.
Remotesensing 16 01289 g006
Figure 7. Performance curves of SAR image reconstruction in the ships scene by ISTA, ISTA-Net+, and the proposed method at different sampling ratios. (a) PSNR; (b) SSIM.
Remotesensing 16 01289 g007
Figure 8. Imaging results for simulated data dock scene. From left to right are the results from the ISTA-based CS Imaging Algorithm, ISTA-Net+, and the proposed method. The first row displays results with subsampling at η = 80%, and the second row with subsampling at η = 50%.
Remotesensing 16 01289 g008
Figure 9. Performance curves of SAR image reconstruction in the dock scene by ISTA, ISTA-Net+, and the proposed method at different sampling ratios. (a) PSNR; (b) SSIM.
Remotesensing 16 01289 g009
Figure 10. Performance comparison of phase reconstruction quality. (a) ISTA; (b) ISTA-Net+; (c) proposed method.
Remotesensing 16 01289 g010
Figure 11. Performance comparison of the memory enhancement mechanism. (a) PSNR; (b) SSIM; (c) NMSE.
Remotesensing 16 01289 g011
Figure 12. (ac) The imaging results for three different scenes based on measured data. Within the same scene, from left to right are the results yielded by the ISTA algorithm, ISTA-Net+, and the proposed method. The first row shows the results with Subsampling at η = 80%, and the second row is with subsampling at η = 50%. (a) Scene 1: ship scene. (b) Scene 2: island scene. (c) Scene 3: wave scene.
Remotesensing 16 01289 g012aRemotesensing 16 01289 g012b
Table 1. Main parameters for simulation, Sentinel-1 satellite, and GF-3 satellite.
ParametersSimulationSentinel-1GF-3
Range FM rate1.3 MHz/µs1.93 MHz/µs1.33 MHz/µs
Center frequency5.4 GHz5.4 GHz5.4 GHz
Signal bandwidth60.5 MHz87.71 MHz60 MHz
Pulse duration45 µs45.5 µs45 µs
Pulse repetition frequency1200 Hz1871 Hz1150 Hz
Table 2. Comparison of PSNR and SSIM metrics for imaging of the ships scene in simulated experiments through different methods.
MethodPSNR (dB)/SSIM
η = 50%η = 80%
ISTA22.61/80.87%28.87/89.20%
ISTA-Net+26.35/87.50%31.38/94.82%
Proposed Method32.52/96.53%34.78/98.46%
Table 3. Comparison of PSNR and SSIM metrics for imaging of the dock scene in simulated experiments through different methods.
MethodPSNR (dB)/SSIM
η = 50%η = 80%
ISTA20.24/78.32%25.33/85.14%
ISTA-Net+24.96/83.31%29.69/92.63%
Proposed Method30.11/93.24%32.86/97.93%
Table 4. Comparison of metrics for performance study of memory enhancement mechanism.
MethodPSNR (dB)/SSIM/NMSE
K = 5K = 7K = 9K = 11
ISTA-Net+24.62/84.16%/0.079425.52/86.22%/0.061226.06/87.50%/0.052526.11/87.45%/0.0521
ISTA-Net+ with HSM26.54/86.24%/0.064527.89/88.66%/0.050328.42/90.04%/0.045828.4/90.01%/0.0457
ISTA-Net+ with CLM26.82/86.82%/0.060828.76/90.43%/0.044229.28/92.57%/0.035429.25/92.58%/0.0350
Proposed Method30.96/93.15%/0.040132.01/94.83%/0.027632.48/96.24%/0.020732.54/96.27%/0.0204
Table 5. Performance comparison of imaging speed.
MethodTime (ms)
ISTA-Net+31.8
ISTA-Net+ with HSM85.2
ISTA-Net+ with CLM92.1
Proposed Method156.7
Table 6. Comparison of ENT for imaging of three scenes in actual experiments through different methods.
SceneSample Ratio (η)ENT
ISTAISTA-Net+Proposed Method
Scene 1: Ship Scene80%3.512.822.35
50%4.223.472.87
Scene 2: Island Scene80%4.363.843.11
50%4.84.233.62
Scene 3: Wave Scene80%3.733.012.52
50%4.473.783.20
Disclaimer/Publisher’s Note: The statements, opinions and data contained in all publications are solely those of the individual author(s) and contributor(s) and not of MDPI and/or the editor(s). MDPI and/or the editor(s) disclaim responsibility for any injury to people or property resulting from any ideas, methods, instructions or products referred to in the content.

