Abstract
This paper shows the observation and estimation of convective wind gusts by different satellite sensors at the C-band (Sentinel-1 SAR) and L-band (ALOS-1 SAR and SMAP radiometer) over Lake Victoria, the Gulf of Guinea, and the Gulf of Mexico. These areas are significantly impacted by deep convection associated with strong surface winds and heavy rainfall. In particular, the collocation of Sentinel-1 and SMAP images enables the observation of the movement of surface wind gusts corresponding to that of deep convective clouds. The convective wind intensity estimated from Sentinel-1 and SMAP data varies from 10 to 25 m/s. Additionally, we present an agreement in the observation of deep convective clouds, dynamics, and strong surface winds by different satellite sensors, including Meteosat geostationary (GEO), Aeolus Lidar, and Sentinel-1 SAR, respectively. We also evaluate the estimated convective wind gusts by comparison with the in situ measurements of the weather stations installed in the Gulf of Mexico, where deep convection occurs regularly. The result shows an agreement between the two wind sources estimated and measured. Likewise, the peaks of the measured wind gusts correspond to the occurrence of deep convective clouds observed by the GOES-16 GEO satellite.
Keywords:
Aeolus; ALOS-1; convective wind gust; deep convection; GOES-16; Meteosat; Sentinel-1; SMAP 1. Introduction
A convective system (CS) is an extreme weather event since it can be associated with intense lightning, heavy rainfall, and severe wind gusts [1,2]. CS observation (or now-cast) and forecast are still significant issues for meteorologists due to their sudden ignition and fast development. During the last decades, the arrival of many GEOstationary (GEO) satellites (Meteosat, GOES, Himawari, and Gaofen) has helped improve CS observation and monitoring in real time over Europe/Africa, America, and the Asia Pacific. In particular, the new generation of GEO satellites can acquire images every 5 min. However, the CS-associated surface effects observation as heavy rainfall and wind gusts remain significant challenges due to the lack of high-resolution sensors. Previous studies [3,4,5,6] indicated that sea surface wind patterns associated with CSs could be retrieved from C-band high-resolution Synthetic Aperture Radar (SAR) images such as Sentinel-1 and Radarsat-2. In addition, these references illustrated the matching in location, time observation, and shape between the SAR-observed surface wind patterns and the Meteosat-observed deep convective clouds with a low brightness temperature (200–230 K). Thanks to the advantages of SAR (high spatial resolution and wide swath), one can observe different types of convective wind patterns, including mesoscale (>100 km) and sub-mesoscale (<100 km) ones, in the shape of a (linear) squall line and non-linear convection cells. Surface wind intensity associated with these patterns varies from 10 to 25 m/s. La et al. [5] illustrated a multi-view of deep convection and its vertical and horizontal dynamics through the collocation of Low-Earth Orbit (LEO), i.e., Sentinel-1, Aeolus, and GEO satellites, i.e., Meteosat. Such a collocation leads to a better illustration of the relationship between deep convective clouds (observed by Meteosat) and their dynamics viewed by Aeolus and Sentinel-1.
As indicated in [3,4,5,6], the high-intensity radar backscattering on the C-band Sentinel-1 and Radarsat-2 SAR images was induced by convective wind gusts. However, Nie and Long [7] assumed that it was due to rainfall effects (atmospheric volume and raindrops impinging onto the sea surface), and Alpers et al. [8] indicated that high-intensity radar backscattering was associated with the hydrometeors in the melting layer. As discussed in [9,10], L-band radar backscattering is much less impacted by precipitation than other radar frequency bands. For C-band, the contribution of rainfall to the radar backscattering observed on SAR images significantly depends on surface wind speed [9,11], and it is little for winds above 7 m/s. In other words, the high-intensity radar backscattering on C-band SAR images associated with deep convection should be induced by strong surface winds rather than precipitation. Likewise, in [12,13], they indicated that rainfall has little impact on surface wind speed estimation from C-band radar backscattering. Recently, Guo et al. [14] studied the effect of precipitation on SAR hurricane wind field retrieval. They concluded that when the wind speed is less than 30 m/s and the rain rate is less than 20 mm/h, the distribution of the melting layer has no obvious effect on SAR wind speed retrieval. To strengthen our assumption about the observation and estimation of sea surface convective wind gusts from C-band SAR images, we present here new results based on different satellite sensors at the C-band and L-band for three regions, including Lake Victoria, the Gulf of Guinea, and the Gulf of Mexico. These tropical or sub-tropical regions are regularly impacted by severe deep convection. Additionally, to assess the estimated wind gusts from satellite data, they are compared with the in situ measurements of the weather stations installed in the Gulf of Mexico. Concretely, this paper will focus on five main and significant points, as follows.
Firstly, we present the observation of convective wind gusts over Lake Victoria on C-band Sentinel-1 SAR images. The method to estimate surface wind speed is the same as proposed in [3,4,5,6]. Lake Victoria, the largest lake in Africa, was selected as one of the regions of interest (ROIs) since one can observe the frequent occurrence of deep convection and the associated dangerous effects on fishing activities, including wind gusts, heavy rainfall, and lightning, especially at night-time [2,15,16]. In [2,16], they indicated that the strong surface winds associated with convective storms are one of the significant hazards for fishing activities over the lake. Waniha et al. [2] estimated horizontal wind gusts based on the radar radial velocity at around 08:00–09:00 UTC (peak in convection), while Chamberlain et al. [16] used the Met Office 4 km numerical model to forecast wind gusts associated with the convective storms. These studies offered similar convective wind gust estimates of 15–20 m/s. Likewise, Van de Walle et al. [17] used a regional climate model run at convection-permitting resolution to simulate both precipitation and wind gusts over Lake Victoria for a historical 10-year period. It showed many cases of wind gusts over 15 m/s, and a threshold of 20 m/s was used to classify moderate and severe wind gusts.
Secondly, we present convective wind patterns observed on L-band ALOS-1 SAR images over the Gulf of Guinea, one of the tropical or subtropical regions where CSs play a principal role in local and regional weather variability. According to the West Africa Monsoon (WAM), intense CSs are often formed over Central and West Africa and then move westwards through the Gulf of Guinea. These CSs, regularly in the form of squall lines, can generate heavy rainfall in this region and strong surface winds over the sea [18]. As discussed above, since the L-band radar signal is little impacted by precipitation, the high-intensity radar backscattering observed on ALOS-1 images corresponding to deep convection should be induced from convective wind gusts.
Thirdly, we illustrate convective wind patterns observed on C-band Sentinel-1 SAR and L-band SMAP images. The collocation of the two satellite sensors with a reasonable time lag enables the observation of the surface displacement of convective wind gusts corresponding to the motion of deep convective clouds observed by Meteosat.
Fourthly, this paper illustrates the multi-view of a mesoscale CS spreading from the Gulf of Guinea to offshore Gabon through the combination of Meteosat, Aeolus, and Sentinel-1. Indeed, the Aeolus Lidar instrument offers precious vertical wind profiles that may enable the identification of strong winds within lower atmospheric layers, associated with deep convection. On the one hand, this approach upholds the schematic understanding of a CS and its vertical and horizontal dynamics. On the other hand, it strengthens the relationship between deep convective clouds detected by Meteosat and surface wind patterns on C-band Sentinel-1 SAR images.
Fifthly and finally, we evaluate the observed convective wind gusts by comparison with in situ measurements.
The last point is the most significant work of this paper since it provides another way to strengthen the assumption about the relationship between strong surface winds and deep convective clouds, as well as to better understand the gap, if existing, between the estimation and measurement of convective wind gusts at the sea surface. Indeed, measuring sea surface convective wind gusts is complicated due to their local scale (or sub-mesoscale) and rapid time variability. For instance, to reach the wind gust measurements using in situ sensors, it is necessary to perform measurements for at least one hour. Also, these gust events can not necessarily occur when LEO satellites like Sentinel-1A/B pass over a region. Therefore, we must process a mass of in situ data to find corresponding cases between in situ measurements and Sentinel-1-estimated convective wind gusts. Among the subtropical and tropical regions, the Gulf of Mexico presents numerous in situ stations (buoys and weather stations). These devices are installed by the NOAA (National Oceanic and Atmospheric Administration) and its industrial partners. Thanks to the short revisit time of Sentinel-1A/B over the Gulf of Mexico, we can obtain enough images relevant to assess the accuracy of ocean surface wind speed estimated from Sentinel-1 data compared to wind speed measured by the in situ devices. Among them, we present a case study to illustrate an agreement between the estimated wind intensity of a mesoscale convective squall line and the wind speed measured by the weather stations installed along the west coast of Florida.
Section 2 presents the methodology of this paper, including data preparation and surface wind speed estimation using Sentinel-1, ALOS-1, and SMAP data. Section 3 illustrates the new results of sea surface convective winds observation, as mentioned above. Section 4 compares the estimated surface wind gusts and the in situ measurements. Section 5 discusses how the results illustrated in this paper strengthen our assumption about the high-intensity radar backscattering associated with surface convective wind gusts. Finally, Section 6 presents our conclusions and perspectives.
2. Methodology
2.1. Region of Interest (ROI)
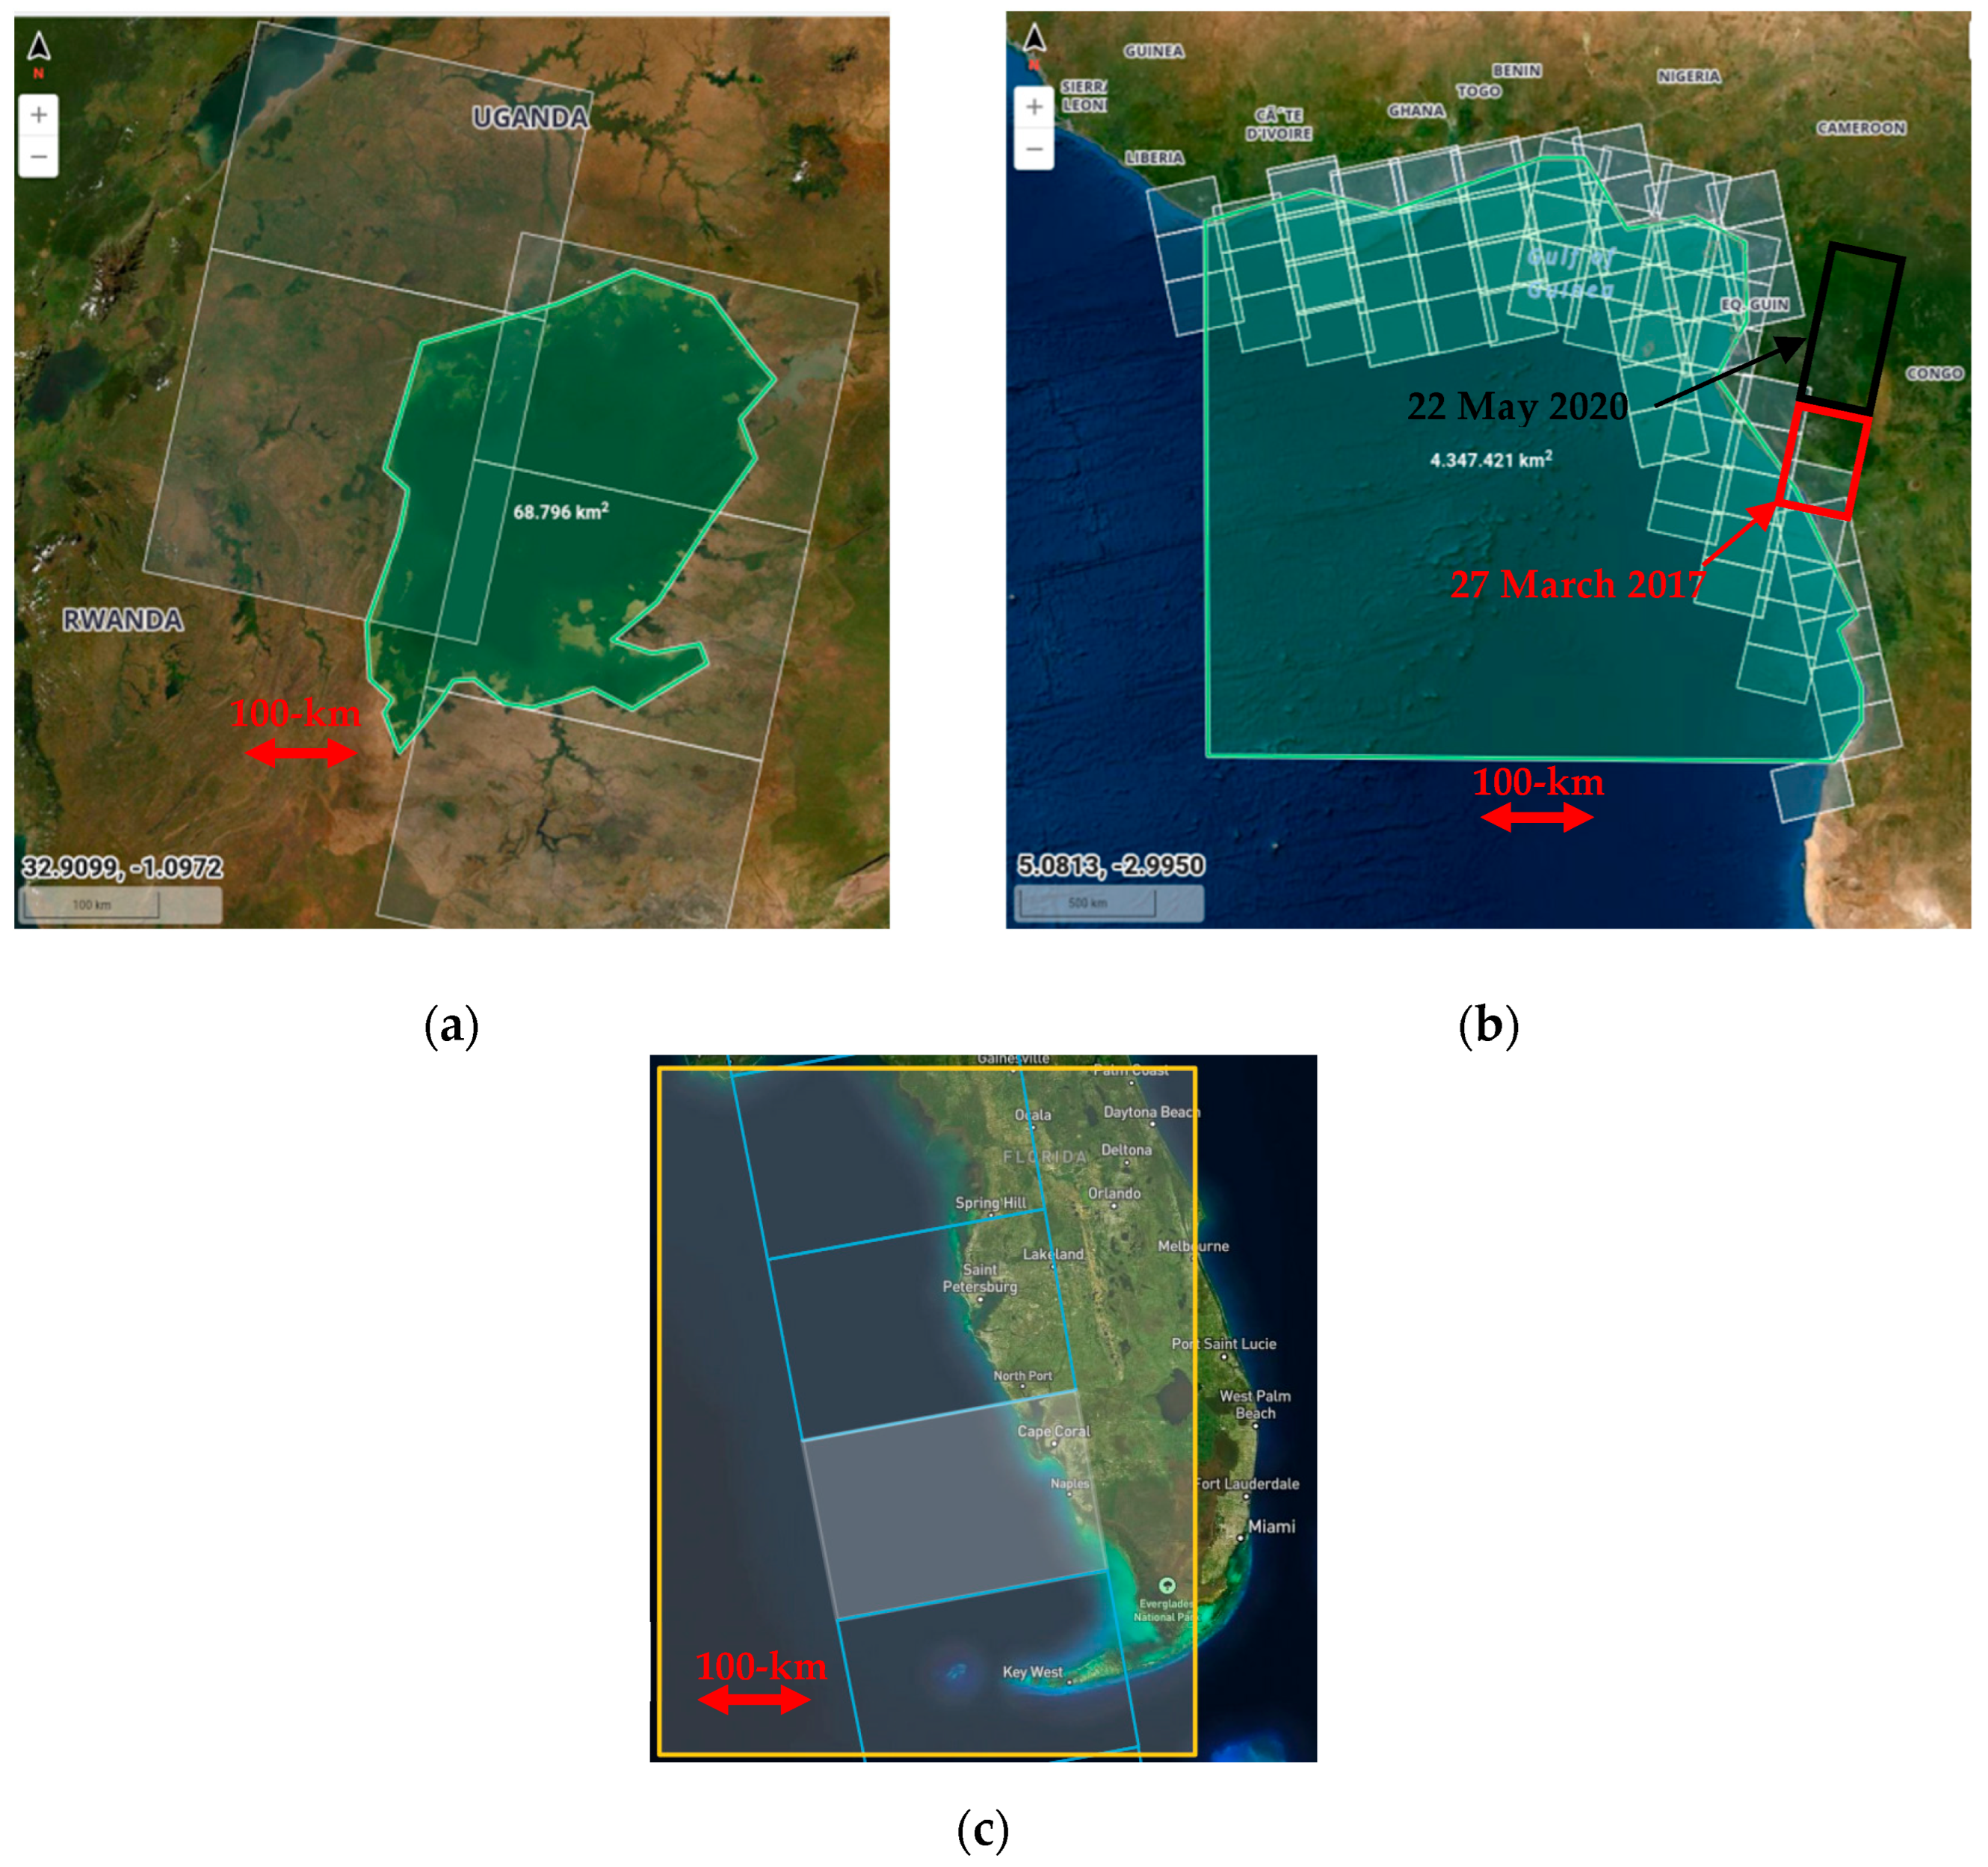
Figure 1 presents the three ROIs of this study for the observation of convective wind gusts at the sea surface over Lake Victoria (Africa), the Gulf of Guinea and offshore Gabon and Angola, and the Gulf of Mexico, with many buoys and weather stations installed by the NOAA and its industrial partners. Figure 1a shows Lake Victoria imaged by Sentinel-1B in descending direction mode, 28–29 January 2020, at around 03:00 UTC, corresponding to the peak in convection over the lake [19,20]. Sentinel-1A takes images of Lake Victoria at around 16:00 UTC in the ascending direction mode, but only a few peaks in convection occur at that time. Therefore, we principally focus on Sentinel-1 images acquired in the descending direction mode. Figure 1b illustrates images captured monthly by Sentinel-1A/B in the descending and ascending modes, respectively, over the Gulf of Guinea and offshore Gabon and Angola, where severe deep convection occurs at that time. Indeed, the Sentinel-1A/B acquisition time for the two modes at around 05:00 and 18:00 UTC corresponds to the peaks in convection in this region [21]. Such a significant collection of Sentinel-1A/B images enables the observation of CSs at different scales. The Sentinel-1A descending scenes used in this paper for convective wind gust observation are highlighted in red for 27 March 2017 and in black for 22 May 2020 (Figure 1b). As well as the Gulf of Guinea, Sentinel-1A/B provides many images over the Gulf of Mexico in both descending and ascending modes with a revisit time of 3 days. This advantage, coupled with the fact that the Gulf of Mexico includes a significant collection of buoys and weather stations, facilitates the comparison of the Sentinel-1-estimated wind speed and in situ measurements, including many cases of convective wind gusts. In this paper, we present a case study that compares the Sentinel-1-estimated convective wind gusts with the in situ measurements provided by the weather stations installed along the west coast of Florida (Figure 1c).
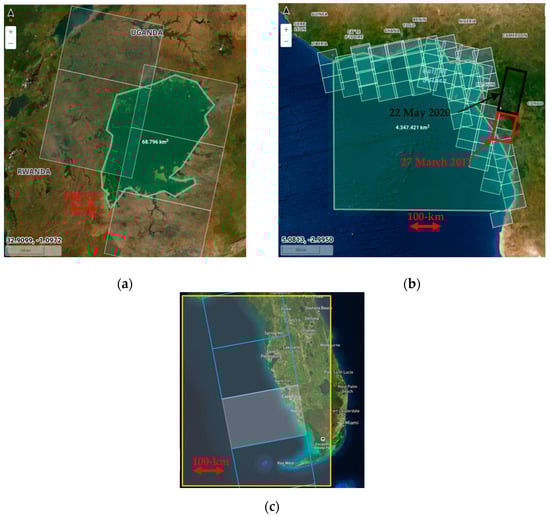
Figure 1.
Three regions of interest (ROIs) for convective wind gust observations at the sea surface. (a) Lake Victoria (Africa) imaged by Sentinel-1A/B in the descending mode (square white polygons), 28–29 January 2020. (b) The Gulf of Guinea and offshore Gabon and Angola imaged by Sentinel-1A/B in the descending and ascending modes (square white polygons), 1–31 January 2020. Sentinel-1A descending scenes used in this paper for convective wind gust observation are highlighted in red for 27 March 2017 and in black for 22 May 2020. (c) The west coast of Florida imaged by Sentinel-1A in the ascending mode (square white polygons), 14 April 2019.
2.2. Data Preparation
This paper uses Sentinel-1 Interferometric Wide (IW) mode with a 250 km swath, ALOS-1 ScanSAR mode with a 350 km swath, and the collocated SMAP data with Sentinel-1 images to estimate surface wind speed associated with deep convection. Sentinel-1 and ALOS-1 Level-1 images should be preprocessed to obtain radar backscattering or Normalized Radar Cross-Section (NRCS). Surface wind speed at the 10 m height is retrieved through the NRCS and other parameters using the Geophysical Model Functions (GMFs). Sentinel-1 and ALOS-1 images acquired at a high spatial resolution (10 m vs. 25 m pixel spacing) and with a wide swath (250 km vs. 350 km) can offer surface wind pattern observations at various scales.
The NASA Soil Moisture Active Passive (SMAP) mission was launched on 29 January 2015 to measure soil moisture and provide freeze/thaw classification for hydrology and carbon cycle studies. It includes a passive radiometer and an active scatterometer at the L-band. Although only the SMAP radiometer has been operating since July 2015 due to the failure of the radar transmitter, it has significant capacities to measure ocean surface salinity and strong surface winds, specifically ocean winds in storms [10,22]. Despite having a low spatial resolution, SMAP data can be used to observe mesoscale convective wind patterns and combined with Sentinel-1 images to follow surface wind pattern displacement. We used the retrieved SMAP wind speeds resampled to a 0.25° spatial grid publicly available in [23].
The Aeolus sensor measures vertical wind profiles of horizontal winds from altitudes of 27 km down to near the sea surface, with layer thickness ranging from 500 m to 2 km, utilizing backscattering from aerosols and molecules at mid-levels. Leveraging Aeolus’s short revisit time over the Gulf of Guinea, integrating Sentinel-1, Aeolus, and Meteosat data enables a comprehensive multi-view analysis of deep convection and its dynamics.
The Meteosat images are used in this paper to observe deep convective clouds (200–220 K brightness temperature) corresponding to convective wind patterns observed on Sentinel-1 images. Therefore, only Meteosat data with a close acquisition time (not over 10 min) to Sentinel-1 ones are selected, and they are resampled on the grid of Sentinel-1 data. As well as Meteosat, GOES-East (GOES-16) and West (GOES-17) deliver images every 5–10 min over the Gulf of Mexico with a 2 km spatial resolution. We use the GOES Infrared Longwave band (Channel 14) to detect deep convective clouds at 200–220 K. The GOES data are also collocated on the Sentinel-1 grid to facilitate comparisons between the two wind sources.
The in situ wind data are measured by the NOAA buoys and weather stations at different heights. Therefore, they must be transformed to the wind speed at the 10 m height to compare with the Sentinel-1-retrieved wind speed. There are two widely used methods to convert wind speed at the z-m height to the one at the 10 m reference height: (i) wind profile power law [24] and (ii) equivalent neutral wind [25]. The detailed description of the two approaches, as well as the comparison of wind speeds calculated by them, is shown in [26]. The wind speeds corrected with [24,25] were very close; however, we selected the equivalent neutral wind method for this work since it can convert wind speed at different heights to the 10 m one without the neutral stability condition.
2.3. Sea Surface Wind Speed Estimation
Convective surface wind patterns can be observed on C-band SAR images, as shown in [3,4,5,6,27]. These references illustrated that deep convective clouds could induce surface wind gusts as intense dynamic winds hit the sea surface. The wind gusts significantly impact sea surface roughness and can be observed as the high-intensity radar backscattering (NRCS) areas on SAR images. In other words, the SAR can observe indirectly convective surface wind patterns. Sea surface wind speed can be retrieved from C-band SAR data using the CMOD5.N function [28], while the LMOD2 [29] is used to retrieve surface wind speed from L-band ALOS-1 images. Wind direction used in these functions are extracted from the ERA-5 reanalysis data [30,31].
The CMOD5.N function can estimate wind speed up to 25–30 m/s depending on the incidence angle [25,32]. Meanwhile, LMOD2 can retrieve surface wind speeds of up to 20 m/s [29]. The L-band SAR-based wind speed retrieval is not affected by rain, or even intense precipitation [9,10]. Likewise, the C-band SAR-based wind speed estimation is little impacted by precipitation for surface wind intensities larger than 7 m/s [9,11].
Meissner et al. [10] presented the retrieval of ocean surface wind speed from the L-band SMAP radiometer data through the Radiative Transfer Model (RTM). First, they took the differences between sea surface brightness temperatures measured by the SMAP radiometer and those of a flat ocean surface. Then, they matched these differences to the RTM model. Once the difference in brightness temperature and other parameters are determined, one can invert the RTM to estimate surface wind speed. As well as the L-band SAR, sea surface wind speed retrieved from L-band SMAP data is not affected by rain [10]. Additionally, ref. [10] validated the SMAP winds by collocating SMAP winds with those from the SFMR (Stepped Frequency Microwave Radiometer) instrument. The comparison between the two wind sources showed good agreement, particularly for surface winds higher than 25 m/s, with a bias of 0.5 m/s and a standard deviation of about 3 m/s. According to [23], the SMAP-estimated wind speed data are recommended for surface wind speeds above 12 m/s.
3. Observation and Estimation of Convective Wind Gusts at the Sea Surface
3.1. Sentinel-1-Observed Convective Winds over Lake Victoria
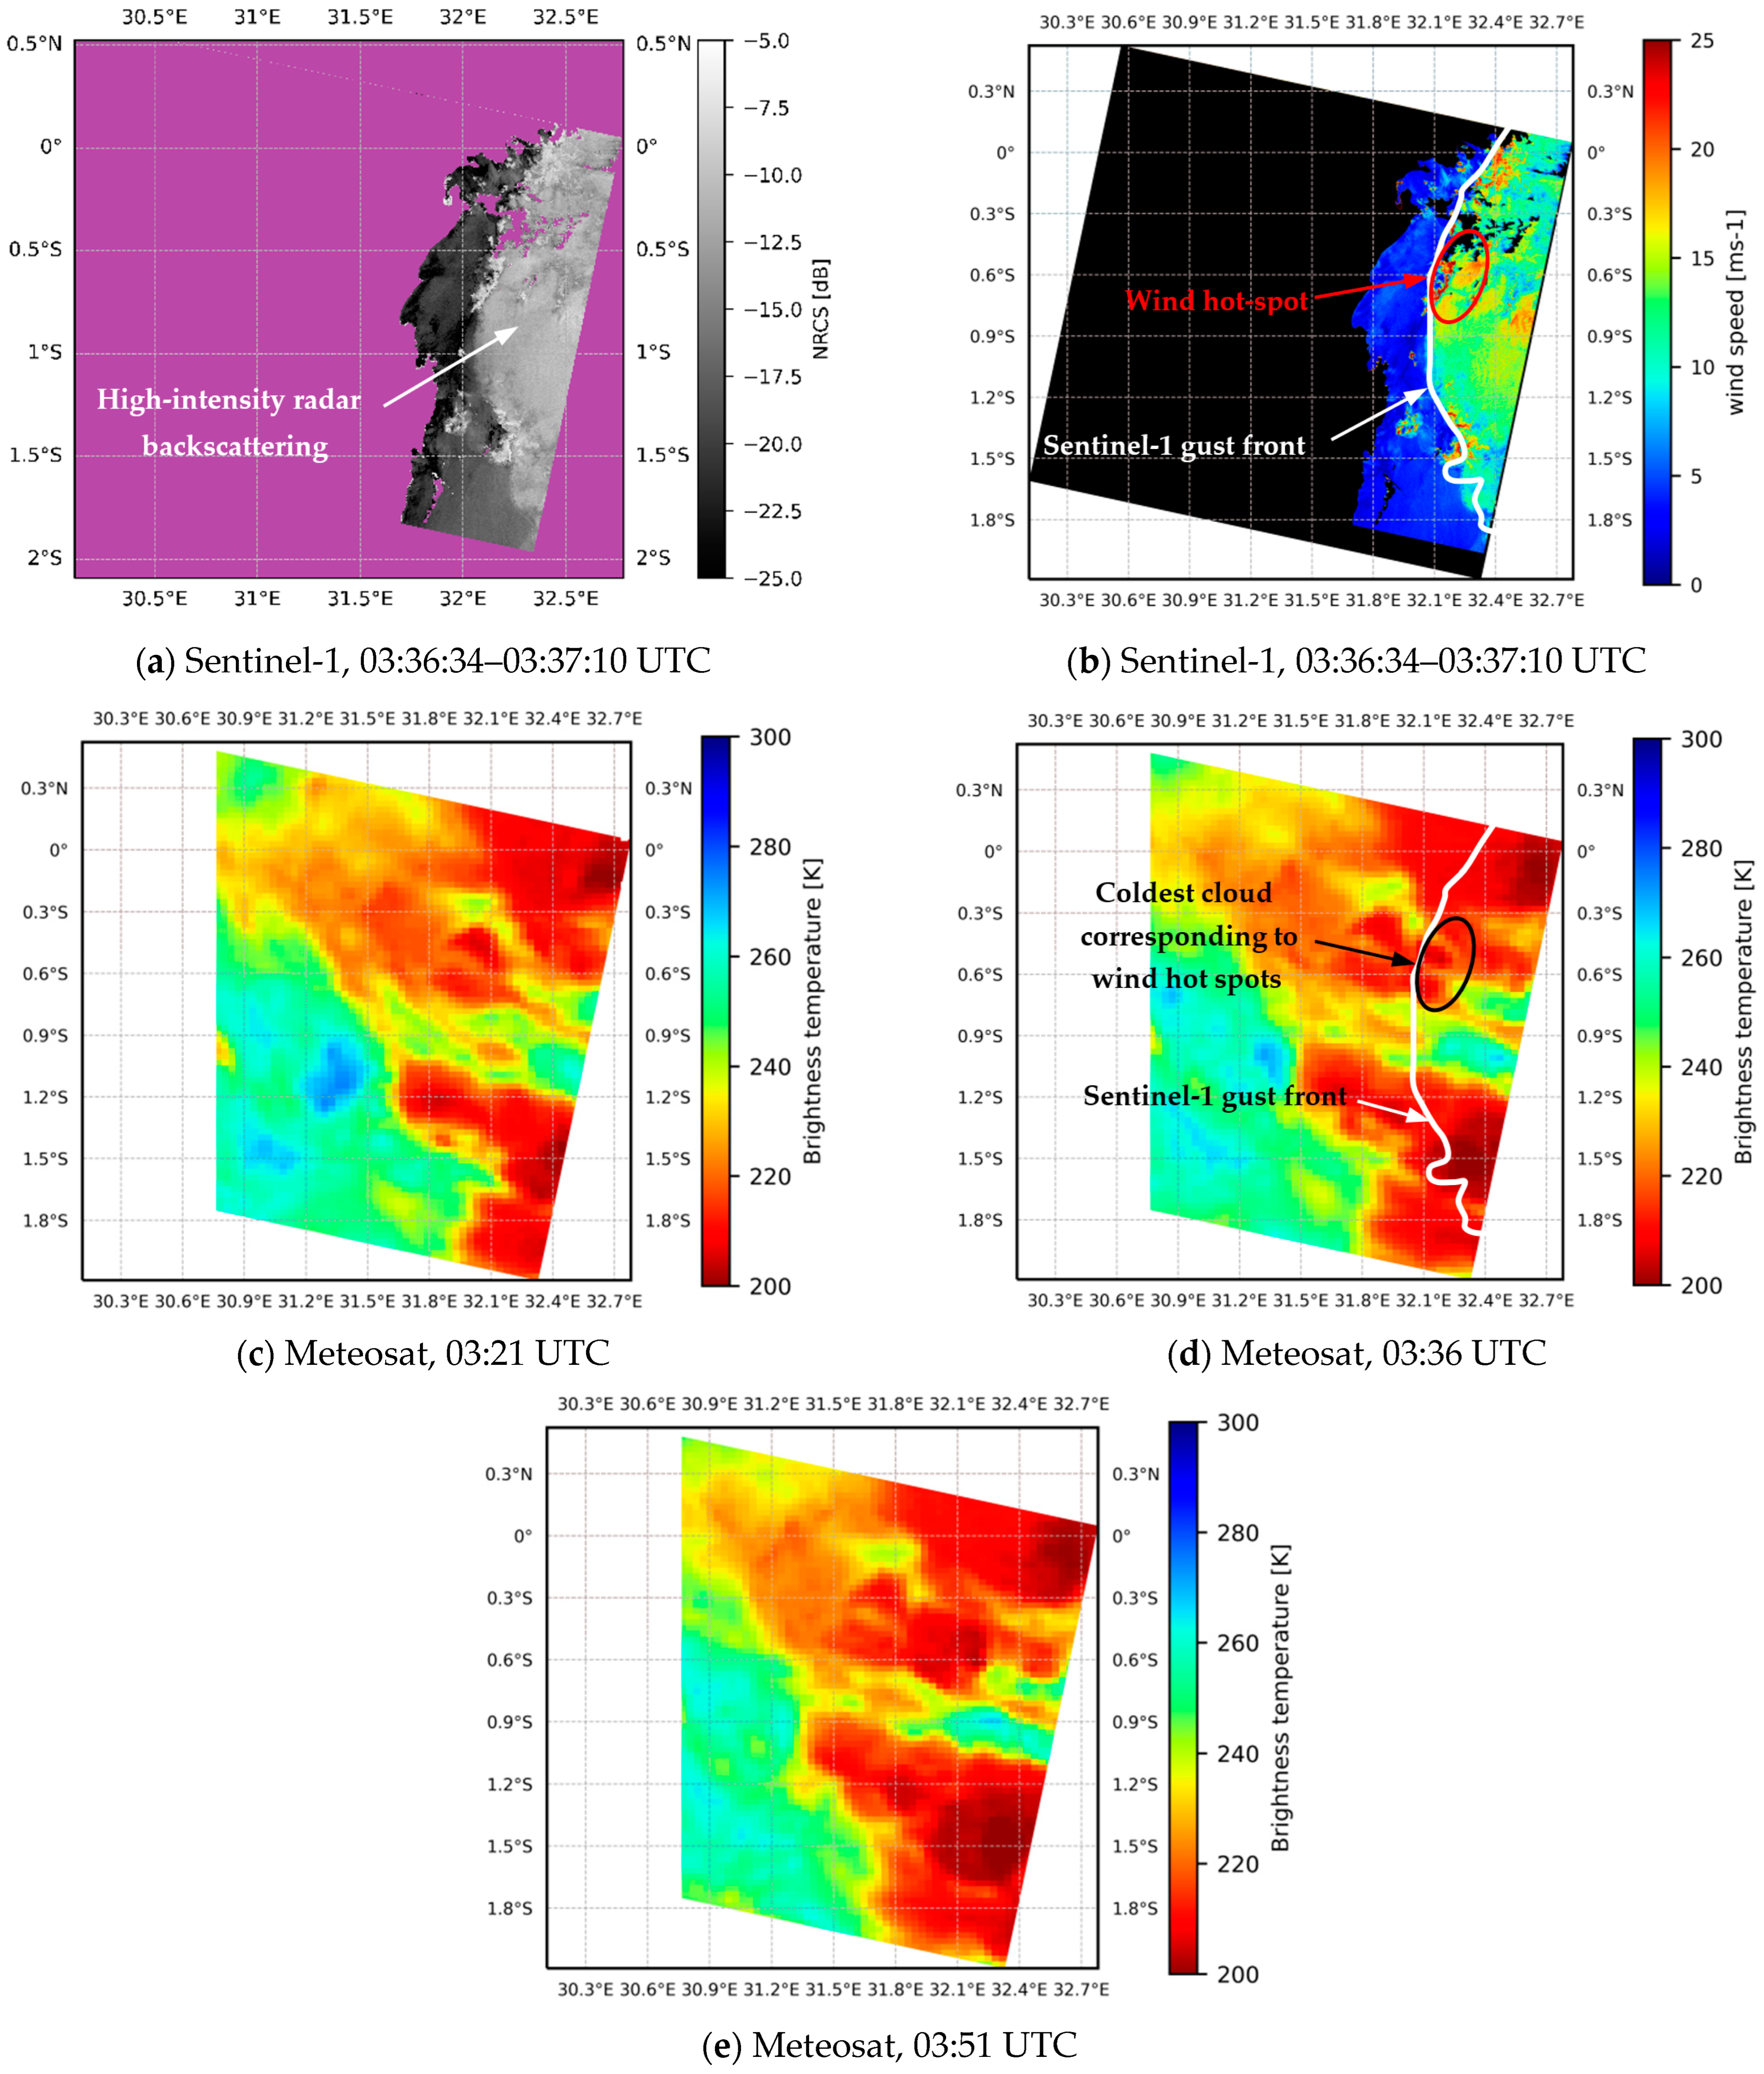
Figure 2 illustrates a mesoscale surface wind pattern observed on Sentinel-1 images over Lake Victoria, 28 January 2020, at around 03:36:34–03:37:10 UTC. This observation time corresponds to the peak in convection between 00:00 and 06:00 UTC [19,20]. The mesoscale wind pattern in Figure 2b spreads on 2° latitude (about 250 km), from 0.2°N to 1.8°S, and wind pattern intensity varies from 12 m/s to 20 m/s, and some hot spots can reach 25 m/s. As shown in Figure 1 of [4], the mesoscale features can produce surface wind gusts with an intensity much higher than synoptic wind. That is why we can see the two distinct wind areas in Figure 2b. The surface wind gusts associated with deep convection have an intensity of 10–25 m/s, while the synoptic wind speed is only about 5–6 m/s. Based on the significant difference in wind gradient, we can determine the border between wind gusts and synoptic wind, and then we can draw the gust front, as shown in Figure 2.

Figure 2.
Mesoscale surface wind pattern observed on Sentinel-1A IW image (descending mode), 28 January 2020, over Lake Victoria, corresponding to the deep convective clouds observed by Meteosat. (a) NRCS extracted from Sentinel-1 image showing the high-intensity radar backscattering associated with deep convection. (b) Sea surface wind speed retrieved from Sentinel-1 image, 03:36:34–03:37:10 UTC. (c–e) Corresponding deep convective clouds (200–220 K brightness temperature) observed by Meteosat at 03:21, 03:36, and 03:51 UTC, respectively.
The estimated wind gusts associated with deep convection from the Sentinel-1 images are very close to that derived by the radial wind velocity measured by a weather radar [2] and the one predicted by the Met Office 4 km model [16]. Likewise, a convective surface wind gust of 20 m/s has been reported in [33].
Figure 2c–e present deep convective clouds (200–220 K brightness temperature) observed on Meteosat images, 28 January 2020, at 03:21, 03:36, and 03:51 UTC, respectively. These periods correspond to the time before, during, and after the Sentinel-1 image acquisition time. Therefore, it offers an overview of a strong link between deep convective clouds and corresponding surface wind patterns. The location of deep convective clouds and wind patterns is very close. In particular, the wind hot spots above 20 m/s (0.6°S, 32.1°E, 1.35°S, 31.95°E) match the coldest cloud (about or less than 200 K) at (1.5°S, 32.1°E) when comparing Figure 2b (Sentinel-1, 03:36:34–03:37:10 UTC) and Figure 2d (Meteosat, 03:36 UTC). This result illustrates that high surface winds can occur just after the coldest cloud occurrence. Likewise, when comparing Figure 2c–e, one can note that deep convective clouds, especially the coldest ones, tend to move northwestwards.
3.2. ALOS-1-Observed Convective Winds over the Gulf of Guinea
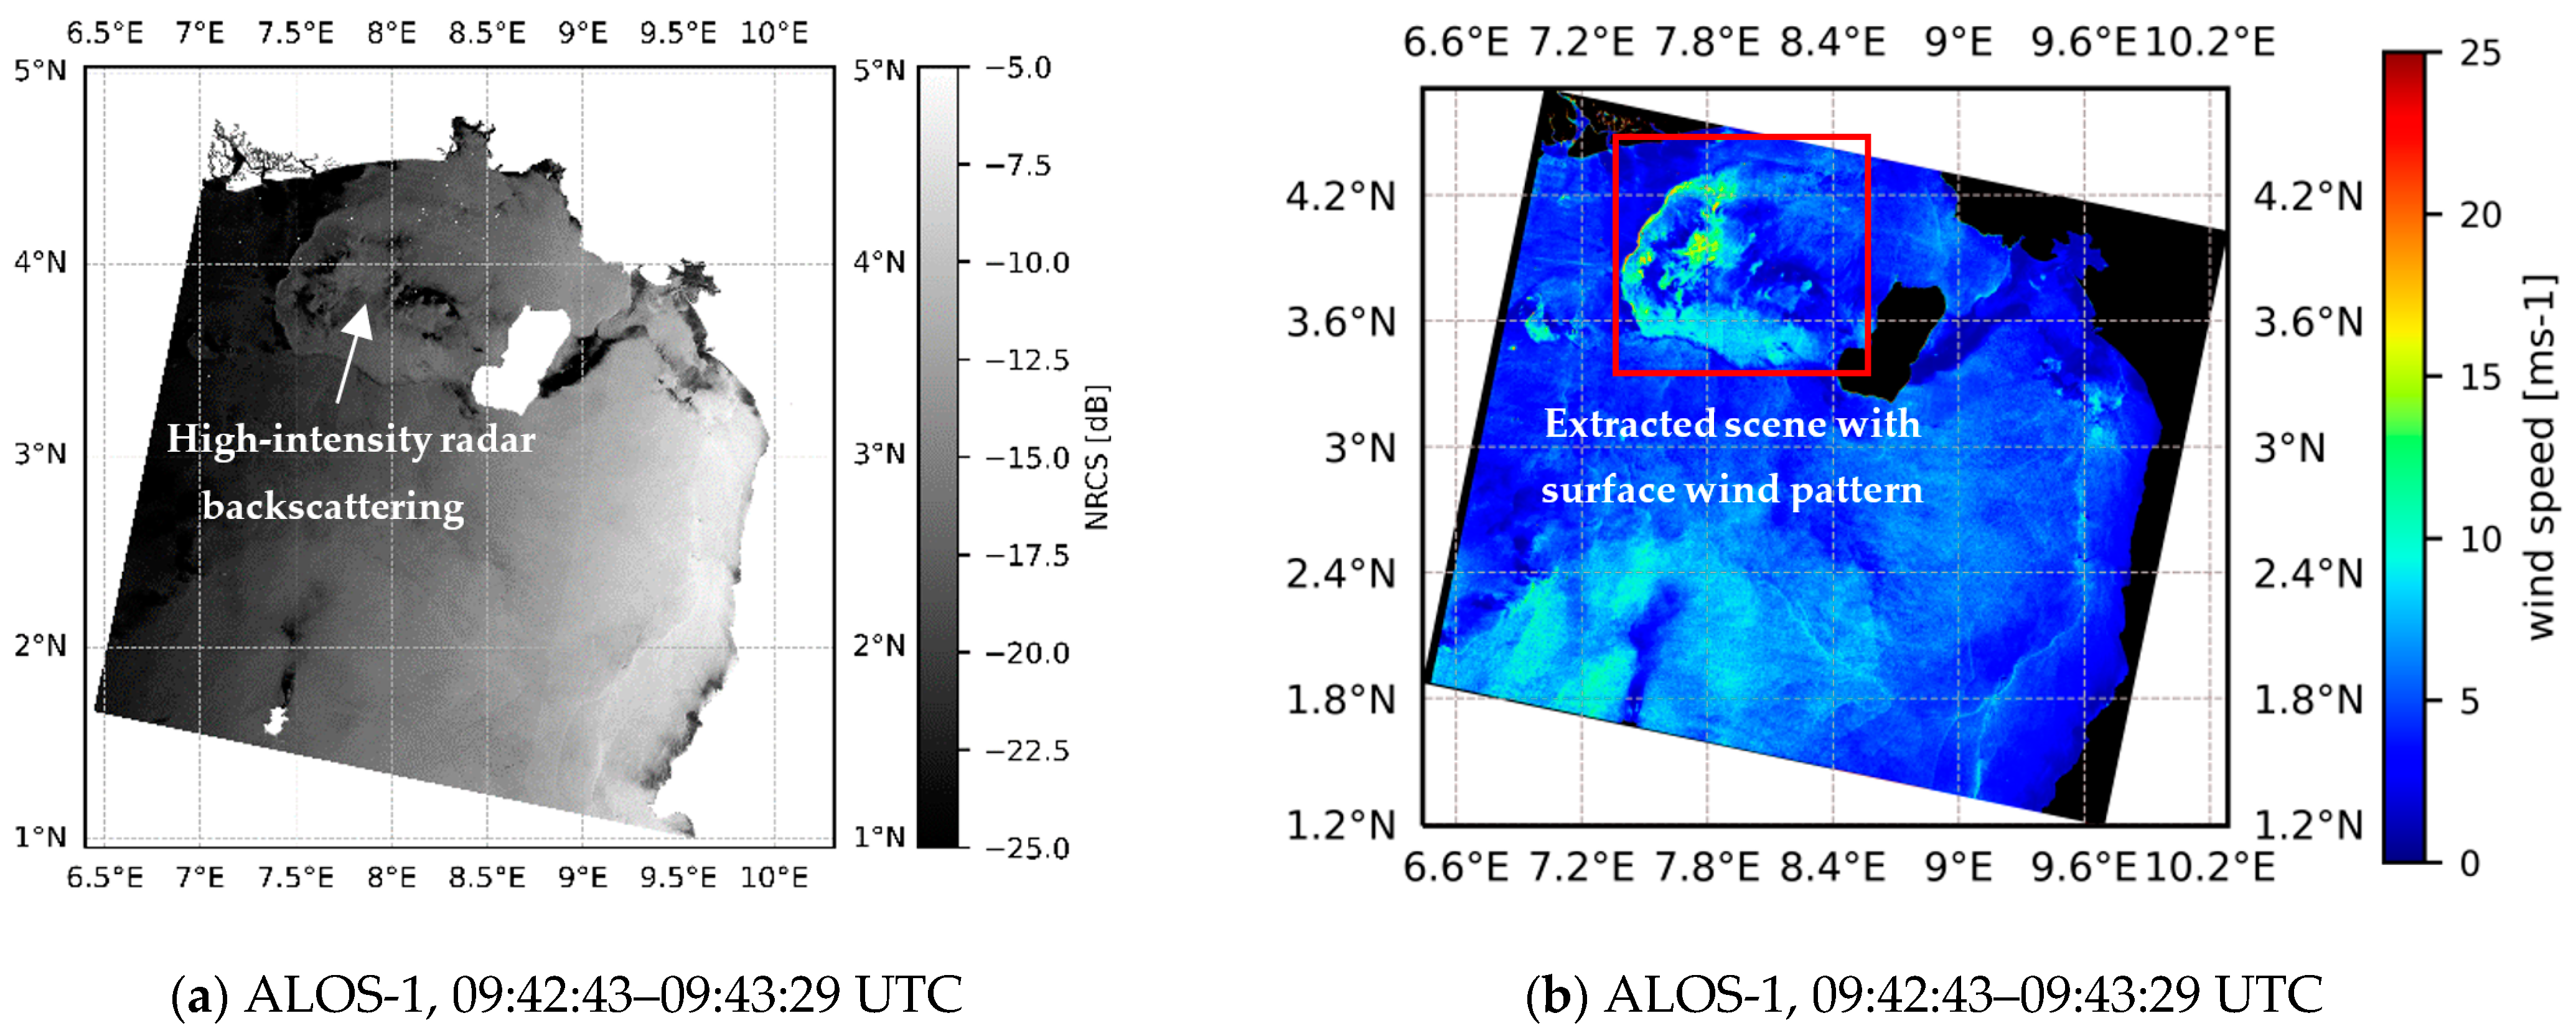
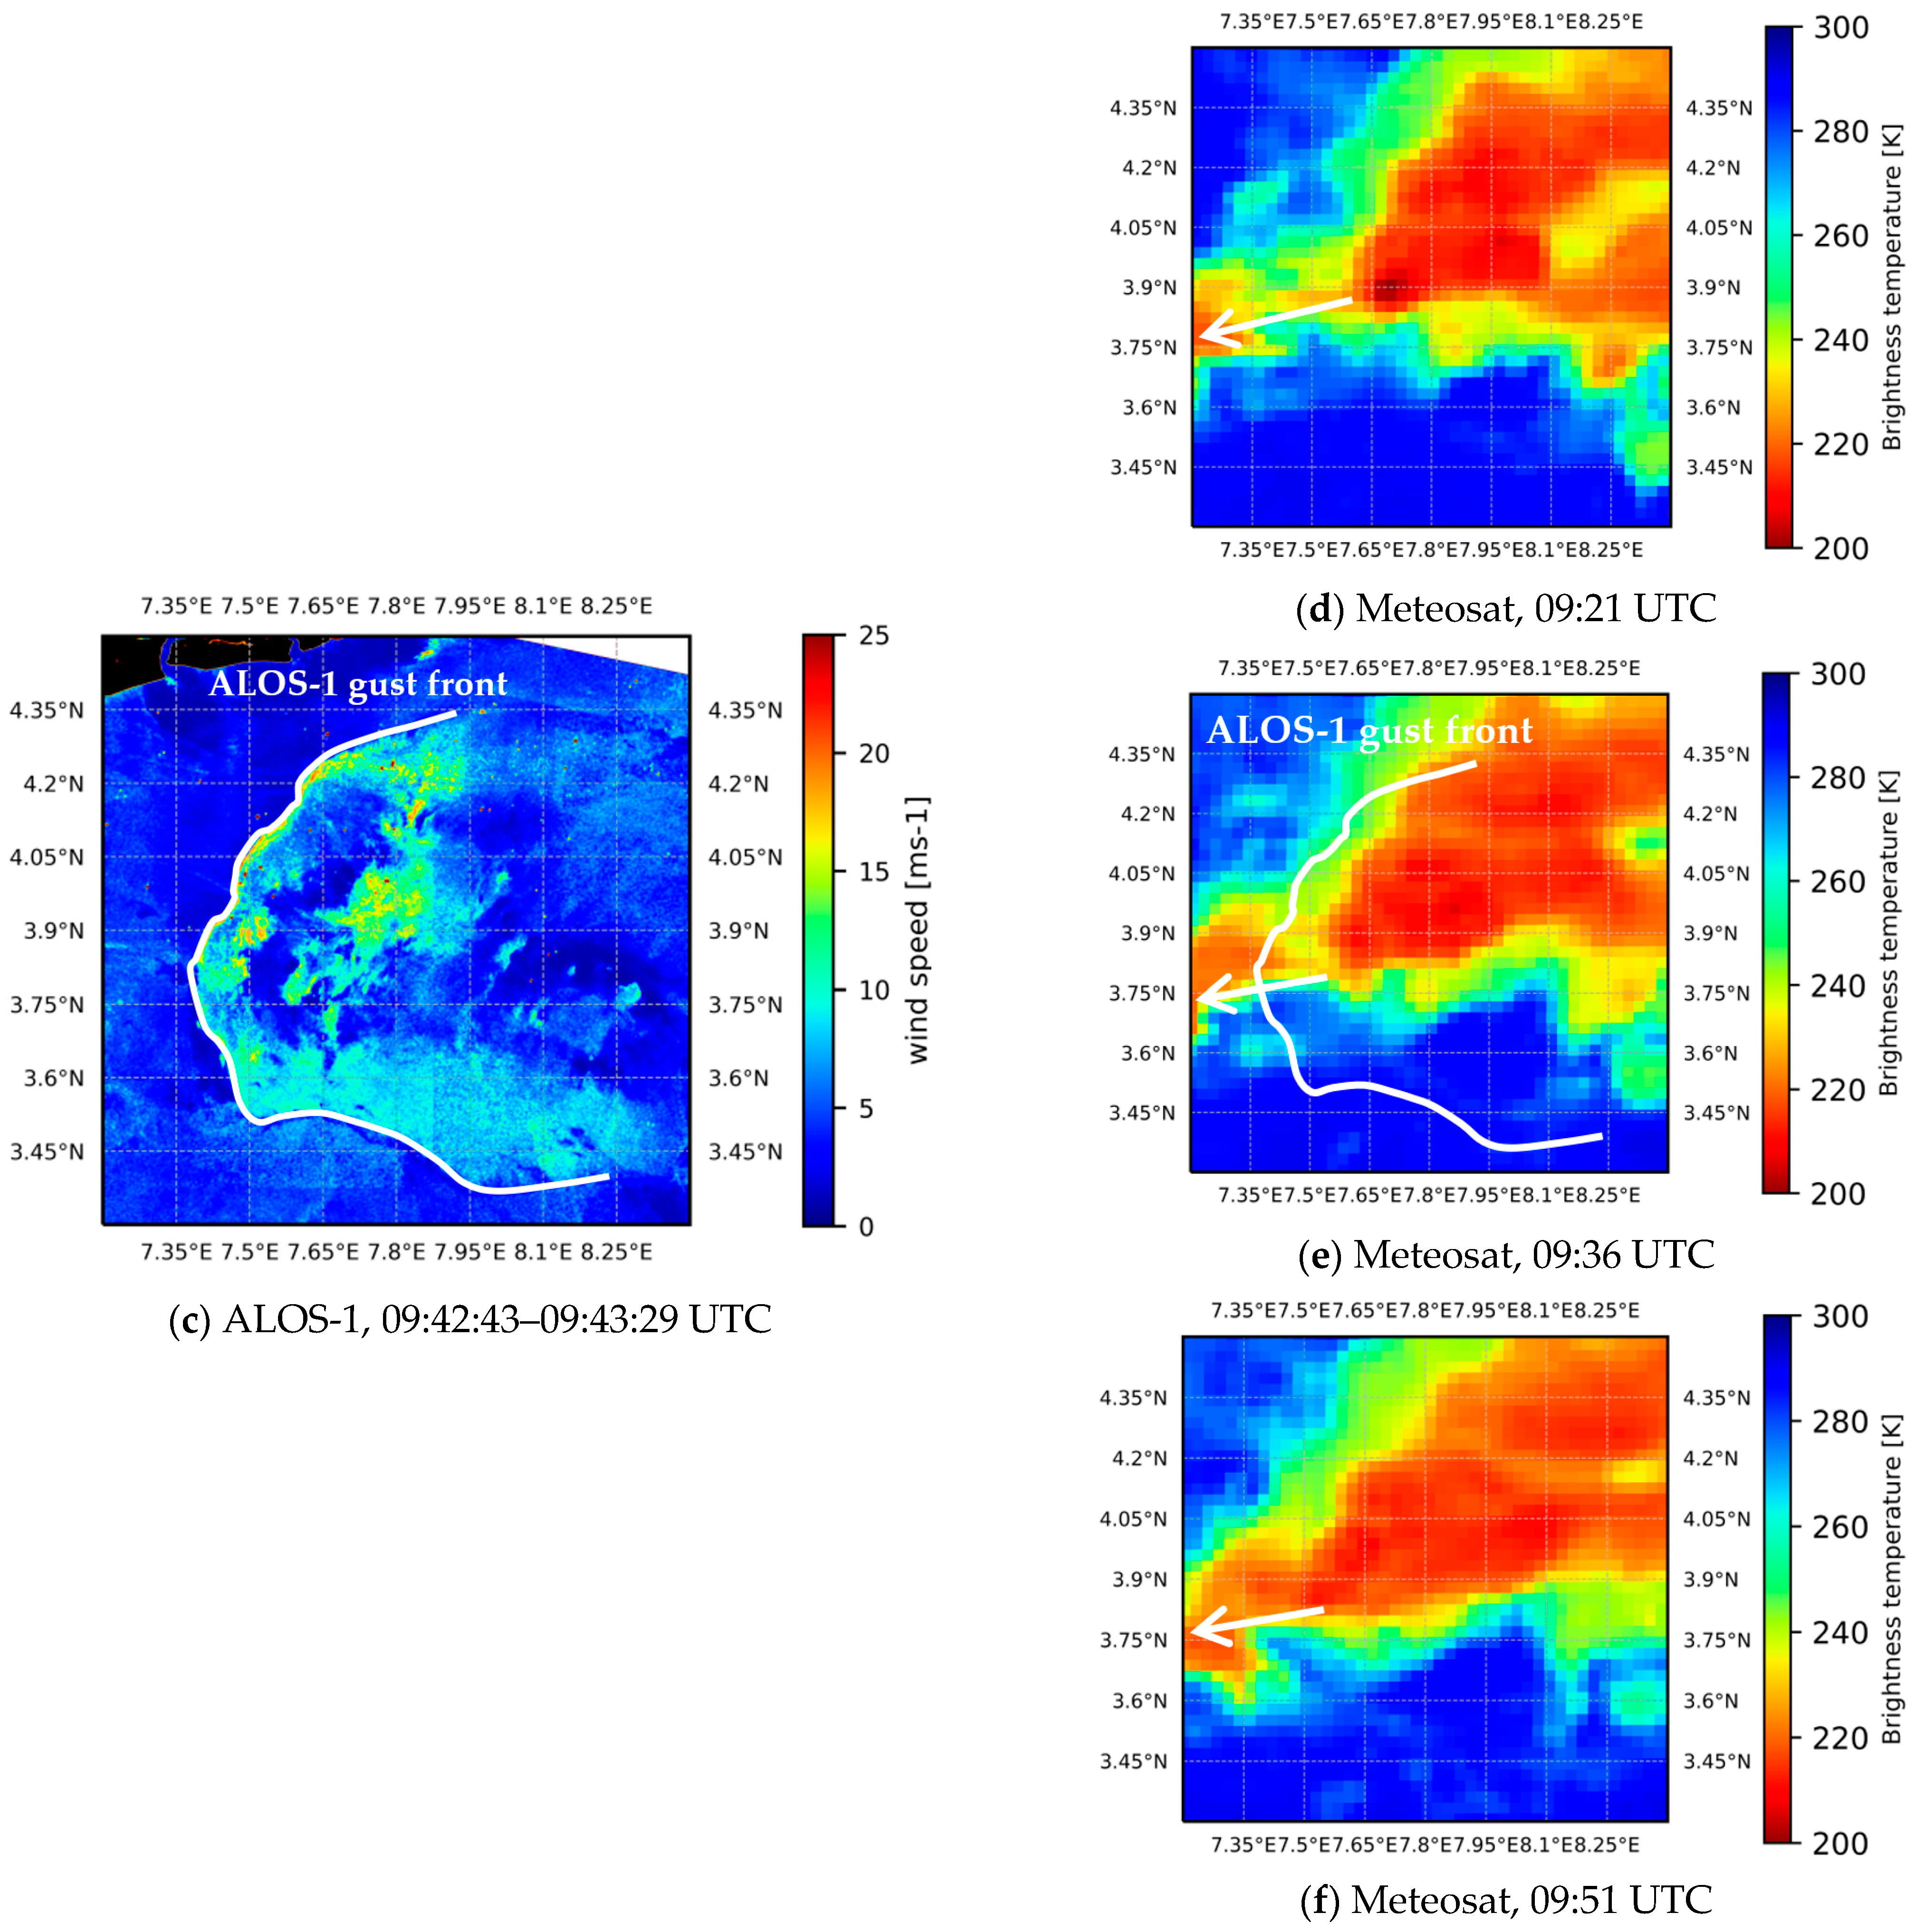
A sub-mesoscale surface wind pattern (12–17 m/s) is observed on the ALOS-1 image (Figure 3) over the Gulf of Guinea, 7 January 2008, at around 09:42:43–09:43:29 UTC. This wind pattern (Figure 3c) with a size smaller than 1° latitude (or longitude) is classified as a sub-mesoscale one. As well as Figure 2b, we can determine the gust front between wind gusts (10–20 m/s) and synoptic winds (5–6 m/s). We note that it tends to move westwards.
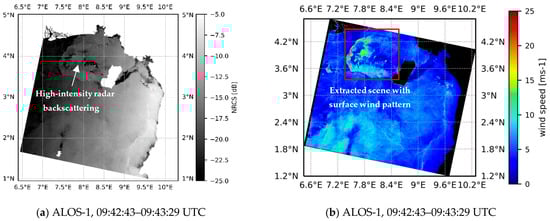

Figure 3.
Sub-mesoscale surface wind pattern observed on ALOS-1 image (ScanSAR mode), 7 January 2008, over the Gulf of Guinea, corresponding to the deep convective clouds observed by Meteosat. (a) NRCS of ALOS-1 image showing the high-intensity radar backscattering associated with deep convection. (b) Surface wind speed estimated from ALOS-1 image, 09:42:43–09:43:29 UTC. (c) Extracted sub-mesoscale wind pattern (12–17 m/s) from (b). (d–f) Deep convective cloud (220 K) observed by Meteosat at 09:21, 09:36, and 09:51 UTC, corresponding to the surface convective wind pattern in (c).
Figure 3d–f present deep convective clouds corresponding to the wind pattern on the ALOS-1 image. They are observed on Meteosat images at 09:21, 09:36, 09:51, and 10:06 UTC, respectively. When comparing Figure 3d–f, one notes that the deep convective cloud is moving westwards (as assumed for the wind pattern in Figure 3c), and its hot spots with 200 K change quickly, depending on the atmospheric conditions. Second, when comparing Figure 3c and Figure 3d–f (before and after the ALOS-1 observation time), one notes that the wind pattern and deep convective cloud are in agreement in terms of location (especially for gust front observed at 7.5°E), and especially matching between wind intensity and convective cloud brightness temperature. Wind speed, in this case, is less significant than that in Figure 2b (12–17 vs. 15–20 m/s), and likewise, the convective cloud brightness temperature in Figure 3d–f is higher (or less cold) than that in Figure 2c–e (220 K vs. 200 K).
3.3. Collocation of Sentinel-1 and SMAP Images for the Observation of the Displacement of Convective Winds
Based on the gust fronts observed in Figure 2b and Figure 3c, we assume that the surface wind patterns observed on Sentinel-1 and ALOS-1 images may move northwestwards and westwards. These assumptions are strengthened by the comparison with the motion of deep convective clouds. In practice, it needs two satellite images with a reasonable acquisition time lag to observe the displacement of surface wind patterns. Therefore, in this case, we collocate Sentinel-1 and SMAP images with a 34 min time lag (05:07:12–05:08:02 vs. 05:41:00 UTC) to identify surface wind pattern movement. The SMAP image is acquired about 34 min later than the Sentinel-1 one. The observation time of the Meteosat images (05:06:00–05:51:00 UTC) corresponds to that of the Sentinel-1 and SMAP ones.
Figure 4 illustrates a mesoscale surface wind pattern observed on Sentinel-1 and SMAP images offshore Gabon (Africa), 27 March 2017. They have the same size (spreading over 2.1° latitude), from 1.8°S to 3.9°S, on the Sentinel-1 image (Figure 4a) and from 2.1°S to 4.2°S on the SMAP image (Figure 4b). The Sentinel-1 wind speed varies from 15 to 25 m/s, while the SMAP wind intensity is in the range of 10–16 m/s. The difference between the two wind sources is due to the coarse spatial resolution of SMAP data (0.25° grid). Likewise, we cannot identify the wind hot spots (15–25 m/s) on the SMAP image. Additionally, the sensitivity of the SMAP data for surface wind speed retrieval below 25 m/s is not as good as for a higher wind speed [10]. We can identify the gust fronts on the two images based on the significant difference in the wind gradient. However, it is more obvious to observe the gust front on the Sentinel-1 image (Figure 4a) than the SMAP image (Figure 4b) thanks to the high spatial resolution of the former. When comparing Figure 4a and Figure 4b, one notes that the location of the wind pattern changes significantly, and it tends to move southwestwards. At around 05:07:12–05:08:02 UTC, the gust front is located at (3°S–3.9°S, 7.9°E–8.4°E) and moves to (3.0°S–4.2°S, 7.5°E–8.0°E) at 05:41 UTC. If one calculates approximately, the wind pattern moves about 0.4° longitude (or about 35–45 km) for about 34 min.
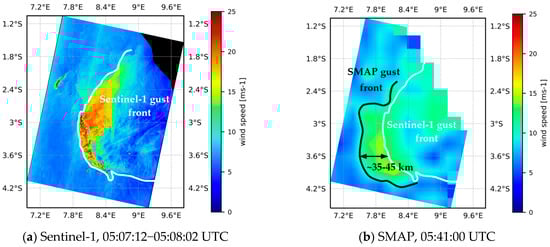
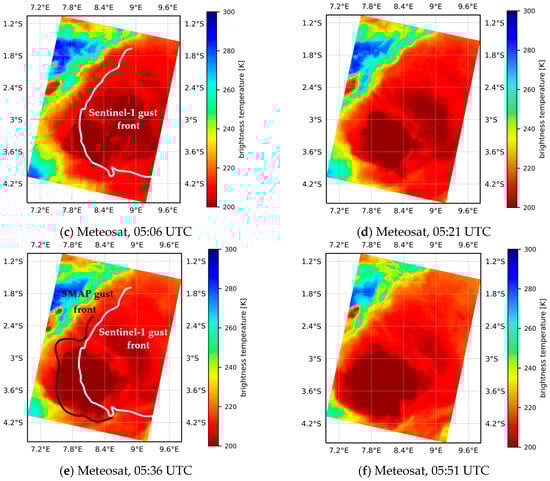
Figure 4.
A mesoscale surface wind pattern observed by Sentinel-1A IW (descending mode) and SMAP offshore Gabon (Africa), 27 March 2017. (a) Surface wind speed retrieved from Sentinel-1 image, 05:07:12–05:08:02 UTC. (b) Surface wind speed estimated by SMAP, 05:41:00 UTC. (c–f) Corresponding deep convective clouds (200–220 K) observed by Meteosat at 05:06, 05:21, 05:36, and 05:51 UTC, respectively.
Figure 4c–f present deep convective clouds observed on Meteosat images at 05:06, 05:21, 05:36, and 05:51 UTC, respectively. The mesoscale deep convective cloud spreads over more than 3° latitude (1.5°S–4.5°S). Its coldest core (about or less than 200 K) is expanding from 0.9° lat. (2.9°S–3.8°S) at 05:06 UTC to 1.5° lat. (2.7°S–4.2°S) at 05:51 UTC. Likewise, this convective cloud moves southwestwards in the same direction as the wind patterns observed on Sentinel-1 and SMAP images (Figure 4a,b). When comparing Figure 4a and Figure 4c, one notes that the gust front of the wind pattern matches the coldest pattern of the deep convective clouds. We obtain the same result when comparing Figure 4b and Figure 4f. In addition, between Meteosat images at 05:06 (Figure 4c) and 05:36 UTC (Figure 4e), the coldest pattern moves southwestwards by about 0.4° longitude. In other words, its displacement velocity seems to be the same as the wind pattern.
3.4. Multi-View of CS Dynamics
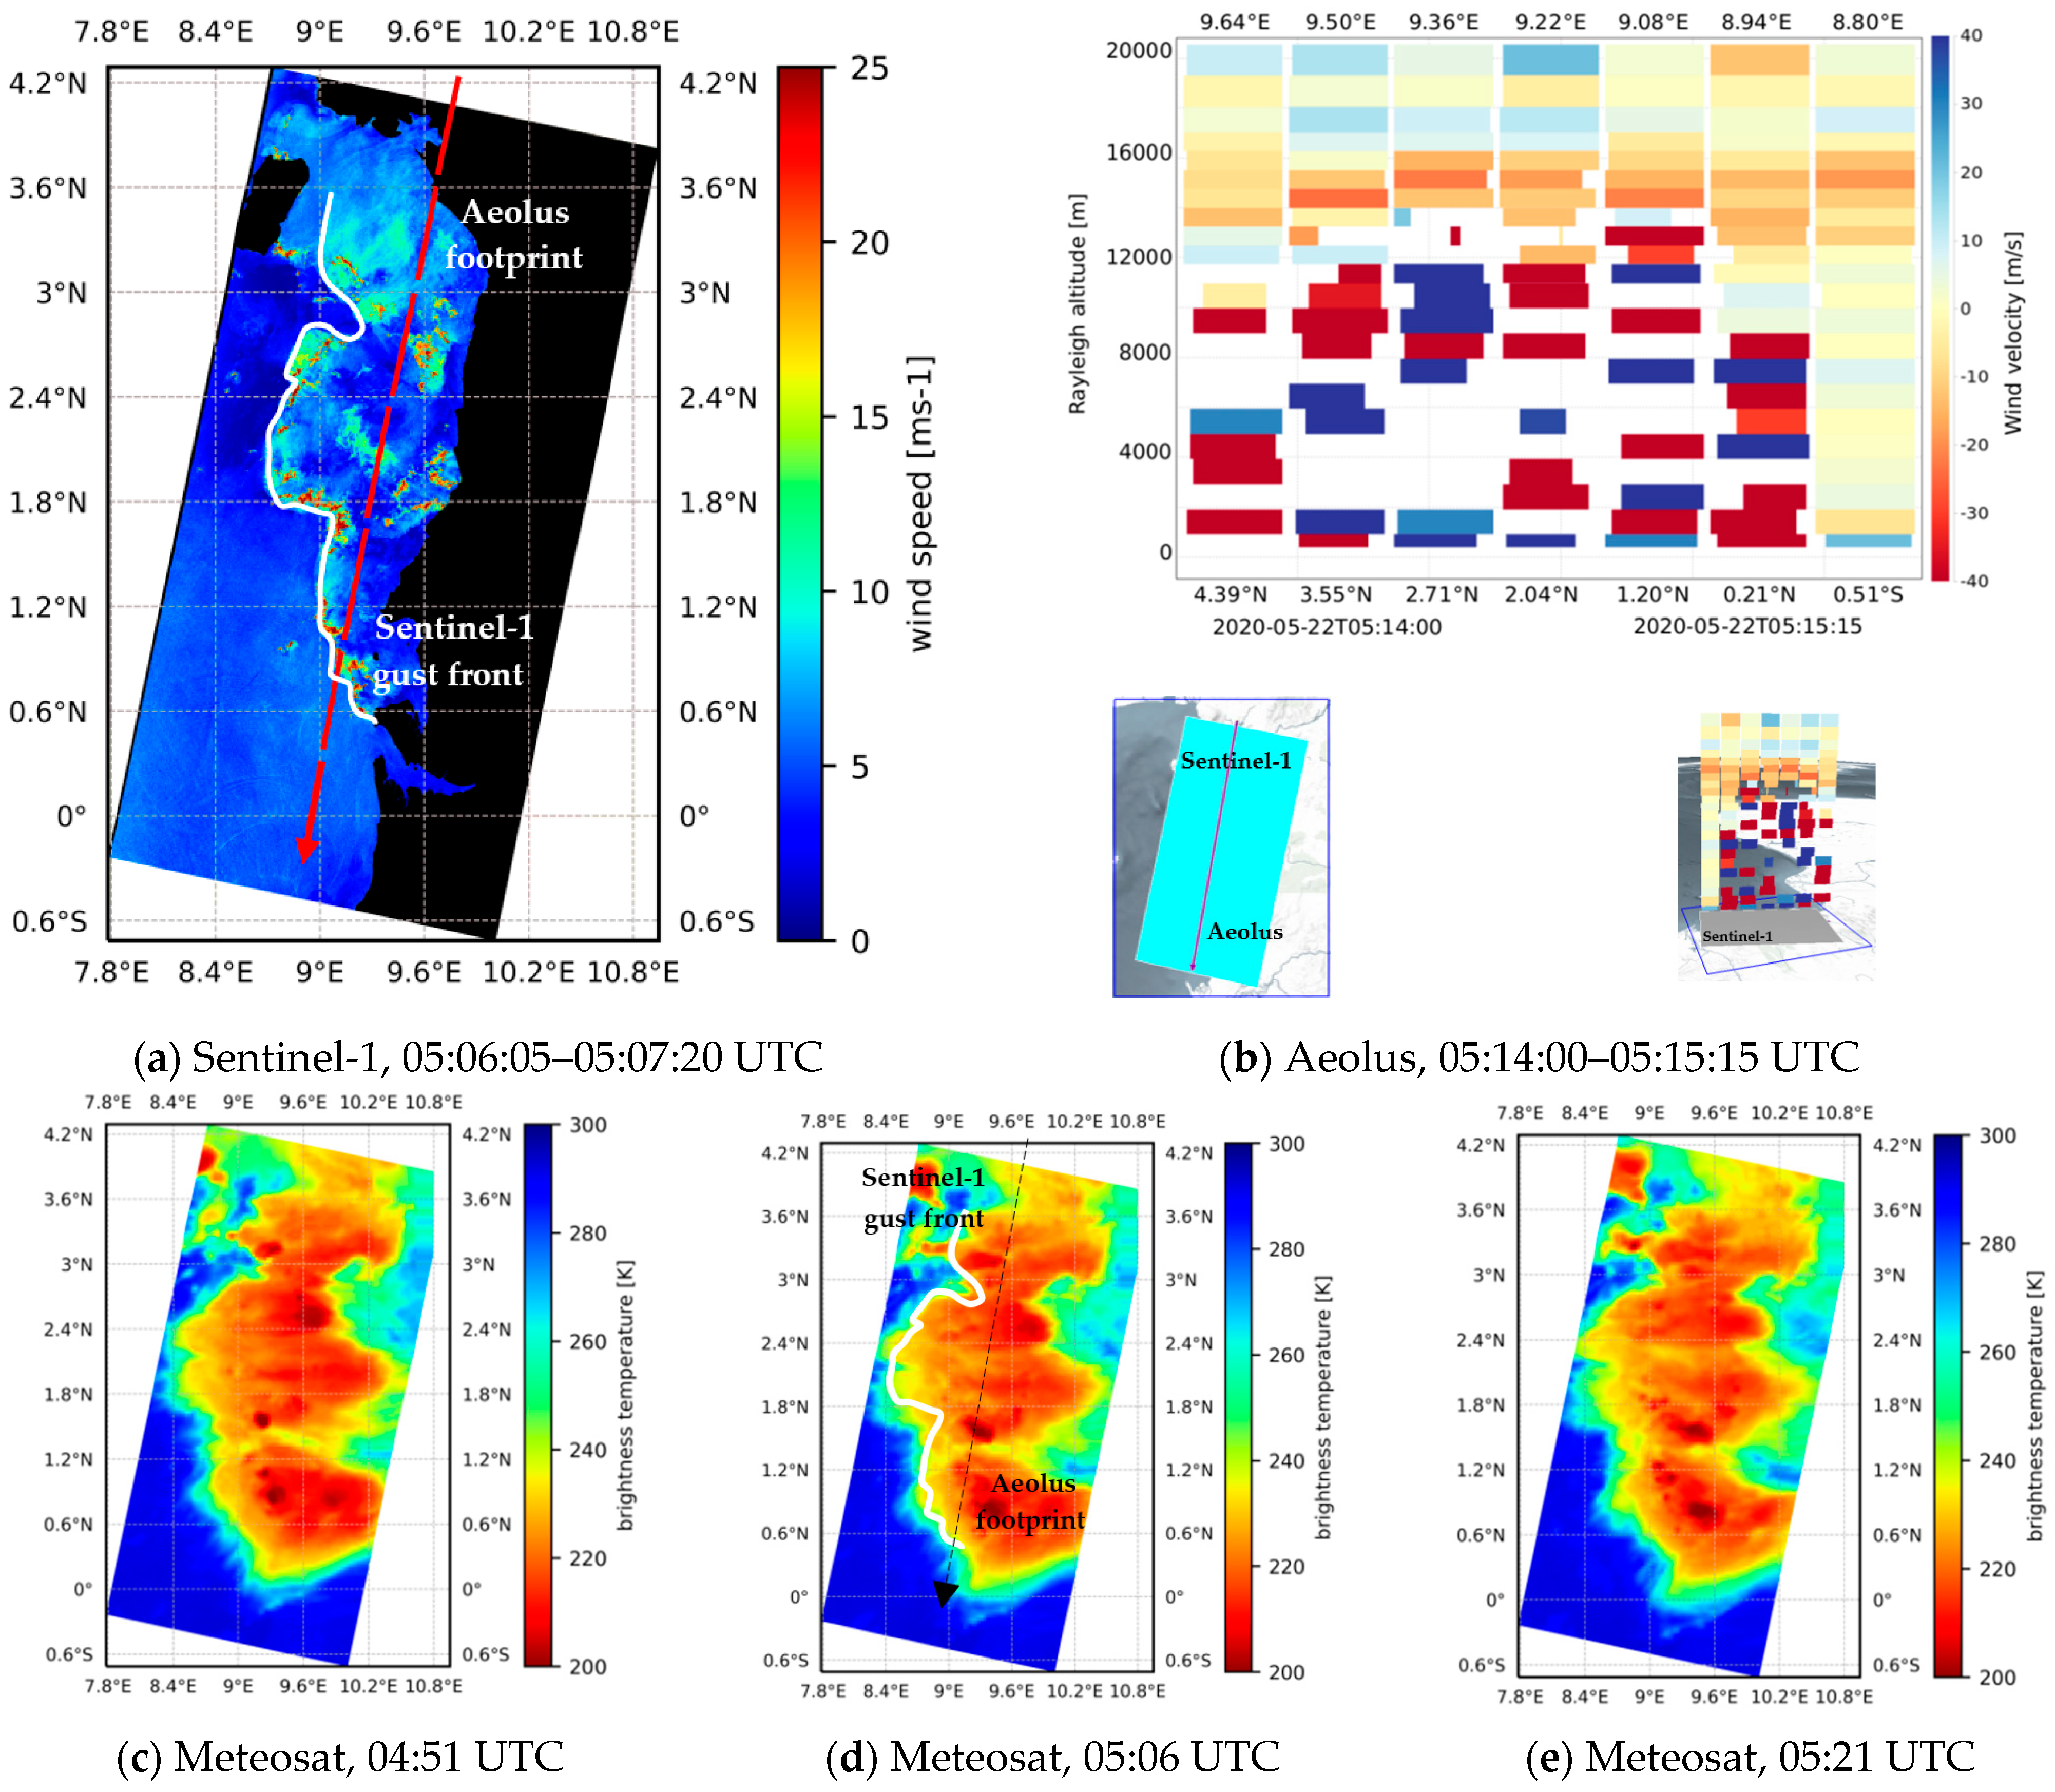
This section presents the multi-view of a CS by the collocation of LEO and GEO satellite data, including Sentinel-1 (05:06:05–05:07:20 UTC), Aeolus (05:14:00–05:15:15 UTC), and Meteosat (04:51:00–05:36:00 UTC), as shown in Figure 1 of [4]. The time lag is relatively small (not over 7 min) and should not produce a significant error in observing the matching between the events observed by Sentinel-1, Aeolus, and Meteosat.
Figure 5 illustrates the multi-view of a mesoscale CS over the Gulf of Guinea and offshore Gabon, 22 May 2020. Figure 5a presents the mesoscale surface wind pattern observed on the three Sentinel-1 images assembled (05:06:05–05:07:20 UTC) spreading on 3.6° latitude from 0.6°N to 4.2°N with 10–25 m/s wind speed. Based on the gust front in Figure 5a, we can note that it tends to move southwestwards.
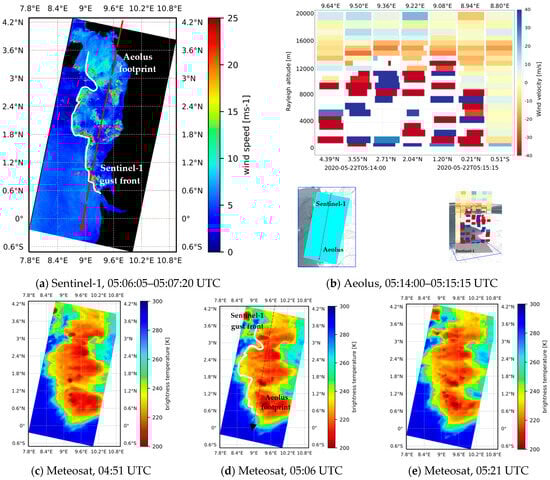
Figure 5.
A multi-view of a mesoscale CS over the region spreading from the Gulf of Guinea to offshore Gabon, 22 May 2020. (a) Mesoscale surface wind pattern (10–25 m/s) on the three Sentinel-1A IW (descending mode) assembled images, 05:06:05–05:07:20 UTC. (b) Vertical cross-section wind magnitudes measured by Aeolus Lidar (05:14:00–05:15:15 UTC) corresponding to the Sentinel-1 image (missing Aeolus data due to dense water clouds). (c–e) Corresponding deep convective clouds (200–220 K) observed by Meteosat at 04:51, 05:06, and 05:21 UTC, respectively.
Figure 5b presents the vertical cross-section wind magnitudes measured by Aeolus Lidar (05:14:00–05:15:15 UTC). The Aeolus horizontal track goes across the Sentinel-1 footprint in sub-Figure 5b. The matching (in location) between the two images facilitates a comparison between the surface wind pattern on the Sentinel-1 image and vertical wind profiles observed by Aeolus. When comparing the Aeolus wind parcels (Figure 5b) and Sentinel-1 wind pattern (Figure 5a), one can note that the high surface wind speed area with 10–25 m/s (4.0°N, 9.65°E–0.6°N, 9°E, according to the descending direction) matches the first six Aeolus parcels (from left to right). The non-convective surface wind speed below 7 m/s (0.3°N, 8.9°E–0.4°N, 8.8°E) corresponds to the last (seventh) parcel not associated with deep convection. For the convective parcels, especially the first, second, and sixth ones (9.64°E, 9.50°E, and 8.94°E, respectively), one can observe some intense dynamics (dark red) at the last layer near the sea. One can assume that these intense dynamics may be associated with the surface wind patterns observed on Sentinel-1 images (Figure 5a). Also, high vertical wind magnitudes may exist at the other parcels just before or after the Aeolus data acquisition, and they may produce strong surface winds.
Figure 5c–e illustrate deep convective clouds observed on Meteosat images at 04:51, 05:06, and 05:21 UTC, respectively. When comparing Figure 5a (Sentinel-1, 05:06:05–05:07:20 UTC) with Figure 5d (Meteosat, 05:06 UTC), one notes that surface wind patterns and deep convective clouds are in agreement not only in terms of location but also in terms of shape. In particular, the Sentinel-1 wind hot spots (above 20 m/s) match the Meteosat coldest cloud patterns (about 200 K). For 30 min of observation (from 04:51–05:21 UTC), the change in the location of the deep convective clouds is relatively small, or in other words, they move very slowly. Therefore, it is not feasible to determine the displacement direction of these convective clouds.
The collocation of Figure 5a,b,d illustrates an agreement in terms of the location and observation time of the three events observed by Sentinel-1, Aeolus, and Meteosat. This brings an overview of a mesoscale CS and its dynamics: the deep convective clouds formed within the tropopause may produce, at the mature stage, intense dynamics at the sea surface, with gusts of up to 25 m/s.
4. Comparison of Convective Wind Gust Estimation and Measurement
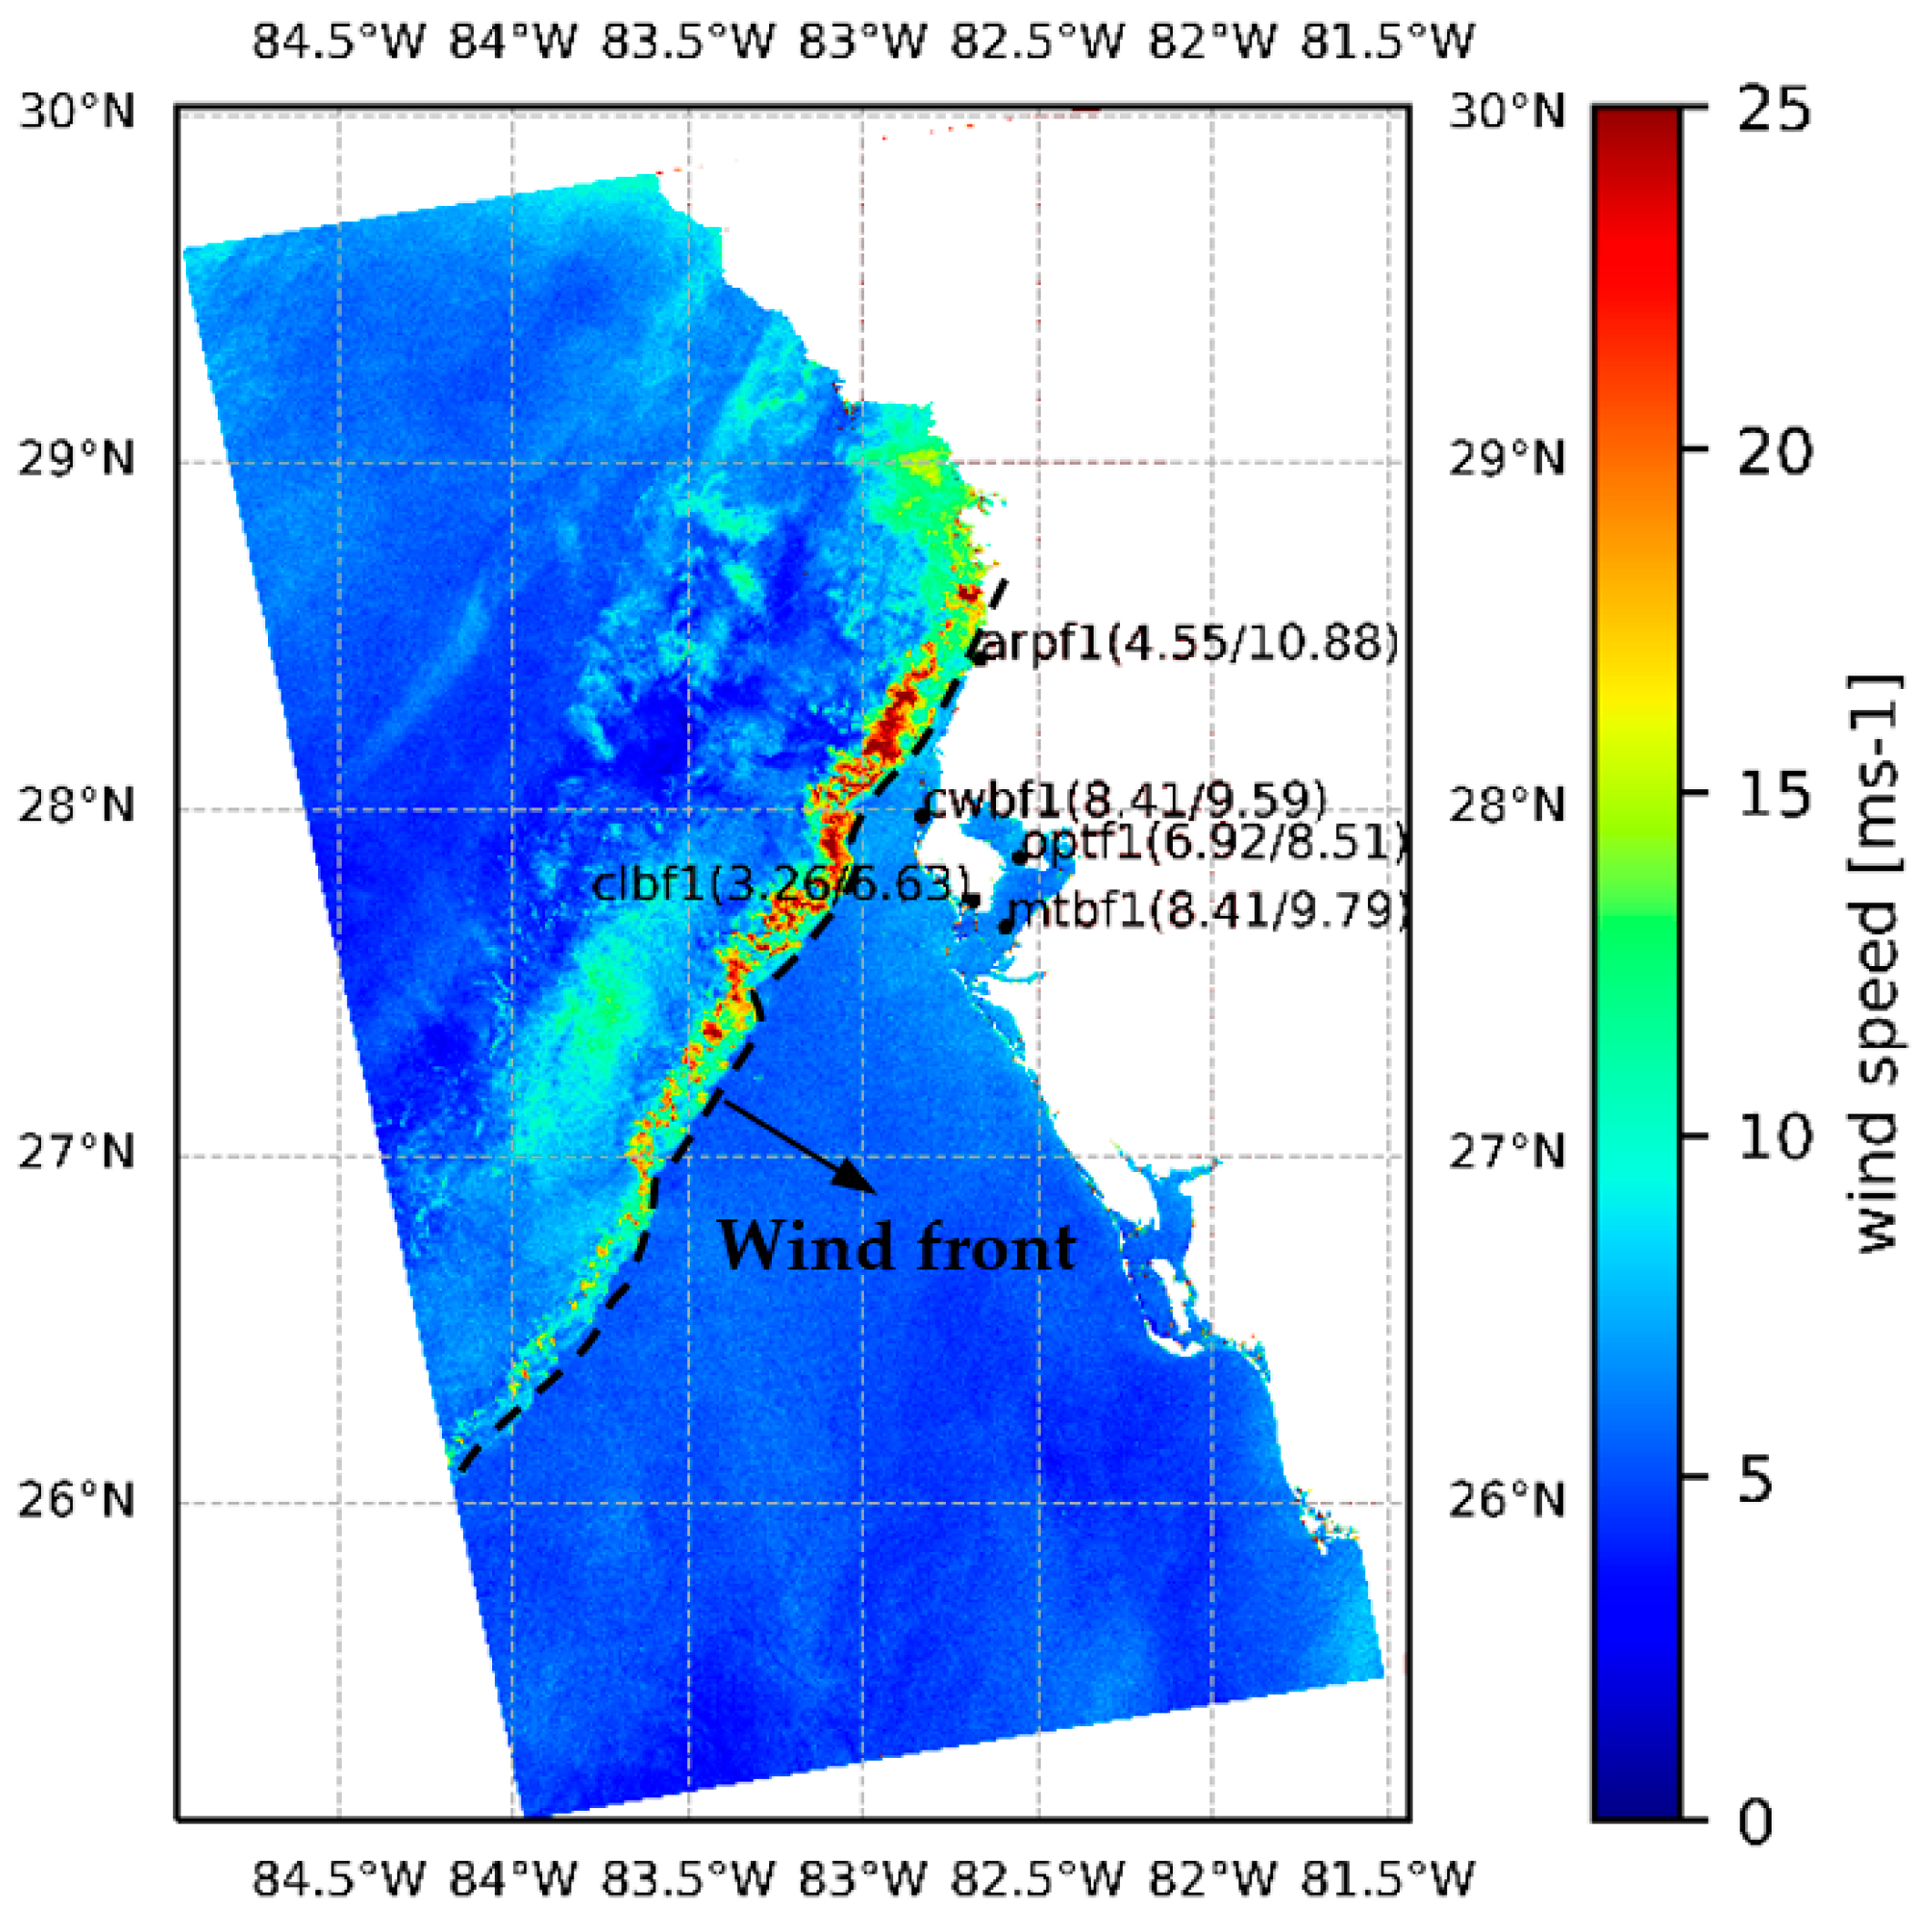
Figure 6 presents a surface wind pattern extended at the mesoscale in the shape of a squall line observed on the merged Sentinel-1 images, 14 April 2019, 23:36:14–23:37:29 UTC. This squall line spreads zonally over more than 3° from 26°N to 29°N with a wind intensity of 10–25 m/s. The squall wind front (as marked by the arrow) moves southeastwards. Over the region imaged by Sentinel-1 in Figure 6 (west coast of Florida), five weather stations are selected: #ARPF1, #CWBF1, #OPTF1, #CLBF1, and #MTBF1. Note that the NOAA moored buoy #42098 in this region does not deliver wind measurements.
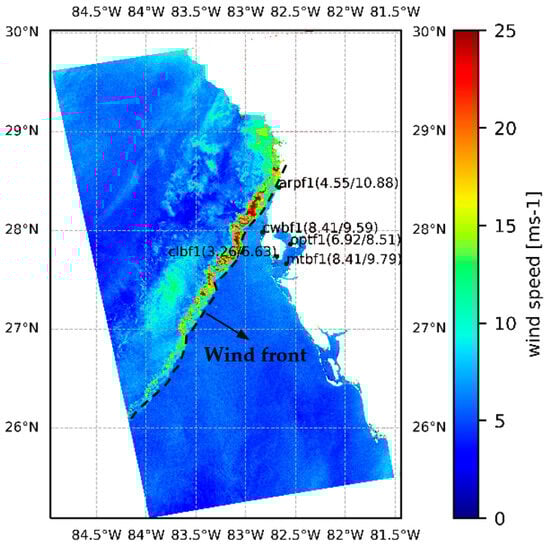
Figure 6.
Mesoscale surface wind pattern in the shape of a squall line observed on the merged Sentinel-1 images, 14 April 2019, 23:36:14–23:37:29 UTC, coupled with the weather stations installed on the west coast of Florida (USA).
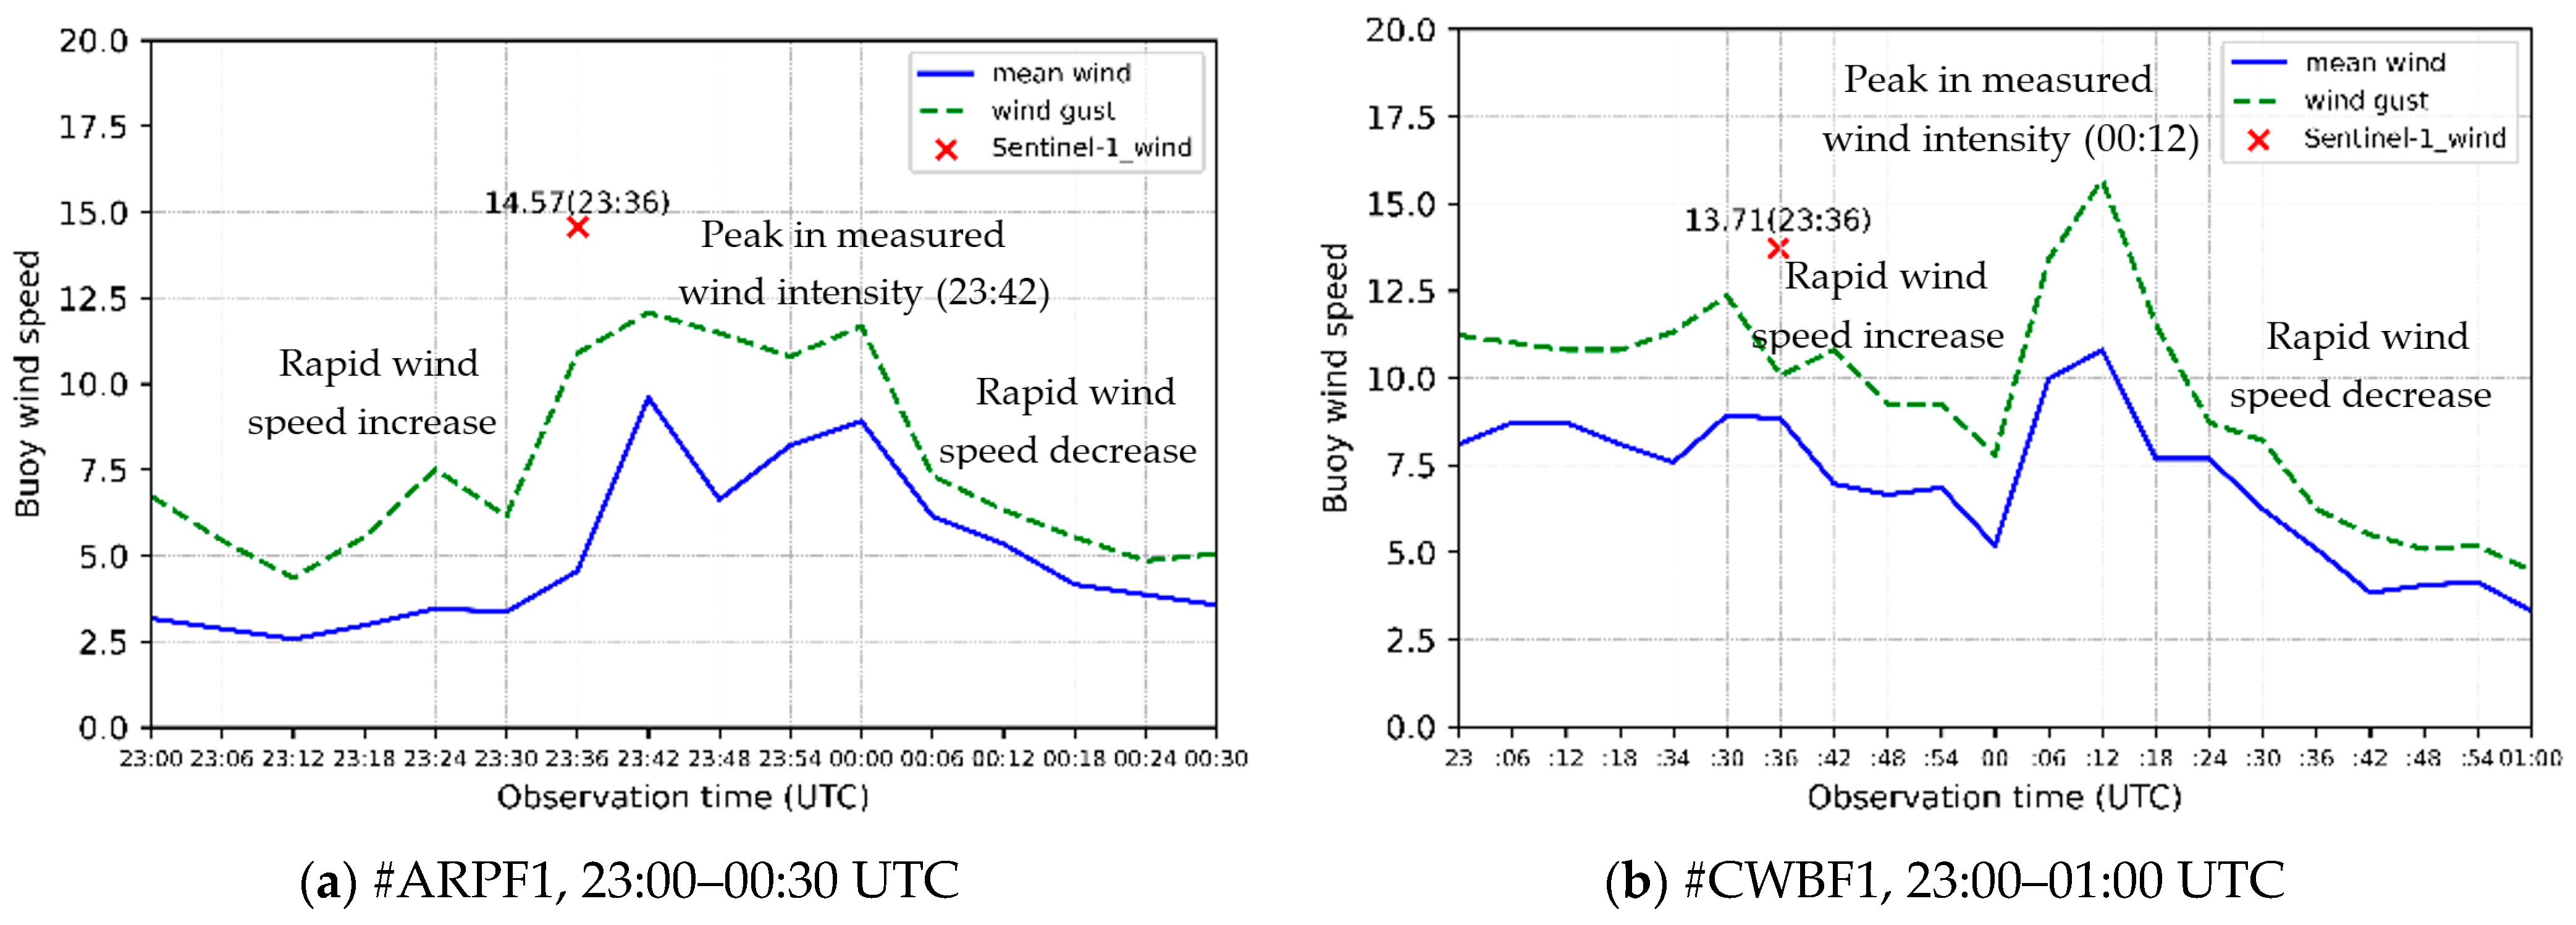
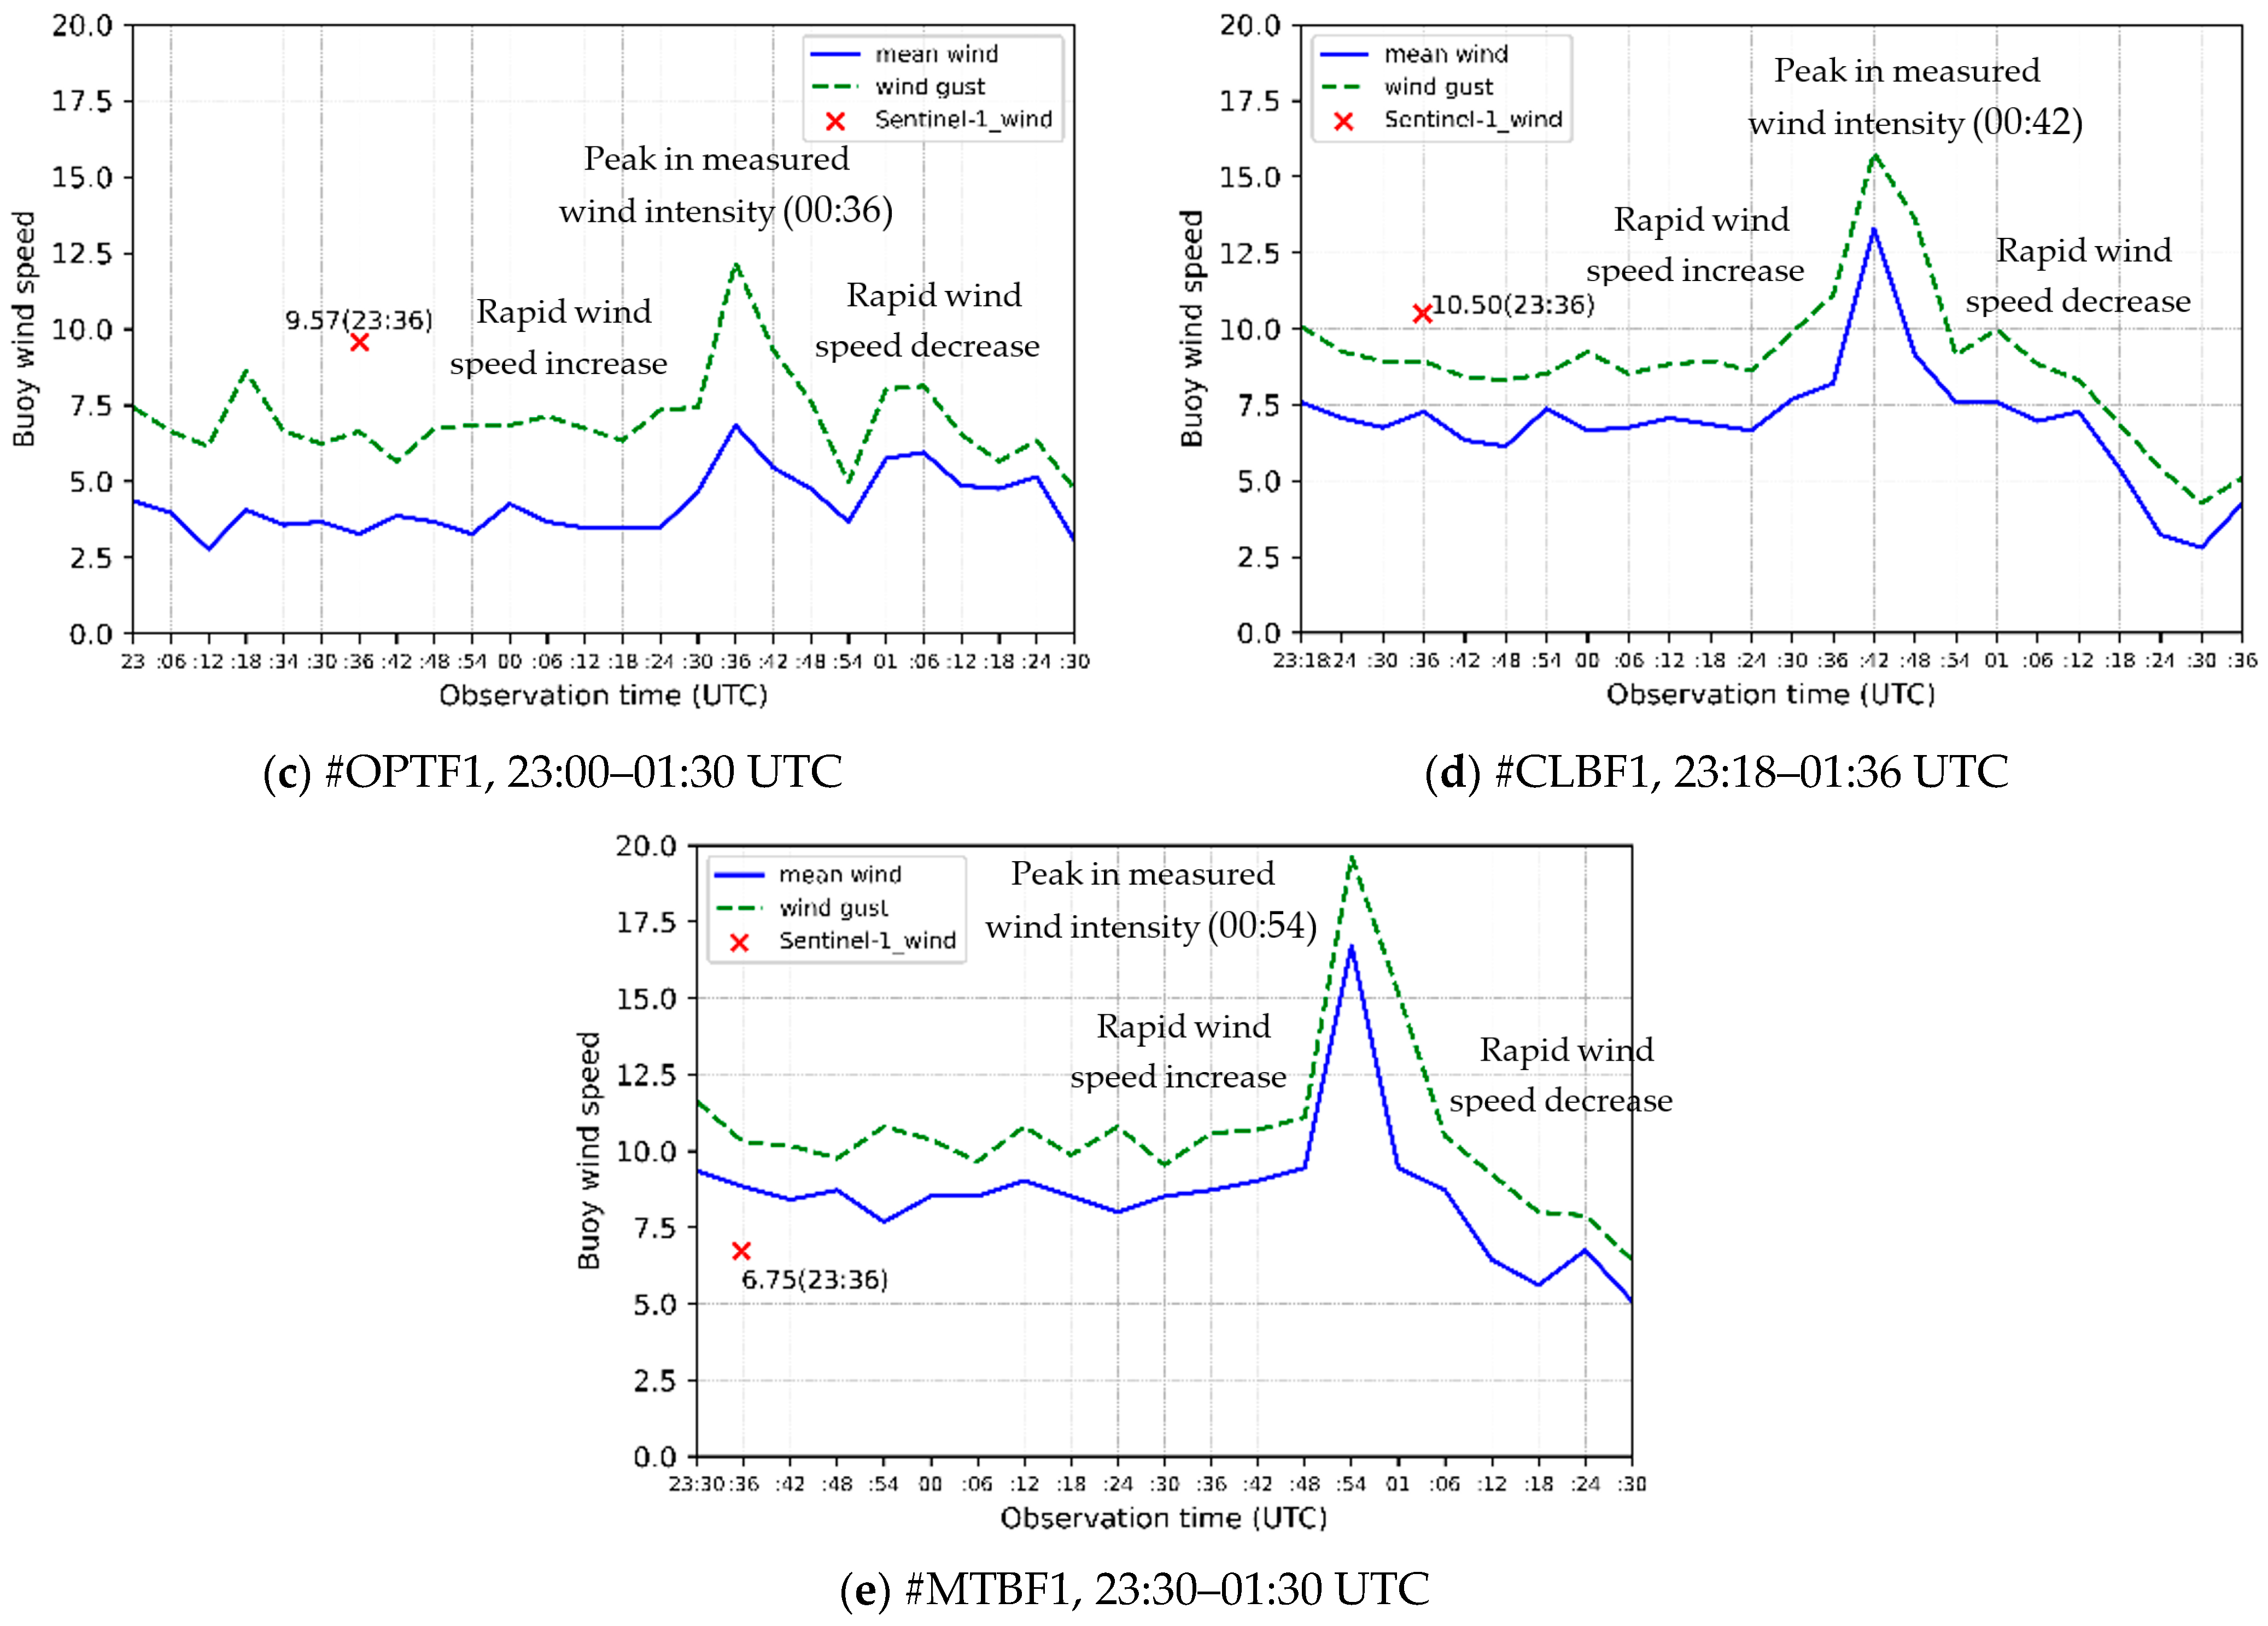
Figure 7 presents the wind speed measured by the five weather stations and the corresponding wind intensity retrieved from the Sentinel-1 data. We can observe the peaks in wind speed measured at 23:42 (#ARPF1), 00:12 (#CWBF1), 00:36 (#OPTF1), 00:42 (#CLBF1), and 00:54 UTC (#MTBF1). Before and after these peaks, the measured wind intensity increases and decreases very quickly, respectively. This wind speed time-series variability corresponds to convective wind gusts [33]. Indeed, the measured peaks in wind intensity match the mesoscale squall line observed on the Sentinel-1 image, 23:36:14–23:37:29 UTC (Figure 6). This squall line tends to move southeastwards. It reaches the first station #ARPF1, then #CWBF1, #OPTF1, #CLBF1, and finally #MTBF1. This observation explains the delayed occurrence between the peaks observed by the five stations. The peaks in Figure 7 have a wind intensity of 12.5–20 m/s, corresponding to a mesoscale squall line (10–25 m/s).
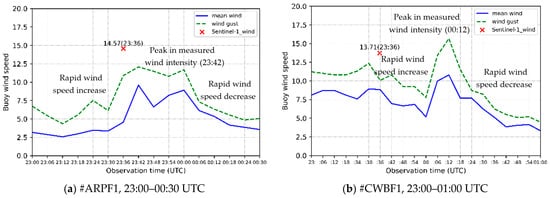
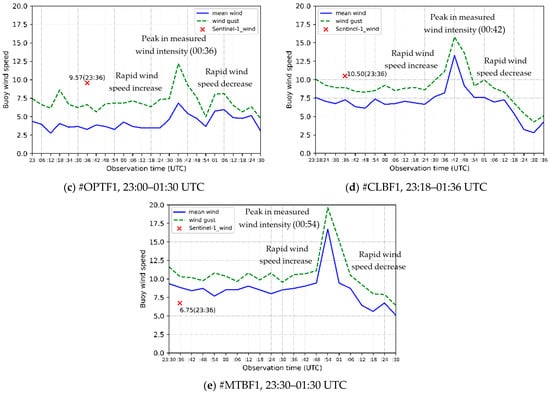
Figure 7.
In situ wind speed measured by the weather stations along the west coast of Florida (#ARPF1, #CWBF1, #OPTF1, #CLBF1, and #MTBF1), 14 April 2019. (a) #ARPF1, 23:00–00:30 UTC. (b) #CWBF1, 23:00–01:00 UTC. (c) #OPTF1, 23:00–01:30 UTC. (d) #CLBF1, 23:18–01:36 UTC. (e) #MTBF1, 23:30–01:30 UTC.
Several assumptions can be made to account for the difference between wind speeds derived from Sentinel-1 imagery and those collected by weather stations (approximately 2–3 m/s). Firstly, the accuracy of the surface wind speeds obtained from Sentinel-1 images using CMOD5.N may be compromised near coastal regions, as CMOD5.N was developed and validated primarily using in situ measurements from buoys deployed in open seas. Secondly, discrepancies may arise due to the methods employed to convert wind speeds from the z-m height to the 10 m reference height, as atmospheric conditions differ between land and sea surfaces. Lastly, the presence of obstacles on land surfaces may result in lower wind speeds compared to the open sea, where friction is reduced. Therefore, to facilitate a more accurate comparison between the two sources of wind data, future efforts will involve assessing surface wind speeds estimated from Sentinel-1 data against in situ measurements collected by buoys deployed in open seas, such as the Gulf of Mexico.
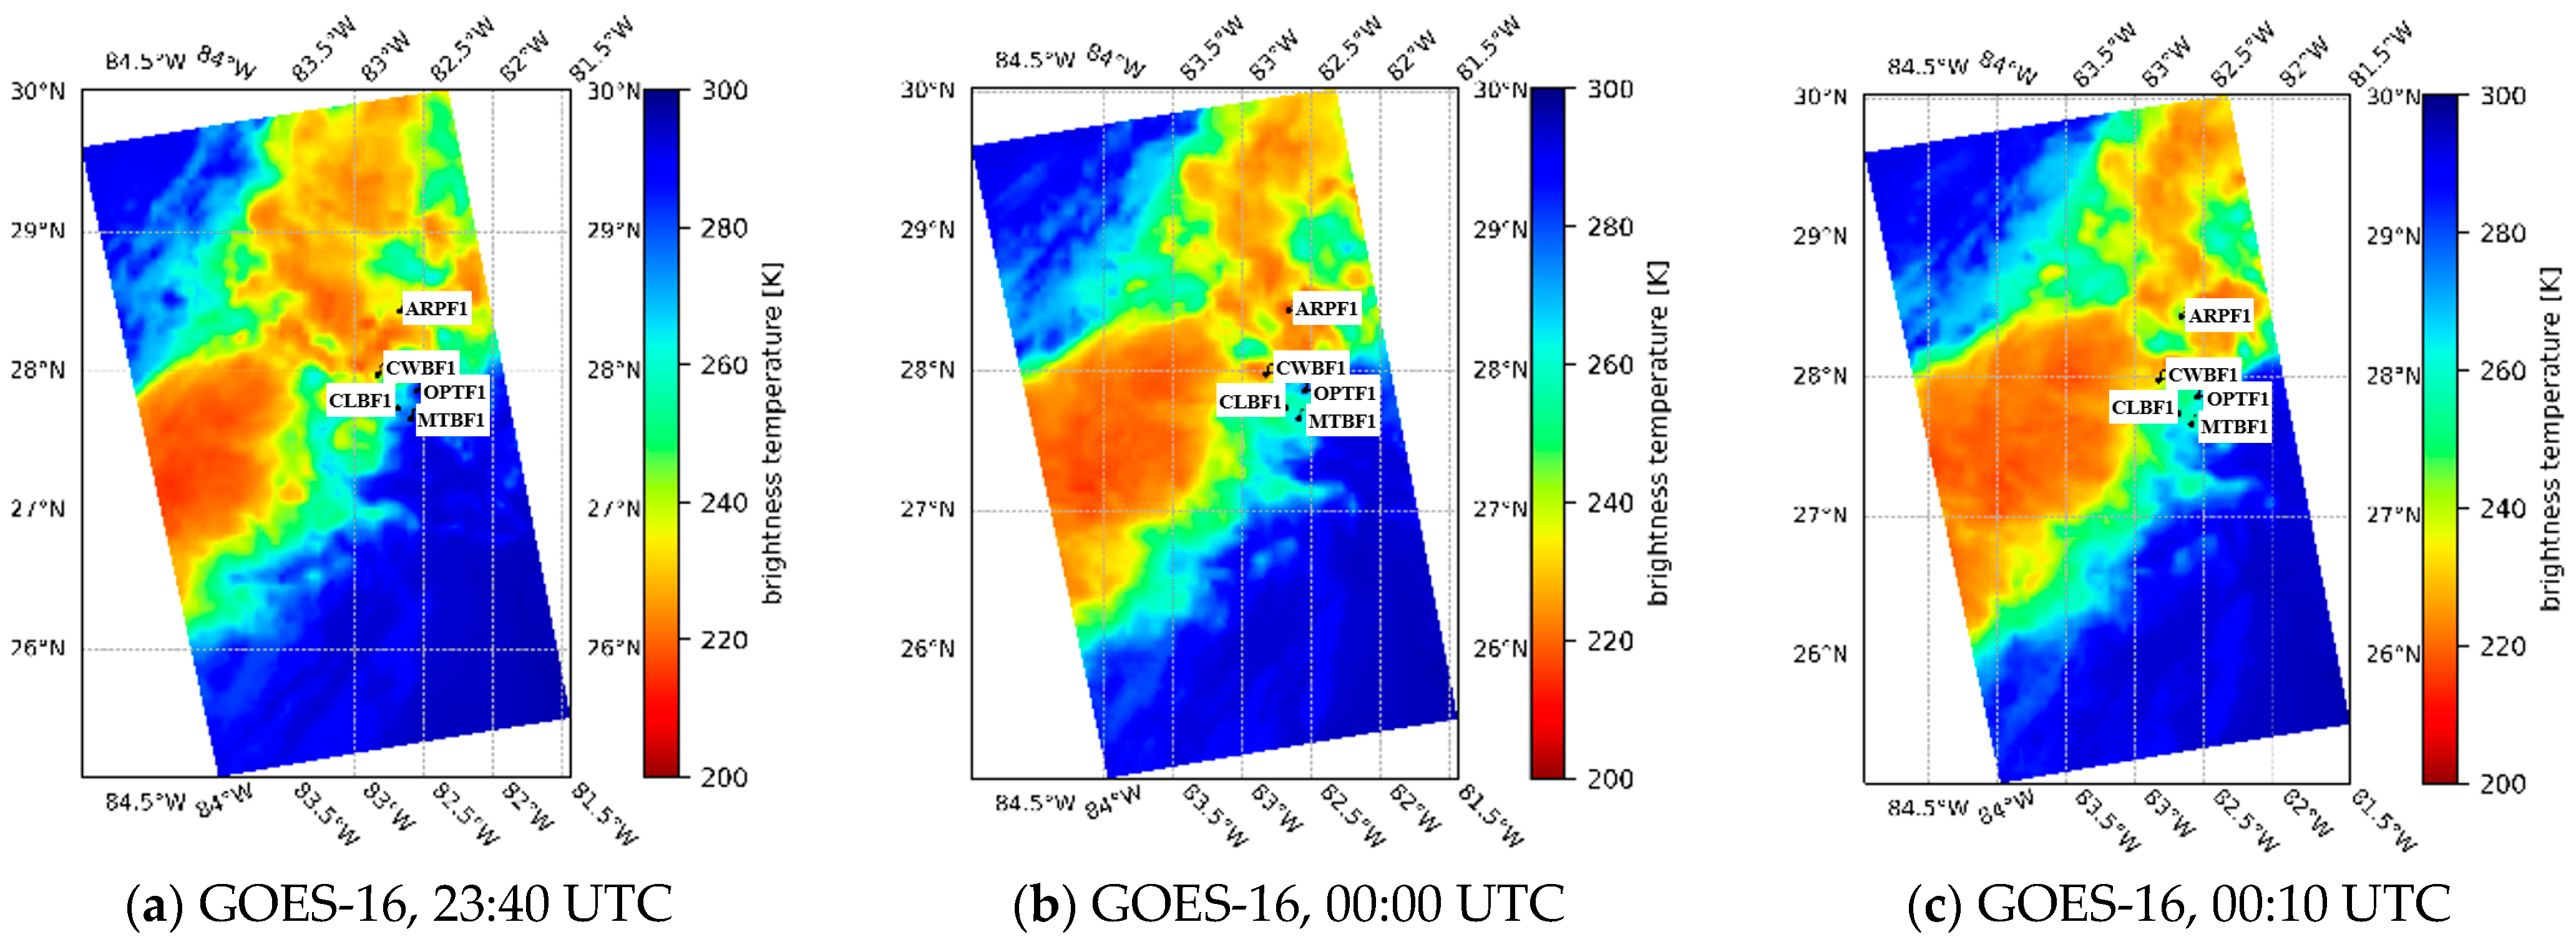
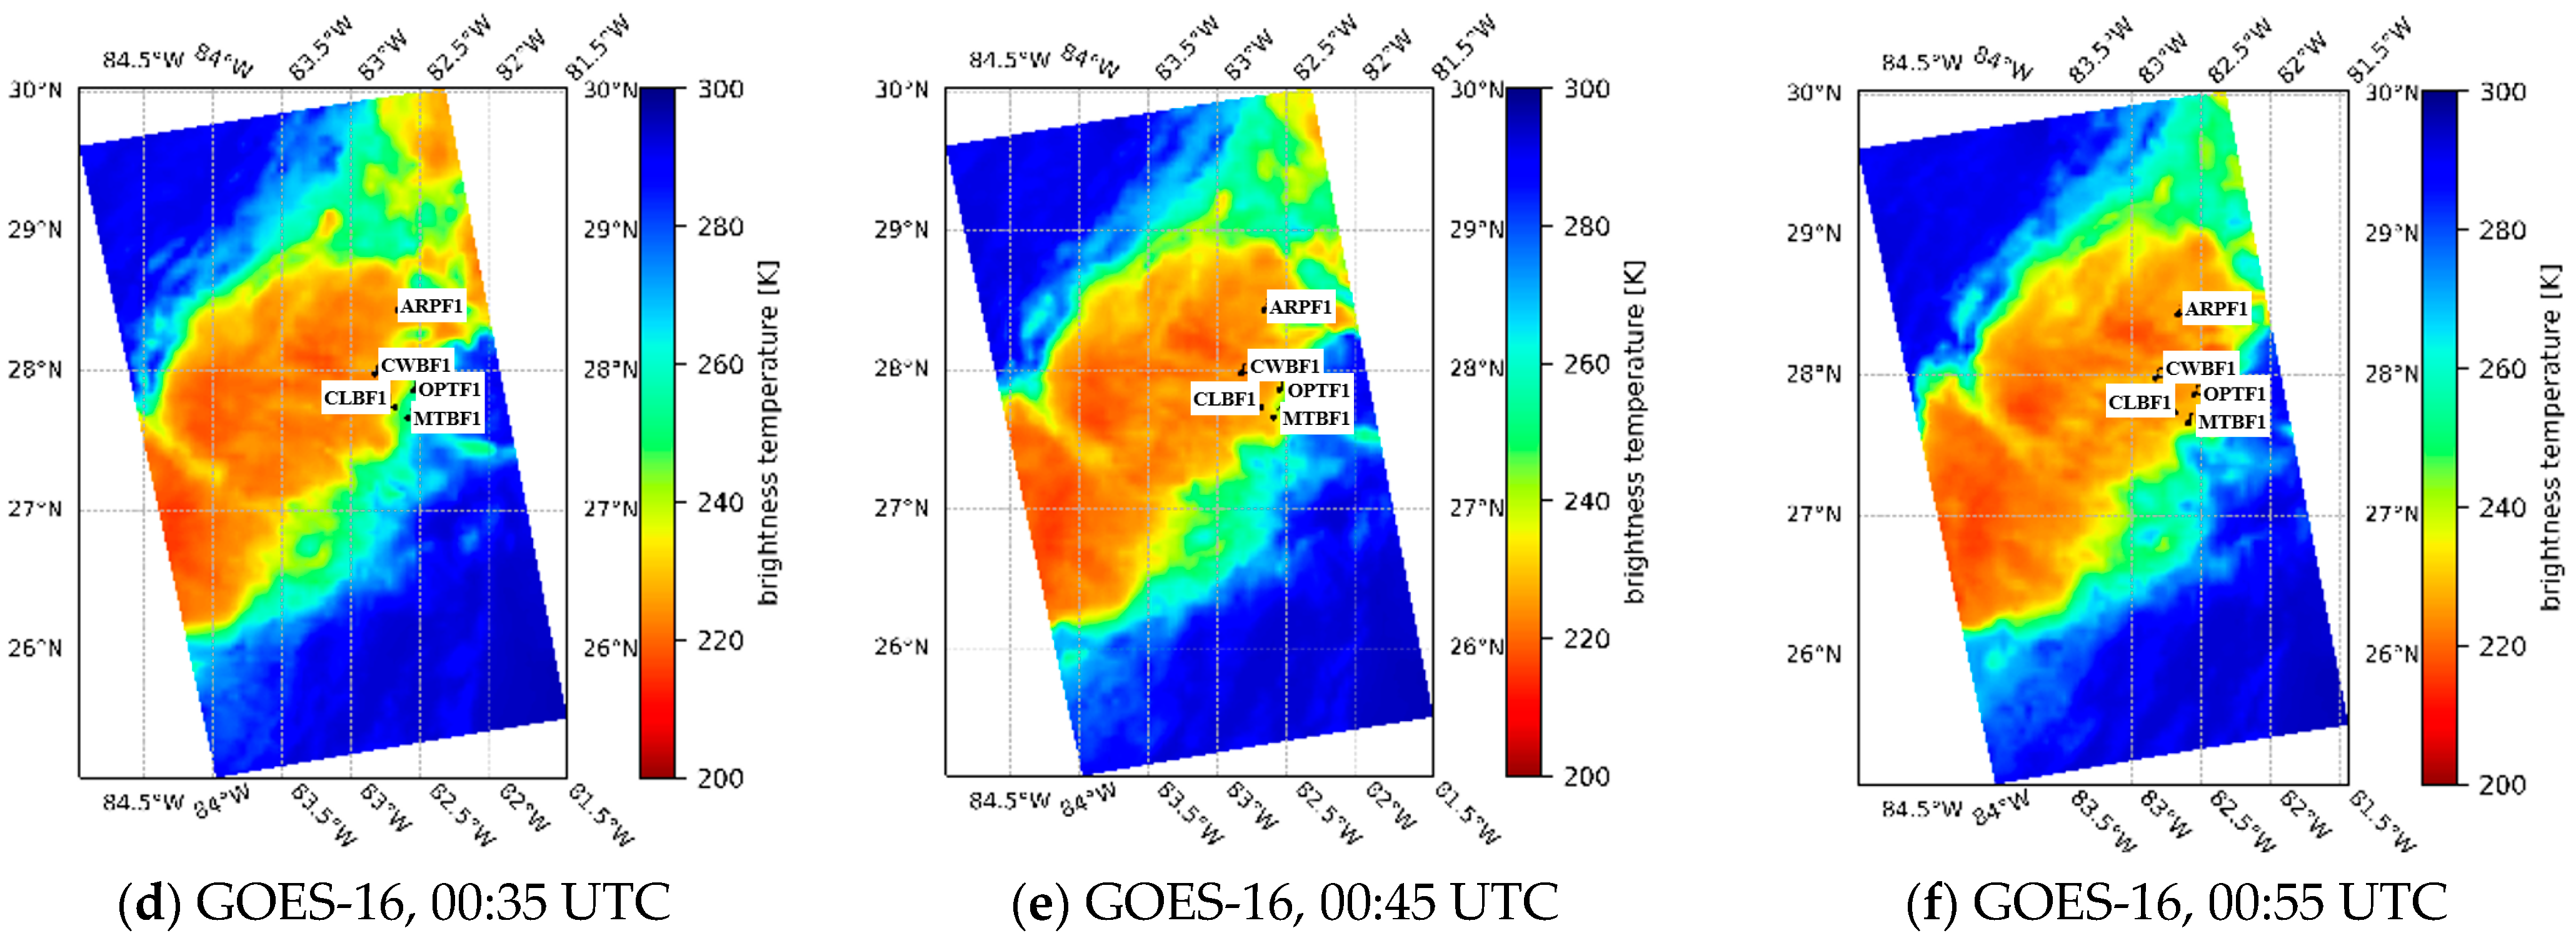
Figure 8 presents deep convective clouds (210–220 K) observed on the GOES-16 images collocated with Sentinel-1 images and five weather stations. The observation time of these GOES-16 images nearly corresponds to the occurrence of the peaks in wind speed. The deep convective cloud observed at 23:40 UTC (Figure 8a) corresponds to the surface wind pattern observed on the Sentinel-1 image (Figure 6). In particular, the peak in wind intensity measured by station #ARPF1 (23:42) corresponds to the deep convective cloud (210–220 K) observed at 23:40 UTC (Figure 8a). Likewise, the peaks measured by stations #CWBF1, #OPTF1, #CLBF1, and #MTBF1 at 00:12, 00:36, 00:42, and 00:54 UTC match the deep convective clouds observed on the GOES-16 images (Figure 8b–e), respectively. This result strengthens the relationship between deep convective clouds (low brightness temperature) and surface wind gusts, as indicated in [3,4,5,6].

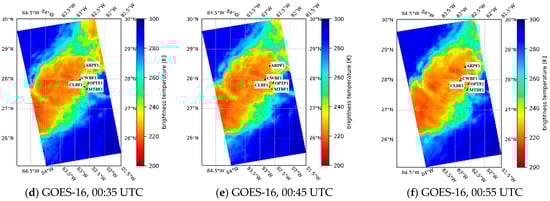
Figure 8.
Deep convective clouds (210–220 K) observed on GOES-16 images, 14–15 April 2019, corresponding to Sentinel-1 and weather stations (Figure 6). (a) GOES-16, 23:40 UTC. (b) GOES-16, 00:00 UTC. (c) GOES-16, 00:10 UTC. (d) GOES-16, 00:35 UTC. (e) GOES-16, 00:45 UTC. (f) GOES-16, 00:55 UTC.
5. Discussion
Previous studies [13,14,15] indicated the existence of surface wind gusts associated with deep convection over Lake Victoria through numerical model simulations and observations by coastal radars. Inspired by these results and [3,4,5,6], we presented the convective wind gusts estimated from Sentinel-1 images over Lake Victoria, especially from the images acquired with descending direction mode (around 03:00 UTC corresponding to the peak in convection). The surface wind speed (12–20 m/s) associated with deep convection retrieved from the Sentinel-1 image (Figure 2) is very close to the one estimated by the Met Office 4 km numerical model [16] and through the radar radial velocity [2]. This result leads to a perspective that one can integrate Sentinel-1 (or SAR) data into numerical weather prediction (NWP) models (like the Met Office 4 km model) to improve the forecast of convective wind gusts at the sea surface. Additionally, the spatial resolution of the predicted wind speed, especially wind hot spots above 20 m/s, may be improved thanks to high-resolution SAR data.
Surface convective wind patterns can also be observed on L-band ALOS-1 images (Figure 3) since the L-band radar backscattering is little impacted by rainfall [9,10]. Meanwhile, the rainfall effects on C-band radar backscattering are small for winds above 7 m/s [9,11]. This strengthens the assumption that the high-intensity radar backscattering observed on the L-band and C-band SAR images is due to surface convective wind gusts rather than precipitation. Recently, La and Messager [6] published a study showing the relationship between surface wind patterns and precipitation under deep convection observed by the Windsat radiometer. It illustrated that surface wind gusts occur 5–30 min earlier than precipitation, depending on the scale of deep convection. Based on the collocation of the Sentinel-1 and Windsat images with the same acquisition time, the paper concluded that the high-intensity radar backscattering observed on the Sentinel-1 image is produced by convective wind gusts.
As indicated in [29], surface wind speed retrieval from L-band SAR data using LMOD2 may be less accurate than that from C-band SAR data using CMOD5.N, especially for low and moderate winds and large incidence angles. Likewise, LMOD2 was not studied for winds above 20 m/s due to the limited number of matchups. Therefore, C-band SAR data, especially Sentinel-1, should be one of the principal sources to observe and estimate surface convective wind gusts at a high spatial resolution.
Wind direction is one of the input parameters for CMOD5.N and LMOD2 to estimate surface wind speed from Sentinel-1 and ALOS-1 data, respectively. We used the ERA-5 reanalysis data [30,31] to obtain surface wind direction. Note that the impact of deep convection on surface wind fields was not considered for the ERA-5 data. To the best of the authors’ knowledge, no current numerical models have considered deep convection effects on surface wind estimation. Indeed, the impact of the convective dynamics on wind direction at the sea surface is very complex since it happens very quickly. In this paper, we assumed that the surface wind gusts associated with deep convection have the same direction as the synoptic winds. More studies about this topic will be carried out in the future.
In addition to Sentinel-1 and ALOS-1 images, we indicated that the L-band SMAP radiometer data can be used to estimate convective wind gusts, especially for large-scale ones (Figure 4). As well as ALOS-1 SAR, the SMAP-estimated wind speed should not be impacted by rainfall. The high surface wind speed (10–16 m/s) estimated from SMAP data (Figure 4b) is close to the expected convective winds. We collocated the SMAP and Sentinel-1 images to observe the surface displacement of a mesoscale wind pattern. The difference in wind speed estimates between the two wind sources may be due to the coarse spatial resolution of SMAP data (0.25° lat grid) or the observation time lag between two devices. Based on this collocation, we noted that the mesoscale surface wind pattern moved southwestwards in the same direction (and probably velocity) as the deep convective clouds observed on the Meteosat images.
To clarify the relationship between surface wind patterns and deep convective clouds, we used the Aeolus vertical wind profiles to observe intense dynamics near the sea surface with similar locations and observation time as Sentinel-1 and Meteosat. The collocation of the three sensors illustrated the multi-view of a mesoscale CS and its dynamics. This scene strengthened the schematic description of deep convection [33,34]. It also led to a perspective to use Sentinel-1, Aeolus, and Meteosat data to study the various cases of CS formation, development, and decay. For instance, some studied cases illustrated the presence of deep convective clouds observed by Meteosat, but no surface wind gusts are detected on Sentinel-1 images.
The deep convective clouds detected by Meteosat and GOES-16 GEO sensors had an agreement in terms of location and shape with the surface wind patterns observed on Sentinel-1, ALOS-1, and SMAP images. Likewise, they had the same displacement direction and probably velocity. When comparing Figure 2, Figure 3, Figure 4 and Figure 5, we could note that the deep convective clouds moved at different speeds for the same observation time. The fastest case was noticed in Figure 4, while Figure 5 showed that the location of deep convective clouds changed very little for 45 min. Two principal factors can be used to model direction and assess the velocity of deep convective clouds [35]: (1) advection of existing cells by the mean wind and (2) propagation of new convection relative to existing storms. Having good knowledge of deep convection motion is very useful in forecasting the direction and velocity of surface convective wind patterns.
6. Conclusions
This paper presented new results on the observation and estimation of surface wind patterns associated with deep convection, not only from C-band Sentinel-1 SAR images, as reported in the previous references, but also through L-band ALOS-1 SAR and L-band SMAP radiometer data. Note that the L-band radar data are little impacted by rainfall. In other words, the high-intensity radar backscattering from L-band SAR data should be induced by strong surface convective winds. This result was also observed for Sentinel-1 SAR images since the radar backscattering at C-band is little impacted for winds above 7 m/s. The high surface wind speed estimated from Sentinel-1 images over Lake Victoria is very close to the values given by the Met Office 4 km numerical model and through the radar radial velocity (15–20 m/s). Note that the Sentinel-1 observation time for the descending direction mode (around 03:00 UTC) over Lake Victoria corresponds to the peak in convection (00:00–06:00 UTC). A perspective with the integration of Sentinel-1 data into NWP models should be carried out to improve the forecast of convective wind gusts at a high spatial resolution.
The collocation of Sentinel-1 and SMAP data with a 34 min time lag illustrated the displacement direction of a surface wind pattern, and it is the same as that of the deep convective clouds observed by Meteosat. This result leads to a perspective that one can use the Meteosat data to model and forecast the direction and probably the velocity of convective wind gusts.
The application of the Aeolus vertical wind intensity measurements corresponding to Sentinel-1 and Meteosat data strengthened the relationship between surface wind patterns and deep convective clouds. The collocation of LEO (Sentinel-1, Aeolus) and GEO (Meteosat) satellites offered a multi-view of deep convection and the associated dynamics. The collocation of the three different satellite sensors can also be used to study the atypical cases of deep convection.
To assess the convective wind gusts estimated from Sentinel-1 images, particularly to strengthen our assumption about the relationship between the high-intensity radar backscattering observed on Sentinel-1 images and deep convection, this paper presented the comparison between the estimated convective winds and in situ wind speed measured by the weather stations along the west coast of Florida. We also showed the GOES-16 images corresponding to cloud activity above the Sentinel-1 images acquired at the sea surface and weather stations. The combination of the three data sources illustrated that the mesoscale surface wind pattern with a squall line shape (10–25 m/s) observed on Sentinel-1 images agrees with the deep convective clouds (210–220 K brightness temperature) observed on GOES-16 images. In particular, the peaks in wind intensity measured by the weather stations correspond to the deep convective clouds observed on GOES-16 images. Moreover, when the squall line observed on Sentinel-1 images reached the west coast of Florida, the rapid increase and the peak of surface wind speed measured by the weather stations were well noticed. The matching between Sentinel-observed surface wind patterns, the peaks in wind intensity measured by the weather stations, and deep convective clouds observed by GOES-16 strengthened a strong relationship between CSs and surface wind gusts. More comparison cases of the estimated and measured wind speeds over the sea corresponding to different stages of deep convection are under study. In particular, they can be used to improve the prediction of surface convective wind gusts based on the GEO images using deep learning. For those studies, the surface convective wind gusts estimated from Sentinel-1 data and in situ measurements of the buoys and weather stations can be used as the training and validation data.
Author Contributions
Conceptualization, T.V.L.; methodology, T.V.L. and C.M.; validation, T.V.L. and C.M.; formal analysis, T.V.L. and C.M.; writing—original draft preparation, T.V.L.; writing—review and editing, T.V.L. and C.M. All authors have read and agreed to the published version of the manuscript.
Funding
This research was funded by the Luxembourg National Research Fund (FNR) in the framework of the Overseas CORE project (C20/SR114703579).
Data Availability Statement
Sentinel-1A/B images were downloaded via the Copernicus Open Access Hub (https://scihub.copernicus.eu/). SMAP ocean surface wind data were obtained via www.remss.com/. ALOS PALSAR-1 images were offered by the ESA (European Space Agency)/JAXA (Japan Aerospace Exploration Agency) in the framework of R&D projects. Aeolus data were downloaded via the virtual research platform VirES (https://aeolus.services/). Meteosat images were provided by the European Organization for the Exploitation of Meteorological Satellites (EUMETSAT) via the EUMETSAT Data Center. GOES-16 images were downloaded via the NOAA servers. In situ wind data were obtained from the NOAA buoys and weather stations.
Acknowledgments
We would like to thank the reviewers for their valuable and constructive feedback, which has greatly contributed to the enhancement of this paper.
Conflicts of Interest
The authors declare no conflicts of interest.
References
- Kastman, S.J.; Market, S.P.; Fox, I.N.; Foscato, A.L.; Lupo, R.A. Lightning and Rainfall Characteristics in Elevated vs. Surface Based Convection in the Midwest that Produce Heavy Rainfall. Atmosphere 2017, 8, 36. [Google Scholar] [CrossRef]
- Waniha, P.F.; Roberts, R.D.; Wilson, J.W.; Kijazi, A.; Katole, B. Dual-Polarization Radar Observations of Deep Convection over Lake Victoria Basin in East Africa. Atmosphere 2019, 10, 706. [Google Scholar] [CrossRef]
- La, T.V.; Messager, C.; Honnorat, M.; Sahl, R.; Khenchaf, A.; Channelliere, C.; Lattes, P. Use of Sentinel-1 C-Band SAR Images for Convective System Surface Wind Pattern Detection. J. Appl. Meteor. Climatol. 2020, 59, 1321–1332. [Google Scholar] [CrossRef]
- La, T.V.; Messager, C. Convective system dynamics viewed in 3D over the oceans. Geophys. Res. Lett. 2021, 48, e2021GL092397. [Google Scholar] [CrossRef]
- La, T.V.; Messager, C. Convective System Observations by LEO and GEO Satellites in Combination. IEEE J. Sel. Top. Appl. Earth Obs. Remote Sens. 2021, 14, 11814–11823. [Google Scholar] [CrossRef]
- La, T.V.; Messager, C. Different Observations of Sea Surface Wind Pattern under Deep Convection by Sentinel-1 SARs, Scatterometers, and Radiometers in Collocation. IEEE J. Sel. Top. Appl. Earth Obs. Remote Sens. 2022, 15, 3686–3696. [Google Scholar] [CrossRef]
- Nie, C.; Long, D.G. A C-Band Wind/Rain Backscatter Model. IEEE Trans. Geosci. Remote Sens. 2007, 45, 621–631. [Google Scholar] [CrossRef]
- Alpers, W.; Zhao, Y.; Mouche, A.A.; Chan, P.W. A note on radar signatures of hydrometeors in the melting layer as inferred from Sentinel-1 SAR data acquired over the ocean. Remote Sens. Environ. 2021, 253, 112177. [Google Scholar] [CrossRef]
- Contreras, R.F.; Plant, W.J. Surface Effect of Rain on Microwave Backscatter from the Ocean: Measurements and Modeling. J. Geophys. Res. 2006, 111, C08019. [Google Scholar] [CrossRef]
- Meissner, T.; Ricciardulli, L.; Wentz, F.J. Capability of the SMAP Mission to Measure Ocean Surface Winds in Storms. Bull. Am. Meteorol. Soc. 2017, 98, 1660–1677. [Google Scholar] [CrossRef]
- Xu, F.; Li, X.; Wang, P.; Yang, J.; Pichel, W.G.; Jin, Y.Q. A Backscattering Model of Rainfall Over Rough Sea Surface for Synthetic Aperture Radar. IEEE Trans. Geosci. Remote Sens. 2015, 53, 3042–3054. [Google Scholar] [CrossRef]
- Wang, Z.; Zou, J.; Stoffelen, A.; Lin, W.; Verhoef, A.; Li, X.; He, Y.; Zhang, Y.; Lin, M. Scatterometer Sea Surface Wind Product Validation for HY-2C. IEEE J. Sel. Top. Appl. Earth Obs. Remote Sens. 2021, 14, 6156–6164. [Google Scholar] [CrossRef]
- Lin, W.; Portabella, M.; Stoffelen, A.; Verhoef, A.; Turiel, A. ASCAT Wind Quality Control Near Rain. IEEE Trans. Geosci. Remote Sens. 2015, 53, 4165–4177. [Google Scholar] [CrossRef]
- Guo, C.; Ai, W.; Hu, S.; Du, X.; Chen, N. Effect of precipitation on synthetic aperture radar hurricane wind field retrieval. Front. Environ. Sci. 2022, 10, 1034045. [Google Scholar] [CrossRef]
- Woodhams, B.J.; Birch, C.E.; Marsham, J.H.; Lane, T.P.; Bain, C.L.; Webster, S. Identifying Key Controls on Storm Formation over Lake Victoria Basin. Mon. Weather Rev. 2019, 147, 3365–3390. [Google Scholar] [CrossRef]
- Chamberlain, J.M.; Bain, C.L.; Boyd, D.F.A.; McCourt, K.; Butcher, T.; Palmer, S. Forecasting storms over Lake Victoria using a high-resolution model. Meteorol. Appl. 2014, 21, 419–430. [Google Scholar] [CrossRef]
- Van de Walle, J.; Thiery, W.; Brogli, R.; Martius, O.; Zscheischler, J.; van Lipzig, N.P.M. Future intensification of precipitation and wind gust associated thunderstorms over Lake Victoria. Weather Clim. Extrem. 2021, 34, 100391. [Google Scholar] [CrossRef]
- Daïka, A.; Pascal, I.M.; Jores, T.K.; Elisabeth, F.D.; Cesar, M.B.; Michael, T.F.; Roméo-Ledoux, D.T.; Marceline, M.; Gladys, K.N.F.; Firmin, B.A. Impact assessment of the West African monsoon on convective precipitations over the far north region of Cameroon. Adv. Space Res. 2023, 72, 666–676. [Google Scholar]
- Anyah, R.O.; Semazzi, F.H.M.; Xie, L. Simulated physical mechanisms associated with climate variability over Lake Victoria basin East Africa. Mon. Weather Rev. 2006, 134, 3588–3609. [Google Scholar] [CrossRef]
- Knapp, K.R.; Ansari, S.; Bain, C.L.; Bourassa, M.A.; Dickinson, M.J.; Funk, C.; Helms, C.N.; Hennon, C.C.; Holmes, C.D.; Huffman, G.J.; et al. Globally gridded satellite observations for climate studies. Bull. Am. Meteorol. Soc. 2011, 92, 893–907. [Google Scholar] [CrossRef]
- Lothon, M.; Campistron, B.; Chong, M.; Couvreux, F.; Guichard, F.; Rio, C.; Williams, E. Life Cycle of a Mesoscale Circular Gust Front Observed by a C-Band Doppler Radar in West Africa. Mon. Weather Rev. 2011, 139, 1370–1388. [Google Scholar] [CrossRef]
- Yueh, S.H.; Fore, A.G.; Tang, W.; Hayashi, A.; Stiles, B.; Reul, N.; Weng, Y.; Zhang, F. SMAP L-Band Passive Microwave Observations of Ocean Surface Wind During Severe Storms. IEEE Trans. Geosci. Remote Sens. 2016, 54, 7339–7350. [Google Scholar] [CrossRef]
- Available online: http://www.remss.com/missions/smap (accessed on 20 June 2020).
- Hsu, S.A.; Meindl, E.A.; Gilhousen, D.B. Determining the power-law wind-profile exponent under near-neutral stability conditions at sea. J. Appl. Meteorol. Climatol. 1994, 33, 757–765. [Google Scholar] [CrossRef]
- Smith, S. Coefficients for sea surface wind stress, heat flux, wind profiles as a function of wind speed and temperature. J. Geophys. Res. 1988, 93, 15467–15472. [Google Scholar] [CrossRef]
- La, T.V.; Khenchaf, A.; Comblet, F.; Nahum, C. Exploitation of C-Band Sentinel-1 Images for High-Resolution Wind Field Retrieval in Coastal Zones (Iroise Coast, France). IEEE J. Sel. Top. Appl. Earth Obs. Remote Sens. 2017, 10, 5458–5471. [Google Scholar] [CrossRef]
- Atlas, D. Origin of storm footprints on the sea seen by synthetic aperture radar. Science 1994, 266, 1364–1366. [Google Scholar] [CrossRef]
- Verspeek, J.; Stoffelen, A.; Portabella, M.; Bonekamp, H.; Anderson, C.; FigaSaldaña, J. Validation and calibration of ASCAT data using ocean backscatter and CMOD5.n. IEEE Trans. Geosci. Remote Sens. 2010, 48, 386–395. [Google Scholar] [CrossRef]
- Isoguchi, O.; Shimada, M. An L-Band Ocean Geophysical Model Function Derived from PALSAR. IEEE Trans. Geosci. Remote Sens. 2009, 47, 1925–1936. [Google Scholar] [CrossRef]
- Hersbach, H.; Bell, B.; Berrisford, P.; Biavati, G.; Horányi, A.; Muñoz Sabater, J.; Nicolas, J.; Peubey, C.; Radu, R.; Rozum, I.; et al. ERA5 Hourly Data on Single Levels from 1979 to Present. Copernicus Climate Change Service (C3S), Climate Data Store (CDS), 2018. Available online: https://cds.climate.copernicus.eu/cdsapp#!/dataset/reanalysis-era5-single-levels?tab=form (accessed on 10 May 2022).
- Available online: https://cds.climate.copernicus.eu (accessed on 10 May 2022).
- La, T.V.; Khenchaf, A.; Comblet, F.; Nahum, C. Assessment of Wind Speed Estimation from C-Band Sentinel-1 Images Using Empirical and Electromagnetic Models. IEEE Trans. Geosci. Remote Sens. 2018, 56, 4075–4087. [Google Scholar] [CrossRef]
- Cotton, W.R.; Bryan, G.; van den Heever, S.C. Storm and Cloud Dynamics—The Dynamics of Clouds and Precipitating Mesoscale Systems; Chapter 9–Mesoscale Convective Systems, International Geophysics; Academic Press: Burlington, VT, USA, 2011; Volume 99, pp. 455–526. [Google Scholar]
- Houze, R.A. Mesoscale Convective Systems. Rev. Geophys. 2004, 42, 1944–9208. [Google Scholar] [CrossRef]
- Corfidi, S.F. Cold Pools and MCS Propagation: Forecasting the Motion of Downwind-Developing MCSs. Weather Forecast. 2003, 18, 997–1017. [Google Scholar] [CrossRef]


Disclaimer/Publisher’s Note: The statements, opinions and data contained in all publications are solely those of the individual author(s) and contributor(s) and not of MDPI and/or the editor(s). MDPI and/or the editor(s) disclaim responsibility for any injury to people or property resulting from any ideas, methods, instructions or products referred to in the content. |
© 2024 by the authors. Licensee MDPI, Basel, Switzerland. This article is an open access article distributed under the terms and conditions of the Creative Commons Attribution (CC BY) license (https://creativecommons.org/licenses/by/4.0/).