Article

Encoder Choice Outweighs Modular Refinement in U-Net Architectures for Globally Distributed Coseismic Landslide Segmentation


1
Chongqing Engineering Research Center of Spatial Big Data Intelligent Technology, Chongqing University of Posts and Telecommunications, Chongqing 400065, China
2
Key Laboratory of Tourism Multisource Data Perception and Decision (TMDPD), Ministry of Culture and Tourism (MCT), Chongqing University of Posts and Telecommunications, Chongqing 400065, China
3
State Key Laboratory of Geohazard Prevention and Geoenvironment Protection, Chengdu University of Technology, Chengdu 610059, China
4
School of Architecture and Civil Engineering, Chengdu University, Chengdu 610106, China
*
Author to whom correspondence should be addressed.
Remote Sens. 2026, 18(16), 2727; https://doi.org/10.3390/rs18162727
Submission received: 25 June 2026 / Revised: 3 August 2026 / Accepted: 7 August 2026 / Published: 13 August 2026
(This article belongs to the Section Remote Sensing Image Processing)

Highlights

What are the main findings?
  • Encoder backbone determines the dominant performance factor within the evaluated U-Net configurations: +11.02 pp IoU, nearly 7× the cumulative module gains
  • Module gains sharpen decision boundaries without recalibrating probabilities
  • Context, attention, and fusion modules follow a see, purify, delineate logic
What are the implications of the main findings?
  • 82.79% Dice, 71.15% IoU, 86.86% Recall, stable across four continents
  • Recall-first design deploys across regions without retraining

Abstract

Rapid post-earthquake landslide mapping is critical for emergency response, yet the quantitative hierarchy of architectural choices in U-Net-based segmentation remains unresolved. Using the Globally Distributed Coseismic Landslide Dataset (GDCLD; nine earthquakes, four continents), we conducted controlled ablations to isolate the contributions of encoder backbones (EfficientNet-b4, ResNet34, DenseNet121) and task-specific modules (RFB, CBAM, PANet). EfficientNet-b4 outperformed ResNet34 by 11.02 pp IoU; per-image IoU differed significantly across the three evaluated encoders (two-sided Kruskal–Wallis test, p < 0.0001), exceeding the cumulative gain of all downstream modules (RFB +0.34 pp, CBAM +0.54 pp, PANet +0.75 pp). EfficientNet regression metrics (MAE, MSE, R2) showed no statistically significant differences across module ablations (p > 0.26), suggesting that gains arose primarily from decision-boundary sharpening rather than large probability-map changes. The final model achieved 82.79% Dice, 71.15% IoU, and 86.86% Recall, with consistent performance across diverse geomorphological and imaging conditions within the present GDCLD evaluation. Independent event-held-out and external-dataset tests are still required to establish broader geographic generalization. These results demonstrate performance within the present GDCLD evaluation; independent event-held-out testing remains necessary for definitive cross-region validation. These findings establish a two-tier design hierarchy—encoder backbones provide the dominant performance capacity within the evaluated U-Net framework, while modules refine decisions via a “see–purify–delineate” mechanism—and propose a dual-metric diagnostic protocol for future architectural evaluation. This hierarchy is limited to the architectures and experimental settings evaluated in this study.

1. Introduction

Earthquake-triggered landslides constitute one of the most lethal secondary geohazards associated with seismic events, in some cases exceeding direct ground-shaking damage in both casualties and economic losses. The 2008 Wenchuan earthquake triggered nearly 200,000 coseismic landslides across a region larger than 110,000 km2, and subsequent multi-temporal inventories showed that post-seismic landsliding remained elevated for years after the mainshock [1,2]. The 2015 Gorkha earthquake in Nepal likewise triggered thousands of slope failures whose cumulative sediment flux reshaped drainage networks and elevated downstream flood risk [3]. Rapid and spatially comprehensive mapping of coseismic landslide inventories in the hours to days following an earthquake is essential for emergency response triage, secondary hazard forecasting, and reconstruction planning [4], as underscored by the global compilation of over 300 earthquake-induced landslide inventories that revealed systematic gaps in spatial coverage and temporal completeness [5]. High-resolution optical satellite imagery, now routinely available within 12–48 h of major seismic events, provides the observational substrate for such mapping. Yet the spatial extent of landslide fields (often spanning thousands of square kilometers across heterogeneous terrain, vegetation cover, and imaging conditions) renders manual photo-interpretation prohibitively slow, subjective, and inconsistent, motivating the development of automated deep-learning segmentation methods capable of delivering reproducible inventories at the pace emergency coordination demands.
Convolutional neural networks, particularly U-Net encoder–decoder architectures [6], emerged over the past five years as the dominant paradigm for pixel-level landslide segmentation. Early studies established CNNs’ superiority over classical machine-learning methods [7,8], and subsequent work explored increasingly elaborate architectural modifications: DeepLab-family models with atrous spatial pyramid pooling (ASPP) for multi-scale context [9], attention mechanisms such as Squeeze-and-Excitation (SE) for channel recalibration [10], feature pyramid networks (FPN) and bidirectional variants for multi-scale fusion [11,12], and most recently CNN–Transformer hybrids that leverage hierarchical vision transformers such as the Swin Transformer to combine local convolutional priors with global self-attention [13,14,15]. The Landslide4Sense benchmark introduced 3799 multisource image patches and evaluated 11 deep-learning segmentation models, with ResU-Net reported as the strongest baseline among the tested architectures [16]. Coseismic landslides vary greatly in size and morphology, from small translational failures to large, complex slope failures [3,5]. This scale variability challenges fixed-resolution segmentation: limited receptive fields may miss large-scale context, whereas excessive downsampling can erase small landslides and irregular boundaries [9,11,12]. Receptive-field design and multi-scale fusion are therefore essential for preserving geomorphologically meaningful features in landslide imagery [11,12,16].
Despite this proliferation of architectural proposals, three interrelated gaps limit both scientific understanding and operational deployment. First, the relative importance of encoder backbone selection versus task-specific downstream modules has never been systematically isolated under controlled experimental conditions; most studies introduce modifications atop default ResNet encoders without establishing whether the encoder itself is the binding constraint. Second, individual modules are typically evaluated as monolithic additions rather than through controlled ablation of mechanistic contributions, leaving it opaque whether reported gains reflect genuine architectural complementarity or parameter accumulation. Third, the majority of existing benchmarks are regionally concentrated, covering one or at most a few earthquake events, and cross-region transferability studies have demonstrated substantial performance degradation when models trained in one geographic context are applied to another [17], raising the question of whether reported improvements reflect architectural merit or dataset-specific overfitting. Cross-region transfer is further complicated by sensor-dependent GSD: after resizing imagery spanning approximately 0.2–3.0 m GSD to a common tensor size, the same convolutional kernel represents substantially different ground areas.
These gaps converge on an unresolved empirical question: what is the quantitative hierarchy of design choices in landslide segmentation architectures, and do module-level gains operate through genuine architectural mechanisms or merely through threshold-level decision adjustments? Answering this requires three elements rarely combined in a single study: rigorous encoder comparison under identical decoder and training conditions; controlled-variable ablation isolating each module’s contribution to specific failure modes; and evaluation on a genuinely globally distributed coseismic dataset that tests robustness across the geomorphological, land-cover, and imaging heterogeneity encountered in real emergency response.
Here, we address these gaps by conducting controlled ablations on the Globally Distributed Coseismic Landslide Dataset [18], which spans nine earthquake events across four continents. We first compare three encoder backbones (EfficientNet-b4, ResNet34, DenseNet121) under an identical U-Net decoder, quantifying their performance ceiling. We then isolate the contributions of three lightweight modules—RFB (context), CBAM (attention), and PANet (fusion)—through incremental ablations, revealing an interpretable “see–purify–delineate” division of labor. Critically, we supplement standard classification metrics (Dice, IoU, Recall, Precision) with continuous probability-map error metrics (MAE, MSE, R2), exposing a previously unreported decoupling: modules improve segmentation via sharper decision boundaries rather than large changes in the continuous probability-map error. These metrics are not presented as a complete probabilistic-calibration analysis. This work establishes an evidence-based hierarchy of design priorities for operational landslide mapping.

2. Methods

2.1. Dataset and Preprocessing

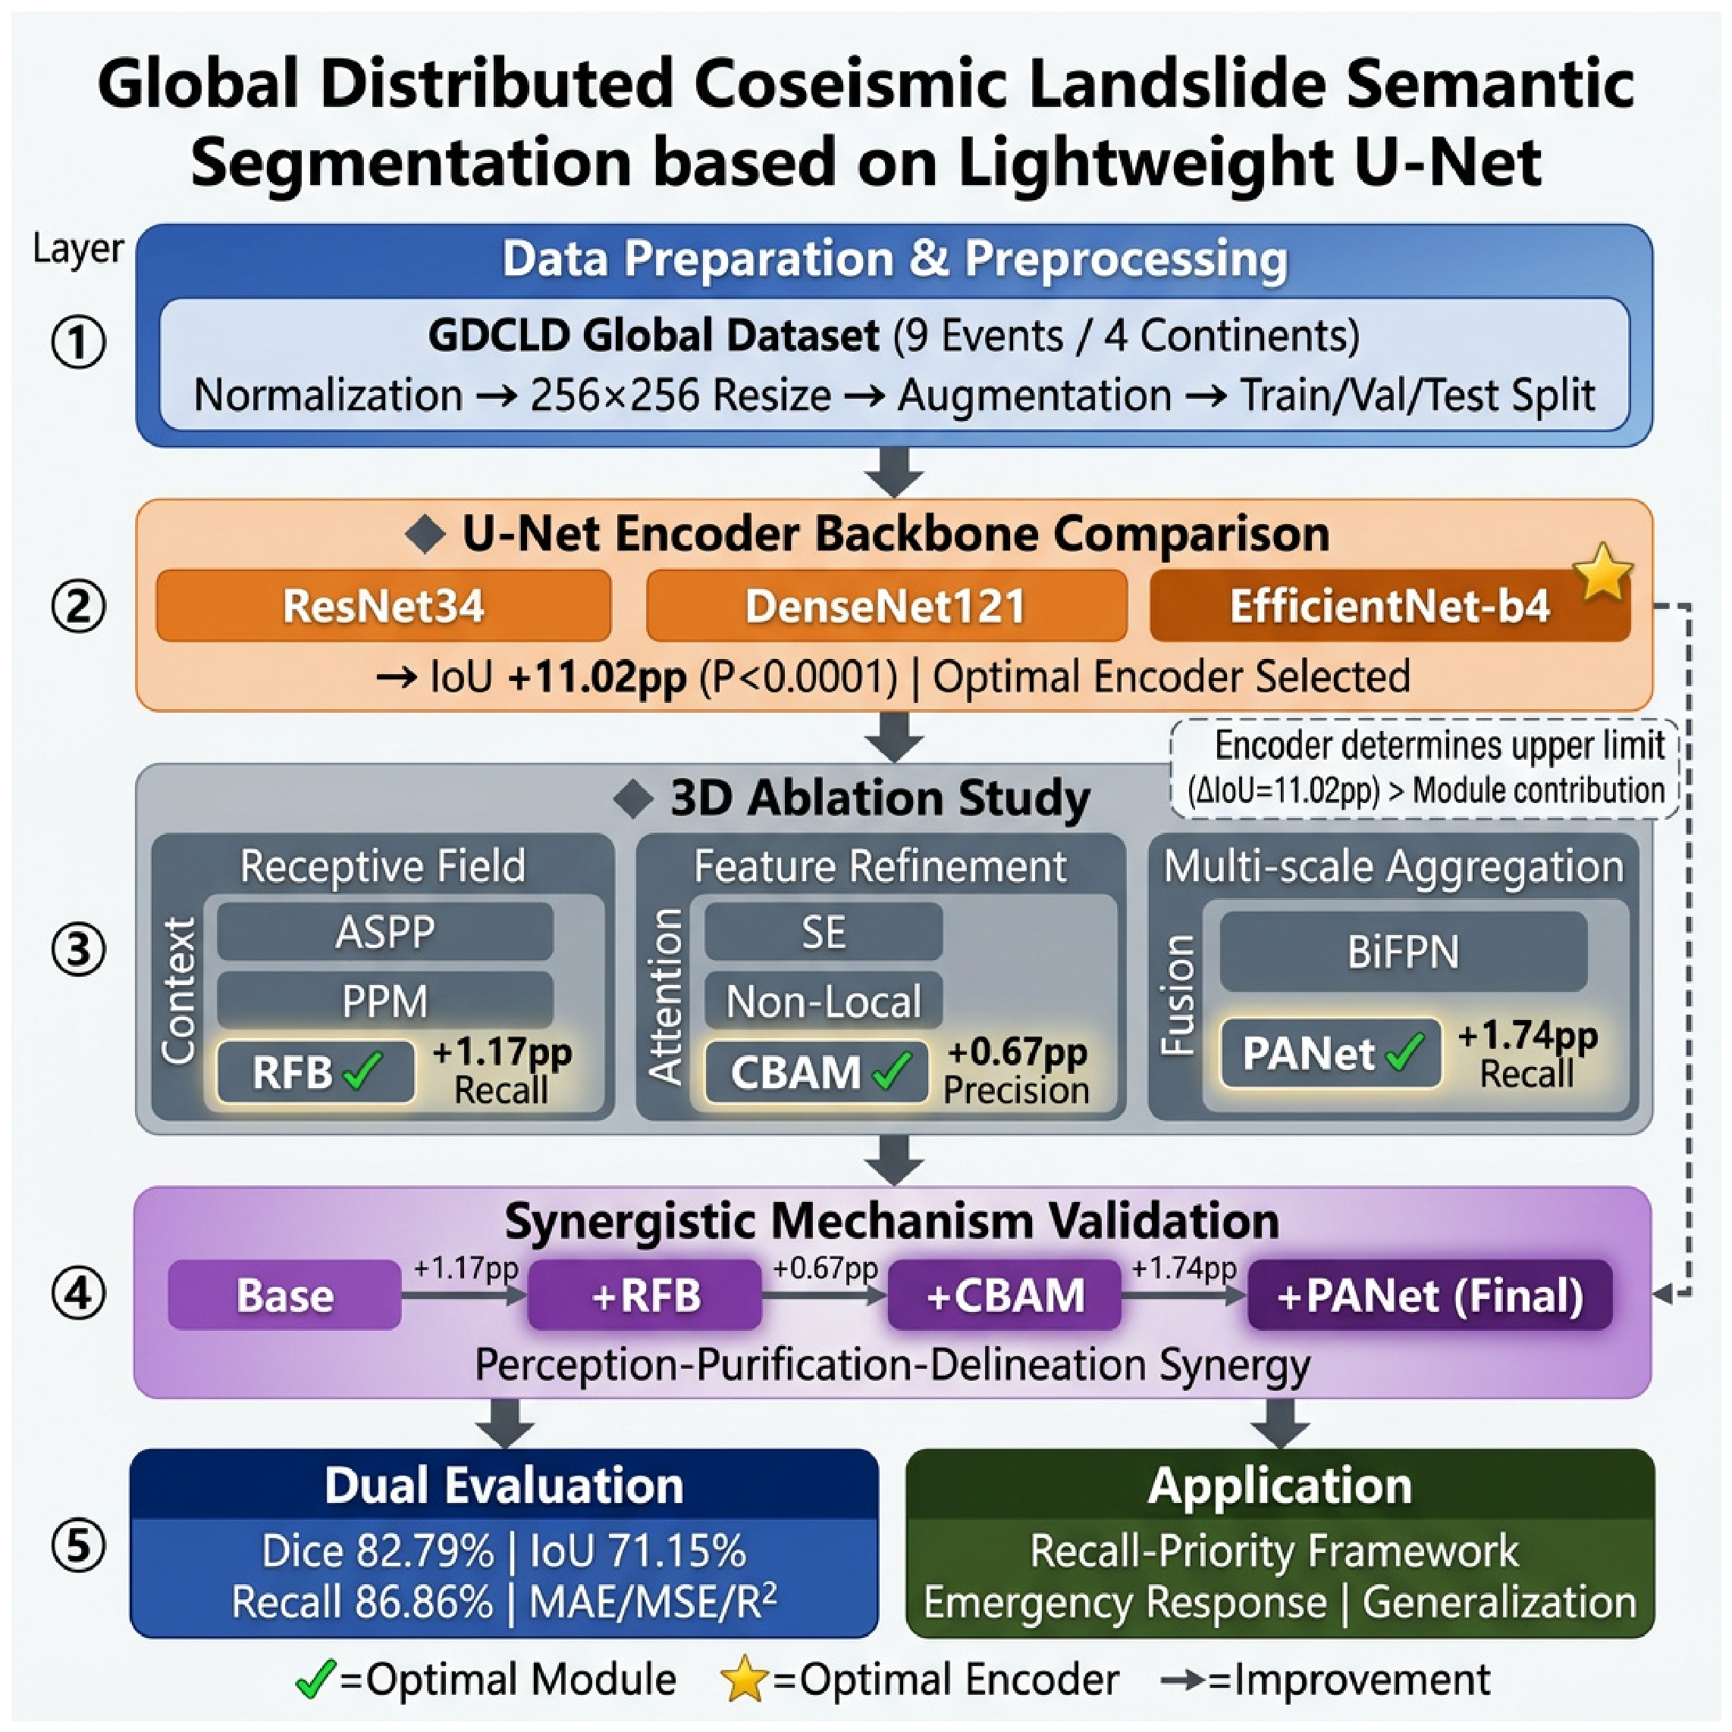
The overall research framework comprised five sequential stages: data preprocessing, encoder backbone comparison, modular ablation across three architectural axes, incremental synergy validation, and dual-metric evaluation (Figure 1). The following subsections detail each component. All experiments were conducted on the Globally Distributed Coseismic Landslide Dataset (GDCLD) [18], which compiles manually delineated inventories together with multisource high-resolution imagery, namely PlanetScope (3 m), Gaofen-6 (2 m), Map World (0.5 m), and UAV (0.2 m), from nine earthquake events across four continents. Resizing standardized the tensor dimensions but did not harmonize the physical GSD; future work should incorporate explicit GSD metadata and scale-aware processing. Before entering the network, image tensors were channel-normalized using the ImageNet statistics μ = (0.485, 0.456, 0.406) and σ = (0.229, 0.224, 0.225), and masks were binarized at 0.5. The audit confirmed that all stored masks contained only binary values after normalization; therefore, the mask threshold of 0.5 represents a deterministic label conversion rather than a tuned operating threshold (Supplementary Table S5). To maintain comparability with the original ablation experiments, the primary training and evaluation retained the positive-mask protocol, while all-zero masks were additionally included in the dataset audit, and all-patch operational evaluation reported in Supplementary Tables S1 and S2. During training only, an Albumentations pipeline applied RandomRotate90, horizontal/vertical flipping, and brightness–contrast jitter of ±0.2 (each p = 0.5), a ShiftScaleRotate with shift ±0.1, scale ±0.1, and rotation ±30° (p = 0.5), and a stochastic choice of Gaussian noise or Gaussian blur (joint p = 0.3); validation and test batches used only resizing. All audited source patches were 1024 × 1024 pixels and were resized to 256 × 256 using bilinear interpolation for RGB images and nearest-neighbor interpolation for masks (Supplementary Table S5). Following Fang et al. [18], GDCLD contains imagery from nine earthquake events. For the locally audited implementation used in this study, 1088 paired image-mask patches were assigned using a fixed stratified split (seed 42) to training (760), validation (164), and testing (164). Positive/negative patch counts and foreground-pixel proportions are provided in Supplementary Table S1.

2.2. Baseline Architecture and Encoder Backbones

The baseline followed a U-Net encoder–decoder topology. The decoder consisted of five blocks with output channel widths [256, 128, 64, 32, 16]; each block bilinearly upsampled its input by a factor of two, concatenated the corresponding encoder skip, and applied two 3 × 3 convolutions with batch normalization and ReLU. A final 3 × 3 convolution with sigmoid activation produced a pixel-wise probability map P [ 0 , 1 ] H × W , followed by bilinear upsampling to the original input resolution. All encoders were initialized with ImageNet-pretrained weights from the segmentation_models_pytorch library such that any performance difference was attributable solely to the backbone.
Three backbones were compared under this fixed decoder. ResNet-34 stacks residual blocks [19]
x l + 1 = F ( x l , { W i } ) + x l
where x l denotes the feature at layer l , F represents the residual function, and W i are learnable weights, scaling capacity through depth alone. DenseNet-121 instead promotes feature reuse by concatenating the outputs of all preceding layers inside each dense block [20].
x l = H l ( [ x 0 , x 1 , , x l 1 ] )
where H l is a composite function (batch normalization, ReLU, convolution) and [ ] denotes channel-wise concatenation, which grows channel width rapidly and can dilute task-specific responses. EfficientNet-b4 adopts compound scaling [21].
d = α ϕ , w = β ϕ , r = γ ϕ , s.t. α β 2 γ 2 2
where d , w , and r represent network depth, width, and input resolution, respectively, and ϕ is the compound coefficient controlling simultaneous scaling, with α , β , and γ determined by grid search. Its MBConv blocks factorize standard convolution into depthwise and pointwise operations, enlarging the effective receptive field per parameter. The five encoder stages of EfficientNet-b4 supplied feature maps with spatial resolutions and channel counts (1282, 48), (642, 32), (322, 56), (162, 160), and (82, 448), which fed the decoder through skip connections. This encoder was adopted for all subsequent module experiments.

2.3. Architectural Refinement Modules

Three lightweight modules were integrated above the deepest encoder stage to address the principal failure modes observed in the baseline: limited contextual coverage, spectrally ambiguous false activations, and fragmented boundaries across scales. The architectural designs are illustrated in Figure 2, Figure 3 and Figure 4.
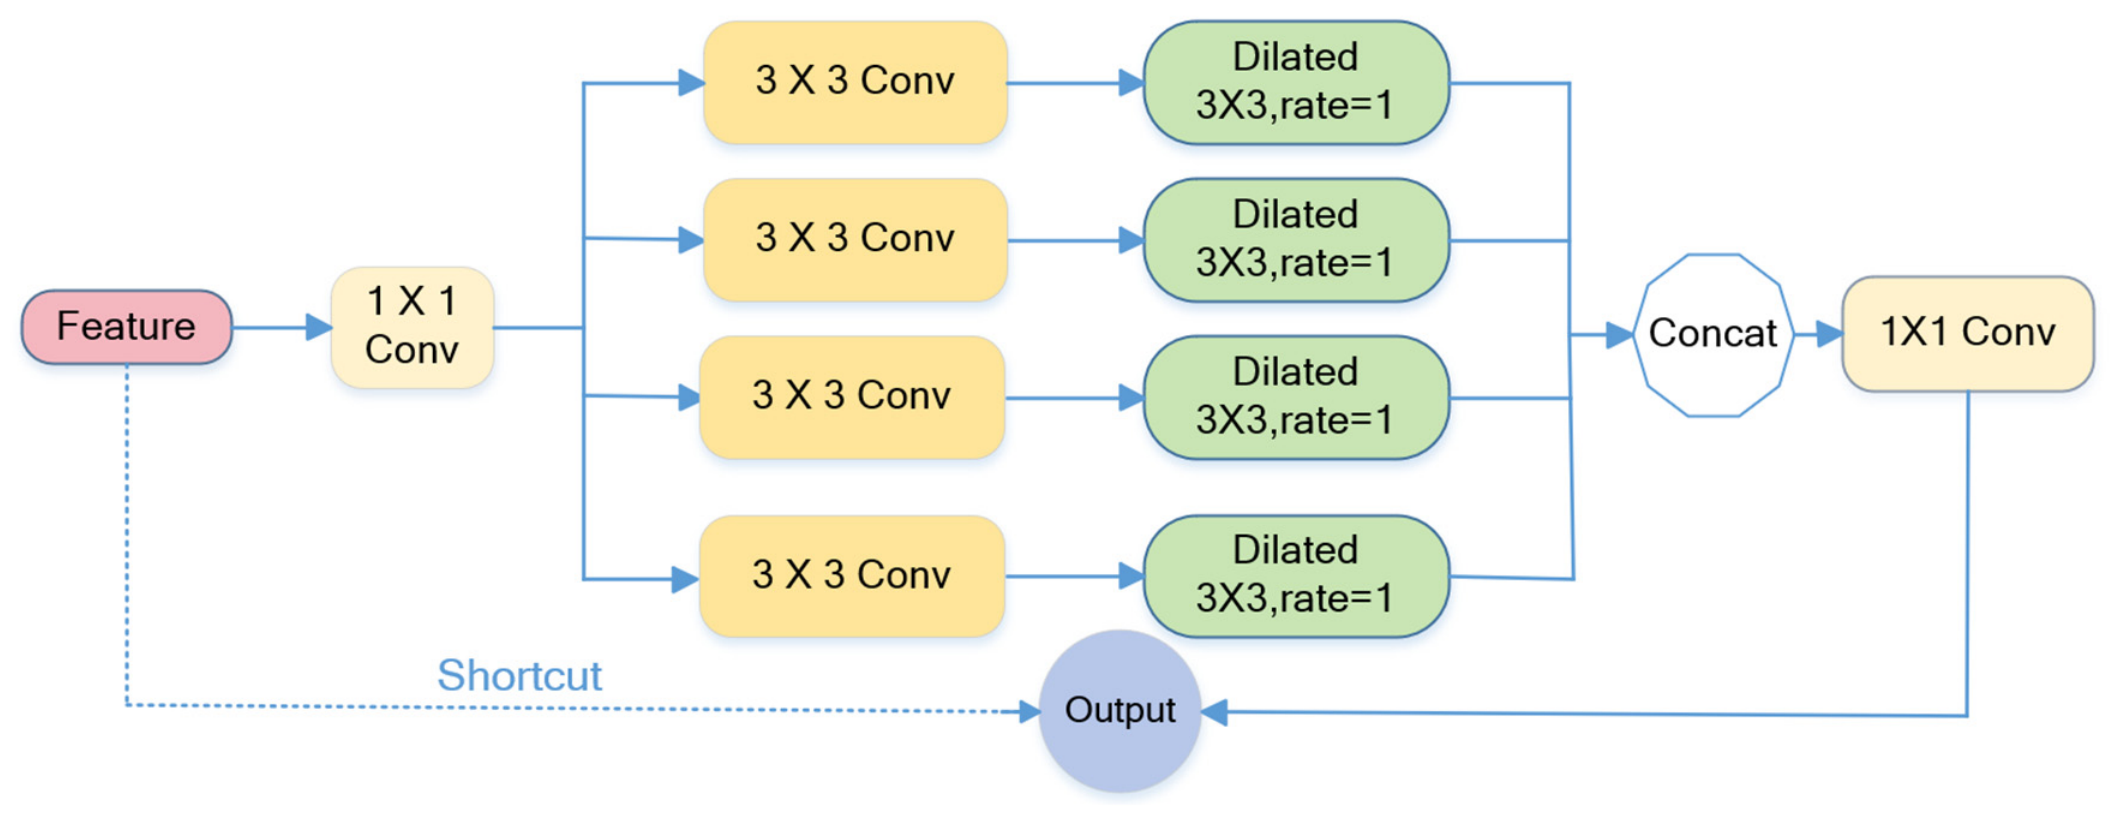
Receptive Field Block (RFB). Following Liu et al. [22], the RFB first compresses the input (where is batch size, is channel count, and are spatial dimensions) to channels through a 1 × 1 convolution with batch normalization and ReLU, then distributes the compressed feature to four parallel branches (Figure 2). Branch 1 is a single 1 × 1 projection; Branches 2–4 each apply a 1 × 1 projection followed by a 3 × 3 dilated convolution with dilation rates and, respectively, such that the effective receptive field per branch X R B × C × H × W B C H W C / 4 r = 1,2 , 3
R eff = k + ( k 1 ) ( r 1 )
where k is the kernel size, progresses from 3 to 7 pixels while leaving spatial resolution unchanged. The choice of small dilation rates ( r 3 ), rather than the r = { 6,12,18 } of ASPP, was motivated by the spatial statistics of coseismic landslides in GDCLD: at 256 × 256 input resolution, typical small-to-medium targets occupy on the order of 50–200 pixels, and larger dilations would sample predominantly background. The four branch outputs are concatenated along the channel axis and fused with a 1 × 1 convolution:
Y = Conv 1 × 1 [ F 1 , F 2 , F 3 , F 4 ]
where F i represents the output of branch i and [ ] denotes channel concatenation.
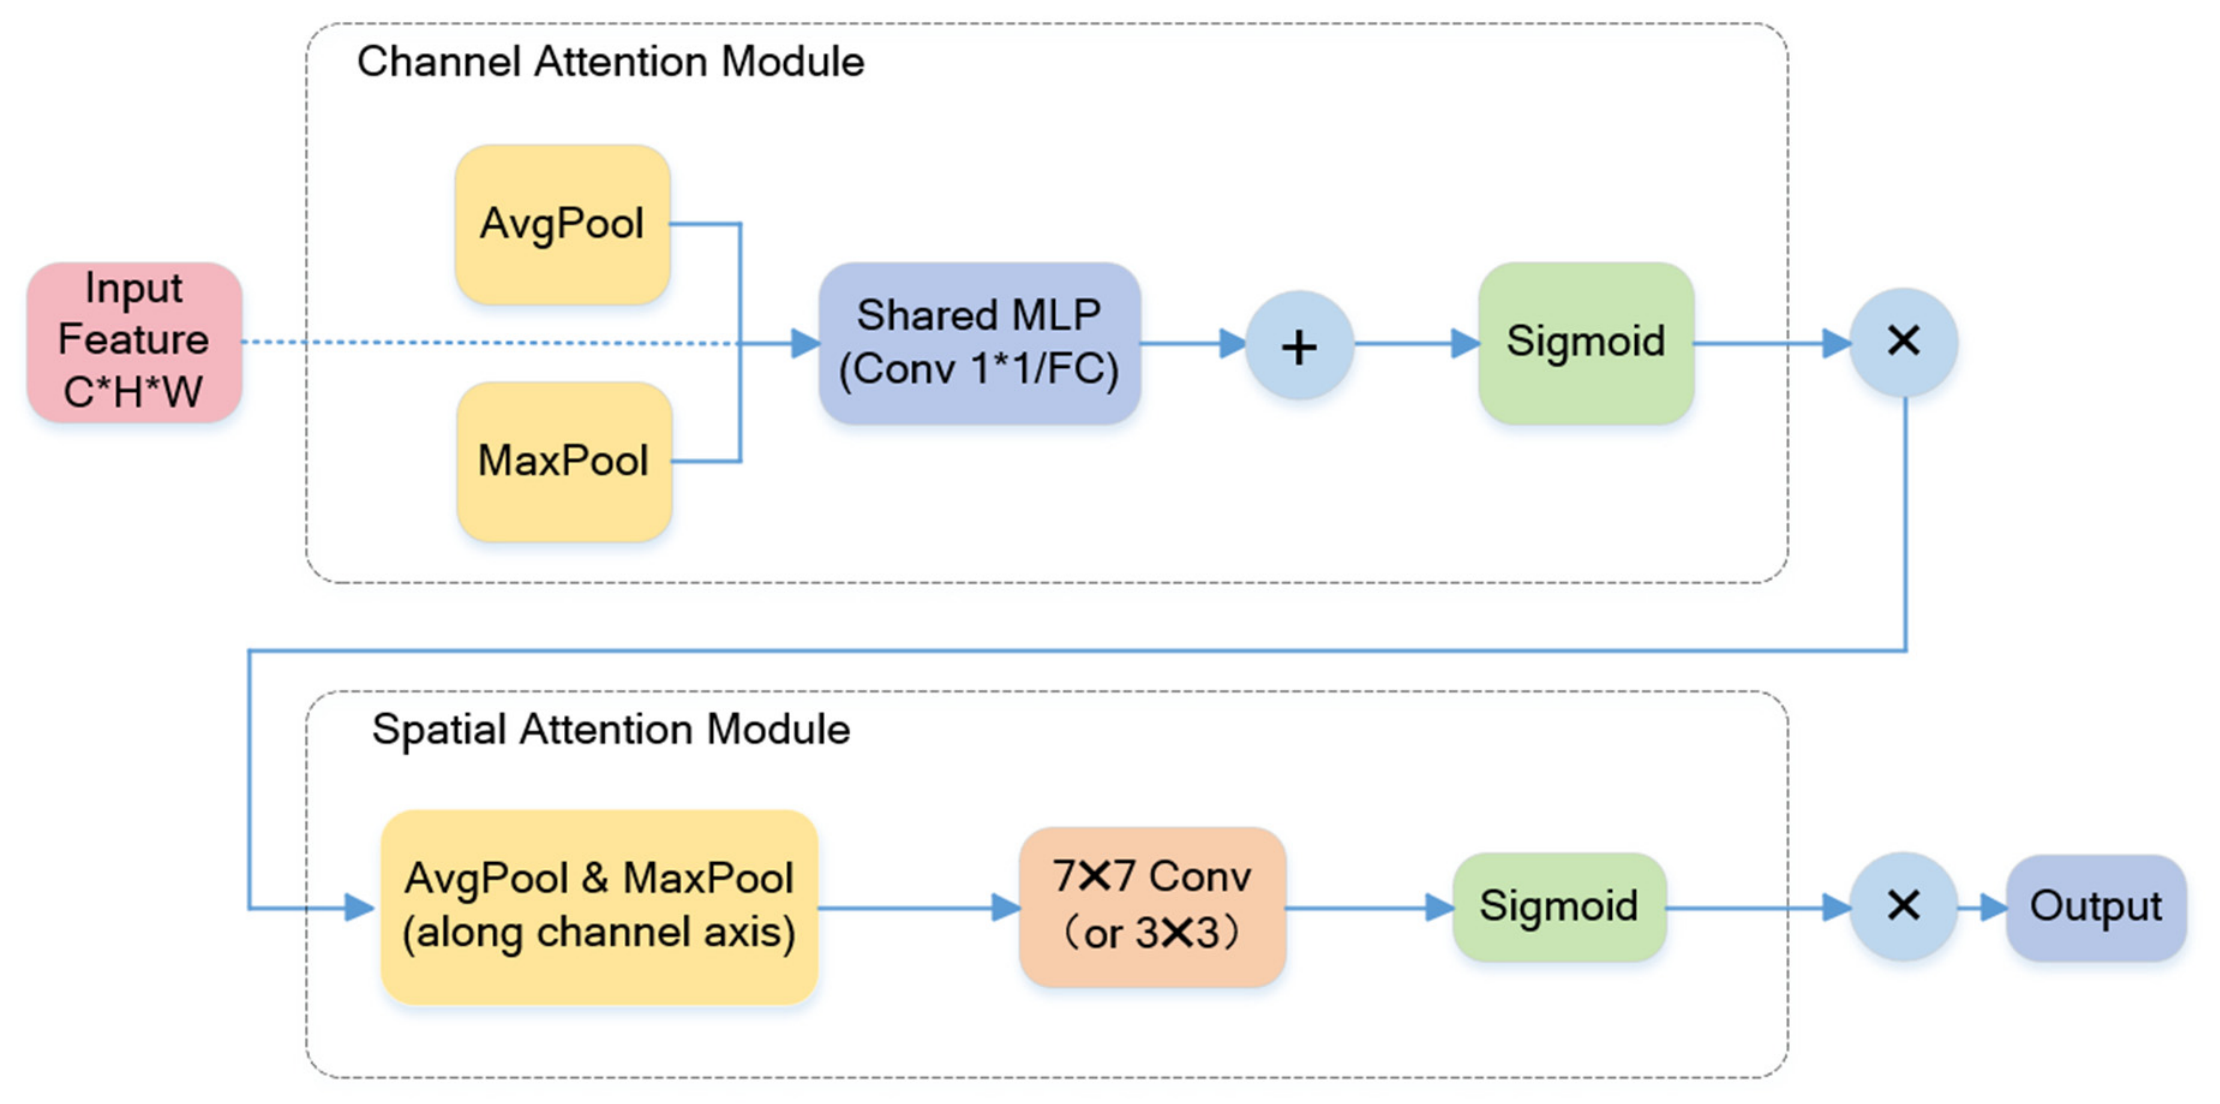
Convolutional Block Attention Module (CBAM). Our CBAM variant implements the sequential channel-then-spatial refinement of Woo et al. [23] in a compact form (Figure 3). Channel attention is produced by a global-average-pool bottleneck.
M c ( X ) = σ ( W 2 ReLU ( W 1 GAP ( X ) ) ) , X = M c ( X )
where G A P ( ) denotes global average pooling; r = 16 is the channel-reduction ratio; W 1 R ( C / r ) × C × 1 × 1 and W 2 R C × ( C / r ) × 1 × 1 are the learnable weights of two 1 × 1 pointwise convolutions that reduce the channel dimension from C to C / r and restore it to C , respectively; σ denotes the sigmoid function; denotes channel-wise multiplication; and X is the channel-refined feature. Spatial attention then pools the channel-refined feature along the channel axis using both mean and maximum, concatenates the two one-channel descriptors, and applies a 7 × 7 convolution:
M s X = σ Conv 7 × 7 μ c X , m a x c X , Y = M s X X
where μ c ( ) and m a x c ( ) compute channel-wise mean and maximum, respectively. Processing channels before space lets the spatial sub-module operate on an already-pruned representation, which reduces interference from background textures while preserving the linear complexity 𝒪 ( H W ) critical at deep-stage feature resolutions.
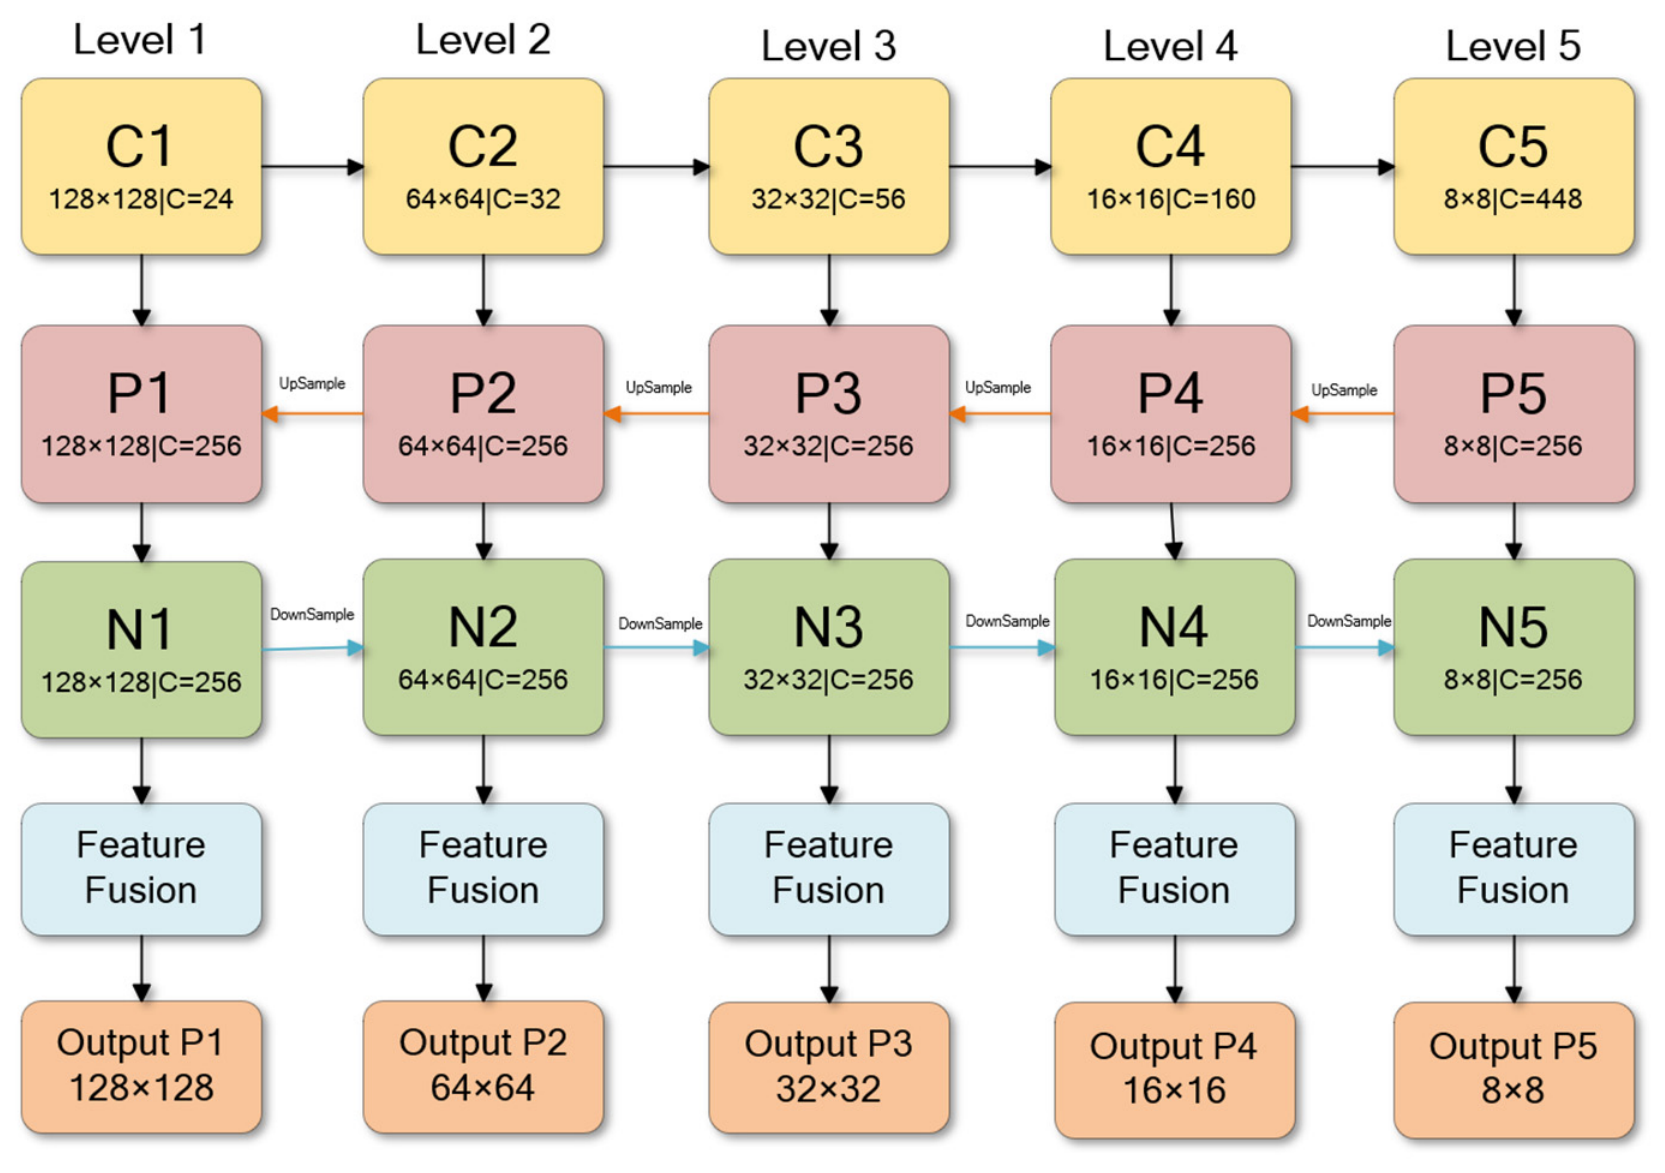
Path Aggregation Network (PANet). Let { F l } l = 1 5 denote the five EfficientNet-b4 encoder feature maps ordered from shallow to deep, with spatial resolutions and channel numbers of ( 128 × 128,48 ) , ( 64 × 64,32 ) , ( 32 × 32,56 ) , ( 16 × 16,160 ) , and ( 8 × 8,448 ) , respectively. Each F l is projected to a common width of 256 through a 1 × 1 convolution followed by batch normalization and ReLU, yielding F ^ l (Figure 4).
A top-down pathway propagates deep semantics downward [24],
{ C l } l = 1 L l { C l }
P L = C L , P l = Conv 3 × 3 C l + Upsample 2 × ( P l + 1 ) ,   l = L 1 , , 1
where P l denotes the top-down feature at level l , U p ( ) denotes bilinear upsampling, and the top-down recurrence proceeds from l = 4 to l = 1 , with the deepest level initialized at l = 5 . A bottom-up pathway shortcuts shallow spatial detail back toward deeper levels through stride-2 3 × 3 convolutions,
N 1 = P 1 , N l = P l + DownSample 2 × ( N l 1 ) ,   l = 2 , , L
where N l denotes the bidirectionally aggregated feature at level l , D o w n ( ) denotes a stride-2 3 × 3 convolution, and the bottom-up recurrence proceeds from l = 2 to l = 5 , with the shallowest aggregated level initialized at l = 1 . Each aggregated level is finalized by an additional 3 × 3 convolution, O l = Conv 3 × 3 ( N l ) . The bottom-up shortcut reduces the propagation length of high-resolution features from O ( L ) hops in a unidirectional FPN to a near-constant path, which is particularly consequential at the EfficientNet-b4 stage, where channel count jumps from 160 to 448, and spatial detail is most aggressively compressed.

2.4. Ablation Design

Four ablation groups were conducted under a controlled-variable paradigm with all training hyperparameters held constant. The encoder comparison contrasted EfficientNet-b4, ResNet-34, and DenseNet-121 under the identical U-Net decoder described in Section 2.2, with no auxiliary modules. Three module-category ablations then fixed the encoder to EfficientNet-b4 and independently varied (i) the context module among {Base, ASPP with rates {6, 12, 18}, PPM with bin sizes {1, 2, 3, 6} [25], RFB}; (ii) the attention module among {Base, SE, Non-local, CBAM}; (iii) the fusion module among {Base, BiFPN, PANet}. Finally, an incremental ablation progressively assembled the final model in a fixed order:
M 0 + RFB M 1 + CBAM M 2 + PANet M 3
chosen to follow the “see–purify–delineate” rationale: RFB first expanded detection coverage, CBAM then suppressed the additional background activations introduced by enlarged receptive fields, and PANet finally restored multi-scale boundary integrity. Tracking all metrics across the four stages distinguished genuine compositional complementarity, reflected in oscillatory Recall/Precision trajectories, from purely additive parameter growth.

2.5. Training Protocol

All networks were optimized with Adam ( β = ( 0.9,0.999 ) ) at an initial learning rate of 3 × 10 4 and a weight decay of 1 × 10 5 , with a cosine-annealing schedule decaying to 1 × 10 6 over 150 epochs. The batch size was 4 on a single NVIDIA GPU. Severe foreground/background imbalance (landslide pixels typically occupy less than 10% of an image) was handled with a soft Dice loss. The loss was held fixed across all configurations to isolate architectural effects; introducing Dice + BCE or Dice + Focal in the principal experiment would have added a second experimental factor.
L Dice = 1 2 i p i y i + ϵ i p i + i y i + ϵ
where p i and y i denote the predicted probability and binary label at pixel i , and ϵ = 10 6 ensures numerical stability, computed per image and averaged over the batch. Complexity was measured at 256 × 256 input and batch size 1. Parameter count, MACs, FLOPs (2 × MACs), mean/SD/median/P95 CPU inference time, model-state memory, and peak process memory are reported in Supplementary Table S4. As an additional sensitivity check, the split was held fixed with seed 42 while initialization, data order, and stochastic augmentation were varied using training seeds 42 and 52. Because this CPU verification used a shortened 100-epoch protocol, its results are reported separately in Supplementary Table S3 and do not replace the primary ablation values.

2.6. Evaluation Metrics and Visualization

Evaluation combined two complementary metric families, designed to diagnose whether gains arose from improved probability estimation or from sharper thresholding. Classification metrics were computed pixel-wise after binarizing predictions at the prespecified threshold τ = 0.5 . To assess threshold sensitivity without changing the principal results, Precision, Recall, F1, and IoU were additionally evaluated over τ = 0.05 –0.95 in increments of 0.05, with the results reported in Supplementary Table S8.
D i c e = 2 TP 2 TP + FP + FN ,   I o U = T P T P + FP + FN ,   R e c a l l = T P T P + FN , P r e c i s i o n = T P T P + FP
where TP, FP, and FN represent true positives, false positives, and false negatives, respectively. Given the asymmetric risk structure of hazard detection (a missed landslide carries far greater operational cost than a field-verifiable false alarm), Recall carried more operational weight than Precision. Regression metrics treated the continuous probability map against the binary target,
MAE = 1 n i = 1 n | y ^ i y i | ,   M S E = 1 n i = 1 n ( y ^ i y i ) 2 R 2 = 1 i ( y ^ i y i ) 2 i ( y i y ¯ ) 2
where y ^ i is the predicted probability, y i is the binary ground truth, y ¯ is the mean of ground-truth labels, and n is the number of pixels. An architectural modification improving Dice/IoU while leaving MAE, MSE, and R2 statistically invariant could be unambiguously identified as a decision-boundary refinement rather than a recalibration of the underlying probability distribution. Per-image values across the test set served as observational units for two-sided non-parametric Kruskal–Wallis testing, with the prespecified significance levels used for module and encoder comparisons. The additional matched sensitivity analysis used a two-sided Wilcoxon signed-rank test and is reported separately in Supplementary Tables S3 and S6.
For qualitative assessment, external contours were extracted from the predicted and ground-truth masks. Dbound is defined as the mean symmetric nearest-neighbor Euclidean distance, in pixels, between the two external-contour point sets. As an additional sensitivity analysis, ASSD and HD95 were computed independently and are reported in Supplementary Table S7.

3. Results

3.1. Encoder Comparison

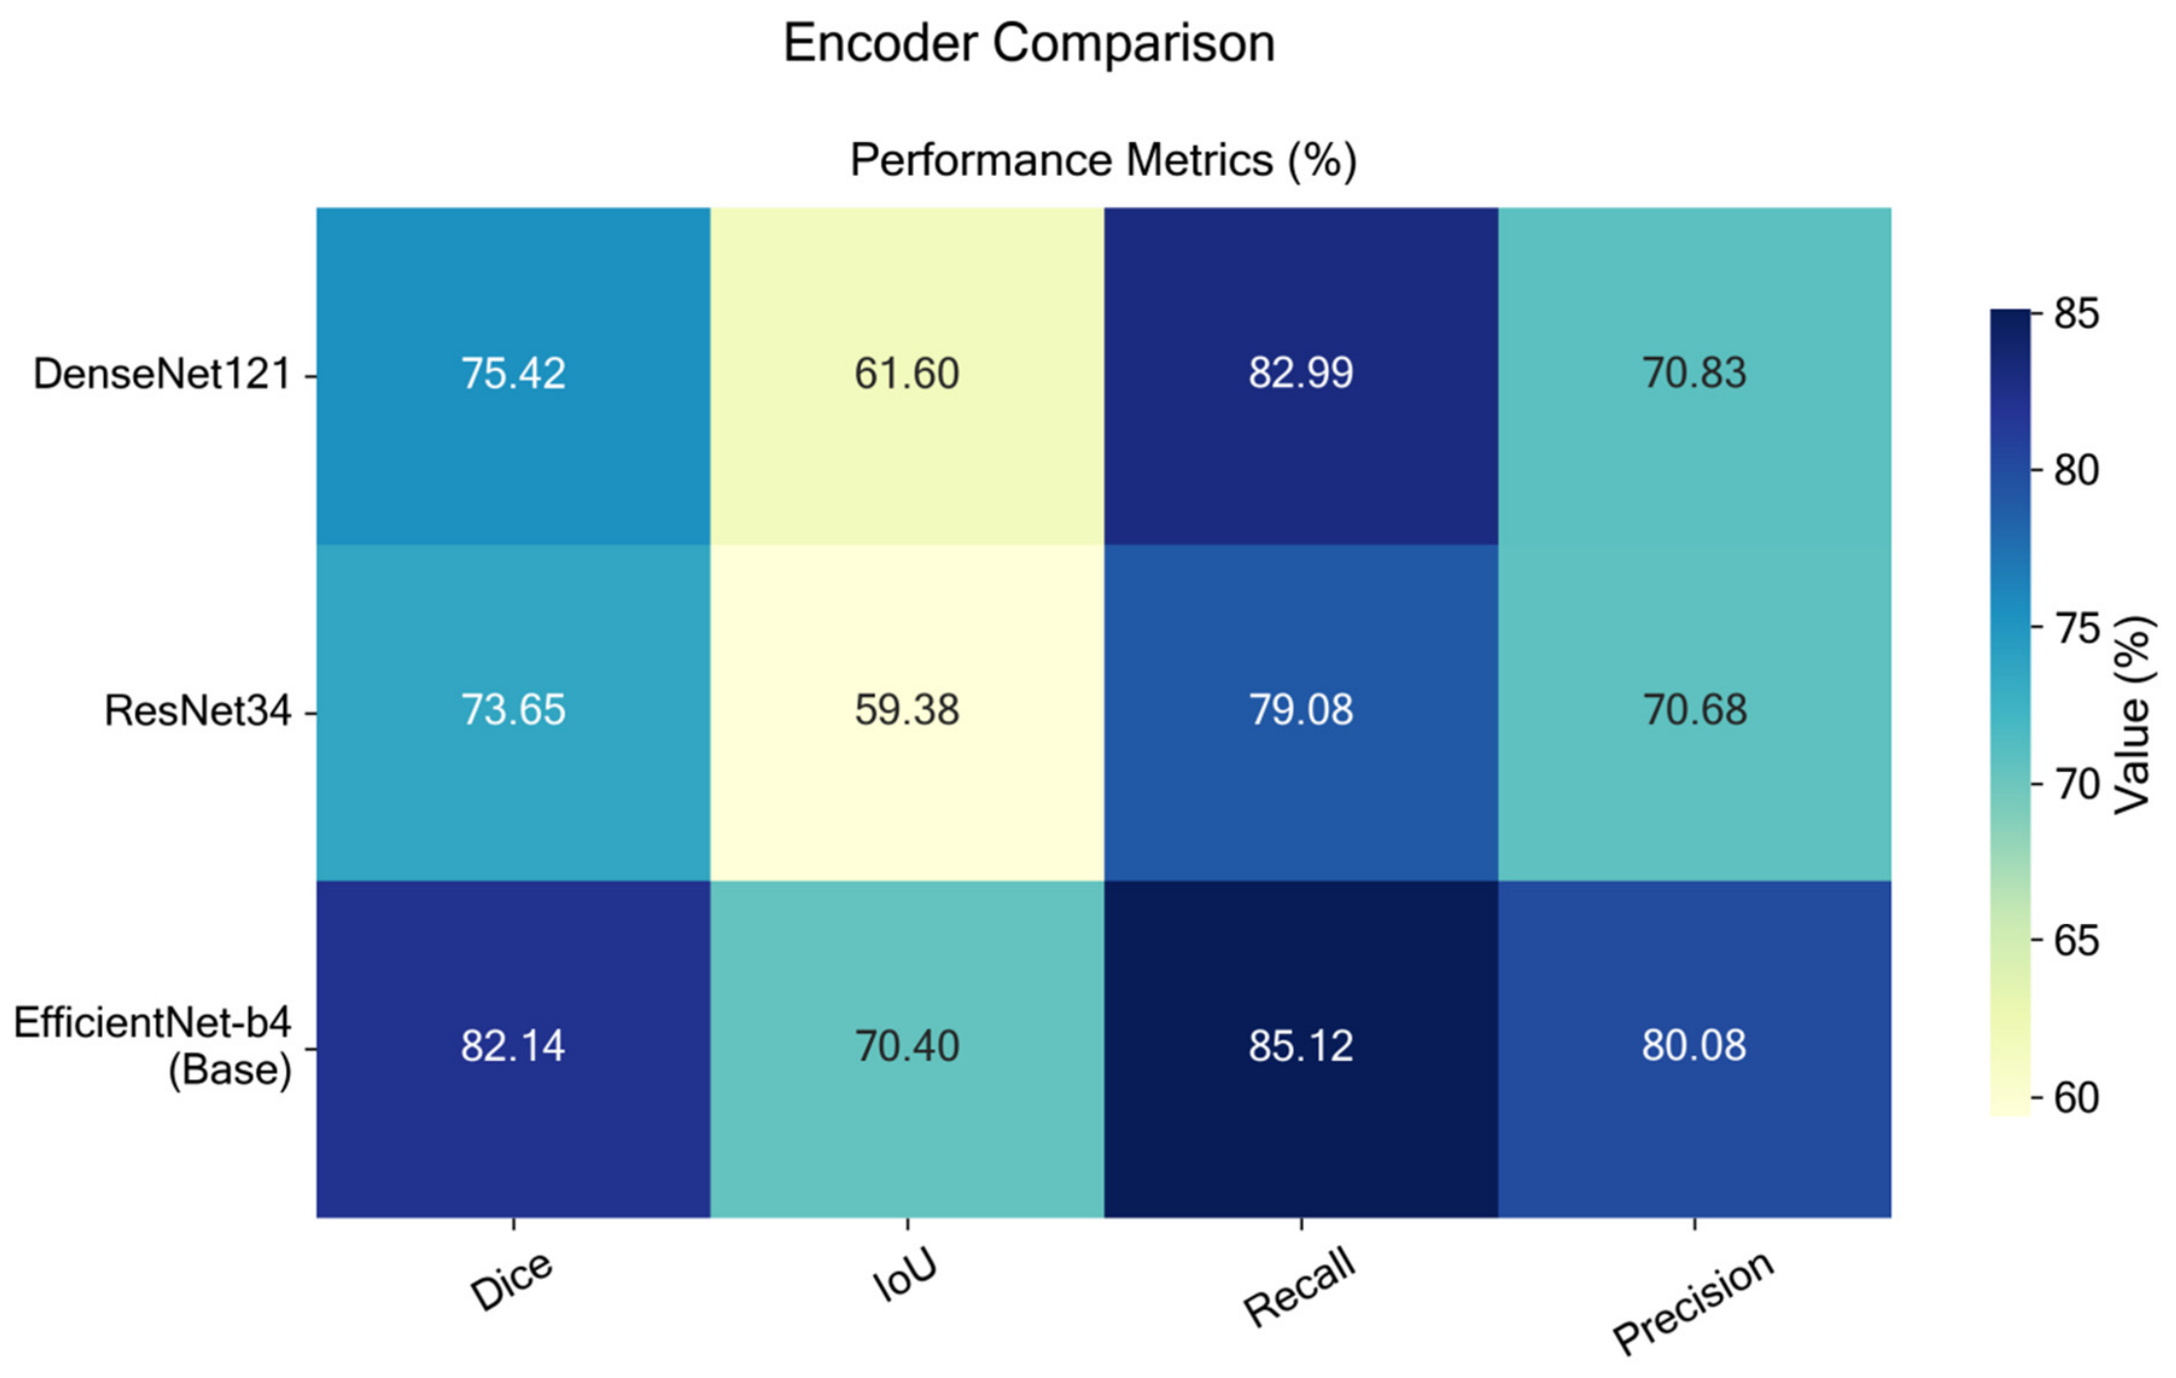
Among three encoder backbones tested under an identical U-Net decoder, EfficientNet-b4 achieved the highest segmentation performance (Dice 82.14%, IoU 70.40%, Recall 85.12%, Precision 80.08%), surpassing ResNet34 by 8.49, 11.02, 6.04, and 9.40 percentage points, respectively (Kruskal–Wallis p < 0.0001; Figure 5). DenseNet121 occupied an intermediate position, with a narrower Recall gap to EfficientNet-b4 (2.13 pp), suggesting partial benefit from dense feature reuse. The 11.02 pp IoU advantage of EfficientNet-b4 over ResNet34 exceeded the summed individual IoU gains of all three modules (RFB +0.34, CBAM +0.54, PANet +0.75; total +1.63 pp) by nearly sevenfold, establishing encoder selection as the dominant architectural degree of freedom.
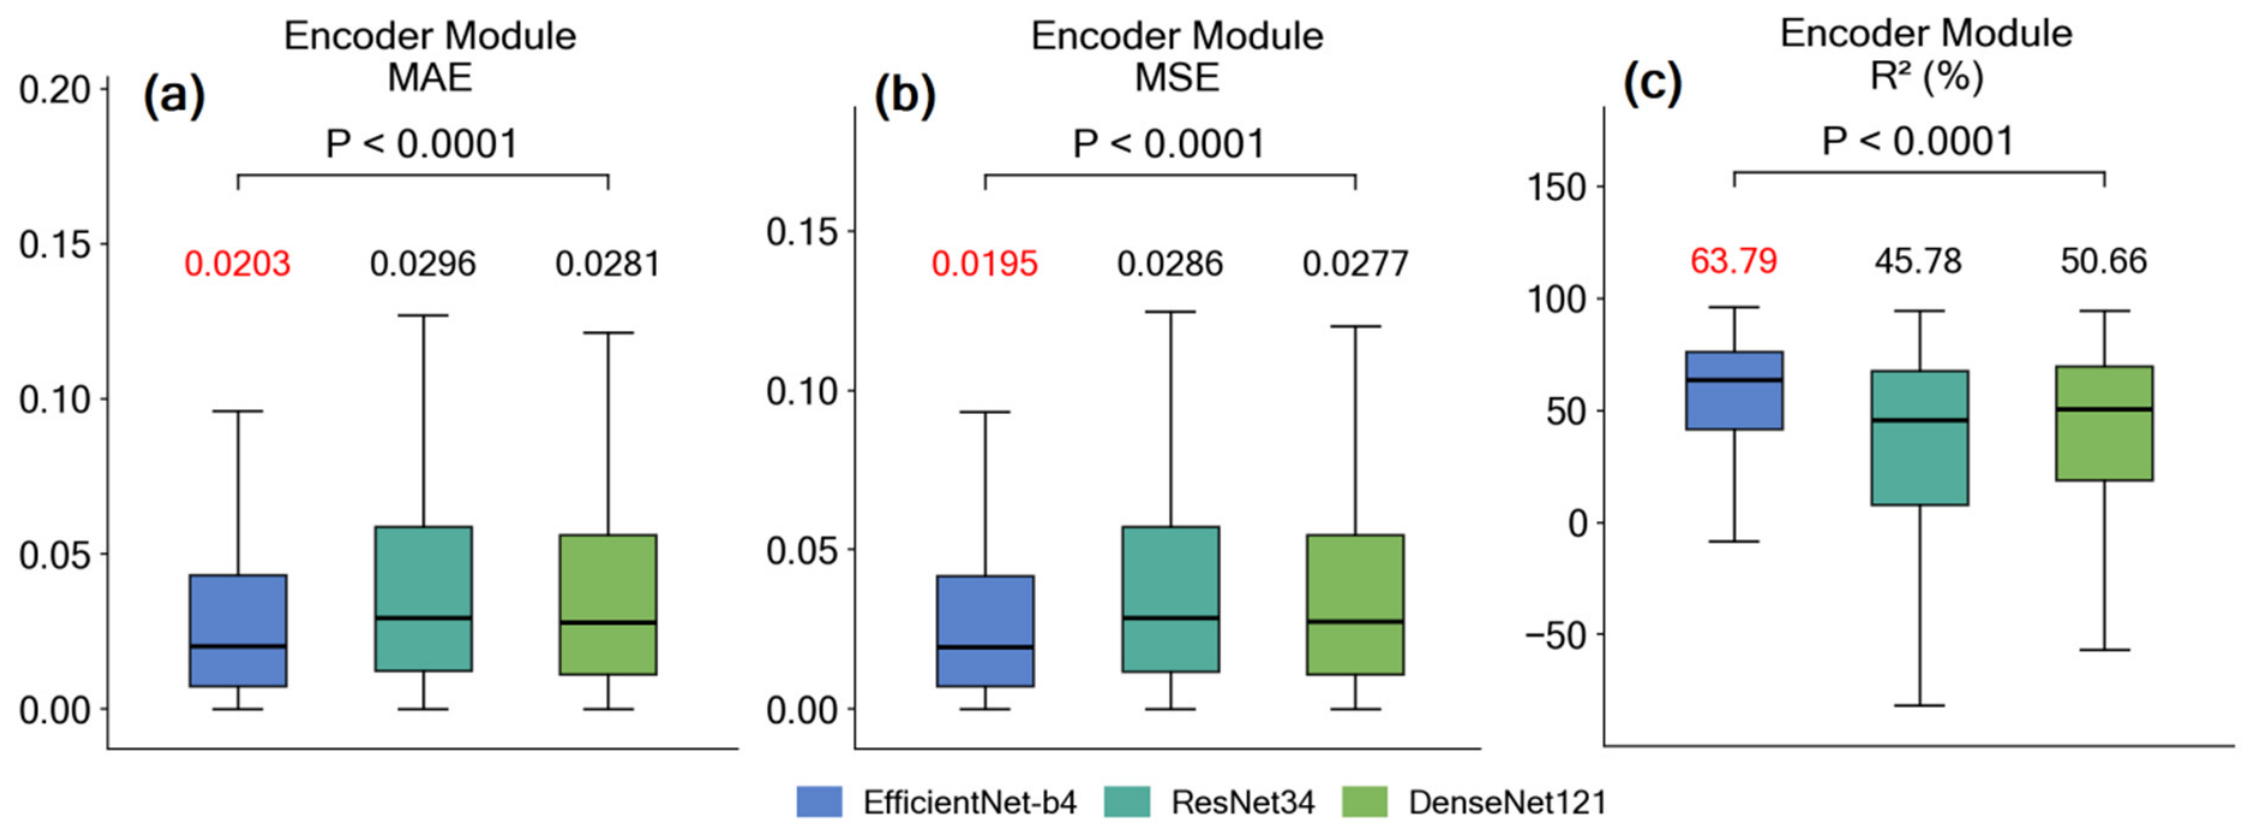
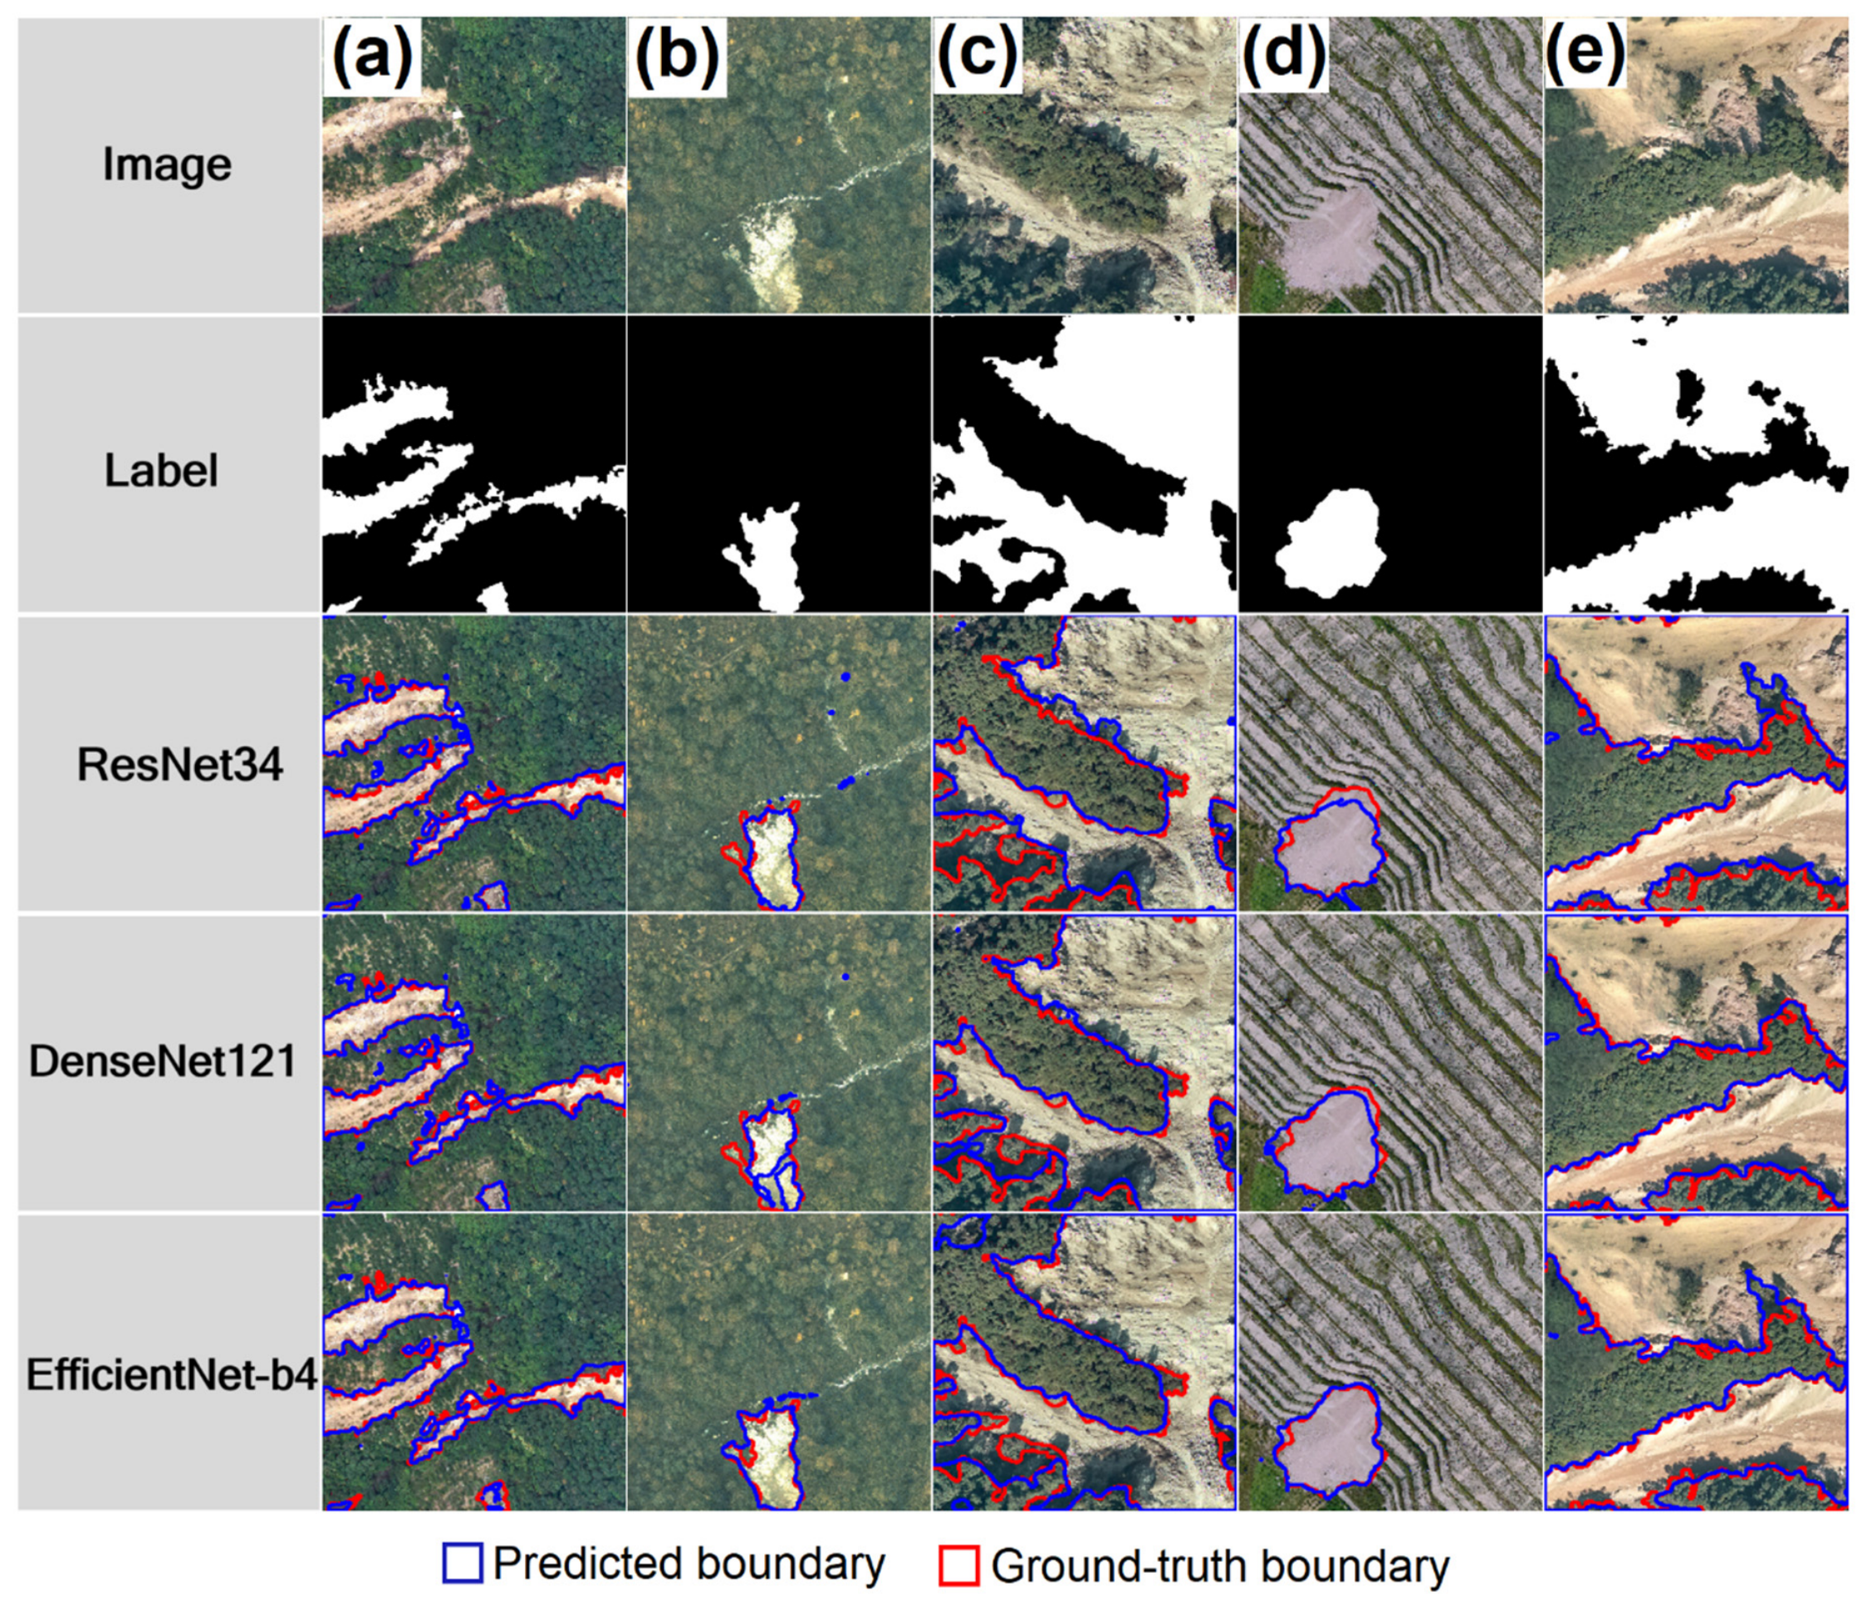
Regression metrics reinforced this conclusion (Figure 6). EfficientNet-b4 reduced MAE by 31.4% and MSE by 31.8% relative to ResNet34, with all differences statistically significant (p < 0.0001). ResNet34 and DenseNet121 produced negative R2 values on approximately 18% and 12% of difficult test samples, respectively (Figure 6c), indicating outright representational failure rather than marginal degradation, whereas EfficientNet-b4 maintained positive R2 across 97% of the test set. Qualitative boundary overlays confirmed that EfficientNet-b4 achieved finer contour alignment, suppressed false positives in terraced farmland, and preserved narrow topological connectors that both alternative backbones eliminated (Figure 7).

3.2. Regression-Metric Invariance Across Module Ablations

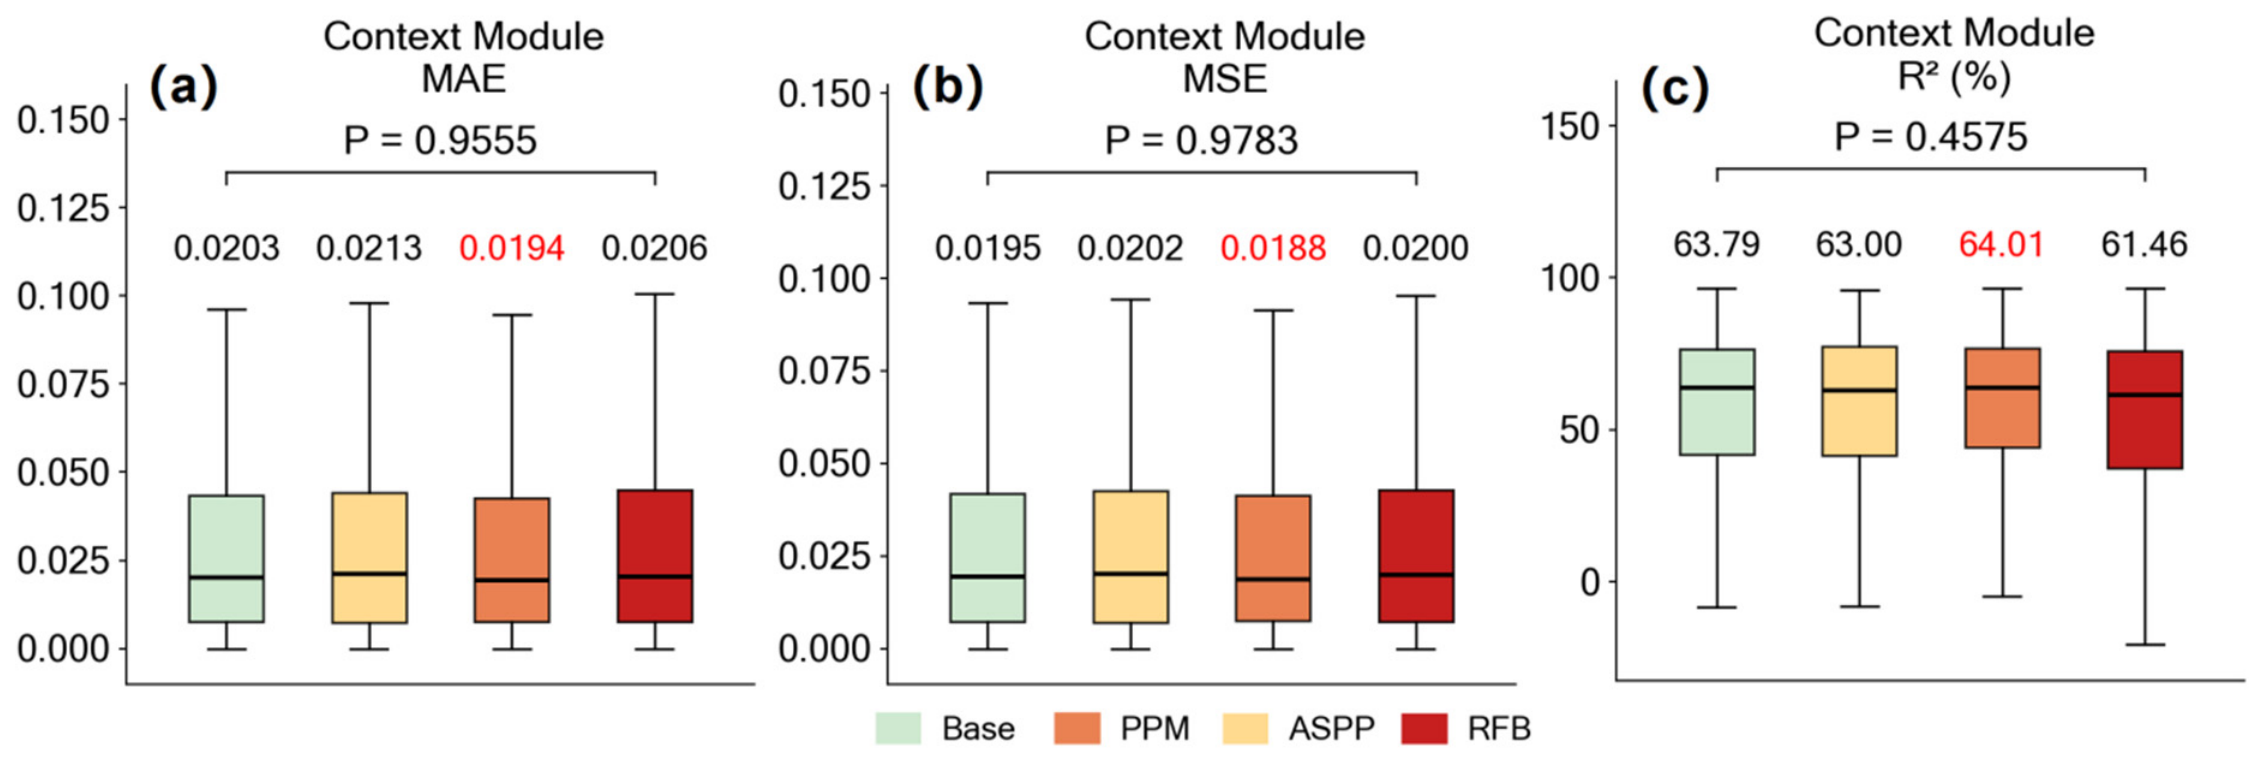
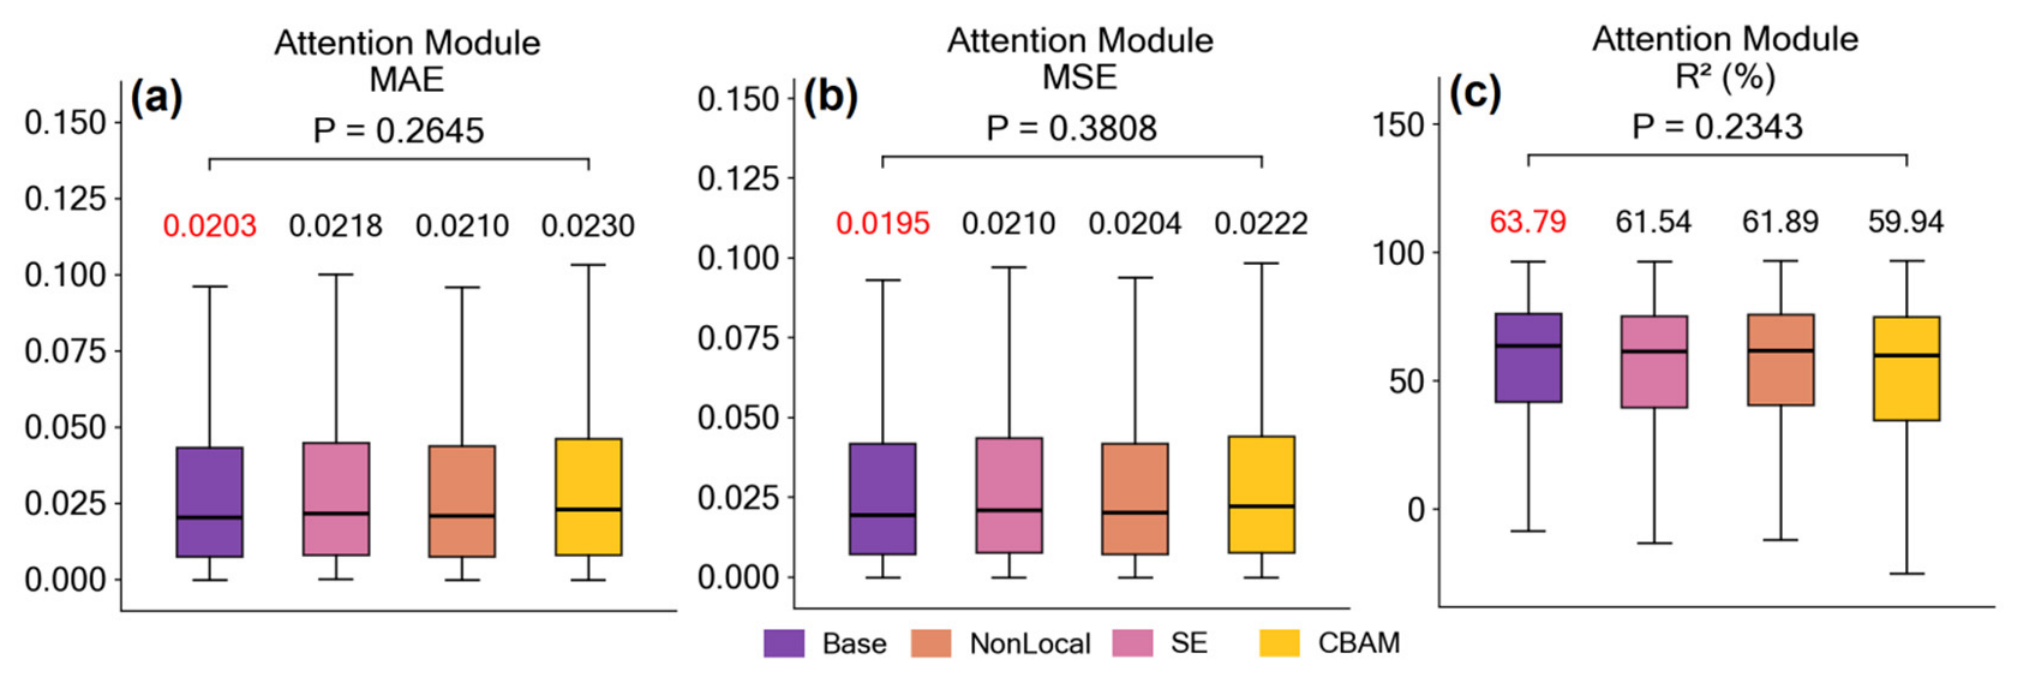
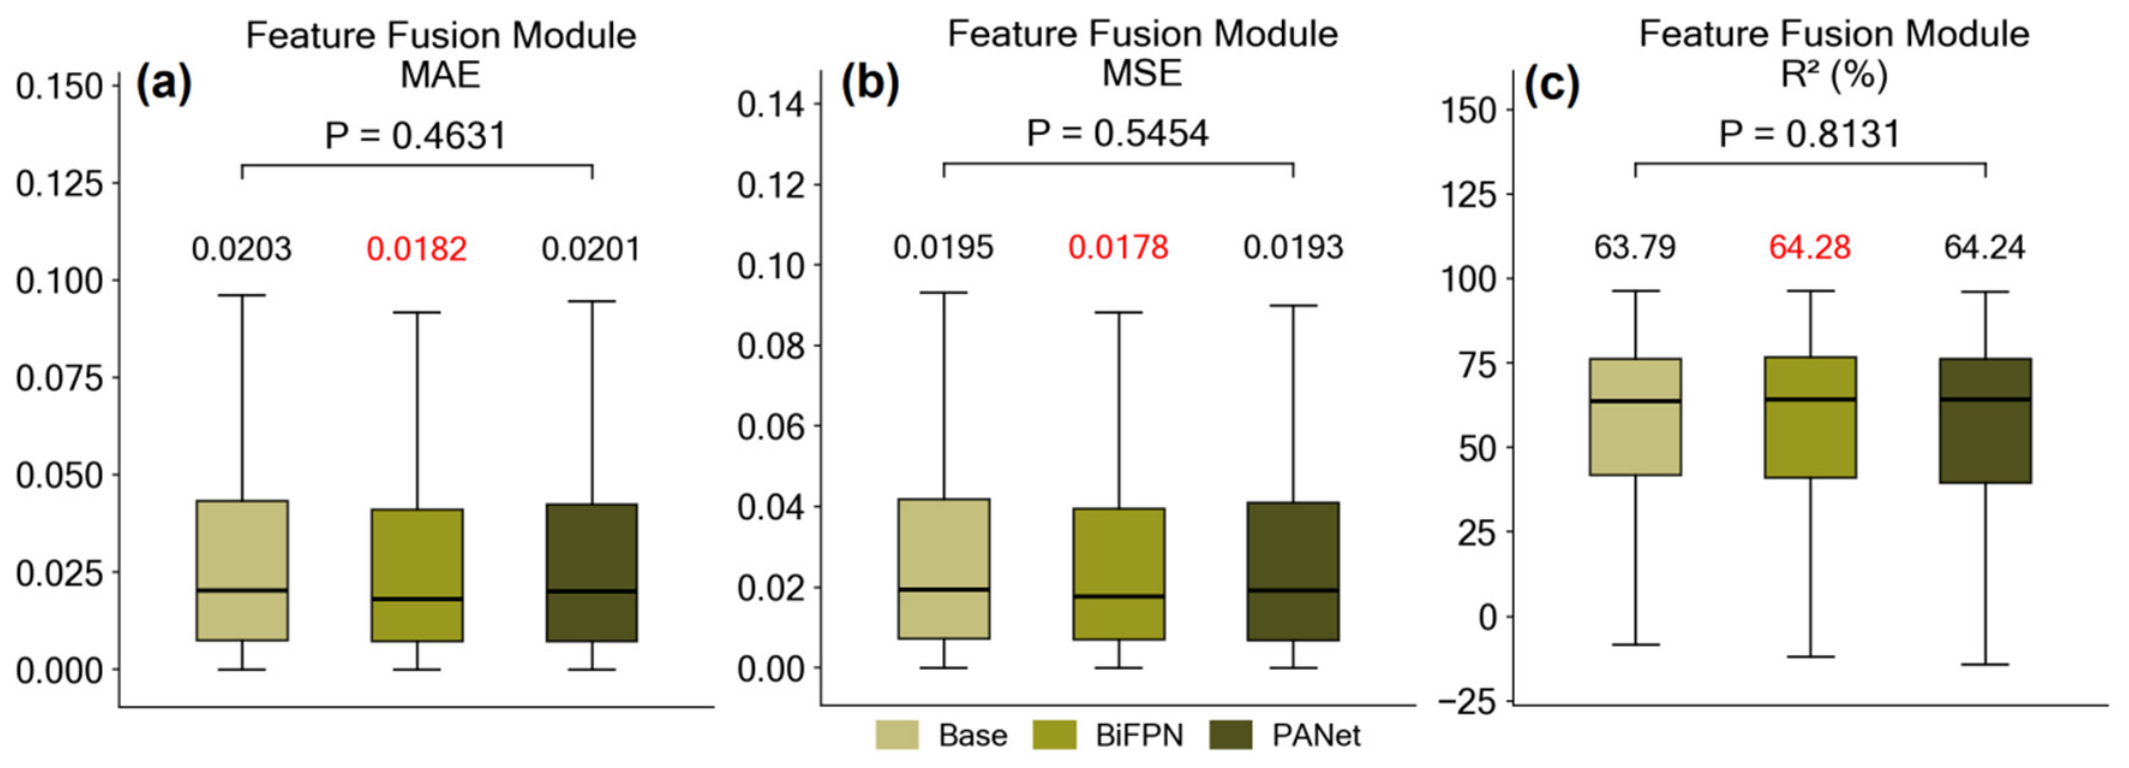
A consistent pattern emerged across all three module ablation categories: while Dice, IoU, Recall, and Precision showed inter-group differences, regression metrics MAE, MSE, and R2 showed no statistically significant differences across all cases (context: p = 0.9555, 0.9783, 0.4575; attention: p = 0.2645, 0.3808, 0.2343; fusion: p = 0.4631, 0.5454, 0.8131; Table 1). This contrasted sharply with encoder-level regression differences (p < 0.0001 for all three metrics). The decoupling supports a two-tier interpretation: encoders alter the network’s underlying probability-assignment capacity, while task-specific modules refine how those probabilities are converted into binary decisions at the classification threshold. Because non-significance does not establish equivalence, paired effect sizes and 95% confidence intervals are additionally reported in Supplementary Table S6.

3.3. Context Module Ablation

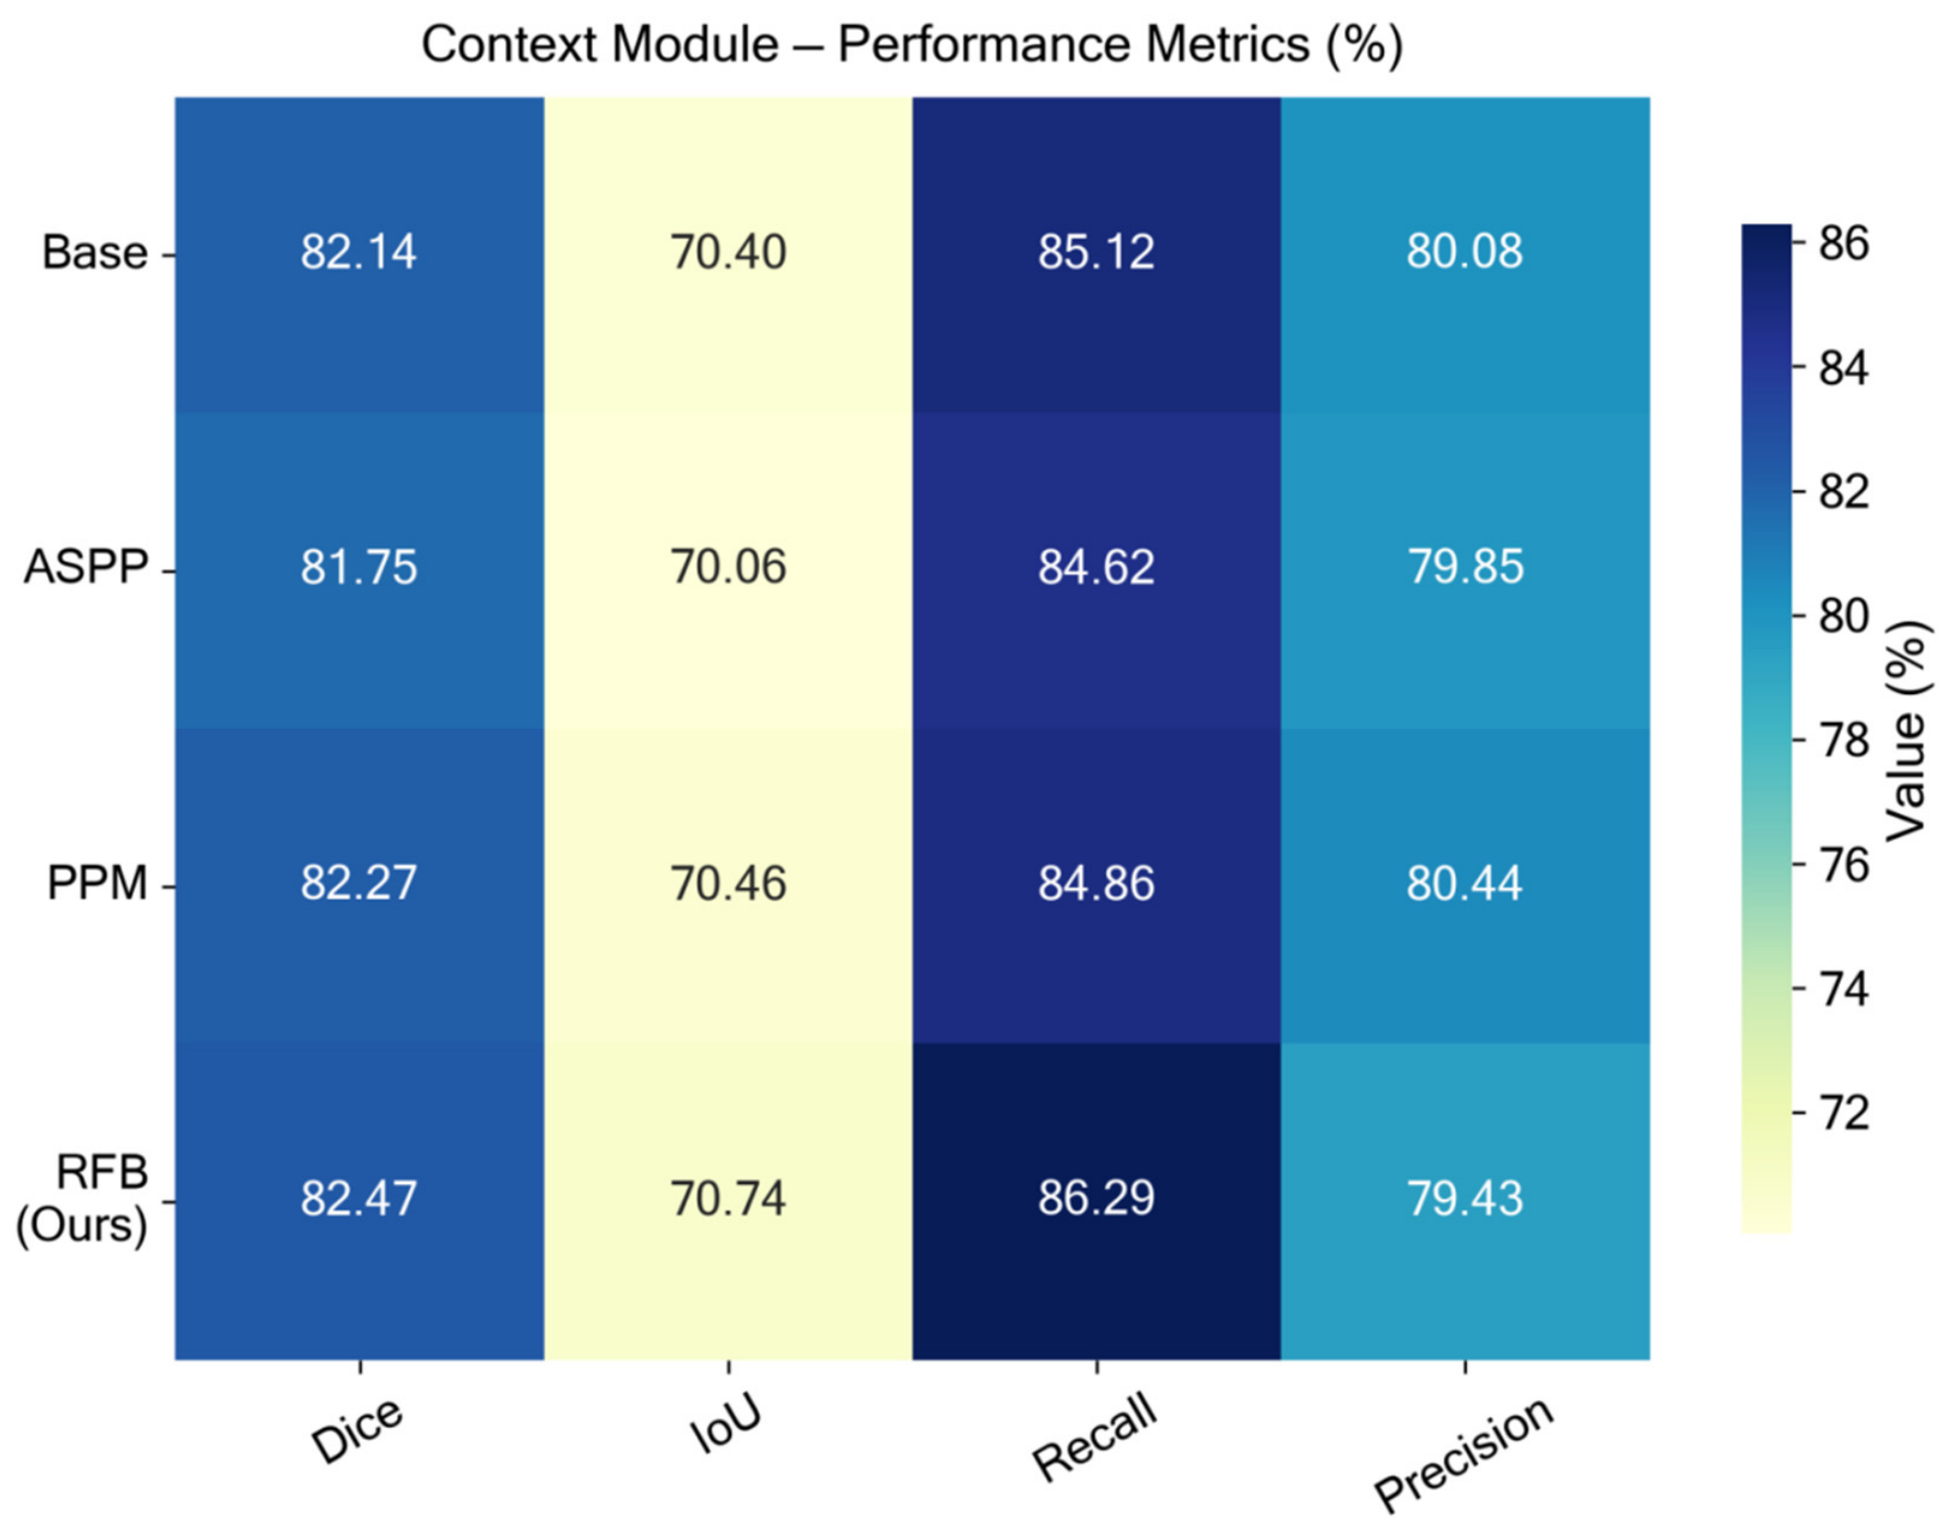
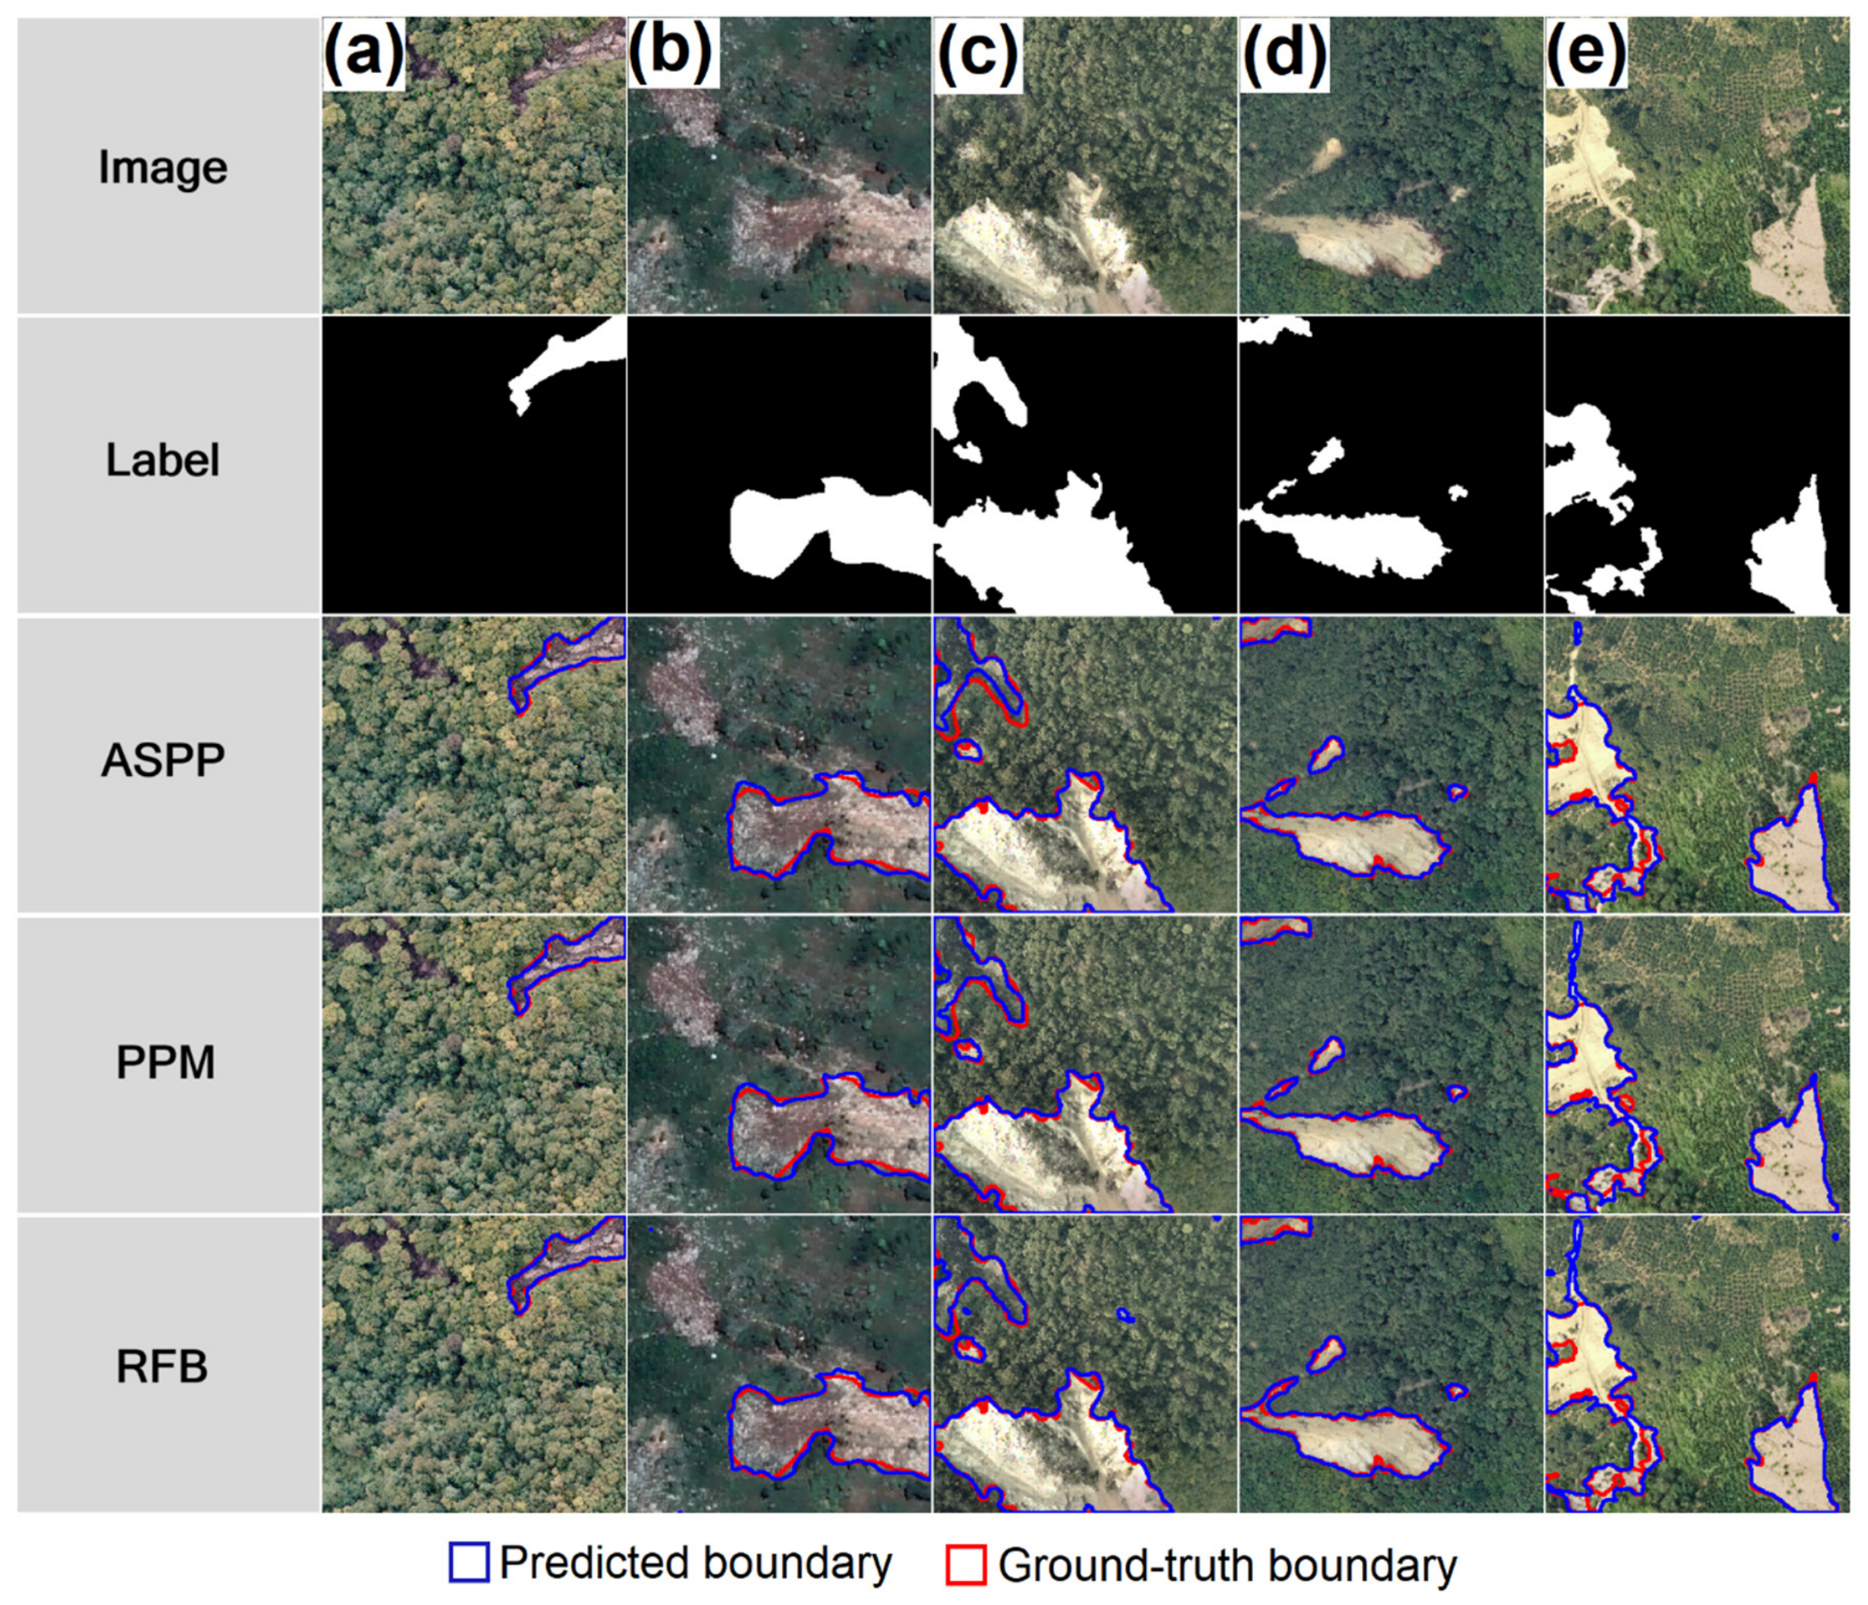
RFB outperformed ASPP and PPM on all primary segmentation metrics, achieving Dice 82.47% (+0.33 pp over base), IoU 70.74% (+0.34 pp), and the highest Recall of 86.29% (+1.17 pp), at a Precision cost of 0.66 pp, yielding a favorable Recall-to-Precision-cost ratio of 1.79:1 (Figure 8). ASPP degraded all four metrics relative to the base, attributable to scale mismatch: its large dilation rates (r = 6, 12, 18) generate receptive fields far exceeding typical landslide extents at 256 × 256 resolution. PPM improved Dice and IoU marginally but underperformed on Recall. Regression metrics remained invariant across all context configurations (Table 1; Figure 9). Notably, PPM achieved the best regression values (MAE 0.0194, R2 64.01%) despite inferior segmentation to RFB, demonstrating that low continuous prediction error does not guarantee high segmentation quality. A plausible explanation is that PPM produces smoother probability fields or low-amplitude halos around landslide margins, reducing average error while weakening the local boundary gradient and thereby lowering thresholded IoU/Dice. Boundary visualizations confirmed that RFB maintained contour integrity and suppressed scattered false positives that ASPP and PPM introduced in densely vegetated and large-area landslide scenes (Figure 10).

3.4. Attention Module Ablation

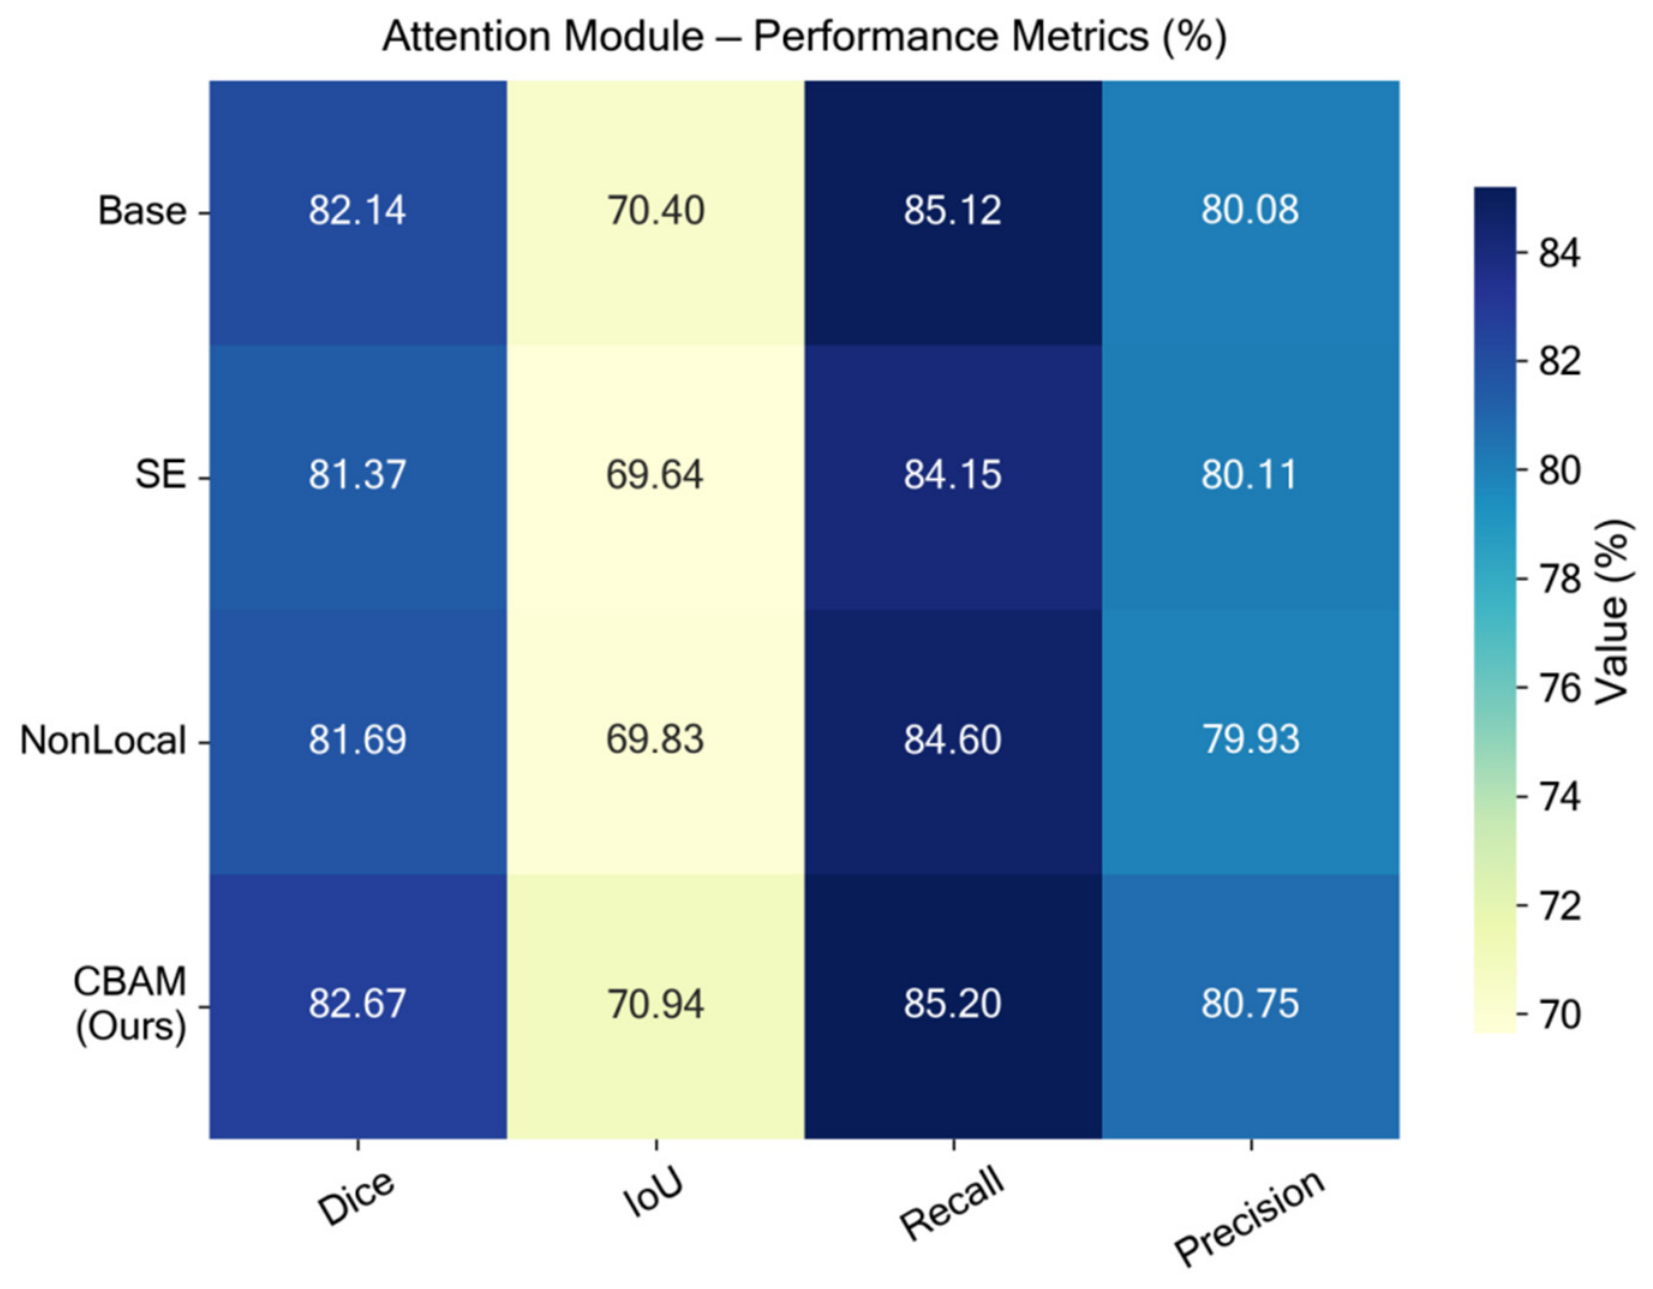
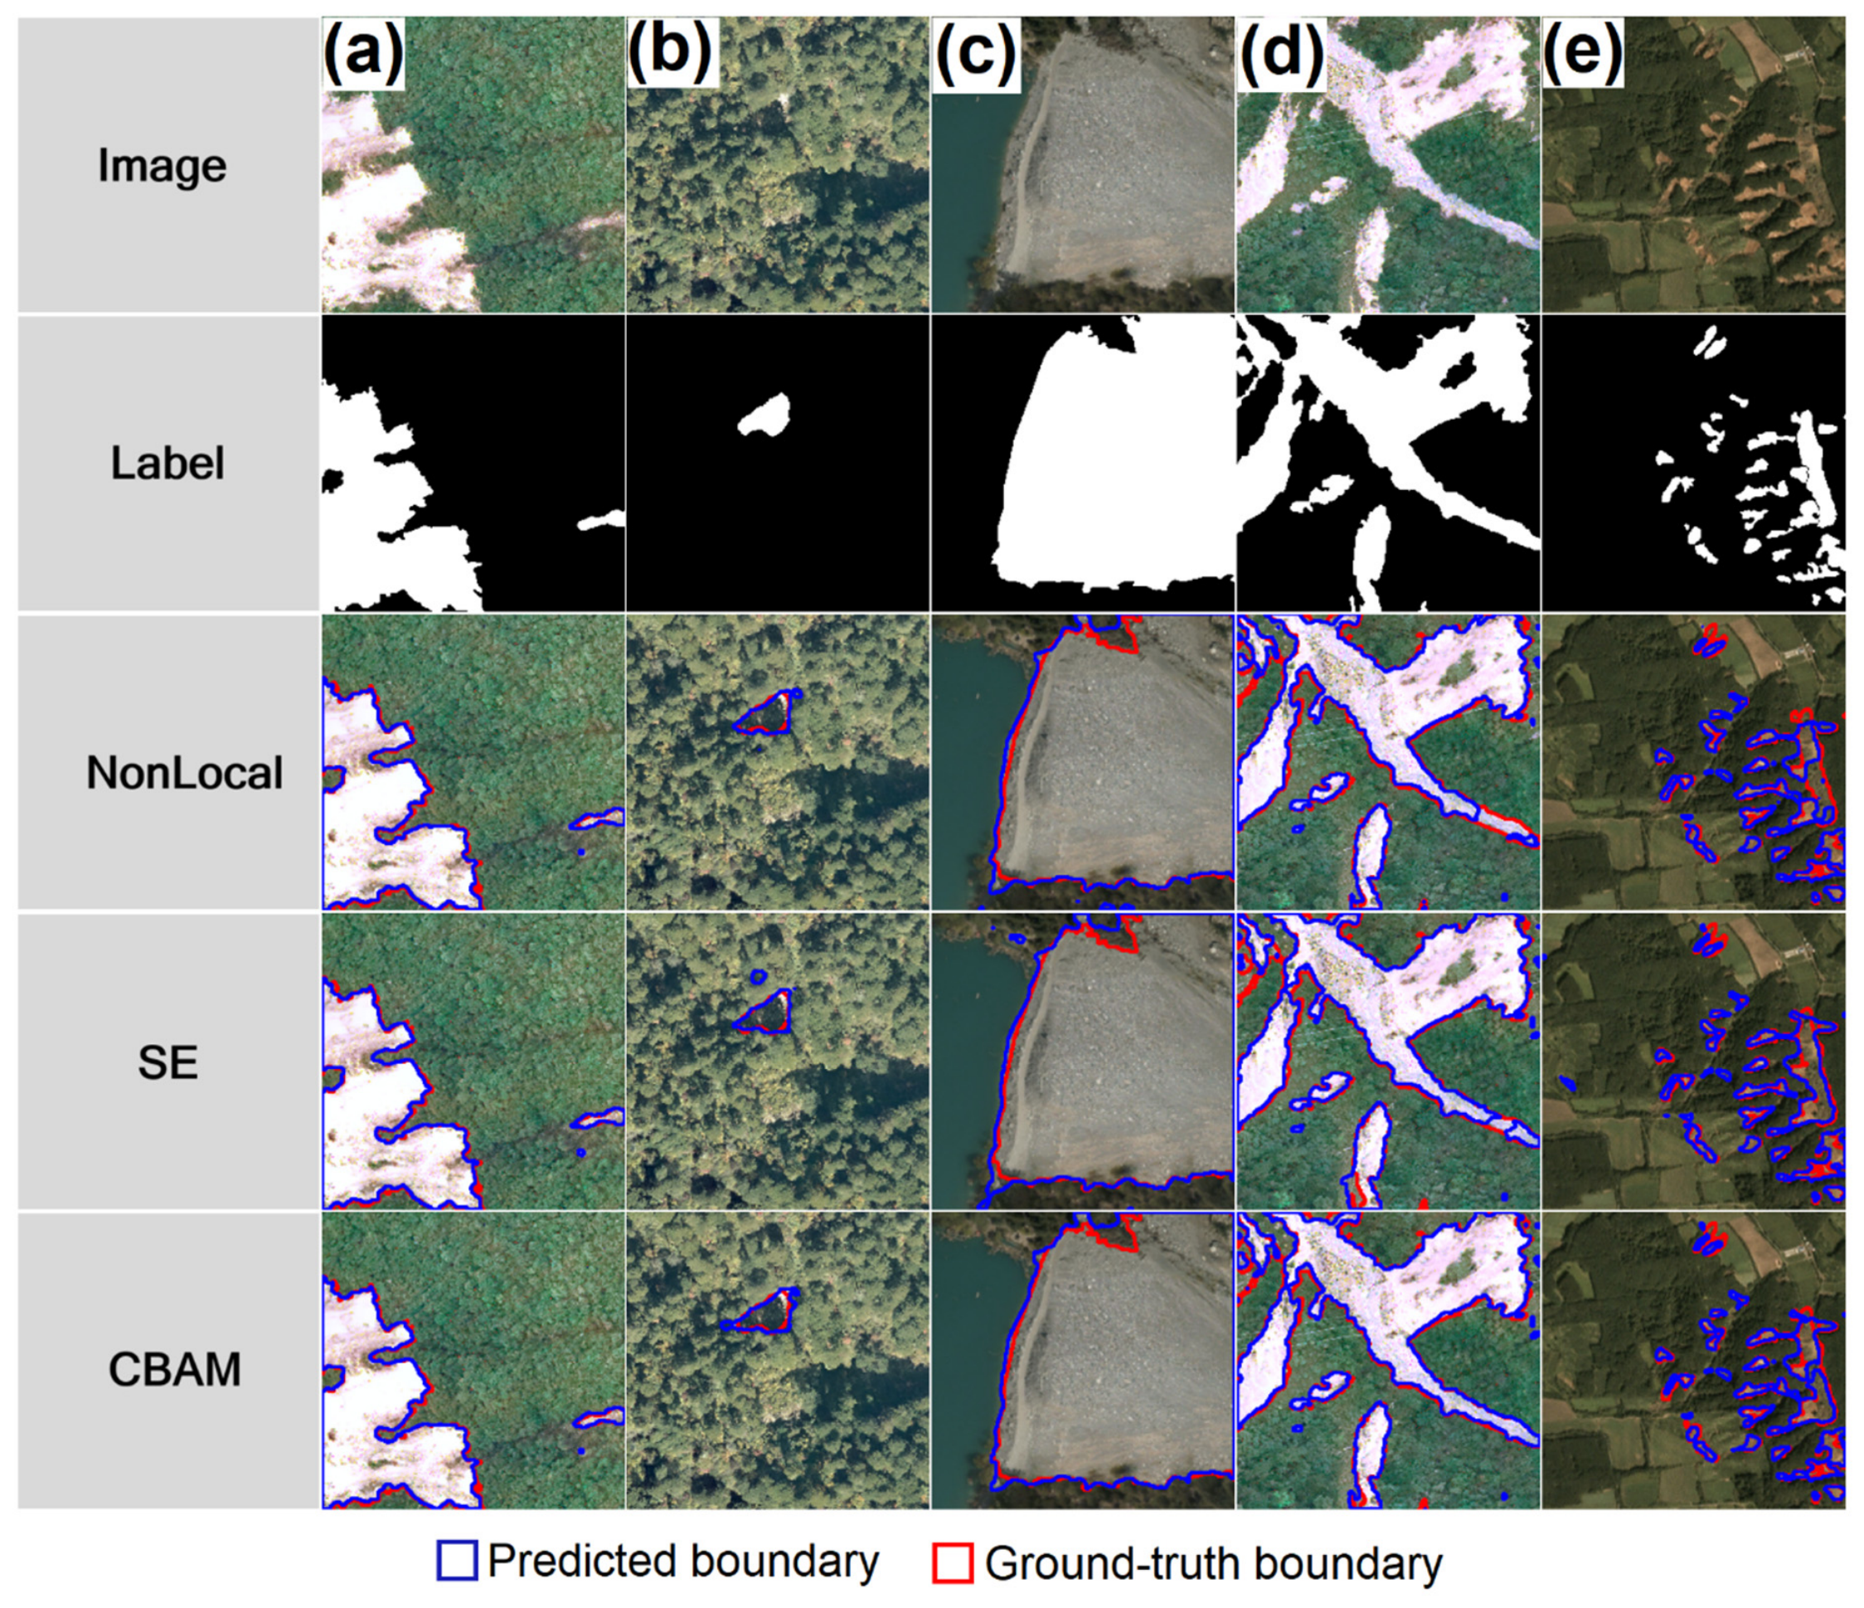
CBAM was the only attention mechanism to simultaneously improve all four segmentation metrics (Dice +0.53 pp, IoU +0.54 pp, Recall +0.08 pp, Precision +0.67 pp), with the +0.67 pp Precision gain representing the largest single-metric improvement attributable to any attention module (Figure 11). SE degraded Dice, IoU, and Recall, demonstrating that channel-only recalibration without spatial localization risks suppressing fine boundary details. Non-local attention remained below the base on Dice and IoU, limited by information dilution at high spatial resolutions due to its quadratic complexity. Regression metrics showed no significant differences across attention configurations (Table 1; Figure 12). Boundary visualizations confirmed that CBAM achieved the tightest contour overlap ( D b o u n d = 2.6 pixels versus Non-local 4.8 pixels and SE 3.9 pixels) and the most complete delineation of small fragmented targets, while SE and Non-local produced missed detections and disconnected fragments (Figure 13). Complementary boundary-distance diagnostics based on the average symmetric surface distance (ASSD) and the 95th-percentile Hausdorff distance (HD95) are provided in Supplementary Table S7.

3.5. Feature Fusion Module Ablation

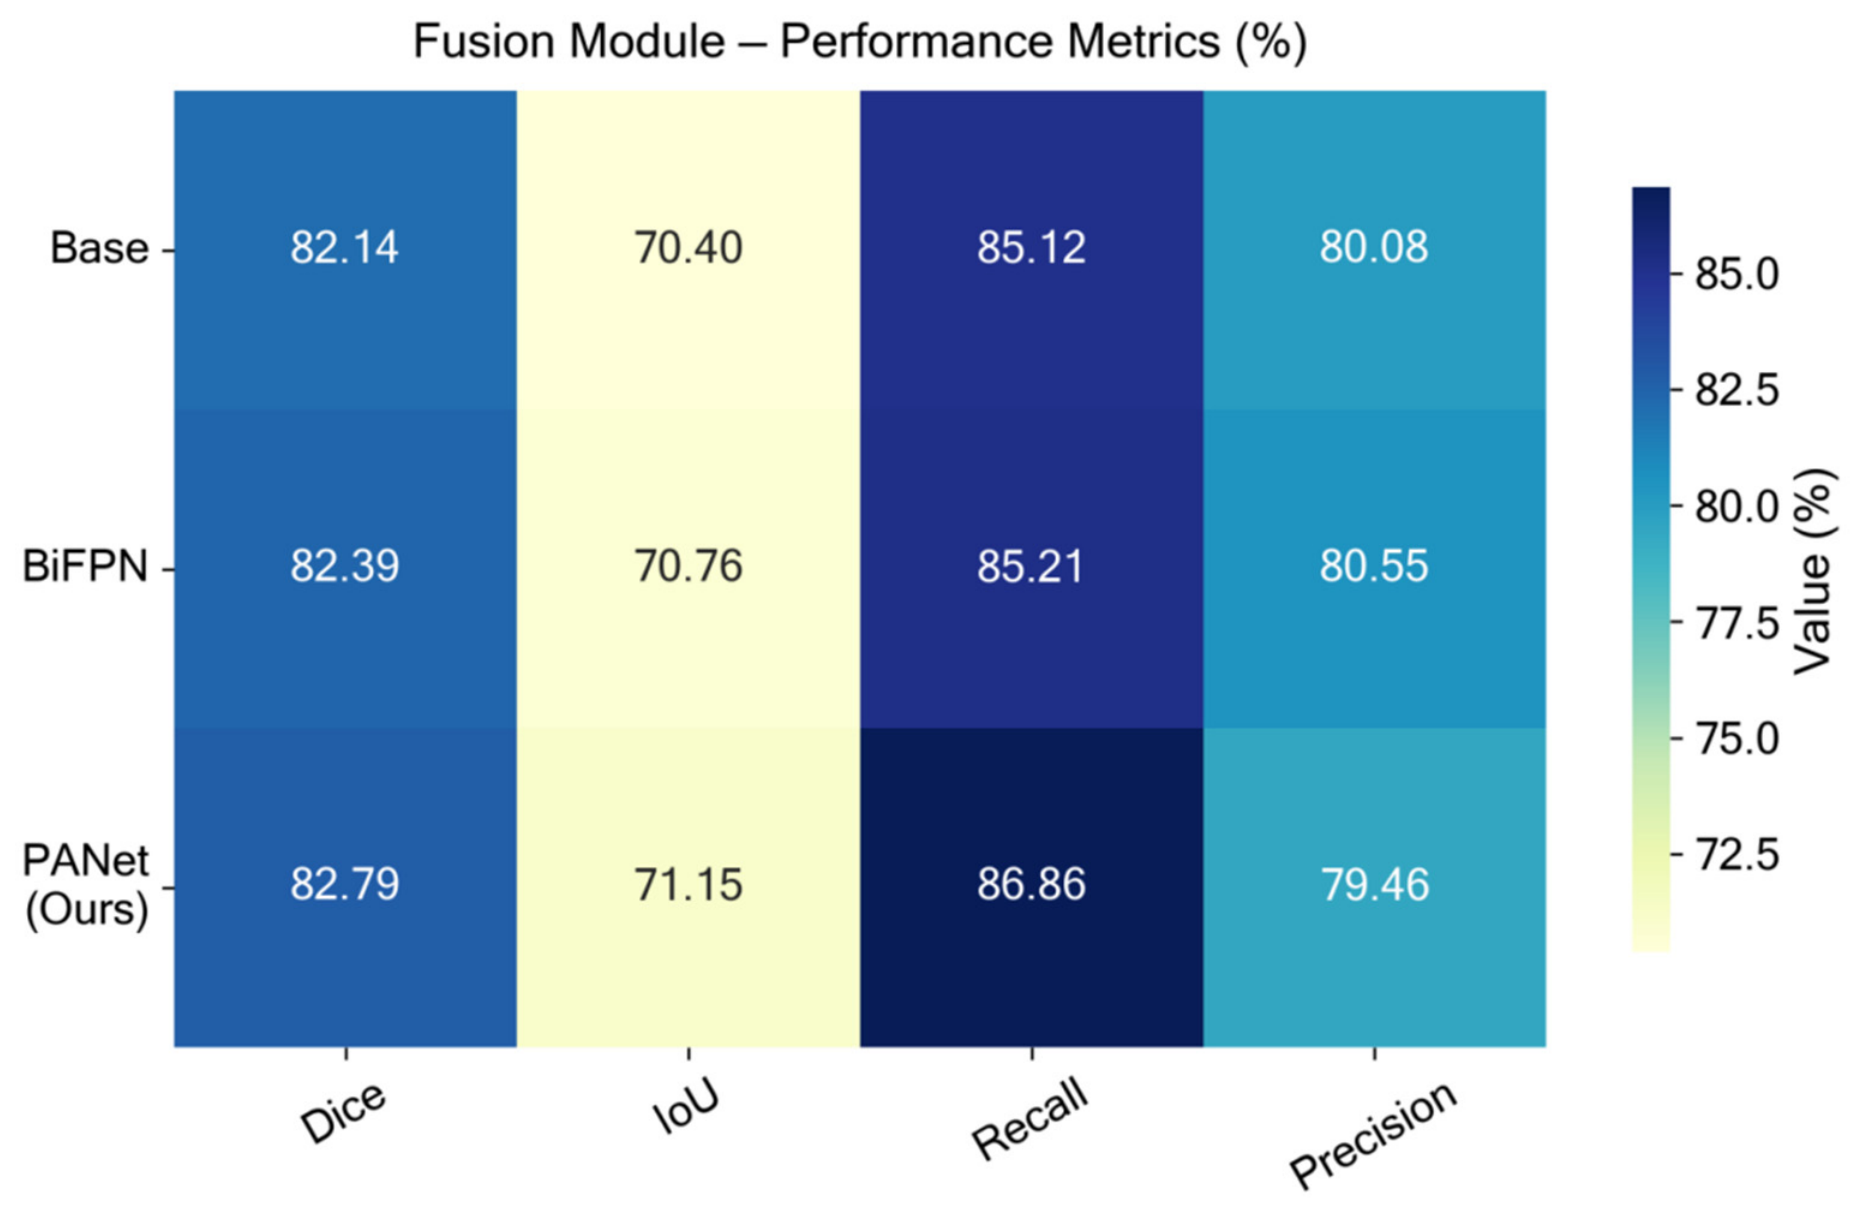
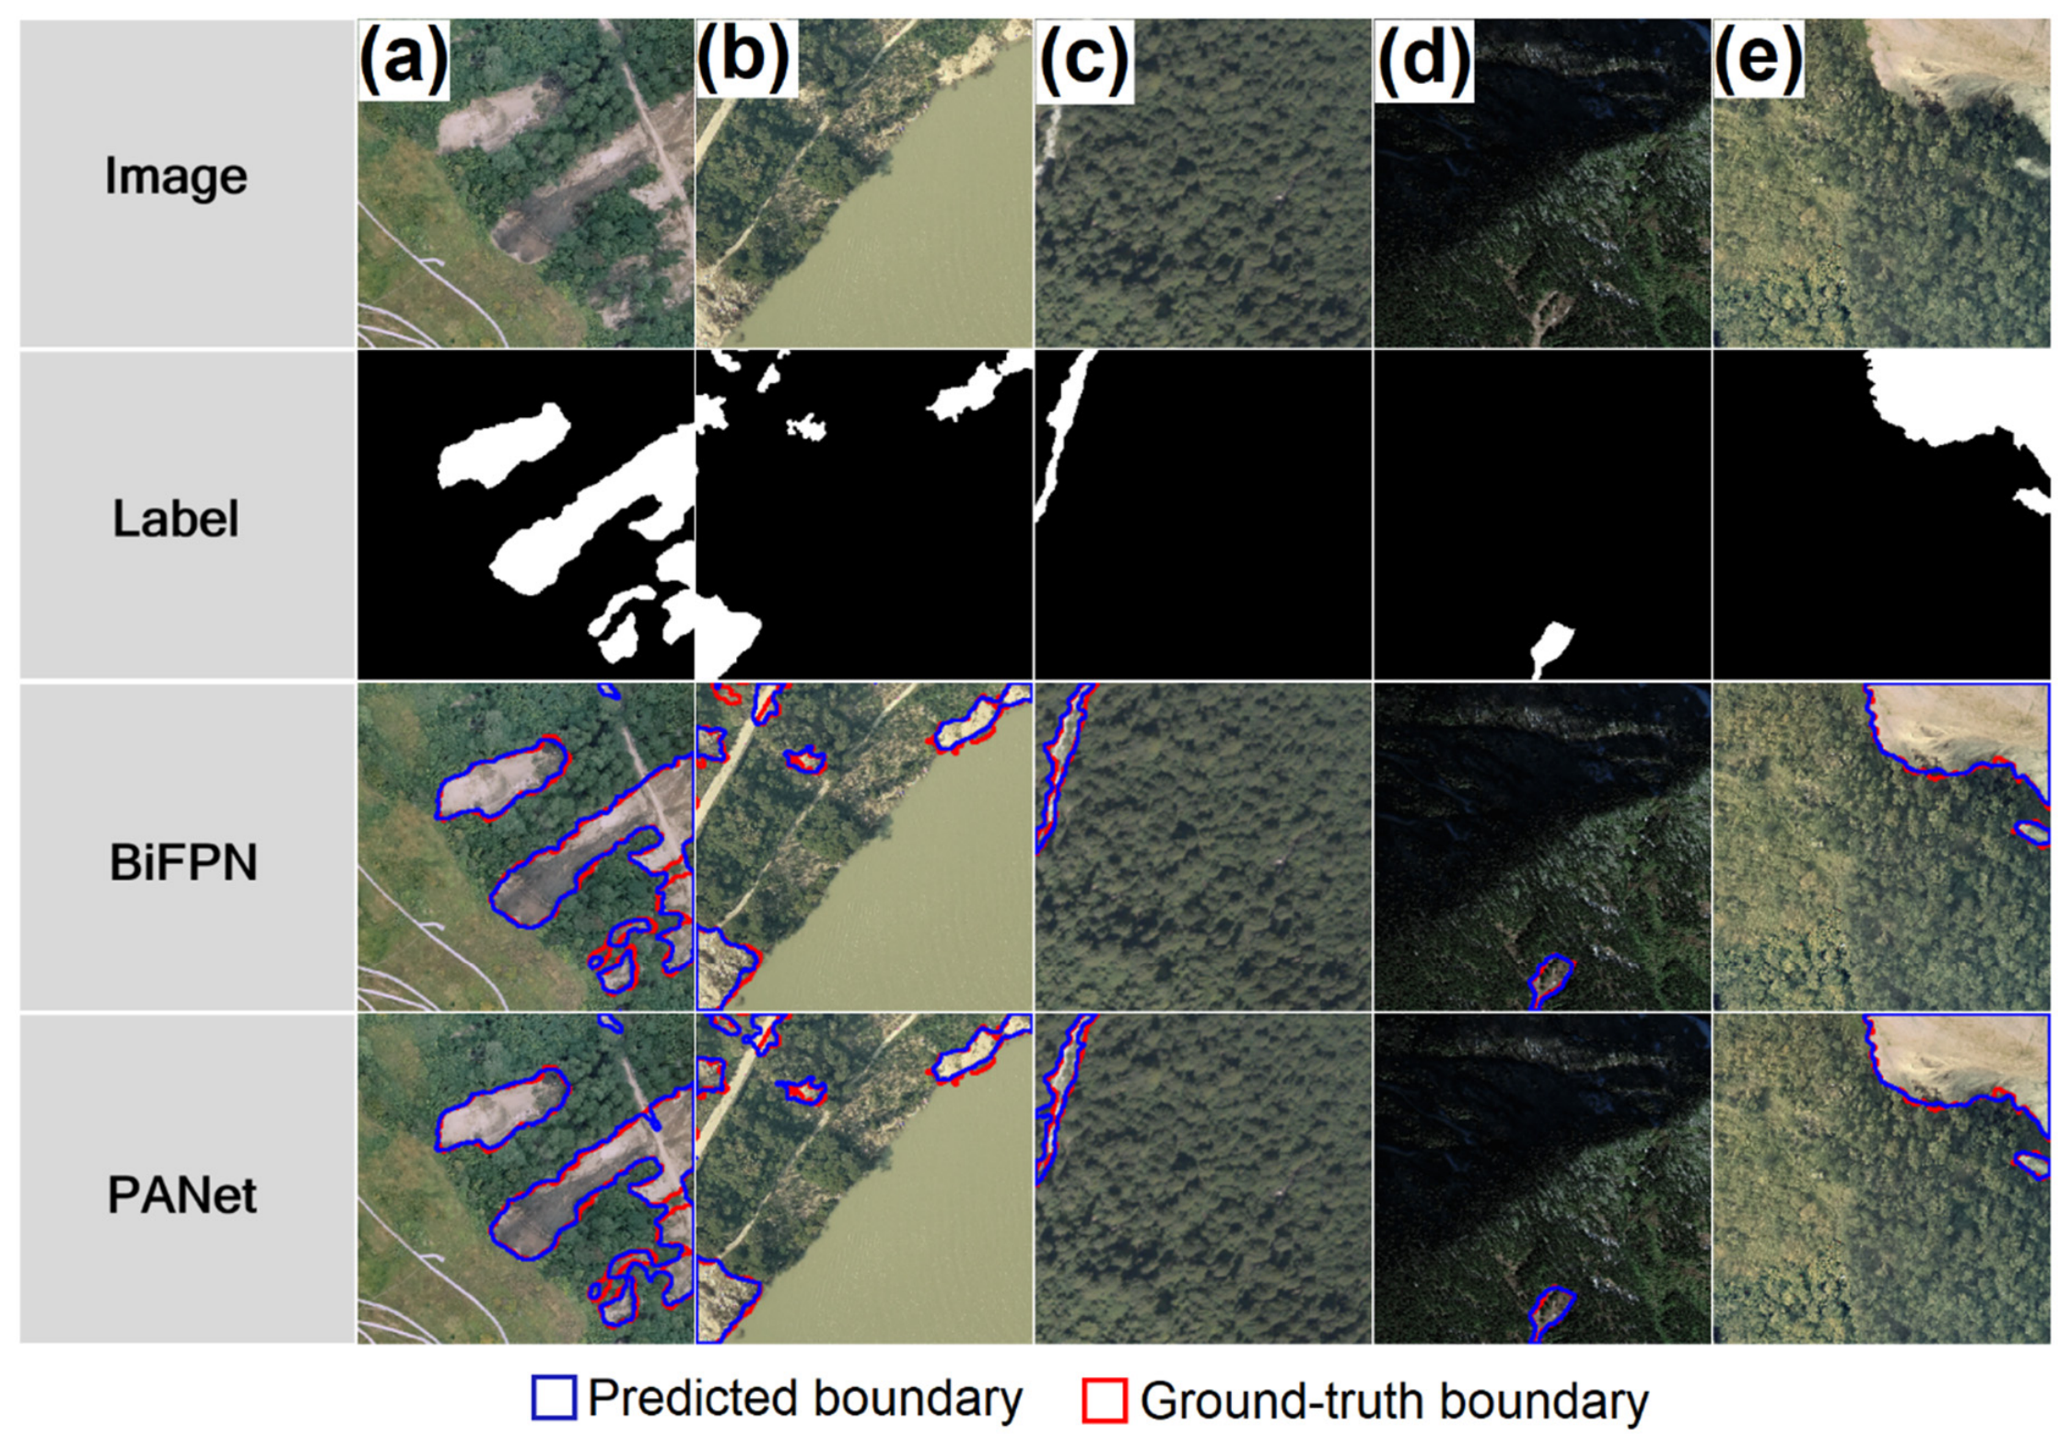
PANet delivered the largest single-module Recall improvement in the study (+1.74 pp to 86.86%), with IoU (+0.75 pp) and Dice (+0.65 pp) gains approximately 2.5 times those of BiFPN (Figure 14). BiFPN produced modest positive changes across all metrics, including Precision (+0.47 pp), whereas PANet followed a Recall-prioritized pattern with Precision declining 0.62 pp, yielding a Recall-to-Precision-cost ratio of 2.82:1. Regression metrics remained invariant across fusion configurations (Table 1; Figure 15), ruling out probability recalibration by PANet’s. Boundary visualizations showed that PANet preserved continuous boundary curves in fragmented and elongated structures, where BiFPN produced disconnected contour segments (Figure 16). The Precision cost manifested as localized boundary drift near true edges ( D b o u n d increasing from Base 2.8 to PANet 3.1 pixels, approximately 9.3 m at 3 m GSD) rather than widespread background false positives, rendering the trade-off operationally acceptable. Because ASSD and HD95 use different boundary-distance aggregation procedures, their complementary results are reported separately in Supplementary Table S7 and do not replace the original D b o u n d values.

3.6. Incremental Ablation and the See-Purify-Delineate Framework

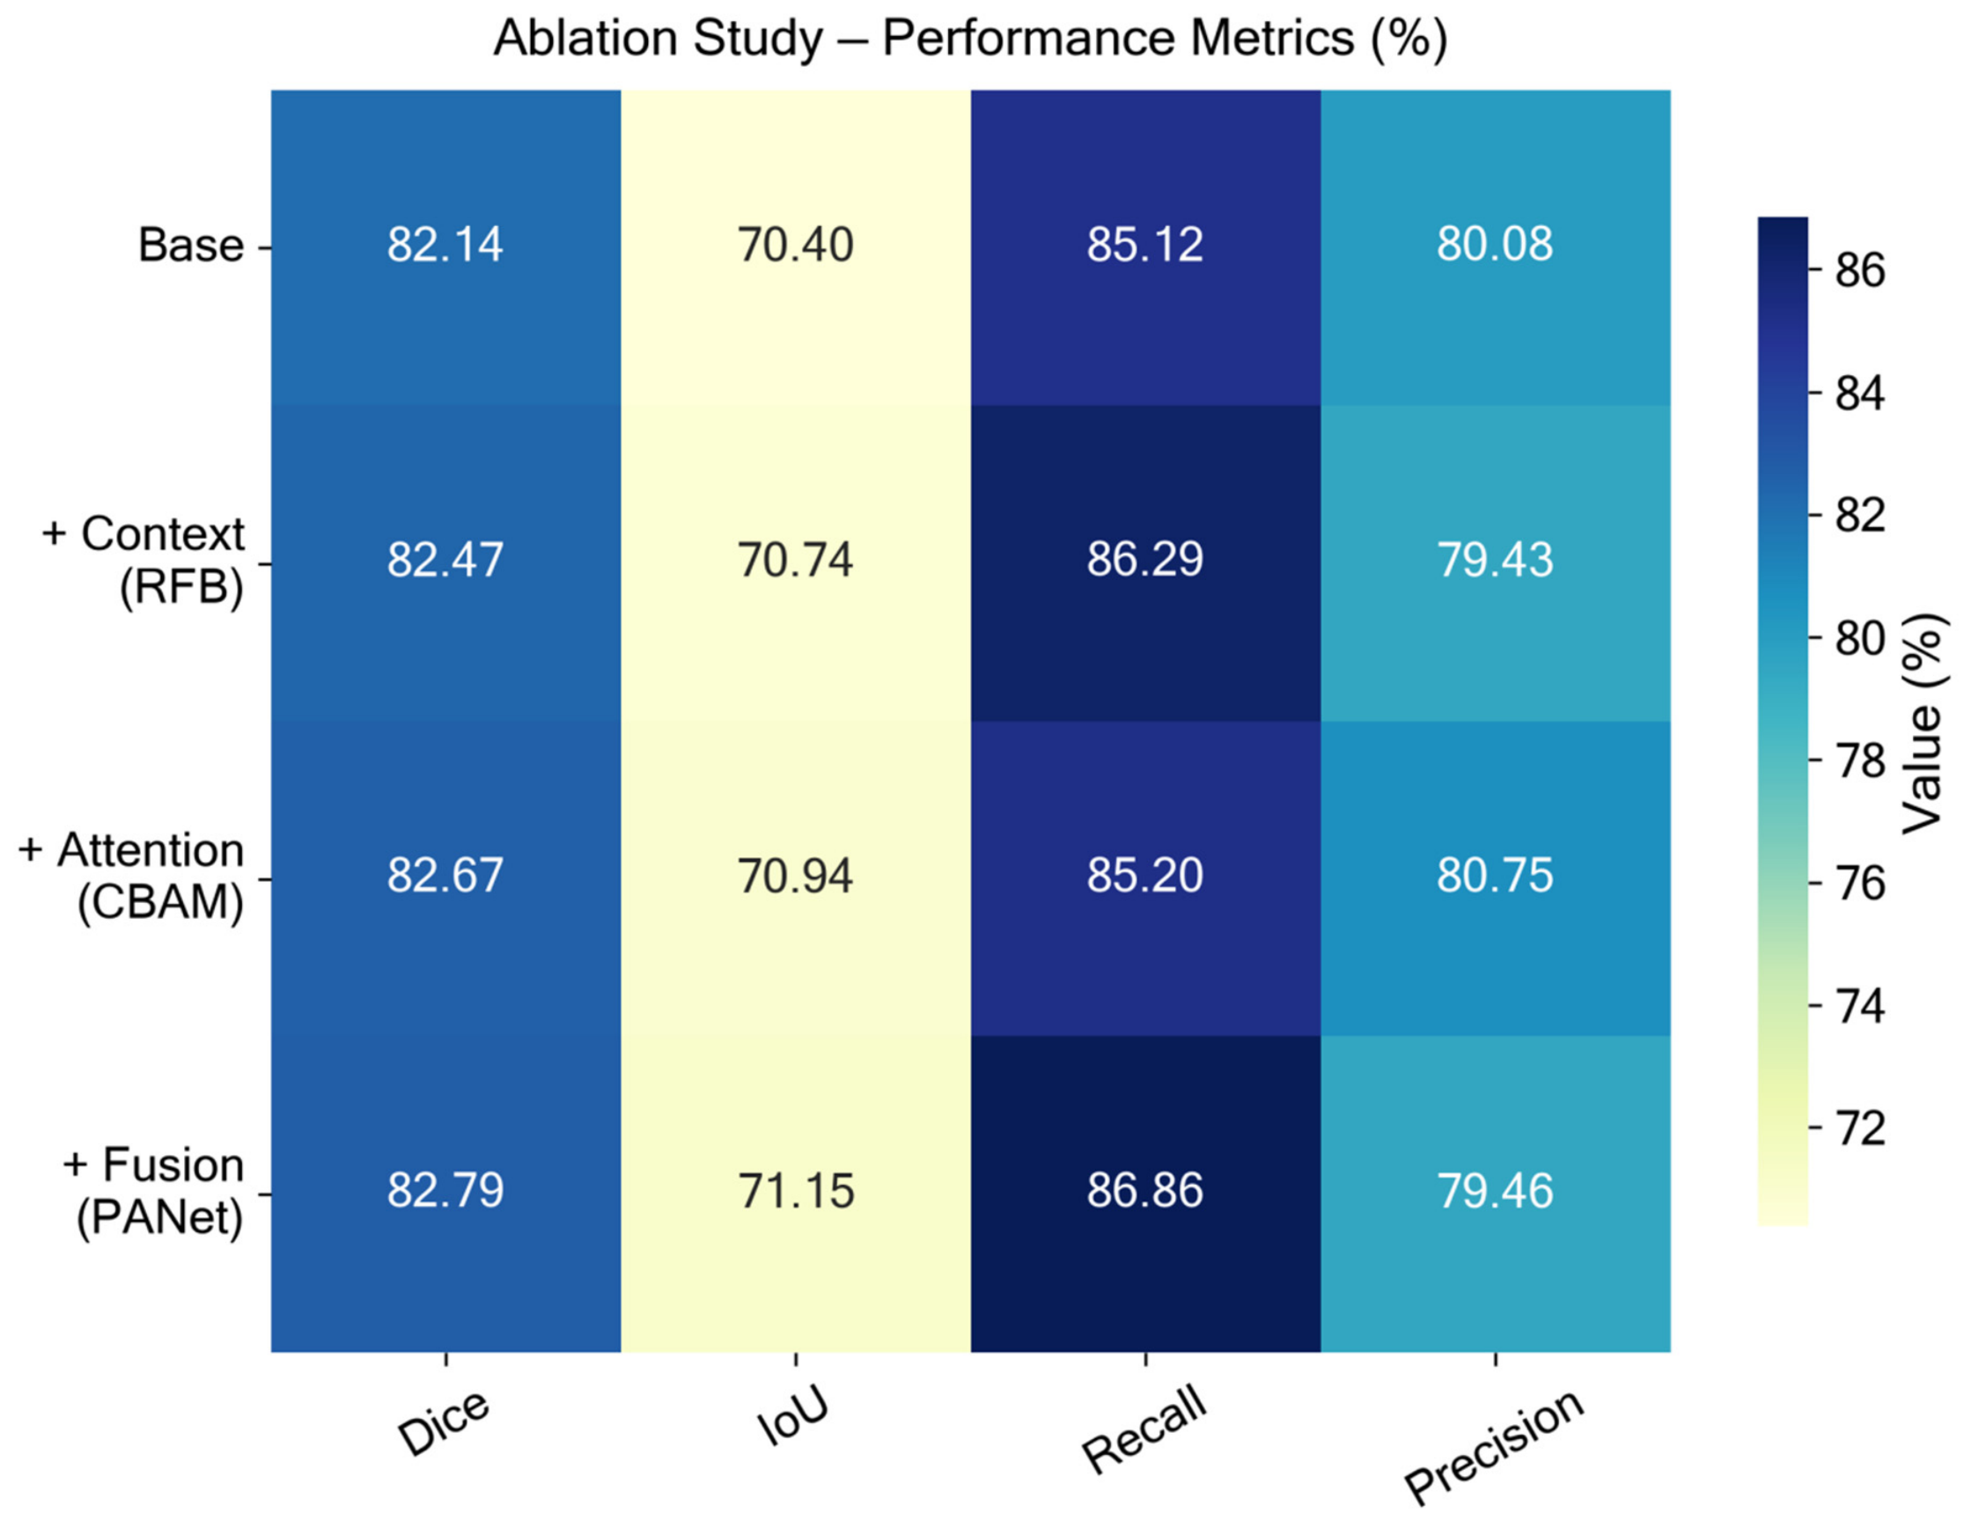
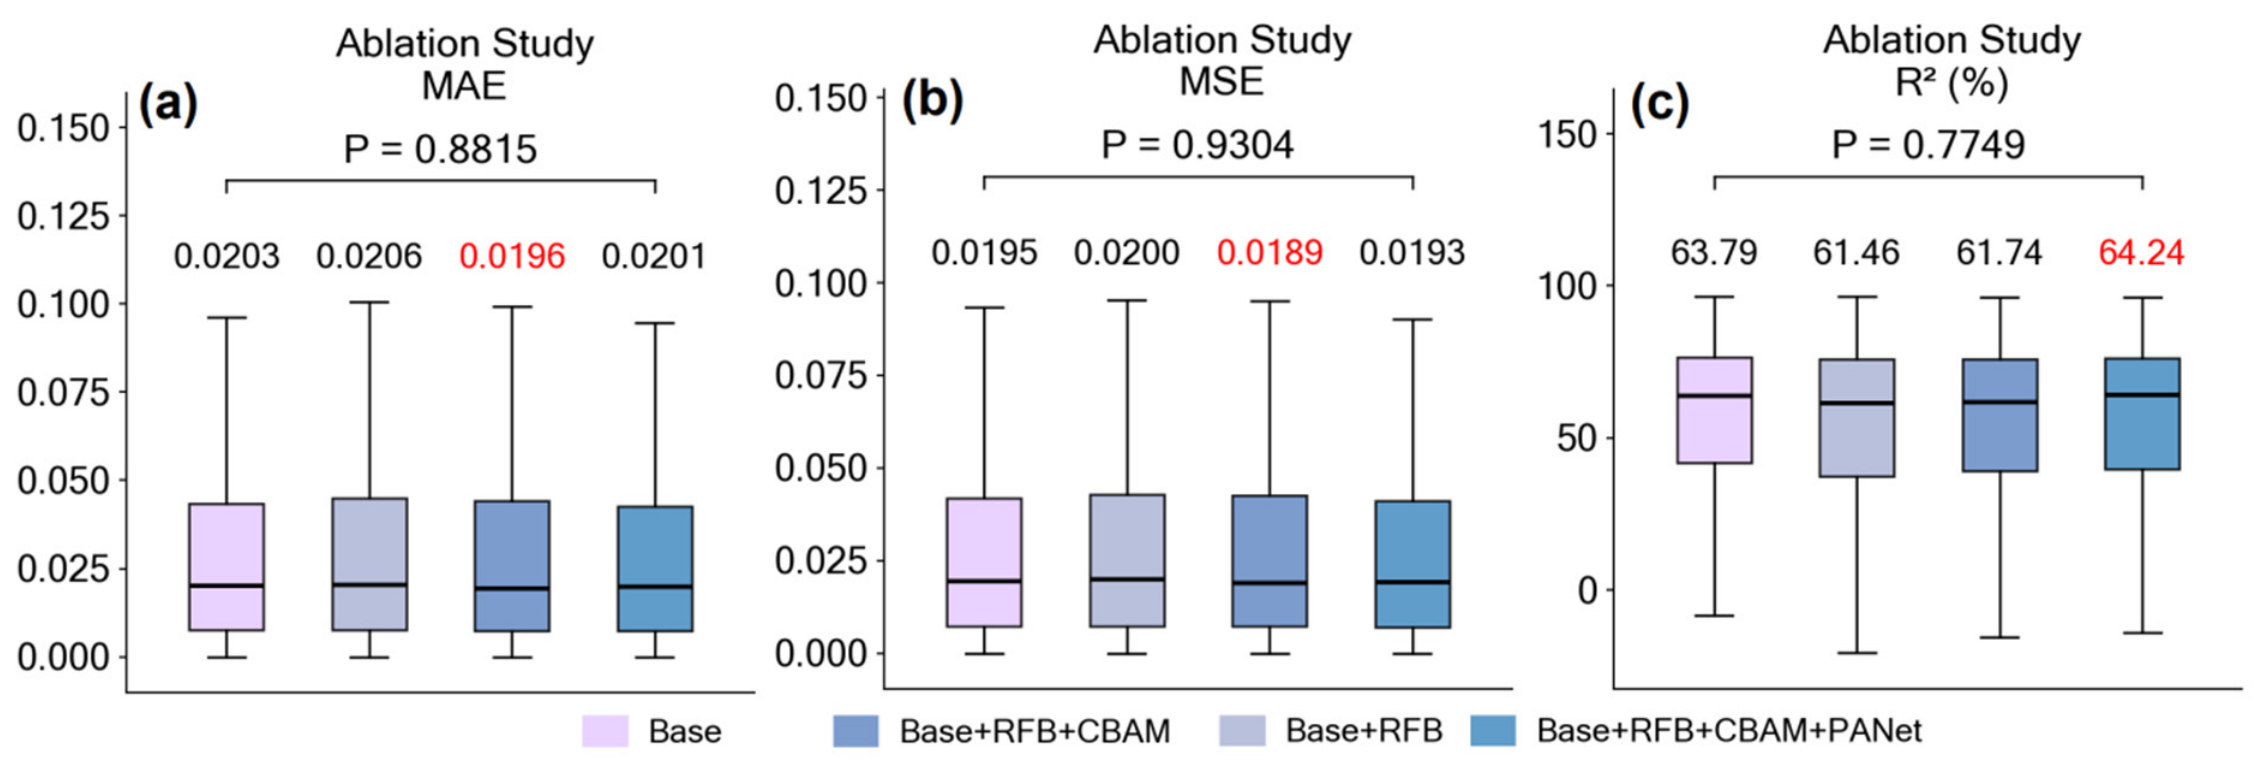
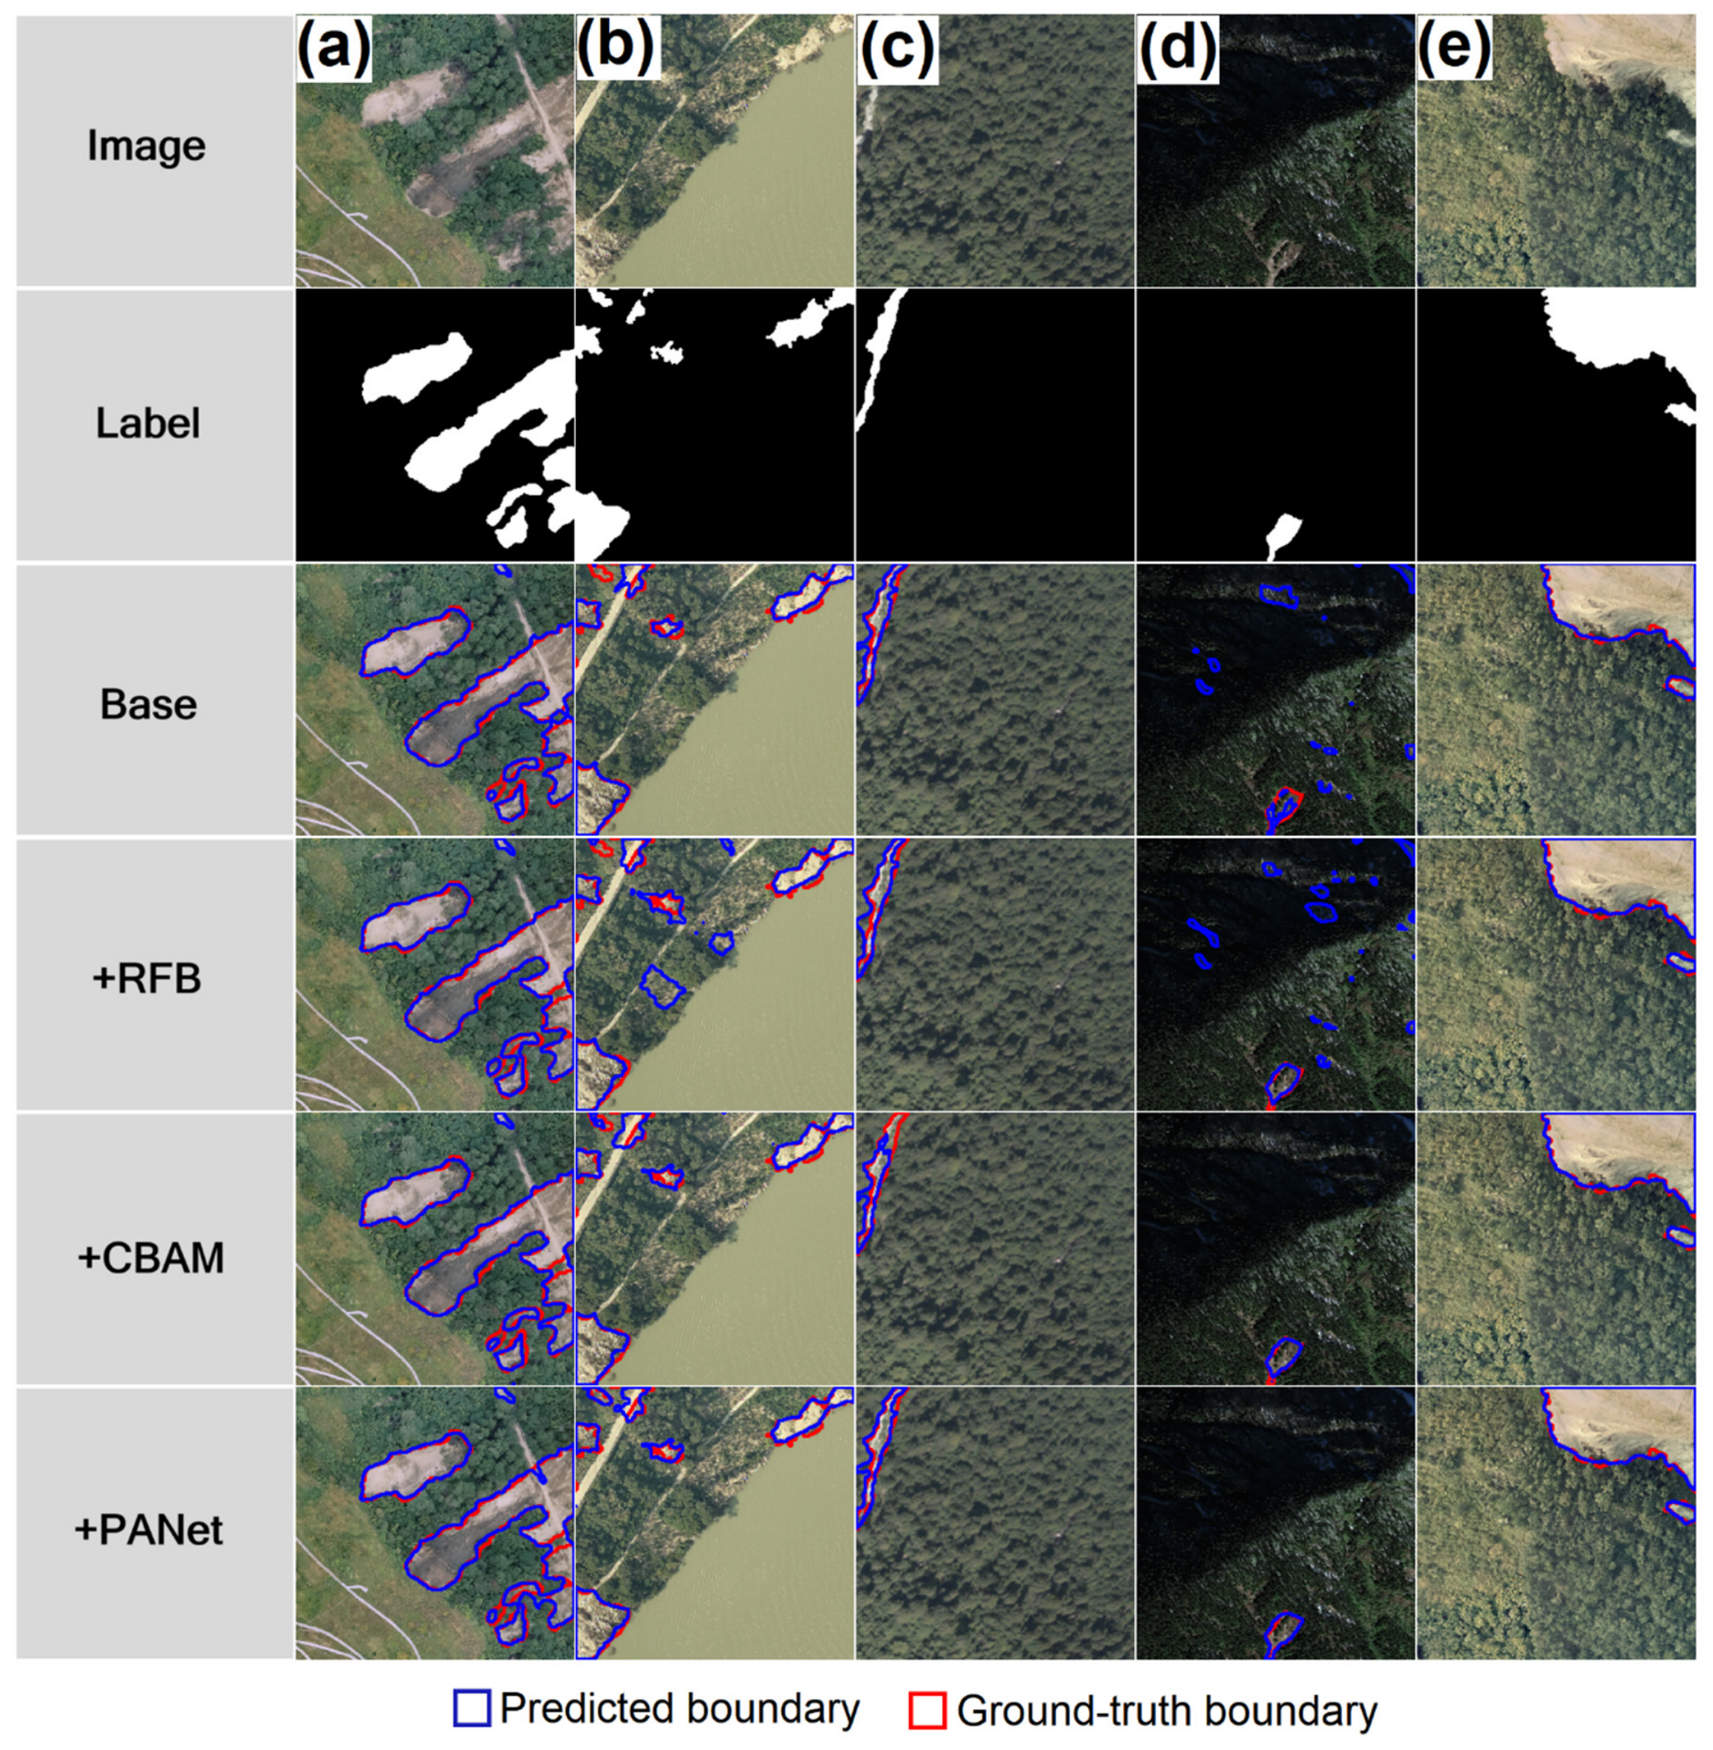
Sequential integration of RFB, CBAM, and PANet produced an oscillatory metric trajectory incompatible with simple additive contributions (Figure 17). Recall followed the progression from 85.12% (M0) to 86.29% (+1.17 pp, M1) to 85.20% (−1.09 pp, M2) to 86.86% (+1.66 pp, M3), while Precision mirrored this in antiphase, indicating each module addressed failure modes introduced or unresolved by its predecessor. Three distinct functional roles emerged: RFB expanded detection coverage through receptive-field enlargement, capturing peripherally occluded segments (+1.17 pp Recall) but introducing minor background noise (−0.65 pp Precision; Supplementary Figure S1); CBAM suppressed those false activations via spatial attention gating, recovering +1.32 pp Precision while preserving Recall (Supplementary Figure S2); and PANet restored multi-scale boundary integrity through bidirectional feature aggregation, reconnecting fragmented segments (+1.66 pp Recall, +0.75 pp IoU) at marginal Precision cost (−1.29 pp; Supplementary Figure S3). The full model achieved cumulative gains of Dice +0.65 pp, IoU +0.75 pp, and Recall +1.74 pp over the base, with an overall Recall-to-Precision-cost ratio of 2.82:1 aligned with hazard detection’s asymmetric risk calculus (Supplementary Figure S4). A separate two-seed CPU sensitivity analysis is provided in Supplementary Table S3; it is reported independently because its training budget differs from the primary experiment. Regression metrics remained invariant across all four incremental stages (MAE p = 0.8815, MSE p = 0.9304, R2 p = 0.7749; Figure 18), with MAE ranging only from 0.0196 to 0.0206 across stages, a 5% span substantially smaller than the 31% encoder-induced MAE span. Boundary contour evolution across five test samples visually confirmed the functional decomposition: the base model captured major landslide bodies but exhibited incomplete boundaries and scattered false positives; adding RFB expanded coverage to peripheral zones while introducing background noise; adding CBAM reduced false-positive fragments; and adding PANet yielded the best overall contour overlap with continuous delineation of thin and fragmented structures (Figure 19).

4. Discussion

4.1. Encoder Choice Produces the Largest Observed Performance Difference Among the Evaluated Backbones

The most consequential finding of this study is that encoder selection alone produced an 11.02 pp IoU advantage of EfficientNet-b4 over ResNet34 (Figure 5), exceeding the cumulative contribution of all three downstream modules (RFB +0.34, CBAM +0.54, PANet +0.75; total +1.63 pp) by nearly sevenfold. This controlled conclusion applies to the evaluated U-Net configurations; ResU-Net, DeepLabV3+, FPN-family, and Transformer-based systems require unified benchmarking before direct quantitative comparison.
A plausible explanation lies in EfficientNet-b4’s compound scaling, which jointly balances depth, width, and resolution through neural-architecture-searched coefficients [21], together with MBConv blocks that enlarge the effective receptive field per parameter. This co-scaling of semantic capacity and spatial precision matches the demands of coseismic landslides, whose broad size distribution and heterogeneous land cover require multi-scale recognition. More specifically, irregular boundaries, thin runout paths, narrow source–deposit connections, and fragmented scars may be spatially diluted by early downsampling, whereas inverted-residual MBConv processing may preserve these high-frequency structures more effectively. This interpretation remains a mechanistic hypothesis that requires dedicated feature-visualization analysis for causal verification. EfficientNet-b4 also delivers approximately 3.7 IoU points per million encoder parameters versus 2.8 for ResNet34, making it both the most accurate and the most efficient backbone among those evaluated, an advantage of practical importance when post-earthquake inference must operate under limited computational resources. Practitioners should therefore establish a strong encoder baseline before adding modules whose additional complexity is justified by specific operational requirements.

4.2. Regression-Metric Invariance as a Diagnostic for Genuine Architectural Merit

The statistical decoupling between classification metrics (Dice/IoU/Recall/Precision improving with modules) and regression metrics (MAE/MSE/R2 invariant across all module ablations, p > 0.26) provides the first empirical demonstration in landslide deep learning that segmentation gains can occur without improvements in probabilistic scene understanding. This challenges the implicit assumption that architectures producing better Dice necessarily “understand landslides better” [14,15], revealing instead that modules sharpen decision boundaries without altering the underlying probability distribution.
The distinction matters operationally: decision-boundary refinements are threshold-sensitive and potentially dataset-specific, while genuine probability-level improvements should generalize across decision thresholds and geographic domains. The supplementary threshold sweep (Table S8) was used only as a sensitivity check; all principal quantitative results remain reported at τ = 0.5. We propose that future ablation studies adopt a dual-metric protocol: co-report classification metrics (Dice, IoU) and regression metrics (MAE, R2) with statistical testing for both. Modifications improving classification while leaving regression invariant operate at the decision level (legitimate but threshold-dependent); those improving both operate at the probability level (more fundamental and generalizable). This protocol requires negligible computational cost and provides mechanistic information that neither metric family alone supplies.

4.3. The See–Purify–Delineate Logic as a Mechanistic Design Heuristic and Its Limitations

The compositional effects of RFB, CBAM, and PANet were interpreted as see (expanding coverage), purify (suppressing noise), and delineate (restoring boundaries). The oscillatory metric trajectory (Figure 17) reflected targeted responses to different failure modes: RFB expanded detection coverage (+1.17 pp Recall) but introduced minor background noise (−0.65 pp Precision); CBAM suppressed part of that noise through spatial attention gating, recovering +1.32 pp Precision; and PANet improved boundary recovery through bidirectional feature aggregation (+1.66 pp Recall and +0.75 pp IoU) at a marginal Precision cost (−1.29 pp). This interpretation is limited to the present controlled ablation and should not be treated as a universal prescription for module stacking.
This logic may also be relevant to geohazard detection tasks involving spatially sparse targets, complex backgrounds, asymmetric misclassification costs, and multi-scale morphologies, such as flood-extent mapping [26] and post-disaster building-damage assessment [27]. However, the complete context–attention–fusion stack increases model capacity and computational cost (Supplementary Table S4) and may overfit small or geographically homogeneous datasets. Future studies should therefore begin with a strong backbone, diagnose specific failure modes, introduce modules incrementally, and retain them only when repeated runs and spatially independent validation demonstrate consistent benefits.

4.4. Comparison with Contemporary Benchmarks

The full model (Dice 82.79%, IoU 71.15%, Recall 86.86%) surpasses recent benchmarks on globally distributed data. Cross-study comparison should be made cautiously because published landslide benchmarks differ substantially in trigger type, spatial resolution, sensor composition, and geographic scope; for example, Landslide4Sense established a 3799-patch multisource benchmark with 11 evaluated baselines, whereas GDCLD spans nine coseismic events and multiple high-resolution sensors [16,18]. However, these results were obtained on regionally concentrated benchmarks, whereas our gains were achieved on GDCLD spanning nine events across four continents without ensembling or test-time augmentation. Earlier studies showed 15–25 pp performance drops when crossing geographic regions [17]; the consistency across diverse test scenes indicates promising cross-region robustness within the GDCLD benchmark; however, broader validation across independent landslide datasets and triggering mechanisms is required before claiming operational generalization. The additional local audit could not reconstruct per-event/per-continent groupings because those identifiers were not preserved, and this is now stated explicitly.

4.5. Limitations and Research Priorities

Three boundary conditions constrain generalizability. GDCLD is exclusively coseismic; rainfall-induced, snowmelt-driven, and anthropogenic landslides exhibit distinct morphologies, and whether the see–purify–delineate logic transfers across triggers remains untested. Systematic evaluation on Landslide4Sense, HR-GLDD, and the CAS Landslide Dataset is still needed, because these benchmarks differ in trigger composition, sensor modality, and annotation strategy; notably, HR-GLDD contains both five rainfall-triggered and five earthquake-triggered events rather than being rainfall-dominated [28,29]. A verified event-level manifest should also be retained in future experiments to enable per-event and per-continent reporting. Only optical RGB imagery was used; topographic features (DEM slope, aspect, curvature) and multispectral bands provide complementary discriminative power [30,31] and could address residual false detections on terraced farmland (Figure 7d).

5. Conclusions

This study shows that encoder choice, rather than lightweight modular refinement, was the dominant source of performance variation among the evaluated U-Net configurations for coseismic landslide segmentation. EfficientNet-b4 improved IoU by 11.02 percentage points over ResNet34—nearly seven times the cumulative gain of RFB, CBAM, and PANet—while the full model achieved 82.79% Dice, 71.15% IoU, and 86.86% Recall. The modules nevertheless provided complementary improvements in contextual coverage, noise suppression, and boundary recovery, supporting the proposed “see–purify–delineate” mechanism; however, the absence of statistically significant differences in MAE, MSE, and R2 suggests that these gains arose mainly from decision-boundary refinement rather than substantial probability-map changes. These findings support an encoder-first, failure-mode-driven strategy: emergency mapping agencies may use the EfficientNet-b4 baseline for rapid human-supervised screening and apply the full refinement model selectively to prioritized hotspots for detailed delineation and analyst review. This conclusion is limited to the evaluated U-Net architectures and the GDCLD setting; event-held-out testing, external-dataset validation, local threshold assessment, and expert review remain necessary before operational deployment.

6. Patents

No patents resulted from the work reported in this manuscript.

Supplementary Materials

The following supporting information can be downloaded at: https://www.mdpi.com/article/10.3390/rs18162727/s1, Figure S1: RFB Delta Gains; Figure S2: CBAM Delta Gains; Figure S3: PANet Delta Gains; Figure S4: Full Model Delta Gains; Table S1: Audited patch composition and class balance; Table S2: Operational all-patch evaluation including all-zero ground-truth masks; Table S3: Two-seed CPU sensitivity analysis under the shortened 100-epoch verification protocol; Table S4: Computational complexity and CPU inference efficiency at 256 × 256 input and batch size 1; Table S5: Native patch dimensions and binary-mask audit; Table S6: Paired per-patch sensitivity diagnostics averaged across seeds 42 and 52; Table S7: Additional ASSD and HD95 boundary-distance sensitivity diagnostics; Table S8: Threshold-sensitivity summary for the all-patch evaluation.

Author Contributions

Conceptualization, P.K. and Q.X.; methodology, P.K. and S.K.; software, S.K.; validation, Y.H., Z.Y. and C.P.; formal analysis, S.K. and P.K.; investigation, P.K., S.K. and H.L.; resources, Q.X. and H.L.; data curation, S.K. and Y.H.; writing—original draft preparation, P.K. and S.K.; writing—review and editing, P.K., Q.X., C.P. and H.L.; visualization, S.K. and Z.Y.; supervision, P.K. and Q.X.; project administration, P.K.; funding acquisition, Q.X. and P.K. All authors have read and agreed to the published version of the manuscript.

Funding

This research was funded by the Sichuan Science and Technology Program, grant numbers 2025YFNH0004 and 2025ZNSFSC1206, and the Chengdu University of Technology Postgraduate Innovative Cultivation Program, grant number 2025BICX-LS011.

Institutional Review Board Statement

Not applicable.

Informed Consent Statement

Not applicable.

Data Availability Statement

The Globally Distributed Coseismic Landslide Dataset is publicly available at https://zenodo.org/records/13612636 (accessed on 6 August 2026). Training code, pretrained model weights, and inference scripts will be released by the corresponding author upon reasonable request.

Acknowledgments

The authors gratefully acknowledge C. Fang, X. Fan, and co-authors for making the Globally Distributed Coseismic Landslide Dataset (GDCLD) publicly available through Zenodo, which was essential to this study. During the preparation of this manuscript, the authors used ChatGPT (OpenAI, GPT-5.5 Thinking) for language polishing and formatting assistance. The authors have reviewed and edited the output and take full responsibility for the content of this publication.

Conflicts of Interest

The authors declare no conflicts of interest. The funders had no role in the design of the study; in the collection, analyses, or interpretation of data; in the writing of the manuscript; or in the decision to publish the results.

Abbreviations

The following abbreviations are used in this manuscript:
ASPPAtrous Spatial Pyramid Pooling
BiFPNBidirectional Feature Pyramid Network
CBAMConvolutional Block Attention Module
CNNConvolutional Neural Network
CVPRConference on Computer Vision and Pattern Recognition
DEMDigital Elevation Model
GDCLDGlobally Distributed Coseismic Landslide Dataset
IoUIntersection over Union
MAEMean Absolute Error
MSEMean Squared Error
PANetPath Aggregation Network
PPMPyramid Pooling Module
RFBReceptive Field Block
RGBRed-Green-Blue
SESqueeze-and-Excitation
UAVUnmanned Aerial Vehicle
U-NetU-shaped Convolutional Network
R2Coefficient of determination

References

  1. Xu, Q.; Fan, X.; Huang, R.; van Westen, C.J. Landslide dams triggered by the Wenchuan Earthquake, Sichuan Province, South West China. Bull. Eng. Geol. Environ. 2009, 68, 373–386. [Google Scholar] [CrossRef] [Scilit]
  2. Fan, X.; Scaringi, G.; Korup, O.; West, A.J.; van Westen, C.J.; Tanyaş, H.; Hovius, N.; Hales, T.C.; Jibson, R.W.; Allstadt, K.E.; et al. Two multi-temporal datasets that track the enhanced landsliding after the 2008 Wenchuan earthquake. Earth Syst. Sci. Data 2019, 11, 35–55. [Google Scholar] [CrossRef] [Scilit]
  3. Roback, K.; Clark, M.K.; West, A.J.; Zekkos, D.; Li, G.; Gallen, S.F.; Chamlagain, D.; Godt, J.W. The size, distribution, and mobility of landslides caused by the 2015 Mw 7.8 Gorkha earthquake, Nepal. Geomorphology 2018, 301, 121–138. [Google Scholar] [CrossRef] [Scilit]
  4. Guzzetti, F.; Mondini, A.C.; Cardinali, M.; Fiorucci, F.; Santangelo, M.; Chang, K.-T. Landslide inventory maps: New tools for an old problem. Earth-Sci. Rev. 2012, 112, 42–66. [Google Scholar] [CrossRef] [Scilit]
  5. Tanyaş, H.; van Westen, C.J.; Allstadt, K.E.; Nowicki Jessee, M.A.; Görüm, T.; Jibson, R.W.; Godt, J.W.; Sato, H.P.; Schmitt, R.G.; Marc, O.; et al. Presentation and analysis of a worldwide database of earthquake-induced landslide inventories. J. Geophys. Res. Earth Surf. 2017, 122, 1991–2015. [Google Scholar] [CrossRef] [Scilit]
  6. Ronneberger, O.; Fischer, P.; Brox, T. U-Net: Convolutional networks for biomedical image segmentation. In Medical Image Computing and Computer-Assisted Intervention—MICCAI 2015; Navab, N., Hornegger, J., Wells, W.M., Frangi, A.F., Eds.; Springer: Cham, Switzerland, 2015; pp. 234–241. [Google Scholar] [CrossRef] [Scilit]
  7. Ghorbanzadeh, O.; Meena, S.R.; Blaschke, T.; Aryal, J. Evaluation of different machine learning methods and deep-learning convolutional neural networks for landslide detection. Remote Sens. 2019, 11, 196. [Google Scholar] [CrossRef] [Scilit]
  8. Prakash, N.; Manconi, A.; Loew, S. Mapping landslides on EO data: Performance of deep learning models vs. traditional machine learning models. Remote Sens. 2020, 12, 346. [Google Scholar] [CrossRef] [Scilit]
  9. Chen, L.-C.; Papandreou, G.; Kokkinos, I.; Murphy, K.; Yuille, A.L. DeepLab: Semantic image segmentation with deep convolutional nets, atrous convolution, and fully connected CRFs. IEEE Trans. Pattern Anal. Mach. Intell. 2018, 40, 834–848. [Google Scholar] [CrossRef] [Scilit] [PubMed]
  10. Hu, J.; Shen, L.; Sun, G. Squeeze-and-excitation networks. In Proceedings of the IEEE/CVF Conference on Computer Vision and Pattern Recognition (CVPR), Salt Lake City, UT, USA, 18–23 June 2018; pp. 7132–7141. [Google Scholar] [CrossRef] [Scilit]
  11. Lin, T.-Y.; Dollár, P.; Girshick, R.; He, K.; Hariharan, B.; Belongie, S. Feature pyramid networks for object detection. In Proceedings of the IEEE Conference on Computer Vision and Pattern Recognition (CVPR), Honolulu, HI, USA, 21–26 July 2017; pp. 2117–2125. [Google Scholar] [CrossRef] [Scilit]
  12. Tan, M.; Pang, R.; Le, Q.V. EfficientDet: Scalable and efficient object detection. In Proceedings of the IEEE/CVF Conference on Computer Vision and Pattern Recognition (CVPR), Seattle, WA, USA, 13–19 June 2020; pp. 10781–10790. [Google Scholar] [CrossRef] [Scilit]
  13. Liu, Z.; Lin, Y.; Cao, Y.; Hu, H.; Wei, Y.; Zhang, Z.; Lin, S.; Guo, B. Swin Transformer: Hierarchical vision transformer using shifted windows. In Proceedings of the IEEE/CVF International Conference on Computer Vision (ICCV), Montreal, QC, Canada, 10–17 October 2021; pp. 9992–10002. [Google Scholar] [CrossRef] [Scilit]
  14. Lv, P.; Ma, L.; Li, Q.; Du, F. ShapeFormer: A shape-enhanced vision transformer model for optical remote sensing image landslide detection. IEEE J. Sel. Top. Appl. Earth Obs. Remote Sens. 2023, 16, 2681–2689. [Google Scholar] [CrossRef] [Scilit]
  15. Wu, L.; Liu, R.; Ju, N.; Zhang, A.; Gou, J.; He, G.; Lei, Y. Landslide mapping based on a hybrid CNN–transformer network and deep transfer learning. Int. J. Appl. Earth Obs. Geoinf. 2024, 126, 103612. [Google Scholar] [CrossRef] [Scilit]
  16. Ghorbanzadeh, O.; Xu, Y.; Ghamisi, P.; Kopp, M.; Kreil, D. Landslide4Sense: Reference benchmark data and deep learning models for landslide detection. IEEE Trans. Geosci. Remote Sens. 2022, 60, 5510717. [Google Scholar] [CrossRef] [Scilit]
  17. Ghorbanzadeh, O.; Tiede, D.; Wendt, L.; Sudmanns, M.; Lang, S. A comprehensive transferability evaluation of U-Net and ResU-Net for landslide detection from Sentinel-2 data. Sci. Rep. 2021, 11, 14699. [Google Scholar] [CrossRef] [Scilit] [PubMed]
  18. Fang, C.; Fan, X.; Wang, X.; Nava, L.; Zhong, H.; Dong, X.; Qi, J.; Catani, F. A globally distributed dataset of coseismic landslide mapping via multi-source high-resolution remote sensing images. Earth Syst. Sci. Data 2024, 16, 4817–4842. [Google Scholar] [CrossRef] [Scilit]
  19. He, K.; Zhang, X.; Ren, S.; Sun, J. Deep residual learning for image recognition. In Proceedings of the IEEE Conference on Computer Vision and Pattern Recognition (CVPR), Las Vegas, NV, USA, 26 June–1 July 2016; pp. 770–778. [Google Scholar] [CrossRef] [Scilit]
  20. Huang, G.; Liu, Z.; van der Maaten, L.; Weinberger, K.Q. Densely connected convolutional networks. In Proceedings of the IEEE Conference on Computer Vision and Pattern Recognition (CVPR), Honolulu, HI, USA, 21–26 July 2017; pp. 4700–4708. [Google Scholar] [CrossRef] [Scilit]
  21. Tan, M.; Le, Q.V. EfficientNet: Rethinking model scaling for convolutional neural networks. In Proceedings of the 36th International Conference on Machine Learning (ICML), Long Beach, CA, USA, 9–15 June 2019; pp. 6105–6114. [Google Scholar]
  22. Liu, S.; Huang, D.; Wang, Y. Receptive field block net for accurate and fast object detection. In Proceedings of the European Conference on Computer Vision (ECCV), Munich, Germany, 8–14 September 2018; pp. 385–400. [Google Scholar] [CrossRef] [Scilit]
  23. Woo, S.; Park, J.; Lee, J.-Y.; Kweon, I.S. CBAM: Convolutional block attention module. In Proceedings of the European Conference on Computer Vision (ECCV), Munich, Germany, 8–14 September 2018; pp. 3–19. [Google Scholar] [CrossRef] [Scilit]
  24. Liu, S.; Qi, L.; Qin, H.; Shi, J.; Jia, J. Path aggregation network for instance segmentation. In Proceedings of the IEEE/CVF Conference on Computer Vision and Pattern Recognition (CVPR), Salt Lake City, UT, USA, 18–23 June 2018; pp. 8759–8768. [Google Scholar] [CrossRef] [Scilit]
  25. Zhao, H.; Shi, J.; Qi, X.; Wang, X.; Jia, J. Pyramid scene parsing network. In Proceedings of the IEEE Conference on Computer Vision and Pattern Recognition (CVPR), Honolulu, HI, USA, 21–26 July 2017; pp. 6230–6239. [Google Scholar] [CrossRef] [Scilit]
  26. Chini, M.; Pelich, R.; Pulvirenti, L.; Pierdicca, N.; Hostache, R.; Matgen, P. Sentinel-1 InSAR coherence to detect floodwater in urban areas: Houston and Hurricane Harvey as a test case. Remote Sens. 2019, 11, 107. [Google Scholar] [CrossRef] [Scilit]
  27. Gupta, R.; Hosfelt, R.; Sajeev, S.; Patel, N.; Goodman, B.; Doshi, J.; Heim, E.; Choset, H.; Gaston, M. xBD: A dataset for assessing building damage from satellite imagery. In Proceedings of the IEEE/CVF Conference on Computer Vision and Pattern Recognition Workshops (CVPRW), Long Beach, CA, USA, 16–20 June 2019; pp. 10–17. [Google Scholar] [CrossRef] [Scilit]
  28. Meena, S.R.; Nava, L.; Bhuyan, K.; Puliero, S.; Soares, L.P.; Dias, H.C.; Floris, M.; Catani, F. HR-GLDD: A globally distributed dataset using generalized deep learning for rapid landslide mapping on high-resolution satellite imagery. Earth Syst. Sci. Data 2023, 15, 3283–3298. [Google Scholar] [CrossRef] [Scilit]
  29. Xu, Y.; Ouyang, C.; Xu, Q.; Wang, D.; Zhao, B.; Luo, Y. CAS Landslide Dataset: A large-scale and multisensor dataset for deep learning-based landslide detection. Sci. Data 2024, 11, 12. [Google Scholar] [CrossRef] [Scilit] [PubMed]
  30. Sameen, M.I.; Pradhan, B. Landslide detection using residual networks and the fusion of spectral and topographic information. IEEE Access 2019, 7, 114363–114373. [Google Scholar] [CrossRef] [Scilit]
  31. Lu, W.; Hu, Y.; Zhang, Z.; Cao, W. A dual-encoder U-Net for landslide detection using Sentinel-2 and DEM data. Landslides 2023, 20, 1975–1987. [Google Scholar] [CrossRef] [Scilit]
Figure 1. Overall research framework. A five-stage workflow covering data preprocessing on the GDCLD (nine events, four continents), encoder backbone comparison (EfficientNet-b4 selected, ΔIoU = +11.02 pp), three-axis module ablation (RFB, CBAM, PANet), incremental synergy validation (“see–purify–delineate”), and dual classification–regression evaluation. Dashed arrows indicate that the encoder’s contribution (ΔIoU = 11.02 pp) sets the performance upper bound, exceeding that of individual modules.
Remotesensing 18 02727 g001
Figure 2. Architecture of the Receptive Field Block (RFB). Multi-branch dilated convolution module with channel reduction and residual connection for an enlarged receptive field.
Remotesensing 18 02727 g002
Figure 3. Architecture of the Convolutional Block Attention Module (CBAM). Sequential channel-to-spatial attention for adaptive feature refinement.
Remotesensing 18 02727 g003
Figure 4. Architecture of the Path Aggregation Network (PANet). Bidirectional feature pyramid for multi-scale spatial-semantic fusion.
Remotesensing 18 02727 g004
Figure 5. Encoder Performance Comparison. EfficientNet-b4 outperforms ResNet34 and DenseNet121 across all four segmentation metrics.
Remotesensing 18 02727 g005
Figure 6. Regression Error Analysis by Encoder. (a) MAE, (b) MSE, (c) R2 distributions confirming EfficientNet-b4’s (p < 0.0001).
Remotesensing 18 02727 g006
Figure 7. Qualitative comparison of encoder performance. (a) Elongated landslides in vegetated terrain; (b) a small isolated landslide; (c) complex landslides on bare slopes; (d) a compact landslide in terraced terrain; and (e) large irregular landslides. Blue and red contours denote predicted and ground-truth boundaries, respectively. EfficientNet-b4 shows the best overall boundary delineation.
Remotesensing 18 02727 g007
Figure 8. Context Module Ablation. RFB delivers optimal Dice, IoU, and Recall gains compared to ASPP and PPM.
Remotesensing 18 02727 g008
Figure 9. Regression performance by context module. (a) MAE distributions; (b) MSE distributions; and (c) R2 distributions for Base, PPM, ASPP, and RFB. No significant differences were observed across modules (p > 0.45).
Remotesensing 18 02727 g009
Figure 10. Qualitative comparison of context modules. (a) Small isolated landslide; (b) medium irregular landslide; (c) large complex landslide; (d) elongated landslide; and (e) multiple irregular landslides. Blue and red contours denote predicted and ground-truth boundaries, respectively. RFB provides the best overall boundary preservation with fewer false positives.
Remotesensing 18 02727 g010
Figure 11. Attention Module Ablation. CBAM is the sole module improving all four metrics simultaneously.
Remotesensing 18 02727 g011
Figure 12. Regression performance by attention module. (a) MAE distributions; (b) MSE distributions; and (c) R2 distributions for Base, NonLocal, SE, and CBAM. No significant differences were observed across modules (p > 0.23).
Remotesensing 18 02727 g012
Figure 13. Qualitative comparison of attention modules. (a) Large irregular landslide; (b) small isolated landslide; (c) large compact landslide; (d) branched landslides; and (e) multiple small scattered landslides. Blue and red contours denote predicted and ground-truth boundaries, respectively. CBAM shows the best overall boundary delineation with fewer false positives.
Remotesensing 18 02727 g013
Figure 14. Feature Fusion Module Ablation. PANet achieves the largest single-module Recall gain (+1.74 pp).
Remotesensing 18 02727 g014
Figure 15. Regression performance by feature fusion module. (a) MAE distributions; (b) MSE distributions; and (c) R2 distributions for Base, BiFPN, and PANet. No significant differences were observed across modules (p > 0.46).
Remotesensing 18 02727 g015
Figure 16. Qualitative comparison of feature fusion modules. (a) Multiple fragmented landslides; (b) narrow landslides along a riverbank; (c) very small isolated landslide; (d) a small landslide under shadow; and (e) a large irregular landslide. Blue and red contours denote predicted and ground-truth boundaries, respectively. PANet shows better overall boundary continuity, especially for fragmented landslides.
Remotesensing 18 02727 g016
Figure 17. Incremental Ablation Study. Phased performance evolution from Base to Full Model.
Remotesensing 18 02727 g017
Figure 18. Regression performance across ablation stages. (a) MAE distributions; (b) MSE distributions; and (c) R2 distributions for Base, Base+RFB, Base+RFB+CBAM, and Base+RFB+CBAM+PANet. No significant differences were observed across ablation stages (p > 0.77).
Remotesensing 18 02727 g018
Figure 19. Incremental visual progression across ablation stages. (a) Multiple fragmented landslides; (b) riverbank landslides; (c) a small isolated landslide; (d) a shadowed landslide; and (e) a large irregular landslide. Blue and red contours denote predicted and ground-truth boundaries, respectively. Boundary delineation progressively improves from Base to +PANet.
Remotesensing 18 02727 g019
Table 1. Statistical significance of regression metrics across encoder and module ablations reveals probability-level invariance for task-specific modules, contrasting with encoder-level probability recalibration.
Ablation CategoryConfigurations ComparedMAE p-ValueMSE p-ValueR2 p-ValueInterpretation
Encoder comparisonDenseNet121, ResNet34, EfficientNet-b4<0.0001<0.0001<0.0001Encoder alters probability calibration
Context modulesBase, ASPP, PPM, RFB0.95550.97830.4575Decision-boundary refinement only
Attention modulesBase, SE, Non-local, CBAM0.26450.38080.2343Decision-boundary refinement only
Fusion modulesBase, BiFPN, PANet0.46310.54540.8131Decision-boundary refinement only
Values from the Kruskal–Wallis test, n = 1243 test images. Significance threshold α = 0.05. The contrast between encoder-level significance (p < 0.0001) and the absence of statistically significant module-level differences supports a two-tier interpretation in which encoders govern probability-assignment capacity, and modules refine decision boundaries. However, non-significance does not establish equivalence; paired effect sizes and 95% confidence intervals are therefore provided in Supplementary Table S6.
Disclaimer/Publisher’s Note: The statements, opinions and data contained in all publications are solely those of the individual author(s) and contributor(s) and not of MDPI and/or the editor(s). MDPI and/or the editor(s) disclaim responsibility for any injury to people or property resulting from any ideas, methods, instructions or products referred to in the content.