1. Introduction
Land subsidence is one of the most widespread environmental and geological hazards that can result from both natural and anthropogenic processes and is currently most commonly associated with excessive groundwater withdrawal. Declining groundwater levels reduce pore-water pressure within aquifer systems, leading to the consolidation of compressible sediments and consequently causing irreversible vertical deformation of the land surface. This process can result in significant environmental and socio-economic impacts, including structural damage to buildings, deterioration of transportation infrastructure, drainage problems, increased flood susceptibility, and the development of secondary geological hazards [
1]. In recent decades, increasing irrigation demand, population growth, climate change-induced drought conditions, and unsustainable groundwater exploitation have transformed land subsidence into a major geohazard in many closed basins worldwide [
2,
3,
4,
5]. Consequently, accurately identifying not only where land subsidence occurs but also its severity and spatial continuity has become increasingly important for supporting groundwater management, hazard zoning, land-use planning, and risk-informed decision making.
The Konya Closed Basin (KCB), the largest endorheic drainage basin in Turkey, covers approximately 50,000 km
2 and constitutes one of the country’s most important agricultural production regions [
5]. The basin plays a strategic role in Turkish agriculture through extensive cereal cultivation, sugar beet production, and other irrigation-dependent farming activities. However, due to its semi-arid climate, limited annual precipitation, and high evaporation rates, agricultural production relies heavily on groundwater resources [
5]. In recent years, increasing irrigation demand and uncontrolled groundwater abstraction have caused groundwater withdrawals to exceed natural recharge rates in many sub-basins, resulting in significant regional groundwater-level declines. Previous studies have reported groundwater-level decreases approaching approximately 1 m/yr in certain areas, with cumulative declines reaching several tens of meters over longer periods [
6,
7]. These persistent groundwater-level reductions have not only threatened the sustainability of regional water resources but have also triggered widespread land subsidence and sinkhole formation throughout the basin [
8,
9,
10]. Consequently, land subsidence in the Konya metropolitan area, which is currently home to approximately 2.3 million inhabitants, has evolved from a predominantly agricultural concern into a significant geohazard with potential implications for urban infrastructure, transportation networks, and residential areas.
Previous geodetic and remote sensing investigations have demonstrated that land subsidence has become a persistent and spatially extensive phenomenon throughout the Konya Closed Basin. Early GNSS-based monitoring studies revealed measurable vertical ground deformation associated with intensive groundwater abstraction and highlighted the growing vulnerability of the basin to subsidence-related hazards [
6]. Subsequent GPS and Differential InSAR investigations further documented the spatial distribution and temporal evolution of subsidence, reporting deformation rates reaching several centimeters per year in different sectors of the basin [
8]. More recently, multi-sensor InSAR analyses conducted over the Konya metropolitan area revealed a long-term increase in subsidence rates and identified localized zones exhibiting deformation rates exceeding 100 mm/yr [
11]. These findings demonstrated that subsidence in the metropolitan area remains active and spatially heterogeneous, with deformation concentrated in specific sectors of the urban environment. Furthermore, studies investigating groundwater-level variations and GNSS observations confirmed the strong relationship between aquifer depletion and ongoing ground deformation throughout the basin [
7].
However, the majority of previous studies have primarily focused on quantifying deformation magnitudes, investigating their temporal evolution, and evaluating their relationships with groundwater-level variations. Although these studies have successfully revealed the spatial distribution and temporal evolution of land subsidence within the Konya Closed Basin, the existing literature has largely been limited to the production of deformation maps and the interpretation of deformation mechanisms. Furthermore, continuous groundwater exploitation and ongoing urban expansion necessitate the periodic re-evaluation of subsidence conditions to determine whether previously reported deformation patterns and magnitudes remain representative of current ground-motion behavior. While significant subsidence rates have been reported in several sectors of the basin during recent years, the current behavior of subsidence and the spatial organization of high-deformation zones continue to evolve and require further investigation. In addition, changes in the spatial distribution and connectivity of high-deformation areas may alter the extent and severity of subsidence hazards. Although previous studies have successfully quantified deformation rates and documented their temporal evolution, less attention has been devoted to understanding how the spatial organization of deformation evolves through time and whether high-subsidence zones remain isolated or become increasingly interconnected. Therefore, periodic reassessment of deformation patterns is required not only to update deformation magnitudes but also to characterize the contemporary spatial configuration of subsidence and its implications for hazard assessment. Although previous studies have significantly improved the understanding of land subsidence in the Konya Closed Basin, they have generally focused on deformation monitoring rather than quantitative hazard assessment. In particular, limited attention has been given to severity-based hazard classification, the integration of complementary spatial statistical methods, the identification of continuous deformation corridors, and the transformation of deformation measurements into decision-support products for hazard management. These research gaps provide the primary motivation for the present study.
Recent studies have increasingly emphasized the need to move beyond conventional deformation monitoring toward quantitative hazard assessment by integrating InSAR-derived measurements with complementary spatial analysis, machine learning, and hazard-zonation frameworks [
3,
12,
13]. Although these approaches have demonstrated the potential of integrating deformation data with spatial analytical techniques, their application to comprehensive land-subsidence hazard zoning and critical hotspot identification remains relatively limited. While deformation-rate maps effectively depict the magnitude and spatial distribution of ground motion, they do not necessarily identify where subsidence becomes spatially concentrated, statistically significant, or sufficiently severe to constitute a critical hazard. Consequently, understanding deformation magnitudes alone is insufficient for evaluating the potential impacts of land subsidence on infrastructure, structural safety, and urban development. The reliable, objective, and reproducible delineation of subsidence hazard zones and critical deformation nuclei is equally important. Early identification of such areas is essential for land-use planning, infrastructure management, sustainable groundwater-resource utilization, and the development of effective mitigation strategies. Furthermore, the continuing expansion of groundwater exploitation and urban development within the Konya metropolitan area necessitates periodic re-evaluation of subsidence conditions to determine whether deformation patterns and rates reported in previous studies remain representative of contemporary ground-motion behavior. To the best of the authors’ knowledge, few studies have attempted to provide an updated assessment of land subsidence in the Konya metropolitan area while systematically delineating quantitative land-subsidence hazard zones and statistically significant critical hotspots through the integration of InSAR-derived deformation measurements with complementary spatial statistical analyses.
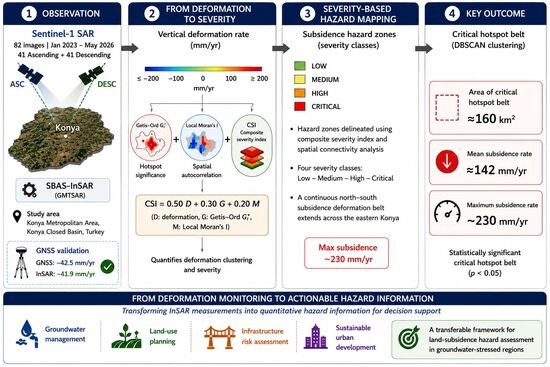
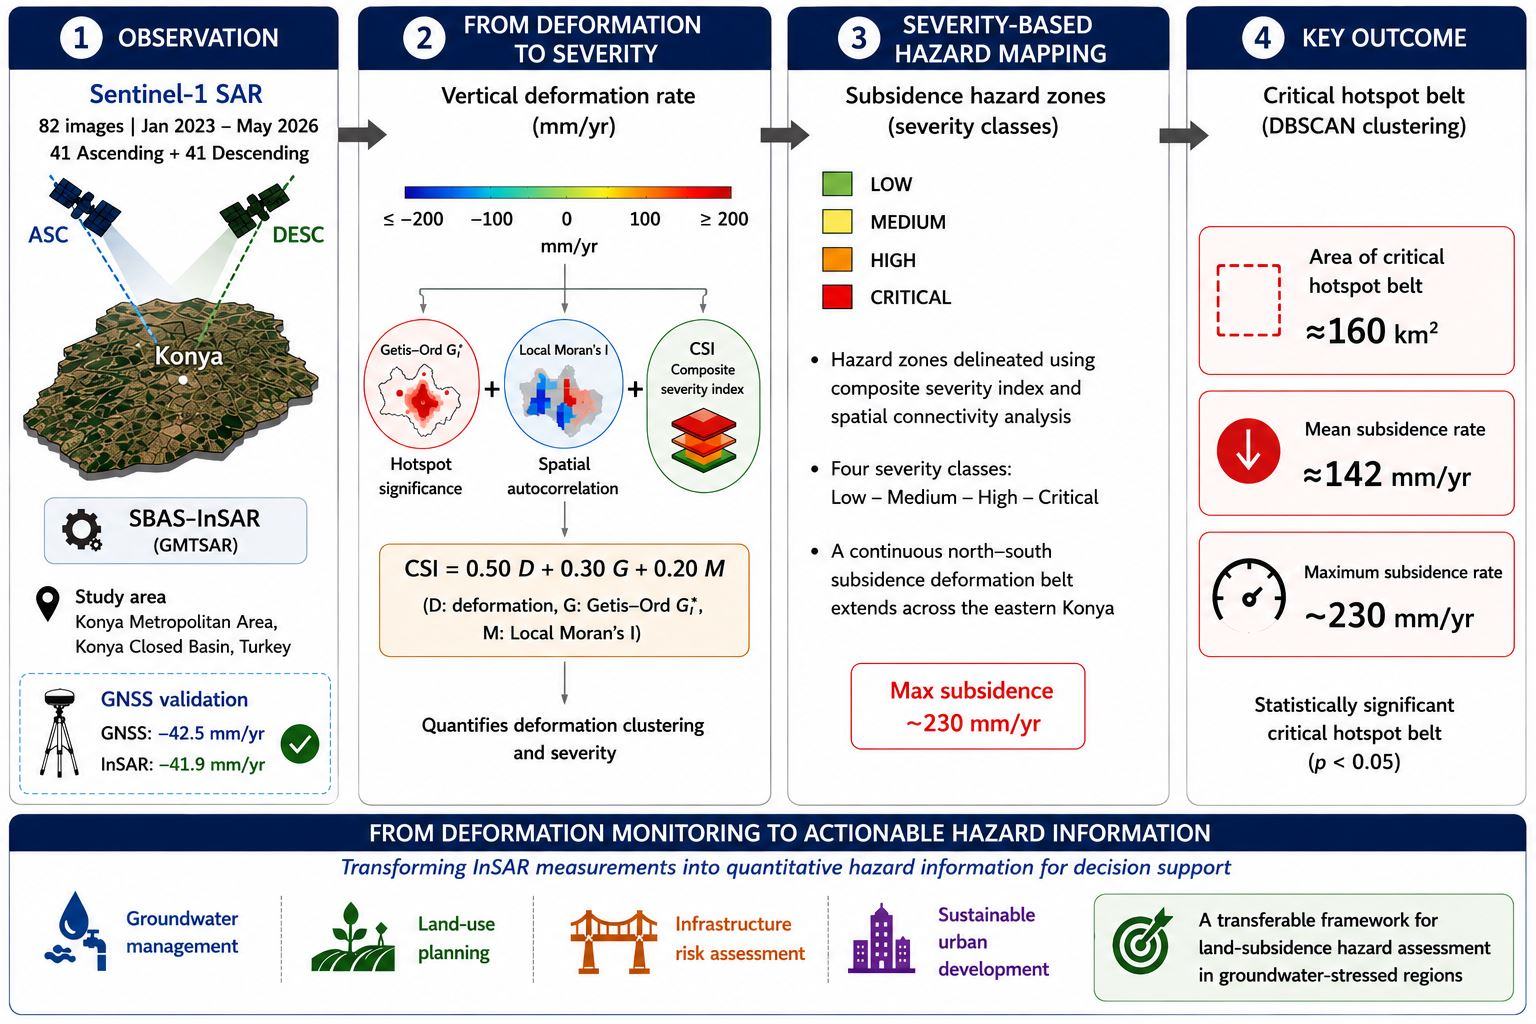
Accordingly, this study aims to provide an updated assessment of contemporary land-subsidence conditions in the Konya metropolitan area and to develop a severity-based framework for delineating land-subsidence hazard zones and statistically significant critical hotspots through the integration of SBAS-InSAR observations and spatial statistical analyses.Unlike previous studies that primarily focused on deformation monitoring, this study extends conventional SBAS-InSAR analysis by integrating multiple complementary spatial statistical approaches into a unified hazard assessment framework. Specifically, the proposed framework (i) establishes a severity-based classification scheme for regional land-subsidence hazard zoning, (ii) integrates Getis–Ord Gi*, Local Moran’s I, Composite Severity Index (CSI), and DBSCAN clustering within a single analytical workflow, (iii) identifies continuous deformation corridors rather than isolated subsidence centers, and (iv) produces quantitative hazard-zoning products that support groundwater management and land-use planning. Throughout this paper, the term ‘severity-based mapping’ refers to the spatial representation of the four hazard classes derived from the Jenks-classified Composite Severity Index rather than to conventional deformation-rate mapping alone. For this purpose, 41 Sentinel-1 SAR acquisitions acquired between January 2023 and May 2026 were processed separately in ascending and descending acquisition geometries using the Small Baseline Subset (SBAS) approach implemented in the Generic Mapping Tools Synthetic Aperture Radar (GMTSAR) software package, v6.1, an open-source interferometric processing framework widely used for measuring crustal deformation and surface displacements from SAR observations [
14,
15]. The resulting line-of-sight deformation fields were subsequently integrated to derive a vertical deformation-rate map representing contemporary ground-motion conditions across the study area. Following the generation of the vertical deformation field, Getis–Ord Gi* hotspot analysis, Local Moran’s I spatial autocorrelation analysis, and the Composite Severity Index (CSI) were employed to quantify deformation clustering and classify subsidence severity. Based on these analyses, continuous subsidence hazard zones and statistically significant critical hotspot polygons were delineated through severity-based classification and spatial connectivity analyses. The resulting spatial patterns were further evaluated to characterize the broader subsidence deformation belt associated with ongoing land subsidence in eastern Konya.
The proposed framework enables the transition from conventional deformation mapping toward risk-oriented subsidence assessment by integrating deformation magnitude, spatial clustering behavior, and hotspot significance into a unified severity-based evaluation scheme, an approach increasingly recognized in recent geohazard-zonation studies [
12,
16]. Unlike previous investigations that primarily focused on deformation measurements and temporal evolution, the proposed framework transforms InSAR-derived deformation observations into quantitative hazard assessment products through the objective delineation of hazard zones and critical hotspots. The results not only provide an updated evaluation of ongoing subsidence conditions, revealing vertical deformation rates locally approaching 230 mm/yr and exceeding values reported in several previous investigations conducted in the region, but also provide a reproducible and quantitative approach for identifying deformation belts, subsidence hazard zones, and statistically significant critical hotspots in groundwater-stressed urban environments. The proposed framework extends conventional deformation mapping by converting deformation measurements into quantitative hazard-zoning products that support geohazard assessment, groundwater-resource management, urban planning, infrastructure management, and land-subsidence risk mitigation.
2. Materials and Methods
2.1. Study Area
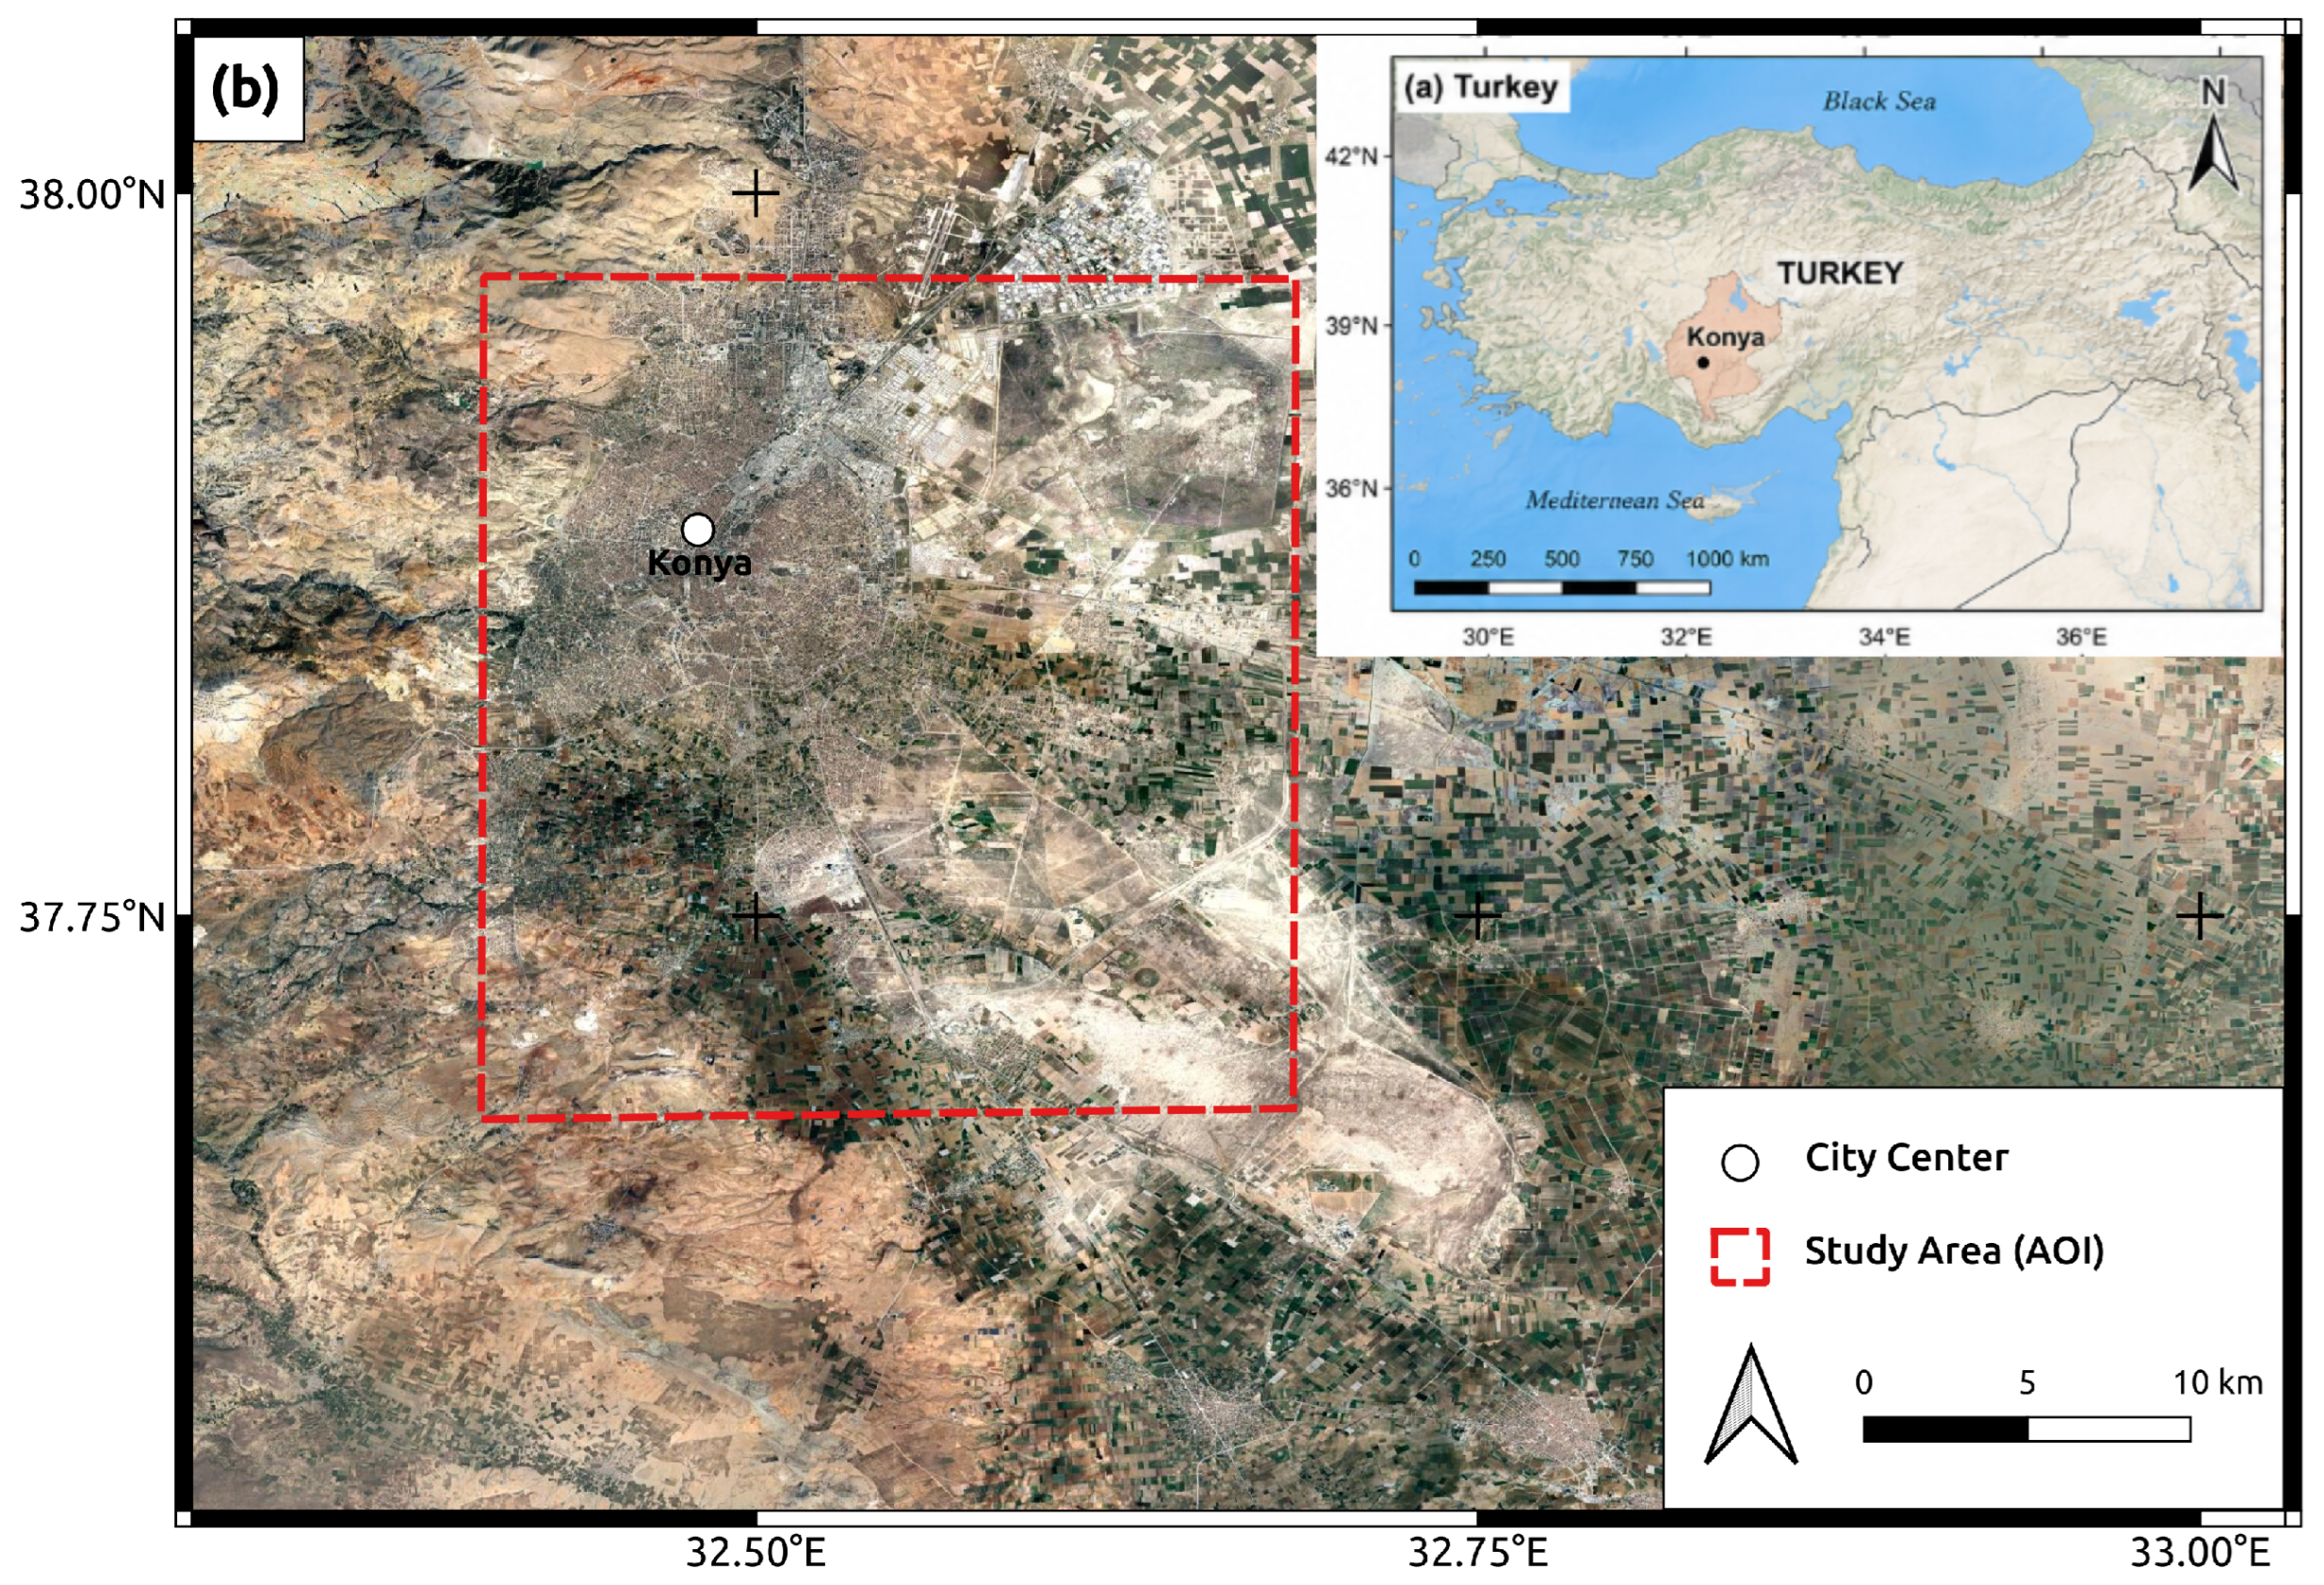
The study area is located in and around the Konya metropolitan area in central Turkey, within the central sector of the Konya Closed Basin (KCB) (
Figure 1). The investigated area encompasses the urban core of Konya and its surrounding agricultural lands, where intensive groundwater exploitation has produced some of the highest documented land-subsidence rates in the basin. The area is characterized by relatively flat topography with elevations generally ranging between 950 and 1050 m above sea level and is underlain by thick Quaternary alluvial deposits that overlie Neogene sedimentary formations composed predominantly of clay, silt, sand, marl, and locally evaporitic units [
8].
The Konya Closed Basin is the largest endorheic basin in Turkey, covering approximately 50,000 km
2 in the Central Anatolian Plateau. The basin is characterized by a semi-arid continental climate, low annual precipitation, high evapotranspiration rates, and limited surface-water resources. As a result, both agricultural production and urban water supply depend heavily on groundwater resources. Extensive cultivation of irrigation-dependent crops, coupled with increasing population pressure and recurrent drought conditions, has led to groundwater withdrawals that exceed natural recharge rates across large parts of the basin [
7,
8]. Consequently, groundwater levels have experienced persistent declines during recent decades, reaching approximately 1 m/yr in some sectors of the basin [
6,
7].
The Konya metropolitan area represents one of the most intensively exploited groundwater regions within the basin and has become one of the most active land-subsidence regions in Turkey. Early GNSS-based investigations documented measurable vertical ground deformation associated with intensive groundwater extraction and highlighted the increasing vulnerability of the region to subsidence-related hazards [
6]. Subsequent GNSS and InSAR studies confirmed the progressive nature of land subsidence and revealed increasing deformation rates across different sectors of the metropolitan area [
7,
8]. More recent investigations reported localized subsidence rates exceeding 100 mm/yr, indicating that ground deformation remains active and continues to evolve spatially throughout the region [
9]. The combination of rapid urban expansion, critical infrastructure, intensive agricultural activities, and ongoing groundwater depletion makes the Konya metropolitan area particularly vulnerable to subsidence-related hazards and therefore an appropriate setting for subsidence-hazard zonation and critical-hotspot delineation.
2.2. SAR Dataset
A total of 82 Sentinel-1 Synthetic Aperture Radar (SAR) images acquired between January 2023 and May 2026 were used in this study. To enable the estimation of vertical ground deformation, ascending and descending datasets were processed independently and subsequently combined. The ascending dataset consisted of 41 Sentinel-1 images acquired along Path 117, Frame 160, whereas the descending dataset comprised 41 Sentinel-1 images acquired along Path 167, Frame 466. Both datasets span the same observation period from 1 January 2023 to 30 May 2026, providing approximately monthly temporal sampling over the study area.
All SAR acquisitions were collected in the Interferometric Wide Swath (IW) mode at C-band wavelength (5.6 cm) with a nominal ground resolution of approximately 5 × 20 m and a revisit interval of 12 days. To maintain temporal consistency and reduce computational requirements while preserving the long-term deformation signal, one Sentinel-1 acquisition per month was selected from the available archive for each orbit geometry. Monthly observations were considered sufficient to characterize the long-term evolution of groundwater-induced land subsidence. When multiple acquisitions were available within the same month, a single scene was selected to ensure approximately uniform temporal sampling and comparable temporal coverage between the ascending and descending datasets. The resulting datasets provide a continuous 41-month observation period suitable for monitoring long-term land-subsidence processes in the Konya metropolitan area.
The selected ascending and descending image stacks cover the entire study area and provide complementary viewing geometries that improve the characterization of surface displacement components. The use of both orbit directions reduces geometric limitations associated with single-track observations and enables the derivation of vertical deformation rates through the combination of line-of-sight (LOS) displacement measurements. Details of the Sentinel-1 datasets used in this study are summarized in
Table 1.
2.3. SBAS-InSAR Processing
Time-series deformation analysis was performed using the Small Baseline Subset (SBAS) technique implemented in the Generic Mapping Tools Synthetic Aperture Radar (GMTSAR) software package [
14,
15]. The SBAS approach reduces temporal and spatial decorrelation effects by constructing interferograms from image pairs characterized by small temporal and perpendicular baselines, thereby improving the reliability of long-term deformation measurements.
The ascending and descending Sentinel-1 datasets were processed independently following the standard GMTSAR-SBAS workflow. Precise orbit ephemerides were applied, and all SAR acquisitions were co-registered to a common master (reference) acquisition. The acquisitions of 14 January 2023 (ascending) and 15 January 2023 (descending) served as the reference acquisitions for the time-series analysis. Since the study area was entirely covered by the IW3 sub-swath, all interferometric processing was performed using Sentinel-1 IW3 data. Interferometric pairs were subsequently generated using maximum temporal and perpendicular baseline thresholds of 125 days and 100 m, respectively, ensuring a well-connected interferometric network while minimizing temporal and spatial decorrelation. Based on these criteria, 154 ascending and 160 descending interferograms were generated and retained for the subsequent SBAS inversion. The topographic phase component was removed using the 30 m Shuttle Radar Topography Mission (SRTM) Digital Elevation Model (DEM).
The generated interferograms were filtered to improve phase quality and suppress noise prior to phase unwrapping. Phase unwrapping was performed using the Statistical-Cost Network-Flow Algorithm for Phase Unwrapping (SNAPHU). A minimum coherence threshold of 0.01 and a maximum deformation-cycle parameter of 40 were adopted during the unwrapping procedure. No explicit atmospheric phase correction was applied during the SBAS inversion. The adopted small temporal and perpendicular baseline thresholds help reduce the influence of temporally uncorrelated atmospheric phase delays within the interferometric network. The resulting unwrapped interferograms were subsequently inverted within the SBAS framework to derive line-of-sight (LOS) deformation time series and mean deformation velocities for both ascending and descending orbit geometries. Only interferograms satisfying the predefined temporal and perpendicular baseline thresholds and successfully unwrapped were included in the SBAS inversion. Interferograms exhibiting unsuccessful phase unwrapping were excluded from the final time-series analysis. The quality of the SBAS inversion was evaluated using the root mean square (RMS) residuals of the time-series solution. For both ascending and descending datasets, RMS values generally ranged between approximately 4–6 mm, indicating satisfactory agreement between the observed and modeled deformation signals. No external reference point was manually selected. Following the standard GMTSAR SBAS implementation, the deformation time series was estimated relative to the reference acquisitions through network inversion.
Because InSAR measurements represent displacement projected along the radar line-of-sight (LOS) direction, LOS deformation velocities from ascending and descending tracks were combined to estimate the vertical component of ground motion. Given that the study area is dominated by groundwater-induced land subsidence and previous GNSS investigations in the Konya Closed Basin reported horizontal deformation rates that are negligible compared with the vertical component [
6,
7,
8], horizontal motion was assumed to be insignificant. Under this assumption, vertical deformation velocities were calculated using the geometric decomposition of ascending and descending LOS observations according to:
where
and
represent the mean line-of-sight (LOS) deformation velocities derived from ascending and descending observations, respectively, and
denotes the Sentinel-1 incidence angle. To provide an independently measured estimate rather than a swath-position approximation, the local incidence angle was computed at the location of the KNY1 GNSS station (32.477°E, 37.860°N) from the ascending and descending reference-orbit geometries using the GMTSAR
SAT_look utility. The resulting incidence angles were
(
) and
(
), differing by less than 1° from each other but by approximately 4° from the nominal value (
) initially adopted in Equation (1). Because the vertical-velocity decomposition is inversely proportional to
, using the measured angles instead would systematically increase all reported vertical deformation rates by approximately 5.7% (mean measured
versus the assumed 0.78). As this correction would uniformly rescale magnitudes without altering spatial patterns, relative ranking, or statistical significance, we report it here for full transparency and retain the original
value throughout the analysis; full reprocessing with per-track measured angles is recommended as a refinement for future work. We further quantify the influence of this parameter choice on the study’s main conclusions. Because the Gi* statistic, Local Moran’s I, and the min–max normalized deformation component of the CSI are all mathematically invariant under a uniform positive rescaling of the input variable (a property that also extends to the standardized four-dimensional feature space—longitude, latitude, subsidence rate, and severity score—used in the DBSCAN clustering,
Section 2.7), the resulting hazard classification, the spatial extent of severity classes, the hotspot pattern, and the delineated critical corridor are exactly unaffected by the choice between
and the measured value. Only the reported absolute deformation rates (in mm/yr) would shift by the uniform factor of approximately 1.057: the headline maximum rate would become approximately 243 mm/yr (from 230 mm/yr), the critical-class maximum approximately 228 mm/yr (from 215.3 mm/yr), and the mean hotspot-belt rate approximately 150 mm/yr (from 142.2 mm/yr). Notably, because the GNSS displacement is measured independently of the incidence-angle assumption, rescaling the InSAR-derived rates would increase—rather than decrease—the residual between the GNSS and InSAR trends (from approximately 0.6 mm/yr to approximately 1.8 mm/yr), providing an additional empirical indication that the originally adopted value remains consistent with the independent geodetic validation. We therefore retain
throughout the analysis, while explicitly reporting this quantified sensitivity for full transparency. The resulting vertical deformation velocity map constituted the primary dataset for subsequent hotspot detection, severity analysis, and subsidence-hazard zonation.
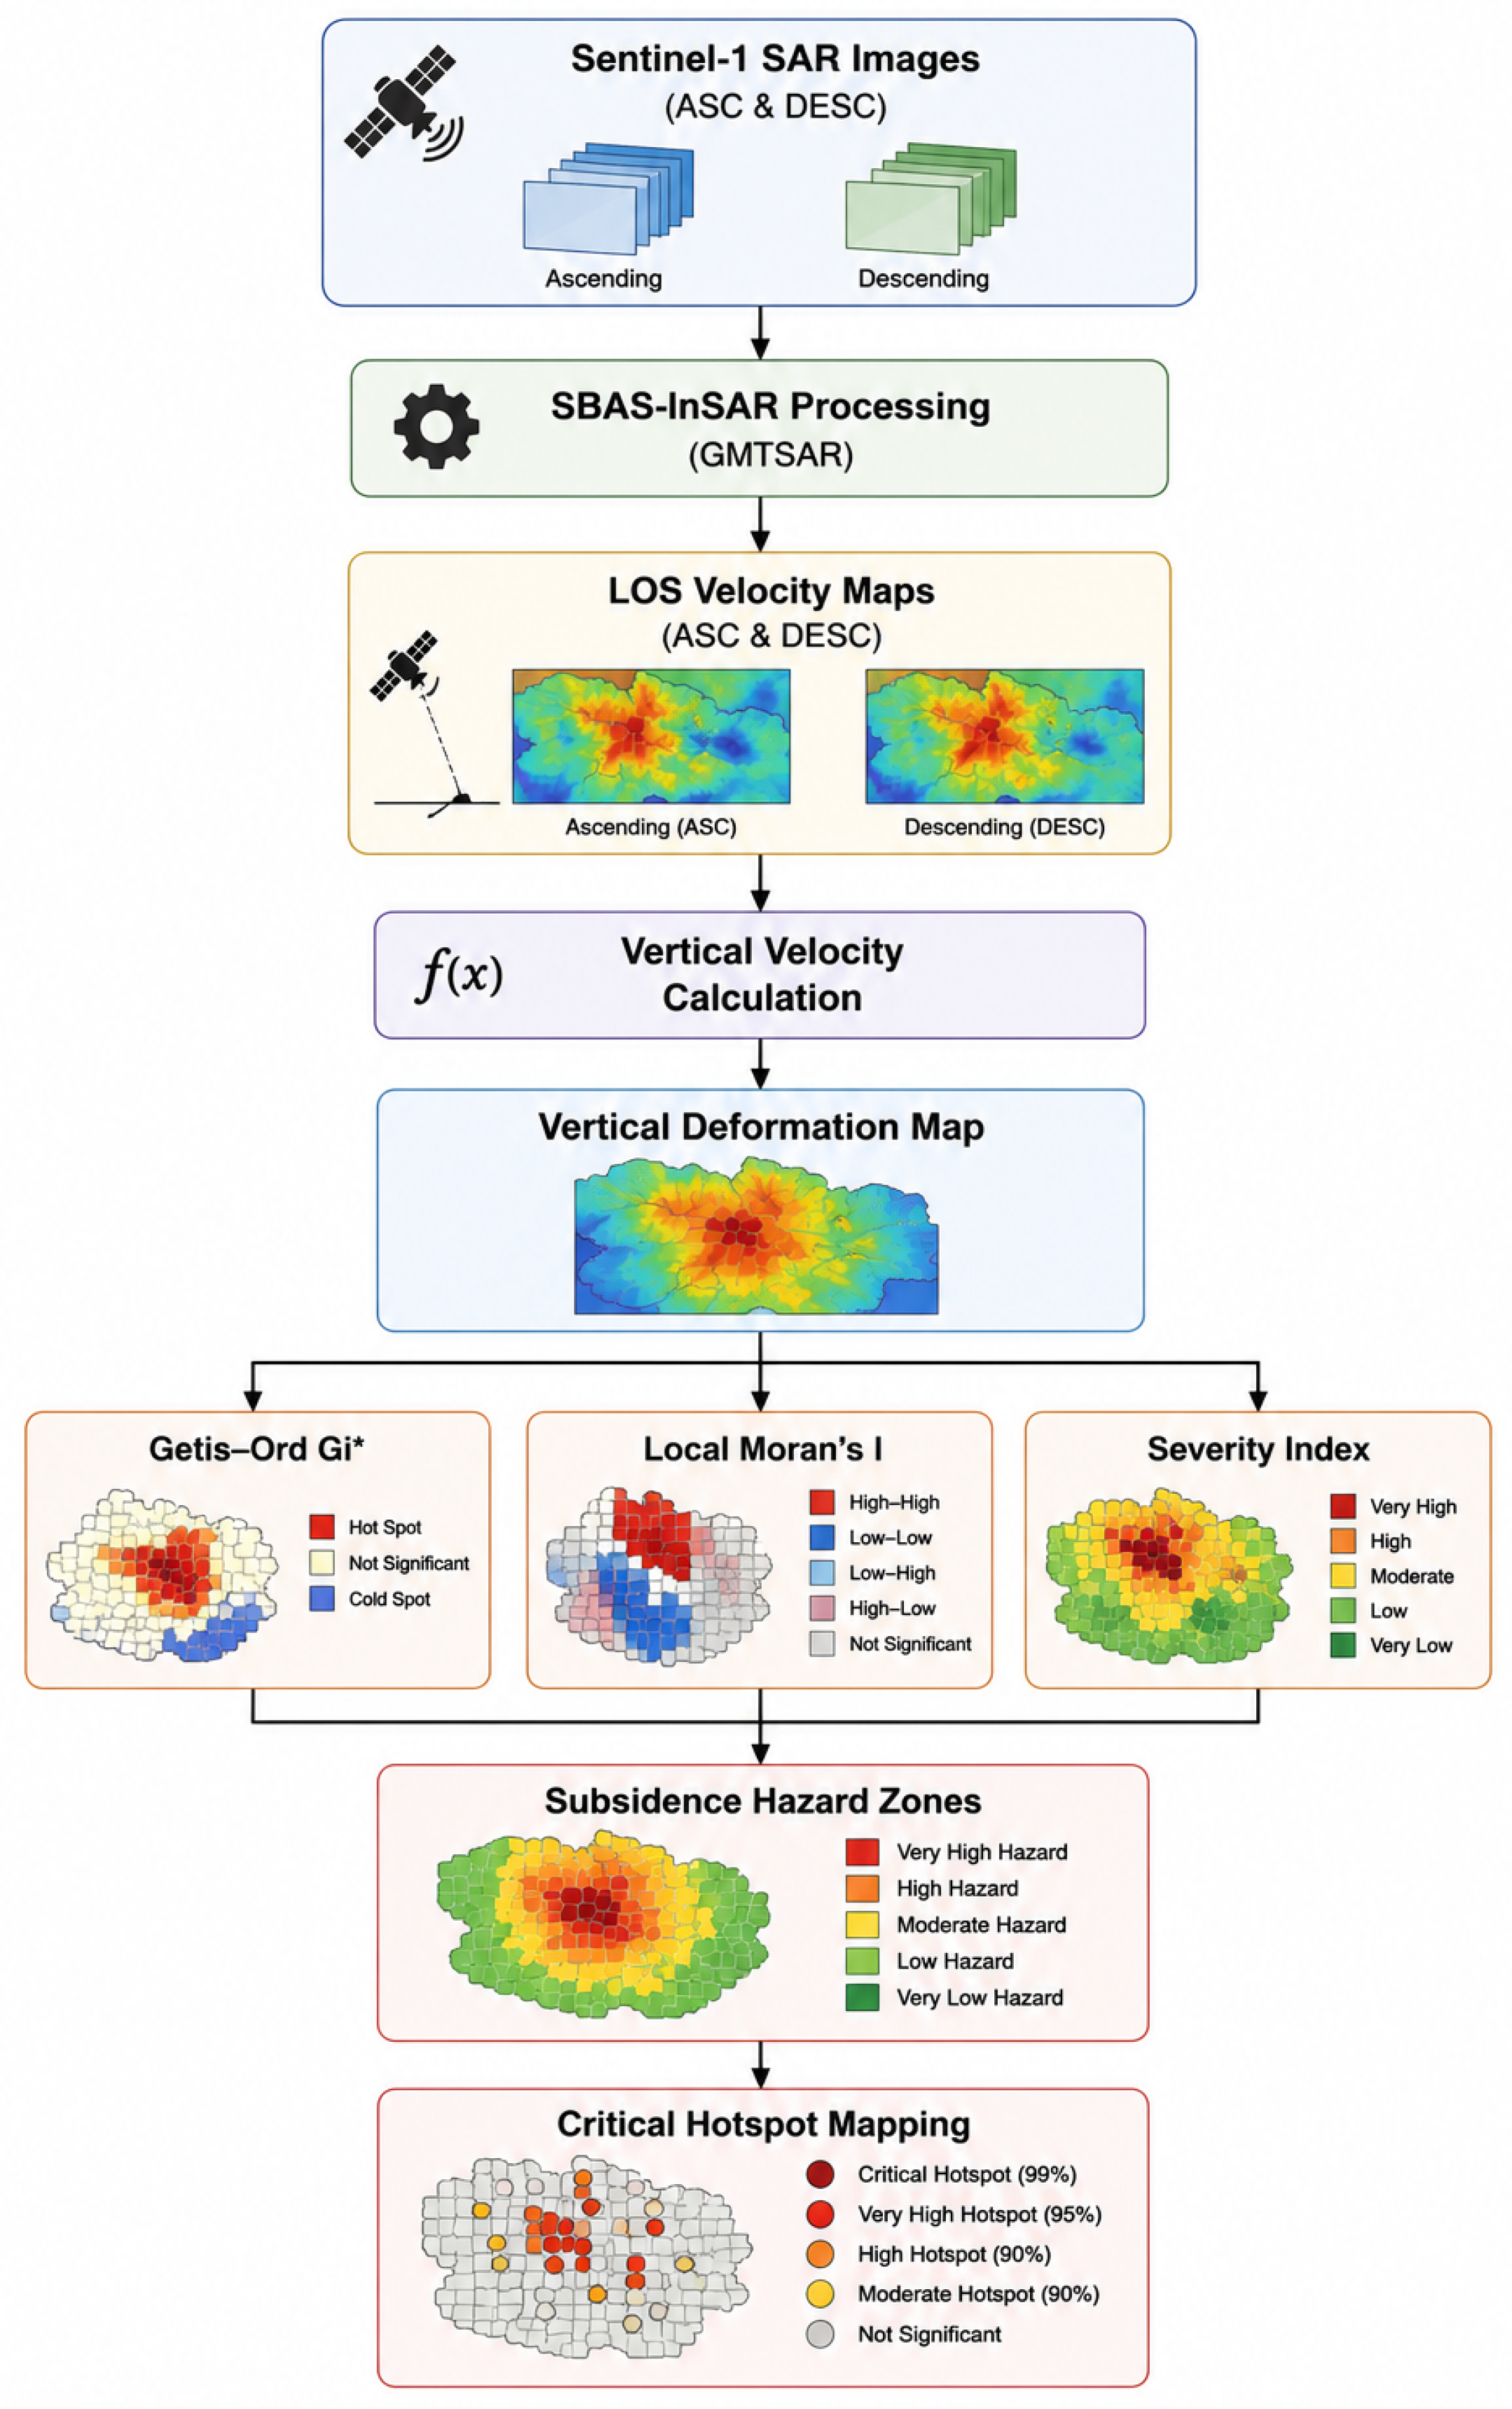
The overall processing workflow adopted in this study is summarized in
Figure 2.
2.4. Spatial Statistical Analysis
Following the generation of the vertical deformation velocity map, spatial statistical analyses were performed to identify areas exhibiting significant deformation clustering and to delineate land-subsidence hazard zones. While deformation velocity maps provide information regarding the magnitude and distribution of ground motion, they do not explicitly reveal whether high-subsidence areas form statistically significant spatial clusters. Therefore, a multi-stage spatial statistical framework was developed to characterize the spatial organization of subsidence and to distinguish isolated deformation anomalies from coherent deformation clusters. Similar spatial statistical approaches integrating InSAR-derived deformation measurements with hazard-zonation frameworks have recently been applied in subsidence and geohazard assessments [
12,
13,
17]. The framework consisted of three complementary components. First, Getis–Ord Gi* hotspot analysis was applied to identify statistically significant clusters of high subsidence rates. Second, Local Moran’s I analysis was employed to evaluate local spatial autocorrelation patterns and to distinguish high–high deformation clusters from spatial outliers. Finally, the outputs of both spatial statistical analyses were integrated with deformation magnitude information through a composite severity index, which was subsequently used to delineate subsidence hazard zones and statistically significant critical hotspots.
2.5. Getis–Ord Gi* Hotspot Analysis
To identify statistically significant spatial concentrations of land subsidence, the Getis–Ord Gi* statistic was applied to the vertical deformation velocity dataset [
18,
19]. The Gi* statistic evaluates whether high or low values are spatially clustered beyond what would be expected under a random distribution and is widely used for hotspot detection in geospatial analyses. Similar hotspot-based approaches have increasingly been employed in InSAR-derived hazard assessment studies to identify spatially concentrated deformation patterns and high-risk zones [
12,
17]. For each observation, the Gi* statistic was calculated as
where
represents the subsidence value at location
j,
denotes the spatial weight between locations
i and
j,
n is the total number of observations,
is the mean subsidence value, and
S is the standard deviation of the dataset. A fixed-distance neighborhood of 150 m was adopted to define local spatial relationships. The neighborhood distance was selected after exploratory testing of several candidate distances. Shorter distances resulted in fragmented and discontinuous hotspot patterns, whereas larger distances produced excessive spatial smoothing. A distance of 150 m provided a balance between preserving local deformation variability and maintaining spatial continuity within the deformation field. The same neighborhood definition was subsequently adopted in the Local Moran’s I analysis to ensure consistency between the spatial statistical approaches.
The resulting Gi* z-scores were used to classify statistically significant hotspots and coldspots. Positive z-scores indicate clusters of high subsidence values, whereas negative z-scores indicate clusters of low values. Statistical significance was evaluated using confidence levels of 90%, 95%, and 99%, corresponding to z-score thresholds of
,
, and
, respectively [
18,
19]. Areas characterized by positive and statistically significant Gi* values were interpreted as potential subsidence hotspots, whereas statistically significant negative z-scores were classified as coldspots.
2.6. Local Moran’s I Spatial Autocorrelation Analysis
Local spatial autocorrelation patterns were evaluated using Local Moran’s I statistics [
20]. Unlike hotspot analysis, which identifies areas of statistically significant concentration, Local Moran’s I characterizes the spatial relationship between individual observations and their neighboring values, thereby distinguishing coherent deformation clusters from spatial outliers. The method has been widely applied in spatial analysis and geohazard studies to identify local clustering structures and neighborhood-level spatial associations [
13,
20]. For each observation, Local Moran’s I was calculated as
where
and
represent standardized subsidence values and
denotes the spatial weight matrix defining neighborhood relationships. The same 150 m neighborhood distance employed in the Gi* analysis was adopted for consistency.
Based on the relationship between each observation and its surrounding neighbors, four local spatial association classes were identified: High–High (HH), Low–Low (LL), High–Low (HL), and Low–High (LH) [
20]. HH clusters represent areas where high subsidence values are surrounded by similarly high values and are therefore indicative of coherent deformation nuclei. Conversely, HL and LH patterns identify potential spatial outliers, while LL clusters indicate spatial concentrations of relatively low subsidence values. Local Moran’s I results were subsequently incorporated into the composite severity assessment to account for local spatial organization and neighborhood similarity. The identification of HH deformation clusters is particularly valuable for hazard-oriented analyses because it highlights areas where severe subsidence is spatially reinforced by neighboring observations, thereby indicating persistent and spatially coherent deformation zones [
13].
2.7. Composite Severity Index, Hazard-Zone Delineation, and Critical Hotspot Extraction
To integrate deformation magnitude and spatial statistical information into a single hazard-oriented indicator, a Composite Severity Index (CSI) was developed in this study. Similar multi-criteria approaches have increasingly been employed in geohazard and subsidence-risk assessments to transform deformation measurements into spatially explicit hazard information [
12,
13,
17]. The proposed index combines normalized subsidence rates, Getis–Ord Gi* hotspot significance, and Local Moran’s I spatial autocorrelation values according to:
where
D represents the normalized subsidence magnitude,
G denotes the normalized Gi* hotspot statistic, and
M corresponds to the normalized Local Moran’s I value. To remove ambiguity regarding the variable used in these calculations, all spatial statistics were computed on a non-negative subsidence-rate variable, defined as the sign-reversed vertical velocity for locations undergoing subsidence (vertical velocity < 0) and set to zero for stable or uplifting locations. The deformation component
D was obtained by min–max normalizing this subsidence-rate variable to the [0,1] range. Because Gi* and Local Moran’s I can take negative values (indicating cold spots or dispersed spatial patterns, respectively), the
G and
M components were obtained by first clipping negative values to zero and then applying the same min–max normalization, so that only positive spatial-association signals contribute to the CSI. Because deformation magnitude directly reflects the physical intensity of land subsidence and its potential impact on infrastructure and the built environment, it was assigned the highest weight (50%). Getis–Ord Gi* hotspot significance was assigned a secondary weight (30%) to account for the spatial concentration and statistical significance of subsiding areas [
18,
19]. Local Moran’s I was assigned a lower weight (20%) because it primarily characterizes local spatial autocorrelation patterns and neighborhood similarity rather than the magnitude of deformation itself [
20]. This weighting scheme prioritizes the physical severity of subsidence while simultaneously incorporating the spatial organization and clustering behavior of deformation patterns. The weighting framework was intentionally designed to emphasize deformation intensity while preserving the contribution of spatial clustering indicators to hazard delineation. The selected weighting coefficients were determined through exploratory evaluation and were intended to prioritize physical deformation severity while preserving the contribution of spatial clustering metrics. Alternative weighting combinations were examined, but the adopted scheme (0.50/0.30/0.20) provided a balanced representation of deformation magnitude, hotspot significance, and local spatial organization. It should be noted that, because Local Moran’s I is positive for both High–High (HH) and Low–Low (LL) spatial associations, the
M component as implemented does not explicitly discriminate between these two cluster types; a strongly clustered low-subsidence (LL) location could, in principle, contribute a small positive value to
M. In practice this has negligible influence on the resulting CSI, because such locations also carry a near-zero
D term (50% weight) and a non-positive Gi* value that is clipped to zero in the
G term (30% weight), so the overall CSI for LL locations remains low irrespective of the
M contribution. An HH-restricted formulation of
M (e.g., retaining only statistically significant HH clusters) constitutes a natural refinement for future implementations of the proposed framework.
The resulting CSI values were classified into four severity levels (low, medium, high, and critical) using the Jenks Natural Breaks classification method [
21]. This classification approach identifies natural groupings within the data by minimizing within-class variance and maximizing between-class variance and has been widely applied in hazard-zonation studies [
13,
16]. Continuous areas classified as medium, high, or critical severity were subsequently merged through spatial connectivity analysis to delineate subsidence hazard zones.
To identify the most severe subsidence nuclei within the broader hazard zones, only observations classified as high or critical severity were retained and subjected to Density-Based Spatial Clustering of Applications with Noise (DBSCAN) analysis [
22]. Clusters were generated using an epsilon parameter of 0.35 and a minimum sample threshold of 10 observations. Unlike conventional threshold-based mapping approaches, DBSCAN identifies spatially coherent clusters while simultaneously excluding isolated observations interpreted as noise. The resulting clusters were interpreted as statistically significant critical hotspots representing the most intense and spatially coherent subsidence areas within the study region. This procedure enabled the hierarchical identification of hazard zones at the regional scale and critical hotspot nuclei at the local scale, thereby providing a multi-level framework for land-subsidence hazard assessment.
These parameters were determined through exploratory sensitivity analyses aimed at balancing cluster continuity and noise suppression. Smaller epsilon values produced fragmented clusters, whereas larger values excessively merged neighboring deformation areas. Similarly, lower minimum sample values increased sensitivity to isolated observations interpreted as noise. The selected parameters ( and ) provided stable and spatially coherent clusters that best represented the dominant subsidence belt identified within the study area. Clustering was performed not in raw geographic or projected coordinates but in a standardized four-dimensional feature space comprising longitude, latitude, subsidence rate (mm/yr), and the composite severity score, each standardized to zero mean and unit variance (z-score) prior to clustering. Consequently, the DBSCAN parameter (0.35) represents a Euclidean distance threshold in this dimensionless standardized space, jointly reflecting spatial proximity and similarity in deformation magnitude and severity, rather than a purely geographic distance in degrees or meters. This formulation was adopted so that the clustering would identify contiguous zones that are simultaneously close in location and comparable in hazard intensity, rather than relying on spatial adjacency alone.
3. Results
3.1. Vertical Deformation Characteristics
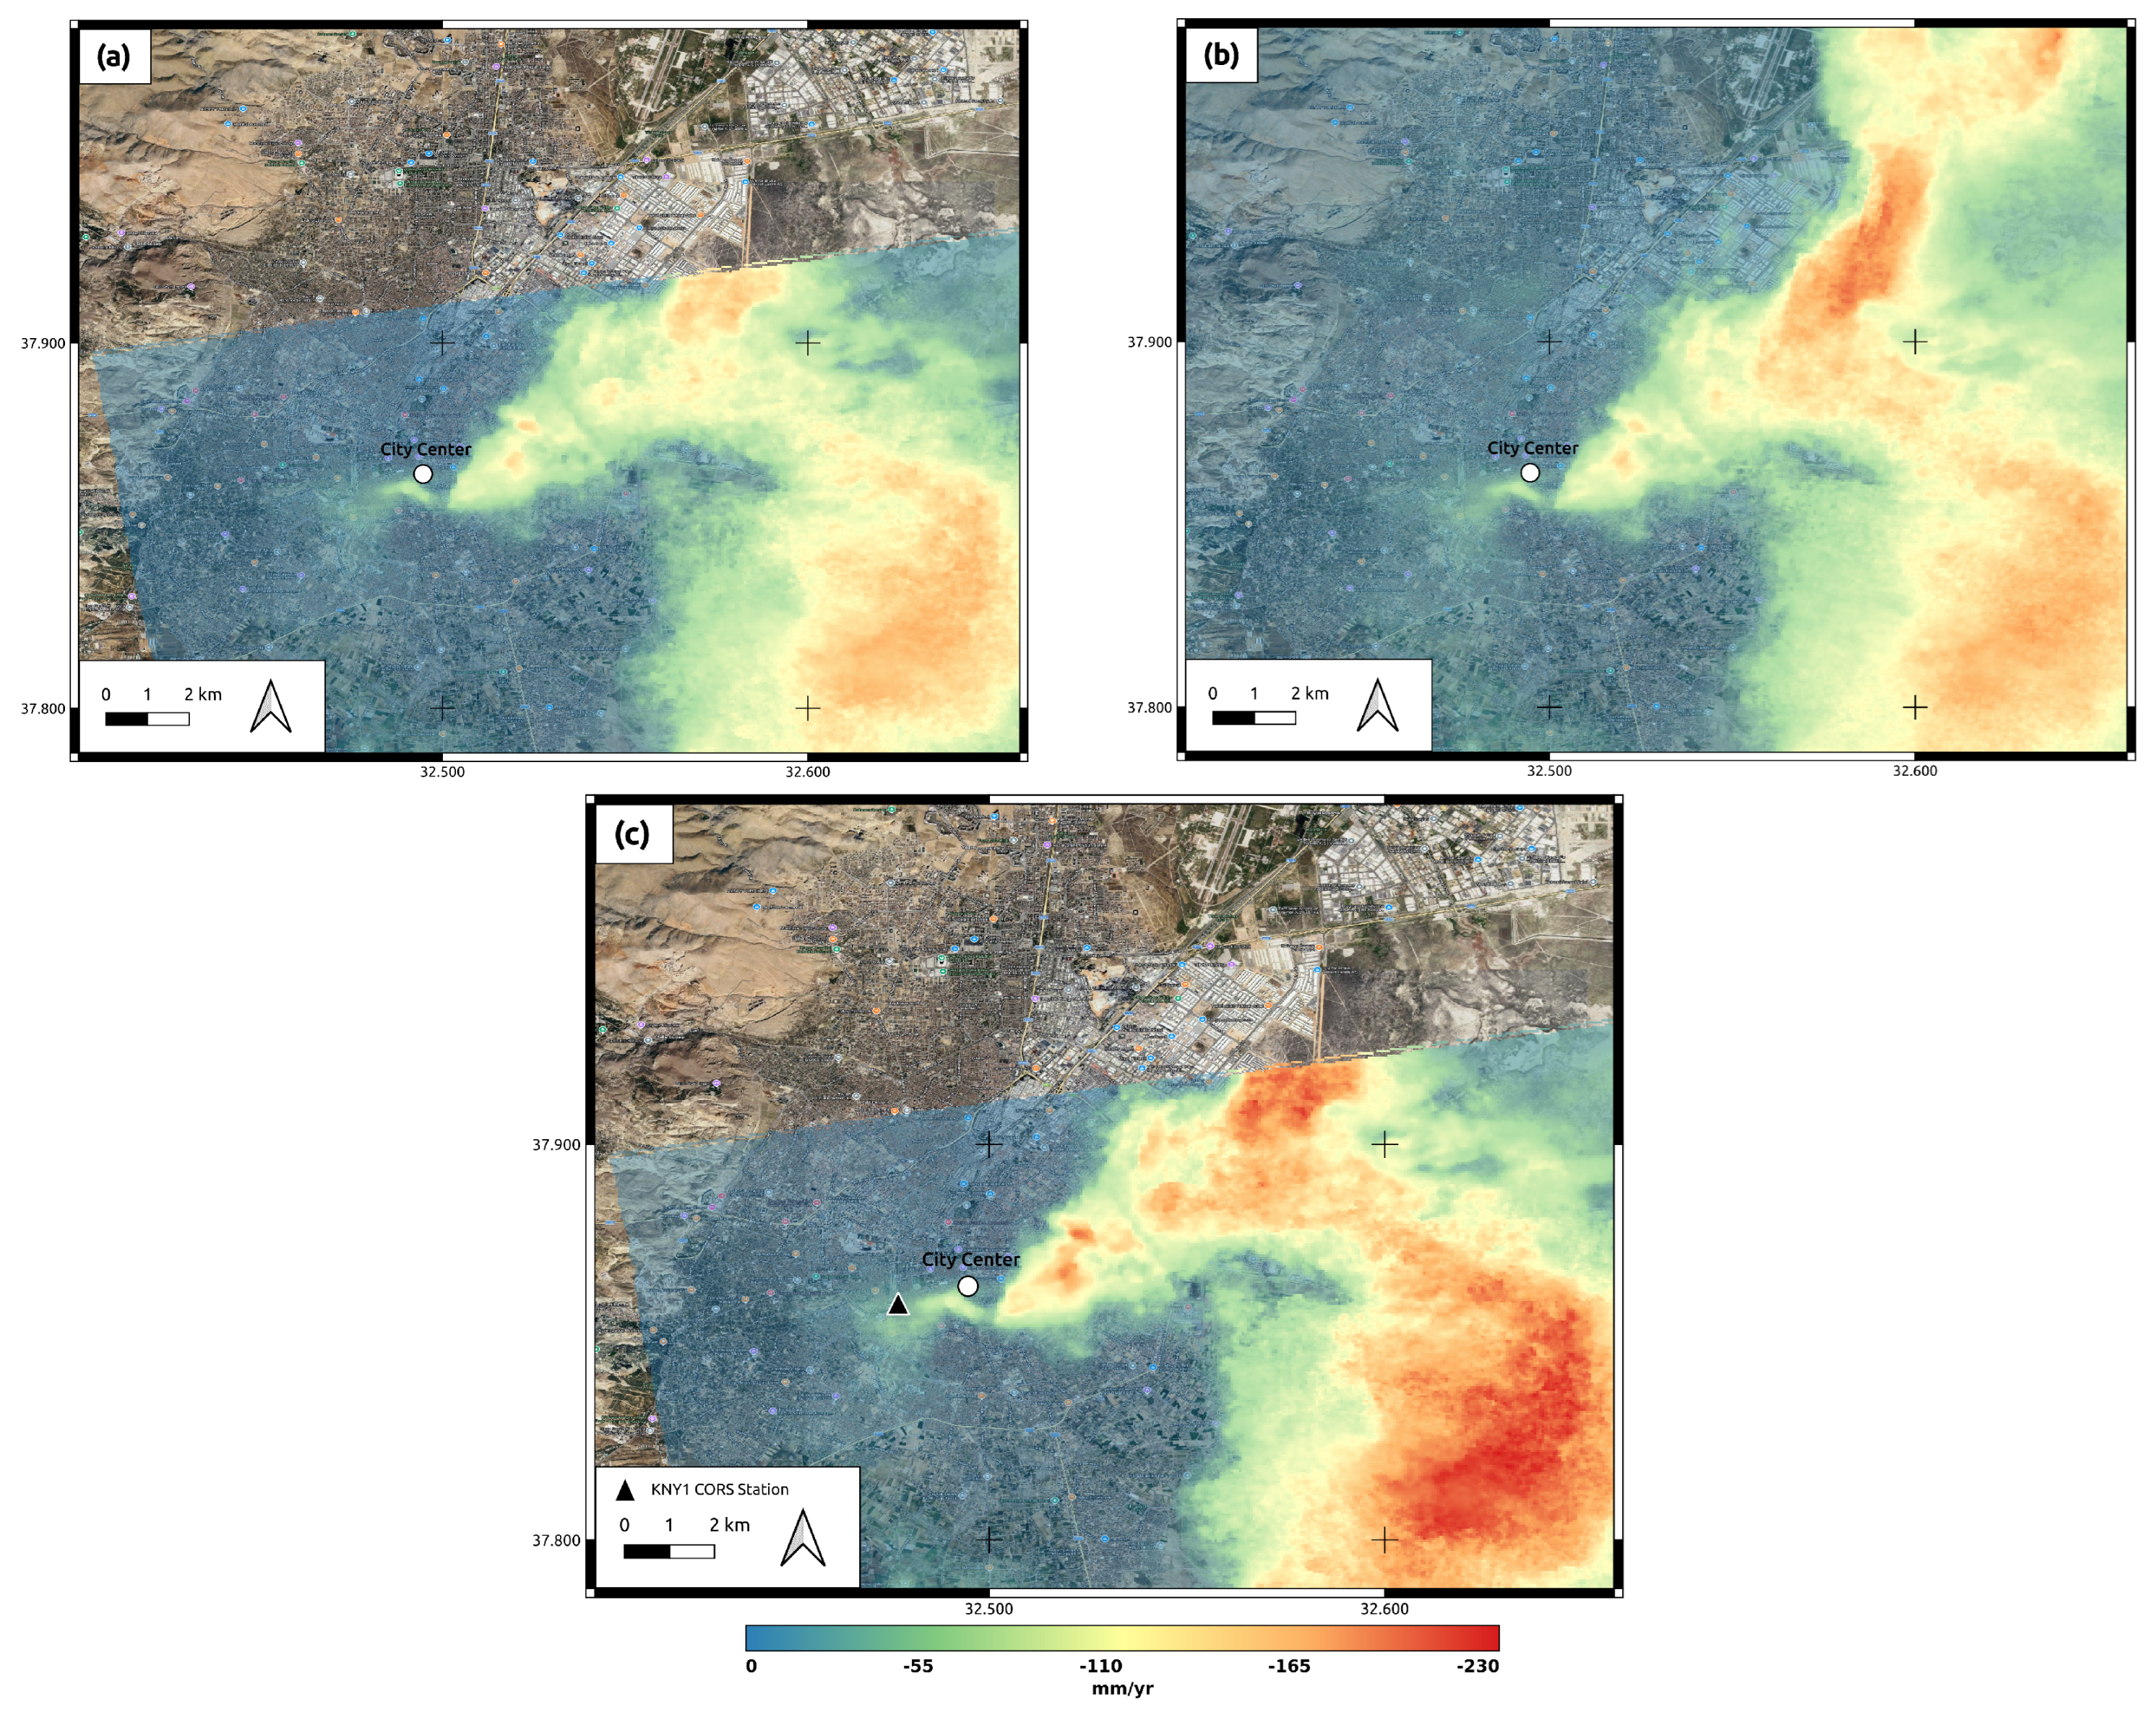
The vertical deformation velocity map derived from the combined ascending and descending SBAS-InSAR datasets reveals a heterogeneous pattern of ground motion across the Konya metropolitan area (
Figure 3). While most parts of the study area exhibited relatively stable conditions or low deformation rates, a pronounced subsidence zone was identified in the eastern sector of the metropolitan area. Maximum vertical subsidence rates approached 230 mm/yr, indicating that land subsidence remains an active and significant geohazard within the region.
The spatial distribution of deformation demonstrates that subsidence is not randomly distributed across the study area but is concentrated within a continuous north–south-oriented deformation corridor extending through the eastern part of the metropolitan area. This deformation corridor contains the highest subsidence rates observed during the monitoring period and coincides with areas characterized by intensive groundwater exploitation and extensive agricultural activities. In contrast, western and northwestern sectors of the study area exhibited comparatively lower deformation rates and more stable ground conditions.
The vertical deformation map further indicates that the deformation corridor is characterized by a gradual transition from relatively stable conditions toward increasingly severe subsidence zones, suggesting the presence of a spatially coherent deformation system rather than isolated subsidence patches. Several sectors within the corridor exhibit extensive areas with subsidence rates exceeding 100 mm/yr, while the most severely affected zones approach 230 mm/yr. This spatial continuity implies that the ongoing deformation is controlled by regional-scale hydrogeological processes associated with long-term groundwater depletion.
Compared with previous investigations conducted in the Konya metropolitan area, the observed deformation rates indicate that subsidence remains active and locally exceeds values reported in several earlier studies [
8,
9,
11]. The persistence, magnitude, and spatial continuity of the deformation corridor suggest that groundwater-related compaction processes continue to affect large portions of the metropolitan area and may be intensifying in specific sectors of eastern Konya.
3.2. GNSS Validation and Temporal Evolution of Subsidence
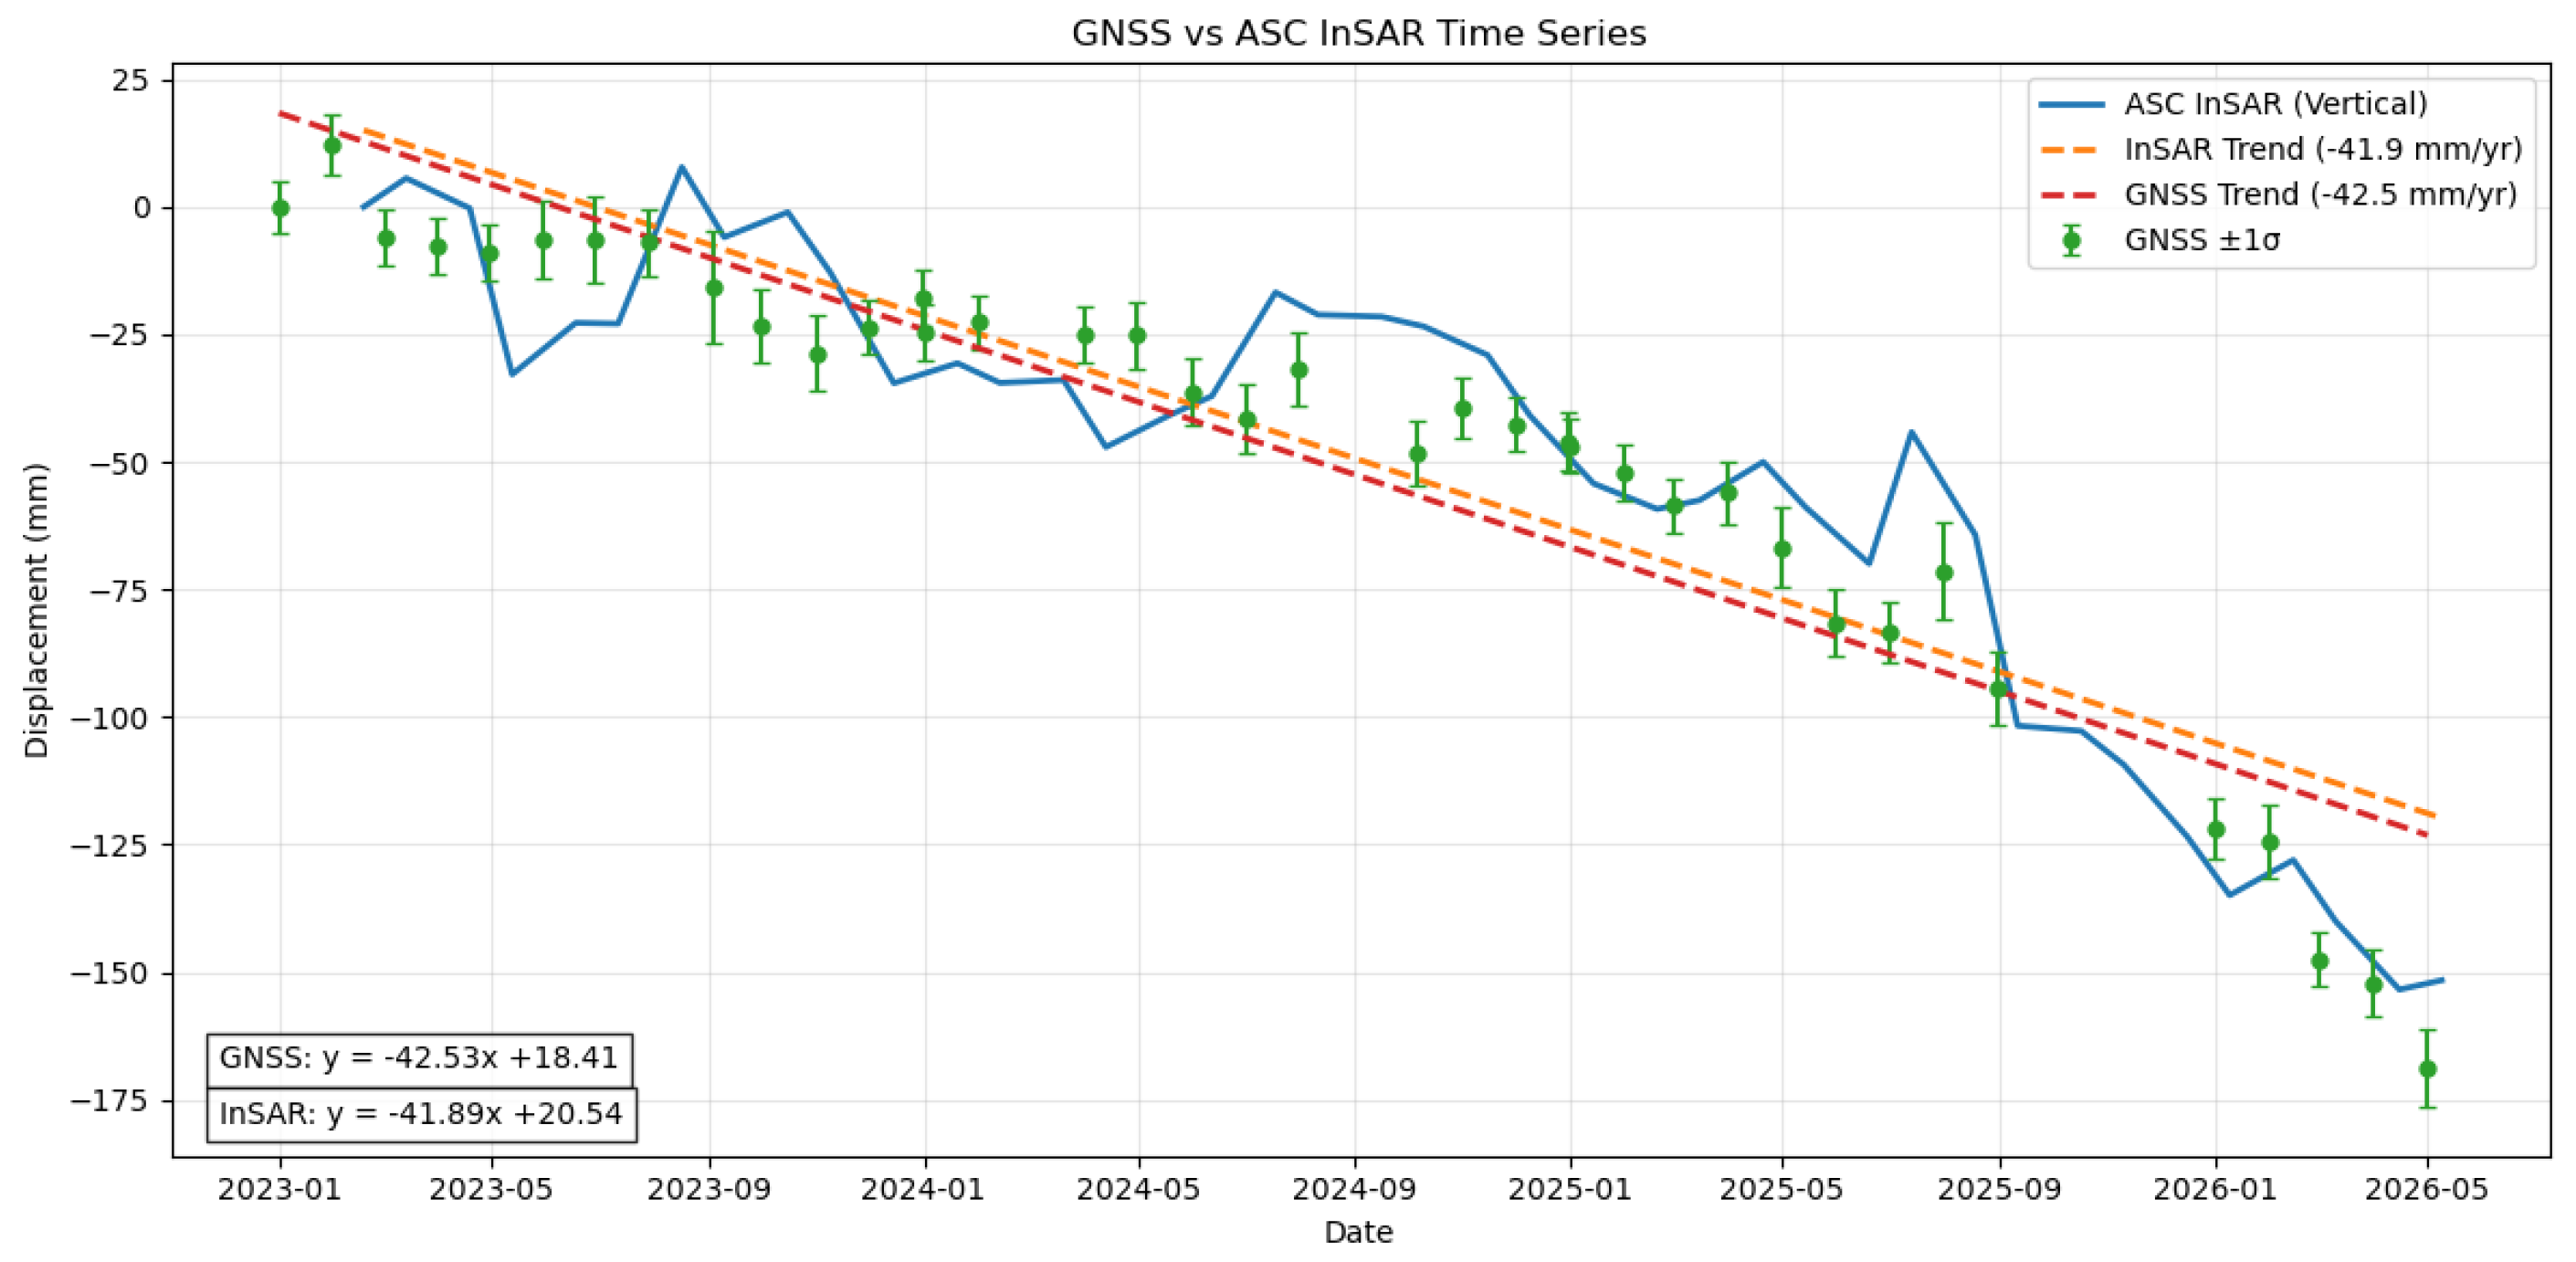
To evaluate the reliability of the SBAS-InSAR deformation estimates, the InSAR time series was compared with observations from the KNY1 station of the Turkish CORS-TR GNSS network (
Figure 4). The GNSS data were processed using the GAMIT/GLOBK software package, version 10.71, within the International Terrestrial Reference Frame (ITRF), which was realized using surrounding International GNSS Service (IGS) reference stations [
23].
The KNY1 station is located near the Konya city center, approximately at the western margin of the principal subsidence corridor identified by the InSAR analysis (
Figure 3c). Although the station is not situated within the area exhibiting the highest subsidence rates, it provides an independent geodetic reference for assessing long-term ground-motion behavior in the urban area.
The InSAR-derived displacement value at the KNY1 station location was extracted directly from the SBAS-derived vertical-velocity and displacement grids using the GMT grdtrack utility, sampling the grid at the exact GNSS station coordinates rather than averaging over a surrounding pixel window. Both the GNSS and InSAR displacement time series were normalized to a common reference epoch by setting the displacement of the first observation period to zero, consistent with the relative (network-inversion) reference convention adopted in the GMTSAR SBAS processing.
The comparison demonstrates a strong agreement between the GNSS and InSAR displacement time series throughout the observation period (
Figure 4). Linear regression analysis yielded an average subsidence rate of approximately
mm/yr from the GNSS observations and
mm/yr from the InSAR-derived vertical displacement series. The difference between the two estimates is less than 1 mm/yr, indicating excellent consistency between the independent measurement techniques. Beyond this long-term trend comparison, epoch-to-epoch agreement between the two time series was further quantified, yielding a root-mean-square error (RMSE) of approximately 13 mm, a mean absolute error (MAE) of approximately 12 mm, and a Pearson correlation coefficient of
, confirming that the short-term temporal behavior of the two independent datasets is also closely aligned.
To quantitatively assess the marked increase in cumulative subsidence observed after 2025, segmented linear trends were fitted separately to the pre-2025 (January 2023–December 2024) and post-2025 (January 2025–May 2026) portions of both time series. The GNSS-derived rate increased from approximately mm/yr before 2025 to approximately mm/yr thereafter, while the InSAR-derived rate showed a consistent increase from approximately mm/yr to approximately mm/yr over the same periods. This corresponds to an approximately four-fold acceleration of subsidence that is independently detected by both the GNSS and InSAR datasets, providing quantitative support for the previously qualitative observation of post-2025 acceleration.
Overall, the close correspondence between the GNSS and InSAR observations confirms the reliability of the SBAS-InSAR-derived deformation time series and demonstrates that the observed temporal evolution of subsidence is consistently detected by both datasets. It should be noted that this validation relies on a single GNSS station located at the margin of the deformation corridor rather than within its highest-subsidence core; consequently, while the results confirm the reliability of the InSAR time series where co-location is available, they do not by themselves guarantee equivalent accuracy within the critical-severity zone, where no independent geodetic observations were available for direct comparison.
3.3. Spatial Clustering of Land Subsidence
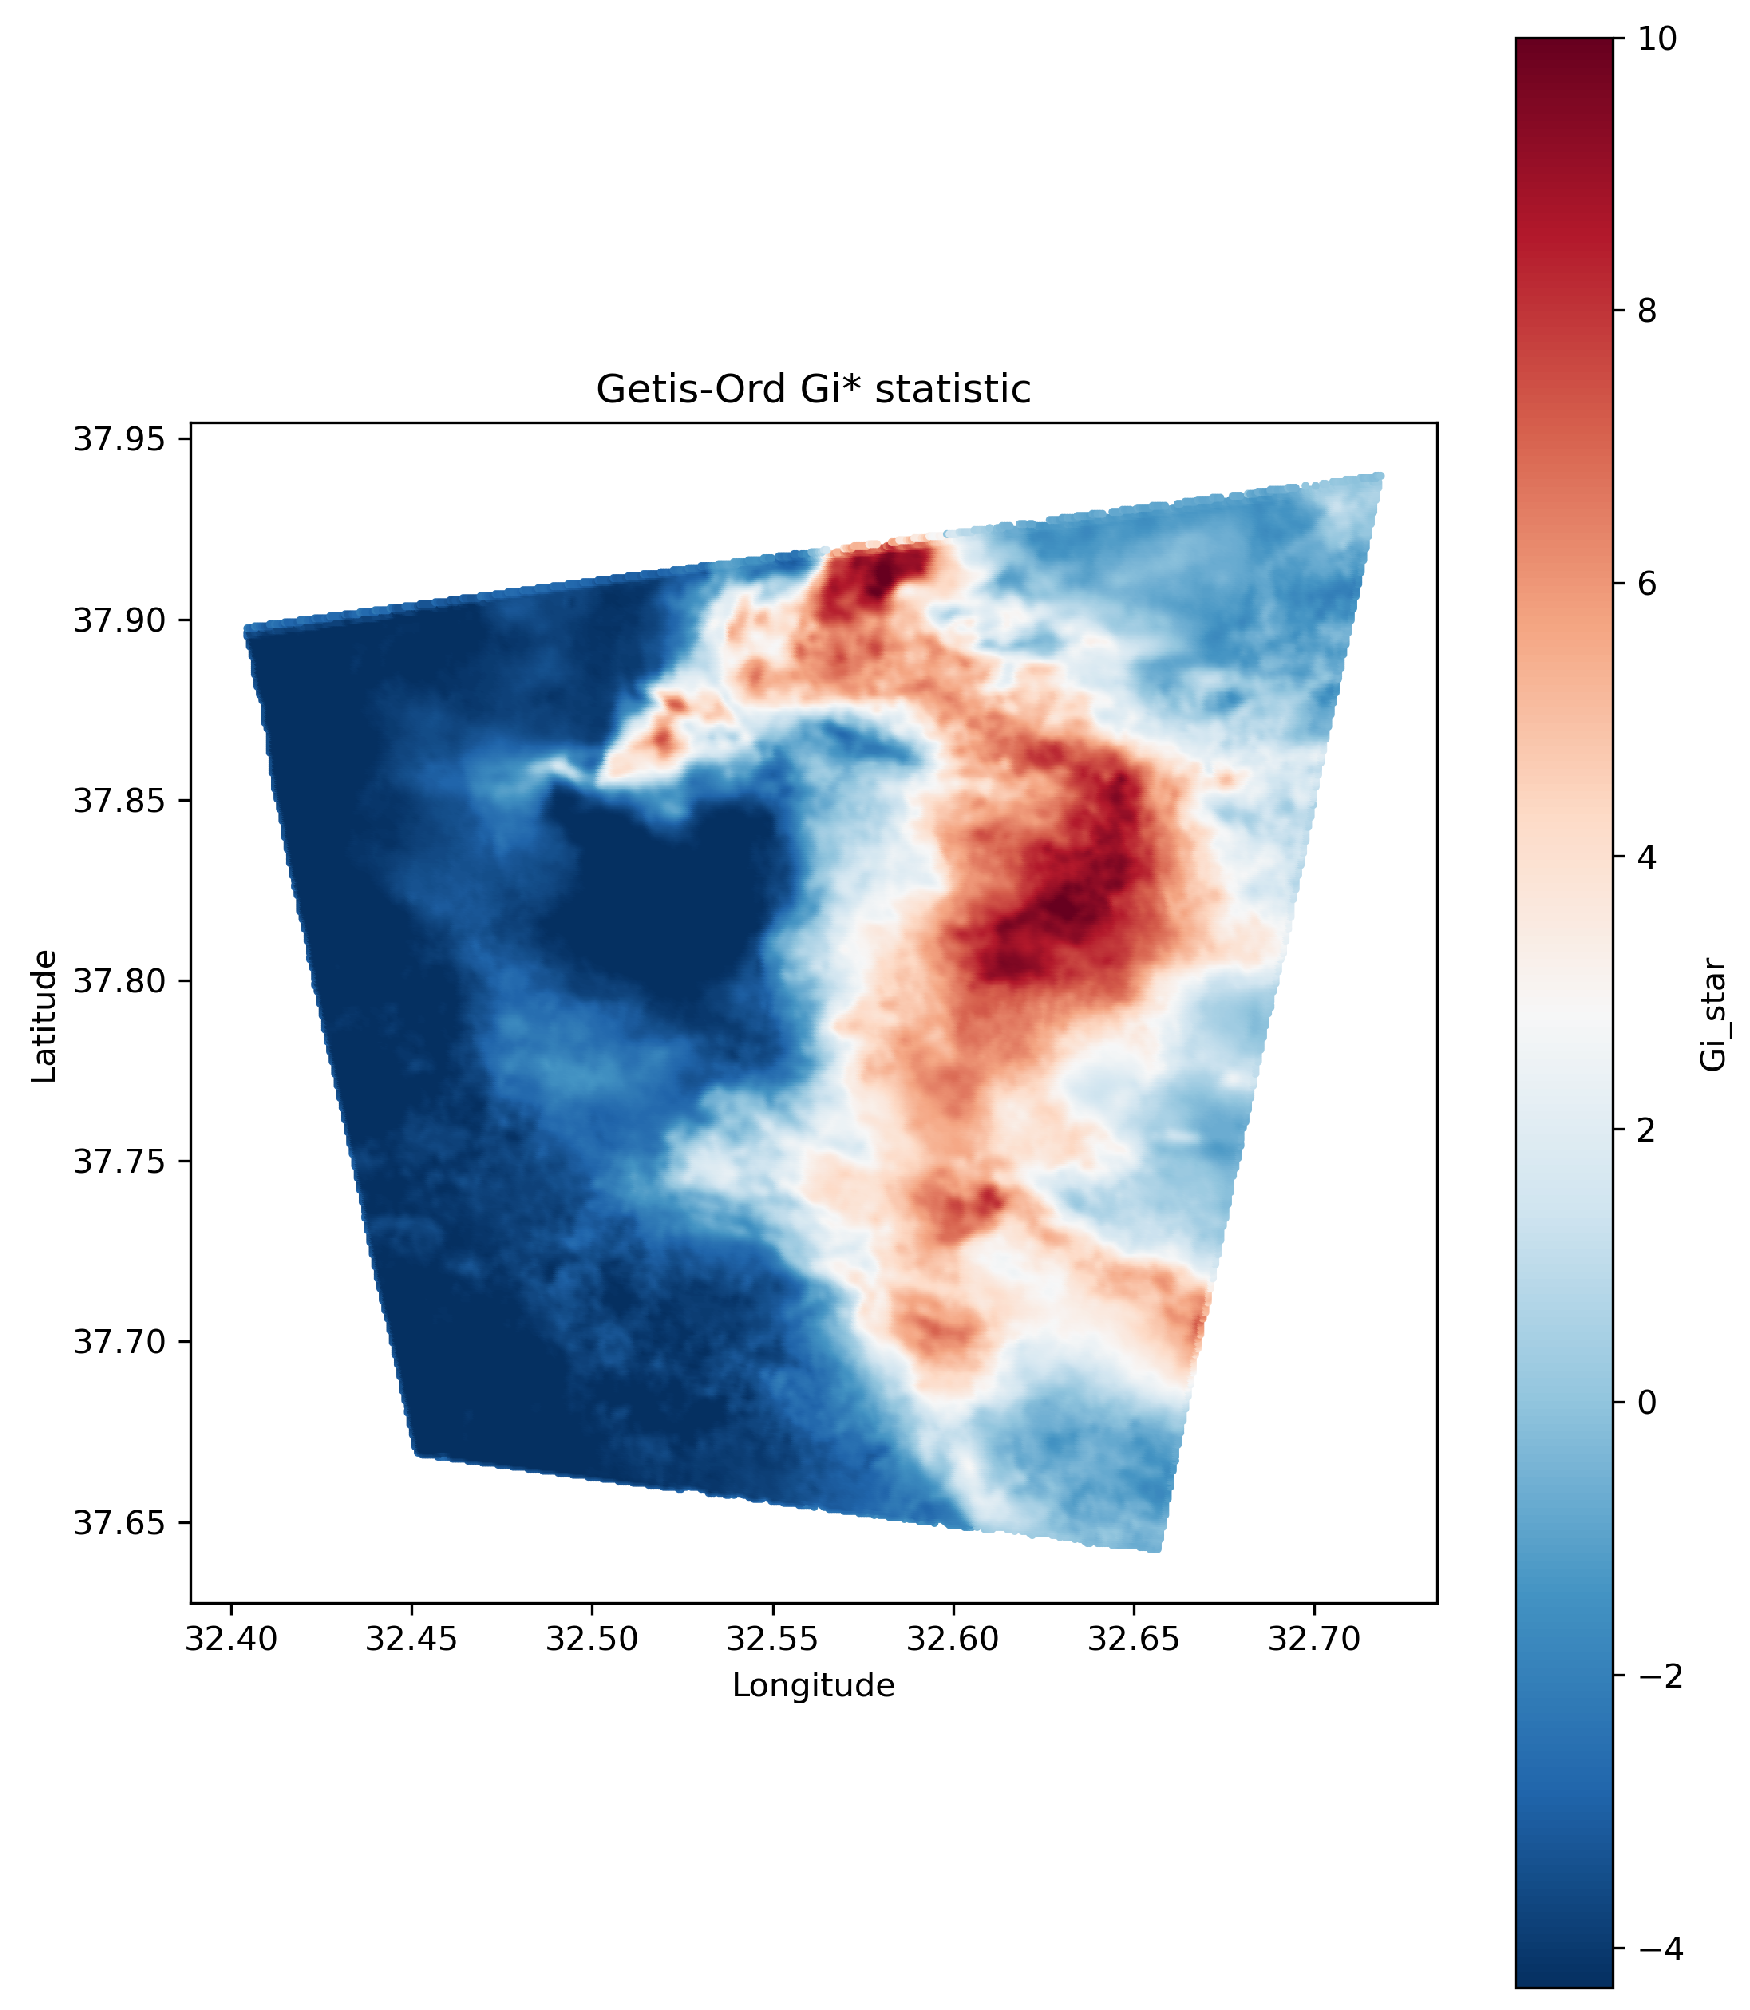
The Getis–Ord Gi* hotspot analysis revealed a pronounced concentration of statistically significant subsidence hotspots within the eastern sector of the study area (
Figure 5). Positive Gi* values formed a continuous north–south-oriented hotspot corridor that closely coincided with the principal deformation belt identified in the vertical deformation-rate map. The strongest hotspot intensities were observed in the northern and central sections of this corridor, where Gi* values exceeded 8 and locally approached the highest values observed in the dataset.
Hotspots identified at the 99% confidence level covered approximately 187.1 km2, while additional hotspot areas of approximately 25.6 km2 and 13.5 km2 were detected at the 95% and 90% confidence levels, respectively. In contrast, the western portion of the study area was dominated by negative Gi* values, indicating statistically significant cold spots associated with comparatively stable ground conditions.
Local Moran’s I analysis further confirmed the existence of strong spatial autocorrelation within the deformation field. High–High (HH) clusters occupied approximately 296.7 km2 and largely overlapped the hotspot corridor identified by the Gi* analysis, whereas Low–Low (LL) clusters covered approximately 366.5 km2 and corresponded to relatively stable sectors. Spatial outliers represented only a negligible fraction of the study area, indicating that deformation is organized into coherent clusters rather than isolated anomalies.
Together, the hotspot and spatial-autocorrelation analyses demonstrate that land subsidence in eastern Konya is characterized by strong spatial clustering and forms a continuous deformation belt rather than a collection of isolated subsidence centers.
3.4. Severity-Based Hazard Zonation and Critical Hotspots
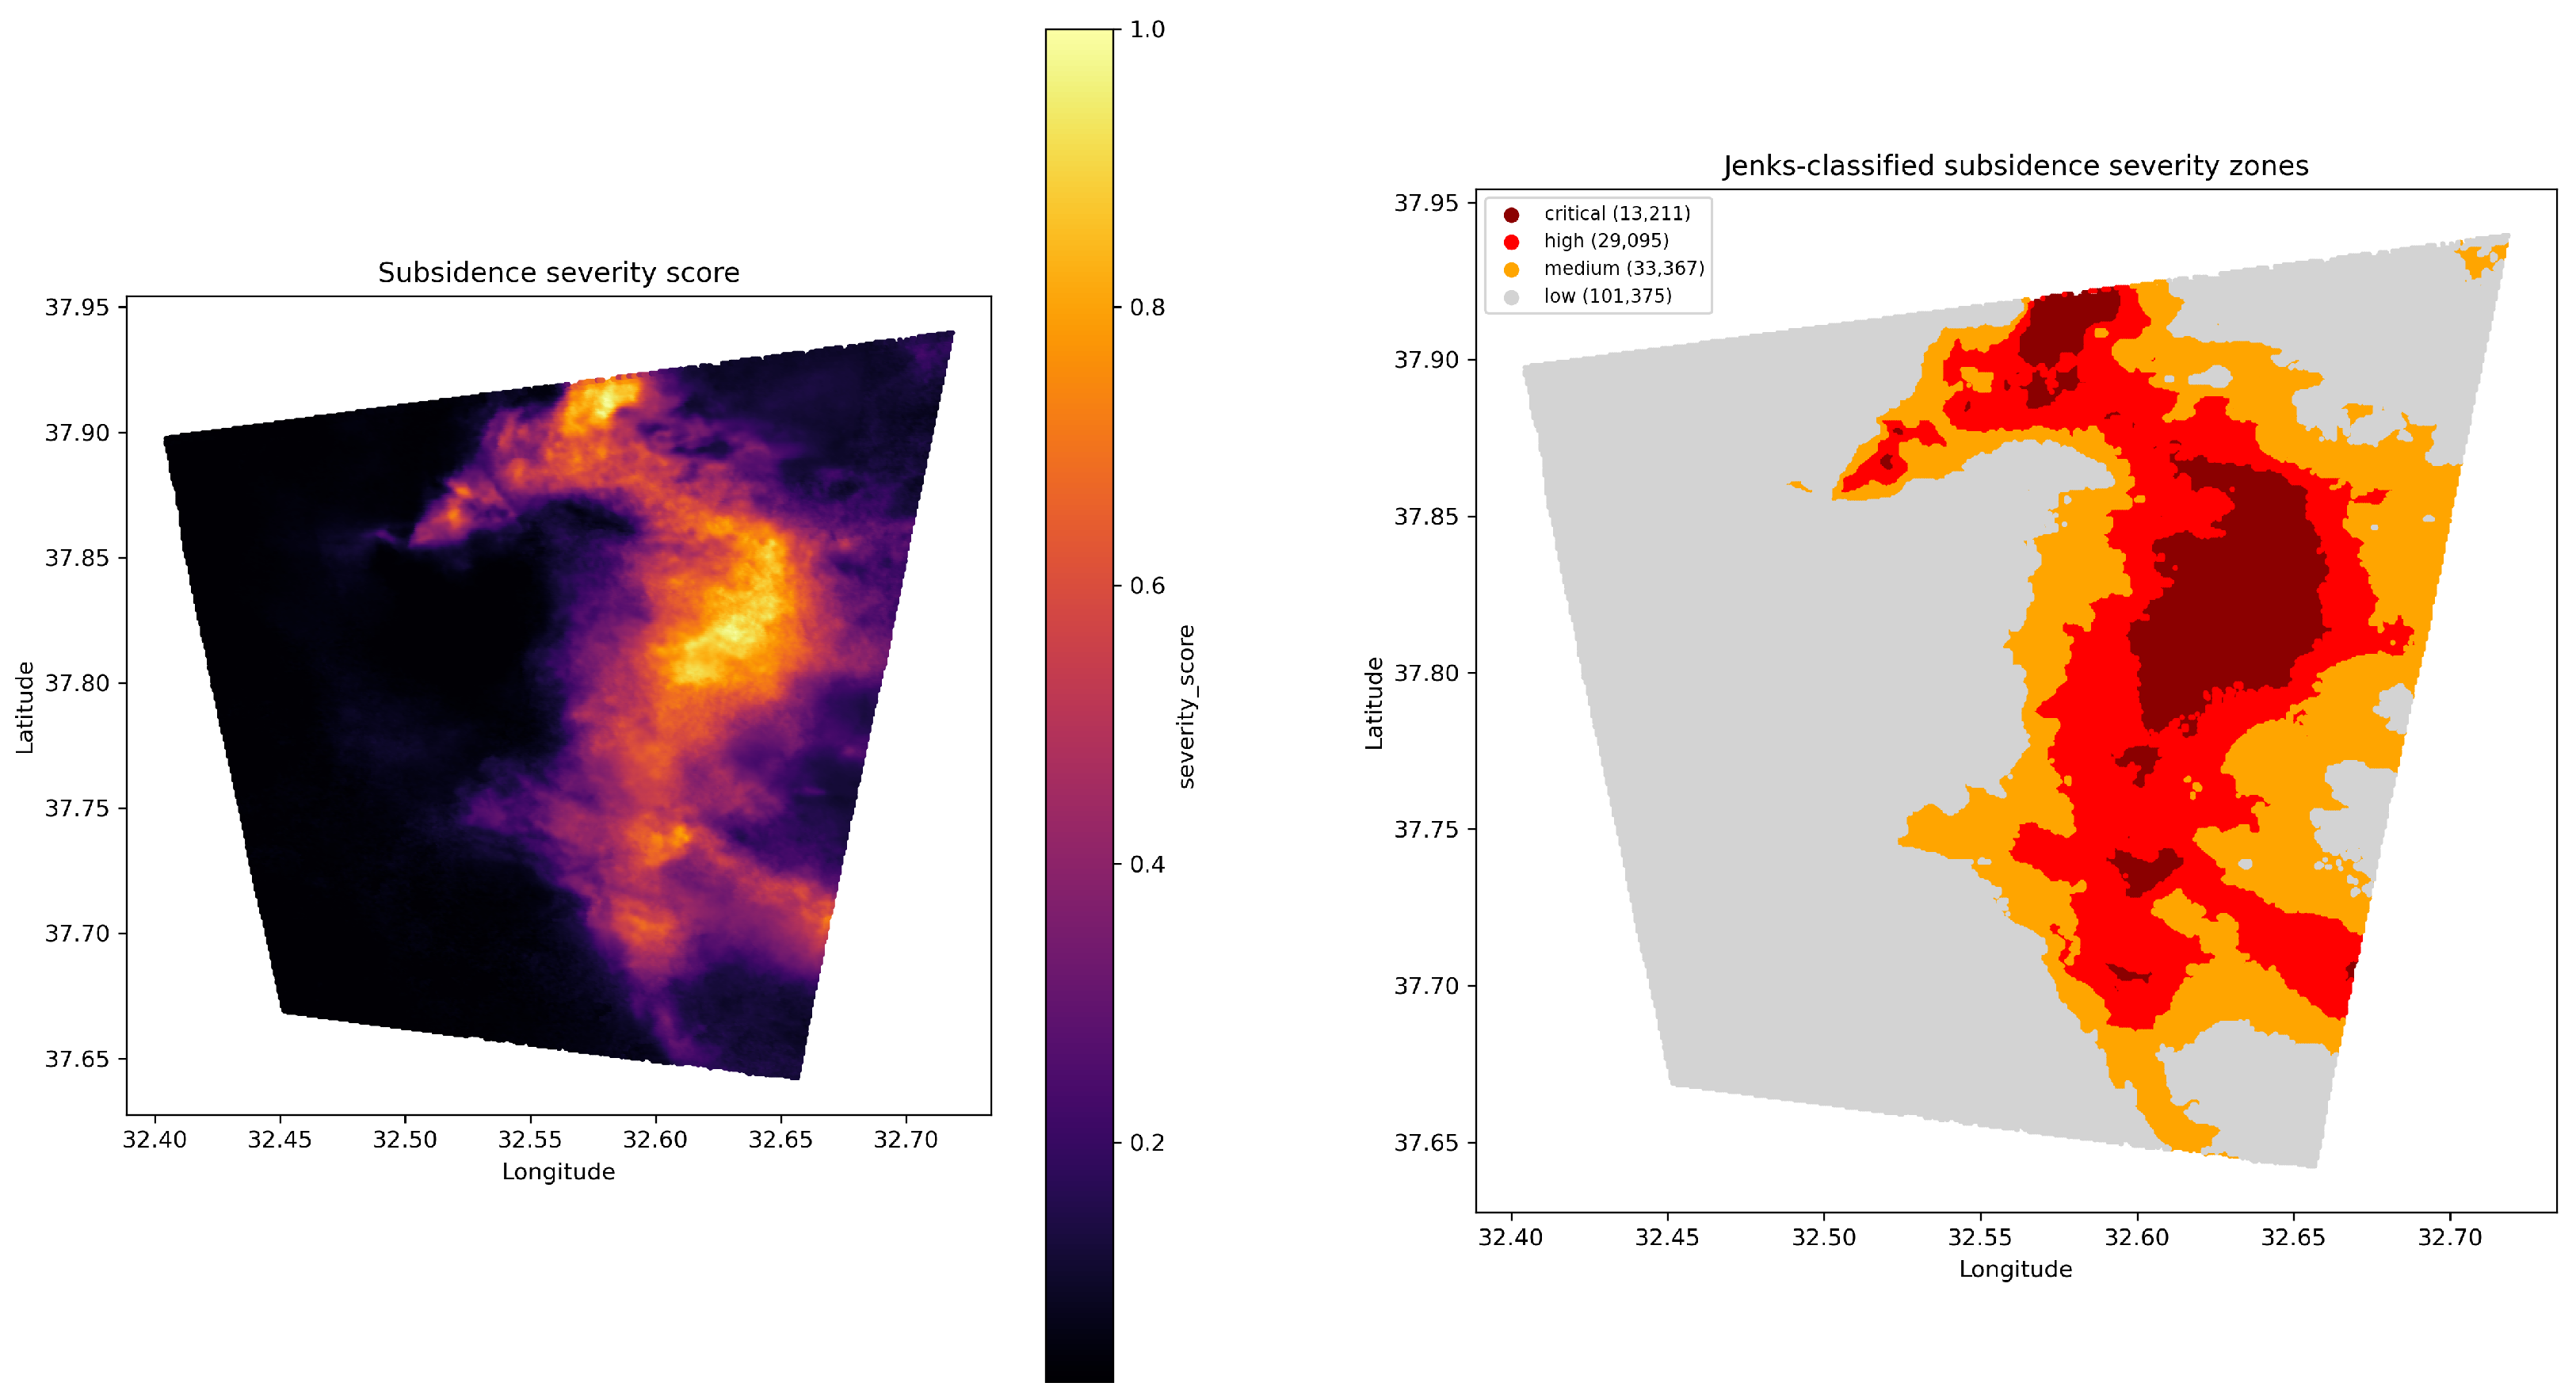
The integrated severity index successfully combined deformation magnitude, hotspot significance, and local spatial autocorrelation into a unified representation of subsidence hazard intensity (
Figure 6 left). Severity scores revealed a distinct concentration of elevated hazard levels within the eastern deformation corridor and progressively lower hazard levels toward the western sectors of the study area.
Jenks natural-break classification of the severity index produced four subsidence hazard categories: low, medium, high, and critical severity (
Figure 6 right). Low-severity zones occupied the largest area, covering approximately 382.8 km
2, whereas medium-severity zones extended across approximately 126.0 km
2. High-severity zones occupied approximately 109.9 km
2, while critical-severity areas covered approximately 49.9 km
2.
The spatial distribution of hazard classes revealed a nested zonation pattern. Critical-severity zones were concentrated along the central axis of the deformation corridor, where subsidence rates commonly exceeded 150 mm/yr and locally approached up to 215 mm/yr, consistent with the maximum subsidence rate reported for the critical-severity class given in later analysis. These areas also coincided with the highest Gi* and Local Moran’s I values, indicating strong spatial clustering of severe subsidence. High-severity zones surrounded the critical nuclei and gradually transitioned into medium-severity and low-severity areas toward the margins of the deformation belt.
The resulting hazard zonation demonstrates that subsidence severity increases systematically from the western stable sectors toward the eastern deformation corridor, providing a spatially explicit representation of subsidence hazard conditions across the metropolitan area.
Although the severity assessment classified subsidence conditions into four hazard levels, the spatial distribution of the high- and critical-severity classes indicates that these areas form a largely continuous north–south-oriented deformation belt rather than isolated hazard patches. This observation suggests that the most severe subsidence is organized within a spatially connected regional-scale deformation system.
3.5. Delineation of Critical Subsidence Hotspots
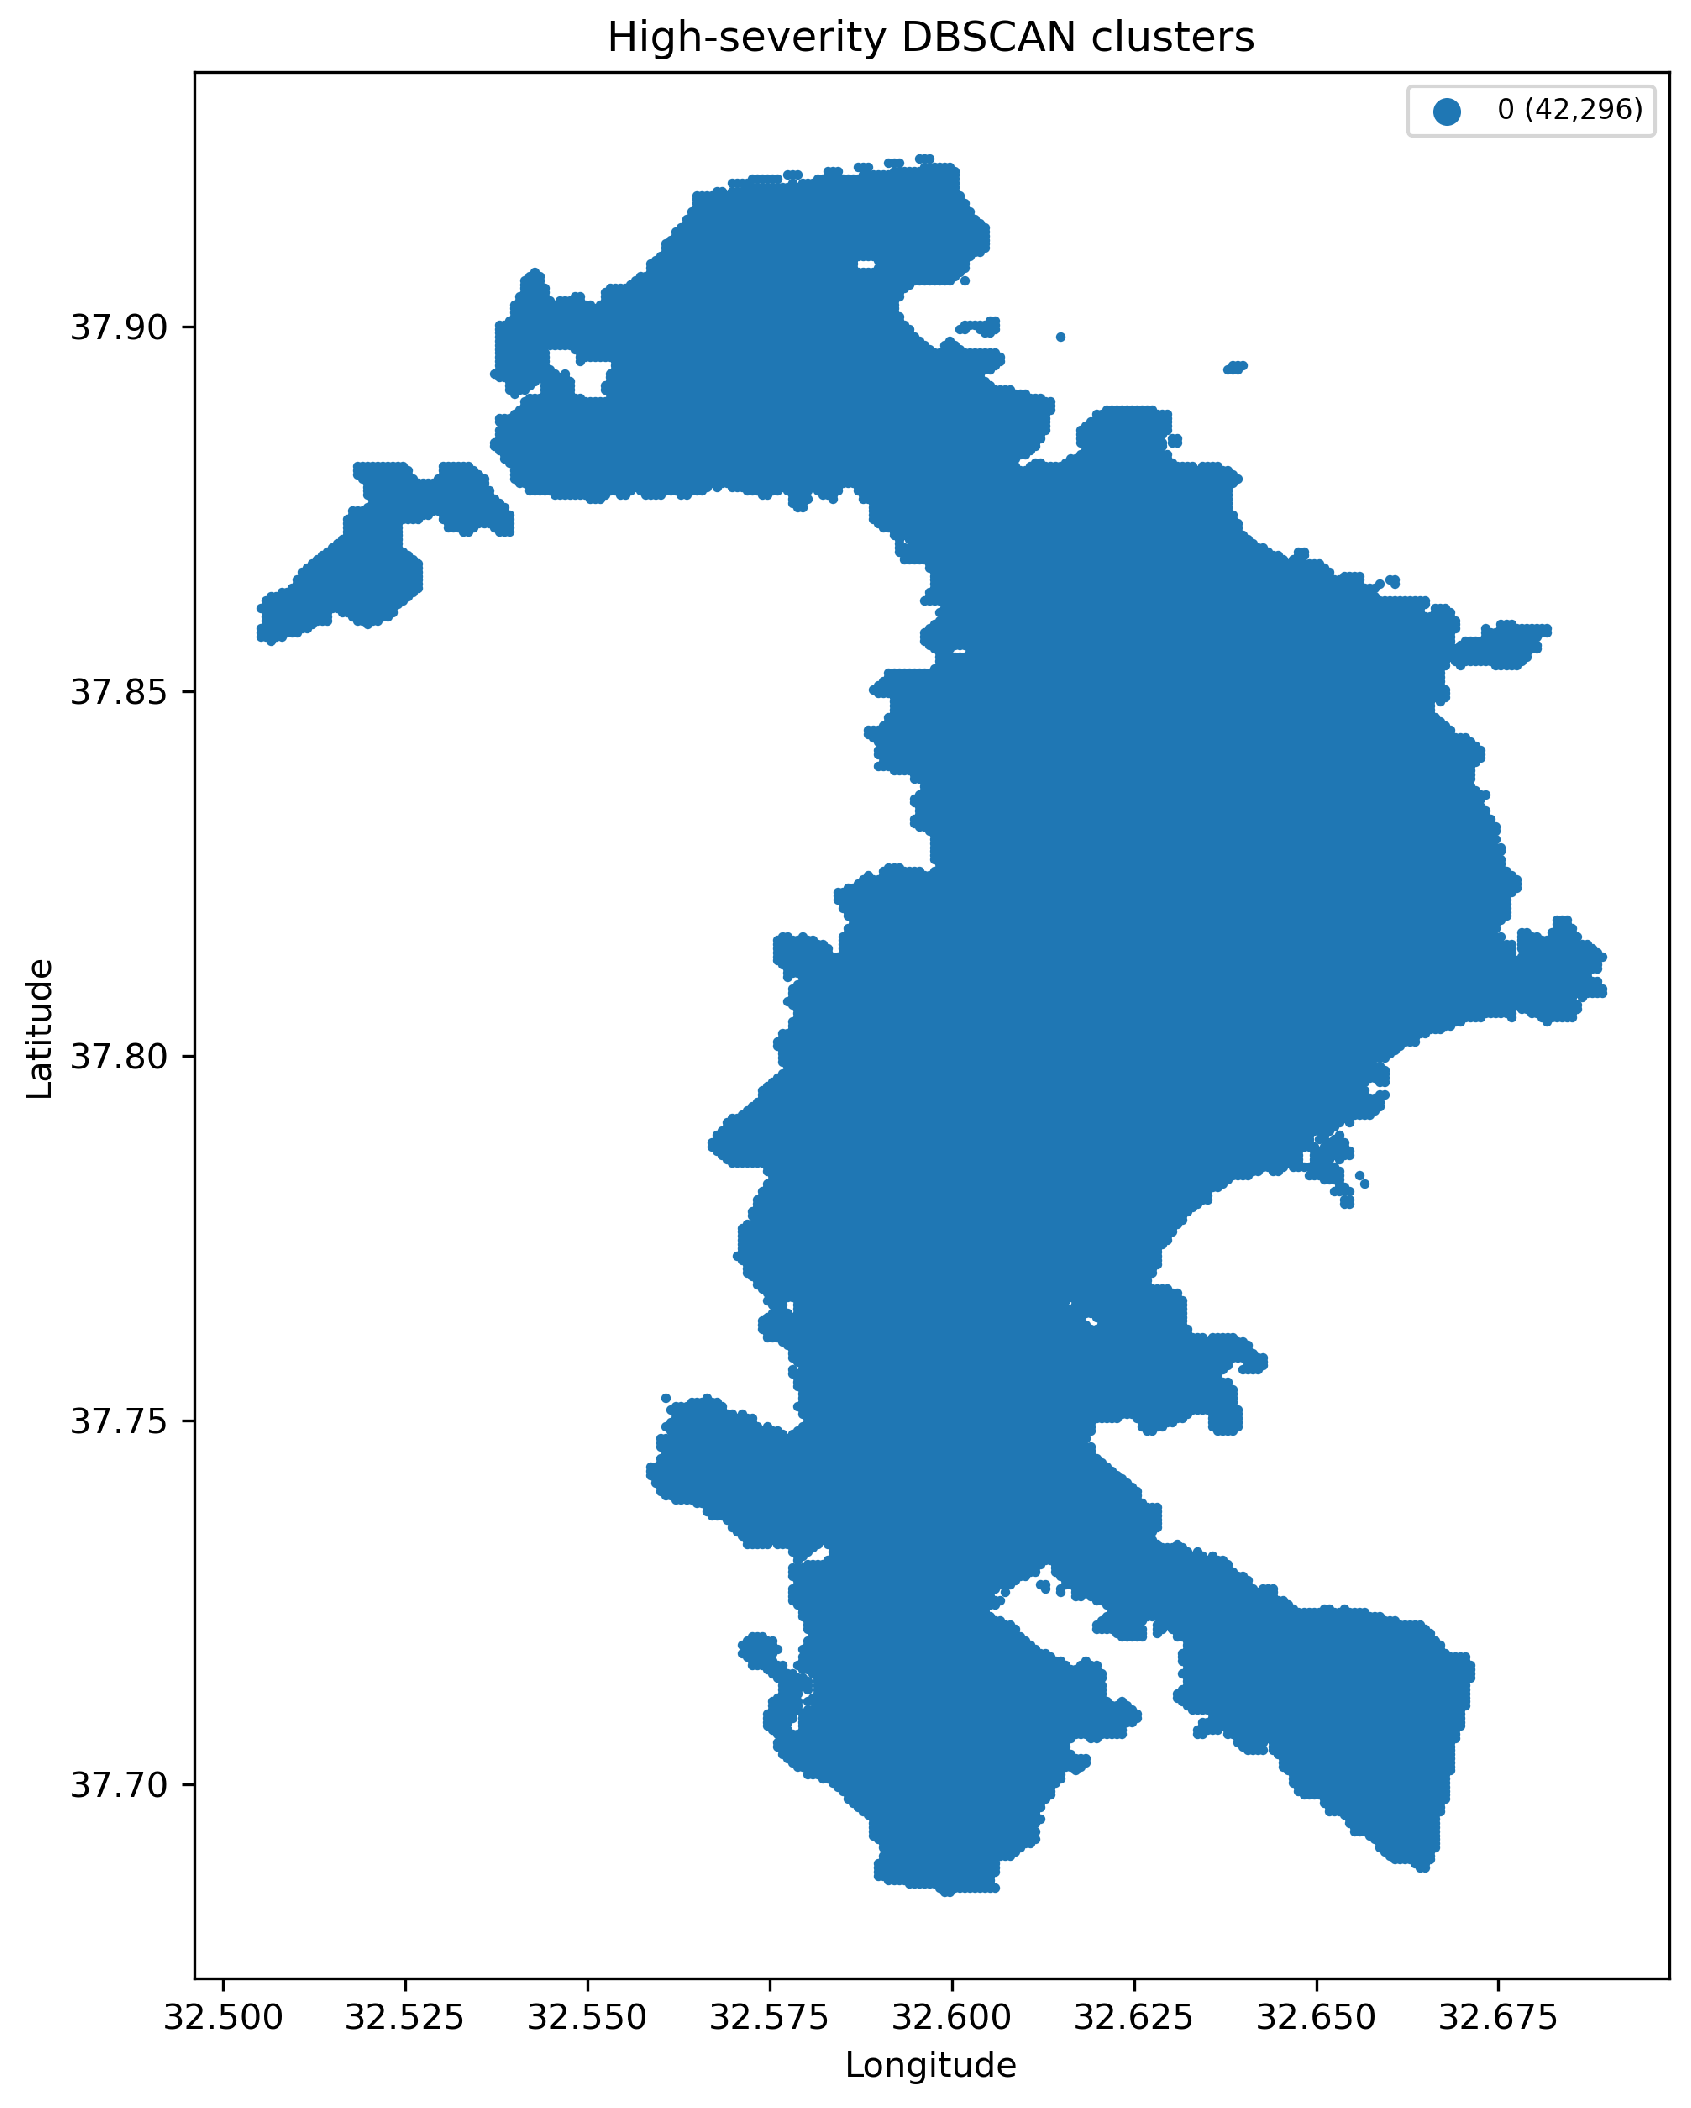
To identify the most hazardous sectors within the deformation corridor, DBSCAN clustering was applied to the high- and critical-severity classes derived from the hazard-zonation analysis. The clustering procedure identified a single dominant and spatially continuous hotspot belt extending across eastern Konya (
Figure 7).
The delineated hotspot belt occupied approximately 159.7 km2 and incorporated the majority of the most severe subsidence areas detected within the study region. Within this belt, the mean subsidence rate reached approximately 142.2 mm/yr, while the maximum deformation rate attained 215.3 mm/yr. The hotspot belt was additionally characterized by high average hotspot significance (mean Gi* = 5.59) and elevated local spatial autocorrelation (mean Local Moran’s I = 2.27), confirming the presence of strongly clustered and statistically significant deformation.
Unlike isolated subsidence centers, the clustered hotspots merged into a continuous north–south-oriented deformation belt. This pattern suggests that groundwater-related compaction processes operate at a regional scale and affect a broad hydrogeological system rather than localized sectors alone. Consequently, the delineated hotspot belt represents the principal subsidence hazard feature within the Konya metropolitan area and provides a practical spatial framework for groundwater-management planning, infrastructure-risk assessment, and long-term monitoring activities.
3.6. Sensitivity Analysis
To evaluate the robustness of the proposed hazard assessment framework, additional sensitivity analyses were performed for the CSI weighting scheme, neighborhood distance, DBSCAN clustering parameters, and Jenks Natural Breaks classification. The objective was to assess the influence of reasonable parameter variations on the resulting hazard maps and to demonstrate the stability of the proposed methodology.
3.6.1. Sensitivity of the Composite Severity Index Weighting Scheme
Alternative weighting configurations were evaluated to investigate the influence of weight allocation on the Composite Severity Index (CSI). In addition to the adopted weighting scheme, equal weighting, deformation-dominant weighting, and spatial-dominant weighting were tested. The resulting severity distributions, affected areas, and CSI statistics for each weighting configuration are summarized in
Table 2.
The spatial consistency of the resulting hazard maps was further evaluated using the Intersection over Union (IoU), Dice similarity coefficient, and overall spatial agreement. The comparison results are presented in
Table 3.
The spatial agreement analysis demonstrates that the proposed Composite Severity Index (CSI) is relatively robust to moderate variations in the weighting configuration. Overall agreement between the original weighting scheme and the alternative weighting schemes ranged from 84.8% to 94.2%, while the Dice similarity coefficient varied between 0.870 and 0.956. These consistently high agreement metrics indicate that the principal hazard patterns and critical subsidence zones remain largely unchanged despite reasonable modifications to the adopted weighting scheme.
3.6.2. Sensitivity to Neighborhood Distance
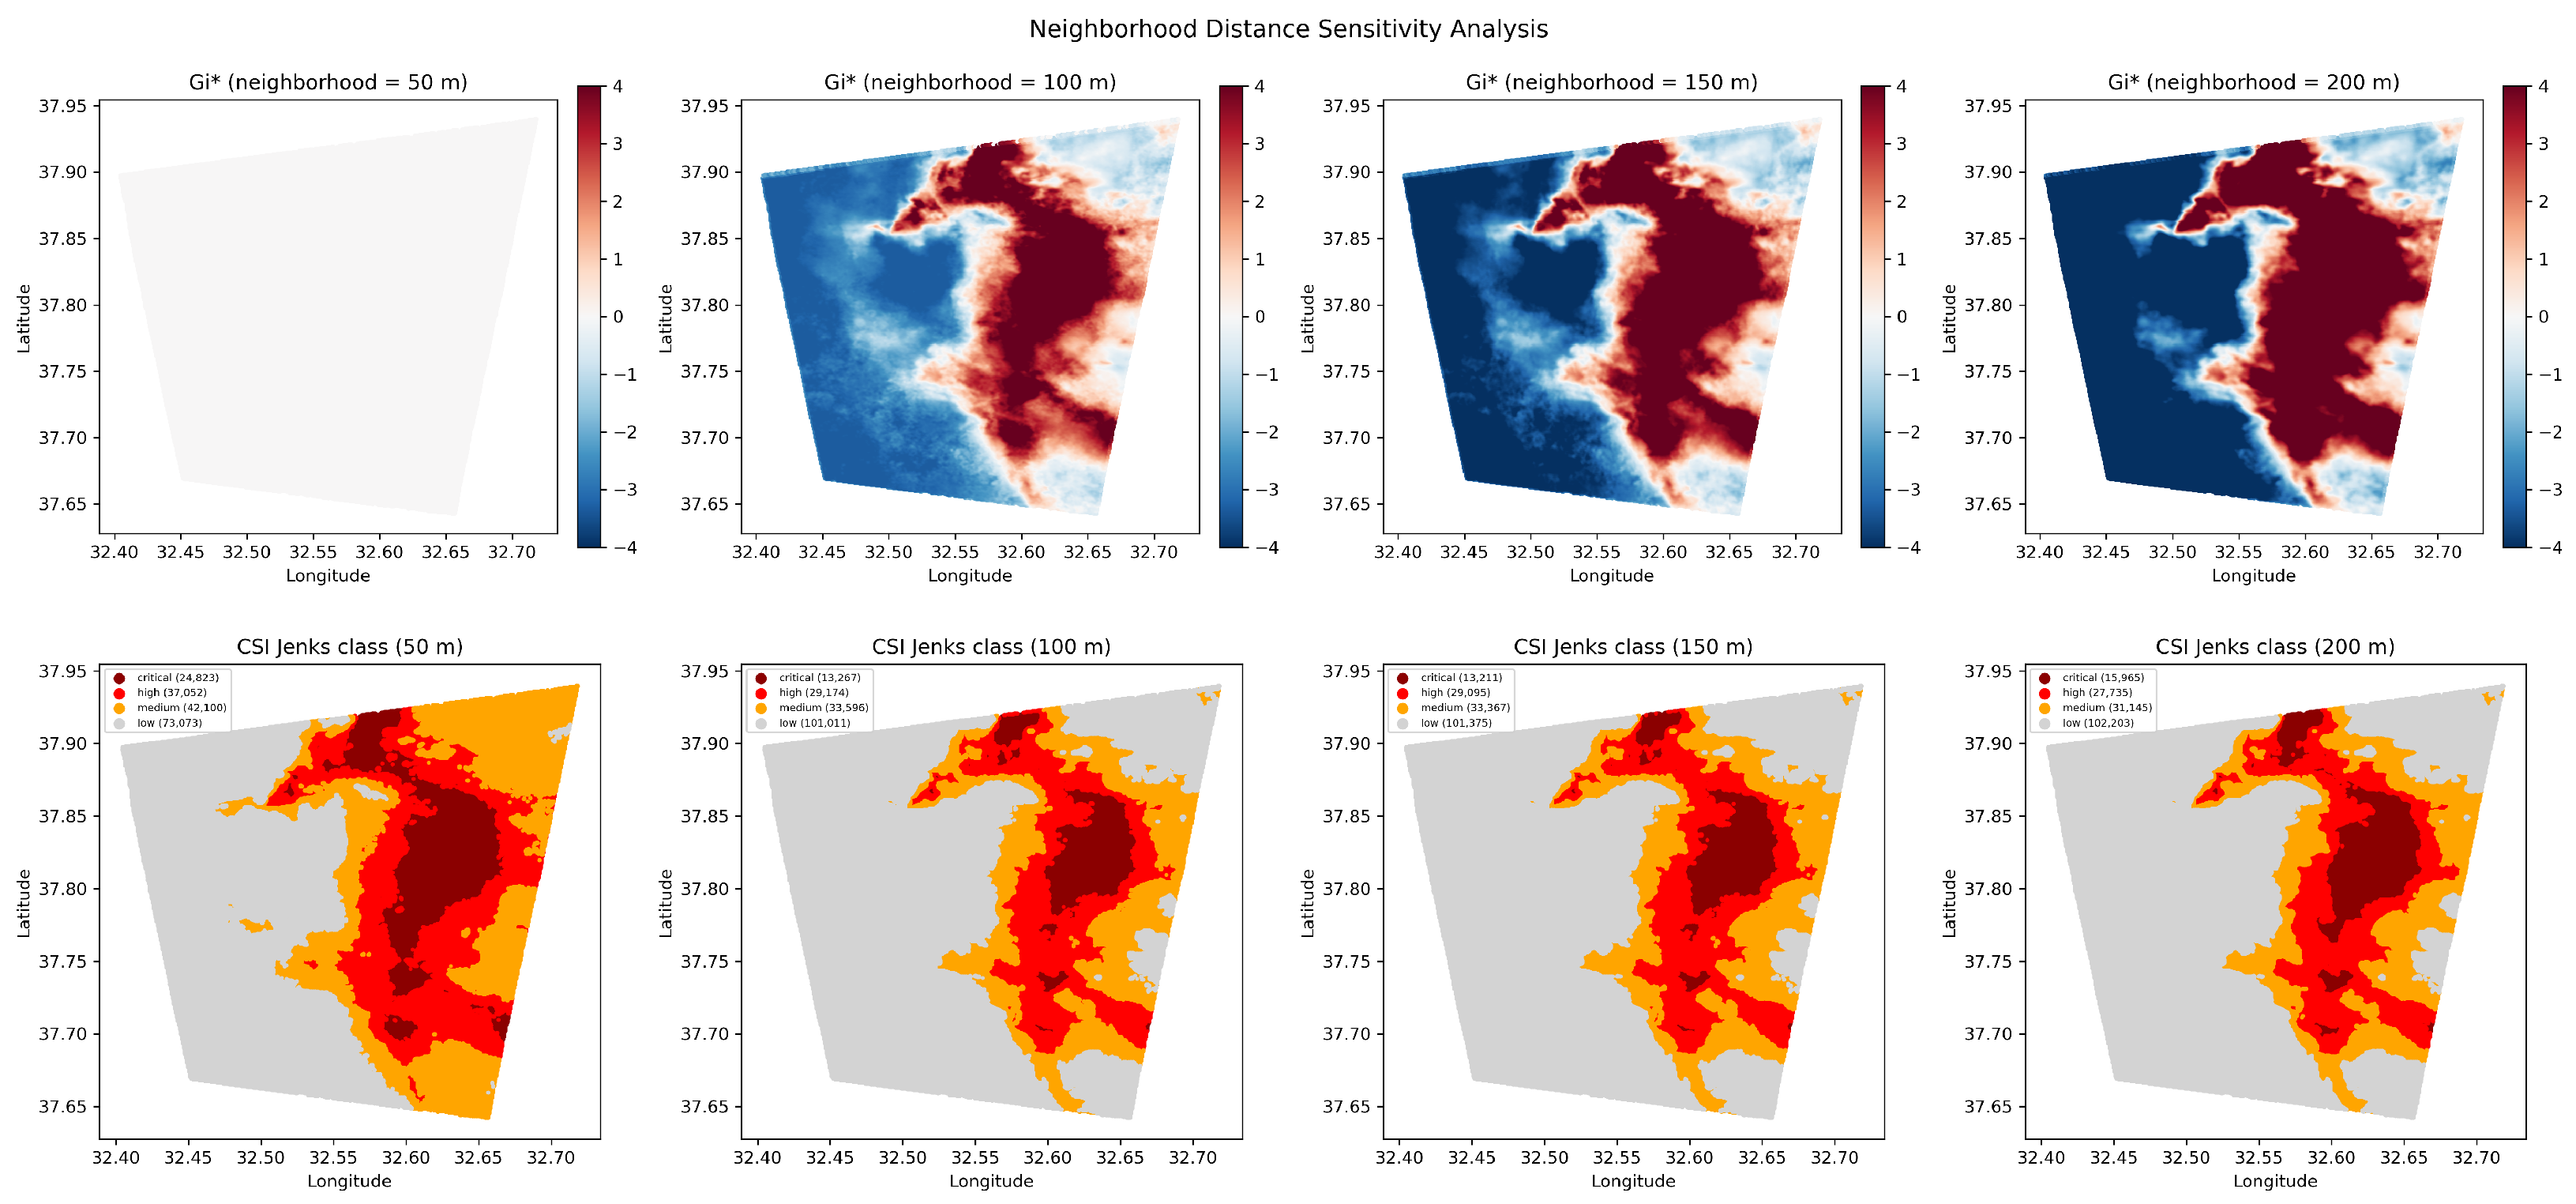
The influence of neighborhood distance on the Getis–Ord Gi* and Local Moran’s I analyses was investigated by repeating the complete spatial statistical workflow using neighborhood distances of 50, 100, 150, and 200 m. The quantitative comparison is summarized in
Table 4, whereas the corresponding spatial distributions are illustrated in
Figure 8.
3.6.3. Sensitivity to DBSCAN Parameters
The robustness of the DBSCAN clustering procedure was evaluated using different combinations of the
and
min_samples parameters. The quantitative comparison is summarized in
Table 5.
All investigated parameter combinations consistently identified a single deformation cluster, while the percentage of noise points remained below 0.1%. The clustered area (159.69–159.79 km2), mean subsidence rate (142.17–142.19 mm/yr), and mean CSI (0.5597–0.5598) exhibited only negligible variations among the tested parameter combinations. These results indicate that the delineation of the principal deformation corridor is robust to reasonable variations in the DBSCAN parameters adopted in this study.
3.6.4. Sensitivity to the Number of Jenks Classes
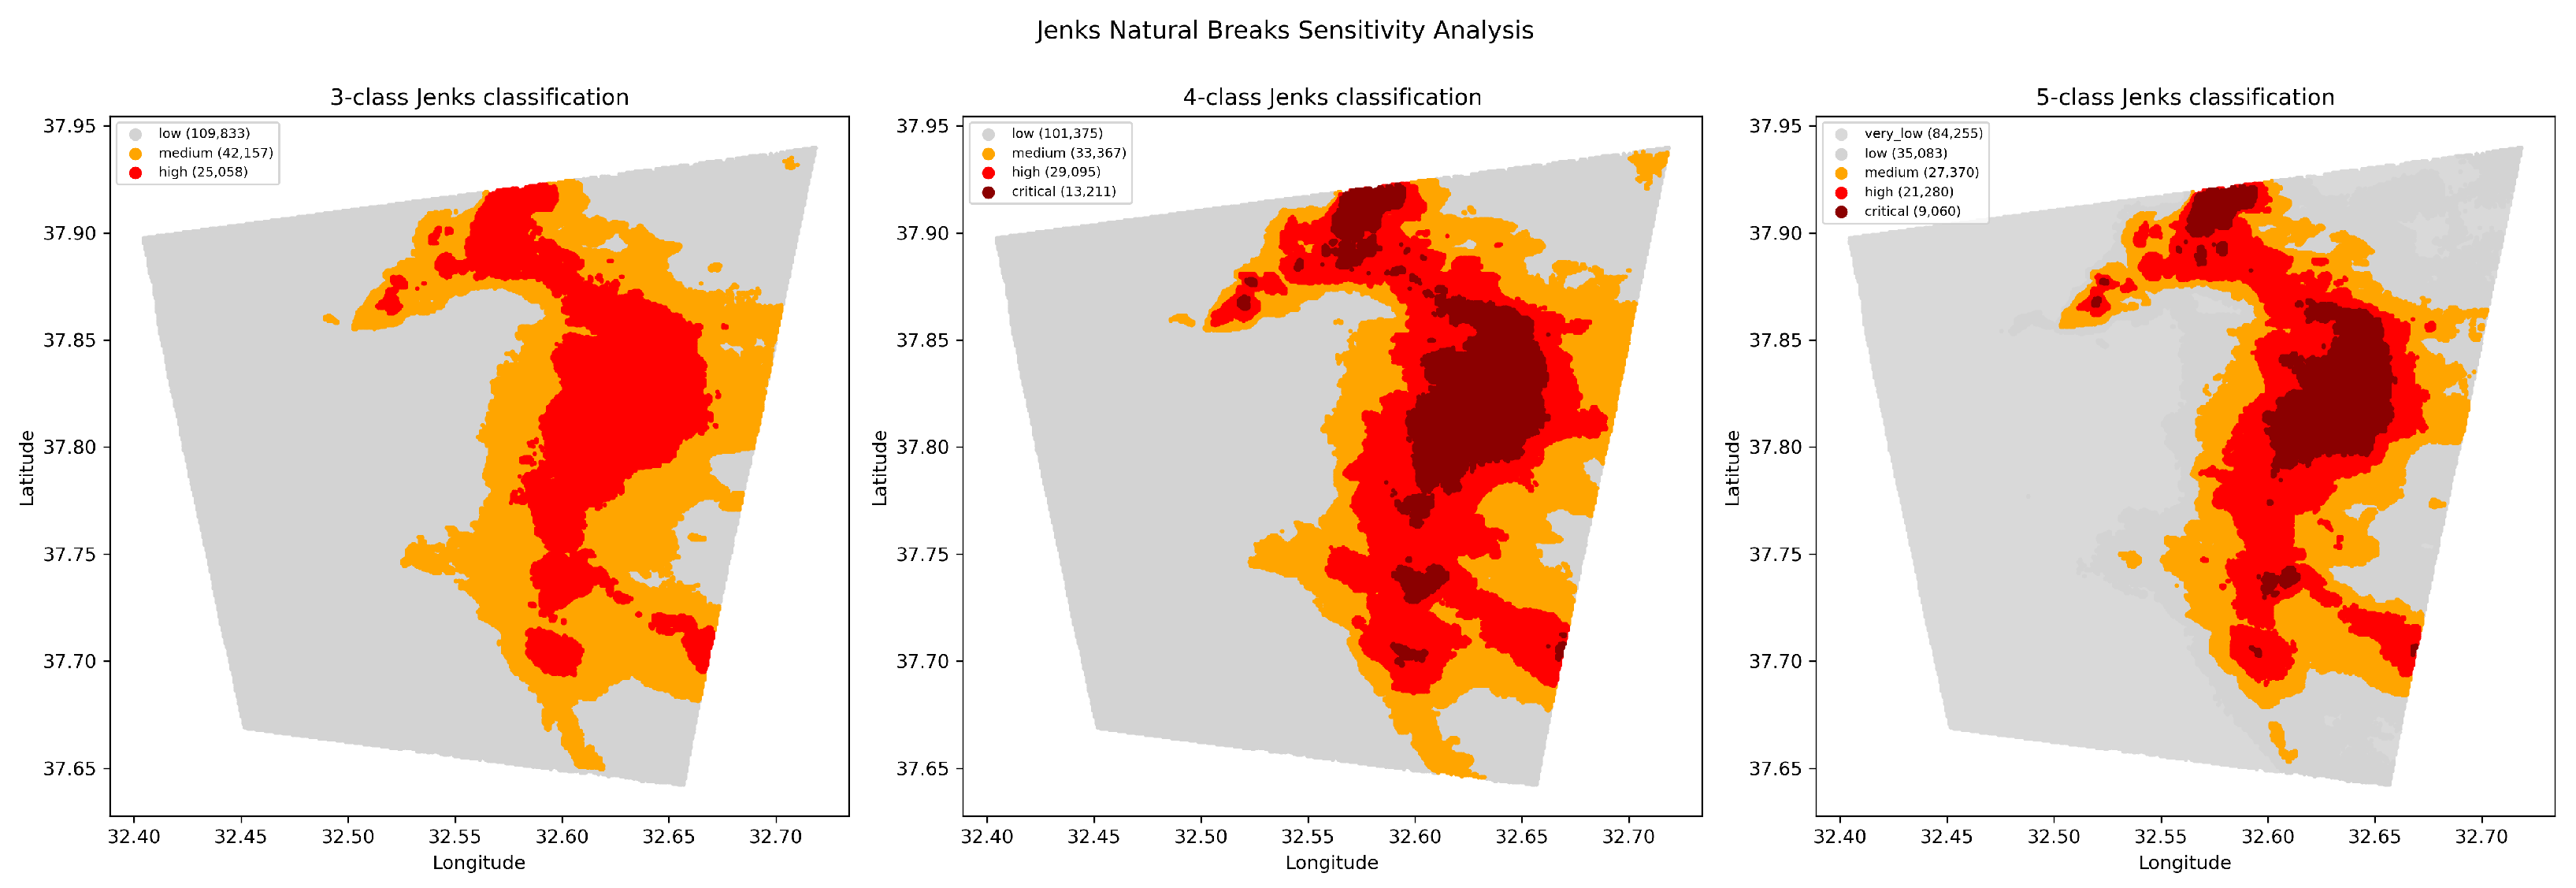
The influence of the number of Jenks Natural Breaks classes on the resulting severity maps was evaluated using three-, four-, and five-class classification schemes. The statistical comparison is summarized in
Table 6, and the corresponding spatial distributions are presented in
Figure 9.
Overall, the sensitivity analyses indicate that the proposed hazard assessment framework is robust to reasonable variations in the adopted parameter settings. Although moderate differences were observed in the spatial extent of individual hazard classes, the principal deformation corridors, hotspot distributions, and critical hazard zones remained largely unchanged. These results provide additional confidence in the reproducibility and reliability of the proposed methodology for regional land-subsidence hazard assessment.
4. Discussion
The results demonstrate that contemporary land subsidence in the Konya metropolitan area is not expressed as a collection of isolated deformation centers but rather as a spatially continuous deformation belt extending across the eastern sector of the study area. The SBAS-InSAR-derived vertical deformation field revealed maximum subsidence rates locally exceeding 230 mm/yr, while subsequent hotspot and spatial-autocorrelation analyses confirmed that these high deformation rates are organized into statistically significant spatial clusters. The combination of extreme deformation magnitudes and strong spatial clustering indicates that the observed subsidence is controlled by regional-scale hydrogeological processes rather than localized ground-failure mechanisms alone.
The identified deformation belt is consistent with the hydrogeological characteristics of the Konya Closed Basin, where long-term groundwater abstraction has resulted in persistent groundwater-level declines and progressive aquifer-system compaction. Previous studies employing GNSS, DInSAR, and multi-temporal InSAR techniques have documented widespread subsidence associated with groundwater depletion throughout the basin [
6,
7,
8,
11]. The principal deformation belt detected in this study largely overlaps areas previously recognized as experiencing intensive groundwater exploitation. However, the maximum subsidence rates observed here are among the highest reported for the Konya metropolitan area and indicate that severe groundwater-induced deformation remains active. This difference relative to earlier estimates is unlikely to result from a single factor. Rather, it most plausibly reflects a combination of (i) the continued temporal evolution of subsidence, consistent with the post-2025 acceleration independently confirmed by both the GNSS and InSAR time series (
Section 2.2); (ii) the non-overlapping observation period of the present study (2023–2026) relative to earlier investigations, which were based on data acquired in previous years and could not capture this more recent acceleration; and, to a lesser extent, (iii) methodological differences, including the denser temporal sampling and well-connected SBAS network adopted here. Because the acceleration is corroborated by an independent GNSS station rather than by the InSAR processing alone, we consider the higher rates reported in this study to primarily reflect a genuine intensification of subsidence rather than a processing artifact. More importantly, the deformation is not confined to a few isolated hotspots but is organized as a laterally continuous subsidence system extending over a large portion of eastern Konya. A more detailed spatial comparison further clarifies how the present findings relate to earlier investigations. Şireci et al. [
11], using multisensor SAR data spanning 2004–2020 over the same metropolitan area, reported two spatially separated subsidence lobes on the western and eastern sides of Konya city, divided by a non-deforming north–south trending zone, with rates increasing to a maximum of approximately 110 mm/yr by 2019 before decelerating and locally reversing to uplift thereafter. Earlier DInSAR- and GNSS-based investigations covering the wider Konya Closed Basin [
6,
8] similarly reported a spatially diffuse pattern with considerably lower rates (approximately 10–40 mm/yr). In clear contrast, the present study identifies a single, spatially continuous north–south corridor spanning approximately 159.7 km
2, with rates reaching up to 230 mm/yr—more than double the maximum previously reported for the area, and without the intervening non-deforming zone described by [
11]. This represents a genuine difference in both the magnitude and the spatial organization of subsidence relative to all three previous studies, independent of any interpretation of its underlying cause. One plausible interpretation of this difference is that the two previously separate subsidence centers have progressively expanded and merged into the single deformation belt identified here, consistent with the sustained and, since 2025, accelerating groundwater depletion documented in
Section 2.2. We emphasize, however, that this merging mechanism is offered as a hypothesis rather than an established fact: the present dataset does not extend back to the 2014–2020 period covered by [
11], and the intervening 2020–2023 evolution of the deformation field cannot be directly observed with the data available to this study. We further note that, although the post-2025 acceleration reported in
Section 2.2 represents a genuine, independently confirmed step-change relative to the pre-2025 rate—detected consistently by both the GNSS and InSAR time series rather than being an artifact of either technique—the available data do not indicate a continuously increasing rate within the last two years of the observation period; the deformation appears to have shifted to, and subsequently persisted at, an elevated rate rather than accelerating without bound. Similarly, the current single-corridor configuration should be regarded as a snapshot of the presently observed spatial pattern rather than a permanent structural state, and future monitoring would be required to confirm whether this configuration persists, further intensifies, or reorganizes over time.
The GNSS validation results further support the reliability of the SBAS-InSAR observations. Comparison with the KNY1 CORS-TR station yielded a difference of less than 1 mm/yr between GNSS-derived and InSAR-derived subsidence rates, demonstrating excellent agreement between the independent geodetic techniques. Such consistency is comparable to validation accuracies reported in previous InSAR-based subsidence studies and confirms that the detected deformation patterns represent genuine ground motion rather than processing artifacts. Beyond this trend-level agreement, epoch-to-epoch comparison between the two time series yielded an RMSE of approximately 13 mm, an MAE of approximately 12 mm, and a Pearson correlation coefficient of
(
Section 2.2), while segmented trend fitting confirmed that both datasets independently detect an approximately four-fold acceleration of subsidence after 2025 (from approximately
to
mm/yr to approximately
to
mm/yr). This acceleration, being jointly detected by two independent measurement techniques, indicates that the underlying deformation processes remained active throughout the observation period rather than reflecting an artifact of either dataset.
A major contribution of this study is the transformation of deformation measurements into hazard-oriented information through the integration of deformation magnitude and spatial statistical indicators. Traditional deformation maps identify where subsidence occurs but do not necessarily distinguish areas where deformation becomes spatially concentrated, statistically significant, and potentially hazardous. By combining vertical deformation rates with Getis–Ord Gi* hotspot statistics and Local Moran’s I spatial-autocorrelation measures, the proposed framework enables the identification of coherent subsidence zones that represent elevated hazard conditions. The resulting severity map revealed a nested hazard structure in which critical-severity areas occupy the core of the deformation belt, while high- and medium-severity zones form transitional regions surrounding these nuclei.
The DBSCAN analysis provided additional insight into the spatial organization of the hazard zones. Rather than identifying multiple independent deformation centers, the analysis delineated a single dominant hotspot belt covering approximately 159.7 km2. This finding has important implications for both hazard assessment and groundwater management. The continuity of the hotspot belt suggests that subsidence in eastern Konya is governed by a broad and interconnected hydrogeological system. Consequently, mitigation strategies focused on individual subsidence locations may be insufficient because the deformation appears to reflect regional-scale groundwater depletion and sediment compaction processes operating across a much larger area.
The methodology developed in this study also offers broader applicability beyond the Konya metropolitan area. Although numerous studies have applied InSAR techniques for subsidence monitoring, many have focused primarily on deformation detection or hotspot identification. In contrast, the proposed framework integrates deformation magnitude, hotspot significance, spatial autocorrelation, hazard classification, and hotspot delineation within a single workflow. This integrated approach provides a reproducible and transferable methodology for converting geodetic deformation measurements into practical hazard information suitable for decision-making and risk-management applications in groundwater-stressed urban environments.
Overall, the results indicate that land subsidence in eastern Konya has evolved into a spatially continuous and statistically significant deformation belt associated with ongoing groundwater depletion. The combination of extreme subsidence rates exceeding 230 mm/yr, strong spatial clustering, and a large continuous hotspot belt highlights the severity of the ongoing deformation process. By integrating SBAS-InSAR observations with spatial statistical analyses and severity-based hazard assessment, this study provides a practical framework for identifying and prioritizing subsidence hazards and supports future groundwater-management, infrastructure-planning, and monitoring efforts within the Konya Closed Basin.
5. Conclusions
This study presented a severity-based framework for delineating land-subsidence hazard zones and critical hotspots in the Konya metropolitan area through the integration of SBAS-InSAR observations and spatial statistical analyses. A total of 82 Sentinel-1 SAR acquisitions acquired between January 2023 and May 2026 were processed using the SBAS technique, and ascending and descending line-of-sight deformation measurements were combined to derive vertical deformation velocities.
The results revealed a pronounced and spatially continuous north–south-oriented subsidence deformation belt extending across the eastern sector of the Konya metropolitan area. Maximum vertical subsidence rates locally approached 230 mm/yr, indicating that land subsidence remains an active and significant geohazard in the region. Validation against observations from the KNY1 CORS-TR GNSS station demonstrated excellent agreement between the independent datasets, with estimated subsidence rates of approximately mm/yr from GNSS observations and mm/yr from the InSAR-derived time series.
Spatial statistical analyses showed that the deformation field is characterized by strong spatial clustering rather than isolated deformation anomalies. Getis–Ord Gi* hotspot analysis and Local Moran’s I spatial autocorrelation analysis consistently identified a continuous deformation belt associated with statistically significant clusters of severe subsidence. The composite severity index further transformed deformation measurements into hazard-oriented information and enabled the delineation of four subsidence hazard classes. Critical-severity zones were concentrated along the central axis of the deformation belt, while lower-severity classes progressively occupied its margins.
Subsequent DBSCAN analysis applied to the high- and critical-severity classes identified a single dominant hotspot belt covering approximately 159.7 km2. Mean subsidence rates within this belt reached approximately 142.2 mm/yr, while maximum deformation rates within the belt attained 215.3 mm/yr. These findings indicate that the most hazardous subsidence areas in eastern Konya are organized as a spatially connected regional-scale deformation system rather than multiple isolated subsidence centers.
Beyond conventional deformation monitoring, the proposed framework provides an objective and reproducible approach for converting InSAR-derived deformation measurements into spatially explicit hazard information. The methodology can support groundwater-resource management, infrastructure planning, and long-term geohazard monitoring in the Konya Closed Basin and may be transferable to other groundwater-stressed urban environments experiencing land-subsidence problems.