1. Introduction
The stress effects of global climate change and human activities on ecosystems are increasingly intensifying [
1,
2]. As China’s second-largest island and a typical key tropical ecological zone, Hainan Island harbors contiguous tropical rainforests, occupying an irreplaceable position in the global biodiversity conservation and ecological security pattern. As a core component of terrestrial ecosystems, vegetation’s spatiotemporal dynamics and driving mechanisms can directly reflect the health status of regional ecosystems [
3]. However, in recent years, the large-scale expansion of artificial forests such as rubber and eucalyptus in Hainan Island has imposed significant pressure on the maintenance of regional biodiversity.
With the rapid development of remote sensing technology, a variety of vegetation indices have been widely applied to the dynamic monitoring of regional vegetation, among which the Normalized Difference Vegetation Index (NDVI) is one of the most extensively used [
4]. Constructed based on the reflectance difference between the near-infrared (NIR) and red bands, NDVI can effectively characterize vegetation coverage, growth status and health level. Relying on its advantages such as high sensitivity, clear threshold characteristics, and the ability to effectively mitigate various external interferences, it has been universally adopted in the field of remote sensing-based vegetation monitoring. However, NDVI is limited by notable drawbacks, such as a significant saturation effect in areas with high vegetation coverage, where it fails to capture subtle vegetation changes once the red band absorption reaches a threshold, thereby compromising monitoring accuracy [
5,
6].
In 2021, the kNDVI was formally proposed [
7]. As a nonlinear improved version of NDVI, kNDVI utilizes a kernel method based on the radial basis function to perform a nonlinear transformation on NDVI to alleviate the saturation issue, thereby significantly enhancing its discriminative ability in regions with high vegetation coverage. This nonlinear transformation can effectively amplify the variations in vegetation growth status within densely vegetated areas, successfully resolving the saturation problem that NDVI is prone to in high-coverage zones [
8]. Furthermore, based on kernel methods, kNDVI maps the original NDVI into a high-dimensional feature space; by calculating the nonlinear similarity between pixels, it can effectively mitigate the impacts of irrelevant factors such as atmospheric interference and soil background noise. Compared with NDVI, it exhibits superior performance in terms of both spatial continuity and temporal stability [
9,
10]. Currently, relying on its unique technical advantages, kNDVI has been widely applied in fields such as high-precision monitoring of vegetation dynamics and long-term time-series analysis of vegetation changes [
11,
12,
13].
Ref. [
14] constructed a kNDVI dataset based on the GEE cloud platform, and systematically analyzed the spatiotemporal evolution characteristics of vegetation coverage and its climatic driving mechanisms in the Yellow River Basin from 2001 to 2020. Their findings confirmed that kNDVI can accurately characterize the spatiotemporal variation laws and dynamic change trends of vegetation coverage in the Yellow River Basin, thus providing a scientific reference for decisions regarding regional ecological sustainable development, ecological protection and restoration. Ref. [
15] calculated the long-term kNDVI time series of Shaanxi Province from 2003 to 2022 using MODIS satellite data, and systematically explored the spatiotemporal variation pattern of vegetation coverage in this region by adopting the Theil–Sen trend analysis, MK trend test and partial correlation analysis methods. The results indicated that the vegetation coverage in Shaanxi Province showed an overall improvement trend, whereas a sharp decline in vegetation coverage was observed in some ecologically significant areas with a relatively small area. Ref. [
16] took the Minjiang River Basin as the study area to explore the influencing mechanisms of topography, climate and human activities on the spatial distribution pattern of kNDVI, and fully revealed the driving processes of vegetation growth in the upper reaches of the Mekong River. Their study showed that the positive driving effects of natural factors such as climate and topography can effectively offset the negative impacts of human activities, thus dominating the dynamic changes in regional vegetation growth. All the above studies have investigated the spatiotemporal characteristics of vegetation using the state-of-the-art kNDVI index, yet the data resolution adopted in these studies was only 500 to 1000 m. Such a relatively low spatial resolution may compromise the accuracy of the research results.
Ref. [
17] calculated the kNDVI index with a 30 m spatial resolution on the GEE platform, and conducted an in-depth study on the spatiotemporal variation characteristics of vegetation growth in the Huojitu Mining Area from 1999 to 2023 by applying the MK trend test and linear regression analysis methods. Their results showed that compared with NDVI, kNDVI can not only identify areas with poor vegetation growth more efficiently and accurately, but also exhibit higher sensitivity in regional vegetation dynamic monitoring. Ref. [
18] reconstructed the spatiotemporal evolution trajectory of kNDVI in the northern foot of the Qinling Mountains from 1986 to 2022 based on the long-term Landsat image dataset. This study introduced a multiple regression residual model considering the time-lag effect to quantify the independent driving contributions of climate change and human activities to vegetation dynamics. The results indicated a significant overall upward trend of kNDVI in the northern foot of the Qinling Mountains, reflecting the continuous improvement of the regional ecological status. However, this study only defined the independent effects of climate and human activities in the attribution analysis, and failed to explore the synergistic or interactive influence mechanisms between them in depth, which may introduce certain attribution biases and pose potential limitations to the accurate analysis of the driving processes. Ref. [
19] finely retrieved the spatiotemporal distribution characteristics of kNDVI in the Henan section of the Yellow River Basin and its internal mining areas using Landsat series images on the GEE platform, and revealed the response laws and driving mechanisms of vegetation dynamics to climatic factors by combining meteorological data such as air temperature and precipitation. Their findings suggested that kNDVI exhibits stronger sensitivity and discriminative ability than NDVI in the intervals of extremely low (<20%) and extremely high (>80%) vegetation coverage, and can depict the vegetation coverage status more accurately. Meanwhile, this study confirmed a significant negative correlation between regional vegetation conditions and the distance from mining areas, revealing the negative disturbance effect of mining activities on the surrounding vegetation ecology. Nevertheless, the comprehensive coupling effect of climatic factors and human activities was not taken into account in the analytical framework of this study, resulting in certain limitations in the explanatory power for the driving mechanisms of vegetation changes.
Hainan Island harbors extensive contiguous tropical rainforests, occupying an irreplaceable and vital position in China’s and even the global ecosystem, and is recognized as one of the world’s biodiversity hotspots [
20]. Since the initiation of the Hainan Free Trade Port (FTP) construction, it has consistently adhered to the core philosophy of “ecological priority and green development” and the core brand of a “Green and Beautiful FTP,” continuously attracting international high-end talent and premium resources. Consequently, ecological environmental quality has become a key evaluation metric for comprehensively advancing high-quality regional development. Against this backdrop, high-precision kNDVI data is urgently needed to provide a reliable foundation for regional ecological environment monitoring, natural resource conservation, and scientific decision-making. Currently, scholars both domestically and internationally have extensively applied the kNDVI to monitor vegetation cover changes across various regions. However, fine-scale studies featuring long time series and high spatial resolution specifically targeting Hainan Island remain scarce, which falls short of meeting the practical demands of the Hainan FTP’s ecological construction.
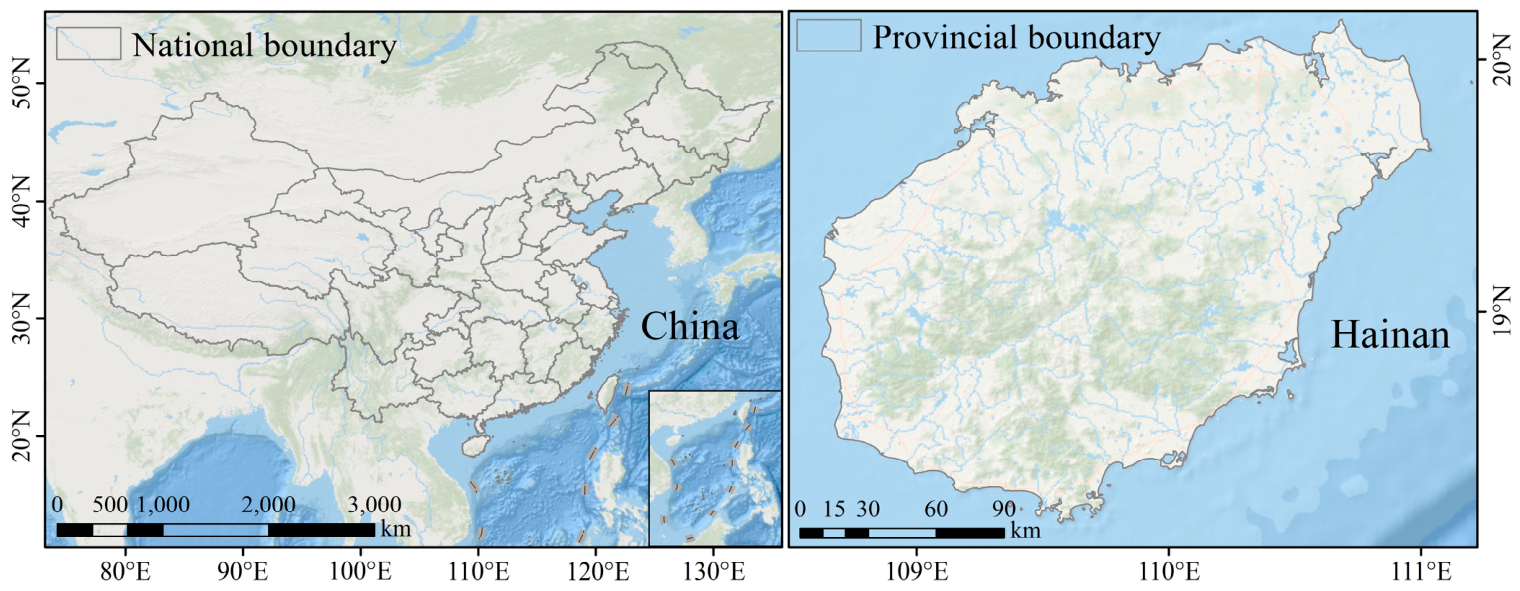
Based on this, the present study focuses on Hainan Island to systematically analyze the spatiotemporal evolution and persistence characteristics of the growing-season kNDVI from 1994 to 2023. Regarding the analysis of driving mechanisms, this study breaks through the limitations of traditional linear attribution by selecting six climatic factors—drought severity, precipitation, average temperature, wind speed, soil moisture, and solar radiation—combined with nighttime lights and rubber plantation distribution (characterizing human activities), as well as elevation and slope (characterizing static topography). Based on these ten core driving factors, the XGBoost machine learning model and the SHAP interpretability framework are introduced to accurately quantify the relative contribution of each factor. This aims to deeply reveal the complex nonlinear synergistic mechanisms of “topographical foundation, human reshaping, and extreme climate triggering” in vegetation dynamics, thereby providing a solid, quantitative scientific basis for the green, high-quality construction of the Hainan FTP and the sustainable management of tropical island ecosystems.
3. Methods
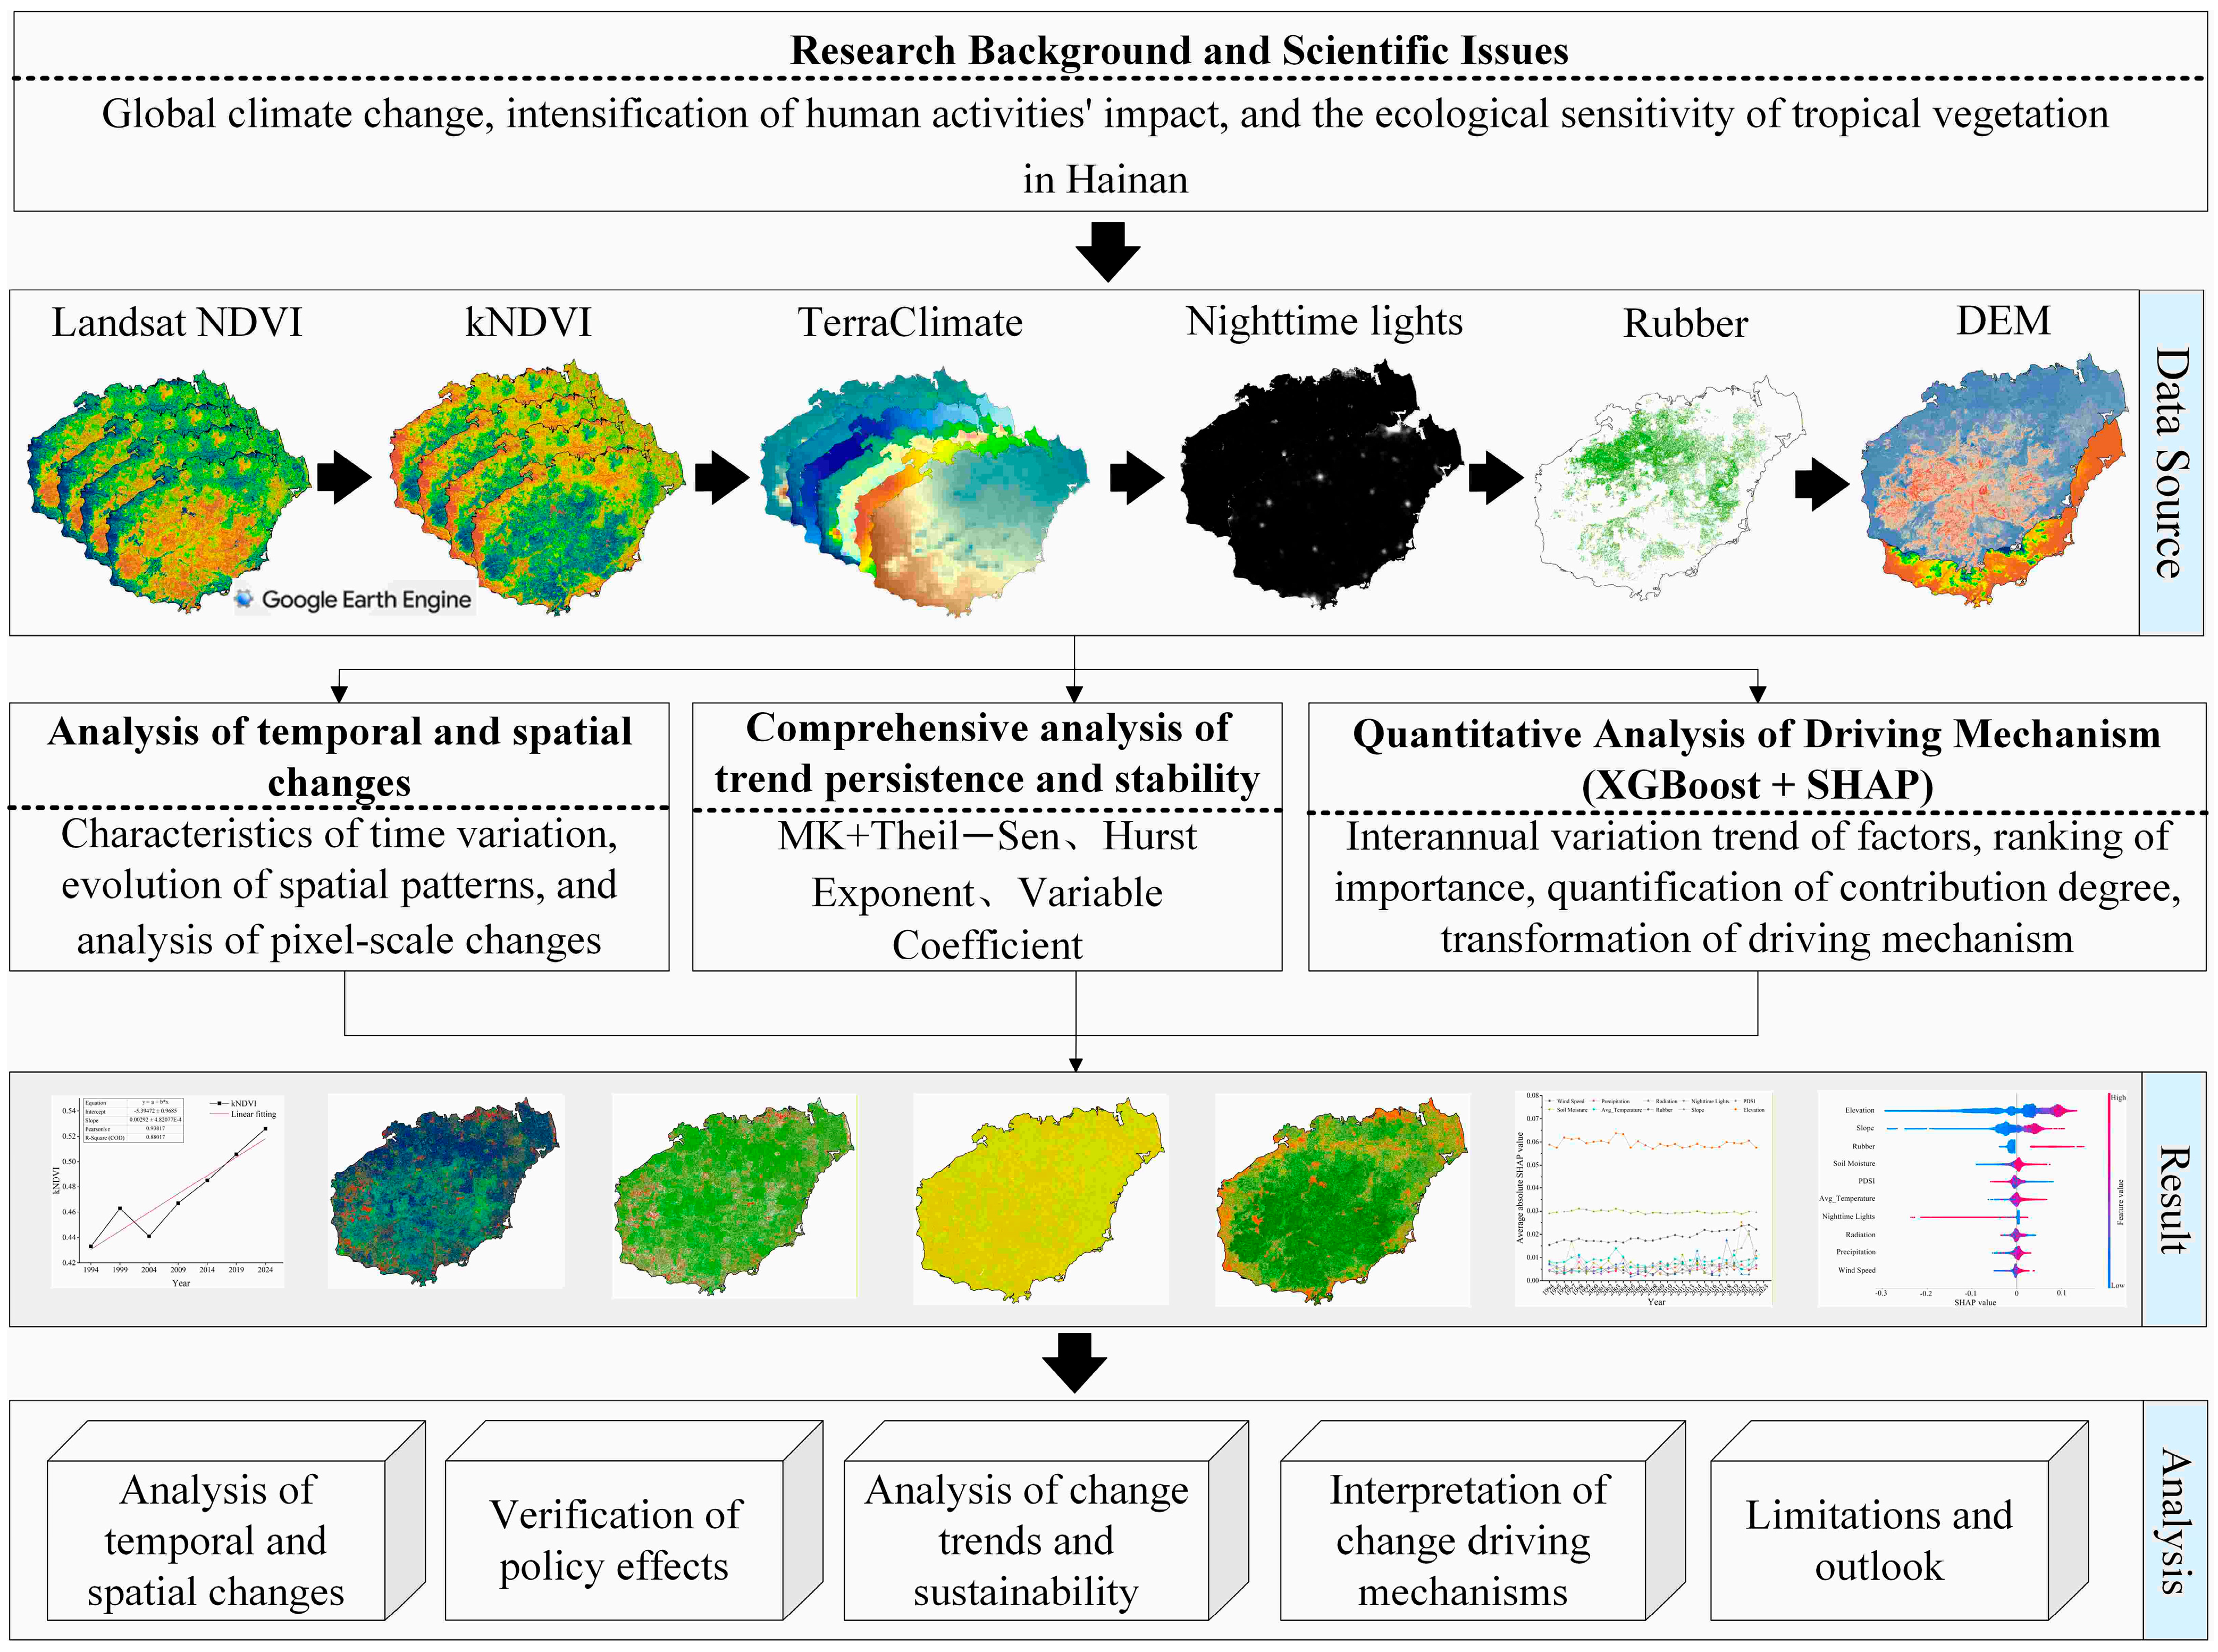
This study explored the spatiotemporal evolution characteristics, stability, and driving mechanisms of the growing-season kNDVI in Hainan Island from 1994 to 2023. The main workflow is as follows: (1) Based on the NDVI dataset constructed from Landsat imagery within the GEE platform, a kNDVI dataset with a 30 m spatial resolution was generated through nonlinear transformation. Multi-source auxiliary datasets, including climate, nighttime lights, artificial forests, and topography, were integrated, and preprocessing tasks such as spatial resolution harmonization were completed. (2) The spatiotemporal evolution characteristics of the kNDVI were investigated. Methods including the Mann–Kendall (MK) test, Theil–Sen slope estimation, Hurst exponent, and coefficient of variation (CV) were employed to systematically analyze the interannual variation trends, future persistence, and interannual stability of the growing-season kNDVI. (3) With kNDVI as the dependent variable and climatic factors, human activity factors (nighttime lights and artificial forests), and topographical factors (elevation and slope) as independent variables, an XGBoost model was constructed to fit the nonlinear response relationships. Coupled with the SHAP method, the relative contribution, direction of effect, and spatiotemporal heterogeneity of each factor were quantified to elucidate the transition characteristics of the dominant driving factors. The technical roadmap is illustrated in
Figure 2.
3.1. Mann–Kendall Trend Test and Theil–Sen Slope Estimator
The combination of the MK trend test and Theil–Sen slope estimator represents the most widely used robust trend analysis framework in vegetation dynamic monitoring. This combined method is particularly suitable for non-normal time-series data that are prone to outliers caused by extreme weather events, anthropogenic disturbances, and other influencing factors. Among them, the Theil–Sen slope estimation is used to calculate the trend slope of the vegetation time series, which can effectively resist the interference of outliers and ensure the accuracy and robustness of the trend amplitude estimation. The MK test is used to determine the statistical significance level of the trend change. Together, they form a comprehensive evaluation framework ranging from “trend magnitude” to “significance confidence level”, enabling a more thorough and reliable quantitative analysis of vegetation change trends.
The calculation formulas for the Theil–Sen (Equation (4)) [
25] and MK trend test (Equations (5)–(8)) [
26] are presented as follows:
where
and
represent the kNDVI values in the long-term time series, and
and
denote two distinct time points. A positive
indicates an increasing trend in vegetation coverage, whereas a negative
signifies a degrading trend.
where
is the standardized test statistic,
is the variance, and
is the number of observations in the time series.
In this study, the above method was applied to conduct a significance test on the annual trend of growing-season kNDVI in Hainan Island. At the confidence level of α = 0.05, the trends were classified as:
Significant increase: and ;
Slight increase: and ;
No significant change: and ;
Slight decrease: and ;
Significant decrease: and .
3.2. Hurst Exponent
The Hurst exponent is a core indicator for quantifying the dynamic persistence (or anti-persistence) of time-series data, which can effectively characterize the consistency between future trends and historical evolution characteristics of time series. At present, it has been widely applied in numerous research fields including vegetation dynamic monitoring and eco-environmental evolution [
27]. In this study, the Hurst exponent was calculated using the Rescaled Range Analysis (R/S analysis) method. Based on this exponent, the persistence characteristics of the kNDVI time series in Hainan Island were quantified, thereby predicting the future trend of regional kNDVI.
The specific calculation formulas are shown in Equations (9)–(13):
The time series is divided into subsequences , for each subsequence .
The mean value of the time series is calculated as:
The cumulative deviation is computed as:
The range sequence is constructed as:
The standard deviation sequence is established as:
The Hurst exponent is calculated as:
The value range of the Hurst exponent is 0 to 1. When , the kNDVI time series exhibits randomness, indicating no significant correlation between the future trend and the trend during the study period. When , the kNDVI time series shows persistence, meaning the future trend is consistent with that during the study period, and a larger value represents stronger persistence. When , the kNDVI time series exhibits anti-persistence, suggesting the future trend is opposite to that during the study period, and a smaller value represents stronger anti-persistence.
3.3. The Coefficient of Variation
CV, also known as the standardized deviation ratio, is a vital indicator for quantifying the stability and fluctuation characteristics of time-series data. This indicator objectively reflects the stability degree and fluctuation magnitude of variables by calculating the ratio of the standard deviation to the mean value of the time-series data. The calculation formula is expressed as follows [
28]:
where
is the coefficient of variation;
is the study duration;
is the kNDVI value in the
-th year, and
is the mean kNDVI value of the time series. In this study,
was classified into five levels:
Stable: ;
Low fluctuation: ;
Moderate fluctuation: ;
High fluctuation: ;
Severe fluctuation: .
3.4. XGBoost Model
XGBoost is an improved algorithm of Gradient Boosting Decision Tree (GBDT) based on ensemble learning, proposed by [
29]. Taking decision trees as the base learner, XGBoost iteratively trains the model through a gradient descent strategy, gradually reducing the prediction error, and finally constructs a high-precision ensemble prediction model, which is suitable for analyzing complex response relationships under multi-factor coupling. Owing to its high efficiency, robustness, and strong fitting ability for complex nonlinear relationships, this algorithm has been widely used in driver mechanism analysis and prediction research in ecology, remote sensing science, environmental science, and other fields [
30,
31]. The formula of the model is given as follows [
32]:
where
is the predicted value of sample
,
is the input feature vector corresponding to the
-th sample,
is the total number of regression trees,
is the mapping function corresponding to the
regression tree, and
is the set of CART functions.
Regarding model training and sample construction, this study extracted 10,000 fixed spatial sampling pixels covering the entirety of Hainan Island. By acquiring their corresponding kNDVI and various driving factor values from 1994 to 2023, a spatiotemporal panel dataset comprising 300,000 observations was ultimately constructed. To prevent overfitting induced by spatial autocorrelation, the model adopted a grouped cross-validation strategy utilizing the spatial locations of the pixels as the grouping basis. Specifically, 80% of the pixels were allocated for model training, while the remaining 20% were reserved as an independent test set for generalization. Furthermore, considering the potential issue of common trend confounding in time-series data, this study introduced “year” as a control variable into the model during preliminary experiments to conduct robustness checks. The results demonstrated that the importance rankings and SHAP value distribution characteristics of the core driving factors (e.g., elevation, rubber) did not undergo significant changes. This confirms that the model makes predictions primarily by capturing the spatial heterogeneity of the variables, effectively overcoming the statistical bias associated with merely fitting temporal trends.
3.5. SHAP Method
The SHAP method is a model interpretability framework based on the Shapley value in game theory [
33]. Its core lies in fairly quantifying the marginal contribution of each feature to the model prediction output, enabling interpretability analysis from the local (single sample) to the global (overall model) scale. The calculation formula of this method is given as follows [
34]:
where
is the total number of input features in the model,
denotes the feature set after excluding the
-th feature
,
is an arbitrary subset of
,
represents the model output when subset
and feature
are jointly used for prediction, and
is the model output when only feature subset
is adopted for prediction. The combination of the SHAP method and the XGBoost model can quantify the relative contribution of each influencing factor to kNDVI dynamics, identify the dominant driving factors, and interpret the nonlinear mechanisms between factors and kNDVI.
Compared with traditional methods such as linear regression and correlation analysis, the integrated analytical framework of XGBoost and SHAP can effectively capture complex nonlinear relationships, reveal the marginal effects and interaction mechanisms of driving factors, and realize the transformation of the model from a “black box” to an interpretable one. This framework exhibits remarkable advantages in the research on driving mechanisms of vegetation dynamics [
35,
36].
5. Discussion
5.1. Spatiotemporal Variation Analysis of kNDVI
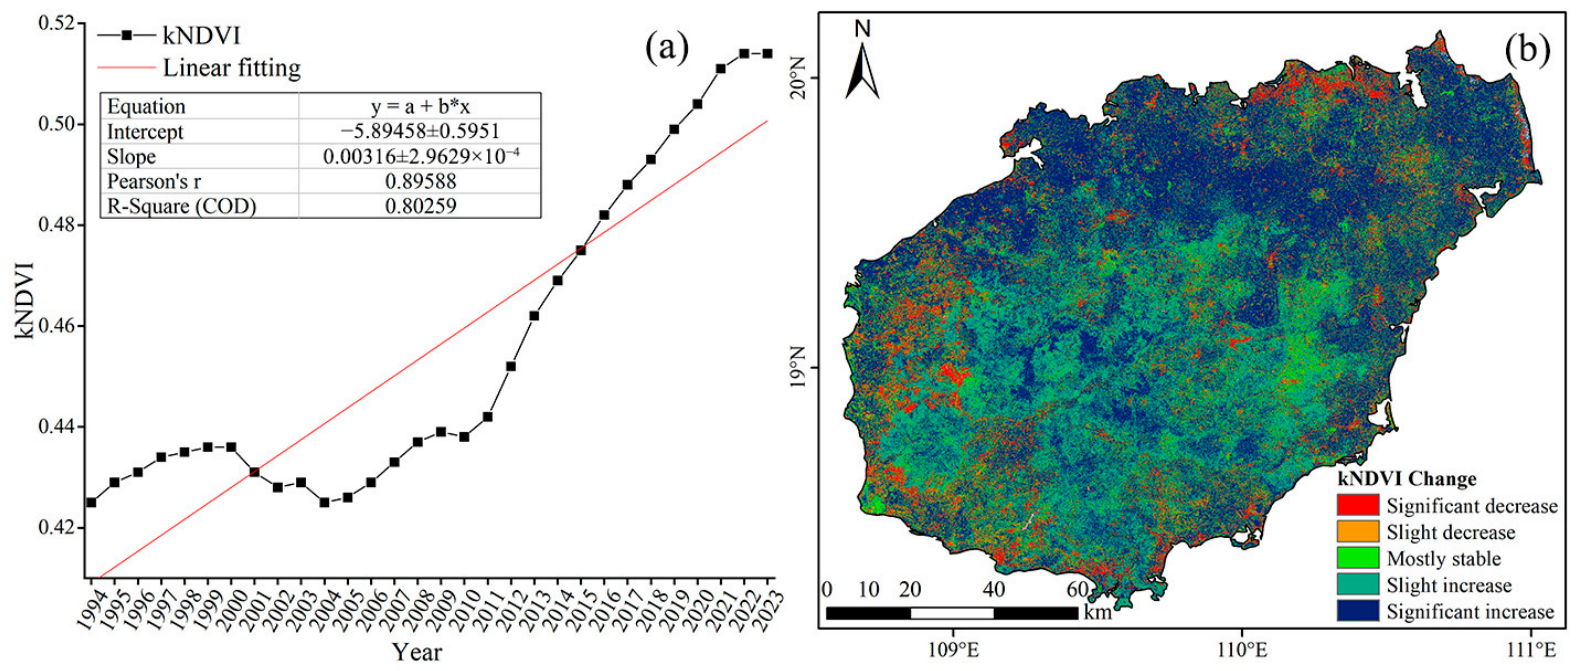
From 1994 to 2023, the growing-season kNDVI on Hainan Island exhibited phased fluctuation characteristics. In the early stage of the study, kNDVI showed a mild upward trend, reaching a phased peak in 2000 before experiencing a pullback. From 2001 to 2004, regional kNDVI declined significantly, and vegetation growth suffered short-term setbacks. After 2005, kNDVI entered a steady upward phase, with the rate of increase accelerating significantly after 2011, reaching a historical high over the past three decades between 2020 and 2023. Overall, the growing-season kNDVI on Hainan Island demonstrated a significant linear upward trend from 1994 to 2023, reflecting the continuous improvement of vegetation coverage and steady enhancement of ecological conditions across the island over the past thirty years. This long-term positive vegetation dynamic is the result of the coupled action of multiple factors, primarily including policy-led ecological restoration, the continuous optimization of artificial forest structures, effective prevention and control of biological disasters, and the long-term positive support of climatic factors.
During 2000 to 2004, the area of rubber plantations in Hainan Island expanded rapidly [
24], resulting in the conversion of some natural forests into artificial forests. Rubber plantations in their early juvenile stage exhibit low vegetation coverage, and their growing-season kNDVI is significantly lower than that of native natural forests. This temporally coincides with the significant decline in regional kNDVI during this period and is considered one of the important potential explanations for this phenomenon. In addition, deforestation for eucalyptus planting, exacerbated coastal development leading to damage to coastal shelterbelts, and the compounding effect of a large-scale outbreak of the coconut leaf beetle (Brontispa longissima (Gestro)) may have jointly intensified the short-term degradation of vegetation on the island.
After 2005, regional vegetation restoration reached a critical turning point. On the one hand, the large-scale rubber plantations established earlier gradually entered a vigorous mature stage, resulting in a substantial increase in stand canopy closure and cover. On the other hand, targeted prevention and control of the coconut leaf beetle outbreak achieved remarkable success [
37], while the island-wide coastal shelterbelt restoration project was advanced simultaneously [
38]. More crucially, following 2005, Hainan officially established the development strategy of “building a green province through ecological preservation” and successively implemented a series of ecological engineering projects. Looking across the three-decade vegetation evolution trajectory, the comprehensive implementation and long-term advancement of various ecological policies provide the most explanatory macro-policy background for the sustained and steady increase in regional kNDVI.
From the perspective of spatial distribution, the changes in the growing-season kNDVI on Hainan Island over the past three decades exhibited a distinct spatial differentiation pattern characterized by “stable recovery in the central mountainous areas and localized degradation in the coastal zones” (
Figure 3b). Regions with a significant increase in kNDVI were primarily concentrated in northern Hainan Island. As a traditional major rubber-producing region, the greenness gains brought by the maturation of large areas of young rubber plantations dominated the long-term significant upward trend in this area, which is highly consistent with the evolutionary pattern observed on the temporal scale. The core of the central mountainous area mostly consists of primitive tropical rainforests with intact ecosystem structures. Coupled with strict blockade and management measures such as national parks [
39,
40], these areas experienced minimal human interference, with kNDVI showing stability or localized significant increases, thereby demonstrating an excellent natural background environment.
In contrast, areas of slight and significant degradation are contiguously concentrated in coastal plains, urban built-up areas, and their surrounding zones. The period from 1994 to 2023 coincided with a phase of rapid expansion in urbanization and the tourism industry on Hainan Island, during which urban construction land continuously encroached upon primitive forest land and high-quality arable land. The expansion of hardened impervious surfaces directly resulted in the impairment of regional ecosystem service functions [
20,
41]. This characteristic of “strengthened central ecological barriers and prominent coastal development pressures” intuitively reflects the typical “ecological–economic spatial mismatch” phenomenon characteristic of tropical islands. Overall, the spatiotemporal evolution pattern of kNDVI on Hainan Island is highly coupled with the intensity of human activities and the implementation scope of ecological policies, profoundly highlighting the spatial differentiation and interplay between ecological conservation and economic development.
5.2. kNDVI Change Trend and Sustainability Analysis
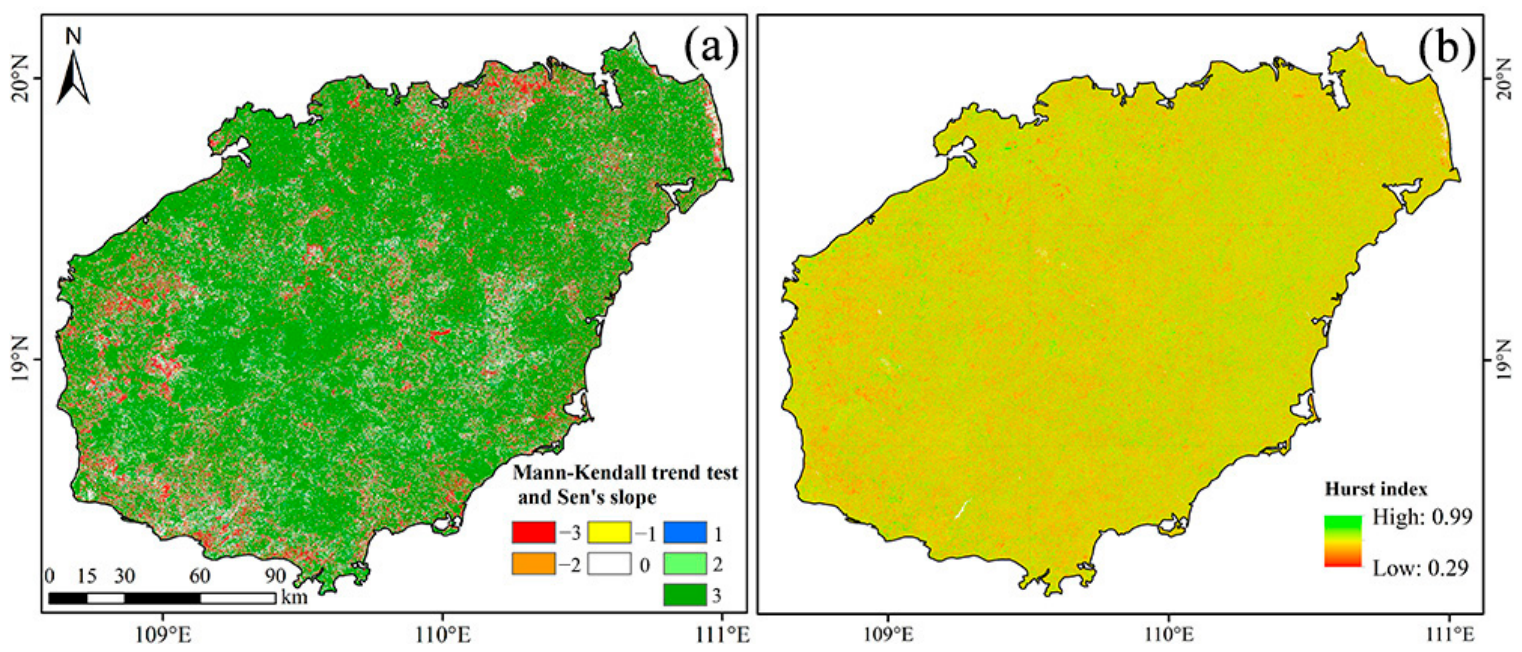
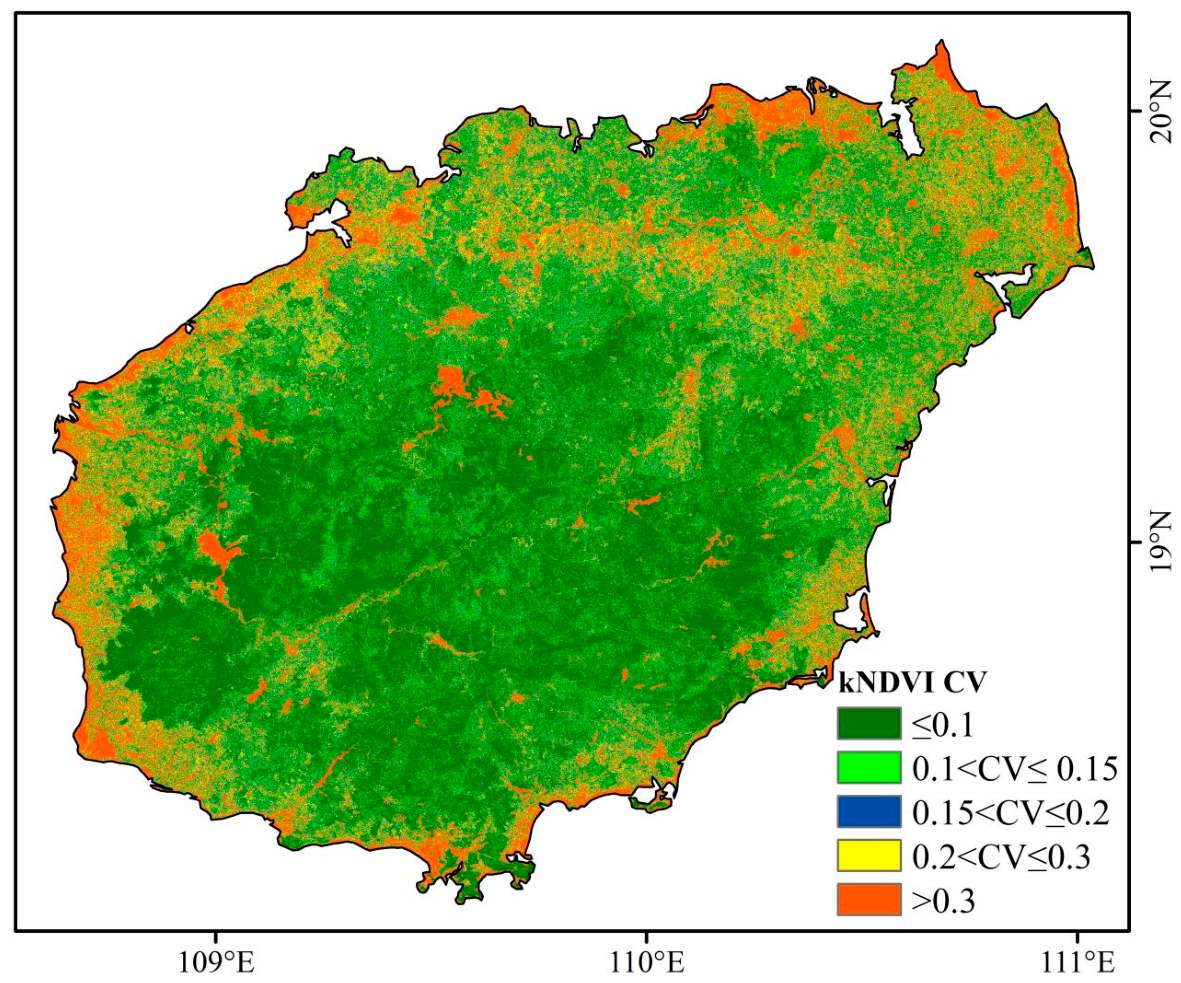
Combining the Mann–Kendall trend test, Hurst exponent, and stability analysis, these three methods form a mutually validating logical closed loop that jointly reveals the core patterns of vegetation evolution on Hainan Island. Regarding the persistence of change trends, the Hurst exponent exceeds 0.5 across the vast majority of the island, indicating that vegetation dynamic evolution possesses strong persistence and is highly consistent with the current trend direction. Notably, the central mountainous region exhibits a spatial characteristic of “extremely significant increase—high Hurst—high stability”, forecasting that its vegetation recovery trend will persist in the long term and form the core support for future improvements in the island’s overall ecological quality. This high persistence and high stability are primarily attributed to three aspects: First, the region boasts an excellent natural baseline, being dominated by primary tropical rainforests and monsoon forests with complex community structures, strong self-maintenance capacity, and substantial environmental buffering capacity. Second, anthropogenic disturbance is strictly controlled; the effective implementation of ecological protection policies has curbed large-scale reclamation and logging, providing a stable living space for vegetation propagation. Finally, following nearly thirty years of natural recovery, communities in this region have gradually approached a climax or mature state, with relatively fixed phenological rhythms and growth trajectories, resulting in minor interannual fluctuations. This result powerfully verifies the mature tropical rainforest redundancy mechanism that “complex community structures can effectively buffer external environmental fluctuations”.
The characteristic of “slight increase—high Hurst—medium stability” is mainly distributed in the periphery of the central mountainous region, the eastern tablelands, and some agro-forestry ecotones. Vegetation dynamics in this region are dually driven by vegetation types and human activities, dominated by secondary forests, plantation forests, and tropical crops. Because their community structures are relatively simple and heavily influenced by human management and operations, their growth states exhibit a certain degree of interannual fluctuation. In contrast, coastal areas typically exhibit “significant decrease—high Hurst—low stability,” making them the most vulnerable zones of Hainan Island’s ecosystem. This region is currently in a period of sustained urban expansion, facing multiple disturbance pressures such as tourism facility construction and industrial land development, which have led to the rapid replacement of native vegetation by construction land. Furthermore, although coastal areas have established artificial shelterbelt forests such as coastal protection forests, their simple community structures and much weaker anti-disturbance capacities compared to the central native forests make their vegetation growth states extremely susceptible to damage and drastic fluctuations when facing in extreme climatic impacts such as typhoons [
42].
Based on the aforementioned trends and sustainability analysis, future ecological and environmental management on Hainan Island should deepen the control system of “zoned governance and precise policy implementation.” For the central mountainous region, strict adherence to ecological protection redlines must be maintained, alongside the intensification of natural forest protection and secondary forest tending. This will consolidate its advantages of high stability and high persistence, firmly anchoring the island’s core ecological security barrier. For the mid-to-low-altitude transition zones, it is advisable to actively promote ecological agriculture and under-forest economy. By enriching stand structures and biodiversity to balance economic development and ecological protection, the ecological stability of the vegetation can be further enhanced. For the vulnerable coastal areas, vigorous implementation of coastal shelterbelt restoration and urban green space expansion projects is required to reduce the coefficient of vegetation variation and effectively curb the trend of degradation, thereby coordinating the dual sustainability of regional ecology and economy at a higher level.
5.3. Analysis of the Driving Mechanism of kNDVI Change
Based on the SHAP method, the driving factor analysis breaks through the linear limitations of traditional correlation analysis, achieving a quantitative resolution of the driving mechanisms behind the spatiotemporal changes in kNDVI on Hainan Island. It clarifies the relative contributions and complex nonlinear effects of static terrain, dynamic climate, and human activities, revealing the core controlling logic of tropical island vegetation evolution.
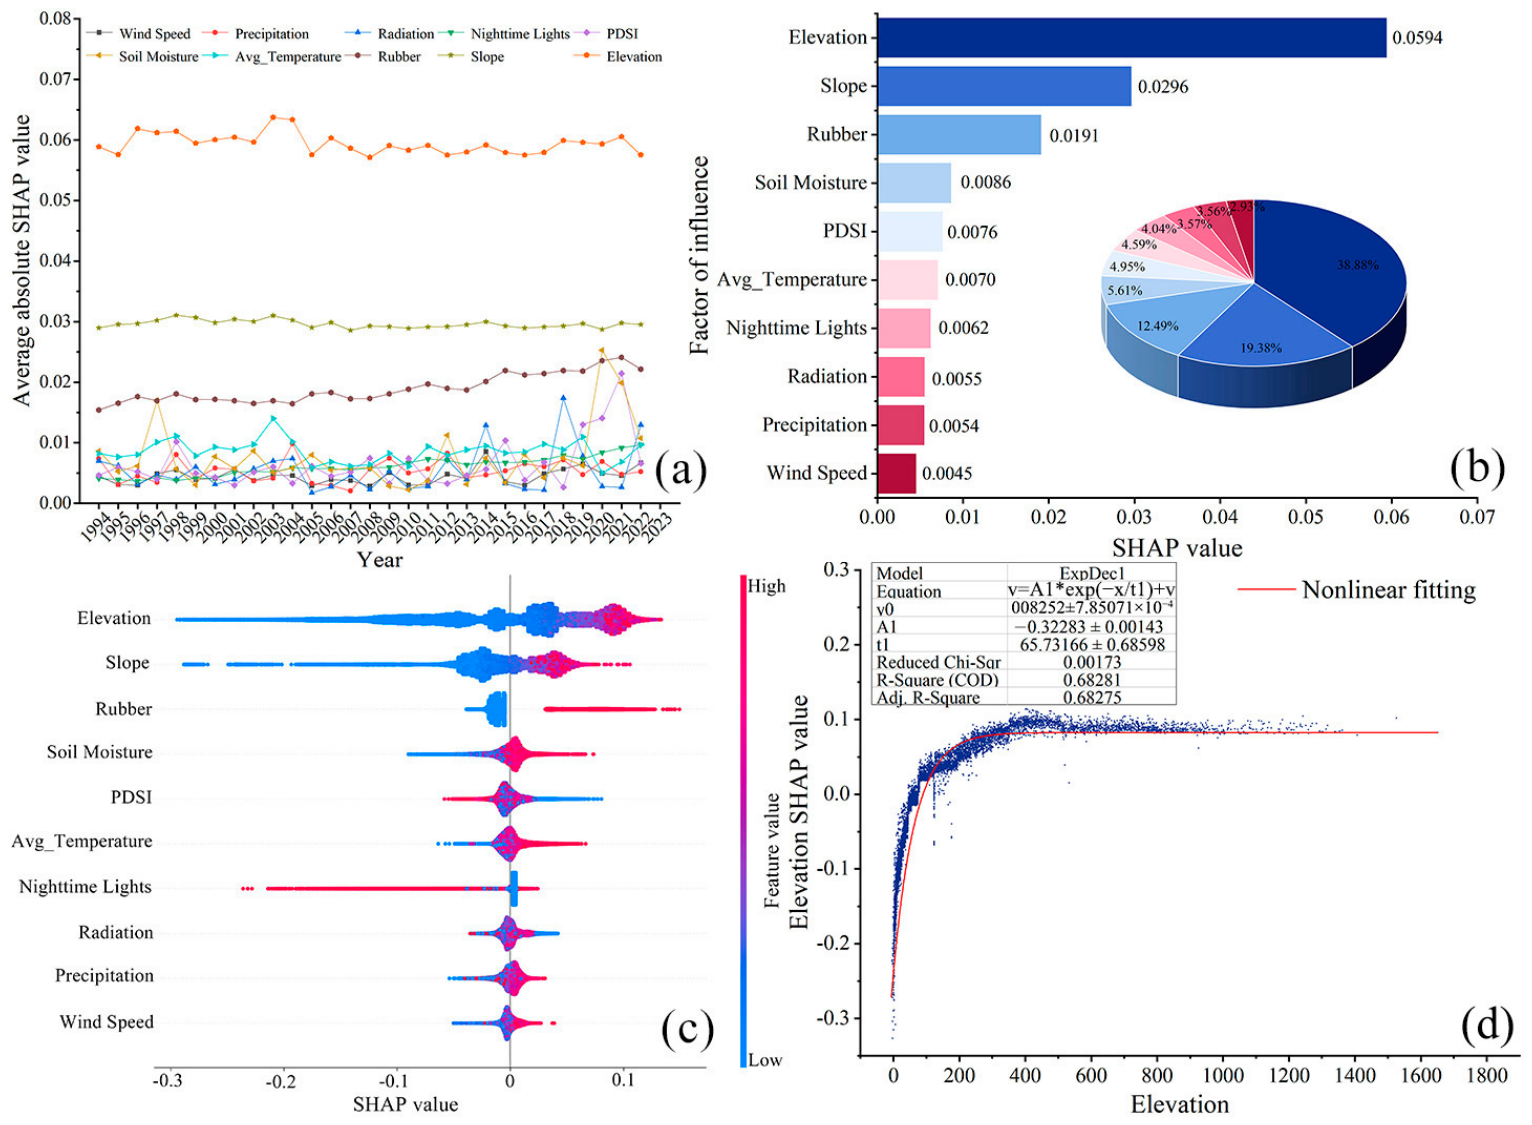
From the perspective of the global dominance of driving factors, static terrain factors constitute the decisive baseline shaping the spatial pattern of vegetation on Hainan Island. Among them, elevation is the primary core driving factor affecting kNDVI changes, with a SHAP contribution rate as high as 38.88%, significantly higher than other factors; slope ranks second with a contribution rate of 19.38%. Combined with the SHAP dependence analysis in
Figure 7d, the impact of elevation on kNDVI exhibits a highly typical “three-stage” nonlinear threshold characteristic: Ultra-low elevation zone (0–150 m): The SHAP values show extremely strong negative inhibition, which highly overlaps with high-intensity human development activities in coastal plains. Transition zone (150–400 m): The negative impact rapidly weakens, crosses the zero-line threshold, and turns into positive promotion. Mid-to-high elevation zone (>400 m): SHAP values remain at a stable high level, forming a “plateau period.” This profoundly reflects the ecological reality that as the elevation gradient increases and human disturbances sharply decrease, the tropical rainforest canopy gradually closes and reaches a state of biomass saturation.
Regarding the representation of human activities, the study reveals a “two-way reshaping effect” of anthropogenic disturbance. As the third largest driving factor, rubber (with a contribution rate of 12.49%) represents land-use transitions centered on specialty economic forests. The SHAP values of its high-value samples are heavily concentrated in the positive interval (
Figure 7c), indicating that the large-scale expansion of artificial economic forests over the past thirty years has significantly driven the enhancement of the island’s overall greenness. In contrast, although nighttime lights account for a relatively low global contribution rate, their high-value zones (urban built-up areas) drag out extremely long negative tails in the SHAP summary plot, precisely illustrating the drastic suppression of local native vegetation by rapid urbanization. This demonstrates that human activities are not simple destroyers; rather, they profoundly reshape the island’s vegetation background through two completely distinct pathways: “coastal urbanization suppression and degradation” and “inland forestry expansion and greening”.
The impact of climate factors exhibits a relatively minor global weight, yet it features a distinct “pulsed” triggering mechanism during extreme events. Overall, the global average explanatory power of conventional climate factors—such as soil moisture, the Palmer Drought Severity Index (PDSI), mean temperature, and precipitation—is relatively weak, with contribution rates mostly distributed between 2.9% and 5.6%. However, looking at the temporal evolution sequence of driving factor contributions (
Figure 7a), the driving mechanism of Hainan Island’s vegetation dynamics is undergoing a profound transition. In the early stages of the study, the dominant status of elevation and slope was absolutely rock-solid; however, as time progressed, the explanatory power of the rubber factor representing human forestry activities showed a continuous upward long-term evolutionary trend. More prominently, between 2020 and 2023, the absolute SHAP values of PDSI and mean temperature experienced a drastic “pulsed” sudden surge. This anomaly indicates that against the backdrop of intensifying climate change, extreme water deficits and high-temperature heat stress are breaking the relatively smooth climate–vegetation response state of the past. Short-term limiting factors for regional vegetation growth are shifting drastically from normalized environmental fluctuations to the shocks of extreme climate events.
Overall, the spatiotemporal evolution of the growing-season kNDVI on Hainan Island is controlled by a composite driving mechanism of “terrain foundation—human reshaping—extreme climate triggering.” Although static terrain laid the basic foundation of “high in the middle and low around the edges” for the island’s vegetation, human continuous expansion of economic forest planting has been a key dynamic pusher for the overall rise in greenness in recent years, while extreme climate events constitute the greatest short-term uncertainty risk. Therefore, future regional ecological management must comprehensively implement spatially differentiated controls: In mid-to-high-altitude core zones, strictly enforce mountain closures for afforestation to protect primitive habitats. In low-altitude transition zones, optimize the stand structure of economic forests such as rubber to enhance the comprehensive benefits of ecology and economy. In coastal urban zones, strictly control the disorderly expansion of construction land, reduce negative human interference, and focus on enhancing the climate resilience of regional ecosystems against extreme heat and drought.
5.4. Limitations and Future Prospects
This study coupled the XGBoost machine learning model with the SHAP interpretability framework to systematically identify the core driving mechanisms behind the spatiotemporal evolution of the growing-season kNDVI on Hainan Island over the past thirty years. However, constrained by data availability and model boundaries, certain limitations remain that urgently need to be addressed and expanded in future work. Regarding trend persistence prediction, the Rescaled Range (R/S) analysis used in this study to calculate the Hurst index relies on 30 annual observations per pixel. Time-series statistical theory indicates that when the sequence length is relatively short, point estimates of the Hurst index often suffer from large variances and uncertainties. Therefore, the core conclusion of this study—that “vegetation recovery in the central mountainous region exhibits high persistence”—largely represents a probabilistic point estimate based on the current sample length. Future research should consider introducing alternative estimation methods such as Bootstrapping or Detrended Fluctuation Analysis (DFA) to provide confidence intervals for trend predictions, thereby further quantifying and reducing pixel-level prediction uncertainties.
Regarding data representation, although kNDVI effectively reflects the spatiotemporal dynamics of regional vegetation greenness and vigor, it has not yet been cross-validated with multi-dimensional ecological parameters such as Gross Primary Productivity (GPP), carbon storage, or water conservation. Consequently, its expression of the physiological–ecological processes of vegetation and the “carbon-water” coupling mechanism under complex habitats remains insufficiently comprehensive. Additionally, residual artifacts in nighttime light data caused by the sensor transition from DMSP to VIIRS during 2012–2013 may have introduced some interference into the fine-scale resolution of human activity evolution trajectories. Future research could consider introducing multi-source remote sensing data such as Light Detection and Ranging (LiDAR) and Synthetic Aperture Radar (SAR), as well as continuous impervious surface evolution products with high temporal consistency, to construct a three-dimensional remote sensing monitoring system capable of more accurately characterizing forest vertical structures and their multiple ecosystem services.
At the methodological support level, although the current XGBoost algorithm demonstrates favorable robustness in handling nonlinear panel data and effectively meets current research needs, subsequent studies could actively explore the application of hybrid models. In terms of the depth of driving mechanism analysis, this study extracted the comprehensive impacts of natural climate and human activities at a macro island-wide scale, yet it has not thoroughly differentiated the response variations in natural rainforests, secondary forests, and typical plantation forest sequences when facing extreme climate and anthropogenic disturbances. Next steps will focus on refining forest type layers, targeting structural differences among various vegetation communities, and quantifying the action strengths of different driving factors across vegetation types. Furthermore, regarding the attribution of the vegetation decline observed between 2001 and 2004, although 30 m resolution rubber plantation data were successfully incorporated into our machine learning framework as a driving factor, a direct pixel-level spatial overlay and quantitative validation between rubber expansion trajectories and the specific kNDVI decline patches remain lacking in this study. While regional historical reports attribute this decline to the combined impacts of rubber plantation expansion, eucalyptus afforestation, and coconut leaf beetle outbreaks, isolating the precise localized footprint of each individual disturbance factor over time using macro-scale panel models presents considerable methodological challenges. Consequently, the attribution of this specific historical dip should be interpreted with caution as a macro-level probabilistic inference. Future work should integrate multi-source disturbance tracking data (such as high-frequency change-detection algorithms) to explicitly map the spatial correspondence between specific human/biomic disturbances and vegetation degradation zones. Meanwhile, combined with more refined ecological clustering characteristics, differentiated management units can be scientifically delineated, providing more targeted quantitative guidelines for the precise restoration and spatial allocation of tropical ecosystems.
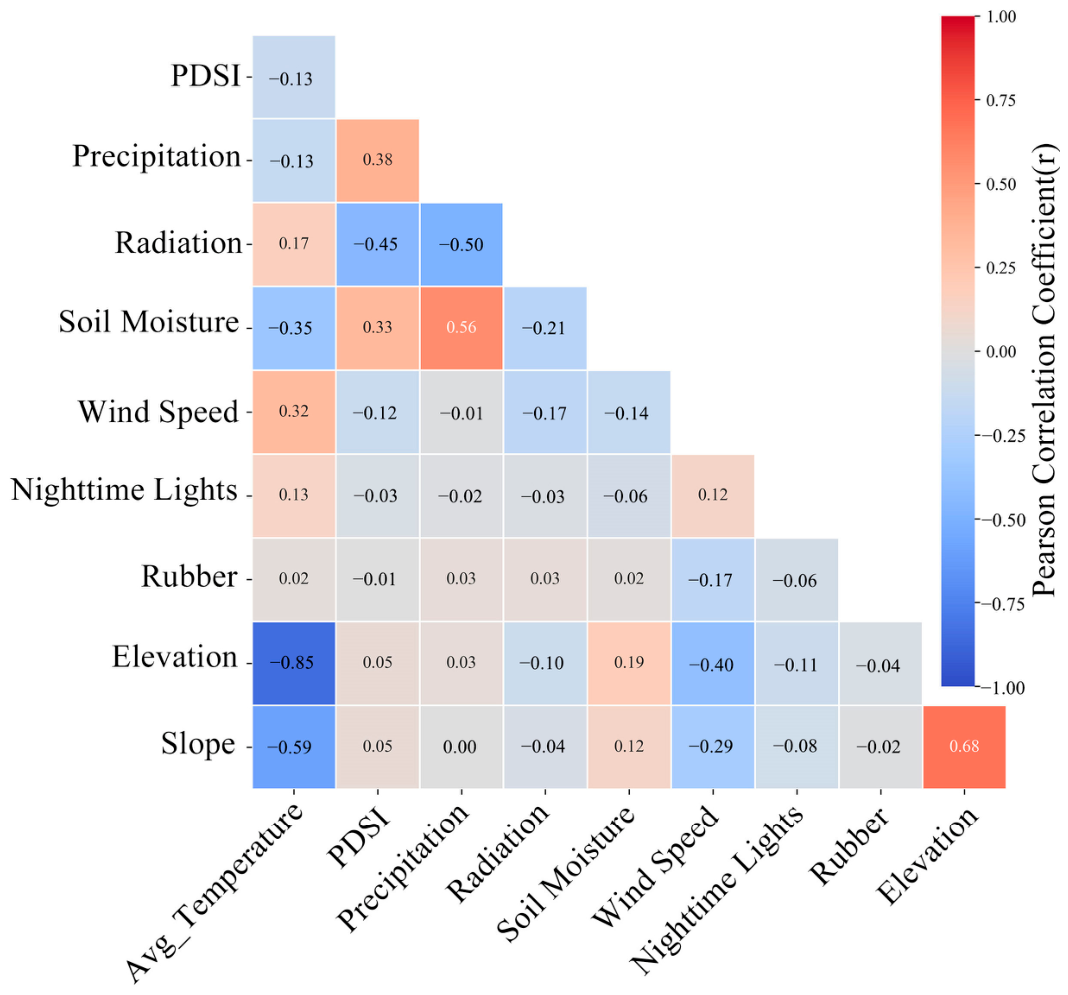
Furthermore, regarding the attribution analysis of driving factors, although the XGBoost-SHAP framework successfully captured complex nonlinear responses, certain inherent methodological limitations associated with multicollinearity should be acknowledged. As demonstrated by the pairwise correlation matrix, strong statistical links exist among precipitation, soil moisture, and PDSI. In tree-based machine learning models, when predictor variables are conceptually and statistically correlated, feature importance and SHAP values tend to be distributed or shared among these collinear features rather than being exclusively assigned to a single dominant one. Consequently, this multicollinearity can diffuse the individual contribution scores of water-related factors, implying that their exact ranking orders (e.g., between precipitation and soil moisture) should be interpreted with caution. Future research could incorporate methods such as grouped feature importance or orthogonal transformations to more strictly decouple the independent contributions of correlated environmental variables.
6. Conclusions
Based on the kNDVI index—which is more sensitive to tropical high-biomass regions—this study systematically characterized the spatiotemporal evolution and persistence characteristics of vegetation during the growing season on Hainan Island from 1994 to 2023. By coupling the XGBoost model with the SHAP interpretability framework, it quantitatively revealed the nonlinear driving mechanisms of natural and anthropogenic factors on vegetation dynamics, leading to the following three main conclusions:
Over the past three decades, the island’s kNDVI has exhibited an overall significant linear upward trend, forming a distinct spatial evolution pattern of “stable recovery in the central region and localized degradation along the coast.” This reflects the positive role of policy-guided ecological protection and plantation maturation in enhancing the island’s overall greenness.
Benefiting from an exceptional primary natural baseline and strict ecological controls, the central mountainous region exhibits the characteristics of “significant increase—high Hurst—high stability,” serving as the solid core for the island’s future ecological quality improvement. The stability of the mid-to-low-altitude transition zones fluctuates to some extent due to anthropogenic forestry activities, whereas coastal areas face degradation risks characterized by “significant decrease—high Hurst—low stability” due to high-intensity human development and a fragile ecological baseline.
Multi-factor quantitative analysis based on SHAP indicates that static terrain factors such as elevation and slope hold an absolute dominant position (with a combined contribution rate of nearly 60%), laying the foundation for the island’s vegetation spatial pattern. Human activities demonstrate a profound two-way reshaping effect: the expansion of artificial forests represented by rubber is a key driver for the long-term increase in the island’s greenness, while urbanization represented by nighttime lights is the core inducement for localized coastal degradation. Furthermore, driving mechanisms are undergoing a critical transition. Although the global mean impacts of climatic factors are relatively weak, extreme drought and high temperatures exhibited significant pulsed shocks in the later stages of the study, indicating that the short-term limiting factors for regional vegetation growth are shifting from normalized environmental fluctuations to extreme climate stress.