Article

A Semi-Empirical Method for Estimating All-Sky Photosynthetically Active Radiation from Sentinel-2 for High-Resolution Land Surface Analysis


1
OpenGeoHub Foundation, 6865 HK Doorwerth, The Netherlands
2
Land & Carbon Lab, World Resources Institute, Washington, DC 20002, USA
3
MultiOne Ltd., 10360 Zagreb, Croatia
4
Remote Sensing and GIS Laboratory (LAPIG), Federal University of Goiás (UFG), Goiania 74001-970, Brazil
*
Author to whom correspondence should be addressed.
Remote Sens. 2026, 18(16), 2745; https://doi.org/10.3390/rs18162745
Submission received: 15 May 2026 / Revised: 28 July 2026 / Accepted: 11 August 2026 / Published: 14 August 2026

Highlights

What are the main findings?
  • A semi-empirical Sentinel-2 framework derived daily clear-sky and all-sky PAR estimates spatially aligned with Sentinel-2 imagery and was evaluated at 172 AmeriFlux sites.
  • Atmospheric and solar-geometry corrections reduced the overall bias from +63.09 to +6.38 W m−2, while the cloud adjustment further reduced it to −1.44 W m−2, with an RMSE of 23.53 W m−2 and r = 0.87 .
What are the implications of the main findings?
  • The framework provides a practical fine-resolution PAR input for analyses combining radiation with Sentinel-2 reflectance, vegetation indices, and other land-surface variables, complementing coarser MODIS, VIIRS, and CERES products.
  • The findings identify more temporally representative cloud attenuation and broader geographic validation as key priorities for improving high-resolution all-sky PAR estimation.

Abstract

Photosynthetically active radiation (PAR) is a fundamental driver of terrestrial photosynthesis and a key input for light use efficiency-based estimates of gross primary productivity (GPP). However, existing PAR products are typically designed for regional to global applications and often remain spatially mismatched with the finer-resolution land surface variables now commonly derived from optical satellite observations. In this study, we present a semi-empirical framework for deriving daily clear-sky and all-sky PAR from Sentinel-2 Level-2A imagery. The approach combines solar geometry, daily extraterrestrial radiation, and simplified atmospheric transmittance parameterizations using Sentinel-2 aerosol, water vapor, and scene classification information to estimate clear-sky PAR, and further extends this formulation to all-sky conditions through a cloud-transmission factor derived from cloud probability to generate a spatially explicit PAR product aligned with Sentinel-2 observations. The resulting estimates are evaluated against flux tower observations from 172 AmeriFlux sites across North and South America for the period 2017–2024 and compared with MODIS MCD18, VIIRS VNP18, and CERES SYN1deg PAR products. The clear-sky Sentinel-2 formulation showed a moderate positive bias of 6.38 W m−2, while the all-sky cloud adjustment reduced the mean bias to −1.44 W m−2 with an RMSE of 23.53 W m−2 and correlation of r = 0.87. The largest improvements occurred in spring and summer seasons, when atmospheric attenuation has the strongest influence on the clear-sky estimates. MODIS and CERES all-sky PAR products achieved lower overall errors with RMSE of 17.60 W m−2 and 15.56 W m−2, respectively, but at substantially coarser spatial resolution. The proposed framework therefore provides a practical high-resolution approximation of daily PAR that is spatially consistent with Sentinel-2 observations. Rather than replacing dedicated radiative transfer-based products, the method is intended to support analyses in which PAR needs to be evaluated together with Sentinel-2 bands, vegetation indices, and other Sentinel-2-derived variables within a common observational framework.

1. Introduction

Solar radiation is the fundamental energy source that sustains terrestrial life and, within it, photosynthetically active radiation (PAR) defines the spectral window through which plants capture energy for photosynthesis. By directly regulating carbon assimilation, vegetation growth, and ecosystem productivity, PAR plays a central role in plant functioning from individual crop canopies to the global terrestrial biosphere [1]. Its magnitude and temporal variability influence not only the efficiency with which vegetation converts light into biomass, but also the capacity of ecosystems to respond to seasonal dynamics, climatic variability, and environmental stress [2,3,4]. Therefore, an accurate characterization of PAR is essential for ecological monitoring, agricultural applications, and land surface models that seek to represent vegetation productivity in space and time [5,6].
Despite its importance, PAR remains difficult to characterize continuously across space and time. Direct measurements are limited to relatively sparse sensor networks, whereas satellite- and reanalysis-based radiation products involve trade-offs among spatial resolution, temporal frequency, latency, and physical complexity [7]. The satellite estimation of PAR has long been recognized as essential for extending observations beyond point measurements, yet most operational products are designed primarily for regional to global applications rather than fine-scale land analysis [5,8]. This limitation has become increasingly relevant as land-surface studies rely more heavily on high-resolution Earth observation data to resolve vegetation structure, ecosystem functioning, and land cover heterogeneity.
Several existing products already provide valuable PAR or radiation inputs for large-scale applications. Satellite-based products such as MODIS MCD18 [9,10] and the VIIRS VNP18/VJ118 family [11] deliver PAR at kilometer-scale resolution with sub-daily to daily temporal coverage, while global composite versions are distributed at coarser 0.05° grids. CERES SYN1deg products provide another widely used source of surface radiative information, including daily and monthly PAR fields at 1° spatial resolution [12]. NASA GMAO reanalysis products, including MERRA-2, also provide meteorological and radiative forcing fields that are widely used in productivity modeling frameworks such as MOD17 products, where incident PAR is commonly approximated from incoming shortwave radiation using a fixed conversion ratio [13,14]. Reanalysis datasets such as ERA5 and ERA5-Land offer another important source of radiative forcing, providing hourly surface solar radiation fields at approximately 0.25° and 0.1° resolution, respectively, from which PAR can be approximated [15,16]. These products are highly valuable for regional to global studies, but each pixel or grid cell represents a ground area (spatial footprint) that remains substantially broader than the scales at which field observations, agricultural parcels, and heterogeneous land-cover mosaics are often analyzed. Although incoming radiation under clear-sky conditions is generally smoother in space than land-surface properties, such coarse radiation fields may still be poorly aligned with the finer-resolution (e.g., 10–30 m) vegetation variables, routinely derived from optical satellite observations.
The growing availability of Sentinel-2-derived land-surface variables [17,18,19] has increased the demand for radiative inputs that are spatially consistent with fine-resolution optical observations. While Sentinel-2 does not directly detect PAR, it provides global, systematic, high-resolution observations together with atmospheric and scene-level information that can support a rapid approximation of clear-sky radiative conditions. In particular, solar geometry, aerosol optical thickness, water vapor content, and scene classification information available in Sentinel-2 Level-2A products provide the necessary inputs for a physically informed PAR derivation framework that is directly aligned with Sentinel-2 Multispectral Imager (MSI) observations. Such an approach is especially relevant for near-real-time applications, where simplicity, reproducibility, and compatibility with existing Sentinel-2 workflows are essential. In this context, the objective of a higher-resolution PAR product is not necessarily to resolve atmospheric variability at the scale of individual meters, nor to replace dedicated radiative-transfer-based radiation products. Rather, the aim is to provide PAR inputs that are spatially aligned with Sentinel-2 observations and sufficiently accurate for high-resolution land-surface analysis under clear-sky conditions. This positioning is particularly important for applications that combine PAR with fine-resolution vegetation variables, where mismatches in spatial support can introduce additional uncertainty into downstream analyses.
This need is also reflected in recent high-resolution productivity studies using Landsat and Sentinel-2 observations, which demonstrate the feasibility of fine-scale GPP estimation but also highlight the importance of radiative inputs that are spatially consistent with high-resolution optical imagery [20]. The novelty of this study lies in adapting established solar-geometry and atmospheric-transmittance concepts into a Sentinel-2-specific semi-empirical daily PAR framework that is directly compatible with Sentinel-2 Level-2A observations. Unlike existing MODIS, VIIRS, CERES, and reanalysis PAR products, which are designed primarily for coarser-resolution regional to global applications, the proposed approach derives PAR at the spatial scale of Sentinel-2 imagery using Sentinel-2 aerosol optical thickness, water vapor, and cloud-probability information. The contribution is therefore not a new radiative-transfer theory, but a practical high-resolution semi-empirical implementation that links Sentinel-2 atmospheric metadata with daily clear-sky and all-sky PAR estimation and evaluates the resulting product against tower observations and established satellite PAR benchmarks. In this study, we specifically ask whether Sentinel-2 Level-2A atmospheric and cloud information can support daily PAR estimates that are spatially aligned with Sentinel-2 observations and sufficiently accurate for high-resolution land-surface applications. To address this question, we (i) derive daily clear-sky PAR from Sentinel-2 using solar geometry and simplified atmospheric attenuation terms, (ii) extend the formulation to all-sky conditions using Sentinel-2 cloud probability, (iii) validate the resulting estimates against AmeriFlux daily PAR observations, and (iv) benchmark the Sentinel-2 estimates against well-established satellite-based PAR products, including MODIS MCD18C2.062, VIIRS VNP18C2, and CERES SYN1deg. Although the framework is motivated by downstream applications such as high-resolution productivity, biomass, and field-scale land-surface applications, the present study focuses on the derivation and direct validation of the PAR estimates themselves, while full downstream testing in GPP or biomass models is left for future work.

2. Materials and Methods

2.1. Semi-Empirical Clear-Sky and All-Sky PAR Estimation Framework

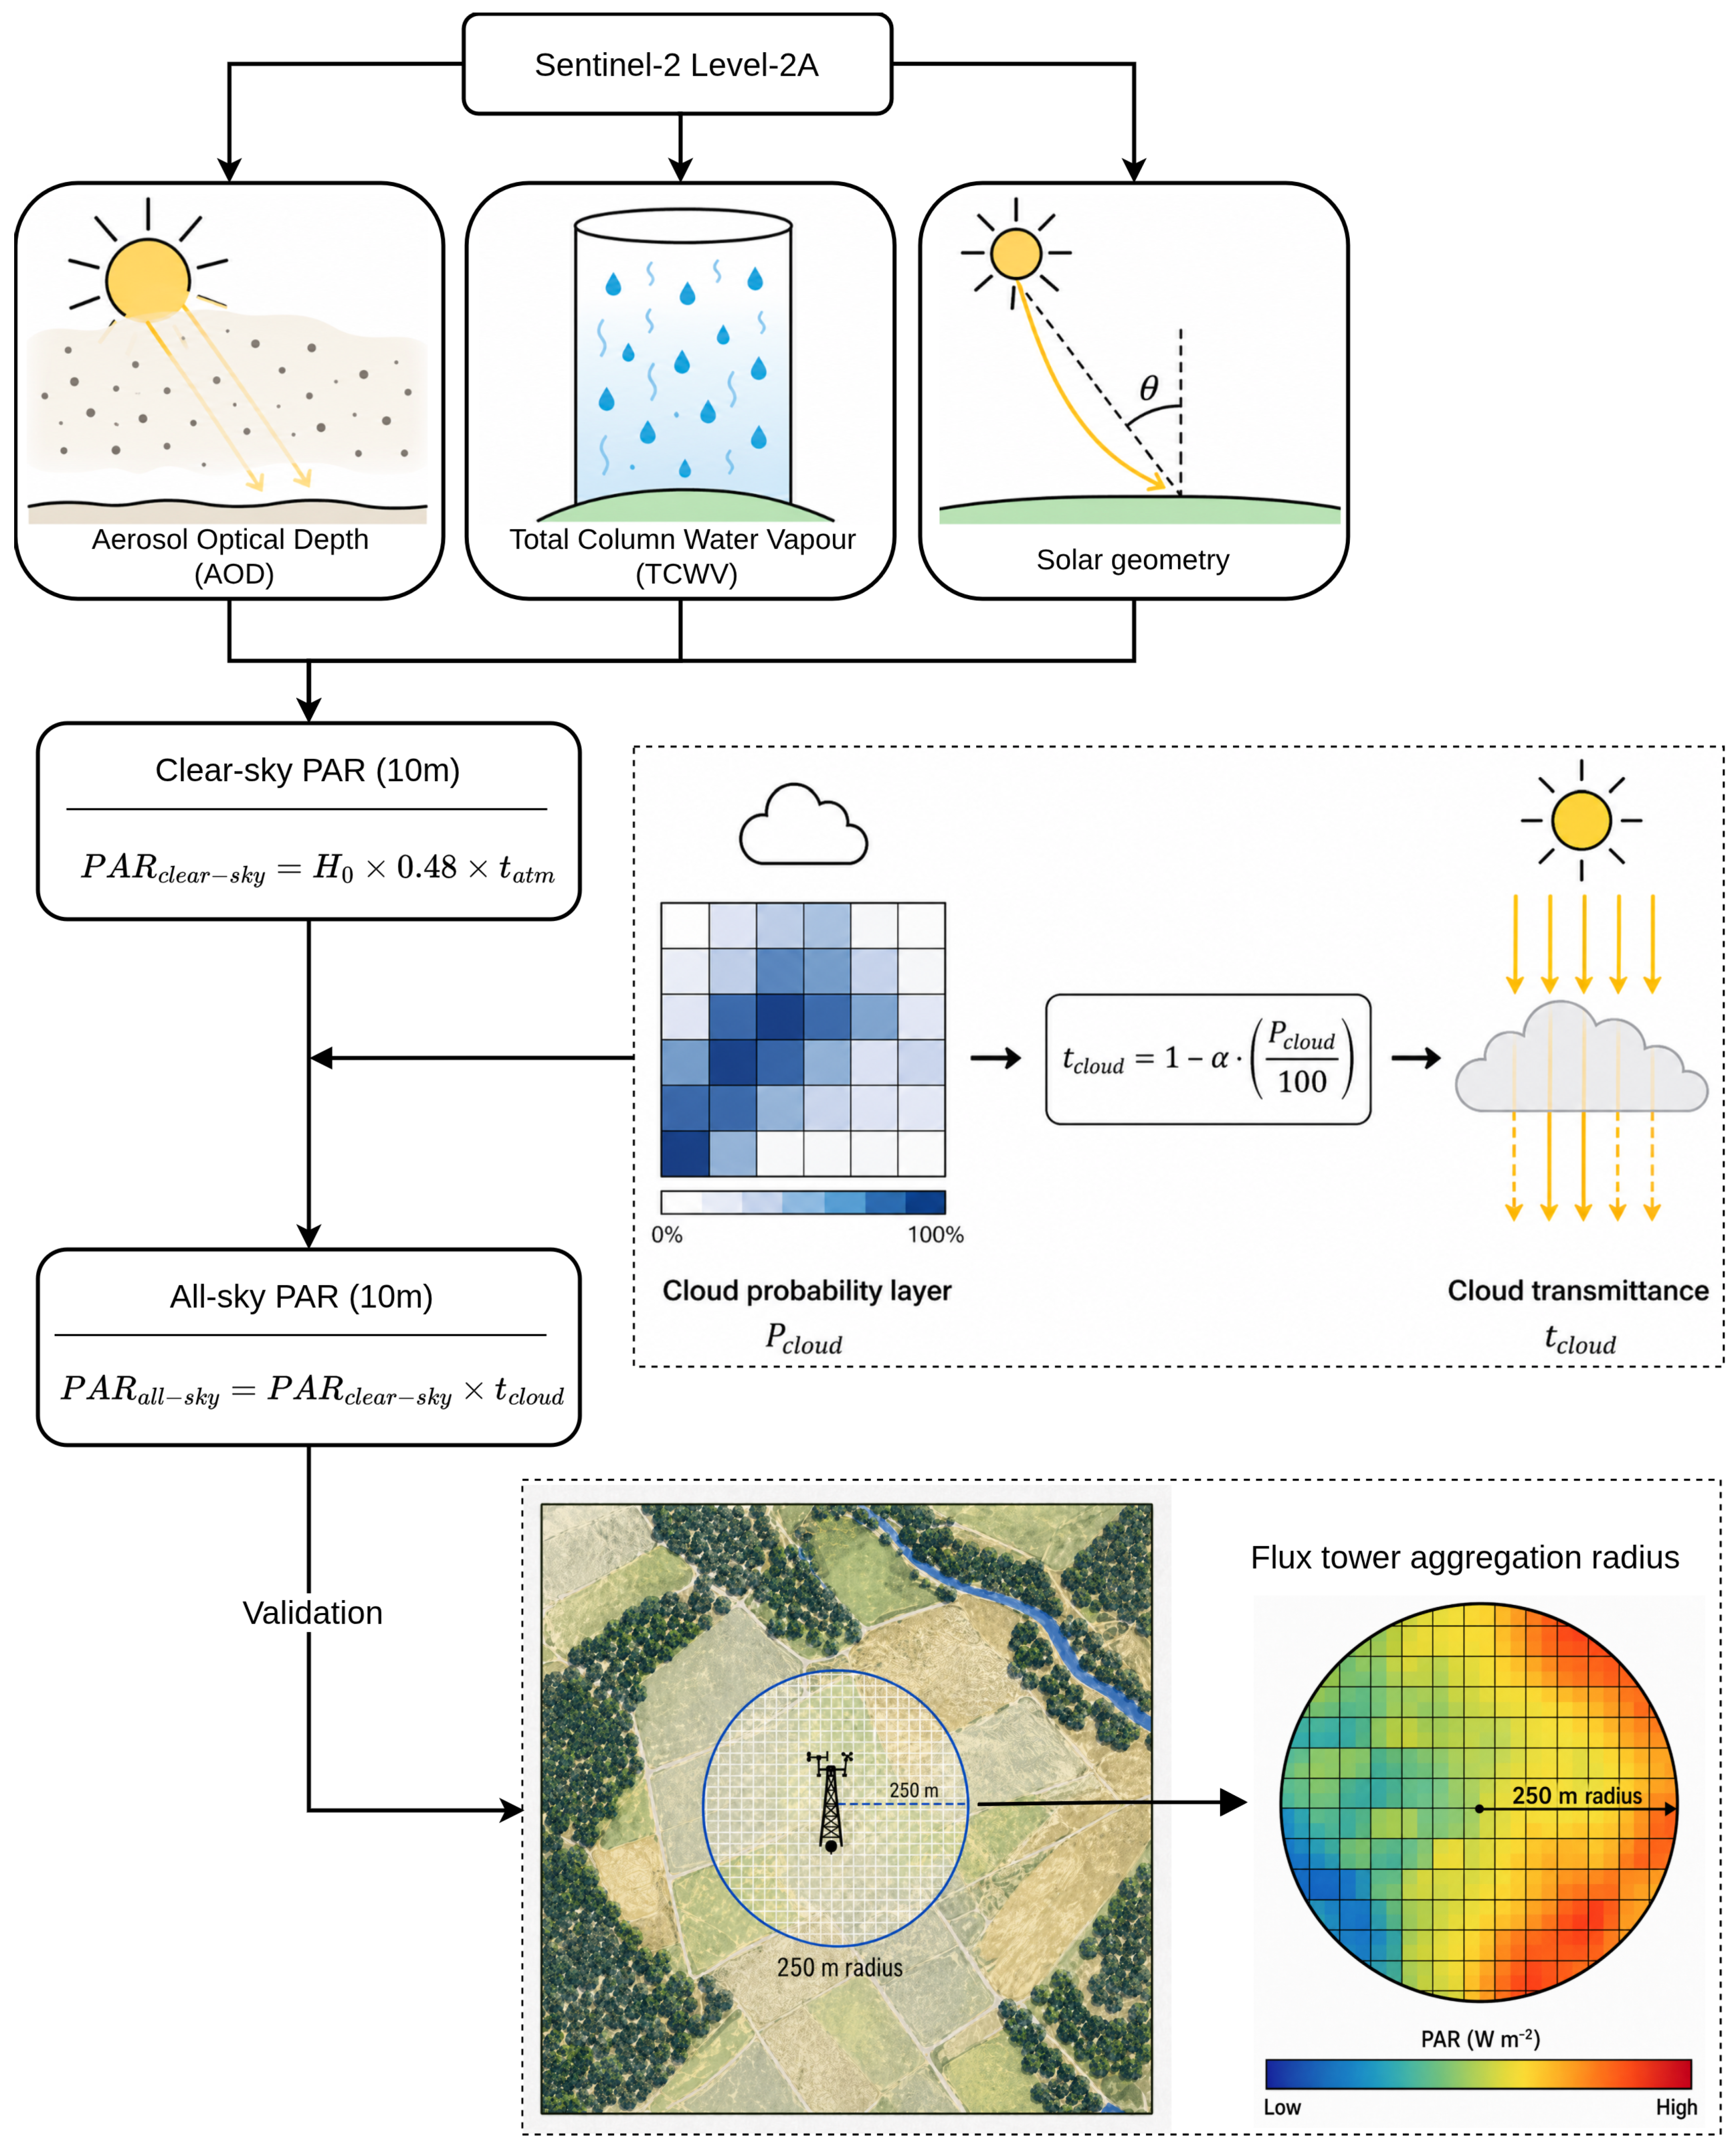
Figure 1 summarizes the overall workflow used to derive daily clear-sky and all-sky PAR based on Sentinel-2 Level-2A imagery and to evaluate the resulting estimates against flux-tower observations and existing reference products. The workflow begins with the acquisition of Sentinel-2 atmospheric and scene classification variables, followed by the calculation of daily extraterrestrial radiation from solar geometry. The clear-sky PAR is then estimated by applying simplified atmospheric transmittance terms and converting the resulting daily surface radiation to PAR. The clear-sky estimate is then extended to all-sky conditions using a cloud-transmission factor derived from Sentinel-2 cloud probability, which attenuates PAR according to the estimated cloudiness of each pixel. Pixel-level estimates are aggregated over tower-centered windows, a 250 m radius around towers, to reduce point-to-pixel mismatch and to provide a local spatial representation of conditions surrounding the radiation sensor. This fixed tower-centered window should not be interpreted as a dynamic eddy-covariance flux footprint; rather, it provides a pragmatic spatial aggregation scale for comparing 10 m Sentinel-2 PAR estimates with tower-based daily PAR observations.

2.1.1. Solar Geometry and Daily Extraterrestrial Irradiance

The incoming solar radiation over a horizontal surface ( G o h ) is expressed in (W m−2) as
G o h = G o n cos θ z
where G o n is the extraterrestrial solar irradiance corrected for the time of year, and θ z is the solar zenith angle. Extraterrestrial irradiance is the incoming solar radiation at the top of the atmosphere and is defined as
G o n = G s c E 0
where G s c is the average amount of solar energy received per second by a square meter of area oriented normal to the Sun, also known as the solar constant, and E 0 is the eccentricity correction factor. The solar constant G sc was set to 1361 W m 2 , following the revised total solar irradiance value reported by Kopp and Lean [21]. The extraterrestrial normal irradiance G on was then calculated by applying the inverse relative Earth–Sun distance correction factor E 0 . Thus, in this study, the seasonal variation in G on is represented through Earth–Sun distance changes associated with Earth’s elliptical orbit, while solar-activity-driven variations in total solar irradiance are not explicitly modeled. This simplification is expected to have a negligible effect on the daily PAR estimates because the 11-year solar-cycle variability in total solar irradiance is typically on the order of 0.1% [21], which is much smaller than the annual Earth–Sun distance correction represented by E 0 .
The eccentricity correction E 0 , or the distance correction, is based on the inverse-square law governing radiative flux, and is represented as
E 0 = r 0 r 2
where r 0 is the mean distance between the Earth and Sun, which represents 1 astronomical unit (1 AU), and r is the instantaneous distance. As Earth’s elliptical orbit causes the Earth–Sun distance to vary periodically over the year, this correction can be expressed as a harmonic series. Spencer [22] derived a Fourier series representation of Equation (3) by fitting harmonics to the Keplerian distance variation:
E 0 = 1.00011 + 0.034221 cos β + 0.00128 sin β + 0.000719 cos ( 2 β ) + 0.000077 sin ( 2 β ) ,
where β is the day-angle calculated by multiplying the mean orbital angular velocity with the day of year,
β = 2 π ( N 1 ) 365 .
Here, the day of the year N is 1 for January 1 and 365 for December 31 (366, if a leap year). All angular variables used in the solar-geometry and atmospheric-transmittance calculations are expressed in radians unless otherwise stated.
The cosine of the solar zenith angle is formulated from spherical trigonometry as
cos θ z = sin ϕ sin δ + cos ϕ cos δ cos Ω ,
where ϕ is the geodetic latitude, δ is the solar declination, and Ω is the hour angle.
The solar declination δ is approximated by
δ = 23 . 45 π 180 sin 2 π ( 284 + DOY ) 365 .
The hour angle Ω is defined as
Ω = π 12 ( t solar 12 ) ,
where t solar is the solar time in hours. Solar noon corresponds to Ω = 0 .
Combining the above relationships, the instantaneous extraterrestrial irradiance over a horizontal surface becomes
G o h = G s c E 0 sin ϕ sin δ + cos ϕ cos δ cos Ω .
The total daily extraterrestrial radiation H 0 (J m−2 day−1) at the top of the atmosphere is given by
H 0 = s u n r i s e s u n s e t G o h ( t ) d t ,
which can be approximated by
H 0 = 86400 π G o n Ω s s sin ϕ sin δ + cos ϕ cos δ sin Ω s s ,
where Ω s s is the sunset hour angle (radians).

2.1.2. Atmospheric Attenuation

Clear-sky surface radiation can be expressed as the TOA extraterrestrial irradiance attenuated by the atmosphere, which means atmospheric radiative transfer between the TOA and the ground must be modeled. Consequently, the clear-sky surface radiation can be formulated as
H = H 0 t atm ,
where t atm accounts for the cumulative effects of atmospheric transmittance. A common approximation is to represent the cumulative atmospheric transmission as the product of transmittance terms associated with major attenuation processes, including Rayleigh (molecular) scattering ( t R ), aerosols ( t a ), and water vapor absorption ( t w ):
t atm = t R t a t w .
These components can significantly impact the transmission of radiation through the atmosphere, which affects the amount that ultimately reaches the surface. We adopt a computationally efficient parameterization for Rayleigh transmittance derived from the clear-sky model by Bird and Hulstrom [23]:
t R = exp 0.0903 · m 0.84 ,
where m is the optical air mass. In its simplest form, optical air mass can be approximated from the solar zenith angle as
m ( θ z ) = 1 cos θ z .
However, this geometric approximation becomes less accurate at large solar zenith angles because it does not account for the curvature of the atmospheric path. To mitigate this limitation, optical air mass was estimated using the Kasten–Young formulation [24]:
m r ( θ z ) = cos θ z + 0.50572 96.07995 θ z 1.6364 1 ,
where θ z is the solar zenith angle in degrees and m r is the relative optical air mass.
Because atmospheric attenuation depends on air pressure, relative air mass was converted to pressure-corrected air mass as
m = m r P P 0 ,
where P 0 is the standard sea-level pressure and P is the local surface pressure. Surface pressure was estimated from elevation using an exponential height correction:
P = P 0 exp z H ,
where z is elevation obtained from the NASADEM digital elevation model (30 m spatial resolution) [25] and H is the atmospheric scale height.
Aerosol effects are represented using a Beer–Lambert transmittance based on the aerosol optical depth at 550 nm ( AOD 550 ) and the pressure-corrected air mass m ( θ z ) :
t a = exp AOD 550 m .
This formulation provides a simplified, computationally efficient estimate of aerosol-induced attenuation, while neglecting the spectral variability of aerosol extinction across the PAR range and the partitioning of surface irradiance into direct and diffuse components. Although PAR spans 400–700 nm, aerosol optical depth varies with wavelength, with shorter wavelengths generally experiencing stronger attenuation than longer wavelengths, depending on aerosol type and particle-size distribution. In a more complete spectral formulation, this wavelength dependence could be represented using an Ångström-type relationship and integrated across the PAR waveband [26]. In the present framework, however, we approximate aerosol effects using AOD 550 as a practical broadband proxy. The wavelength 550 nm is commonly treated as representative because it lies near the center of the visible window and, by extension, the PAR domain. Consequently, many widely used satellite and reanalysis aerosol products report AOD primarily at 550 nm as a standard reference variable (e.g., MODIS-based retrievals and global reanalyses/assimilations such as MERRA-2 and CAMS) [27,28].
In addition to Rayleigh scattering and aerosol attenuation, atmospheric water vapor contributes to the reduction in incoming radiation reaching the surface. Considering a simplified clear-sky parameterization based on Bird and Hulstrom [23], water vapor transmittance was represented as
t w = 1 0.077 TCWV m 0.38 1 + 0.077 TCWV m 0.38 ,
where TCWV is the total column water vapor. This term provides a computationally efficient approximation of water-vapor-induced attenuation within the clear-sky formulation, while remaining consistent with the simplified treatment adopted for the other atmospheric transmittance components.

2.1.3. Daily PAR Derivation

Using the daily extraterrestrial radiation term H 0 defined in Section 2.1.1, clear-sky surface PAR was approximated as 48% of incoming shortwave radiation [5]. Because H 0 represents daily integrated energy in J m−2 day−1, the resulting PAR was converted to daily mean flux density before comparison with tower observations:
P A R ¯ cs = 0.48 H 0 t atm 86400 ,
where t atm is the effective atmospheric transmittance under clear-sky conditions and 86,400 is the number of seconds per day. Thus, P A R ¯ cs is expressed in W m−2. A fixed shortwave-to-PAR fraction of 0.48 was used as a practical first-order approximation for converting broadband solar radiation into the photosynthetically active portion of the spectrum. However, the shortwave-to-PAR fraction is not strictly constant. Previous studies have shown that the shortwave-to-PAR relationship varies with atmospheric conditions, sky clearness, season, solar geometry, and cloudiness [29,30]. Therefore, in the present framework, the fixed value of 0.48 should be interpreted as a broadband approximation rather than a dynamic spectral conversion. This simplification is consistent with the semi-empirical nature of the proposed formulation, while the uncertainty associated with this assumption is discussed further in the limitations section (see Section 4.1).
To derive daily PAR, atmospheric attenuation was not represented solely by the noon solar geometry. Instead, optical air mass was evaluated at representative solar zenith geometries during the daylight period, and the resulting transmittance estimates were combined to approximate an effective daily atmospheric transmission. In the present implementation, we used three representative solar hour angles, corresponding approximately to 09:00, 12:00, and 15:00 local solar time. The corresponding solar zenith angles were calculated separately for each date and location. The atmospheric transmittance was then calculated separately for each sampled solar geometry and combined as an effective daytime transmittance:
t atm = i = 1 3 w i t atm , i ,
where t atm , i is the atmospheric transmittance calculated using the solar zenith angle and pressure-corrected air mass at hour angle Ω i . In the present implementation, equal weights were used, such that w i = 1 / 3 and i w i = 1 . This three-sample scheme was selected as a computationally efficient representation of diurnal variation in the atmospheric optical path.
To extend the formulation from clear-sky to all-sky conditions, a cloud-transmission factor ( t cloud ) was introduced based on Sentinel-2 cloud probability:
P A R ¯ all = P A R ¯ cs t cloud ,
where
t cloud = 1 f cloud 1 τ cloud .
Here, f cloud is the cloud fraction, probability-weighted cloudiness factor derived from Sentinel-2 cloud probability layer. Cloud probabilities below 20% were set to zero to suppress low-confidence cloud detections, while probabilities equal to or above this threshold were scaled from percent to fractional units:
f cloud = 0 , P cloud < 20 , P cloud / 100 , P cloud 20 ,
where P cloud is the Sentinel-2 cloud probability in percentage. The parameter τ cloud is the cloud transmittance, defined as the fraction of PAR that still reaches the surface through cloud cover. In this study, τ cloud was assigned an empirical value of 0.5. Hence, the clear-sky estimate represents daily mean PAR under cloud-free conditions, whereas the all-sky estimate approximates daily mean PAR received at the surface after accounting for cloud attenuation. All Sentinel-2 PAR estimates reported in this study are therefore expressed as daily mean flux densities in W m−2.
To assess the robustness of these empirical cloud-related choices, we conducted a sensitivity analysis using cloud-probability thresholds from 0% to 50% and cloud-transmittance values from 0.2 to 0.8. In addition, an exploratory repeated site-level calibration/validation analysis was performed to evaluate the stability of the selected parameter values. These supplementary tests were used only to assess parameter sensitivity and were not used to redefine the selected configuration used in the main analysis (see Appendix A, Table A1).

2.2. Sentinel-2

The Copernicus Sentinel-2 mission comprises two Sun-synchronous, near-polar orbiting, multispectral satellites designed to provide high-resolution, high-revisit optical imagery for monitoring land surfaces and coastal/inland waters. Sentinel-2 Level-2A products deliver atmospherically corrected surface reflectance (Bottom-Of-Atmosphere, BOA) derived from Level-1C top-of-atmosphere measurements, together with scene classification (SCL) and quality information. As part of the Level-2A processing chain, auxiliary atmospheric fields are produced and used to model atmospheric absorption and scattering effects. Among these auxiliary layers, the aerosol optical depth (AOD) characterizes the column aerosol loading that influences path radiance and visibility, while the total column water vapor represents the amount of atmospheric moisture that drives strong absorption features (notably in the near-infrared). Providing AOD and water vapor auxiliary datasets alongside surface reflectance improves the traceability of the correction, supports uncertainty-aware interpretation, and can be valuable for downstream applications such as vegetation monitoring, aquatic remote sensing, and atmospheric screening.

2.3. Other Satellite-Based PAR Products

Other satellite-based PAR products considered in this study included MODIS MCD18C2.062, VIIRS/NPP VNP18C2, and CERES SYN1deg. MCD18C2.062 is a MODIS Terra–Aqua combined Level-3 global all-sky photosynthetically active radiation (PAR) product distributed on the 0.05° Climate Modeling Grid. It provides incident PAR in the 400–700 nm waveband as eight 3-hourly layers per day (GMT 00:00, 03:00, 06:00, 09:00, 12:00, 15:00, 18:00, and 21:00) [10]. In this study, daily PAR was derived by multiplying each 3-hourly PAR layer (W m−2) by the 3 h interval length and summing the resulting eight interval totals for each day to obtain daily integrated energy. This total was then divided by 24 h to obtain daily mean PAR flux in W m−2.
In addition to MODIS, we included the VIIRS/NPP VNP18C2 Version 2 product as an independent satellite-based PAR reference. VNP18C2 is a Suomi National Polar-orbiting Partnership (Suomi NPP) VIIRS Level-3 Climate Modeling Grid (CMG) PAR product produced at 0.05° spatial resolution and daily temporal resolution [11,31]. The VNP18 algorithm adapts a narrowband look-up-table approach and accounts for different aerosol and cloud loadings under varying illumination and viewing geometries. Daily mean VIIRS PAR was calculated from global 3-hourly PAR variables using the same procedure as for MODIS.
We also considered the CERES SYN1deg product family, which provides radiative fluxes on a coarser 1° grid and explicitly separates direct and diffuse components of surface radiation. CERES SYN1deg combines hourly CERES and geostationary top-of-atmosphere (TOA) fluxes, MODIS/VIIRS and GEO cloud properties, MODIS/VIIRS aerosol information, and Fu–Liou radiative transfer calculations to derive surface and in-atmosphere fluxes consistent with the CERES-observed TOA fluxes. The SYN1deg product is available in multiple temporal aggregations from hourly products to monthly [12,32]. We considered three CERES-based PAR quantities: surface all-sky PAR, surface clear-sky PAR, and TOA all-sky PAR. Daily CERES PAR values for these products were calculated by summing the direct and diffuse PAR components provided by the product.
All satellite products were evaluated within a daily framework. Sentinel-2-derived PAR estimates were available only on valid Sentinel-2 overpass dates and were therefore compared with in situ daily PAR observations for the same calendar dates. In contrast, MODIS, VIIRS, and CERES provide daily PAR estimates and were evaluated using all available daily records that coincided with valid in situ daily PAR observations. Thus, the Sentinel-2 validation was constrained by Sentinel-2 temporal availability, whereas the MODIS, VIIRS, and CERES evaluations used continuous daily product availability.

2.4. Fluxnet Towers

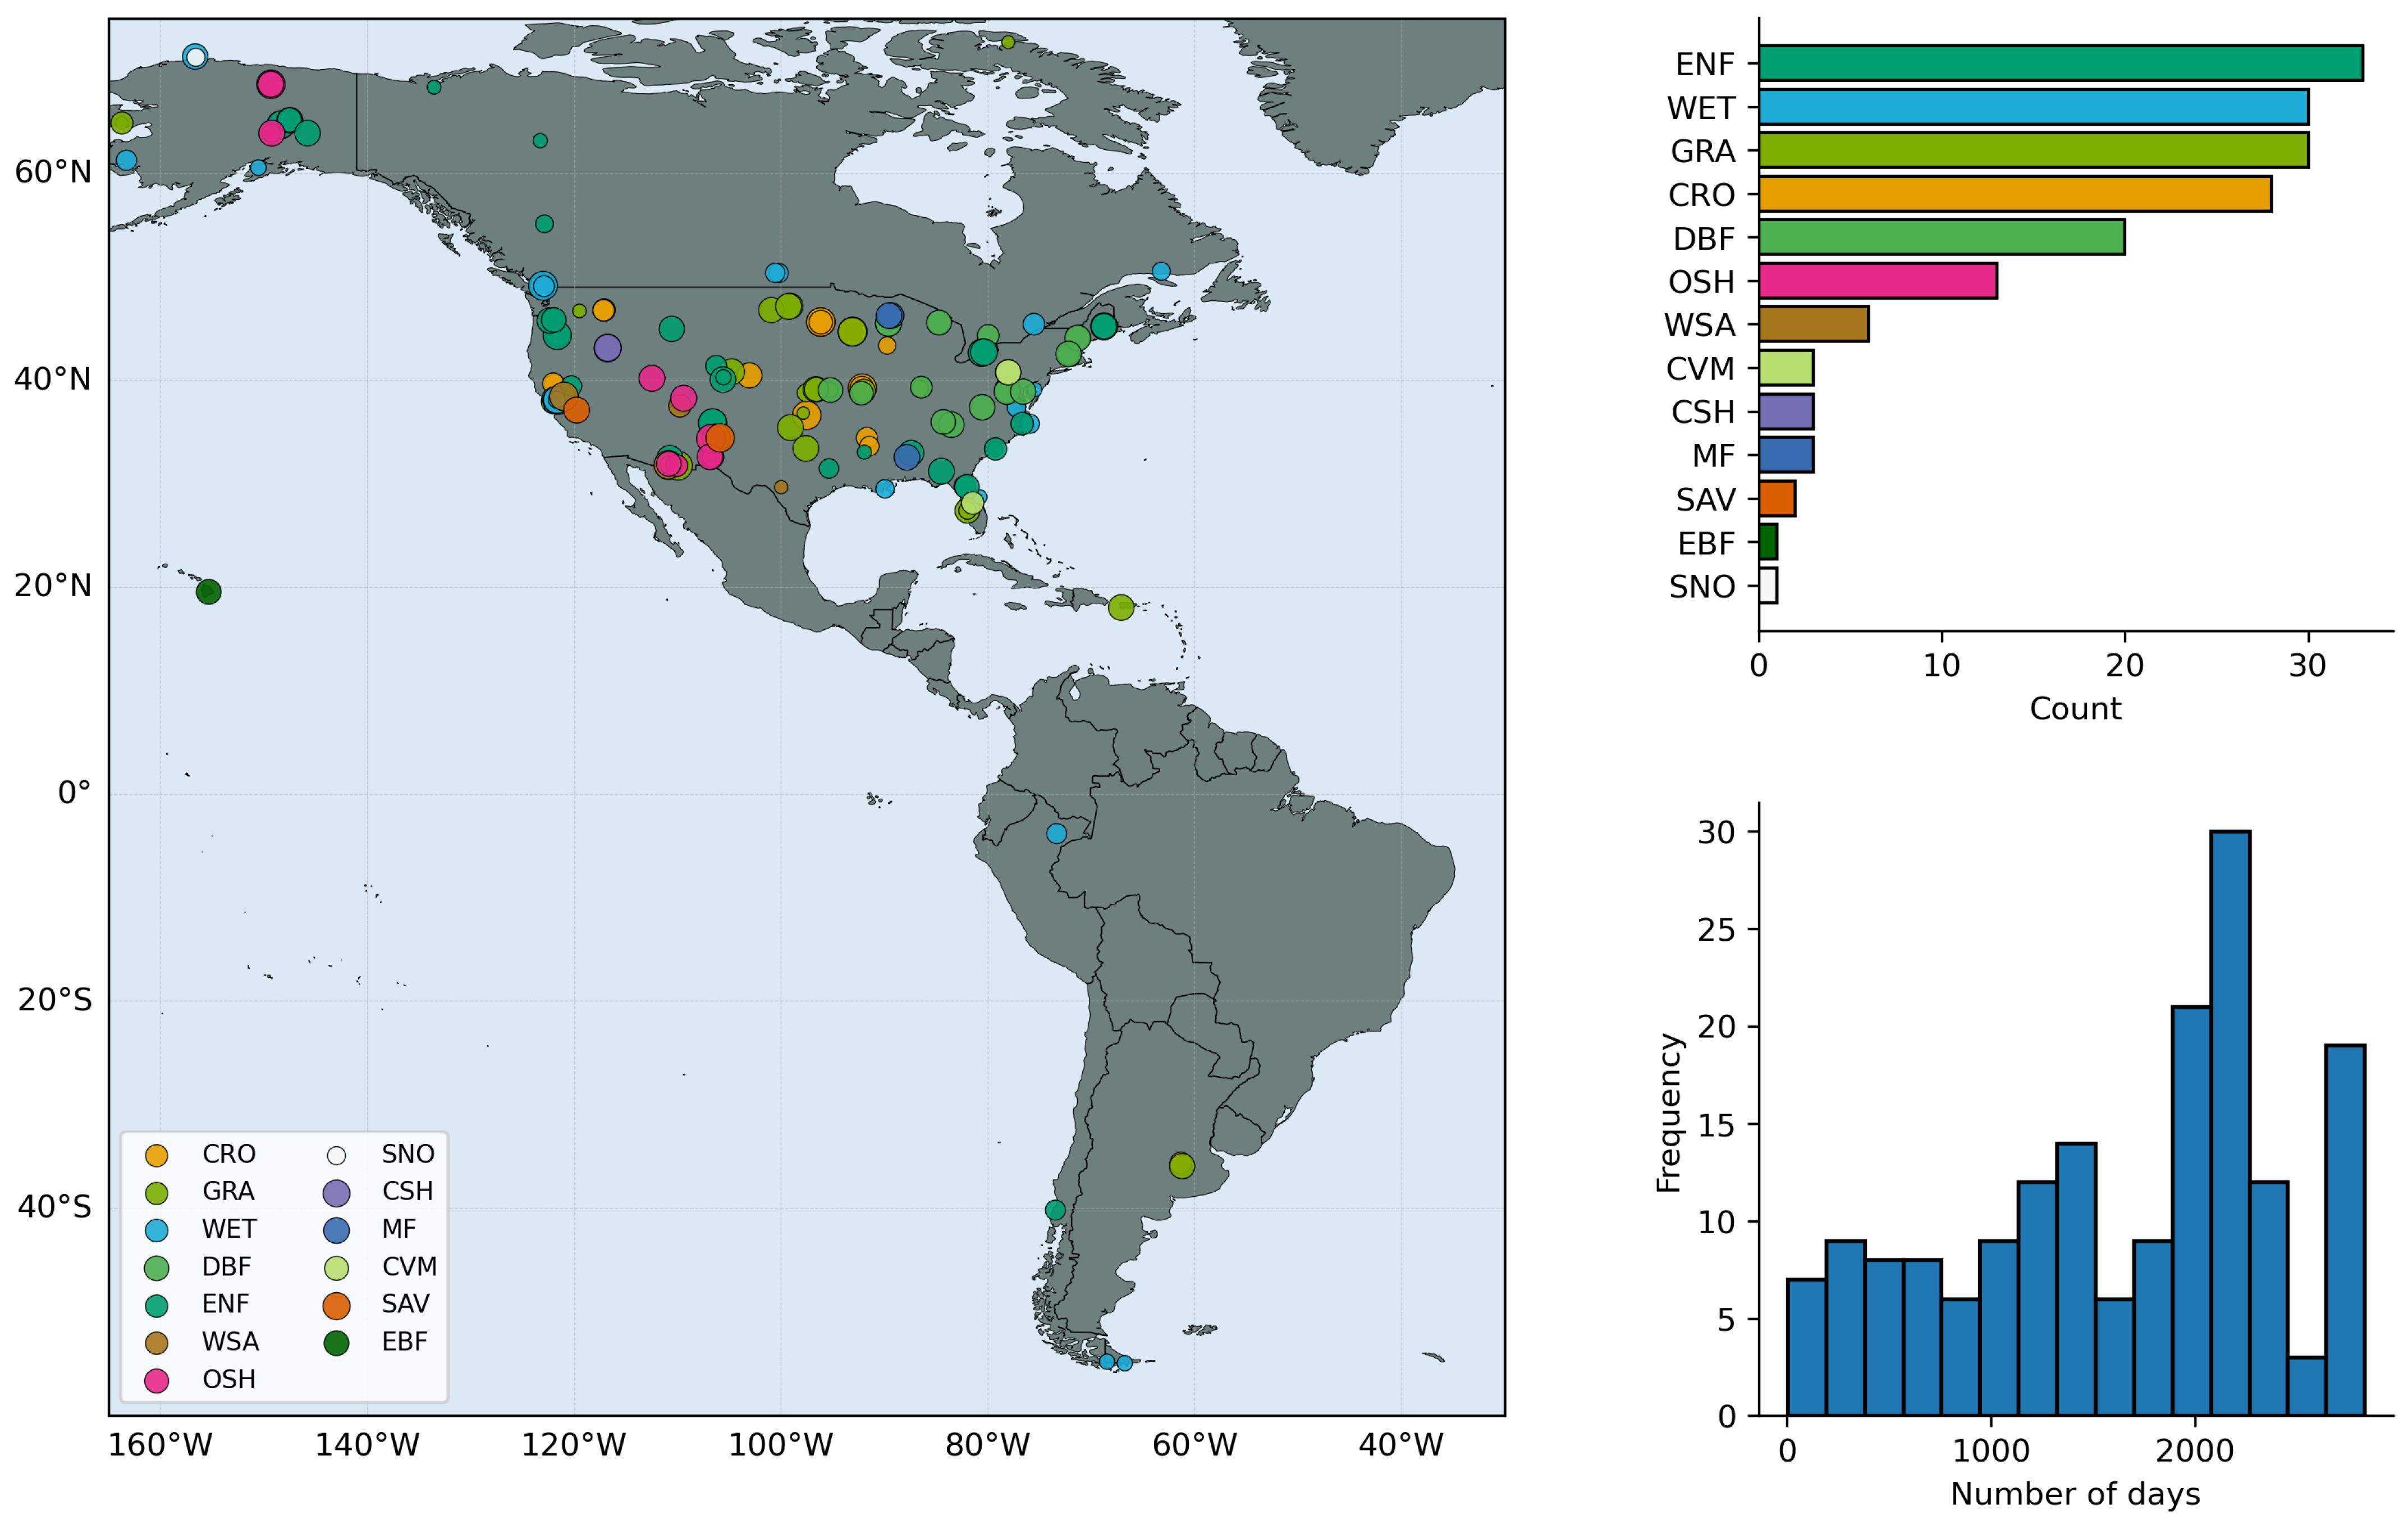
To evaluate the satellite-derived PAR estimates, we used eddy-covariance flux towers from the AmeriFlux network (Figure 2). In addition to providing continuous measurements of ecosystem carbon exchange, particularly net ecosystem exchange (NEE) and respiration-related fluxes, these sites also collect key meteorological variables, including incoming shortwave radiation and incoming photosynthetic photon flux density (PPFD), which are directly relevant for PAR assessment. The daily data used in this study span the period from 1 April 2017, corresponding to the start of the Sentinel-2 Level-2 data record, to 31 December 2024. From the more than 500 AmeriFlux stations screened in this study, 230 stations were within the temporal coverage of the analysis period. Among these, 57 stations were excluded because no valid PPFD measurements were available to derive the in situ PAR reference. One additional station was excluded because, although both valid PPFD measurements and valid Sentinel-2 scenes were available, no same-date matched observations between Sentinel-2 and tower PAR were found. After these filtering steps, 172 AmeriFlux sites were retained for validation.
Daily in situ PAR was derived from AmeriFlux PPFD_IN measurements. The PPFD_IN variable is reported in the AmeriFlux daily product as the daily mean photosynthetic photon flux density ( μ mol photons m−2 s−1), aggregated from half-hourly observations over the 24 h period. Daily mean PAR in W m−2 was obtained using the conversion factor of 4.57 μ mol photons J−1 [33].

3. Results

3.1. Performance of the PAR Derivation Framework Against AmeriFlux

To assess how each component of the proposed framework improves PAR estimation, we evaluated four model formulations of increasing complexity against AmeriFlux observations. The first experiment represents TOA PAR, in which PAR is derived solely from extraterrestrial radiation without atmospheric correction. The second experiment introduces atmospheric attenuation to estimate clear-sky surface PAR, while adopting a constant air-mass approximation. The third experiment further refines the clear-sky formulation by allowing air mass to vary with solar zenith angle, thereby representing changes in optical path length more realistically during the day. Finally, the fourth experiment extends the framework to all-sky surface PAR by incorporating a cloud-transmission factor derived from cloud probability. This stepwise design makes it possible to isolate the contribution of each modeling component and to evaluate how the transition from TOA PAR to clear-sky and all-sky surface PAR affects agreement with tower observations.
Throughout all stages of the experiment, daily PAR estimates were generated from Sentinel-2 overpasses coincident with the flux tower locations. As Sentinel-2 acquisitions are temporally irregular and do not provide continuous daily coverage, tower-based PAR observations were matched to the dates of valid Sentinel-2-derived PAR estimates.

3.1.1. TOA PAR from Solar Geometry

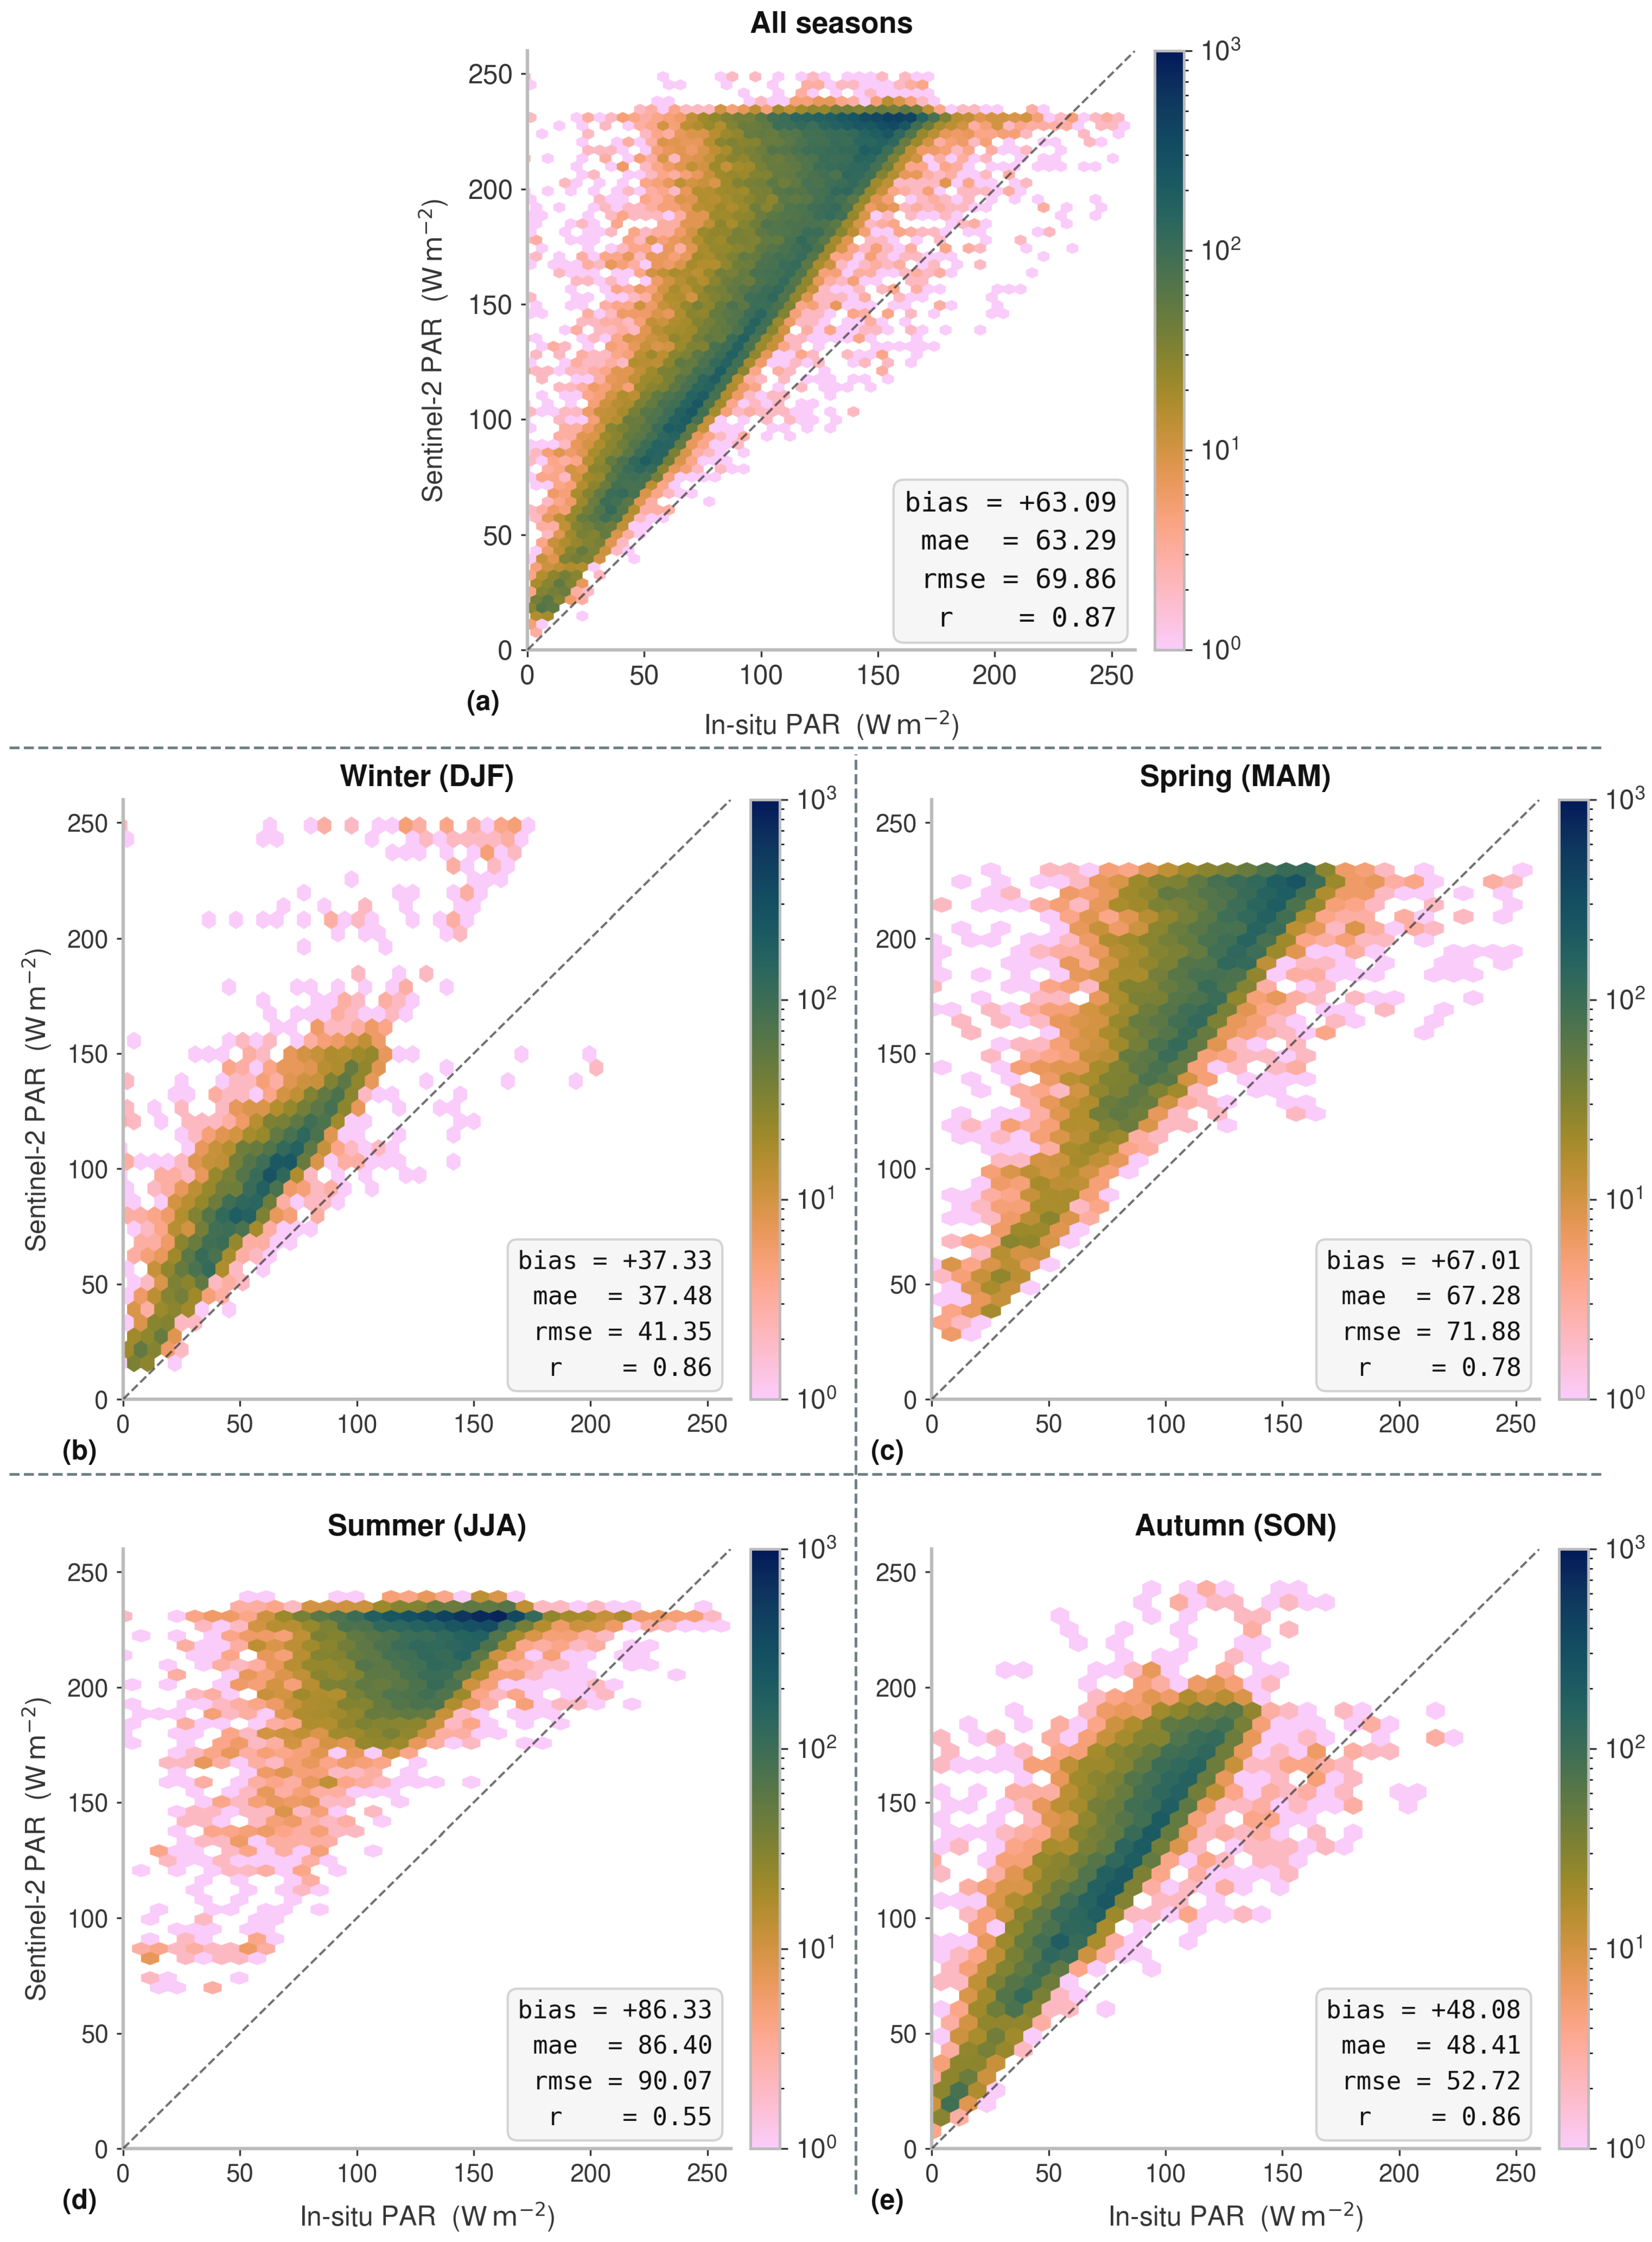
The purely geometric formulation, which estimates PAR directly from extraterrestrial radiation without accounting for atmospheric attenuation, represents TOA PAR rather than surface PAR. As expected, this first-order approximation substantially overestimated the in situ PAR observations from AmeriFlux towers across all seasons (Figure 3), because it does not include radiative losses associated with Rayleigh scattering, aerosols, water vapor, or clouds. In all observations, the TOA-based formulation showed a positive bias of +63.09 W m−2, an RMSE of 69.86 W m−2, and a correlation of r = 0.87 . Consequently, the TOA-based solution should be interpreted as an extraterrestrial reference estimate of incident PAR before atmospheric attenuation, rather than as a realistic representation of the radiation actually reaching the land surface.
Despite this strong positive bias, the solar-geometry-based formulation was still able to reproduce the broad seasonal pattern of incoming radiation, indicating that astronomical controls such as solar declination, day length, and solar elevation account for a substantial fraction of the temporal variability in PAR. This is reflected in the relatively strong overall correlation with in situ measurements, even though the magnitude of PAR was consistently overestimated.
Furthermore, the seasonal performances of TOA PAR (Figure 3b–e) show that the magnitude of overestimation was not uniform throughout the year. The estimation errors were the smallest in winter, with a bias of +37.33 W m−2 and r = 0.86 , but increased markedly during spring (+67.01 W m−2, r = 0.78 ) and especially summer (+87.28 W m−2, r = 0.55 ), when the TOA formulation diverged most strongly from the surface observations. In autumn, the bias decreased again to +48.08 W m−2 and the correlation recovered to r = 0.856 . In summer, the spread around the one-to-one line also increased, which indicates weaker agreement with in situ PAR.

3.1.2. Clear-Sky Surface PAR with Atmospheric Attenuation

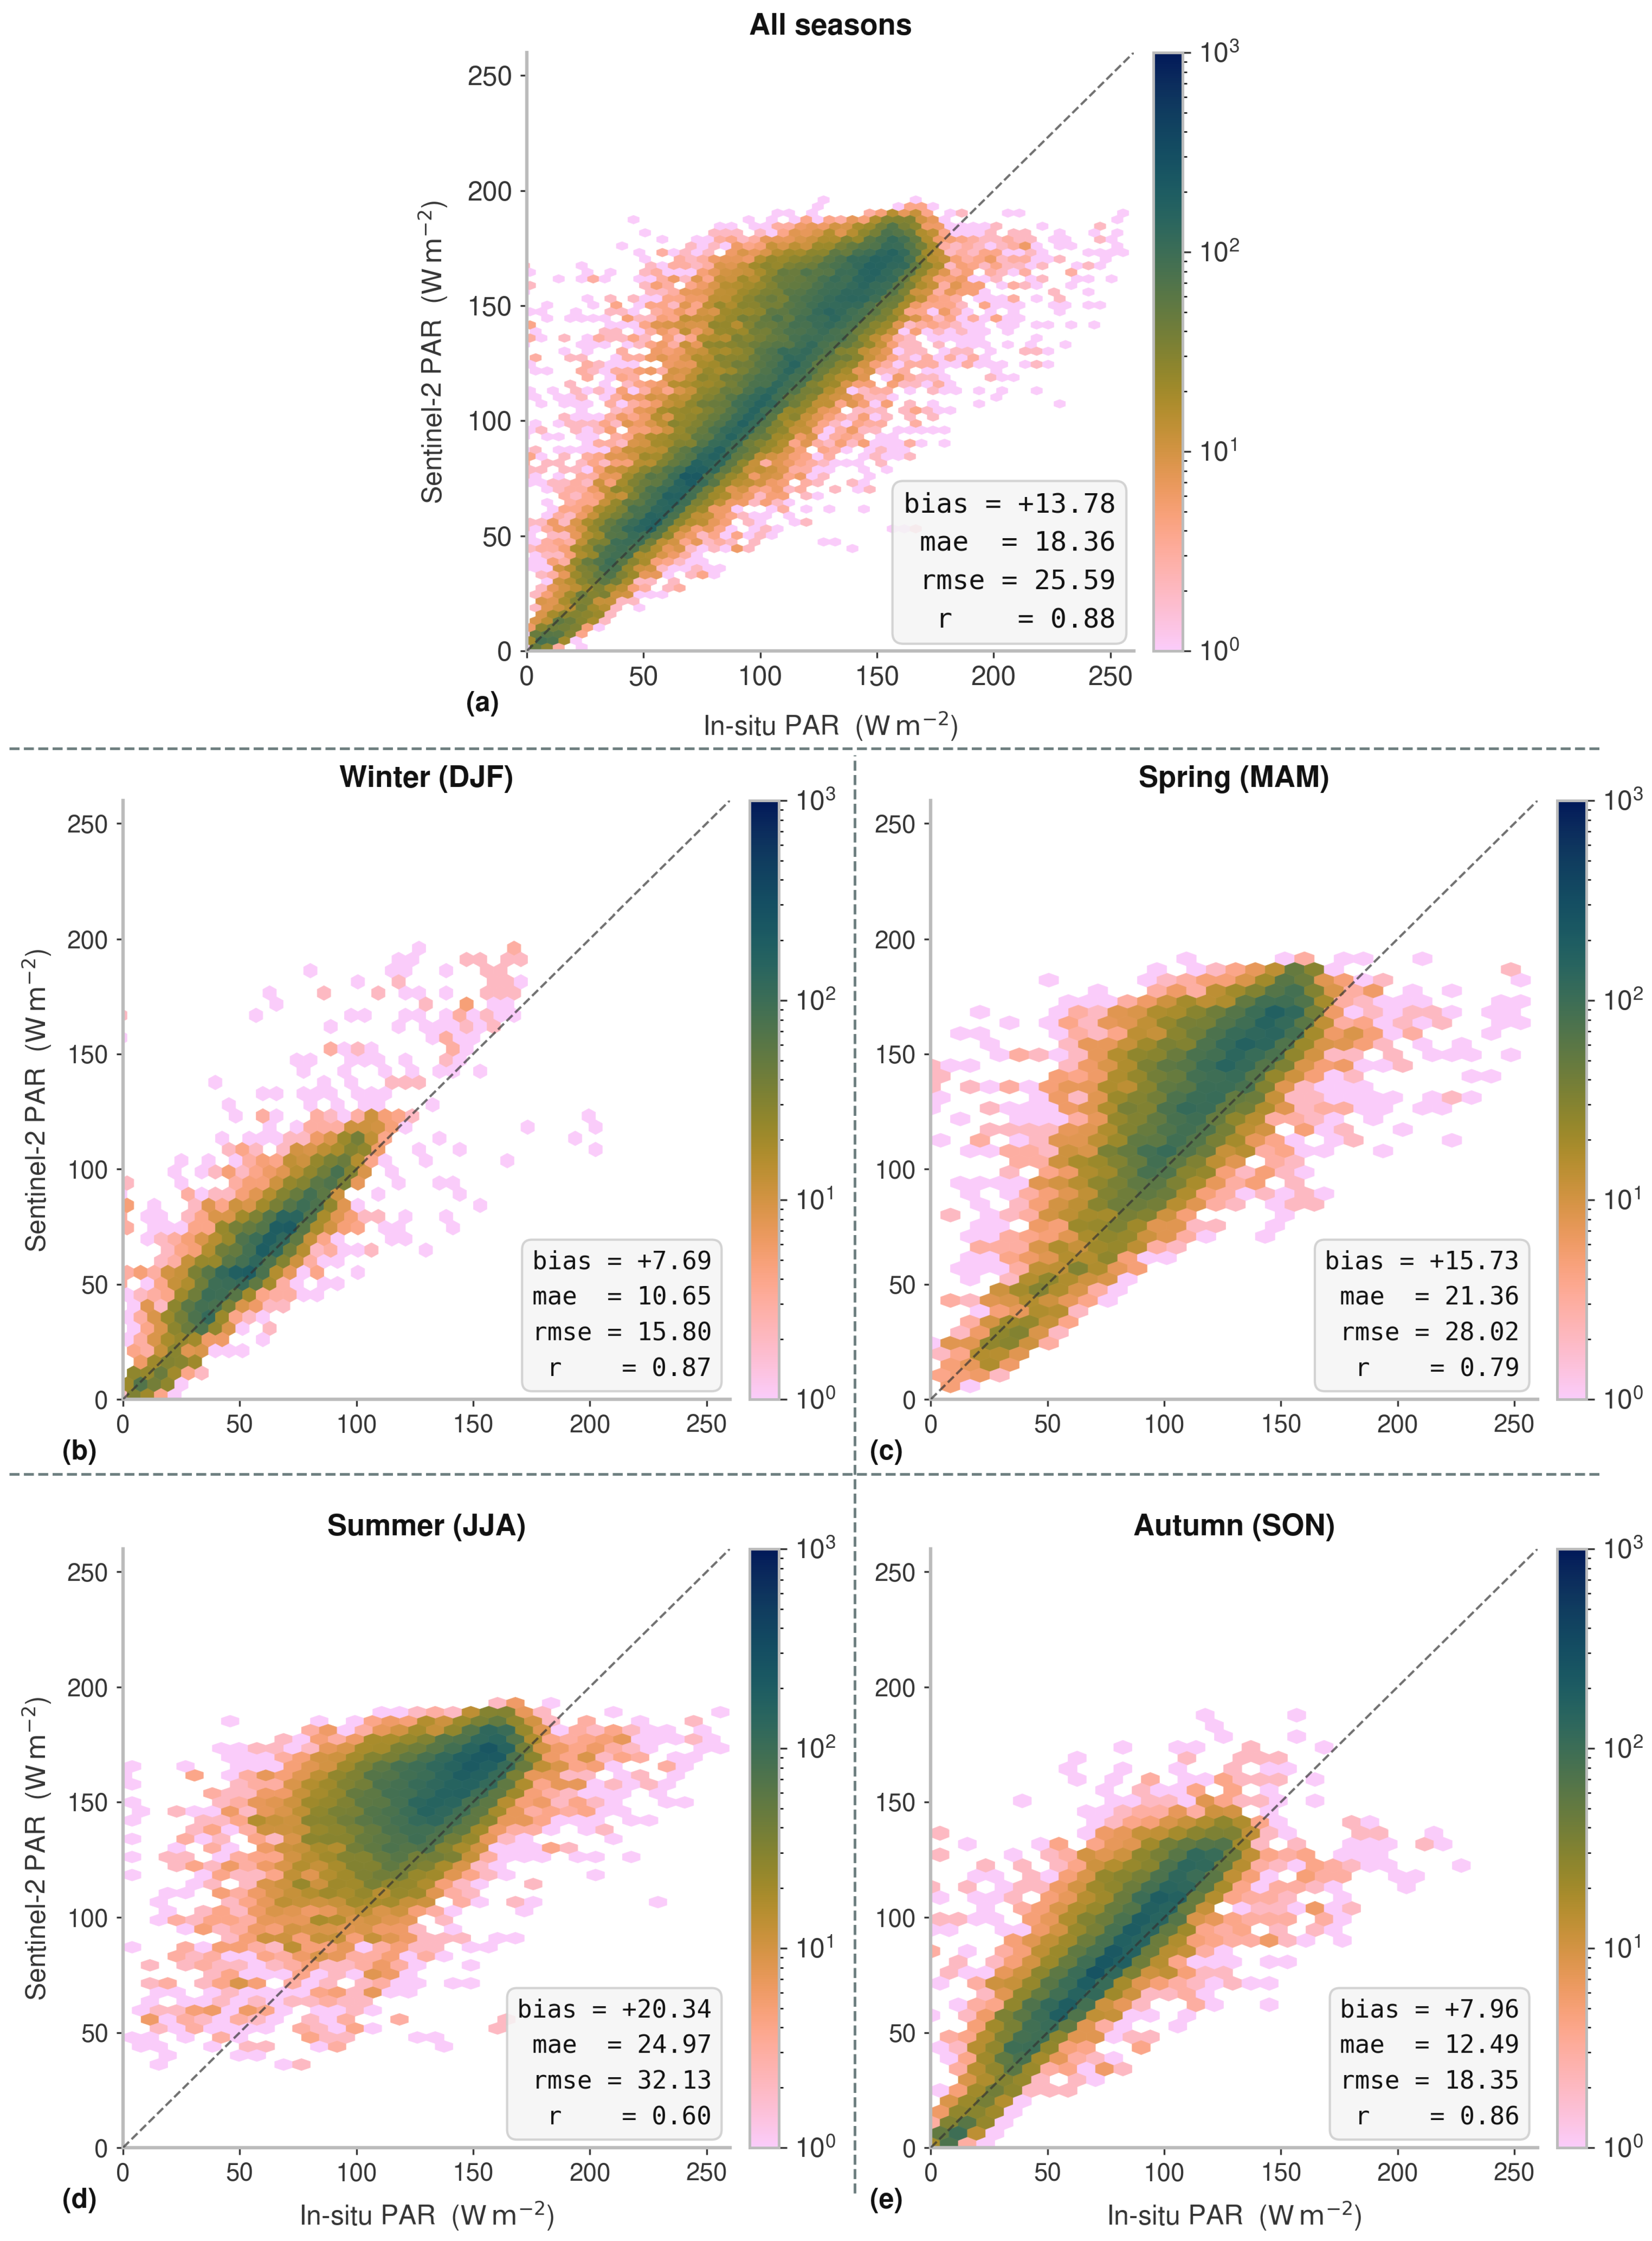
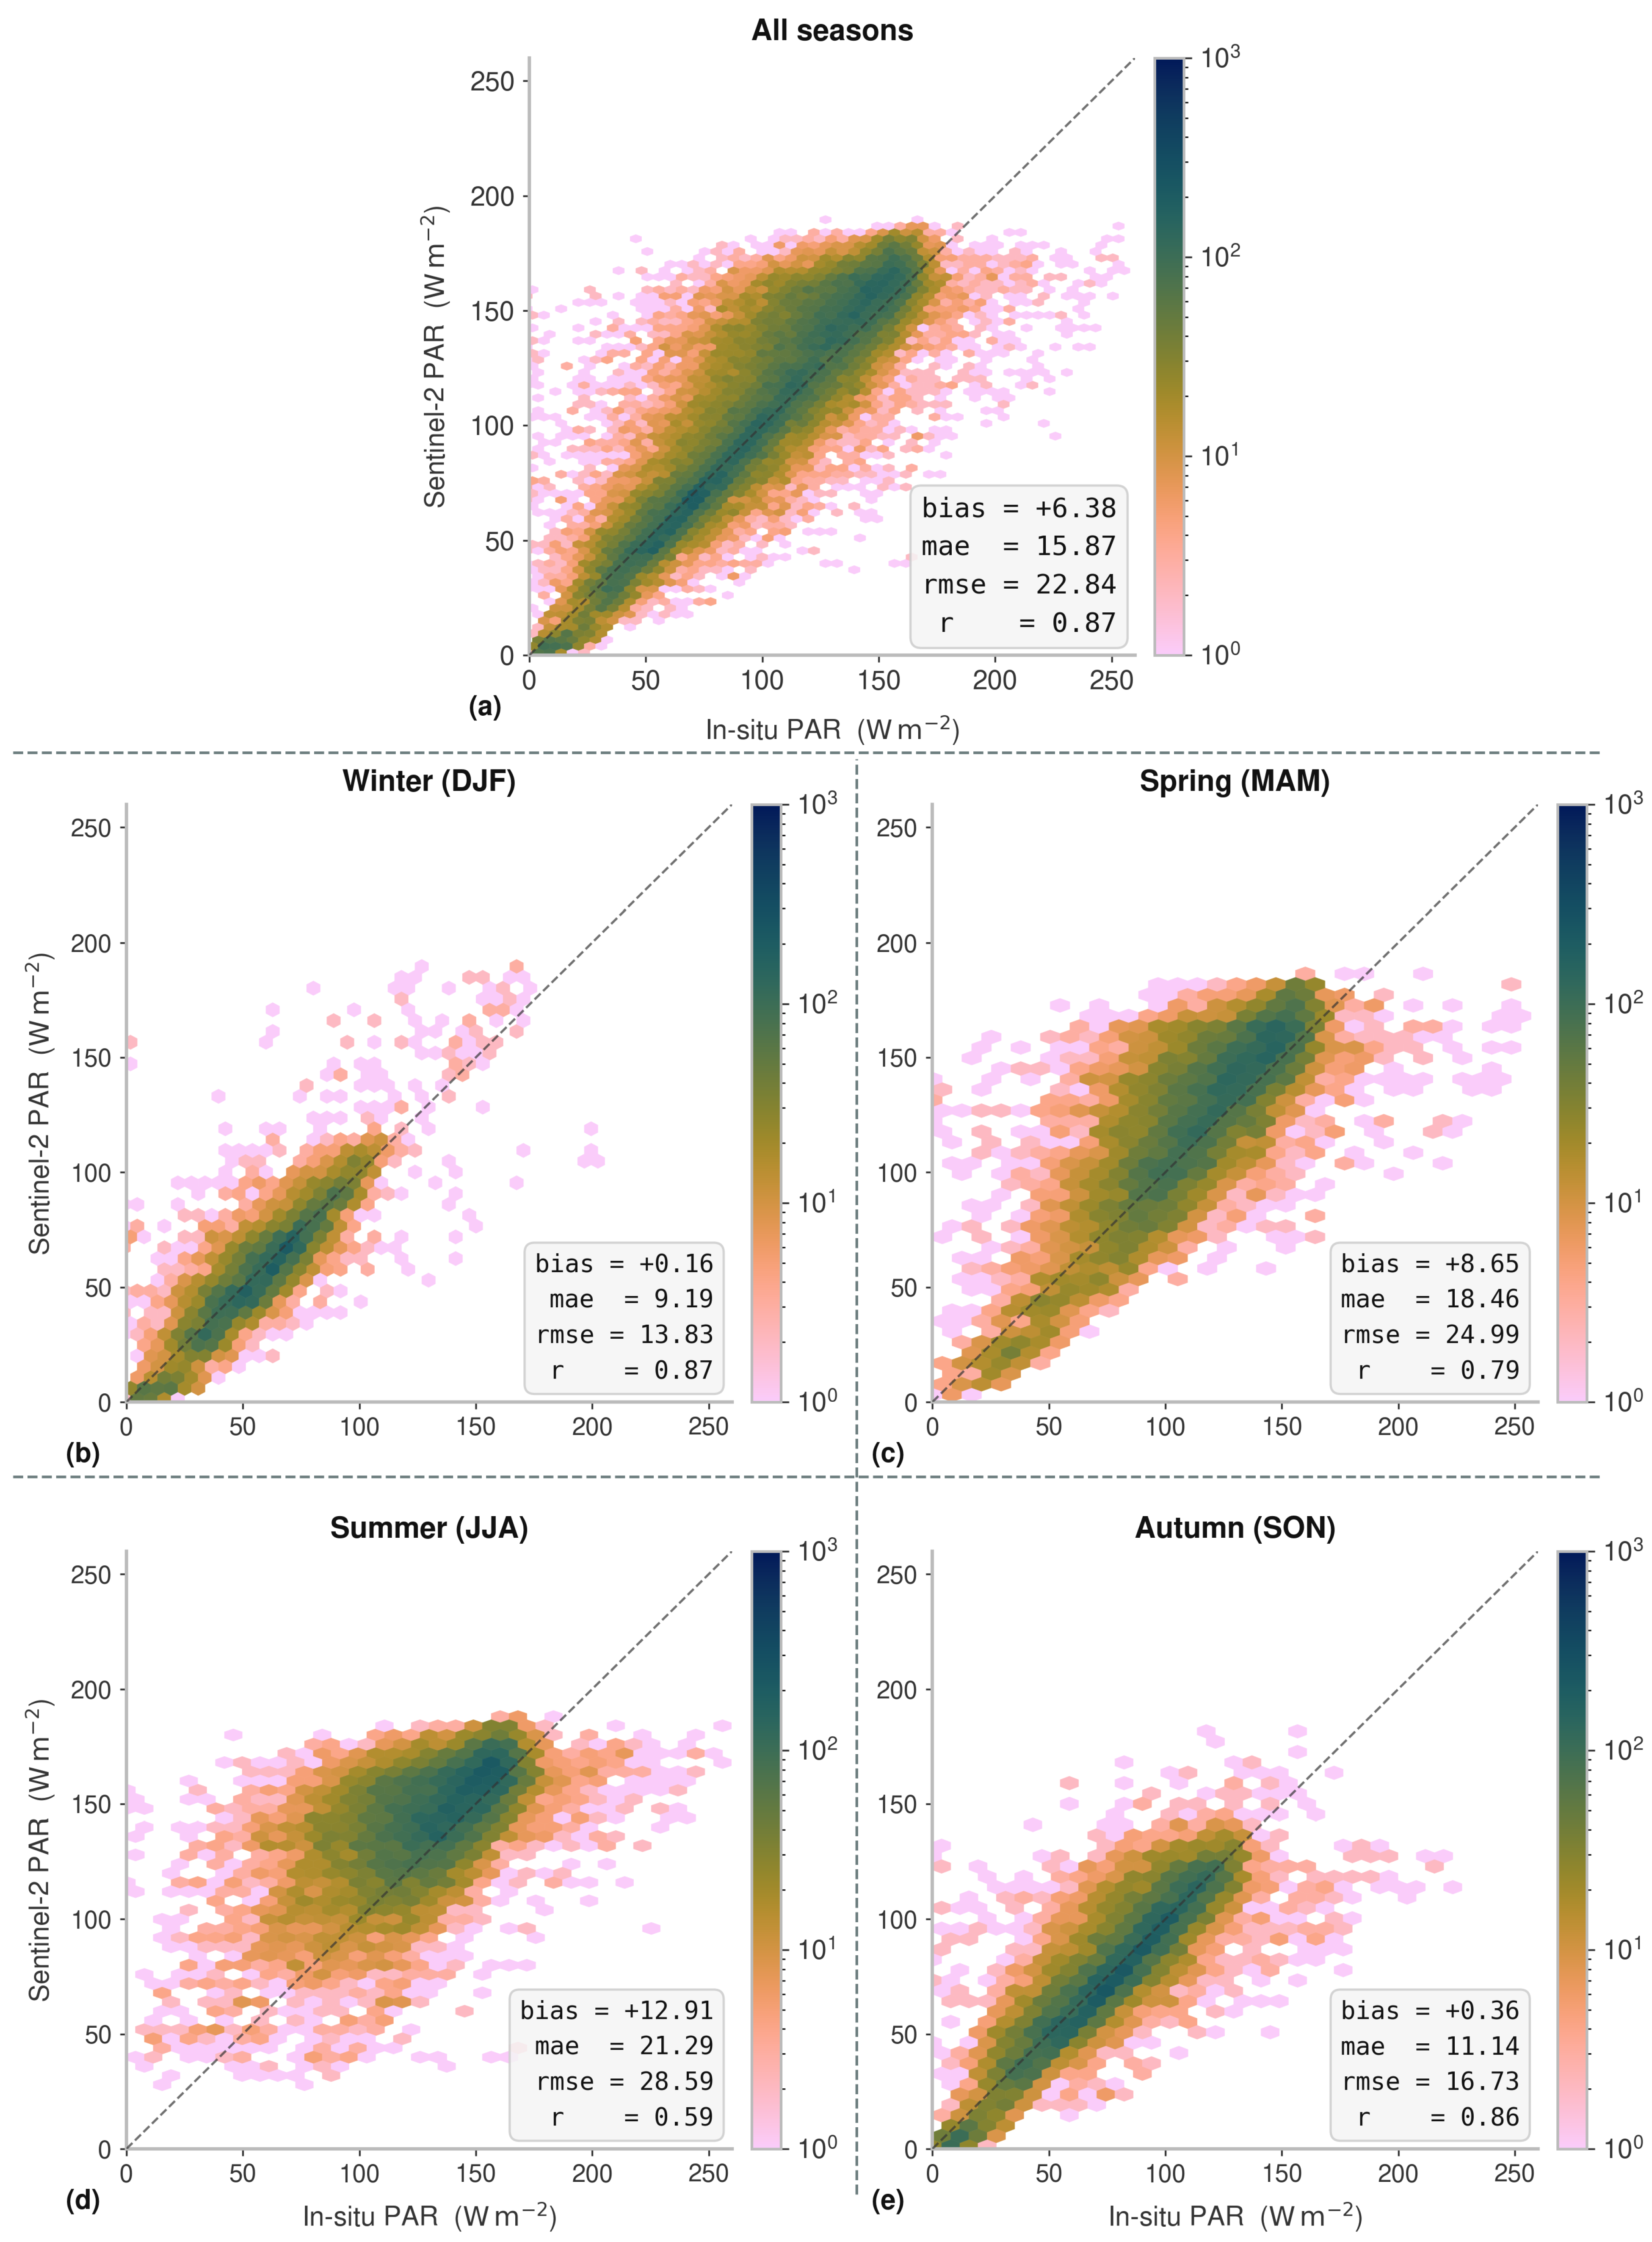
Introducing atmospheric attenuation under a constant-air-mass assumption substantially improved the PAR estimates relative to the purely geometric TOA formulation, yielding a clear-sky surface PAR product that more closely matched AmeriFlux observations (Figure 4). In this baseline experiment, constant-air-mass means that a single pressure-corrected optical air-mass value was calculated for each site and date from the solar zenith angle at solar noon and then applied to all atmospheric transmittance terms for the daily PAR estimate. This noon-based value was used as a simple baseline proxy for daytime atmospheric path length, rather than as a complete representation of diurnal variation in solar geometry. By accounting for radiative losses associated with Rayleigh scattering, aerosols, and water vapor, the systematic overestimation was strongly reduced. Overall, the clear-sky surface formulation showed a bias of +13.78 W m−2, an RMSE of 25.59 W m−2, and a correlation of r = 0.88 .
Compared with the TOA case, the scattering of estimations shifted much closer to the one-to-one line, confirming that atmospheric attenuation accounts for a substantial share of the gap between extraterrestrial and surface PAR. However, the remaining positive bias indicates that the clear-sky formulation still tended to overestimate PAR, particularly under conditions where a constant air-mass approximation is too restrictive.
Seasonally, the best agreement was obtained in winter, with a bias of +7.69 W m−2, an RMSE of 15.80 W m−2, and r = 0.87 . Spring and autumn remained reasonably consistent, with biases of +15.73 W m−2 and +7.96 W m−2, respectively, whereas summer, again, showed the largest difference from tower observations, with a bias of +20.34 W m−2 and a reduced correlation of r = 0.60 . Thus, although atmospheric attenuation substantially improved the surface PAR estimates, the constant-air-mass clear-sky formulation remained less reliable during high-radiation periods.

3.1.3. Clear-Sky Surface PAR with Varying Air Mass

Allowing optical air mass to vary with solar zenith angle further improved the clear-sky surface PAR estimates compared with the constant-air-mass formulation (Figure 5). This step reduced the overall positive bias from +13.78 W m−2 to +6.38 W m−2, while also lowering the RMSE to 22.84 W m−2. The overall correlation remained similar ( r = 0.87 ), which indicates that the main benefit of the varying-air-mass formulation was a better representation of PAR magnitude rather than a major change in temporal agreement. The improvement was strongest in winter and autumn, where the remaining biases were close to zero (+0.16 W m−2 and +0.36 W m−2, respectively). These seasons also showed relatively low errors, with RMSE values of 13.83 W m−2 in winter and 16.73 W m−2 in autumn. In spring, the formulation still showed a moderate positive bias of +8.65 W m−2, while summer remained the most challenging season, with the largest bias (+12.91 W m−2), highest RMSE (28.59 W m−2), and lowest correlation ( r = 0.59 ).
The varying-air-mass formulation provides a more realistic clear-sky surface PAR estimate by accounting for changes in atmospheric optical path length during the day. However, the remaining positive bias, particularly in spring and summer, indicates that clear-sky atmospheric attenuation alone is not sufficient to represent actual surface PAR under real conditions. Therefore, this limitation motivates the so-called all-sky formulation, where cloud attenuation is explicitly included.

3.1.4. All-Sky Surface PAR with Cloud Attenuation

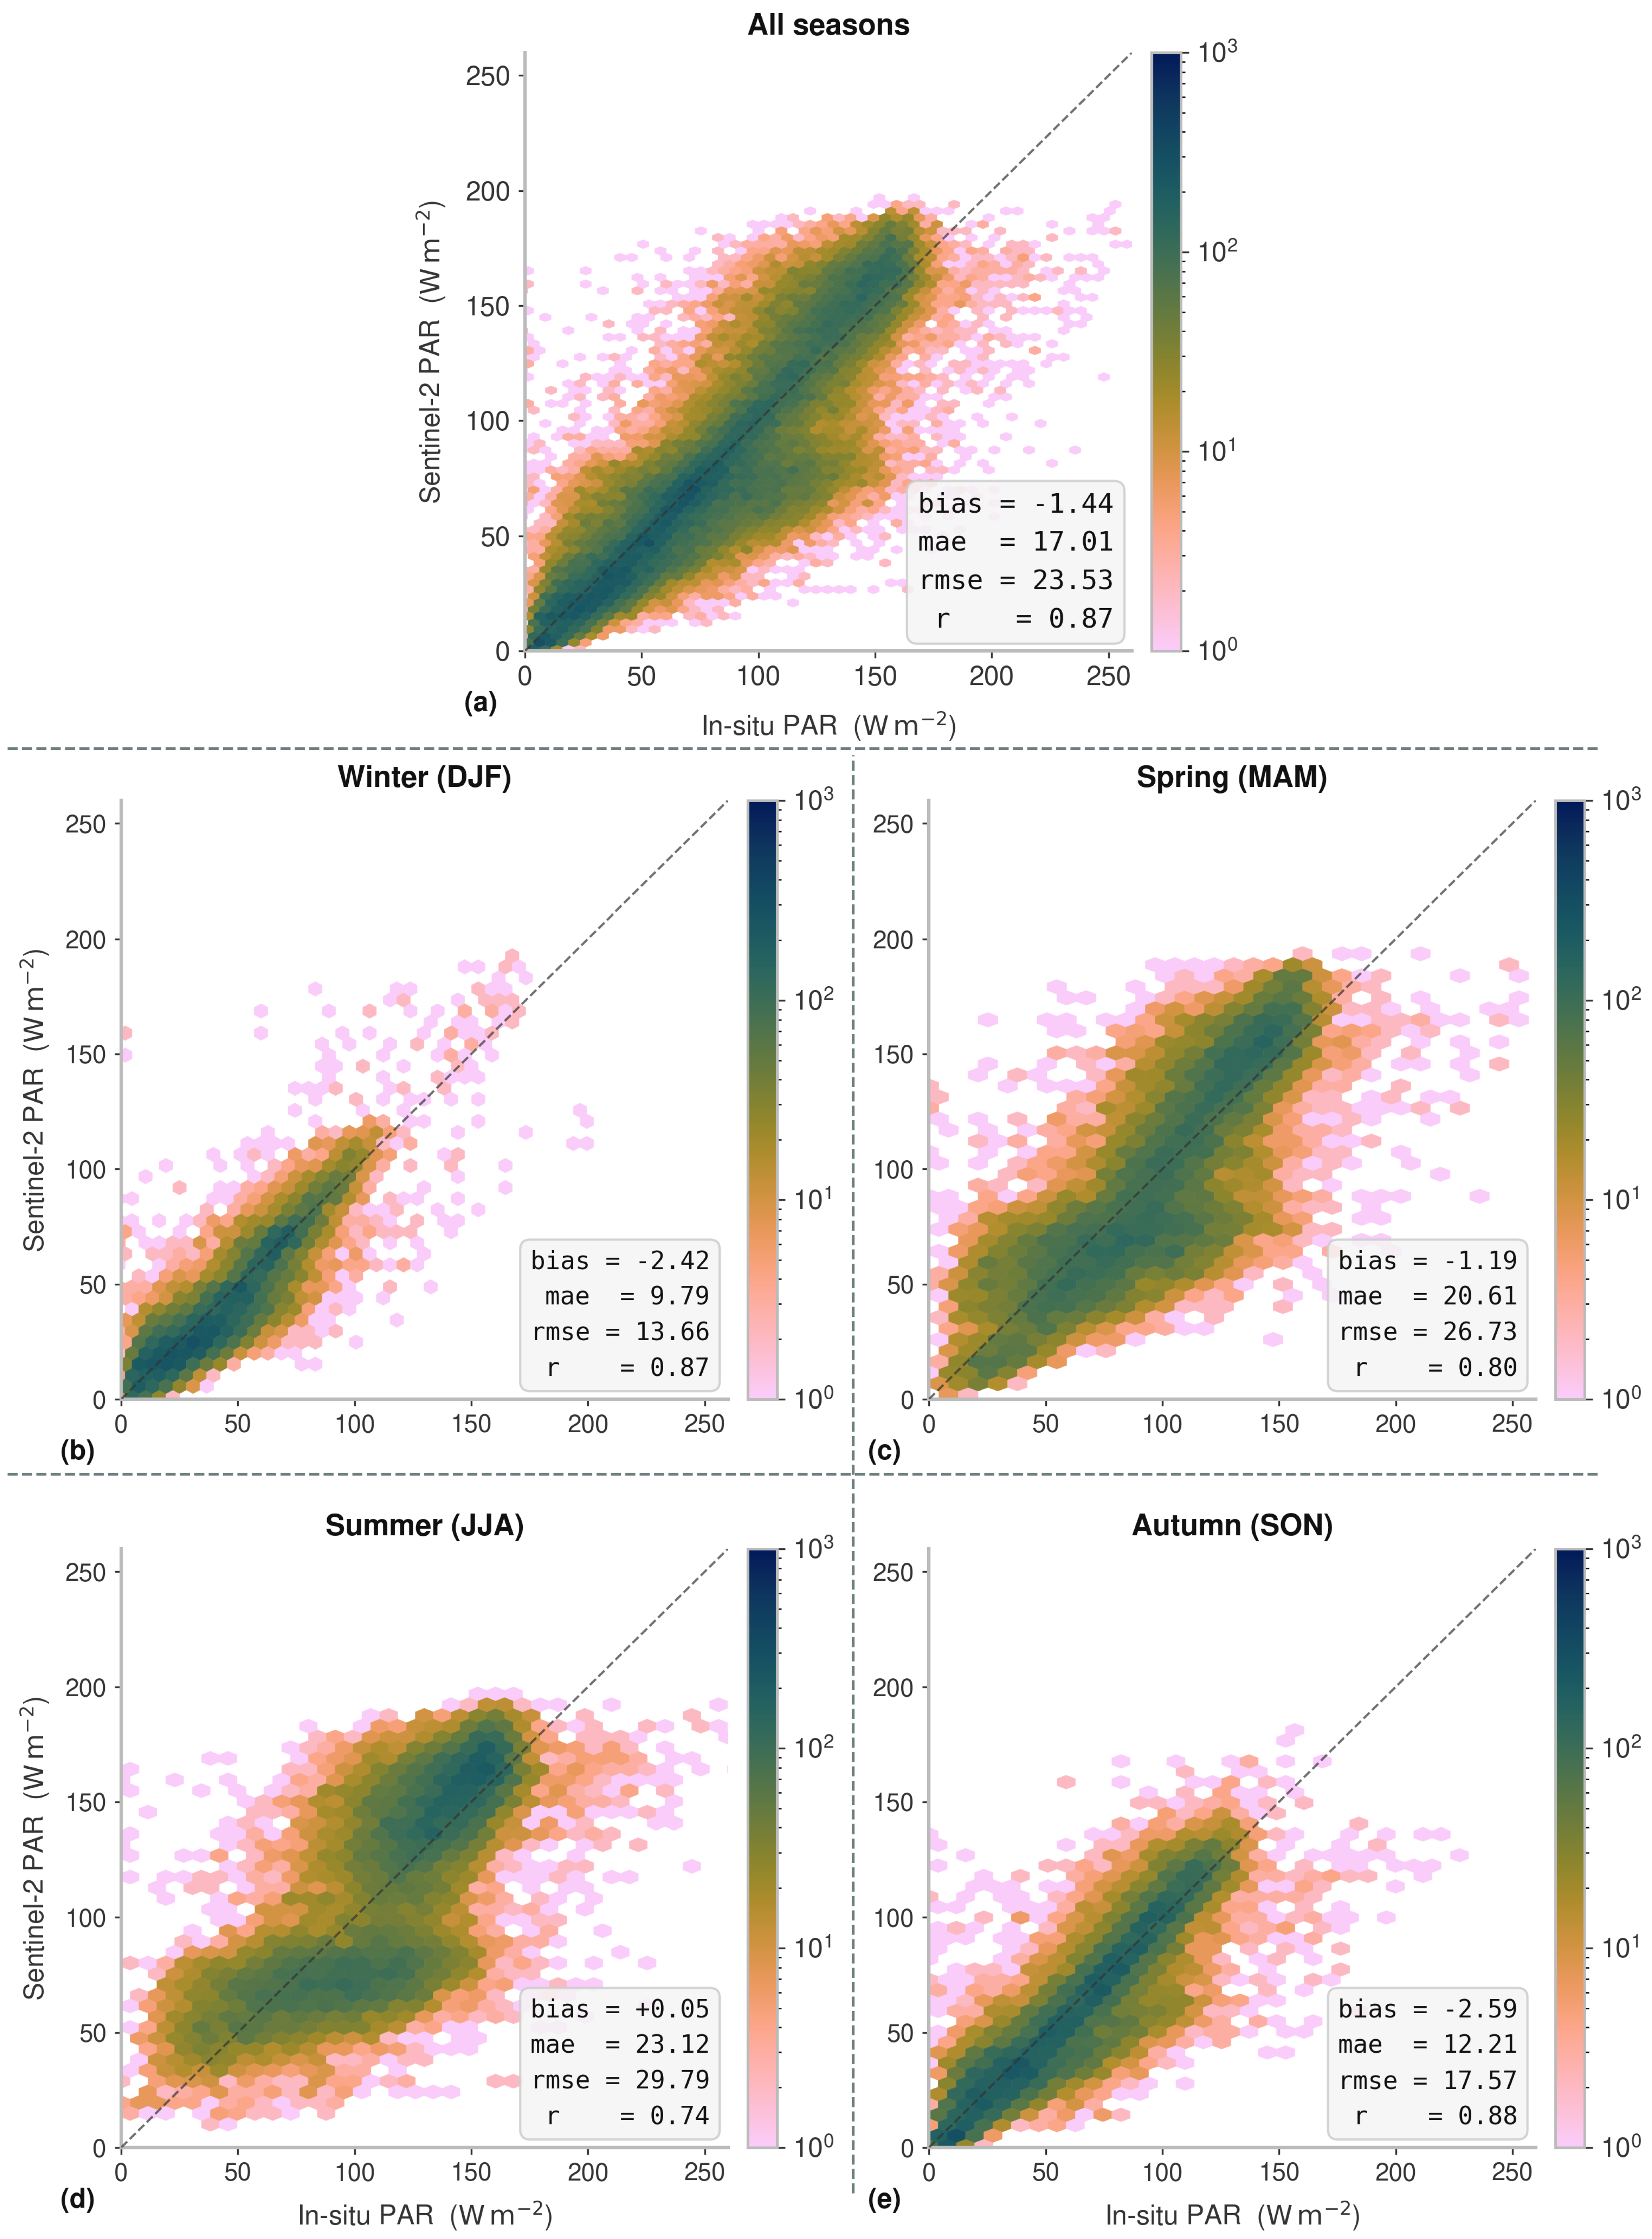
Introducing cloud attenuation substantially reduced the systematic bias in the Sentinel-2 PAR estimates (Figure 6). Across all seasons, the all-sky formulation produced a near-zero mean bias of −1.44 W m−2, compared with the positive bias observed for the clear-sky formulation. The overall correlation remained high ( r = 0.87 ), while the RMSE was 23.53 W m−2.
The seasonal results show that the effect of cloud attenuation was most important in spring and summer. In spring, the bias was reduced to −1.19 W m−2, while in summer it decreased to +0.05 W m−2. These values show that the all-sky correction effectively removed much of the seasonal overestimation associated with the clear-sky formulation. However, the error spread remained relatively large in both seasons, with RMSE values of 26.73 W m−2 in spring and 29.79 W m−2 in summer. This suggests that the cloud attenuation term improved the mean behavior of the retrieval, but did not fully resolve day-to-day variability in cloud conditions. This difference between bias and RMSE indicates that the cloud correction primarily reduced the systematic component of the error, rather than the random or event-specific component. The empirical cloud-transmission factor shifts the Sentinel-2 estimates closer to the tower observations by attenuating clear-sky overestimation, but it cannot fully capture the timing, thickness, persistence, or sub-daily evolution of cloud cover. As a result, some individual days may remain under-corrected or over-corrected, especially when the Sentinel-2 overpass cloud probability is not representative of the daily cloud conditions. Since RMSE is more sensitive to these day-specific deviations and large residuals, it does not necessarily improve, even when the mean bias is reduced.
Winter and autumn showed the strongest agreement with the tower observations. The winter estimates had a bias of −2.42 W m−2, an RMSE of 13.66 W m−2, and a correlation of r = 0.87 . Autumn showed similar behavior, with a bias of −2.59 W m−2, an RMSE of 17.57 W m−2, and a correlation of r = 0.88 . The smaller errors in winter and autumn likely reflect, at least in part, the lower absolute PAR range during these seasons. However, this should not be interpreted as evidence that cloud-related uncertainty is necessarily weaker in winter, since cloud effects depend on local cloud regime and atmospheric conditions.
Overall, the all-sky formulation provided a more balanced representation of surface PAR than the clear-sky formulation. The main improvement was the reduction of systematic overestimation, particularly during spring and summer, when ignoring cloud attenuation led to larger positive biases. At the same time, the remaining scatter indicates that a single Sentinel-2 observation and its associated cloud probability cannot fully represent the complete daily evolution of cloud cover. Therefore, the all-sky product should be interpreted as a high-resolution approximation of daily surface PAR that improves the clear-sky estimate, while still retaining uncertainty under variable cloud conditions.

3.2. Comparison with Existing PAR Products

3.2.1. Benchmarking Against MODIS, VIIRS, and CERES

Table 1 summarizes the agreement between the evaluated satellite-derived PAR products and the flux tower observations for all records combined and for each season. We also report the number of matched daily observations (counts) and 95% confidence intervals for bias, RMSE, MAE, and correlation coefficient r, estimated using site-level bootstrap resampling. The seasonal validation statistics are strongly dominated by Northern Hemisphere observations because only 5 of the 172 retained AmeriFlux stations are located in the Southern Hemisphere. This imbalance affects the interpretation of all seasonal statistics, which mainly reflect Northern Hemisphere seasonality. It is especially visible in DJF, where 14,671 matched observations are from Northern Hemisphere sites, whereas only 192 are from Southern Hemisphere sites. Therefore, the DJF panels are dominated by Northern Hemisphere winter conditions, which explains the limited number of high-PAR observations despite the inclusion of a small number of Southern Hemisphere sites. Seasonal matched-observation counts by hemisphere are reported in Table A2.
Overall, the Sentinel-2 all-sky PAR formulation substantially reduced systematic overestimation relative to the clear-sky formulation. Across all seasons, the mean bias decreased from 6.38 W m−2 for the clear-sky product to −1.44 W m−2 for the all-sky product. However, RMSE increased slightly from 22.84 W m−2 to 23.53 W m−2, MAE increased from 15.87 W m−2 to 17.01 W m−2, and correlation remained unchanged ( r = 0.87 ). Therefore, the cloud correction primarily improved agreement in mean PAR by substantially reducing systematic bias, while the remaining performance metrics were broadly comparable.
Among the satellite PAR products, MODIS all-sky PAR showed strong overall agreement with the flux tower measurements. It had lower RMSE and MAE than both Sentinel-2 products and also achieved a higher correlation (r = 0.93). This is not surprising, since MODIS PAR is already designed as a physically based all-sky product and includes sub-daily information. Even so, the Sentinel-2 all-sky estimates performed reasonably well, especially considering that Sentinel-2 provides much finer spatial detail than MODIS.
The comparison with CERES further placed the Sentinel-2 and MODIS results into context. The CERES surface all-sky PAR at the daily scale showed the strongest agreement with the tower observations, with the lowest overall error compared to the Sentinel-2, VIIRS and MODIS products. In contrast, CERES surface clear-sky PAR and CERES TOA all-sky PAR showed much larger positive biases across all seasons. This was expected, as these quantities are not directly comparable to in situ surface all-sky PAR measurements: clear-sky PAR represents potential radiation in the absence of clouds, whereas TOA PAR does not account for atmospheric attenuation at the surface.
Seasonal statistics revealed clear differences in product performance. The benefit of the Sentinel-2 all-sky correction was most evident in spring and summer, when the clear-sky formulation showed substantially larger positive bias. In winter and autumn, the differences between the two Sentinel-2 products were smaller. The lowest correlations for Sentinel-2 were found in summer, likely reflecting stronger day-to-day cloud variability and the difficulty of representing daily integrated PAR from satellite observations that do not fully resolve the diurnal cycle. The MODIS all-sky PAR remained more stable throughout the seasons, with consistently lower bias and error metrics than the Sentinel-2 products.
Overall, these results show that incorporating cloud attenuation provides a more balanced representation of surface PAR, with Sentinel-2 all-sky formulation substantially reducing systematic overestimation relative to the Sentinel-2 clear-sky formulation, particularly in spring and summer. Although the daily MODIS and CERES surface all-sky products achieved lower overall errors, the Sentinel-2 all-sky estimates provide substantially finer spatial detail and allow PAR to be derived directly from Sentinel-2 observations.

3.2.2. Comparison of Sentinel-Based PAR Estimate with Global Products

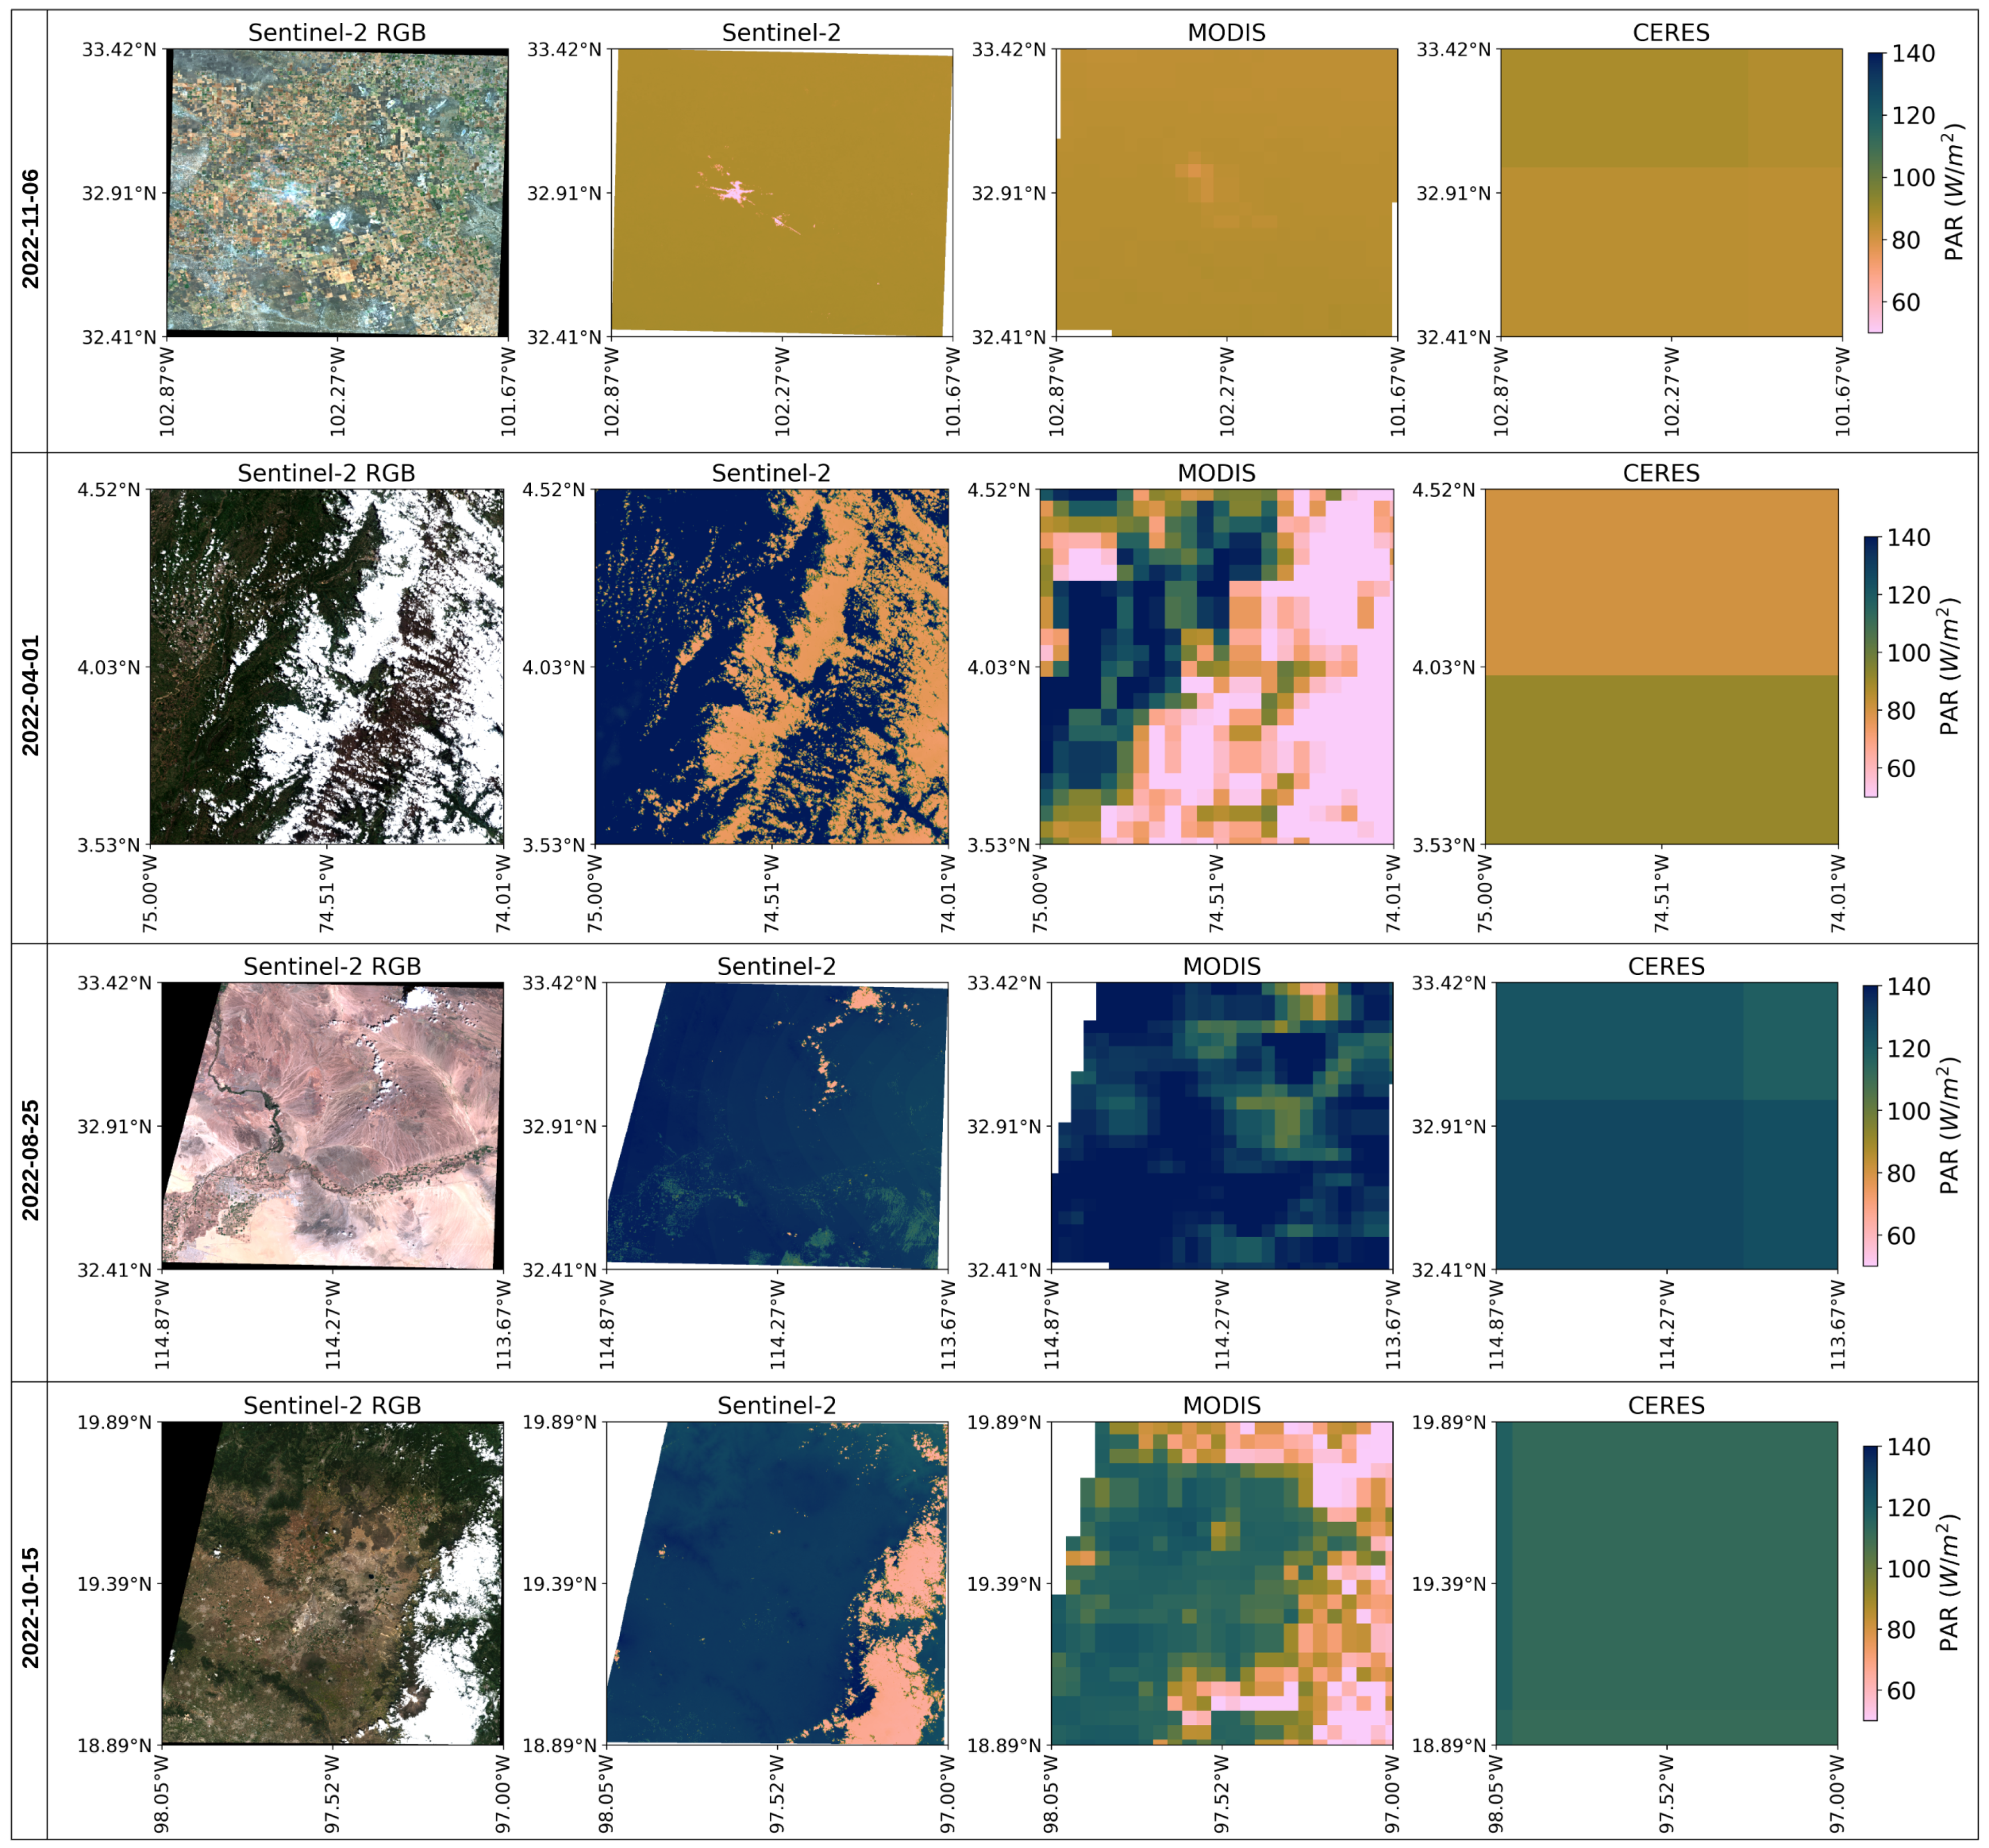
Figure 7 compares the spatial patterns of the Sentinel-2 all-sky PAR estimates with MODIS and CERES for representative scenes from each season. The comparison with CERES all-sky PAR should be interpreted mainly as a coarse-scale magnitude evaluation rather than a pixel-level spatial comparison. CERES shows broad, coarser resolution patterns, and therefore cannot capture the fine scale cloud variability observed by Sentinel-2. In this case, MODIS provides a more useful intermediate comparison, as it retains some sub-regional variability while still being much coarser than Sentinel-2. The Sentinel-2 product generally follows the broad MODIS patterns in cloud-affected regions, but with sharper spatial transitions and more local detail.
In general, the Sentinel-2 product shows substantially finer spatial detail than both reference products, as expected from its higher spatial resolution. The comparison also shows that the cloud adjustment introduces spatially coherent reductions in PAR, particularly in areas where cloud features are visible in the Sentinel-2 RGB images. This pattern is most evident in spring and autumn, where lower PAR values in the Sentinel-2 product broadly coincide with cloud-affected regions and are also reflected, although more coarsely, in the MODIS PAR fields.
Seasonal differences are also visible. Winter shows relatively limited spatial contrast compared with the other seasons, while spring and autumn show stronger cloud-related spatial variability. Summer presents a different case, with large areas close to clear-sky conditions and comparatively high PAR values. In this situation, the Sentinel-2 product appears more strongly influenced by the clear-sky component of the algorithm, and the comparison suggests that remaining differences with MODIS and CERES may be larger where cloud attenuation is limited.

4. Discussion

In this study, we evaluated two Sentinel-2 PAR formulations: a clear-sky version and an all-sky version that includes a cloud adjustment. The contrast between the Sentinel-2 clear-sky and all-sky products is one of the most informative parts of the analysis. The clear-sky formulation represents daily mean PAR estimate under cloud-free conditions, based on solar geometry and atmospheric transmittance terms. In that sense, it is not wrong. However, it is not directly comparable to actual tower PAR under real daily conditions, because cloud attenuation is a major control on the amount of radiation that reaches the surface. This explains why the clear-sky version consistently shows positive bias, especially in brighter seasons.
The all-sky formulation improves this by introducing an empirical cloud-transmission term based on cloud probability. The clearest gain is the reduction in systematic overestimation. When cloud effects are ignored, the Sentinel-2 clear-sky product tends to produce PAR values that are too high relative to the flux tower observations. After the cloud-adjustment step is applied, this bias is reduced substantially, while the overall temporal agreement remains similar. This step is necessary if Sentinel-2 is to be used as a practical PAR product rather than only as a clear-sky benchmark. The strongest benefit appears in spring and summer, when the difference between clear-sky and all-sky estimates becomes much larger. This seasonal behavior is physically sensible, since cloud effects during high-radiation periods can lead to large differences in incoming radiation. In contrast, the smaller differences in winter and autumn suggest that, under lower-radiation conditions, the impact of the cloud correction is still present, but less dominant.
The stepwise formulation also helps to clarify the relative role of the main radiative controls in the framework. Solar geometry determines the seasonal and latitudinal structure of available extraterrestrial radiation, while atmospheric attenuation controls the reduction from TOA irradiance to surface clear-sky PAR. This is evident from the results in Section 3.1: moving from TOA PAR to the clear-sky formulation produced the largest reduction in systematic bias, indicating the importance of accounting for Rayleigh scattering, aerosol loading, water vapor absorption, pressure effects, and optical air mass. The subsequent all-sky correction further reduced the remaining mean bias, but did not substantially reduce RMSE, suggesting that much of the residual day-to-day error is associated with cloud variability that cannot be fully represented by a single Sentinel-2 morning overpass. Surface albedo feedbacks were not explicitly modeled in the present downward-PAR formulation, except indirectly through the comparison with tower observations. Their influence is expected to be secondary for most vegetated surfaces relative to solar geometry, atmospheric attenuation, and cloud variability, but may become more important over high-albedo surfaces such as snow. Solar-cycle variability was also not explicitly modeled; however, its effect is expected to be small at the daily-to-seasonal scale considered here because total solar irradiance varies by only about 0.1% over the 11-year solar cycle [21].
Daily MODIS, VIIRS and CERES surface all-sky PAR products perform better overall against the tower observations (see Table 1). In fact, this is not unexpected considering that these products were designed specifically for surface radiation applications and benefit from more direct treatment of all-sky radiative conditions at coarse spatial resolution. Nevertheless, the Sentinel-2 all-sky estimates provide finer spatial detail and allow PAR to be derived directly from the Sentinel-2 observation framework itself. This may be useful for analyses that require radiative inputs to be spatially consistent with Sentinel-2-derived vegetation and surface variables.
Although the Sentinel-2 estimates are generally within the seasonal range in comparison with other PAR estimates, clear differences remain still. In areas that appear close to clear-sky conditions, Sentinel-2 often produces relatively high PAR values (see Figure 7). This suggests that some residual overestimation may remain when the cloud-transmittance correction is relatively less effective. This behavior is consistent with the structure of the algorithm, since low cloud probability leaves the estimated PAR largely controlled by the clear-sky radiation component. In contrast, where stronger cloud attenuation is present, the Sentinel-2 spatial patterns become more comparable to the MODIS patterns, although Sentinel-2 preserves finer local variability.

4.1. Limitations of the Method

An important limitation of the Sentinel-2 approach is that the sensor observes the surface only at one moment in the morning. This means that the cloud adjustment used here is based on atmospheric conditions near overpass time rather than on the full evolution of cloud cover throughout the day. That limitation is especially relevant because the target variable in this study is daily, not instantaneous PAR. A morning cloud scene does not necessarily represent afternoon conditions, and in many environments the cloud field can change substantially over the course of the day. Accordingly, the present cloud correction should be interpreted as an overpass-time proxy for daily cloud attenuation rather than as a reconstruction of the complete daily cloud cycle.
The cloud-transmission term is conceptually related to clear-sky index approaches [34], but here it remains an empirical parameterization based on Sentinel-2 cloud probability. It performs well in the current comparison, but it is not derived from a direct physical relationship between cloud probability and cloud optical transmittance. This means that its transferability outside the calibration domain remains uncertain. The sensitivity analysis further showed that the all-sky estimates were more sensitive to the cloud-transmittance parameter than to the exact cloud-probability threshold, supporting the interpretation of the 20% threshold as a pragmatic low-confidence cloud filter rather than a calibrated optimum (Appendix A). While AmeriFlux provides a strong testbed because of its broad latitudinal coverage, the transferability of the parameterization across all global biomes and climate regimes may still require further refinement to achieve higher accuracy at the global scale.
Furthermore, the atmospheric transmittance is still approximated rather than fully integrated over the entire daylight period. Although increasing the number of sampled hour angles improves the representation of daytime variation, the method still relies on a simplified daily treatment of the atmosphere. In particular, AOD and TCWV are derived from the conditions observed in instantaneous Sentinel-2 overpass and are assumed to represent the complete daytime atmospheric state. This introduces an additional first-order approximation as the sub-daily variability in aerosols, water vapor, and cloud-related atmospheric attenuation is not explicitly resolved. This is different from a full sub-daily radiative framework and likely contributes to residual errors.
Part of the residual overestimation under near clear-sky conditions may also be related to the fixed shortwave-to-PAR conversion factor used in the formulation. The fraction of broadband shortwave radiation represented by PAR is not constant, but varies with solar geometry, atmospheric composition, aerosol loading, water vapor, cloudiness, season, and sky conditions. Therefore, adopting a fixed value of 0.48 may lead to overestimation where the actual PAR fraction is lower than the assumed broadband conversion factor, or underestimation where the actual fraction is higher. Importantly, this bias is unlikely to be uniform across seasons, biomes, or climatic regions because the spectral partitioning of shortwave radiation depends on local and seasonal atmospheric conditions [29]. Since low cloud probability leaves the estimate largely controlled by the clear-sky component, this source of uncertainty is expected to be most evident under clear or weakly attenuated conditions. Because the PAR estimate scales linearly with the assumed shortwave-to-PAR conversion factor, uncertainty in this factor propagates directly into the PAR estimate. For instance, if the actual PAR fraction varies between 0.45 and 0.50, using a fixed value of 0.48 would imply an approximate relative error of +6.7% when the true fraction is 0.45 and −4.0% when the true fraction is 0.50. For daily mean PAR values of 100–200 W m−2, this corresponds to an approximate uncertainty of 4–13 W m−2. This limitation reinforces that the fixed 0.48 factor should be interpreted as a practical first-order approximation rather than a dynamic spectral representation of the 400–700 nm radiation fraction.
The spatial applicability of the framework also requires further consideration. The solar-geometry calculations and clear-sky atmospheric-transmittance terms are general and can be applied wherever Sentinel-2 Level-2A observations, aerosol optical thickness, water vapor information, and cloud probability are available. Therefore, the framework is not geographically restricted to the AmeriFlux domain used in this study. However, the validation presented here is limited to stations in North and South America, and the empirical all-sky correction may not perform identically in other regions. In particular, the cloud-probability threshold and cloud-transmittance parameter were used as simple empirical choices to reduce systematic clear-sky overestimation and provide a first-order all-sky approximation, rather than as region-specific calibrated parameters. As a result, the current parameterization may reduce overall bias in the present validation dataset, but it does not guarantee minimum bias or optimal accuracy across all climatic and atmospheric regimes. Regional differences in cloud type, cloud persistence, aerosol loading, water vapor conditions, snow cover, terrain complexity, and seasonal radiation patterns may affect performance.
To further assess whether the validation errors varied across broad ecosystem settings, we summarized the Sentinel-2 PAR validation statistics by IGBP biome class in Appendix C, Table A3. Across the major biome groups with stronger sample support, RMSE values were generally within approximately 21–26 W m−2 and correlation coefficients ranged from 0.84 to 0.91. Larger deviations occurred mainly in poorly represented classes, such as evergreen broadleaf forest and snow/ice, which were represented by only one station. These results suggest that the overall validation performance was not driven by a single biome class, although broader validation across more evenly distributed climatic and biome regions remains necessary.

4.2. Future Work

Although the all-sky formulation reduced the systematic overestimation of the clear-sky estimates, it still represents daily cloud attenuation using a single Sentinel-2 observation near the morning overpass. A key direction for future work is therefore to incorporate sub-daily cloud information from geostationary observations. Over the Americas, cloud products from the GOES-R series could be aggregated over the daylight period to derive a temporally representative daily cloud-occurrence or cloud-attenuation index [35]. This temporally resolved constraint could then be combined with Sentinel-2 cloud probability and atmospheric variables, with GOES-R representing the diurnal evolution and persistence of cloud conditions and Sentinel-2 retaining the finer spatial detail. A complementary approach would be to derive a daily clear-sky index from CERES surface PAR, defined as the ratio between all-sky and clear-sky PAR, and use this as a coarse-scale daily attenuation constraint. Both approaches would require cross-sensor spatial and temporal harmonization and the development of a new daily cloud-transmission algorithm; they are therefore considered extensions for future work rather than components of the present framework.
In addition, future work should evaluate the geographic transferability of the empirical cloud-related parameters across broader climatic and atmospheric regimes. Although the solar-geometry and clear-sky atmospheric-transmittance components can be applied wherever Sentinel-2 Level-2A observations are available, the cloud-probability threshold and cloud-transmittance parameter may not perform identically in all regions. A broader, ideally global, validation would help to determine whether these empirical choices remain stable or require regional or climate-specific adjustment.
Another aspect that requires further investigation is the incorporation of terrain effects into Sentinel-2-based all-sky PAR estimation. The fine-scale spatial patterns observed in the Sentinel-2 PAR maps indicate that local landscape structure can influence the derived PAR field, particularly in heterogeneous and topographically complex areas [36,37]. Terrain parameters such as slope, aspect, elevation, illumination geometry, cast shadows, and sky-view conditions can affect the amount of PAR received at the surface, especially where opposing slopes experience contrasting solar exposure. Explicitly accounting for these effects could improve the physical consistency of Sentinel-2 PAR estimates and help to separate atmospheric attenuation from terrain-driven radiation variability [38].
A further priority is to expand the validation framework beyond the proof-of-concept assessment presented here. Although the current analysis provides a broad initial evaluation using AmeriFlux sites, future work should test the framework using independent observational networks and a more balanced geographic distribution of sites before it is developed into a definitive global radiation product. We therefore plan to incorporate networks such as the Integrated Carbon Observation System (ICOS), together with AmeriFlux and other regional flux tower or radiation monitoring datasets, to evaluate the transferability of the parameterization across continents, climate regimes, biomes, and latitude zones. This future validation should be designed around independent site-level testing, with uncertainty estimates and stratified performance summaries across the main environmental gradients controlling PAR, including latitude, season, biome, and atmospheric conditions. Such an assessment would help to determine whether the empirical cloud-transmission parameterization remains stable across regions or requires biome, climate, or latitude-specific refinement.
Finally, we plan to examine the sensitivity of daily PAR estimates to the fixed shortwave-to-PAR conversion ratio and to evaluate dynamic conversion factors. Although a constant ratio provides a practical first-order approximation, the fraction of broadband shortwave radiation represented by PAR can vary spatio-temporally with atmospheric clarity, water vapor, solar geometry, season, and site conditions [30,39]. Therefore, a fixed value may introduce systematic deviations, particularly under weakly attenuated atmospheric conditions where the estimated PAR is mainly controlled by the clear-sky radiation component. Future developments should therefore assess seasonally and regionally stratified PAR conversion factors, including possible biome- or climate-zone-specific parameterizations, rather than relying only on a single globally fixed broadband conversion factor.

5. Conclusions

In this study, we developed a Sentinel-2-based PAR framework with both clear-sky and all-sky formulations to enable daily PAR estimation directly from Sentinel-2 observations. The semi-empirical approach combines Sentinel-2 AOD and TCWV information with solar geometry equations, while the all-sky formulation further incorporates cloud attenuation using Sentinel-2 cloud probability.
Based on the validation against daily PAR observations at AmeriFlux towers, we found that the all-sky formulation reduced the overestimation found in the clear-sky version and provided a more realistic representation of surface PAR under actual atmospheric conditions. Although MODIS, VIIRS, and CERES surface all-sky products achieved lower overall errors, the Sentinel-2 approach offers finer spatial detail and PAR estimates that are spatially aligned with other Sentinel-2-derived variables.
Overall, the present results suggest that Sentinel-2-based all-sky PAR estimation is feasible. The approach does not replace established coarse-resolution radiation products, which achieved lower overall errors, but provides a high-resolution approximation that may be useful when PAR needs to be spatially aligned with Sentinel-2 observations and other Sentinel-2-derived variables. However, the proposed framework should still be interpreted as a high-resolution approximation rather than a full sub-daily radiative-transfer product. Its main limitations are the reliance on a single Sentinel-2 overpass to represent daily atmospheric conditions, the empirical treatment of cloud transmittance, and the simplified representation of sub-daily variability in aerosols, water vapor, and cloud cover. In future work, we will investigate refining the all-sky formulation by improving the daily representation of atmospheric condition and cloud attenuation, incorporating terrain-driven irradiance effects, and evaluating the sensitivity of PAR estimates to the spatio-temporal changes in shortwave-to-PAR conversion factor.

Author Contributions

Conceptualization, M.S.I., L.G.F. and L.P.; methodology, L.G.F. and M.S.I.; software, M.S.I., J.K. and K.Č.; validation, M.S.I. and L.G.F.; formal analysis, M.S.I. and L.G.F.; investigation, M.S.I. and L.G.F.; resources, M.S.I., L.P., L.S., J.K., K.Č. and L.G.F.; data curation, M.S.I.; writing—original draft preparation, M.S.I.; writing—review and editing, M.S.I., L.P., L.S., J.K., K.Č. and L.G.F.; visualization, M.S.I.; supervision, L.G.F.; project administration, L.S.; funding acquisition, L.S. All authors have read and agreed to the published version of the manuscript.

Funding

This project received funding from the Global Methane Hub through the Time2Graze project. The Open-Earth-Monitor Cyberinfrastructure project has received funding from the European Union’s Horizon Europe research and innovation programme under grant agreement No. 101059548.

Data Availability Statement

The AmeriFlux datasets used in this study are publicly available through the AmeriFlux data portal at https://ameriflux.lbl.gov/sites/site-search/?availability (accessed on 15 May 2026). Sentinel-2 Level-2A surface reflectance imagery is available through the Google Earth Engine data catalog under the collection ID COPERNICUS/S2_SR_HARMONIZED.

Acknowledgments

The authors acknowledge the AmeriFlux network, site principal investigators, and data contributors for providing the data used in this study. The Google Earth Engine code for estimating clear-sky and all-sky PAR from a single Sentinel-2 L2 image is available at https://code.earthengine.google.com/fc57410253d0dbf859643ca5461981ee (accessed on 15 May 2026). The authors also acknowledge the use of ChatGPT-5.4, a generative AI language model developed by OpenAI, to help improve the clarity and readability of the manuscript.

Conflicts of Interest

Authors Josip Krizan and Karla Čmelar were employed by the company MultiOne Ltd. The remaining authors declare that the research was conducted in the absence of any commercial or financial relationships that could be construed as a potential conflict of interest.

Abbreviations

The following abbreviations are used in this manuscript:
AODAerosol optical depth
AUAstronomical unit
BOABottom-of-atmosphere
DJFDecember–January–February
GMTGreenwich Mean Time
GPPGross primary productivity
JJAJune–July–August
MAEMean absolute error
MAMMarch–April–May
MSIMultispectral Imager
NEENet ecosystem exchange
NPPNet primary productivity
PARPhotosynthetically active radiation
PPFDPhotosynthetic photon flux density
RMSERoot mean square error
SCLScene classification layer
SONSeptember–October–November
TCWVTotal column water vapor
TOATop-of-atmosphere

Appendix A. Cloud-Parameter Sensitivity Analysis

To assess the stability of the empirical cloud-related parameters, we performed an exploratory repeated site-level calibration/validation analysis. In each repetition, AmeriFlux towers were randomly split into calibration and validation subsets using an 80%/20% split, with all daily observations from a given tower retained within the same subset. The cloud-probability threshold and cloud-transmittance parameter were selected on the calibration subset by minimizing RMSE and then evaluated on the held-out validation subset. This procedure was repeated 100 times. The selected configuration corresponds to the parameter values used in the main analysis: a cloud-probability threshold of 20% and a cloud-transmittance parameter of τ = 0.5. The optimized configuration was selected independently in each split by minimizing calibration RMSE over the tested parameter grid. Across the repeated splits, the optimized setting most frequently selected a lower cloud-probability threshold and a slightly higher cloud-transmittance value, with the representative optimum being threshold =0% and τ = 0.6, before evaluation on the held-out validation towers.
Table A1. Exploratory repeated site-level calibration/validation results for the empirical cloud-parameter settings. Values summarize validation performance across 100 random site-level splits. Bias, MAE, and RMSE are in W m−2.
ConfigurationMetricMean ± SD95% Range
SelectedBias 1.63 ± 1.30 [ 4.46 , 0.83 ]
MAE 17.02 ± 0.67 [ 15.91 , 18.32 ]
RMSE 23.54 ± 1.04 [ 21.82 , 25.81 ]
r 0.87 ± 0.01 [ 0.85 , 0.89 ]
OptimizedBias 1.35 ± 1.27 [ 1.35 , 3.66 ]
MAE 16.06 ± 0.65 [ 14.98 , 17.58 ]
RMSE 22.08 ± 1.00 [ 20.47 , 24.43 ]
r 0.88 ± 0.01 [ 0.86 , 0.90 ]
The exploratory optimized configuration reduced validation RMSE and MAE relative to the selected setting, but it also shifted the mean bias from slight underestimation to slight overestimation. Because the AmeriFlux validation network is spatially and biome-imbalanced, this split-based optimization should not be interpreted as a globally transferable calibration. Instead, the results indicate that the all-sky formulation is moderately sensitive to empirical cloud-related parameters, while supporting the use of the default 20% cloud-probability threshold and τ cloud = 0.5 as pragmatic and physically conservative values in the main analysis.

Appendix B. Seasonal Sample-Size Distribution by Hemisphere

The seasonal validation statistics were affected by the geographic distribution of the retained AmeriFlux sites. The validation dataset was strongly dominated by Northern Hemisphere stations, with only 5 of the 172 retained sites located in the Southern Hemisphere. Therefore, the seasonal statistics, and especially the DJF results, primarily reflect Northern Hemisphere seasonality.
This imbalance is evident in the matched-observation counts by season and hemisphere (Table A2). In DJF, 14,671 matched observations were from Northern Hemisphere sites, whereas only 192 were from Southern Hemisphere sites. Thus, the DJF validation samples were dominated by Northern Hemisphere winter conditions, which explains why the DJF panels contain relatively few high-PAR observations despite the inclusion of a small number of Southern Hemisphere sites.
Table A2. Seasonal matched-observation counts by hemisphere for the Sentinel-2–AmeriFlux validation dataset.
SeasonNorthern HemisphereSouthern Hemisphere
DJF14,671192
MAM19,163201
JJA20,585193
SON18,478188

Appendix C. Biome-Level Validation Diagnostics

To assess whether Sentinel-2 PAR validation errors varied across broad ecosystem settings, we summarized the validation statistics by IGBP biome class. This analysis was used as a diagnostic assessment of biome-level consistency rather than as a biome-specific calibration, because the number of retained stations differed substantially among biome classes.
Across the major biome classes with stronger sample support, the validation statistics were broadly consistent. Evergreen needleleaf forests (ENF), grasslands (GRA), croplands (CRO), wetlands (WET), deciduous broadleaf forests (DBF), and open shrublands (OSH) all showed RMSE values between approximately 21 and 26 W m−2, with correlation coefficients between 0.84 and 0.91. This suggests that the main validation performance was not driven by a single biome class. Larger deviations were observed for small-sample classes such as evergreen broadleaf forests (EBF) and snow/ice (SNO), but these classes were represented by only one station each and should therefore be interpreted with caution.
Table A3. Biome-level validation statistics for Sentinel-2 daily PAR against AmeriFlux observations. Bias, MAE, and RMSE are reported in W m−2. Biome classes follow the IGBP classification.
IGBPObservationsStationsBiasMAERMSEr
ENF13,17633−1.4817.0824.050.87
GRA11,69530−0.5517.5524.280.86
CRO10,75327−2.6615.7222.100.88
WET10,41830−4.4216.2522.430.89
DBF981920−4.6819.0126.100.84
OSH8205131.4715.8021.430.91
WSA244764.1616.5722.500.88
CSH274634.7516.4122.310.90
MF18343−1.8116.6122.880.87
CVM101033.5218.2424.190.81
SAV93423.4320.5825.770.83
EBF383113.5720.9927.010.79
SNO2511−14.4325.5033.660.72

References

  1. Keenan, T.F.; Luo, X.; Stocker, B.D.; Kauwe, M.G.D.; Medlyn, B.E.; Prentice, I.C.; Smith, N.G.; Terrer, C.; Wang, H.; Zhang, Y.; et al. A constraint on historic growth in global photosynthesis due to rising CO2. Nat. Clim. Change 2023, 13, 1376–1381. [Google Scholar] [CrossRef] [Scilit]
  2. Bateni, S.; Entekhabi, D.; Margulis, S.; Castelli, F.; Kergoat, L. Coupled estimation of surface heat fluxes and vegetation dynamics from remotely sensed land surface temperature and fraction of photosynthetically active radiation. Water Resour. Res. 2014, 50, 8420–8440. [Google Scholar] [CrossRef] [Scilit]
  3. Feltrin, R.P.; Will, R.E.; Meek, C.R.; Masters, R.E.; Waymire, J.; Wilson, D.S. Relationship between photosynthetically active radiation and understory productivity across a forest-savanna continuum. For. Ecol. Manag. 2016, 374, 51–60. [Google Scholar] [CrossRef] [Scilit]
  4. Duan, M.; Han, C.; Zhang, X.; Wei, Z.; Wang, Z.; Zhang, B. Spatial and Temporal Dynamics of Photosynthetically Active Radiation in Crops: Effects of Canopy Structure on Yield. Agronomy 2025, 15, 940. [Google Scholar] [CrossRef] [Scilit]
  5. Frouin, R.; Pinker, R.T. Estimating Photosynthetically Active Radiation (PAR) at the earth’s surface from satellite observations. Remote Sens. Environ. 1995, 51, 98–107. [Google Scholar] [CrossRef] [Scilit]
  6. Alados, I.; Foyo-Moreno, I.; Alados-Arboledas, L. Photosynthetically active radiation: Measurements and modelling. Agric. For. Meteorol. 1996, 78, 121–131. [Google Scholar] [CrossRef] [Scilit]
  7. Liu, J.; Cai, Y.; Pei, X.; Yu, X. Advances in research and application of techniques for measuring photosynthetically active radiation. Remote Sens. 2025, 17, 1765. [Google Scholar] [CrossRef] [Scilit]
  8. Liang, S.; Zheng, T.; Liu, R.; Fang, H.; Tsay, S.; Running, S. Estimation of incident photosynthetically active radiation from Moderate Resolution Imaging Spectrometer data. J. Geophys. Res. Atmos. 2006, 111, D15208. [Google Scholar] [CrossRef] [Scilit]
  9. Wang, D.; Liang, S.; Zhang, Y.; Gao, X.; Brown, M.G.L.; Jia, A. A New Set of MODIS Land Products (MCD18): Downward Shortwave Radiation and Photosynthetically Active Radiation. Remote Sens. 2020, 12, 168. [Google Scholar] [CrossRef] [Scilit]
  10. Wang, D. Moderate Resolution Imaging Spectroradiometer (MODIS) Downward Shortwave Radiation (MCD18A1 and MCD18C1) and Photosynthetically Active Radiation (MCD18A2 and MCD18C2) User Guide, Collection 62; NASA LP DAAC and University of Maryland, College Park: Sioux Falls, SD, USA, 2022. [Google Scholar]
  11. Wang, D.; Li, R. Suomi-NPP and JPSS-1 VIIRS Downward Shortwave Radiation (VNP18A1/VJ118A1) and Photosynthetically Active Radiation (VNP18A2/VJ118A2) User Guide; NASA LP DAAC and University of Maryland, College Park: Sioux Falls, SD, USA, 2022. Available online: https://lpdaac.usgs.gov/documents/2261/VNP18_UserGuide_V1.2.pdf (accessed on 8 March 2026).
  12. Su, W.; Charlock, T.P.; Rose, F.G.; Rutan, D. Photosynthetically active radiation from Clouds and the Earth’s Radiant Energy System (CERES) products. J. Geophys. Res. Biogeosci. 2007, 112, G02022. [Google Scholar] [CrossRef] [Scilit]
  13. Gelaro, R.; McCarty, W.; Suárez, M.J.; Todling, R.; Molod, A.; Takacs, L.; Randles, C.A.; Darmenov, A.; Bosilovich, M.G.; Reichle, R.; et al. The Modern-Era Retrospective Analysis for Research and Applications, Version 2 (MERRA-2). J. Clim. 2017, 30, 5419–5454. [Google Scholar] [CrossRef] [Scilit] [PubMed]
  14. Running, S.W.; Nemani, R.; Glassy, J.M.; Thornton, P.E. MODIS Daily Photosynthesis (PSN) and Annual Net Primary Production (NPP) Product (MOD17) Algorithm Theoretical Basis Document. In SCF At-Launch Algorithm ATBD Documents; University of Montana: Missoula, MT, USA, 1999; Volume 490. [Google Scholar]
  15. Muñoz Sabater, J. ERA5-Land Hourly Data from 1950 to Present. 2019. Available online: https://cds.climate.copernicus.eu/datasets/reanalysis-era5-land (accessed on 8 March 2026).
  16. Hersbach, H.; Bell, B.; Berrisford, P.; Biavati, G.; Horányi, A.; Muñoz Sabater, J.; Nicolas, J.; Peubey, C.; Radu, R.; Rozum, I.; et al. ERA5 Hourly Data on Single Levels from 1940 to Present. 2023. Available online: https://cds.climate.copernicus.eu/datasets/reanalysis-era5-single-levels?tab=overview (accessed on 8 March 2026).
  17. Kollert, A.; Bremer, M.; Löw, M.; Rutzinger, M. Exploring the potential of land surface phenology and seasonal cloud free composites of one year of Sentinel-2 imagery for tree species mapping in a mountainous region. Int. J. Appl. Earth Obs. Geoinf. 2021, 94, 102208. [Google Scholar] [CrossRef] [Scilit]
  18. Zegaar, A.; Telli, A.; Ounoki, S.; Shahabi, H.; Rueda, F. Data-driven approach for land surface temperature retrieval with machine learning and sentinel-2 data. Remote Sens. Appl. Soc. Environ. 2024, 36, 101357. [Google Scholar] [CrossRef] [Scilit]
  19. Ahmed, A.Y.; Ali, A.M.; Ahmed, N. Temporal dynamics of leaf area index and land surface temperature correlation using Sentinel-2 and Landsat OLI data. Environ. Syst. Res. 2024, 13, 43. [Google Scholar] [CrossRef] [Scilit]
  20. Isik, M.S.; Parente, L.; Consoli, D.; Sloat, L.; Mesquita, V.V.; Ferreira, L.G.; Sabbatini, S.; Stanimirova, R.; Teles, N.M.; Robinson, N.; et al. Light use efficiency (LUE) based bimonthly gross primary productivity (GPP) for global grasslands at 30 m spatial resolution (2000–2022). PeerJ 2025, 13, e19774. [Google Scholar] [CrossRef] [Scilit] [PubMed]
  21. Kopp, G.; Lean, J.L. A new, lower value of total solar irradiance: Evidence and climate significance. Geophys. Res. Lett. 2011, 38, L01706. [Google Scholar] [CrossRef] [Scilit]
  22. Spencer, J. Fourier series representation of the position of the sun. Search 1971, 2, 172. [Google Scholar]
  23. Bird, R.E.; Hulstrom, R.L. A Simplified Clear Sky Model for Direct and Diffuse Insolation on Horizontal Surfaces; Technical Report SERI/TR-642-761; Solar Energy Research Institute: Golden, CO, USA, 1981. [Google Scholar]
  24. Kasten, F.; Young, A.T. Revised Optical Air Mass Tables and Approximation Formula. Appl. Opt. 1989, 28, 4735–4738. [Google Scholar] [CrossRef] [Scilit] [PubMed]
  25. NASA JPL. NASADEM Merged DEM Global 1 arc Second V001. 2020. Available online: https://www.earthdata.nasa.gov/data/catalog/lpcloud-nasadem-hgt-001 (accessed on 1 April 2026).
  26. Jin, J.; Henzing, B.; Segers, A. How aerosol size matters in aerosol optical depth (AOD) assimilation and the optimization using the Ångström exponent. Atmos. Chem. Phys. 2023, 23, 1641–1660. [Google Scholar] [CrossRef] [Scilit]
  27. Levy, R.; Hsu, C. MODIS Atmosphere L2 Aerosol Product. Data Accessed from NASA Earthdata. 2015. Available online: https://modaps.modaps.eosdis.nasa.gov/services/about/products/c6/MOD04_L2.html (accessed on 8 March 2026).
  28. Hsu, N.C.; Jeong, M.J.; Bettenhausen, C.; Sayer, A.M.; Hansell, R.; Seftor, C.; Huang, J.; Tsay, S.C. Global and regional evaluation of over-land spectral aerosol optical depth retrievals from SeaWiFS. Atmos. Chem. Phys. 2013, 13, 1–20. [Google Scholar] [CrossRef] [Scilit]
  29. Olofsson, P.; Van Laake, P.E.; Eklundh, L. Estimation of absorbed PAR across Scandinavia from satellite measurements: Part I: Incident PAR. Remote Sens. Environ. 2007, 110, 252–261. [Google Scholar] [CrossRef] [Scilit]
  30. Proutsos, N.D.; Liakatas, A.; Alexandris, S.G.; Tsiros, I.X.; Tigkas, D.; Halivopoulos, G. Atmospheric Factors Affecting Global Solar and Photosynthetically Active Radiation Relationship in a Mediterranean Forest Site. Atmosphere 2022, 13, 1207. [Google Scholar] [CrossRef] [Scilit]
  31. Wang, D. VIIRS/NPP Photosynthetically Active Radiation Daily L3 Global 0.05Deg CMG V002; NASA Land Processes Distributed Active Archive Center: Sioux Falls, SD, USA, 2025. [CrossRef]
  32. Doelling, D.R.; Sun, M.; Nguyen, L.T.; Nordeen, M.L.; Haney, C.O.; Keyes, D.F.; Mlynczak, P.E. Advances in Geostationary-Derived Longwave Fluxes for the CERES Synoptic (SYN1deg) Product. J. Atmos. Ocean. Technol. 2016, 33, 503–521. [Google Scholar] [CrossRef] [Scilit]
  33. McCree, K. Test of current definitions of photosynthetically active radiation against leaf photosynthesis data. Agric. Meteorol. 1972, 10, 443–453. [Google Scholar] [CrossRef] [Scilit]
  34. Wandji Nyamsi, W.; Saint-Drenan, Y.M.; Augustine, J.A.; Arola, A.; Wald, L. On the Relationships between Clear-Sky Indices in Photosynthetically Active Radiation and Broadband Ranges in Overcast and Broken-Cloud Conditions. Remote Sens. 2024, 16, 3718. [Google Scholar] [CrossRef] [Scilit]
  35. Schmit, T.J.; Griffith, P.; Gunshor, M.M.; Daniels, J.M.; Goodman, S.J.; Lebair, W.J. A Closer Look at the ABI on the GOES-R Series. Bull. Am. Meteorol. Soc. 2017, 98, 681–698. [Google Scholar] [CrossRef] [Scilit]
  36. Ciazela, M.; Ciazela, J. Topoclimate Mapping Using Landsat ETM+ Thermal Data: Wolin Island, Poland. Remote Sens. 2021, 13, 2712. [Google Scholar] [CrossRef] [Scilit]
  37. Bennie, J.; Huntley, B.; Wiltshire, A.; Hill, M.O.; Baxter, R. Slope, aspect and climate: Spatially explicit and implicit models of topographic microclimate in chalk grassland. Ecol. Model. 2008, 216, 47–59. [Google Scholar] [CrossRef] [Scilit]
  38. Zhang, S.; Li, X.; She, J.; Peng, X. Assimilating remote sensing data into GIS-based all sky solar radiation modeling for mountain terrain. Remote Sens. Environ. 2019, 231, 111239. [Google Scholar] [CrossRef] [Scilit]
  39. Akitsu, T.K.; Nasahara, K.N.; Ijima, O.; Hirose, Y.; Ide, R.; Takagi, K.; Kume, A. The variability and seasonality in the ratio of photosynthetically active radiation to solar radiation: A simple empirical model of the ratio. Int. J. Appl. Earth Obs. Geoinf. 2022, 108, 102724. [Google Scholar] [CrossRef] [Scilit]
Figure 1. Overview of the workflow used to derive daily clear-sky and all-sky PAR from Sentinel-2 imagery and evaluate the resulting estimates. Sentinel-2 atmospheric and scene classification variables were combined with solar-geometry-based extraterrestrial radiation and simplified atmospheric transmittance terms to estimate pixel-level daily PAR.
Remotesensing 18 02745 g001
Figure 2. Overview of the 172 AmeriFlux sites used for validation. The main panel shows the spatial distribution of the stations across North and South America, with point colors indicating IGBP land-cover classes and point sizes proportional to the number of available daily PPFD observations at each site. The upper-right panel summarizes the biome composition of the selected tower set, while the lower-right panel shows the distribution of daily PPFD observation counts per station.
Remotesensing 18 02745 g002
Figure 3. Comparison of TOA PAR estimates based on solar geometry using Sentinel-2 against in situ measurements from AmeriFlux stations. Comparisons across (a) all seasons, (b) winter (DJF), (c) spring (MAM), (d) summer (JJA), and (e) autumn (SON). Color intensity indicates the density of observations on a logarithmic scale. The dashed line represents the 1:1 line.
Remotesensing 18 02745 g003
Figure 4. Comparison of clear-sky PAR estimates based on solar geometry and atmospheric attenuation correction using Sentinel-2 against in situ measurements from AmeriFlux stations. The comparison across (a) all seasons, (b) winter (DJF), (c) spring (MAM), (d) summer (JJA), and (e) autumn (SON). Color intensity indicates the density of observations on a logarithmic scale. The dashed line represents the 1:1 line.
Remotesensing 18 02745 g004
Figure 5. Comparison of clear-sky PAR estimates based on varying solar zenith angle during atmospheric attenuation correction using Sentinel-2 against in situ measurements from AmeriFlux stations. Comparisons across (a) all seasons, (b) winter (DJF), (c) spring (MAM), (d) summer (JJA), and (e) autumn (SON). Color intensity indicates the density of observations on a logarithmic scale. The dashed line represents the 1:1 line.
Remotesensing 18 02745 g005
Figure 6. Comparison of all-sky PAR estimates using Sentinel-2 against in situ measurements from AmeriFlux stations. Comparisons across (a) all seasons, (b) winter (DJF), (c) spring (MAM), (d) summer (JJA), and (e) autumn (SON). Color intensity indicates the density of observations on a logarithmic scale. The dashed line represents the 1:1 line.
Remotesensing 18 02745 g006
Figure 7. Selected single-date examples of daily all-sky PAR estimates from Sentinel-2, MODIS, and CERES across different seasonal periods. Each row represents one Sentinel-2 overpass date, indicated on the left side of the figure, rather than a seasonal composite or seasonal mean. Columns show the Sentinel-2 RGB image, Sentinel-2-derived daily PAR, MODIS PAR, and CERES PAR for the same calendar date, respectively. All PAR panels are displayed using a common color scale across dates and products to allow direct visual comparison of product differences and date-to-date PAR magnitude. The maps are shown in geographic coordinates, with longitude and latitude indicated on the map frames. All products are cropped to the Sentinel-2 scene extent. Sentinel-2 PAR is displayed at 10 m spatial resolution, MODIS MCD18 at 0.05°, and CERES SYN1deg at 1° spatial resolution.
Remotesensing 18 02745 g007
Table 1. Seasonal validation statistics for satellite-derived daily PAR products against flux tower PAR observations. Bias, RMSE, and MAE are reported in W m−2, while correlation (r) is unitless. The Count column indicates the number of matched daily observations used for each product-season comparison, and brackets indicate 95% confidence intervals from site-level bootstrap resampling.
SeasonProductCountBiasRMSEMAECorr (r)
All seasonsSentinel-2 All-sky73,671−1.44[−3.00, 0.17]23.53[22.52, 24.40]17.01[16.40, 17.48]0.87[0.86, 0.88]
Sentinel-2 Clear-sky73,6716.38[4.99, 7.92]22.84[22.00, 23.70]15.87[15.22, 16.64]0.87[0.86, 0.88]
MODIS All-sky268,300−2.16[−3.44, −1.09]17.60[16.17, 18.98]11.74[10.97, 12.54]0.93[0.92, 0.94]
VIIRS All-sky275,975−4.09[−5.42, −2.91]21.16[19.83, 22.31]14.56[13.69, 15.31]0.91[0.90, 0.92]
CERES Surface All-sky281,7471.58[0.47, 2.74]15.56[13.99, 16.85]10.13[9.33, 10.90]0.94[0.93, 0.95]
CERES Surface Clear-sky281,74721.61[20.10, 23.16]35.03[33.77, 36.20]24.38[23.17, 25.67]0.81[0.80, 0.83]
CERES TOA All-sky281,74726.23[24.40, 28.15]39.43[38.02, 40.85]28.38[26.99, 29.92]0.79[0.78, 0.80]
Winter (DJF)Sentinel−2 All-sky14,863−2.42[−3.33, −1.45]13.66[12.69, 14.77]9.79[9.34, 10.30]0.87[0.86, 0.89]
Sentinel−2 Clear-sky14,8630.16[−0.97, 1.28]13.83[12.32, 15.52]9.19[8.55, 9.94]0.87[0.83, 0.89]
MODIS All-sky57,060−3.24[−4.01, −2.39]11.94[10.40, 13.79]7.56[6.96, 8.29]0.92[0.90, 0.94]
VIIRS All-sky62,697−6.00[−6.91, −5.05]14.67[13.35, 16.13]9.82[9.07, 10.60]0.89[0.87, 0.91]
CERES Surface All-sky64,2350.82[0.10, 1.65]10.85[9.18, 12.79]6.61[6.00, 7.34]0.93[0.91, 0.95]
CERES Surface Clear-sky64,23514.91[13.53, 16.29]23.93[22.18, 25.79]16.46[15.19, 17.82]0.80[0.75, 0.83]
CERES TOA All-sky64,23519.06[17.51, 20.59]27.51[25.77, 29.34]19.96[18.57, 21.47]0.77[0.72, 0.81]
Spring (MAM)Sentinel−2 All-sky19,364−1.19[−3.84, 1.02]26.73[25.44, 28.18]20.61[19.64, 21.77]0.80[0.78, 0.82]
Sentinel−2 Clear-sky19,3648.65[6.03, 11.11]24.99[23.61, 26.41]18.46[17.41, 19.58]0.79[0.74, 0.82]
MODIS All-sky70,824−4.51[−6.15, −2.90]20.05[18.41, 21.89]14.02[13.11, 15.10]0.89[0.87, 0.90]
VIIRS All-sky70,693−6.68[−8.48, −4.96]24.24[22.69, 25.86]17.56[16.60, 18.67]0.86[0.84, 0.88]
CERES Surface All-sky70,9291.13[−0.43, 2.56]17.57[15.98, 19.36]12.06[11.21, 13.04]0.90[0.89, 0.92]
CERES Surface Clear-sky70,92927.15[24.70, 29.39]42.36[40.30, 44.11]30.56[28.63, 32.44]0.61[0.58, 0.64]
CERES TOA All-sky70,92930.59[27.86, 33.12]46.11[43.87, 48.22]33.61[31.40, 35.74]0.54[0.51, 0.58]
Summer (JJA)Sentinel−2 All-sky20,7780.05[−2.23, 2.17]29.79[28.61, 31.05]23.12[22.20, 24.03]0.74[0.71, 0.76]
Sentinel−2 Clear-sky20,77812.91[10.56, 15.22]28.59[27.07, 29.97]21.29[19.93, 22.58]0.59[0.54, 0.63]
MODIS All-sky74,6670.11[−1.56, 1.71]21.02[19.67, 22.58]15.13[14.22, 16.21]0.86[0.84, 0.88]
VIIRS All-sky71,556−0.89[−2.95, 1.07]26.15[24.86, 27.53]19.36[18.36, 20.40]0.82[0.80, 0.84]
CERES Surface All-sky74,6902.73[1.09, 4.26]18.69[17.22, 20.39]13.11[12.11, 14.17]0.88[0.86, 0.90]
CERES Surface Clear-sky74,69026.93[24.63, 29.20]41.16[39.38, 42.72]30.34[28.42, 32.07]0.60[0.55, 0.65]
CERES TOA All-sky74,69032.69[29.86, 35.43]46.97[44.71, 48.90]35.51[33.05, 37.65]0.50[0.42, 0.56]
Autumn (SON)Sentinel−2 All-sky18,666−2.59[−3.82, −1.47]17.57[16.31, 18.94]12.21[11.49, 13.00]0.88[0.85, 0.89]
Sentinel−2 Clear-sky18,6660.36[−0.98, 1.62]16.73[15.23, 18.43]11.14[10.37, 12.21]0.86[0.82, 0.89]
MODIS All-sky65,749−1.29[−2.40, −0.19]14.34[12.63, 16.07]9.04[8.26, 9.89]0.92[0.91, 0.94]
VIIRS All-sky71,029−3.04[−4.13, −1.92]16.61[15.20, 18.19]10.94[10.15, 11.73]0.91[0.89, 0.92]
CERES Surface All-sky71,8931.49[0.35, 2.55]13.28[11.69, 14.93]8.27[7.51, 9.09]0.93[0.91, 0.95]
CERES Surface Clear-sky71,89316.59[15.06, 18.13]27.70[26.14, 29.26]19.16[17.88, 20.52]0.79[0.77, 0.82]
CERES TOA All-sky71,89321.61[19.99, 23.28]32.06[30.45, 33.63]23.34[21.85, 24.84]0.76[0.73, 0.79]
Disclaimer/Publisher’s Note: The statements, opinions and data contained in all publications are solely those of the individual author(s) and contributor(s) and not of MDPI and/or the editor(s). MDPI and/or the editor(s) disclaim responsibility for any injury to people or property resulting from any ideas, methods, instructions or products referred to in the content.