


Highlights
- This study presents one of the first national-scale flood susceptibility assessments for Nigeria, integrating frequency ratio (FR), logistic regression (LR), Random Forest (RF), and XGBoost within a unified modeling framework.
- At the national scale, height above nearest drainage (HAND) exhibited the highest overall importance across FR, LR, RF permutation importance, and XGBoost gain analyses.
- RF Gini importance ranked land use/land cover (LULC) as the dominant predictor, whereas permutation importance identified HAND as the primary predictor, highlighting the influence of cardinality bias on feature-importance interpretation.
- A satellite-driven HEC-RAS framework, supported by Dartmouth Flood Observatory (DFO) river discharge observations, offers a practical approach to flood susceptibility mapping in hydrologically data-sparse environments.
- The resulting national-scale flood susceptibility maps provide spatially consistent information to support flood-risk management, infrastructure planning, land-use decision-making, and climate adaptation across Nigeria.
Abstract
Flooding is the most recurrent and economically devastating natural hazard in Nigeria, yet no standard or consistent nationwide assessment method exists. Spatially explicit flood susceptibility information also remains scarce, particularly given limited hydrometric monitoring. This study comparatively evaluates national-scale flood susceptibility in Nigeria using frequency ratio (FR), logistic regression (LR), Random Forest (RF), and gradient boosting (XGBoost), while assessing conditioning-factor importance within a satellite-informed framework for data-sparse environments. Six conditioning factors were evaluated—elevation, TWI, HAND, LULC, slope, and soil type—with elevation, TWI, HAND, and LULC retained following multicollinearity and sensitivity assessments. The flood inventory was derived from a HEC-RAS 100-year floodplain simulation driven by Dartmouth Flood Observatory (DFO) satellite-derived discharge, yielding 1,048,575 binary flood/non-flood observations for supervised model development and FR computation. The HEC-RAS floodplain was qualitatively checked for spatial plausibility against documented DFO historical flood reports. On the held-out HEC-RAS-derived test subset, XGBoost achieved the highest AUC (0.956) and overall accuracy (0.892). As an internal spatial-reproduction diagnostic, LR, RF, and XGBoost showed substantial agreement with the HEC-RAS reference (Kappa = 0.662–0.700), whereas FR showed moderate agreement (Kappa = 0.410). External evaluation against the independent 2022 Sentinel-1 SAR flood extent showed consistently high flood-class detection across all four susceptibility models (93.81–94.50%). At the national scale, HAND ranked highest overall across the evaluated importance analyses. The results demonstrate the value of combining statistical and machine learning approaches with satellite-informed hydrodynamic data for national-scale flood susceptibility assessment. XGBoost showed the strongest overall predictive performance, while the resulting maps provide spatial information to support disaster risk management, land-use planning, and early warning in Nigeria and other data-sparse regions.
1. Introduction
Flooding is the most frequent and economically devastating natural disaster globally, accounting for approximately one-third of natural disaster-related deaths and most economic losses from extreme events in low- and middle-income countries [1]. The Intergovernmental Panel on Climate Change (IPCC Sixth) Assessment Report projects that rising global temperatures will intensify the West African monsoon system, amplifying the frequency, magnitude, and spatial extent of extreme rainfall and river flooding across the Niger–Benue basin and its transboundary catchments [2]. In a region where socioeconomic vulnerabilities are acute and adaptive capacity is severely constrained [3], the absence of spatially explicit flood risk intelligence represents a critical unmet need with direct consequences for life safety, infrastructure investment, and long-term climate resilience.
Nigeria exemplifies this challenge most severely. As Africa’s most populous nation—with over 220 million people and extensive settlement in flood-prone riparian lowlands—Nigeria experiences recurring catastrophic floods driven by seasonal Niger–Benue dynamics, upstream transboundary dam releases, and intensifying monsoonal precipitation [4,5,6,7]. The 2012 flood, triggered by anomalous rainfall and the deliberate release of water from the Lagdo Dam in Cameroon, inundated 30 of the 36 states, displaced over 2.1 million people, caused 363 fatalities, and inflicted economic losses estimated at USD 16.9 billion [8,9,10]. A near-recurrence in 2022 confirmed that the structural drivers of Nigeria’s flood risk remain unaddressed. Critically, Nigeria’s hydrometric monitoring network has deteriorated severely since the 1980s—fewer than 30% of gauging stations remain operational [11,12]—rendering conventional gauge-driven flood modeling inapplicable at the national scale [13] and making the absence of nationwide, spatially consistent flood susceptibility maps both more consequential and more technically challenging to address.
Flood susceptibility mapping (FSM), integrating statistical and machine learning (ML) approaches, offers a computationally efficient, data-driven way to fill this gap. FSM approaches span three complementary model classes: bivariate statistical models, such as frequency ratio (FR) [14,15], which quantify empirical spatial associations between flood occurrence and conditioning factor classes; multivariate statistical models, such as logistic regression (LR) [16], which model flood probability as a function of multiple factors; and ensemble ML models, such as Random Forest (RF) [17] and XGBoost [18], which capture complex nonlinear relationships through iterative tree-based learning. Each model class offers distinct strengths [19,20,21,22,23,24,25]: statistical models provide physically interpretable susceptibility gradients, while ML ensembles deliver higher classification accuracy and sharper spatial boundary delineation [26,27]. National-scale FSM applications remain limited, although Taubenböck et al. [28] recently demonstrated nationwide data-driven flood susceptibility mapping for Nigeria. Rather than introducing a new predictive algorithm, this study integrates established bivariate, multivariate, and ensemble machine learning approaches—FR, LR, RF, and XGBoost [14,15,16,17,18]—within a common satellite-informed hydrodynamic framework for national-scale flood susceptibility assessment in Nigeria. These four approaches were selected to represent complementary model classes: FR provides transparent bivariate associations, LR provides interpretable multivariate probabilistic relationships, and RF and XGBoost capture nonlinear relationships and interactions through ensemble tree learning [14,15,16,17,18,19,20,21,22,23,24,25,26,27]. This integrated framework is particularly suitable for Nigeria because it combines interpretable statistical and nonlinear machine learning approaches with nationally consistent satellite and hydrodynamic information, addressing the limited availability of spatially continuous gauge-based flood observations. The resulting comparative framework therefore extends existing national-scale FSM work in Nigeria by evaluating complementary modeling approaches and conditioning-factor importance within a common satellite-informed flood-reference framework. This gap leaves planners, emergency managers, and infrastructure developers without the multi-model spatial intelligence needed to prioritize flood risk reduction interventions across the country’s physiographically diverse landscape.
Furthermore, three critical gaps motivate this study. First, despite a contemporaneous nationwide FSM effort for Nigeria [28], no study has integrated FR, LR, RF, and XGBoost with HAND as a conditioning factor within a satellite-driven HEC-RAS training framework. This specific combination is absent from the current literature for a nation of over 220 million people. Second, default Gini-based variable importance in RF platforms such as ArcGIS Pro 3.6.2 is known to favor high-cardinality categorical variables [29,30]. This can inflate the apparent importance of land cover classes while underestimating physically meaningful continuous predictors such as HAND; this issue has not previously been diagnosed and corrected at the national scale using multi-method corroboration. Third, FSM studies in data-sparse environments lack access to nationally consistent ground-truth flood records, thereby necessitating physically based alternatives for generating flood/non-flood training labels and assessing model spatial consistency.
This study addresses these three gaps through four contributions. First, it presents one of the earliest national-scale, multi-model FSM efforts for Nigeria at 30 m resolution, based on 1,048,575 HEC-RAS-derived flood/non-flood observations. It also presents a bivariate FR component and a conditioning-factor analysis based on the four retained factors—elevation (DEM), HAND, TWI, and LULC—within a satellite-informed HEC-RAS training framework. Second, on a national scale, it establishes HAND as the most influential flood conditioning factor across four independent model types and two key metrics—a novel geomorphological finding with direct implications for prioritizing conditioning factors in national-scale FSM. Third, it diagnoses, quantifies, and corrects Gini cardinality bias in RF variable importance using permutation importance, corroborated by FR, LR, and XGBoost—a methodological warning with broad applicability to RF-based FSM studies using categorical land cover data. Fourth, it integrates DFO passive-microwave discharge, HEC-RAS hydrodynamic modeling, and established statistical and machine learning approaches within a nationally consistent FSM framework for gauge-sparse environments. The HEC-RAS floodplain is independently verified against DFO-documented historical flood reports, and model spatial consistency is assessed against the same physically based hydrodynamic reference—a replicable approach for gauge-sparse environments across sub-Saharan Africa [13,31,32].
2. Study Area
Nigeria is in West Africa, bounded by latitudes 4°N and 14°N and longitudes 3°E and 15°E, covering approximately 923,768 km2 (Figure 1). It borders Benin to the west, Niger to the north, Chad to the northeast, and Cameroon to the east. The Niger and Benue rivers converge at Lokoja in Kogi State, forming the country’s primary hydrological axis. The Benue, which originates in the Adamawa Highlands of Cameroon, flows westward before joining the Niger at Lokoja—historically Nigeria’s most flood-prone confluence zone [5,33].
Figure 1.
Study area map of Nigeria showing the HEC-RAS 100-year floodplain extent, derived from DFO satellite river discharge measurements and used as the flood-inventory reference for model training and spatial consistency assessment.
The country’s physiography is highly diverse: coastal mangrove swamps and freshwater swamp forests in the Niger Delta; tropical rainforests and derived savannas across the southern and middle belt zones; Guinea and Sudan savannas in the north; and semi-arid Sahel savannas near the Lake Chad Basin. Elevation ranges from sea level in the Niger Delta to over 2000 m in the Adamawa Highlands and the Jos Plateau. Mean annual rainfall declines sharply from approximately 3000–4000 mm in the Niger Delta to less than 500 mm in the northeast [34].
Nigeria’s hydrometric monitoring network has deteriorated severely since the 1980s, with fewer than 30% of established gauging stations currently operational [11,13]. This infrastructure deficit renders conventional gauge-driven hydrodynamic modeling inapplicable at the national scale and precludes the use of observed flood records as direct training data for models. This deficit is the primary motivation for the satellite-driven framework adopted in this study, in which DFO passive microwave river discharge drives HEC-RAS to generate physically grounded flood susceptibility training labels, which are then verified against DFO historical flood extent polygons [13,31,32]. Idowu and Zhou [11,13] documented the 2012 and 2022 flood events in the lower Niger River Basin using satellite-based flood detection, supporting the use of DFO-derived products for credible spatial characterization of Nigerian flood extents.
3. Materials and Methods
The methodological framework comprised nine sequential steps (Figure 2): (1) data collection from satellite and ancillary sources, including the 2022 Sentinel-1 SAR flood extent reserved for independent verification [35]; (2) derivation of conditioning factors and classification into five classes; (3) multicollinearity assessment and sensitivity-based factor selection; (4) retention of four conditioning factors; (5) satellite-driven flood reference generation, in which DFO satellite discharge drives a HEC-RAS 100-year floodplain simulation, verified against DFO-documented historical flood reports, which were used in two ways: as a pixel-count reference for FR class-level frequency ratio computation and as binary training labels (1,048,575 data points with a 80/20 split [36]) for LR, RF, and XGBoost modeling; (6) flood susceptibility modeling using four complementary approaches—FR (deterministic frequency ratio computation), LR (supervised multivariate regression), RF (supervised ensemble trees), and XGBoost (supervised gradient boosting); (7) statistical accuracy assessment of the independent 20% test subset (209,715 data points) for LR, RF, and XGBoost, with FR AUC computed at the pixel level using sklearn roc_auc_score on 1,048,575 stratified observations; (8) spatial consistency assessment of all four binary model outputs against the HEC-RAS floodplain using 3000 stratified random points (Figure 3), and an independent check against the 2022 Sentinel-1 SAR flood extent (12,444,033 data points); and (9) national-scale map output synthesis and cross-model comparison.
Figure 2.
Methodological workflow for national-scale flood susceptibility mapping in Nigeria.
Figure 3.
Red dots represent points used to assess the spatial consistency of all four binary model outputs against the HEC-RAS floodplain.
3.1. Data Sources and Flood Inventory
Six candidate flood-conditioning factors—elevation, slope, TWI, HAND, LULC, and soil type—were initially identified from the established flood-susceptibility literature because they represent major topographic, hydrologic, surface-cover, and infiltration controls relevant to flood occurrence in Nigeria. Elevation values were obtained directly from the NASA 30 m Digital Elevation Model (DEM), and the slope was derived from the same DEM [37]. The DEM was hydrologically conditioned prior to terrain analysis to fill voids/depression and improve drainage continuity before deriving the terrain-based conditioning factors. TWI was computed as:
where As is the specific catchment area and β is the local slope angle [38]. HAND was computed using the flow distance approach as the vertical distance of each pixel above its nearest drainage channel [39]. LULC data were obtained from the ESRI Sentinel-2 Land Cover Explorer and soil data from the United Nations Food and Agriculture Organization (FAO) Harmonized World Soil Database (HWSD). The sources for these datasets are shown in Table 1. The flood reference for all four models was derived from HEC-RAS 100-year floodplain simulation outputs, with DFO satellite passive microwave radiometer discharge records used as upstream boundary conditions [40]. Prior to downstream use, the HEC-RAS floodplain was independently verified for spatial plausibility against DFO-documented historical flood reports [31]—one of the few independent references available at the national scale in this data-sparse environment. The HEC-RAS floodplain was used in two distinct ways across the four models. For FR, the full national raster floodplain extent defined flood pixel membership for class-level frequency ratio computation. For LR, RF, and XGBoost, the HEC-RAS flood extent polygon (flood class) and areas outside the simulated floodplain (non-flood class) were converted to 1,048,575 georeferenced binary observations, partitioned into 80% training (838,860 data points) and 20% independent test (209,715 data points) subsets for supervised model fitting and statistical accuracy assessment [41]. A separate stratified pixel sample of 1,048,575 observations (692,722 flood data points; 355,853 non-flood data points) was extracted from the national raster for FR AUC computation.
TWI = ln(As/tanβ)
Table 1.
The datasets used and their sources in this study.
3.2. Multicollinearity and Sensitivity Assessment
Multicollinearity among the six candidate conditioning factors was assessed using the variance inflation factor (VIF). VIFs were calculated from auxiliary regressions with an intercept, excluding the binary flood-response variable from the predictor matrix. A VIF > 10 was considered indicative of severe multicollinearity [42,43]. Because none of the six candidate factors exhibited problematic multicollinearity, factor retention was further examined through sensitivity analysis to determine whether inclusion of all candidate variables provided meaningful incremental predictive benefit. Using logistic regression as a controlled sensitivity model, the retained configuration comprising DEM, HAND, LULC, and TWI was compared with configurations additionally including slope, soil type, or both variables. Model performance was compared using AUC, overall accuracy, balanced accuracy, Cohen’s Kappa, log loss, and Brier score. In all expanded setups, including slope and/or soil type did not significantly enhance the DEM–HAND–LULC–TWI configuration.
3.3. Frequency Ratio Model
The FR model quantifies the empirical spatial association between flood occurrence and each conditioning factor class using the following equation.
where Nflood(Xi) is the number of flood pixels in class i, Nflood(total) is the total number of flood pixels, N(Xi) is the total pixel count of class i, and N(total) is the total number of pixels for the entire study area [14,44]. FR > 1 indicates a positive flood association; FR < 1 indicates a negative association. Flood pixel membership was defined by the HEC-RAS 100-year floodplain—the same reference used for LR, RF, and XGBoost, but applied differently. Rather than generating supervised training labels, the floodplain was used to extract pixel counts for each conditioning factor class across the full national raster, from which class-level FR values were computed deterministically, without any parameter optimization or decision boundary fitting. Each conditioning factor was first classified into five classes, and the total pixels and flood pixels for each class were then extracted to compute FR values. The implementation involved: (1) reclassifying each factor raster by replacing class values with corresponding FR values, and (2) summing the four reclassified rasters to produce the flood susceptibility index (FSI). The FSI was classified into five susceptibility zones [45]. A predictive ratio (PR) weight was computed for each factor as the ratio of the maximum to the minimum FR value, reflecting the factor’s discriminative range across classes. AUC was computed at the pixel level using the sklearn roc_auc_score function [41] on a stratified sample of 1,048,575 pixels (consisting of 692,722 flood pixels and 355,853 non-flood pixels) from the national raster. Each pixel’s class score (1–5) was mapped to its corresponding FR value using the full-raster class table. FSI was computed as the sum of the four mapped FR values per pixel. The resulting AUC of 0.929 indicates that a randomly selected flood pixel has a much higher FSI than a randomly selected non-flood pixel, and that the FR model demonstrates excellent predictive accuracy [46].
FR(Xi) = [Nflood(Xi)/Nflood(total)]/[N(Xi)/N(total)]
3.4. Logistic Regression
LR models the conditional probability of a flood as follows and is estimated by maximum likelihood on the training dataset [16,47].
where P is the model probability; β0 is the intercept not associated with any input feature; β1, β2, …, βn are coefficients for each input parameter; and X1, X2, …, Xn are input parameters.
P(Y = 1|X) = 1/(1 + e−(β0 + β1X1 + … + βnXn))
The LR model was implemented in Python 3 (scikit-learn) with L2 regularization using the four retained conditioning factors as predictors. For statistical evaluation on the held-out test subset, predicted probabilities were converted to binary flood/non-flood labels using the conventional 0.50 probability cutoff [48,49]. Predicted probabilities on the independent test set (consisting of 209,715 data points) were used to generate the LR ROC curve and compute the AUC.
3.5. Random Forest
RF constructs an ensemble of decision trees through bootstrap aggregation, with random feature subsampling at each node split to reduce inter-tree correlation [17,50]. The ArcGIS Pro implementation used: n_trees = 100; minimum leaf size = 1; depth range = 10–15; internal holdout = 10%; random seed = 735,701; output cell size = 31.86 m. Variable importance was assessed using two methods applied in parallel for direct comparison. First, ArcGIS Pro’s built-in Gini importance (mean decrease in node impurity across all trees) was extracted from the fitted model. Second, permutation importance was computed using sklearn.inspection.permutation_importance (n_repeats = 10, random_state = 42) on the independent test set of 209,715 observations [41,51,52]. Gini importance systematically overestimates the contribution of high-cardinality categorical variables because large classes yield larger absolute impurity reductions regardless of true predictive value [30,53]. Permutation importance avoids this bias by directly measuring the reduction in predictive accuracy when each feature’s values are randomly permuted—a model-agnostic, post hoc measure of true feature contribution [51,52]. Both sets of results are reported in full to quantify the magnitude and direction of cardinality bias in this national-scale dataset.
3.6. Gradient Boosting (XGBoost)
XGBoost builds an ensemble of trees sequentially, with each tree fitted to the negative gradient of a differentiable loss function applied to the residual errors from all preceding trees [18,54]. This boosting mechanism explicitly focuses learning on misclassified instances, making XGBoost particularly effective at minimizing false negatives in imbalanced classification tasks—a critical advantage in national-scale FSM, where missed flood pixels have direct life-safety implications [21,22,55]. The parameters used in ArcGIS Pro include method = GRADIENT_BOOSTED; n_trees = 100; mean depth = 6; learning rate (Eta) = 0.30; regularization Lambda = 1.00; Gamma = 0.00; internal holdout = 10%; and random seed = 94,423. Gain-based variable importance—the total reduction in the loss function attributable to each feature across all splits—was extracted from the fitted model for cross-model comparison.
3.7. Satellite-Driven Flood Inventory and Independent Checking Framework
In the absence of nationally consistent ground-based flood records, this study uses a satellite-based framework to generate physically informed flood-susceptibility training labels and to assess the model’s spatial consistency. DFO passive microwave radiometer river discharge records were extracted for major Nigerian river systems and used as upstream boundary conditions for the HEC-RAS 100-year flood simulation [40], following the methodology established by Idowu et al. [13] for data-sparse West African basins. The HEC-RAS simulation used spatially distributed Manning’s roughness coefficients assigned according to mapped land-cover classes, thereby representing spatial differences in surface resistance across the study area rather than applying arbitrary or spatially uniform roughness values. The resulting HEC-RAS 100-year floodplain delineates the national extent of flood susceptibility and serves as the binary flood/non-flood reference throughout this study. The 100-year return period applies only to the hydrodynamic scenario used to construct the flood-reference boundary and does not transfer to the resulting susceptibility models. FR, LR, RF, and XGBoost estimate relative spatial predisposition to flooding from the conditioning factors and therefore do not predict recurrence intervals. The 100-year scenario was used as a standardized national-scale hydraulic reference representing an extreme but physically plausible inundation footprint from which consistent flood/non-flood spatial relationships could be derived. Prior to downstream use, the HEC-RAS floodplain was independently verified for spatial plausibility through qualitative comparison with DFO historical flood extent polygons [31]—documented historical flood reports entirely independent of the HEC-RAS simulation. Strong spatial concordance suggested that the HEC-RAS simulation provides a plausible national-scale flood-susceptibility reference for training labels and consistency checks. The spatial consistency of all four flood susceptibility models relative to the HEC-RAS floodplain was then quantified by generating 3000 stratified random points across the entire study area (Figure 3) and computing confusion matrices [56]. This two-step approach—HEC-RAS results verified against DFO datasets and model results assessed against HEC-RAS results—constitutes a coherent satellite-to-susceptibility framework for FSM in gauge-sparse environments. This framework provides the training and consistency reference; an additional independent check against the 2022 Sentinel-1 SAR flood extent is described below. Importantly, the Sentinel-1 comparison was applied not only to the four flood susceptibility-model outputs but also directly to the HEC-RAS 100-year floodplain, thereby providing a quantitative event-based assessment of the hydrodynamic reference itself.
In addition to the qualitative DFO comparison, a quantitative independent check was conducted using Sentinel-1 Synthetic Aperture Radar (SAR) flood-extent mapping for the September–October 2022 flood event—Nigeria’s most severe flood on record—which affected the Niger–Benue corridor, the Lake Chad basin, and the Niger Delta. SAR-detected flood pixels of 12,644,095 were converted to point observations and overlaid with the HEC-RAS 100-year floodplain raster and each of the four binary susceptibility classification rasters from FR, LR, RF, and XGBoost modeling, with 1 indicating high susceptibility and 0 indicating low susceptibility. For each layer, the proportion of SAR-observed 2022 flood pixels falling within the high-susceptibility/100-year floodplain class was computed as the producer’s accuracy for the flood class—entirely independent of the model training dataset (Section 4.8).
3.8. Accuracy Assessment
Three complementary accuracy evaluation dimensions were used. Each evaluation differs in its independence from the HEC-RAS-derived flood reference. The detailed implementation of these evaluations is provided below.
First, held-out (test samples) predictive performance of LR, RF, and XGBoost was evaluated using the 20% test subset (209,715 data points), which was excluded from model fitting but retained HEC-RAS-derived flood/non-flood labels [46,57]. This assessment therefore measures generalization to unseen samples from the HEC-RAS-defined susceptibility pattern rather than external flood-event accuracy. For FR, AUC was computed from 1,048,575 pixel-level observations using sklearn roc_auc_score [43], with class scores mapped to FR values; OA, F1, recall, and false negatives are not applicable because FR produces a continuous susceptibility index.
Second, model spatial reproduction relative to the HEC-RAS 100-year floodplain was evaluated using overall accuracy, Kappa coefficient [58], and producer’s accuracy at 3000 stratified random points. Because the same HEC-RAS simulation underlies model development, these statistics are mainly interpreted as an internal spatial-consistency diagnostic and not as independent validation. The credibility of this consistency assessment rests on the prior qualitative verification of HEC-RAS relative to DFO historical flood polygons (Section 3.7). Kappa > 0.60 indicates substantial agreement, and 0.41–0.60 indicates moderate agreement [59].
Third, external event-based performance was assessed against the independently derived 2022 Sentinel-1 SAR flood extent. This was independently checked by overlaying 2022 flood extent points (12,444,033 after data cleaning) with the HEC-RAS floodplain and each model’s binary susceptibility classification, then computing producer’s accuracy for the flood class against an observed catastrophic flood event (Section 4.8).
4. Results
4.1. Multicollinearity and Sensitivity Assessment Results
VIF screening indicated no evidence of problematic multicollinearity among the six candidate conditioning factors. All values were substantially below the VIF > 10 threshold [43] (Table 2). Factor selection was therefore evaluated based on incremental predictive contribution and model parsimony using a controlled predictor-inclusion sensitivity analysis. The DEM–HAND–LULC–TWI configuration achieved an AUC of 0.936702 and an accuracy of 0.871763. Adding slope slightly reduced both AUC (0.936514) and accuracy (0.870483). Adding soil type produced a negligible increase in accuracy to 0.872195 but a slight decrease in AUC to 0.936632, indicating no meaningful overall improvement. Similarly, including both slope and soil type did not improve performance (AUC = 0.936589; accuracy = 0.870738). Across all expanded configurations, adding slope and/or soil type produced no meaningful gain over the DEM–HAND–LULC–TWI configuration. Accordingly, these four factors were retained because they achieved comparable or better predictive performance with fewer predictors, providing a more parsimonious model specification.
Table 2.
VIF diagnostic results for conditioning factors.
4.2. Frequency Ratio Analysis Results
HAND showed the most pronounced flood-association gradient across all factors: the very high class (FR = 3.453) versus the very low class (FR = 0.059) spans nearly a 60-fold range—the largest of any conditioning factor. Water/flooded vegetation LULC exhibited the highest single-class FR (3.626), consistent with its inherent association with permanent surface water and inundation [60]. TWI showed a strong monotonic positive gradient from very high (FR = 1.783) to very low (FR = 0.058) [38,61], while elevation exhibited a non-monotonic pattern with peak FR in the very low class (FR = 1.963) and moderate class (FR = 1.377), reflecting Nigeria’s floodplain geomorphology. PR weight ranking identified HAND as the most discriminative factor (PR = 2.17), followed by LULC (1.76), TWI (1.63), and elevation (1.48). FR AUC was computed at the pixel level from 1,048,575 stratified observations using sklearn roc_auc_score, with class scores mapped to full-raster FR values (Table 3). The combined FSI (sum of the four factor FR values per pixel) yielded an AUC of 0.929, indicating strong discrimination between flood and non-flood pixels. Per-factor AUC values further quantify each factor’s individual discriminative contribution: HAND = 0.931 (dominant), TWI = 0.726, elevation = 0.631, LULC = 0.586 (Table 3 and Table 4, and Figure 4). These per-factor values are fully consistent with the PR weight ranking and provide independent quantitative corroboration of HAND’s physical primacy as a national-scale flood predictor—a finding later reinforced by permutation importance analysis (Section 5.3).
Table 3.
Frequency ratio values for all conditioning factor classes.
Table 4.
FR predictive ratio (PR) weight ranking.
Figure 4.
National flood susceptibility map of Nigeria—frequency ratio model with five susceptibility classes, classified using Jenks Natural Breaks.
4.3. Logistic Regression Results
LR achieved an AUC of 0.948 and an overall accuracy of 87.5% on the independent test set. Logistic regression identified HAND as the strongest positive predictor of flood occurrence (β = 1.7184), followed by TWI (β = 0.3509), DEM (β = 0.2220), and LULC (β = 0.0514), consistent with the FR results (Section 4.2; synthesized in Section 5.1) [15,16,47]. The strongly negative intercept (β0 = −6.2333) sets a conservative baseline flood probability, contributing to the 12,197 false negatives recorded and reflecting the known conservative bias of logistic regression in spatially imbalanced flood classification contexts—examined further in Section 5.2 [16,48,49] (Table 5 and Figure 5).
Table 5.
Logistic regression model coefficients and interpretation.
Figure 5.
National flood susceptibility map of Nigeria—logistic regression model with five susceptibility classes, classified using Jenks Natural Breaks.
4.4. Random Forest Results
RF achieved an AUC of 0.956, an overall accuracy of 89.2%, and an F1 score of 0.89 on the independent test dataset. Two variable importance methods yielded markedly different rankings. ArcGIS Pro Gini importance ranked LULC first (39%), TWI second (27%), DEM third (25%), and HAND fourth (9%). Permutation importance produced a complete reversal: HAND ranked first (importance = 0.8326; 83% of total), followed by TWI (0.0791; 8%), DEM (0.0458; 5%), and LULC last (0.0425; 4%). The 20-fold difference between HAND and LULC permutation scores quantifies the cardinality bias embedded in the Gini result: LULC’s Rangeland class alone covers 643 million national pixels, thereby generating disproportionately large node impurity reductions at high-level tree splits, regardless of its actual predictive contribution [29,30]. Permutation importance—which measures the actual accuracy degradation when each feature is permuted on the held-out test set—is immune to this bias and identifies HAND as the most influential predictor [51,52] (Table 6 and Figure 6). This permutation ranking is corroborated by FR, LR, and XGBoost (Section 5.3).
Table 6.
Random Forest variable importance—Gini (ArcGIS Pro) vs permutation importance (scikit-learn, n_repeats = 10)—and classification report.
Figure 6.
National flood susceptibility map of Nigeria—Random Forest model with binary output.
4.5. XGBoost Results
XGBoost achieved an AUC of 0.956 and an overall accuracy of 89.2%, matching RF on both headline metrics. XGBoost recorded the fewest false negatives among the four models (8705 vs. RF’s 9594—a 9.3% reduction), consistent with the sequential boosting mechanism’s explicit focus on misclassified instances and its effectiveness at minimizing false negatives in imbalanced datasets [18,54,55]. Gain-based importance ranked HAND first (31%), followed by DEM (26%), LULC (22%), and TWI (21%) (Table 7 and Figure 7), aligning with the RF permutation importance ranking (Section 4.4).
Table 7.
XGBoost variable importance (gain) and classification report.
Figure 7.
National flood susceptibility map of Nigeria—XGBoost model with binary output.
4.6. Comprehensive Model Accuracy Assessment
Spatial comparison of the four model outputs shows broad agreement in the principal national flood-susceptibility patterns, particularly along the Niger–Benue drainage corridor and confluence, the northeastern lowlands toward the Lake Chad Basin, and the Niger Delta/coastal lowlands. Table 8 presents model performance across three complementary dimensions, each measuring a distinct aspect of model quality. Table 8a summarizes statistical discrimination and predictive performance, including training and held-out test results for LR, RF, and XGBoost, together with the full-sample FSI-based AUC for FR. Comparison of training and held-out test performance indicates stable generalization across the three supervised models. LR achieved training and test AUC values of 0.949 and 0.948, respectively, with corresponding overall accuracies of 0.877 and 0.875. RF yielded AUC values of 0.956 for both training and testing, with overall accuracy changing only from 0.893 to 0.892. XGBoost similarly yielded an AUC of 0.956 for both datasets and overall accuracy of 0.893 and 0.892 for training and testing, respectively. These small training–test differences indicate no appreciable evidence of overfitting under the adopted 80/20 partition. XGBoost recorded the fewest test-set false negatives (8705 compared with 9594 for RF), indicating the lowest omission of flood observations among the supervised models. Table 8 and Figure 8 also show LR, RF, and XGBoost achieving substantial agreement (Kappa = 0.662–0.700), while FR achieved moderate agreement (Kappa = 0.410). RF achieved the highest spatial consistency (Kappa = 0.700). Table 9 confirms that all four models exceed HEC-RAS’s flood-detection accuracy (93.81–94.50% vs. 90.26%), with LR achieving the highest SAR flood detection (94.50%). FR’s strong SAR performance (93.81%)—despite its moderate HEC-RAS Kappa—confirms that its broader susceptibility footprint captures real flood-prone terrain beyond the fixed 100-year floodplain boundary. No single model dominated across all three dimensions, collectively justifying the multi-model approach for national-scale FSM in data-sparse environments (Table 8 and Figure 9).
Table 8.
(a) Statistical discrimination and predictive accuracy metrics for the four flood-susceptibility approaches. (b) Internal spatial consistency of flood susceptibility model outputs relative to the HEC-RAS-derived flood reference.
Figure 8.
Confusion matrices for spatial consistency assessment of all four susceptibility models, compared with the HEC-RAS 100-year floodplain reference (N = 3000 stratified random points). TN = True Negative, FP = False Positive, FN = False Negative, TP = True Positive.
Table 9.
External event-based evaluation of flood susceptibility models against the independent 2022 Sentinel-1 SAR-observed flood extent.
Figure 9.
ROC curves for all four national-scale flood susceptibility models in Nigeria. The FR ROC curve was based on FSI scores from 1,048,575 pixel-level observations; AUC = 0.929 (sklearn roc_auc_score, exact pixel-level result). LR, RF, and XGBoost ROC curves were generated from predicted probabilities on the independent test dataset of 209,715 data points.
4.7. HEC-RAS Validation Against DFO Historical Flood Records
Figure 10 presents the HEC-RAS 100-year floodplain simulation driven by DFO satellite-derived river discharge, overlaid with DFO historical flood extent polygons to assess plausibility. The DFO polygons represent documented historical flood reports—compiled from news, government, and remote sensing sources—and are entirely independent of the HEC-RAS simulation, providing one of the few independent references available at the national scale in this data-sparse environment. Strong spatial concordance is observed between the HEC-RAS-simulated floodplain and DFO-documented historical extents across three primary zones of known flood exposure: the Niger–Benue confluence at Lokoja, the northeastern corridor toward Lake Chad, and the Niger Delta coastal lowlands [5,9,34] (Figure 10). This qualitative concordance supports using the HEC-RAS simulation as a plausible national-scale flood susceptibility reference before using it as training labels for the four susceptibility models and as the spatial consistency reference in Table 8b. This qualitative concordance is complemented by a quantitative check against the 2022 Sentinel-1 SAR flood extent (see Section 4.8).
Figure 10.
HEC-RAS 100-year floodplain model for Nigeria, driven by DFO satellite-derived river discharge. Hatched polygons indicate the DFO historical flood report extents used to qualitatively verify the HEC-RAS simulation.
4.8. Quantitative Independent Evaluation Against the 2022 Sentinel-1 SAR Flood Extent
Table 9 provides a quantitative event-based evaluation of both the HEC-RAS 100-year floodplain and the four flood-susceptibility outputs using 12,444,033 independently observed Sentinel-1 SAR flood pixels from the September–October 2022 event (Figure 11). The HEC-RAS floodplain captured 11,231,426 of these observed flood pixels, corresponding to a flood-class producer’s accuracy of 90.26%. This metric quantifies the proportion of independently observed flood pixels captured by the simulated 100-year floodplain. Here, the SAR dataset represents observed flood pixels. Furthermore, all four susceptibility models achieved consistently high flood-class detection against the independent 2022 Sentinel-1 SAR extent, ranging from 93.81% to 94.50%. Across all models, the higher flood-class detection relative to the HEC-RAS reference provides external evidence that the susceptibility patterns learned from the HEC-RAS-derived reference are spatially consistent with the independently observed 2022 flood extent. Notably, FR achieves 93.81% SAR accuracy despite its moderate HEC-RAS spatial consistency (Kappa = 0.410), directly demonstrating that spatial consistency against a fixed-return-period boundary and real-event flood detection are complementary dimensions of model quality. The remaining 5.50–6.19% of SAR-observed flood pixels not captured by each model are flood-class omission errors most plausibly attributable to drivers outside the four conditioning factors rather than to a deficiency in the HAND-TWI-DEM-LULC framework itself.
Figure 11.
Sentinel-1 SAR-derived flood extent for the September–October 2022 event across Nigeria, used as the independent reference for the producer’s accuracy assessment in Table 9 (Section 4.8).
5. Discussion
5.1. Complementary Strengths of Statistical and Machine Learning Models
The three-tier accuracy assessment reveals that statistical and ML approaches deliver distinct, complementary predictive capabilities, with no single model dominating across all evaluation dimensions. On statistical accuracy (Table 8a), performance scales with model complexity: FR (AUC = 0.929) provides physically interpretable bivariate susceptibility gradients driven by HAND’s class-level frequency ratios; LR (AUC = 0.948) improves discrimination through multivariate coefficient calibration, with HAND (β = 1.7184) directly quantifying its log-odds contribution [15,16,23]; RF and XGBoost (AUC = 0.956) achieve the highest discrimination by capturing nonlinear factor interactions through ensemble tree learning [17,18,21,26,27]. XGBoost recorded the fewest false negatives (8705 vs. RF’s 9594—a 9.3% reduction) attributable to the boosting mechanism’s focus on misclassified instances [54,55], making it the recommended model for operational applications where missed flood pixels carry direct life-safety consequences [21,22]. On spatial consistency against HEC-RAS (Table 8b), LR, RF, and XGBoost achieve substantial agreement (Kappa = 0.662–0.700), while FR achieves moderate agreement (Kappa = 0.410). FR’s lower Kappa reflects its broader binarized footprint—the Jenks Natural Breaks threshold includes moderate susceptibility zones extending beyond the HEC-RAS 100-year boundary—rather than a fundamental discriminative weakness. This distinction is confirmed by the independent SAR check (Table 9): FR achieves 93.81% producer’s accuracy against the 2022 Sentinel-1 flood extent, nearly identical to RF (93.87%) and XGBoost (93.94%), while LR achieves the highest SAR flood detection (94.50%). All four models exceed HEC-RAS’s own accuracy against the 2022 event (90.26%), indicating that the conditioning-factor relationships learned from HEC-RAS labels generalize beyond the fixed 100-year boundary to real flood occurrence. This three-tier comparison—statistical accuracy, spatial consistency, and real-event flood detection—supports multi-model FSM over single-model reliance [11,12] consistent with findings by Ahmad et al. [64] and El-Haddad et al. [65] at comparable spatial scales.
5.2. LR Conservative Classification Bias and Threshold Implications
LR achieved the highest flood zone producer accuracy against the HEC-RAS reference (C1 = 0.911) among the four models, correctly identifying 91.1% of HEC-RAS-defined flood pixels in its binary output. Its non-flood producer accuracy (C0 = 0.830) is lower than RF (C0 = 0.884) and XGBoost (C0 = 0.885), indicating that LR’s binary susceptibility footprint extends into some areas that HEC-RAS classifies as non-flood. The LR model produces continuous flood probabilities. For statistical evaluation, a 0.50 probability cutoff was used to classify test observations as flood or non-flood. For national susceptibility mapping, the continuous LR probability surface was instead divided into five susceptibility classes using Jenks Natural Breaks. These procedures served different purposes: the former supported binary performance assessment, whereas the latter supported spatial representation of relative flood susceptibility. Optimization of an operational probability threshold was beyond the scope of this study. Furthermore, LR’s AUC on the statistical test set (0.948) is strong but below RF and XGBoost (0.956), reflecting the linear decision boundary’s reduced capacity to resolve the nonlinear HAND gradient that RF and XGBoost capture through recursive partitioning [17,18,22]. The intercept (β0 = −6.2333) imposes a conservative baseline flood probability at low conditioning factor scores, which is appropriate for national-scale susceptibility mapping but means that threshold selection significantly influences the spatial extent of the binary output [16,48,49]. Optimizing the binarization threshold below the moderate class boundary could improve C0 precision without materially reducing C1 recall [66]. Overall, LR strikes the strongest balance between interpretability (coefficient-level factor attribution) and flood-detection performance, making it a useful complement to the ML ensembles for evidence-based flood risk communication.
5.3. Gini Cardinality Bias and Resolution via Permutation Importance
ArcGIS Pro’s Gini importance ranked LULC as the dominant RF conditioning factor (39%), with HAND fourth (9%), contradicting all three other model rankings: FR predictive ratio (HAND rank 1: PR = 2.17), LR coefficients (HAND rank 1: β = 1.7184), and XGBoost gain (HAND rank 1: 31%). This four-way contradiction prompted a permutation importance analysis (scikit-learn, n_repeats = 10, random_state = 42). The result was clear: HAND ranked first (0.8326; 83%) and LULC ranked last (0.0425; 4%)—a reversal of the Gini ranking. The mechanism is well established [30,53]: Gini importance accumulates node impurity reductions across all tree splits, and LULC’s Rangeland class alone covers 643 million national pixels, generating disproportionately large impurity reductions regardless of LULC’s actual predictive contribution. Permutation importance directly measures the accuracy degradation when each feature is permuted on the held-out test set: HAND’s removal reduces accuracy by 0.8326, compared with just 0.0425 for LULC—a 20-fold difference that is immune to cardinality bias [51,52]. The reversal is further corroborated by two independent lines of evidence: FR per-factor AUC (HAND = 0.931 vs. LULC = 0.586, a 59% difference via an entirely different methodological pathway) and LR coefficients (HAND β = 1.7184 is 33 times larger than LULC β = 0.0514). The convergence of four independent methods constitutes, to the authors’ knowledge, the most extensively corroborated diagnosis and correction of Gini cardinality bias reported to date in the FSM literature at the national scale. The practical implication is direct and serious: RF-based FSM studies that report only platform-default Gini importance—as is standard practice in ArcGIS Pro workflows—may systematically misattribute flood predictive importance to high-cardinality land cover classes at the expense of physically dominant topographic predictors, with downstream consequences for conditioning factor selection, map interpretation, and evidence-based flood policy [51,52,53].
5.4. Satellite Earth Observation as a Validation Resource in Data-Sparse Environments
Nigeria’s severely degraded hydrometric monitoring network renders conventional gauge-driven FSM inapplicable at the national scale. This study addresses this through a coherent satellite-driven framework with two distinct steps. In the first step, DFO passive microwave satellite discharge drives HEC-RAS to generate a physically grounded 100-year floodplain—transforming satellite observations into a nationally consistent flood reference without ground-based gauges [13,31,32]. The HEC-RAS floodplain is then independently verified against DFO-documented historical flood reports—one of the few independent references available at the national scale—confirming spatial plausibility before downstream use. In the second step, the HEC-RAS floodplain serves as the flood reference in two distinct ways: for FR, it defines flood pixel membership for deterministic class-level frequency ratio computation across the full national raster; for LR, RF, and XGBoost, it generates binary flood/non-flood training labels (N = 1,048,575; 80/20 split) for supervised model fitting. FR and LR outputs are then binarized, while RF and XGBoost produce direct binary predictions; all four binary maps are assessed for spatial consistency against the same HEC-RAS reference (Table 8b). Because FR’s frequency ratios and LR/RF/XGBoost’s training labels both derive from the same HEC-RAS simulation, Table 8b quantifies spatial generalization fidelity rather than independent validation. The objective was not to independently validate the HEC-RAS simulation itself, but to evaluate whether susceptibility models derived from its output could reproduce a physically based floodplain representation from satellite-informed hydrodynamic modeling, and whether that representation generalizes to an observed flood event. The independent Sentinel-1 SAR check (Table 9) directly addresses this: all four models exceed HEC-RAS’s own SAR flood detection accuracy (93.81–94.50% vs. 90.26%), confirming that the satellite-driven framework produces susceptibility maps that generalize to real catastrophic flood occurrence. FR’s strong SAR performance (93.81%) despite its moderate HEC-RAS Kappa (0.410) further illustrates that spatial consistency against a fixed return-period boundary and real-event flood detection are complementary rather than identical dimensions of model quality. This framework—DFO discharge to HEC-RAS to susceptibility models to SAR validation—is directly transferable to other gauge-sparse nations across sub-Saharan Africa [67,68].
A further check using Sentinel-1 SAR-derived 2022 flood extent [35]—independent of model training data—shows that all four susceptibility models align more closely with the actual spatial pattern of Nigeria’s most severe documented flood event (93.81–94.50%) than the HEC-RAS 100-year floodplain itself (90.26%). Because the models were trained on HEC-RAS labels with only moderate-to-substantial spatial consistency (Kappa = 0.410–0.700, Table 8b), this suggests that the conditioning-factor relationships learned during training generalize beyond the specific HEC-RAS boundary in a way that aligns with real flood occurrence—supporting the validity of the satellite-driven training framework as a whole, rather than constituting a direct test of HEC-RAS’s own accuracy. To be explicit about the study’s validation logic: the objective was not to independently validate the HEC-RAS simulation itself, but to evaluate whether susceptibility models trained on its output could reproduce a physically based floodplain representation derived from satellite-informed hydrodynamic modeling, and whether that representation generalizes to an observed flood event.
5.5. Comparison with Related FSM Studies
The model performance achieved in this study is broadly consistent with comparable national and the regional FSM literature, situating the present work within an emerging body of evidence for data-driven national-scale flood susceptibility assessment. Ahmad et al. [64] reported strong ML-based FSM performance for the Hunza-Nagar region using a HEC-RAS-integrated training framework—a methodological parallel that corroborates the validity of satellite-informed hydrodynamic modeling as a physically grounded flood reference for susceptibility model training in gauge-sparse environments. The present study’s ML results are consistent with and extend this approach to a far larger national territory. El-Haddad et al. [65] demonstrated the feasibility of national-scale FSM in data-sparse environments using AHP-GIS for Saudi Arabia, achieving strong agreement between the susceptibility map and observed flood locations—supporting the broader finding that nationally consistent susceptibility baselines are achievable where ground-based flood records are limited. Vojtek and Vojteková [69] similarly demonstrated national-scale FSM viability for Slovakia using AHP, validating susceptibility outputs against 1513 historical flood points and finding strong coincidence with high and very high-susceptibility zones—consistent with this study’s finding that conditioning-factor-driven susceptibility models reliably identify flood-prone territory across physiographically diverse national landscapes. Agoha et al. [70] and Ekanem et al. [71] identified drainage proximity and low-lying topographic position as dominant flood determinants in southeastern Nigeria—directly consistent with HAND’s cross-model dominance at the national scale in the present study, extending this sub-national finding to the full national territory for the first time. Taubenböck et al. [28] provided a contemporaneous national-scale data-driven FSM assessment of Nigeria, corroborating the feasibility of ML-based national FSM and validating the outputs against the 2022 flood event. The present study complements this work by contributing a bivariate FR component with pixel-level AUC assessment, HAND-focused conditioning factor analysis across four model classes, diagnosis and correction of Gini cardinality bias in RF variable importance, and a three-tier accuracy framework integrating statistical assessment, HEC-RAS spatial consistency, and independent Sentinel-1 SAR validation—dimensions not addressed in prior Nigerian or comparable national-scale FSM studies.
5.6. Implications for Flood Risk Management in Nigeria
This study’s contributions extend beyond Nigeria. The national FSM baseline—among the first for Nigeria at this resolution and the first to integrate a bivariate FR component with HAND-focused conditioning factor analysis—provides NEMA and state-level authorities with the spatial intelligence needed for evidence-based flood risk decision-making: prioritizing emergency response along the Niger–Benue corridor and Niger Delta, directing infrastructure investment to chronically exposed riparian communities, implementing land-use zoning to reduce settlement in very favorable HAND zones, and deploying an early warning targeted at the highest-susceptibility corridors consistently identified across all four models. The finding of Gini cardinality bias serves as a direct methodological warning for the global FSM community: any RF-based FSM study using ArcGIS Pro or similar platforms that reports only Gini importance in landscapes with large categorical land cover classes should validate variable rankings with permutation importance. The satellite-driven framework—DFO river discharge to HEC-RAS floodplain to model training and spatial consistency assessment—is directly transferable to other West African nations facing identical gauging deficits: Ghana, Cameroon, Benin, Niger, and Mali [13,67,68]. The cross-model HAND dominance finding reinforces the case for prioritizing drainage proximity as a primary conditioning factor in FSM studies across tropical and subtropical fluvial landscapes [38,63].
5.7. Limitations
Key limitations of this study include the following: (1) The dynamic flood drivers—rainfall intensity, antecedent soil moisture, and drainage infrastructure—were excluded due to national-scale data constraints; future studies should incorporate high-resolution precipitation [72] and satellite-derived soil moisture products. (2) For spatial comparison of the mapped susceptibility outputs, the moderate–very high susceptibility classes were treated as the flood-susceptible category for FR and LR. This map-binarization rule is distinct from the 0.50 probability cutoff used for LR statistical test-set classification and was not optimized against the HEC-RAS boundary. More generally, model-specific probability-threshold optimization—including precision–recall or F2-based operating-point analysis—was beyond the scope of the present national-scale model comparison and should be investigated in future operational studies where the relative costs of false-negative and false-positive classifications can be explicitly defined. (3) The flood inventory and spatial consistency reference (Table 8b) both derive from the same HEC-RAS 100-year simulation, constituting internal consistency rather than independent validation of the models; the Sentinel-1 SAR check (Table 9) provides an independent external reference confirming that all four models generalize to a real flood event, but it reflects a single catastrophic event rather than the full range of susceptibility conditions. (4) As with national-scale hydrodynamic modeling based on remotely sensed inputs, the HEC-RAS floodplain is subject to inherent uncertainty associated with terrain representation, remotely sensed discharge observations, hydraulic parameterization, and spatial data alignment. In this study, the DEM was hydrologically conditioned before analysis, and Manning’s roughness coefficients were spatially assigned from mapped land-cover classes. DFO passive-microwave observations provided spatially consistent discharge information where national gauge coverage is limited. These considerations should be taken into account when interpreting the HEC-RAS-derived flood reference and downstream susceptibility results. (5) The FR AUC (0.929) was computed from a stratified pixel sample (N = 1,048,575; 66% flood) reflecting standard oversampling practice [42,49]. (6) Static susceptibility maps do not capture temporal dynamics of flood exposure under future climate projections [2,73]. (7) Predictor importance was assessed for Nigeria as a whole rather than for individual regions or subbasins. Therefore, the national ranking does not mean that the same factors are equally important everywhere in the country. The relative importance of HAND, TWI, LULC, elevation, and other factors may vary by region and should be examined in future studies. (8) The hydrodynamic flood reference was derived from a single 100-year return-period scenario. Although the resulting susceptibility models represent relative spatial predisposition rather than a 100-year recurrence probability, use of alternative HEC-RAS return-period scenarios could modify the spatial extent of the flood-reference labels and consequently influence model development. Future studies should examine multiple hydraulic return periods to assess the sensitivity of national-scale susceptibility patterns to the choice of reference scenario.
6. Conclusions
This study achieved four principal contributions to the FSM literature, assessed across three complementary accuracy dimensions. First, it produced among the earliest nationally consistent, multi-model flood susceptibility assessments for Nigeria using FR, LR, RF, and XGBoost at 30 m resolution, based on 1,048,575 HEC-RAS-derived observations. It presents a bivariate FR component, HAND-focused factor analysis, and satellite-driven training framework. Second, it established HAND as the most influential conditioning factor across all four model classes and two importance metrics. Third, it diagnosed, quantified, and corrected Gini cardinality bias in RF variable importance using permutation importance, corroborated by three independent methods. Fourth, it established a satellite-driven FSM framework—DFO discharge driving HEC-RAS, verified against DFO documented historical flood reports, with model spatial consistency assessed against the HEC-RAS reference and independently checked against the 2022 Sentinel-1 SAR flood extent. The following specific conclusions are drawn:
- Four complementary model classes provide distinct and mutually reinforcing flood susceptibility intelligence across Nigeria’s 923,768 km2 territory, assessed across three accuracy dimensions. Statistical accuracy increases with model complexity (FR AUC = 0.929, LR = 0.948, RF/XGBoost = 0.956). Internal comparison with the HEC-RAS reference demonstrated how faithfully the four susceptibility approaches reproduced the hydrodynamically derived spatial pattern; these comparisons are not interpreted as independent validation. External event-based evidence was instead provided by the 2022 Sentinel-1 SAR flood extent, against which the four susceptibility models captured 93.81–94.50% of observed flood pixels. For operational flood risk management, where minimizing missed flood areas is paramount, XGBoost is recommended—achieving the fewest false negatives while matching RF in classification accuracy and spatial consistency. No single model dominated across all dimensions, justifying the multi-model approach.
- At the national scale, HAND is identified as the most influential flood conditioning factor across all four model classes—FR predictive ratio, LR coefficients, XGBoost gain importance, and RF permutation importance—and this finding is corroborated by per-factor AUC analysis. This cross-model convergence indicates a strong overall national contribution of drainage-relative elevation to flood susceptibility but should not be interpreted as evidence that HAND is locally dominant within every physiographic setting.
- Default Gini-based variable importance in ArcGIS Pro produces a complete reversal of true feature importance when high-cardinality land cover data are present—mis-ranking HAND from first to fourth and LULC from last to first. Permutation importance resolves this bias and should be used as standard practice alongside Gini importance in any RF-based FSM study using categorical land cover datasets, particularly on platforms where it is not computed by default.
- A satellite-driven FSM framework is established and shown to be replicable in gauge data-sparse environments: DFO passive microwave discharge drives HEC-RAS to generate physically grounded flood susceptibility training labels; the HEC-RAS floodplain is independently verified against DFO-documented historical flood report extents; and model outputs are assessed for spatial consistency against the verified hydrodynamic reference. This framework—with its explicit distinction between spatial consistency assessment and independent validation—is directly transferable to other data-sparse nations across sub-Saharan Africa. A check against the 2022 Sentinel-1 SAR-observed flood extent (N = 12,444,033) shows that all four models align with this real catastrophic event at least as well as HEC-RAS itself (93.81–94.50% vs. 90.26%), supporting the generalizability of the satellite-driven training framework.
Future research should incorporate dynamic flood drivers (rainfall, soil moisture, and dam release records), explore deep learning architectures, leverage SWOT satellite altimetry to improve discharge estimation, and develop climate-change-informed susceptibility projections under CMIP6 scenarios [2,72,73].
Author Contributions
Conceptualization, D.I. and W.Z.; methodology, D.I.; software, D.I.; validation, D.I., J.B., and W.Z.; formal analysis, D.I.; investigation, D.I.; resources, D.I.; data curation, D.I.; writing—original draft preparation, D.I.; writing—review and editing, D.I., J.B., and W.Z.; visualization, D.I.; supervision, W.Z.; project administration, W.Z. All authors have read and agreed to the published version of the manuscript.
Funding
This research received no external funding.
Data Availability Statement
Datasets used in this study are from public domain resources: (1) NASA DEM data are freely available from NASA/USGS EarthExplorer at https://earthexplorer.usgs.gov/ (accessed on 20 April 2025). (2) DFO satellite-derived river discharge data and documented historical flood reports are publicly available at https://floodobservatory.colorado.edu/ (accessed on 20 April 2025). (3) Sentinel-1 SAR-derived 2022 flood extent data for Nigeria are freely available via the Copernicus Open Access Hub (https://dataspace.copernicus.eu/) (accessed on 20 April 2025). Additional data are available from the corresponding author upon reasonable request.
Acknowledgments
The authors acknowledge the Dartmouth Flood Observatory for maintaining publicly accessible satellite-derived river discharge records used as HEC-RAS boundary conditions and for documenting historical flood report archives used as an independent plausibility reference for the HEC-RAS simulation underpinning this study. The authors also acknowledge the ESRI Sentinel-2 Land Cover team and NASA/USGS for freely accessible remote sensing data products.
Conflicts of Interest
The authors declare no conflicts of interest.
Abbreviations
The following abbreviations are used in this manuscript:
| FSM | Flood Susceptibility Mapping |
| FR | Frequency Ratio |
| LR | Logistic Regression |
| RF | Random Forest |
| XGBoost | Extreme Gradient Boosting |
| HAND | Height Above Nearest Drainage |
| TWI | Topographic Wetness Index |
| DEM | Digital Elevation Model |
| LULC | Land Use/Land Cover |
| DFO | Dartmouth Flood Observatory |
| AUC | Area Under the ROC Curve |
| OA | Overall Accuracy |
| VIF | Variance Inflation Factor |
| NEMA | National Emergency Management Agency |
| HWSD | Harmonized World Soil Database |
| FAO | Food and Agriculture Organization |
| SRTM | Shuttle Radar Topography Mission |
| ML | Machine Learning |
| GIS | Geographic Information System |
| ESRI | Environmental Systems Research Institute |
References
- UNDRR. Global Assessment Report on Disaster Risk Reduction 2022; UNDRR: Geneva, Switzerland, 2022. [Google Scholar]
- IPCC. Climate Change 2021: The Physical Science Basis; Cambridge University Press: Cambridge, UK, 2023. [Google Scholar] [CrossRef] [Scilit]
- Garcia-Rosabel, S.; Idowu, D.; Zhou, W. At the intersection of flood risk and social vulnerability: A case study of New Orleans, Louisiana, USA. GeoHazards 2024, 5, 866–885. [Google Scholar] [CrossRef] [Scilit]
- Nkwunonwo, U.C.; Whitworth, M.; Baily, B. A review and critical analysis of the efforts towards urban flood risk management in the Lagos region of Nigeria. Nat. Hazards Earth Syst. Sci. 2020, 20, 549–567. [Google Scholar]
- Aich, V.; Koné, B.; Hattermann, F.F.; Müller, E.N. Floods in the Niger basin—Analysis and attribution. Nat. Hazards Earth Syst. Sci. Dis. 2014, 2, 5171–5212. [Google Scholar]
- Idowu, D.; Zhou, W. Global megacities and frequent floods: Correlation between urban expansion patterns and urban flood hazards. Sustainability 2023, 15, 2514. [Google Scholar] [CrossRef] [Scilit]
- Tang, W.; Kumar, R.; Del Moral Méndez, A.; Ahafianyo, F.; Akinsanola, A.A.; Ameko, A.; Dekker, M.; Fu, R.; Gaubert, B.; Hagos, S.; et al. The UCAR Africa initiative: Recent insights, challenges, and opportunities to foster collaborative research for environmental sustainability. Bull. Am. Meteorol. Soc. 2026, 107, E718–E741. [Google Scholar] [CrossRef] [Scilit]
- NEMA. 2022 Annual Report on Flood and Other Disasters in Nigeria; NEMA: Abuja, Nigeria, 2022.
- Idowu, D.; Zhou, W. Performance evaluation of a potential component of an early flood warning system—A case study of the 2012 flood, Lower Niger River Basin, Nigeria. Remote Sens. 2019, 11, 1970. [Google Scholar] [CrossRef] [Scilit]
- Idowu, D.; Zhou, W. Land use and land cover change assessment in the context of flood hazard in Lagos State, Nigeria. Water 2021, 13, 1105. [Google Scholar] [CrossRef] [Scilit]
- Idowu, D. Assessing the Utilization of Remote Sensing and GIS Techniques for Flood Studies and LULC Analysis Through Case Studies in Nigeria and the USA. Ph.D. Thesis, Colorado School of Mines, Golden, CO, USA, 2021. [Google Scholar]
- Idowu, D.; Peter, B.G.; Boakye, J.; Cohen, S.; Carter, E. An evaluation of earth observation products for catchment-scale operational flood monitoring and risk management in sparsely gauged to ungauged river basin. SSRN 2024. [Google Scholar] [CrossRef] [Scilit]
- Idowu, D.; Peter, B.G.; Boakye, J.; Cohen, S.; Carter, E. Evaluating Earth observation products for Catchment-Scale operational flood monitoring and risk management in a sparsely gauged to ungauged river basin in Nigeria. Int. J. Appl. Earth Obs. Geoinf. 2025, 138, 104445. [Google Scholar] [CrossRef] [Scilit]
- Lee, S.; Pradhan, B. Landslide hazard mapping using frequency ratio and logistic regression. Landslides 2007, 4, 33–41. [Google Scholar] [CrossRef] [Scilit]
- Samanta, S.; Pal, D.K.; Palsamanta, B. Flood susceptibility analysis through remote sensing, GIS and frequency ratio model. Appl. Water Sci. 2018, 8, 66. [Google Scholar] [CrossRef] [Scilit]
- Hosmer, D.W.; Lemeshow, S.; Sturdivant, R.X. Applied Logistic Regression, 3rd ed.; Wiley: Hoboken, NJ, USA, 2013. [Google Scholar]
- Breiman, L. Random forests. Mach. Learn. 2001, 45, 5–32. [Google Scholar] [CrossRef] [Scilit]
- Chen, T.; Guestrin, C. XGBoost: A scalable tree boosting system. In Proceedings of the 22nd ACM Sigkdd International Conference on Knowledge Discovery and Data Mining, San Francisco, CA, USA, 13–17 August 2016; pp. 785–794. [Google Scholar]
- Tehrany, M.S.; Pradhan, B.; Jebur, M.N. Flood susceptibility mapping using ensemble weights-of-evidence and SVM models in GIS. J. Hydrol. 2014, 512, 332–343. [Google Scholar] [CrossRef] [Scilit]
- Rahmati, O.; Pourghasemi, H.R.; Zeinivand, H. Flood susceptibility mapping using FR and weights-of-evidence in Iran. Geocarto Int. 2016, 31, 42–70. [Google Scholar] [CrossRef] [Scilit]
- Band, S.S.; Janizadeh, S.; Chandra Pal, S.; Saha, A.; Chakrabortty, R.; Shokri, M.; Mosavi, A. Novel Ensemble Approach of Deep Learning Neural Network (DLNN) Model and Particle Swarm Optimization (PSO) Algorithm for Prediction of Gully Erosion Susceptibility. Sensors 2020, 20, 5609. [Google Scholar] [CrossRef] [Scilit] [PubMed]
- Abedi, R.; Costache, R.; Shafizadeh-Moghadam, H.; Pham, Q.B. Flash-flood susceptibility mapping based on XGBoost, random forest and boosted regression trees. Geocarto Int. 2022, 37, 5479–5496. [Google Scholar] [CrossRef] [Scilit]
- Pradhan, B. Flood susceptible mapping and risk area delineation using logistic regression, GIS and remote sensing. J. Spat. Hydrol. 2010, 9, 1–18. [Google Scholar]
- Tehrany, M.S.; Jones, S.; Shabani, F. Identifying essential flood conditioning factors for bivariate statistical FSM. Catena 2019, 175, 52–70. [Google Scholar]
- Pham, B.T.; Avand, M.; Janizadeh, S.; Van Phong, T.; Al-Ansari, N.; Ho, L.S.; Das, S.; Van Le, H.; Amini, A.; Bozchaloei, S.K.; et al. GIS-based hybrid computational approaches for flash flood susceptibility. Water 2021, 13, 83. [Google Scholar] [CrossRef] [Scilit]
- Ahmad, I.; Farooq, R.; Ashraf, M.; Waseem, M.; Shangguan, D. Improving flood hazard susceptibility assessment by integrating hydrodynamic modeling with remote sensing and ensemble ML. Nat. Hazards 2025, 12, 7839–7868. [Google Scholar] [CrossRef] [Scilit]
- Khosravi, K.; Shahabi, H.; Pham, B.T.; Adamowski, J.; Shirzadi, A.; Pradhan, B.; Dou, J.; Ly, H.B.; Gróf, G.; Ho, H.L.; et al. A comparative assessment of flood susceptibility modeling using multi-criteria decision-making analysis and machine learning methods. J. Hydrol. 2019, 573, 311–323. [Google Scholar] [CrossRef] [Scilit]
- Montien Tique, W.F.; Fabian, W.; Sapena, M.; Weigand, M.; Groth, S.; Geiß, C.; Taubenböck, H. A comparative assessment of data-driven flood susceptibility mapping in Nigeria. Nat. Hazards 2026, 122, 139–160. [Google Scholar] [CrossRef] [Scilit]
- Strobl, C.; Boulesteix, A.L.; Zeileis, A.; Hothorn, T. Bias in random forest variable importance measures. BMC Bioinform. 2007, 8, 25. [Google Scholar] [CrossRef] [Scilit] [PubMed]
- Genuer, R.; Poggi, J.M.; Tuleau-Malot, C. Variable selection using random forests. Pattern Recognit. Lett. 2010, 31, 2225–2236. [Google Scholar] [CrossRef] [Scilit]
- Brakenridge, G.R.; Nghiem, S.V.; Anderson, E.; Mic, R. Orbital microwave measurement of river discharge and ice status. Water Resour. Res. 2007, 43, W04405. [Google Scholar] [CrossRef] [Scilit]
- Kettner, A.J.; Brakenridge, G.R.; Schumann, G.J.P. Satellite-Based Flood Detection for Hydrological Model Calibration. In 2019 IEEE International Geoscience and Remote Sensing Symposium (IGARSS); IEEE: Piscataway, NJ, USA, 2019; pp. 5025–5028. [Google Scholar]
- Tarhule, A. Damaging rainfall and flooding: The other Sahel hazards. Clim. Change 2005, 72, 355–377. [Google Scholar] [CrossRef] [Scilit]
- Okonkwo, C.; Demoz, B.; Sakai, R.; Ichoku, C.; Anarado, C.; Adegoke, J.; Amadou, A.; Abdullahi, S.I. Combined effect of El Niño southern oscillation and Atlantic multidecadal oscillation on Lake Chad level variability. Cogent Geosci. 2015, 1, 1117829. [Google Scholar] [CrossRef] [Scilit]
- Idowu, D.; Zhou, W. Spatiotemporal evaluation of flood potential indices for watershed flood prediction in the Mississippi River basin, USA. Environ. Eng. Geosci. 2021, 27, 319–330. [Google Scholar]
- Gholamy, A.; Kreinovich, V.; Kosheleva, O. Why 70/30 or 80/20 Relation Between Training and Testing Sets: A Pedagogical Explanation. Departmental Technical Reports (CS). 2018. 1209. Technical Report UTEP-CS-18-09. Available online: https://scholarworks.utep.edu/cs_techrep/1209 (accessed on 20 July 2026).
- Crippen, R.; Buckley, S.; Agram, P.; Belz, E.; Gurrola, E.; Hensley, S.; Kobrick, M.; Lavalle, M.; Martin, J.; Neumann, M.; et al. NASADEM global elevation model: Methods and progress. Int. Arch. Photogramm. Remote Sens. Spat. Inf. Sci. 2016, 41, 125–128. [Google Scholar] [CrossRef] [Scilit]
- Beven, K.J.; Kirkby, M.J. A physically based, variable contributing area model of basin hydrology. Hydrol. Sci. Bull. 1979, 24, 43–69. [Google Scholar] [CrossRef] [Scilit]
- Nobre, A.D.; Cuartas, L.A.; Hodnett, M.; Rennó, C.; Rodrigues, G.; Silveira, A.; Waterloo, M.; Saleska, S. Height Above the Nearest Drainage—A hydrologically relevant new terrain model. J. Hydrol. 2011, 404, 13–29. [Google Scholar] [CrossRef] [Scilit]
- Brunner, G.W. HEC-RAS River Analysis System: Hydraulic Reference Manual, Version 6.3; USACE HEC: Davis, CA, USA, 2021. [Google Scholar]
- Scikit-learn. Machine Learning in Python. J. Mach. Learn. Res. 2011, 12, 2825–2830. [Google Scholar]
- O’Brien, R.M. A caution regarding rules of thumb for variance inflation factors. Qual. Quant. 2007, 41, 673–690. [Google Scholar] [CrossRef] [Scilit]
- Dormann, C.F.; Elith, J.; Bacher, S.; Buchmann, C.; Carl, G.; Carré, G.; Marquéz, J.R.G.; Gruber, B.; Lafourcade, B.; Leitão, P.J.; et al. Collinearity: A review of methods to deal with it. Ecography 2013, 36, 27–46. [Google Scholar] [CrossRef] [Scilit]
- Tehrany, M.S.; Pradhan, B.; Jebur, M.N. Spatial prediction of flood susceptible areas using DT and novel ensemble bivariate and multivariate statistical models in GIS. J. Hydrol. 2013, 504, 69–79. [Google Scholar] [CrossRef] [Scilit]
- Jenks, G.F. The data model concept in statistical mapping. Int. Yearb. Cartogr. 1967, 7, 186–190. [Google Scholar]
- Hanley, J.A.; McNeil, B.J. The meaning and use of the area under a ROC curve. Radiology 1982, 143, 29–36. [Google Scholar] [CrossRef] [Scilit] [PubMed]
- Pradhan, B.; Lee, S. Delineation of landslide hazard areas using frequency ratio, logistic regression, and ANN models. Environ. Earth Sci. 2010, 60, 1037–1054. [Google Scholar] [CrossRef] [Scilit]
- King, G.; Zeng, L. Logistic regression in rare events data. Political Anal. 2001, 9, 137–163. [Google Scholar] [CrossRef] [Scilit]
- Saito, T.; Rehmsmeier, M. The precision-recall plot is more informative than the ROC plot when evaluating binary classifiers on imbalanced datasets. PLoS ONE 2015, 10, e0118432. [Google Scholar] [CrossRef] [Scilit]
- Tyralis, H.; Papacharalampous, G.; Langousis, A. A brief review of random forests for water scientists. Water 2019, 11, 910. [Google Scholar] [CrossRef] [Scilit]
- Fisher, A.; Rudin, C.; Dominici, F. All models are wrong, but many are useful: Learning a variable’s importance by studying an entire class of prediction models simultaneously. J. Mach. Learn. Res. 2019, 20, 177. [Google Scholar] [PubMed]
- Molnar, C. Interpretable Machine Learning: A Guide for Making Black Box Models Explainable, 2nd ed.; Lulu: Morrisville, NC, USA, 2022; Available online: https://christophm.github.io/interpretable-ml-book/ (accessed on 20 July 2026).
- Strobl, C.; Boulesteix, A.L.; Kneib, T.; Augustin, T.; Zeileis, A. Conditional variable importance for random forests. BMC Bioinform. 2008, 9, 307. [Google Scholar] [CrossRef] [Scilit] [PubMed]
- Georganos, S.; Grippa, T.; Vanhuysse, S.; Lennert, M.; Shimoni, M.; Wolff, E. Very high resolution object-based LULC urban classification using extreme gradient boosting. IEEE Geosci. Remote Sens. Lett. 2018, 15, 607–611. [Google Scholar] [CrossRef] [Scilit]
- Saha, T.K.; Pal, S.; Talukdar, S.; Debanshi, S.; Khatun, R.; Singha, P.; Mandal, I. How far spatial resolution affects ensemble ML flood susceptibility. J. Environ. Manag. 2021, 297, 113344. [Google Scholar] [CrossRef] [Scilit] [PubMed]
- Esri. Forest-Based Classification and Regression Tool; ESRI: Redlands, CA, USA, 2023. [Google Scholar]
- Swets, J.A. Measuring the accuracy of diagnostic systems. Science 1988, 240, 1285–1293. [Google Scholar] [CrossRef] [Scilit] [PubMed]
- Cohen, J. A coefficient of agreement for nominal scales. Educ. Psychol. Meas. 1960, 20, 37–46. [Google Scholar] [CrossRef] [Scilit]
- Landis, J.R.; Koch, G.G. The measurement of observer agreement for categorical data. Biometrics 1977, 33, 159–174. [Google Scholar] [CrossRef] [Scilit]
- Kumar, V.; Sharma, K.V.; Caloiero, T.; Mehta, D.J.; Singh, K. Comprehensive Overview of Flood Modeling Approaches: A Review of Recent Advances. Hydrology 2023, 10, 141. [Google Scholar] [CrossRef] [Scilit]
- Sorensen, R.; Zinko, U.; Seibert, J. On the calculation of the topographic wetness index. Hydrol. Earth Syst. Sci. 2006, 10, 101–112. [Google Scholar] [CrossRef] [Scilit]
- Afshari, S.; Tavakoly, A.A.; Rajib, M.A.; Zheng, X.; Follum, M.L.; Omranian, E.; Fekete, B.M. Comparison of new generation low-complexity flood inundation mapping tools with a hydrodynamic model. J. Hydrol. 2018, 556, 539–556. [Google Scholar] [CrossRef] [Scilit]
- Costache, R.; Pham, Q.B.; Sharifi, E.; Linh, N.T.T.; Abba, S.; Vojtek, M.; Vojteková, J.; Nhi, P.T.T.; Khoi, D.N. Flash-flood susceptibility assessment using multi-criteria decision making and ML. Remote Sens. 2020, 12, 106. [Google Scholar] [CrossRef] [Scilit]
- Termeh, S.V.R.; Kornejady, A.; Pourghasemi, H.R.; Keesstra, S. Flood susceptibility mapping using novel ensembles of ANFIS and metaheuristic algorithms. Sci. Total Environ. 2018, 615, 438–451. [Google Scholar] [CrossRef] [Scilit] [PubMed]
- El-Haddad, B.A.; Youssef, A.M.; Mahdi, A.M.; Karimi, Z.; Pourghasemi, H.R. National flood susceptibility mapping in Saudi Arabia. Earth Sci. Inform. 2025, 18, 118. [Google Scholar] [CrossRef] [Scilit]
- Fawcett, T. An introduction to ROC analysis. Pattern Recognit. Lett. 2006, 27, 861–874. [Google Scholar] [CrossRef] [Scilit]
- Sivapalan, M.; Takeuchi, K.; Franks, S.W.; Gupta, V.K.; Karambiri, H.; Lakshmi, V.; Liang, X.; McDONNELL, J.J.; Mendiondo, E.M.; O’Connell, P.E.; et al. IAHS Decade on Predictions in Ungauged Basins (PUB). Hydrol. Sci. J. 2003, 48, 857–880. [Google Scholar] [CrossRef] [Scilit]
- Hrachowitz, M.; Savenije, H.H.G.; Blöschl, G.; McDonnell, J.; Sivapalan, M.; Pomeroy, J.; Arheimer, B.; Blume, T.; Clark, M.; Ehret, U.; et al. A decade of Predictions in Ungauged Basins—A review. Hydrol. Sci. J. 2013, 58, 1198–1255. [Google Scholar] [CrossRef] [Scilit]
- Vojtek, M.; Vojteková, J. Flood susceptibility mapping on a national scale in Slovakia using the analytical hierarchy process. Water 2019, 11, 364. [Google Scholar] [CrossRef] [Scilit]
- Okoli, E.A.; Josephine, K.M.; Agoha, C.C.; Ikoro, D.O.; Oyinebielador, D.O.; Aniyom, E.A.; Oladipupo, J.T.; Emenyonu, U.D. Integrated flood susceptibility mapping using ML and geospatial techniques: A case study of Imo State, southeastern Nigeria. J. Afr. Earth Sci. 2025, 233, 105872. [Google Scholar] [CrossRef] [Scilit]
- Amos, M.D.; Okeke, F.N.; Agbozu, E.N.; Mogo, C.F.; Ogidi, O.I.; Eteh, D.R.; Omonefe, F.; Mogo, C.O.; Winston, A.G.; Ihekona, O.; et al. Machine learning-based flood inundation mapping and LULC classification in Ahoada West, Rivers State, Nigeria using satellite imagery. Discov. Geosci. 2026, 4, 117. [Google Scholar] [CrossRef] [Scilit]
- Funk, C.; Peterson, P.; Landsfeld, M.; Pedreros, D.; Verdin, J.; Shukla, S.; Husak, G.; Rowland, J.; Harrison, L.; Hoell, A.; et al. The climate hazards infrared precipitation with stations. Sci. Data 2015, 2, 150066. [Google Scholar] [CrossRef] [Scilit] [PubMed]
- Singha, C.; Rana, V.K.; Pham, Q.B.; Nguyen, D.C.; Łupikasza, E. Integrating machine learning and geospatial data analysis for comprehensive flood hazard assessment. Environ. Sci. Pollut. Res. 2024, 31, 48497. [Google Scholar] [CrossRef] [Scilit] [PubMed]
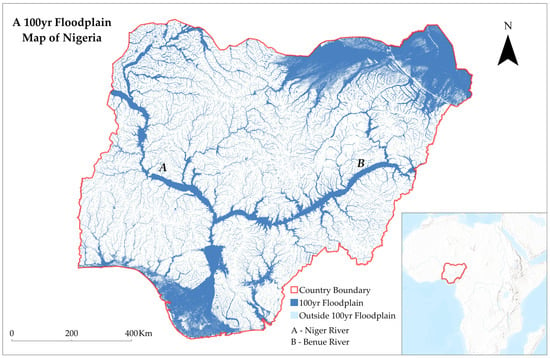
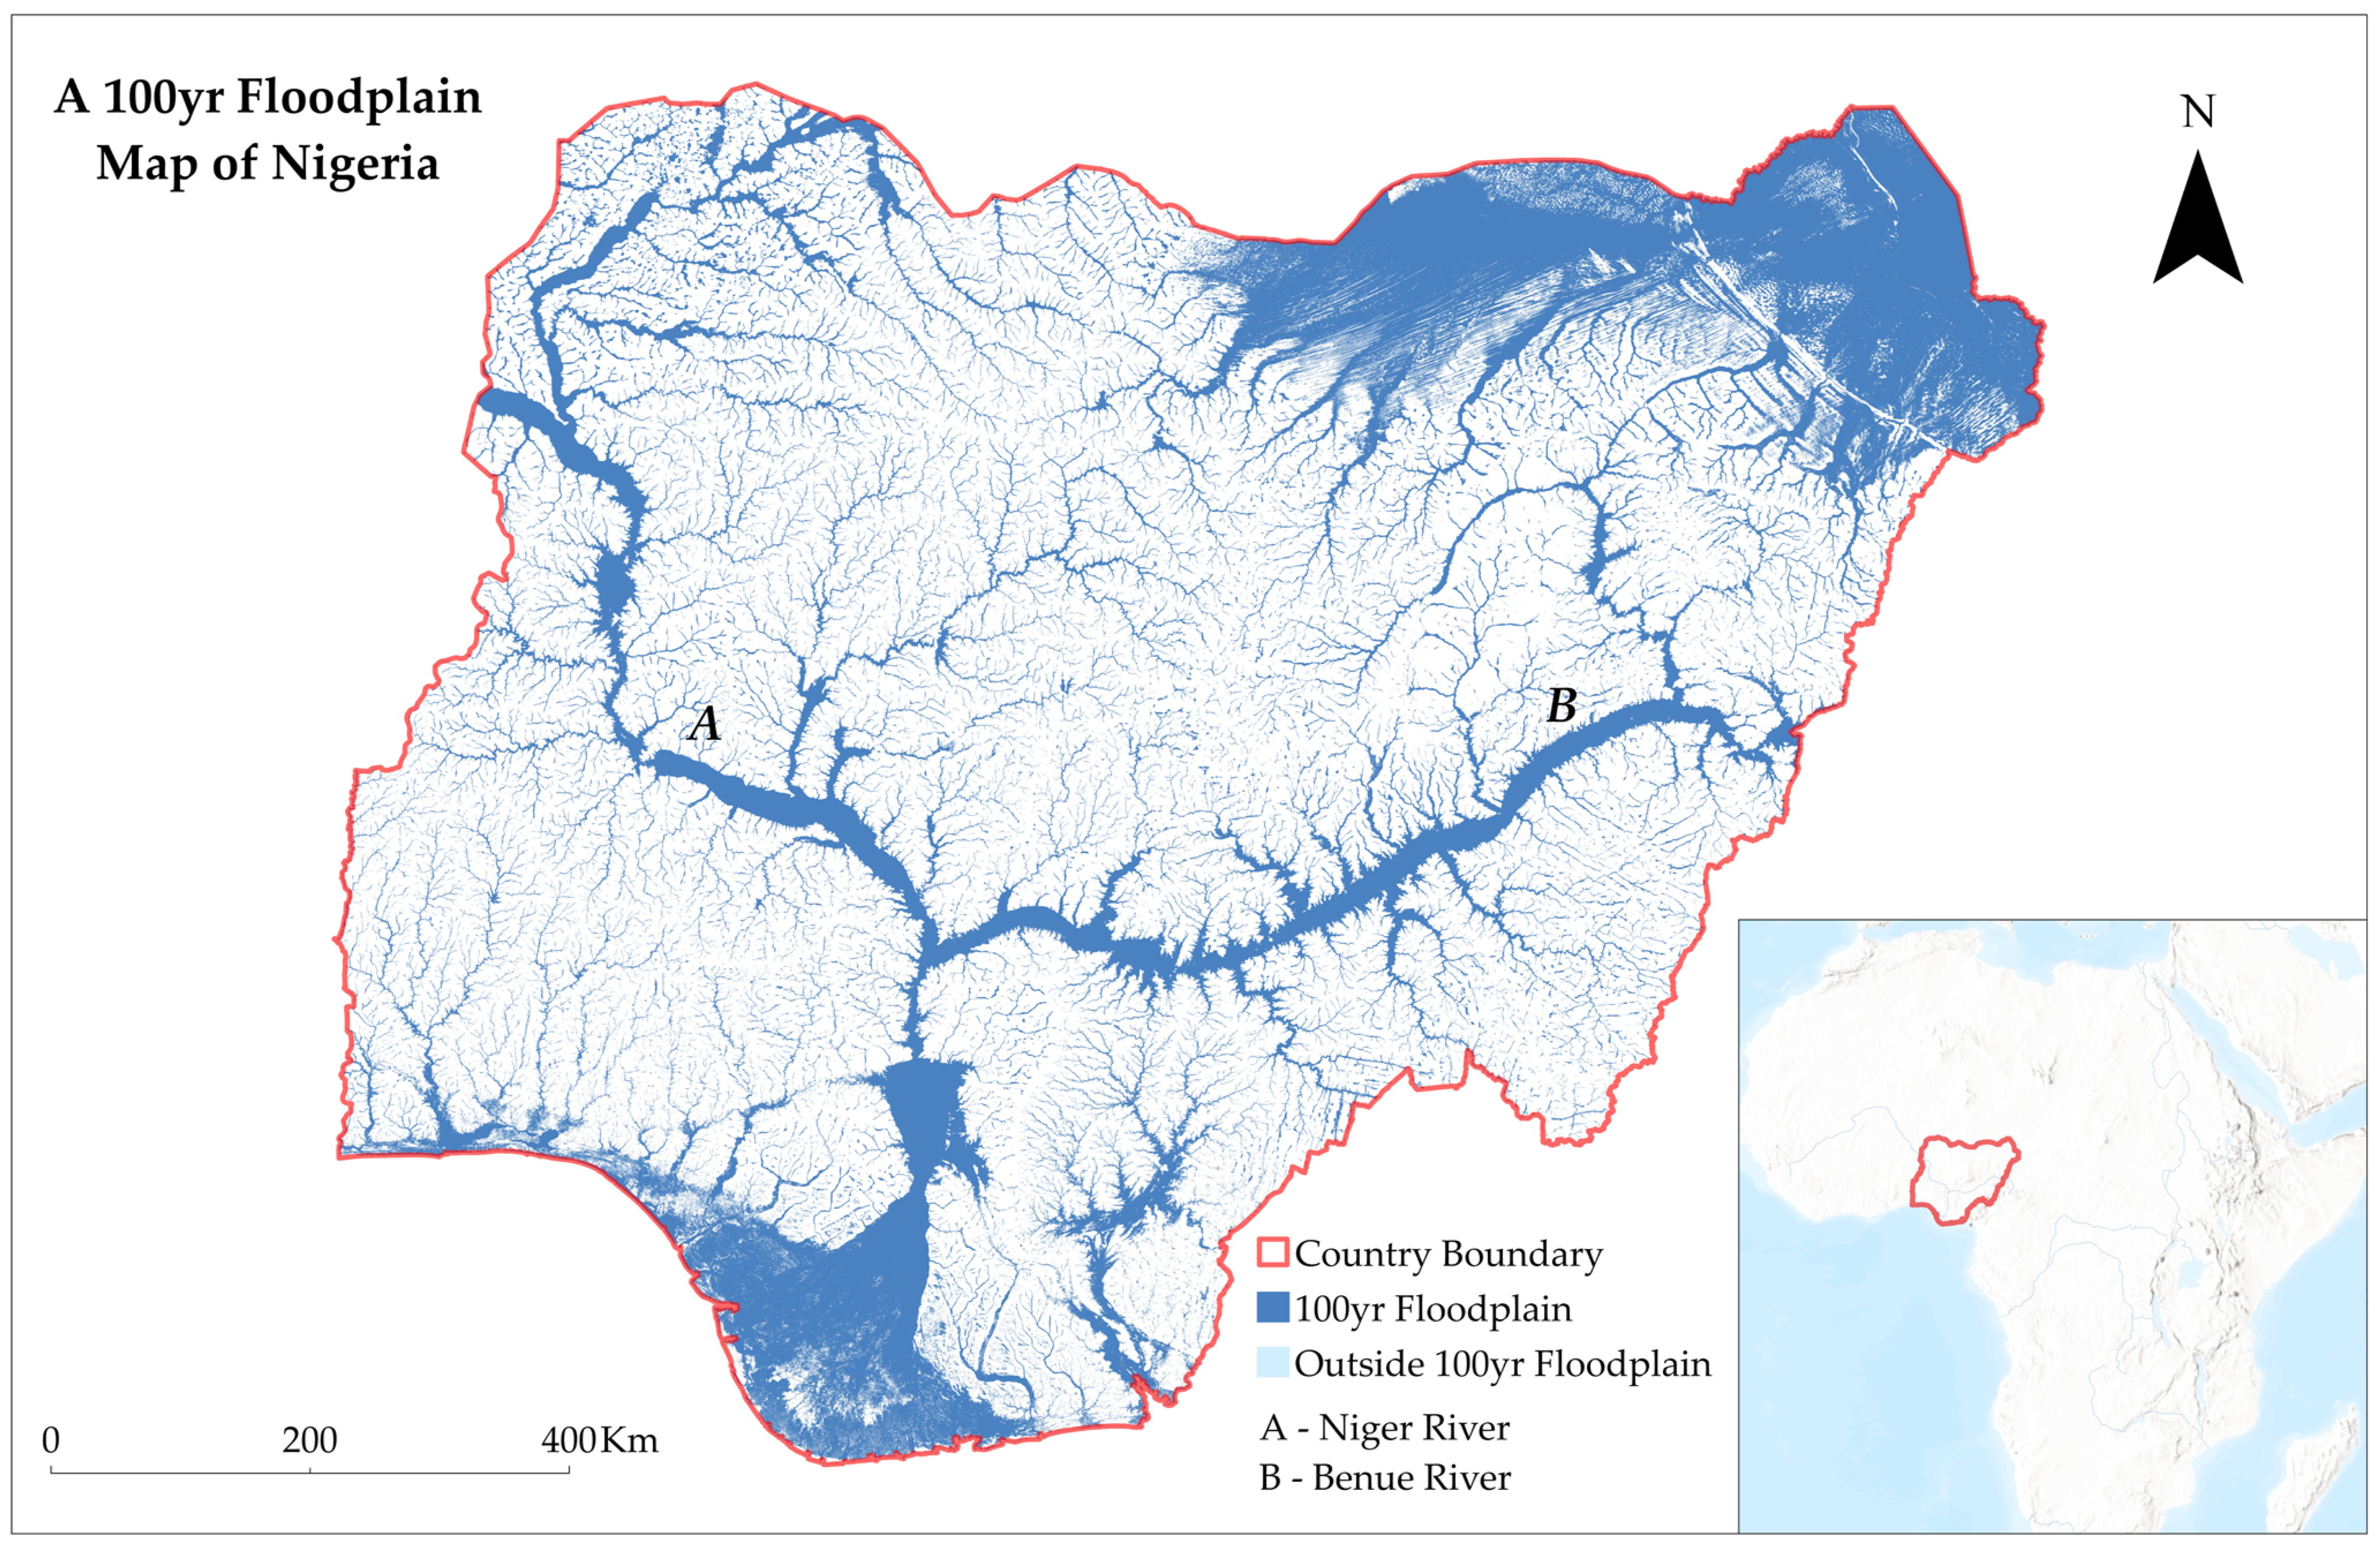
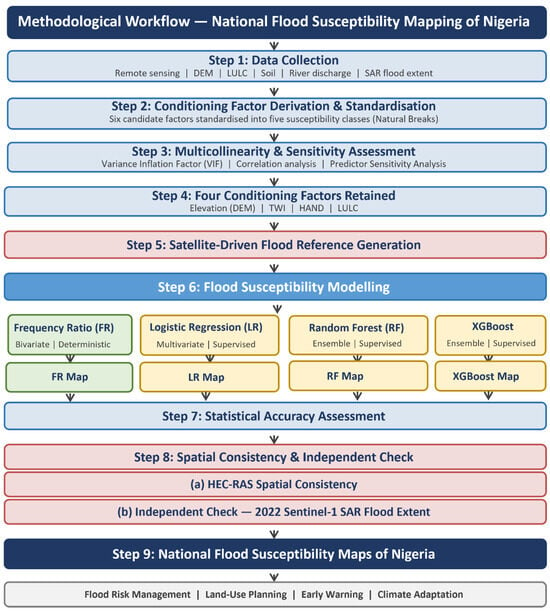
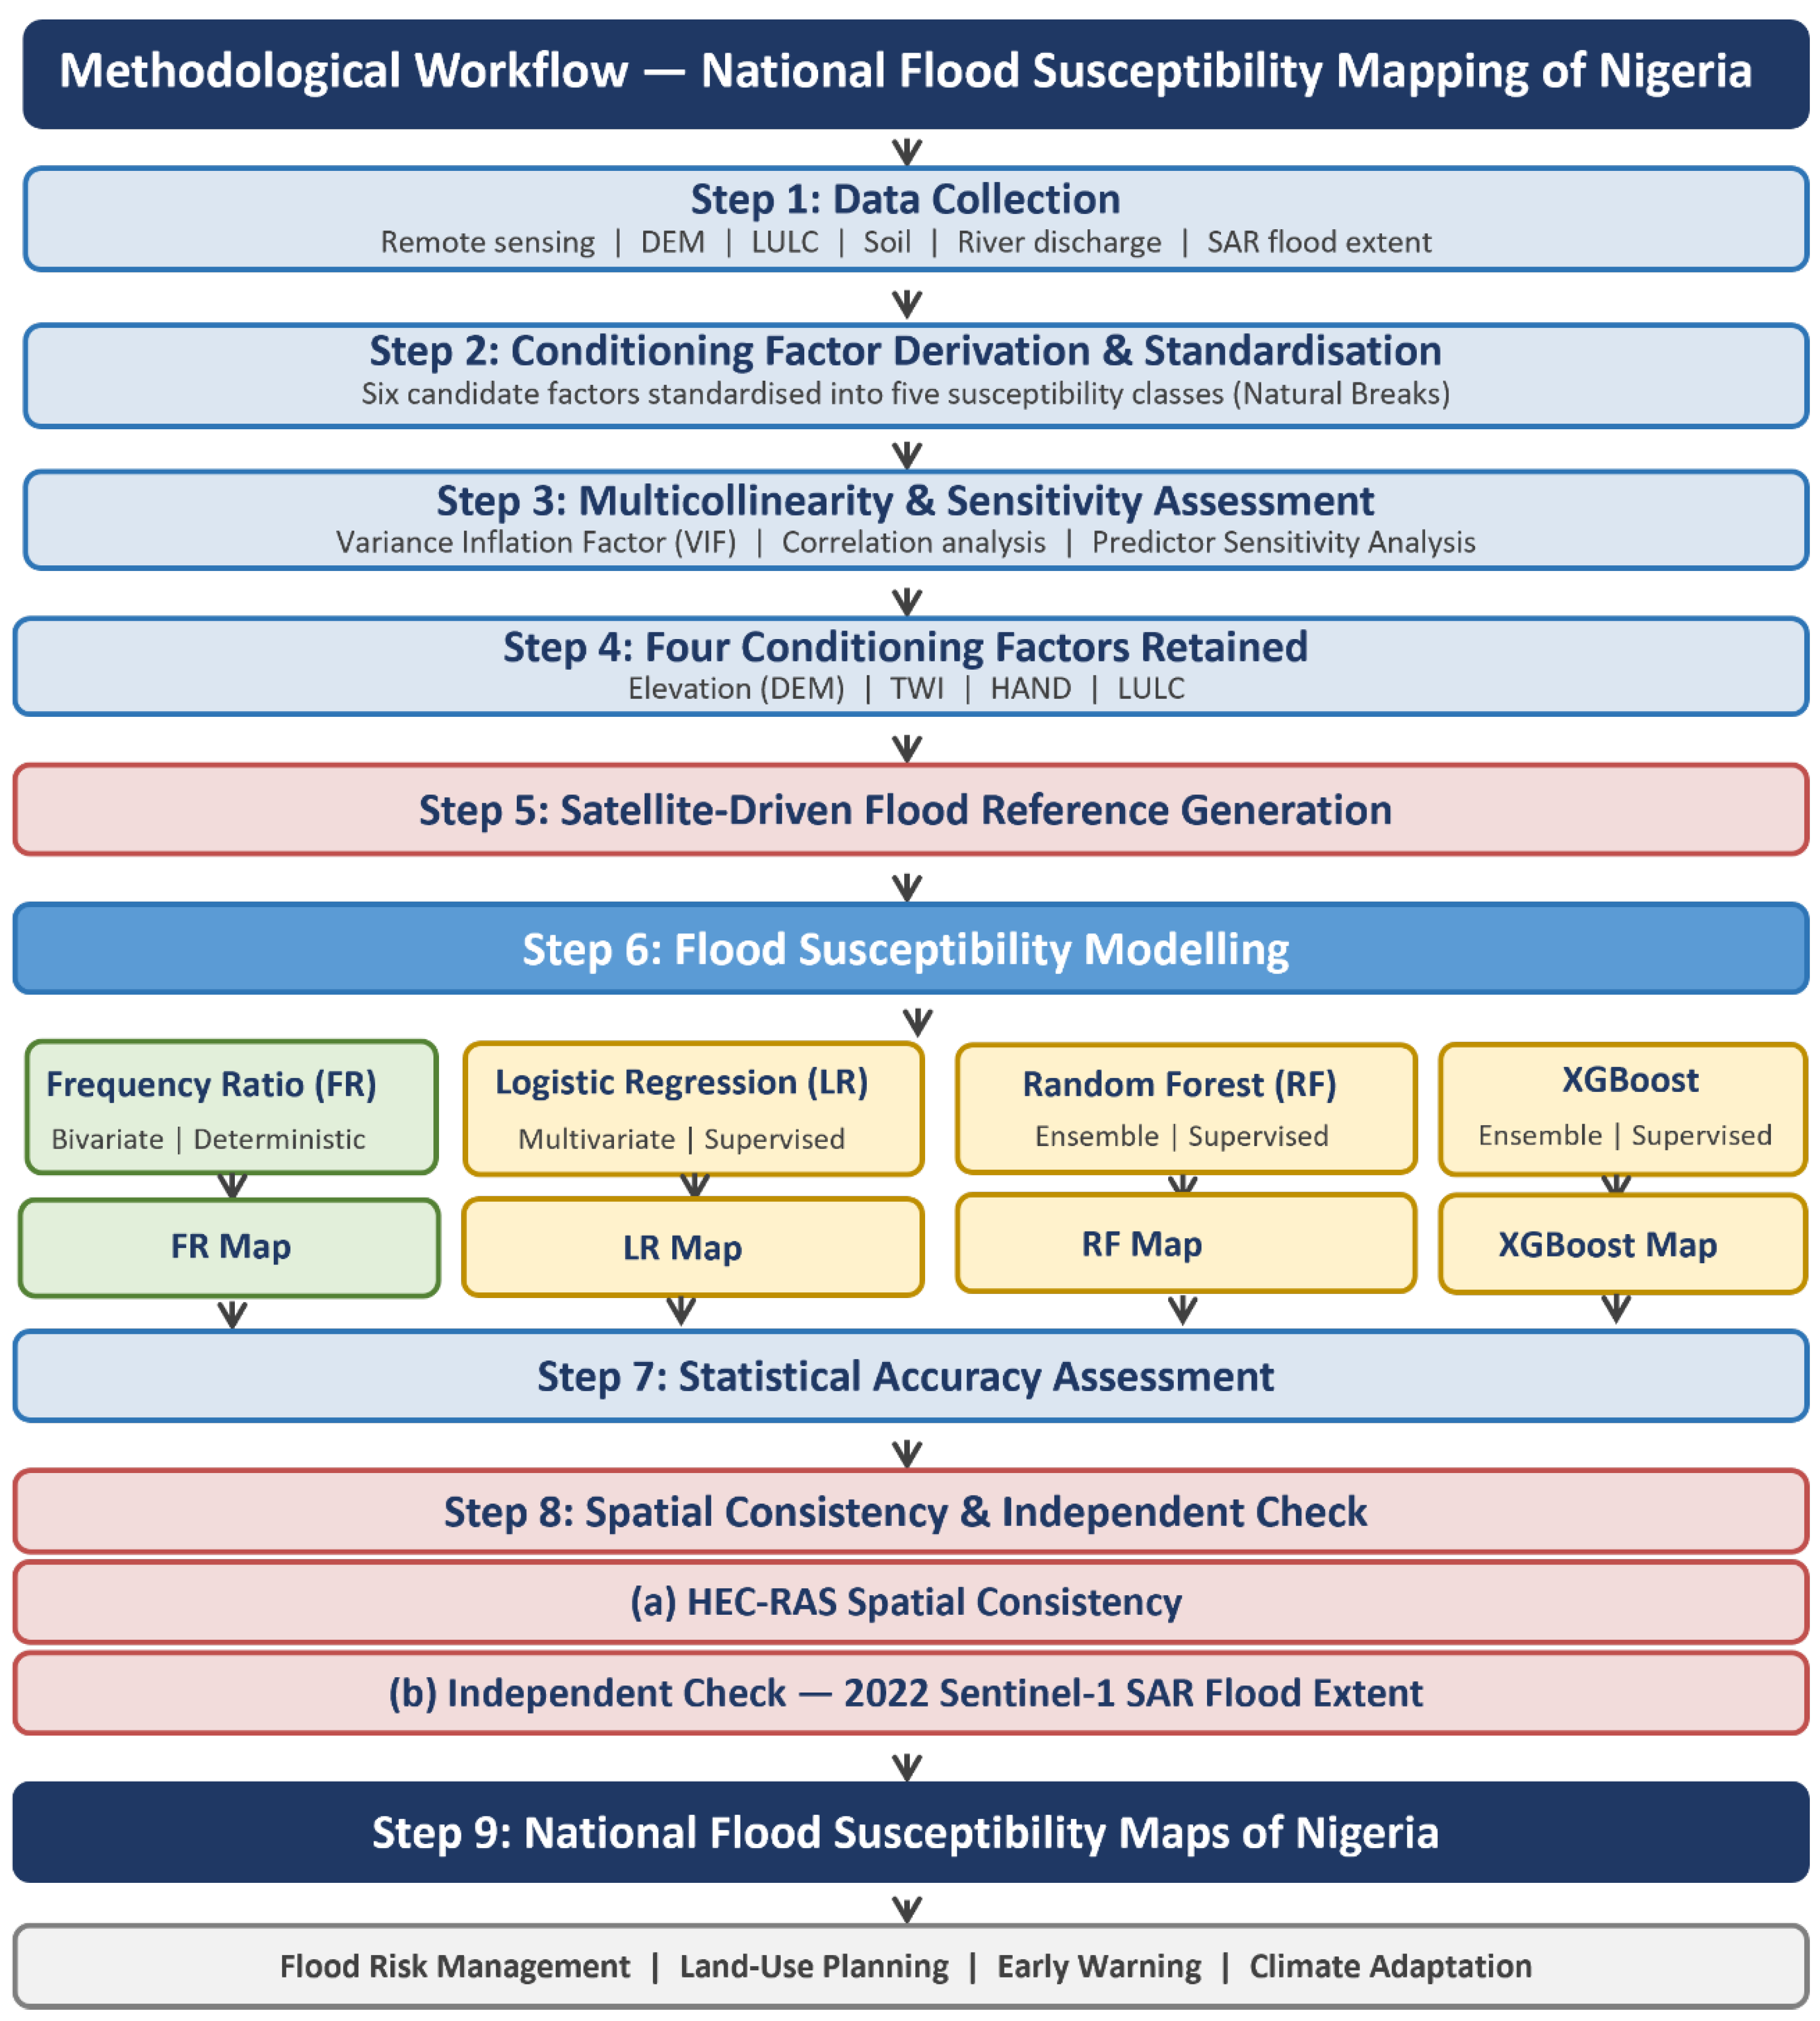
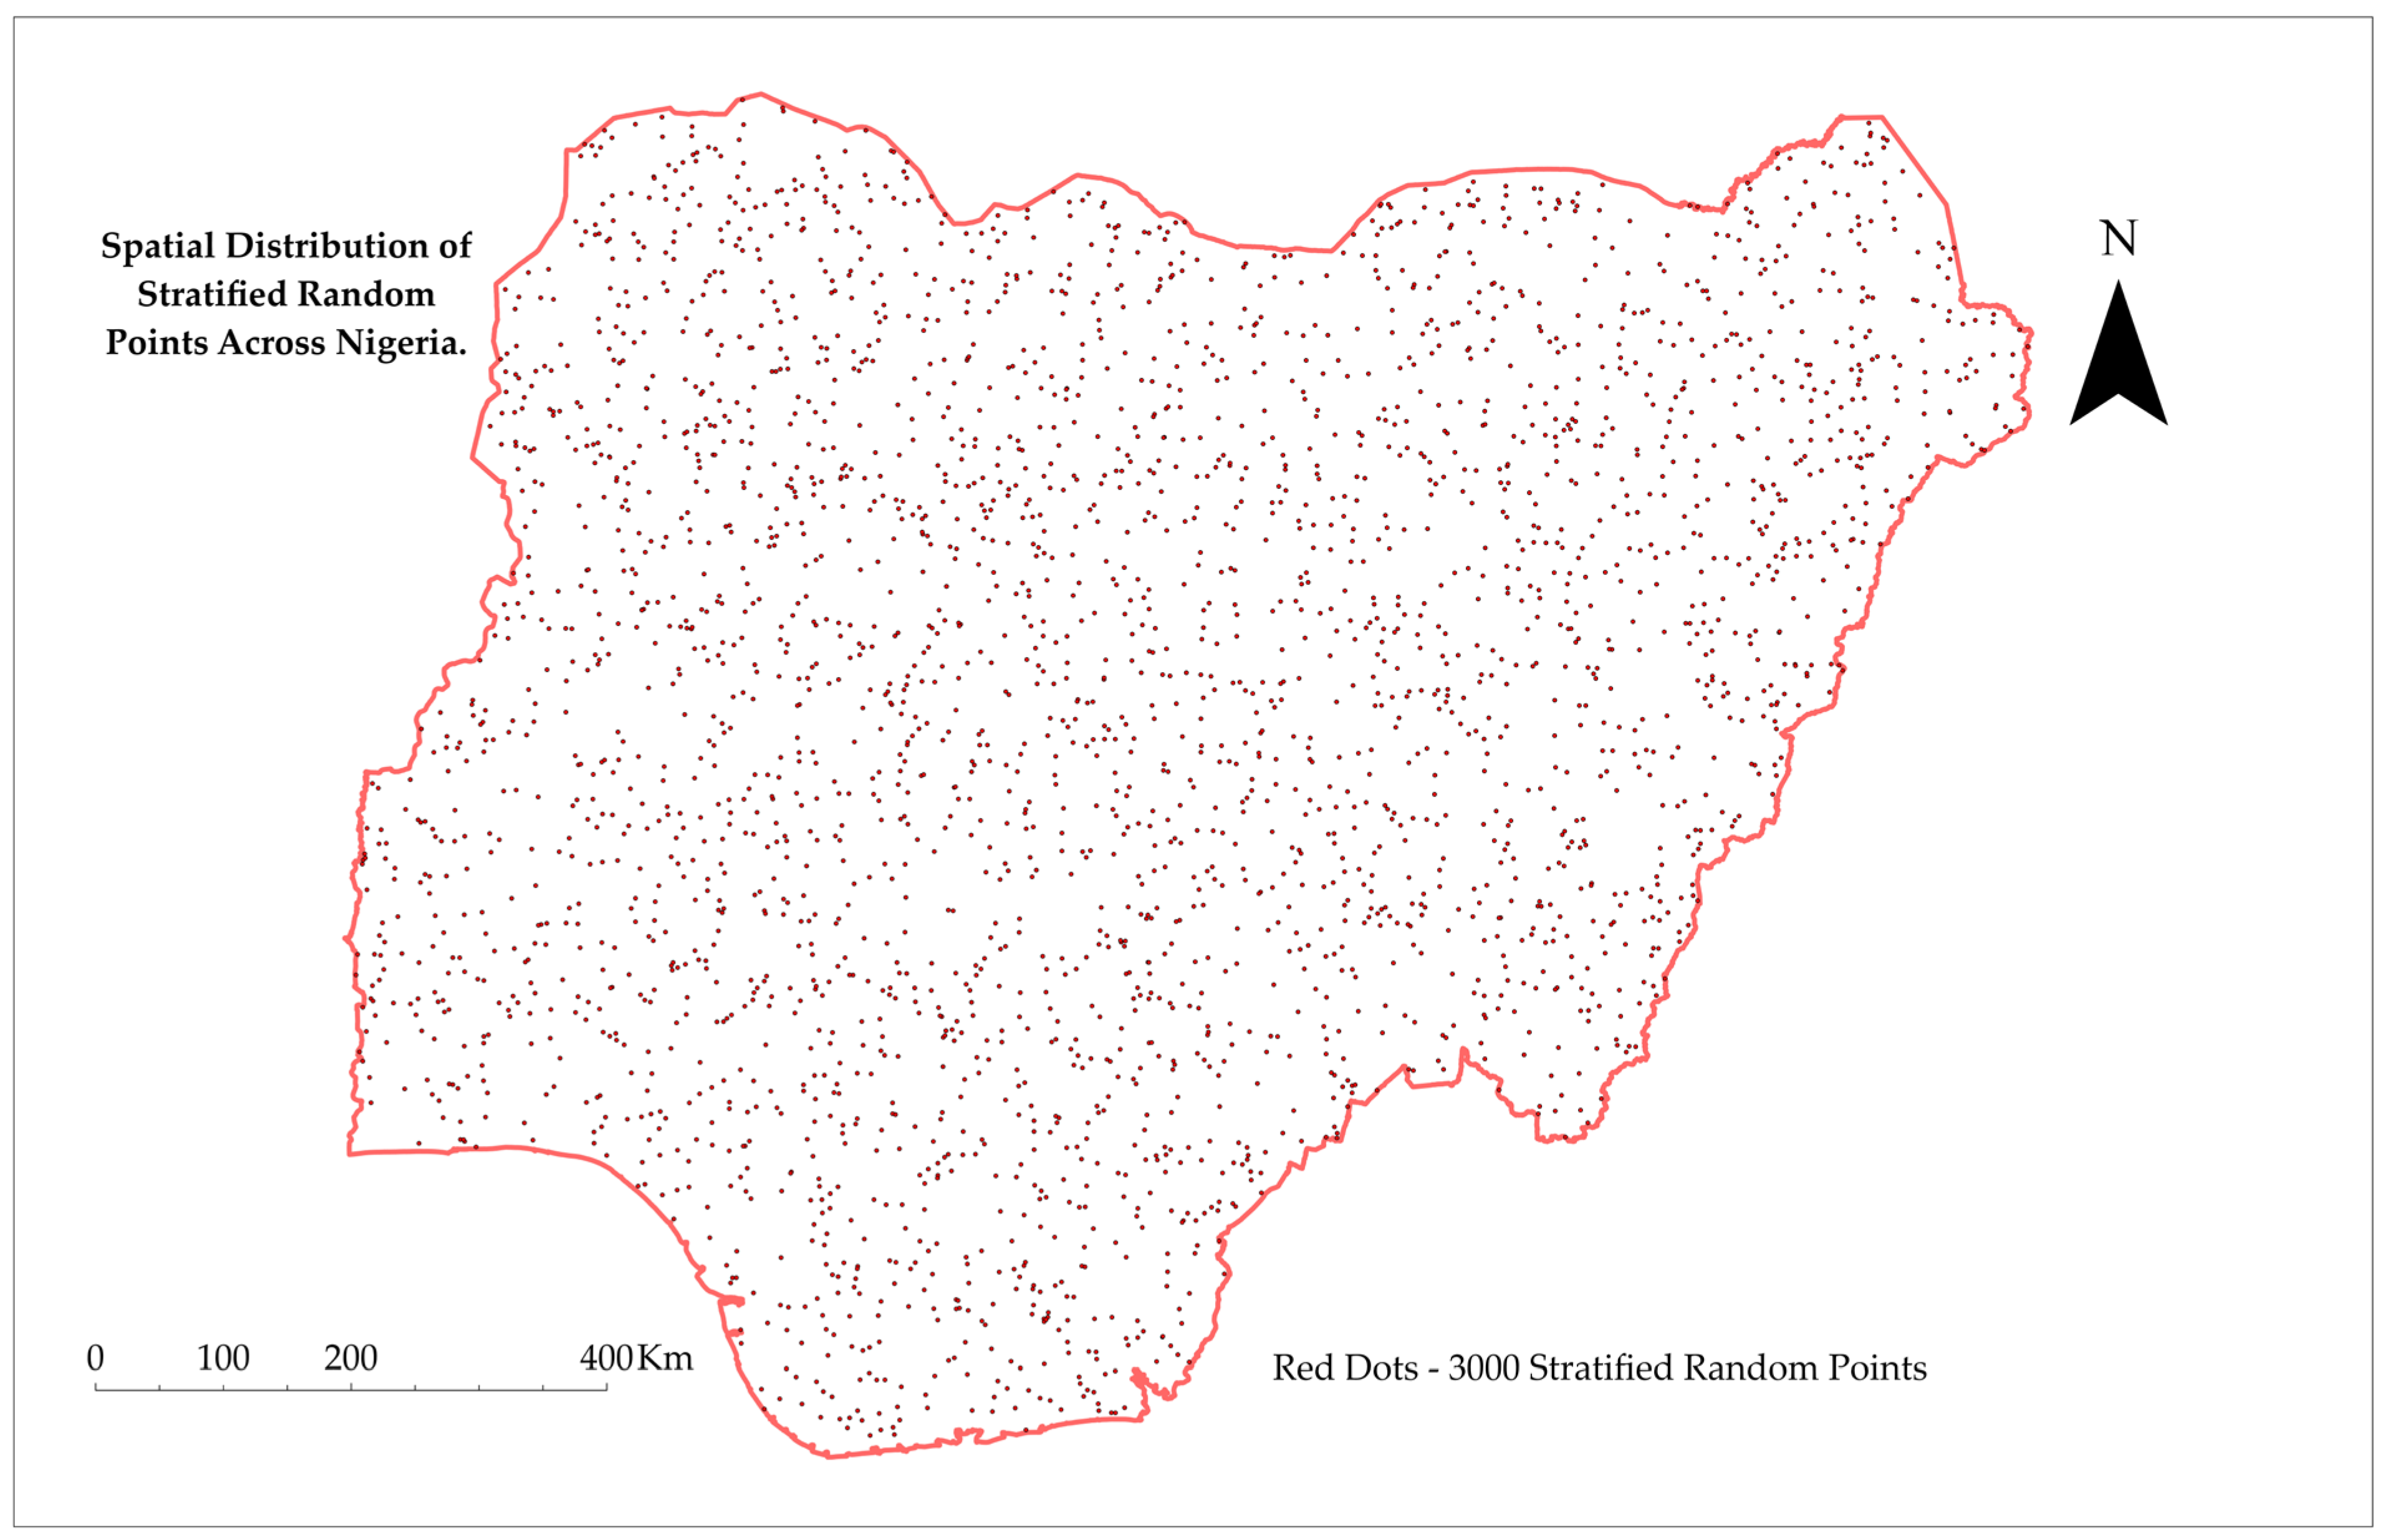
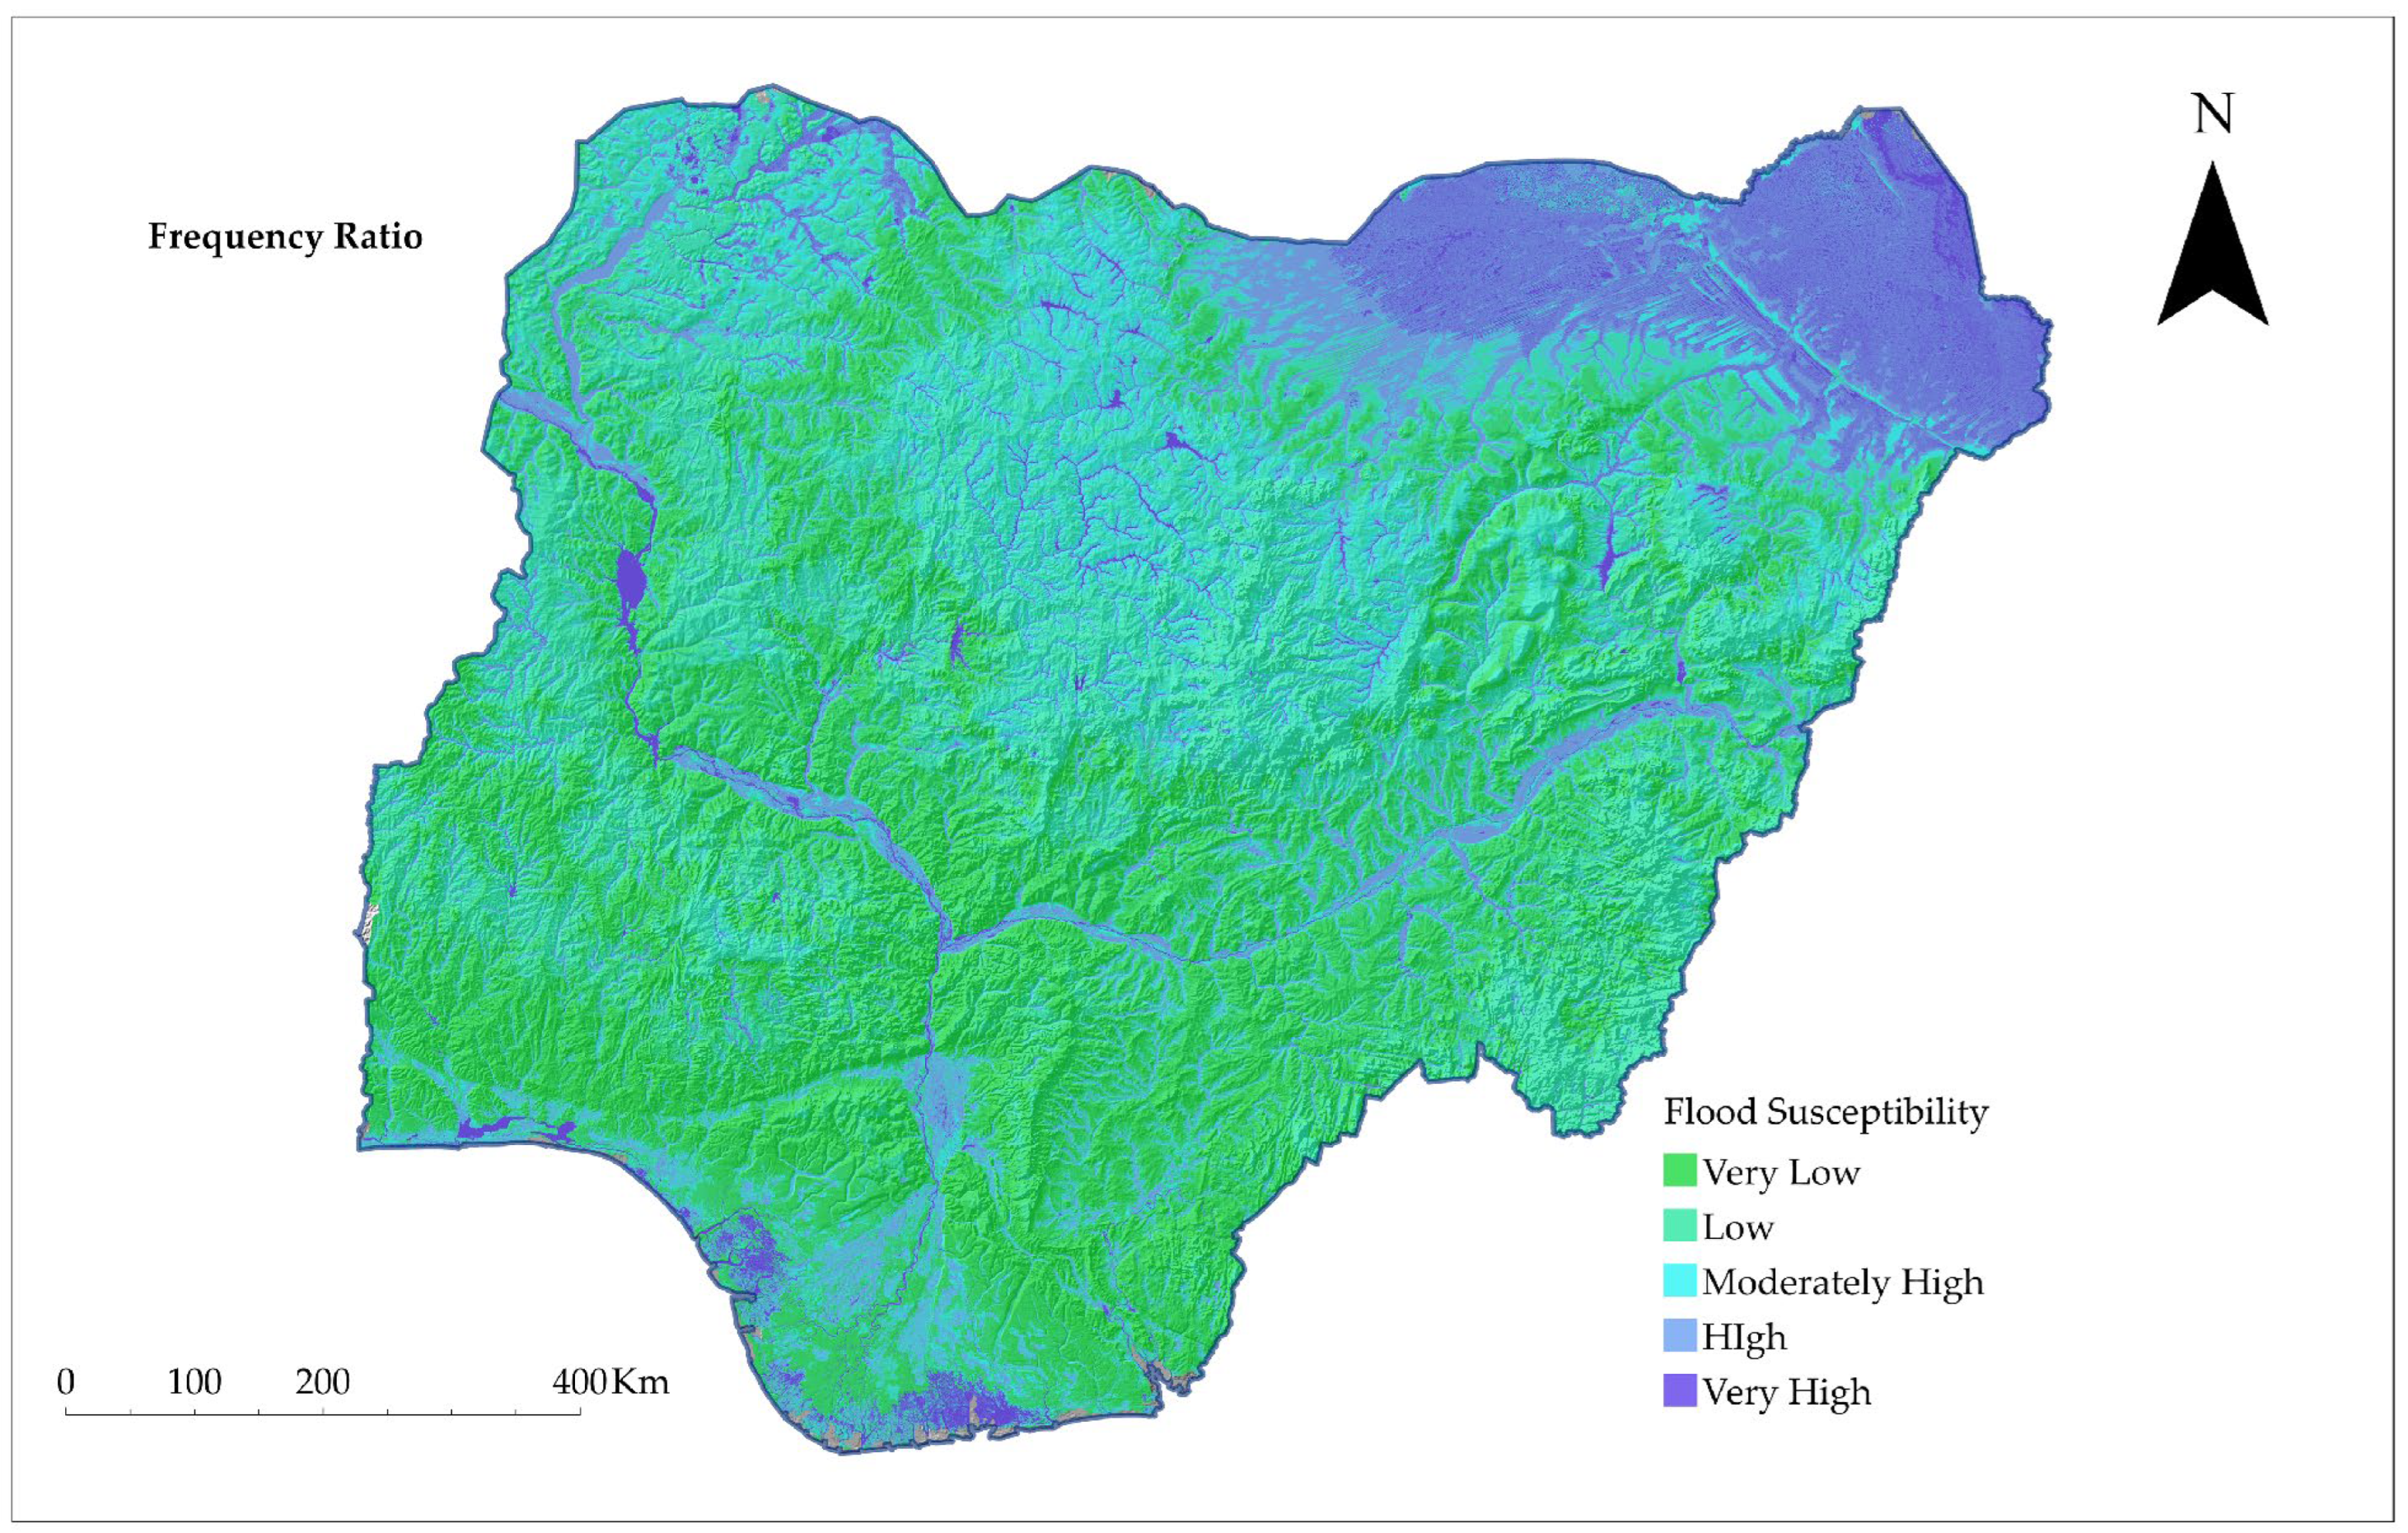
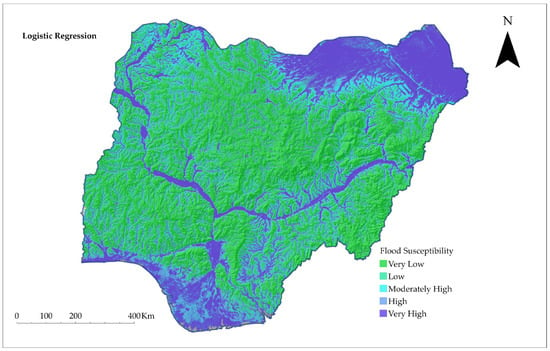
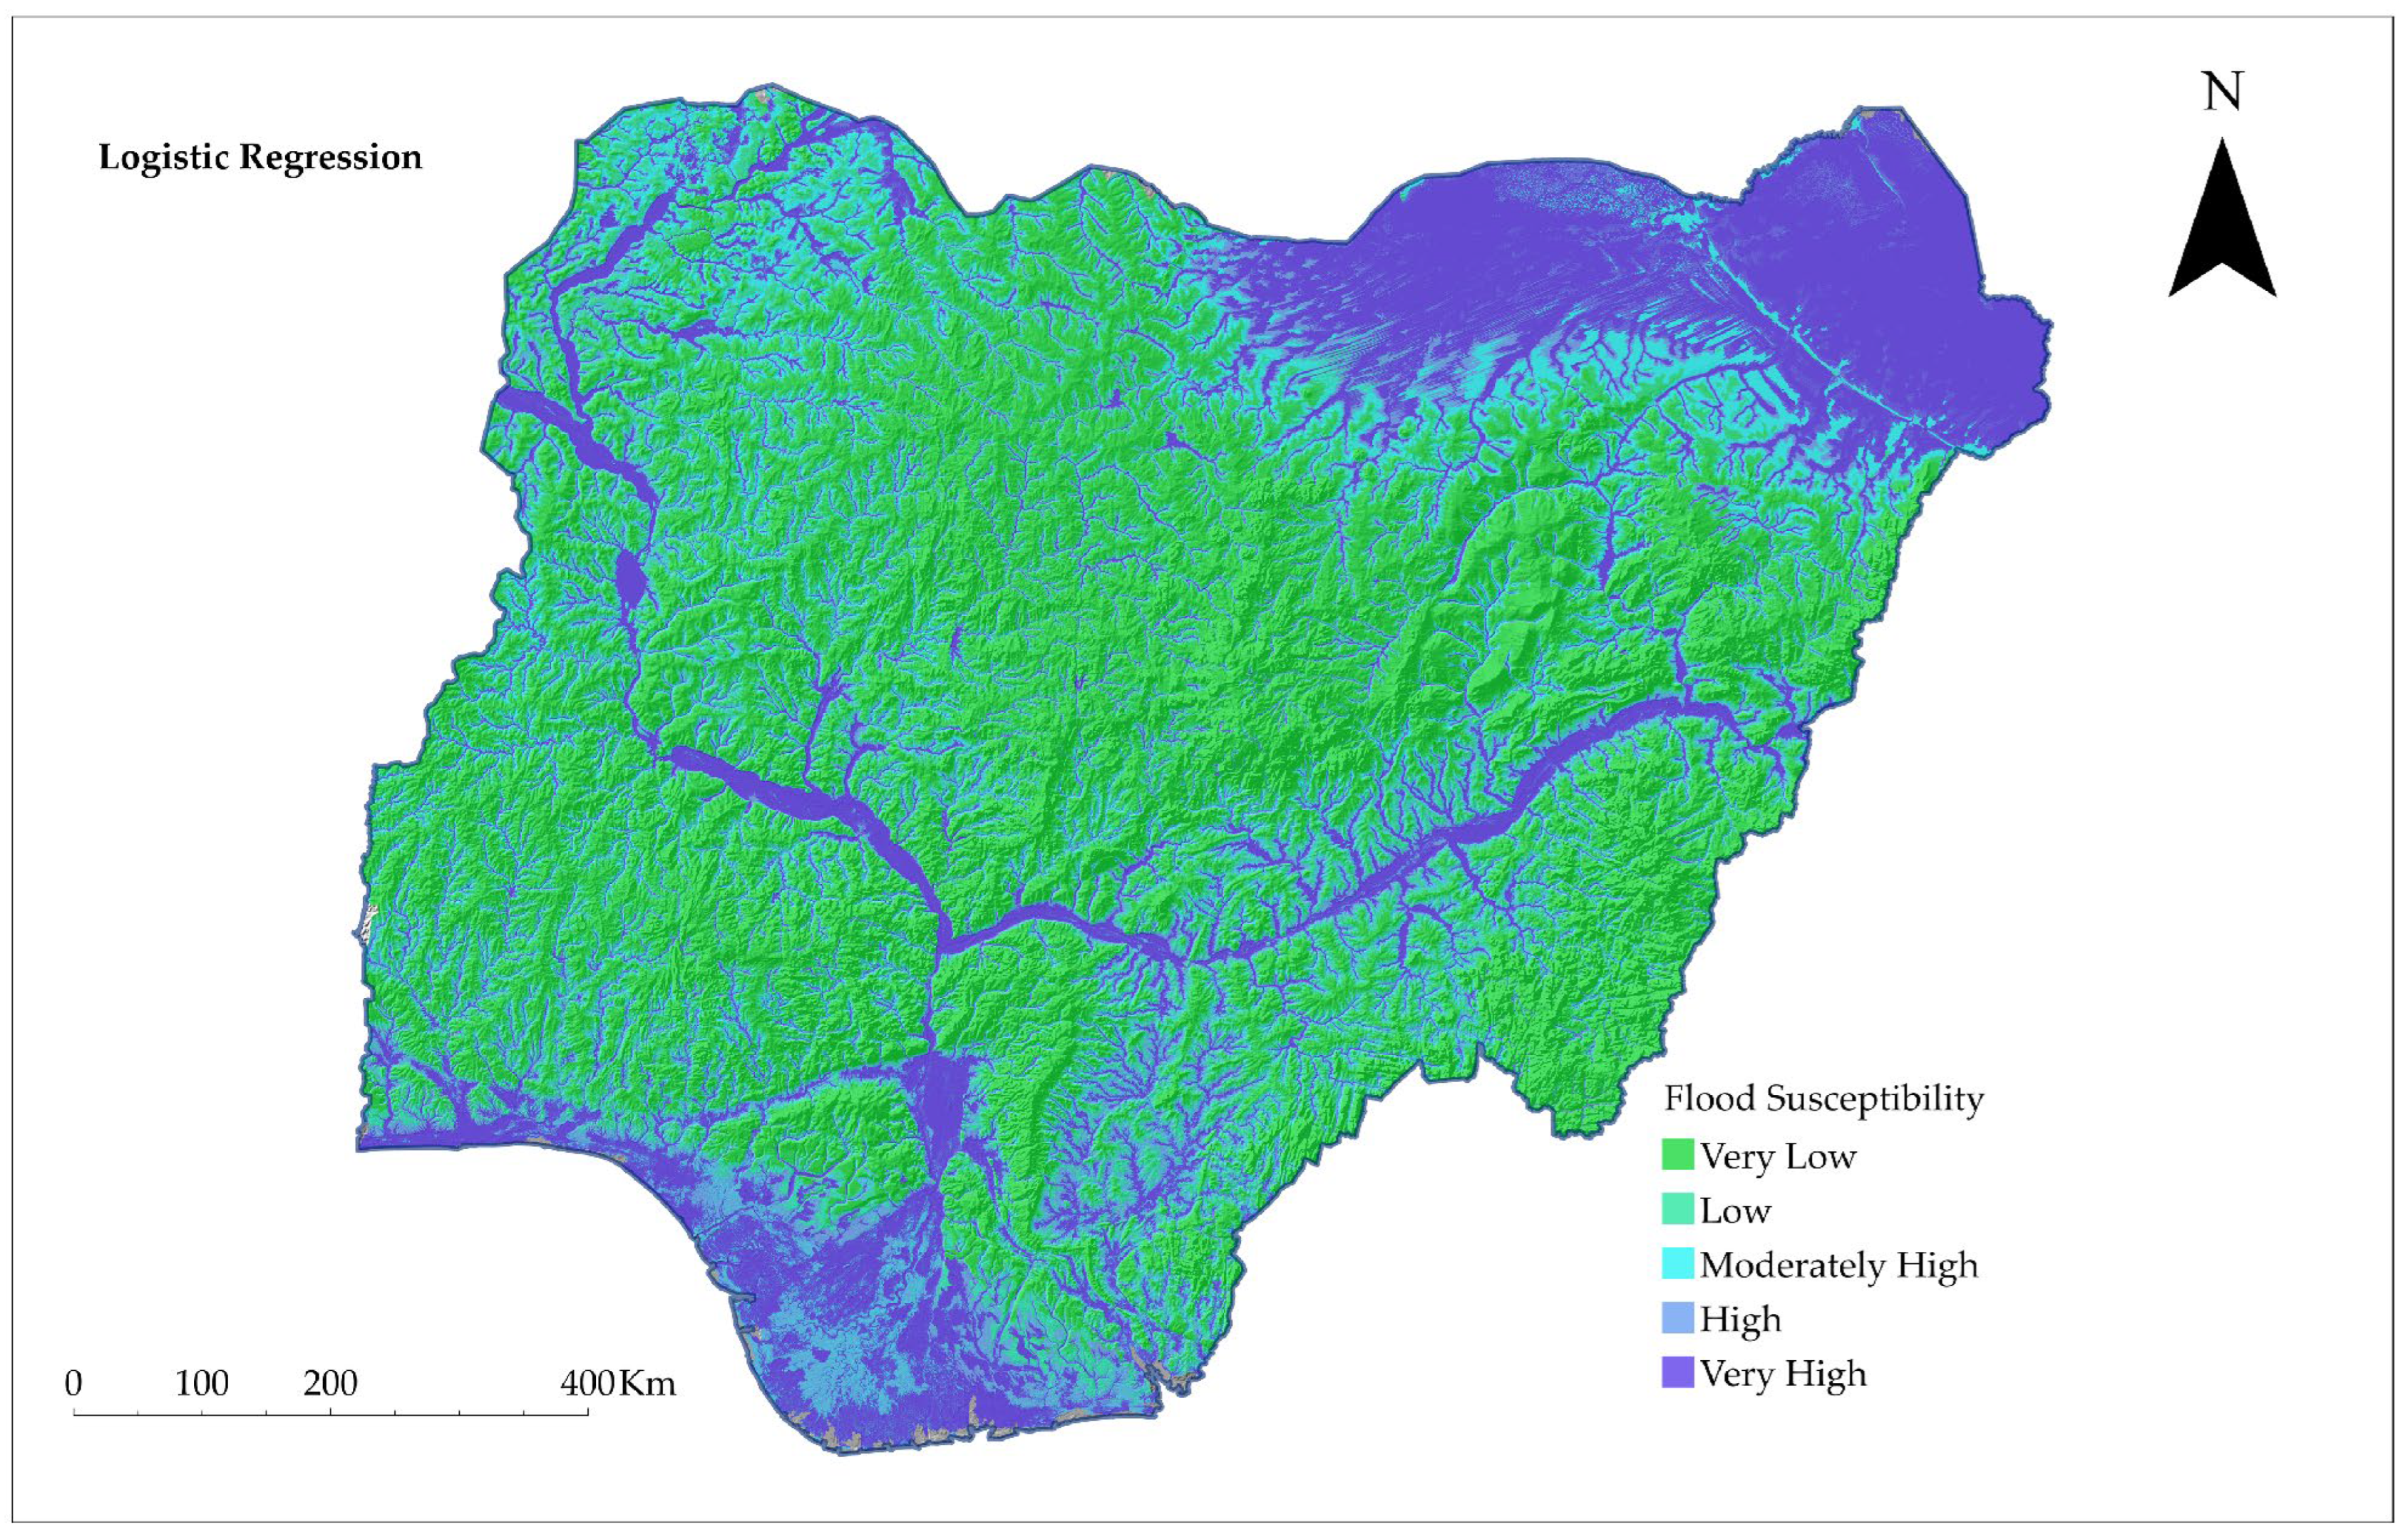
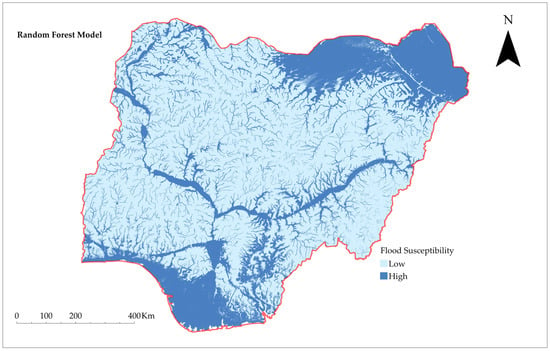
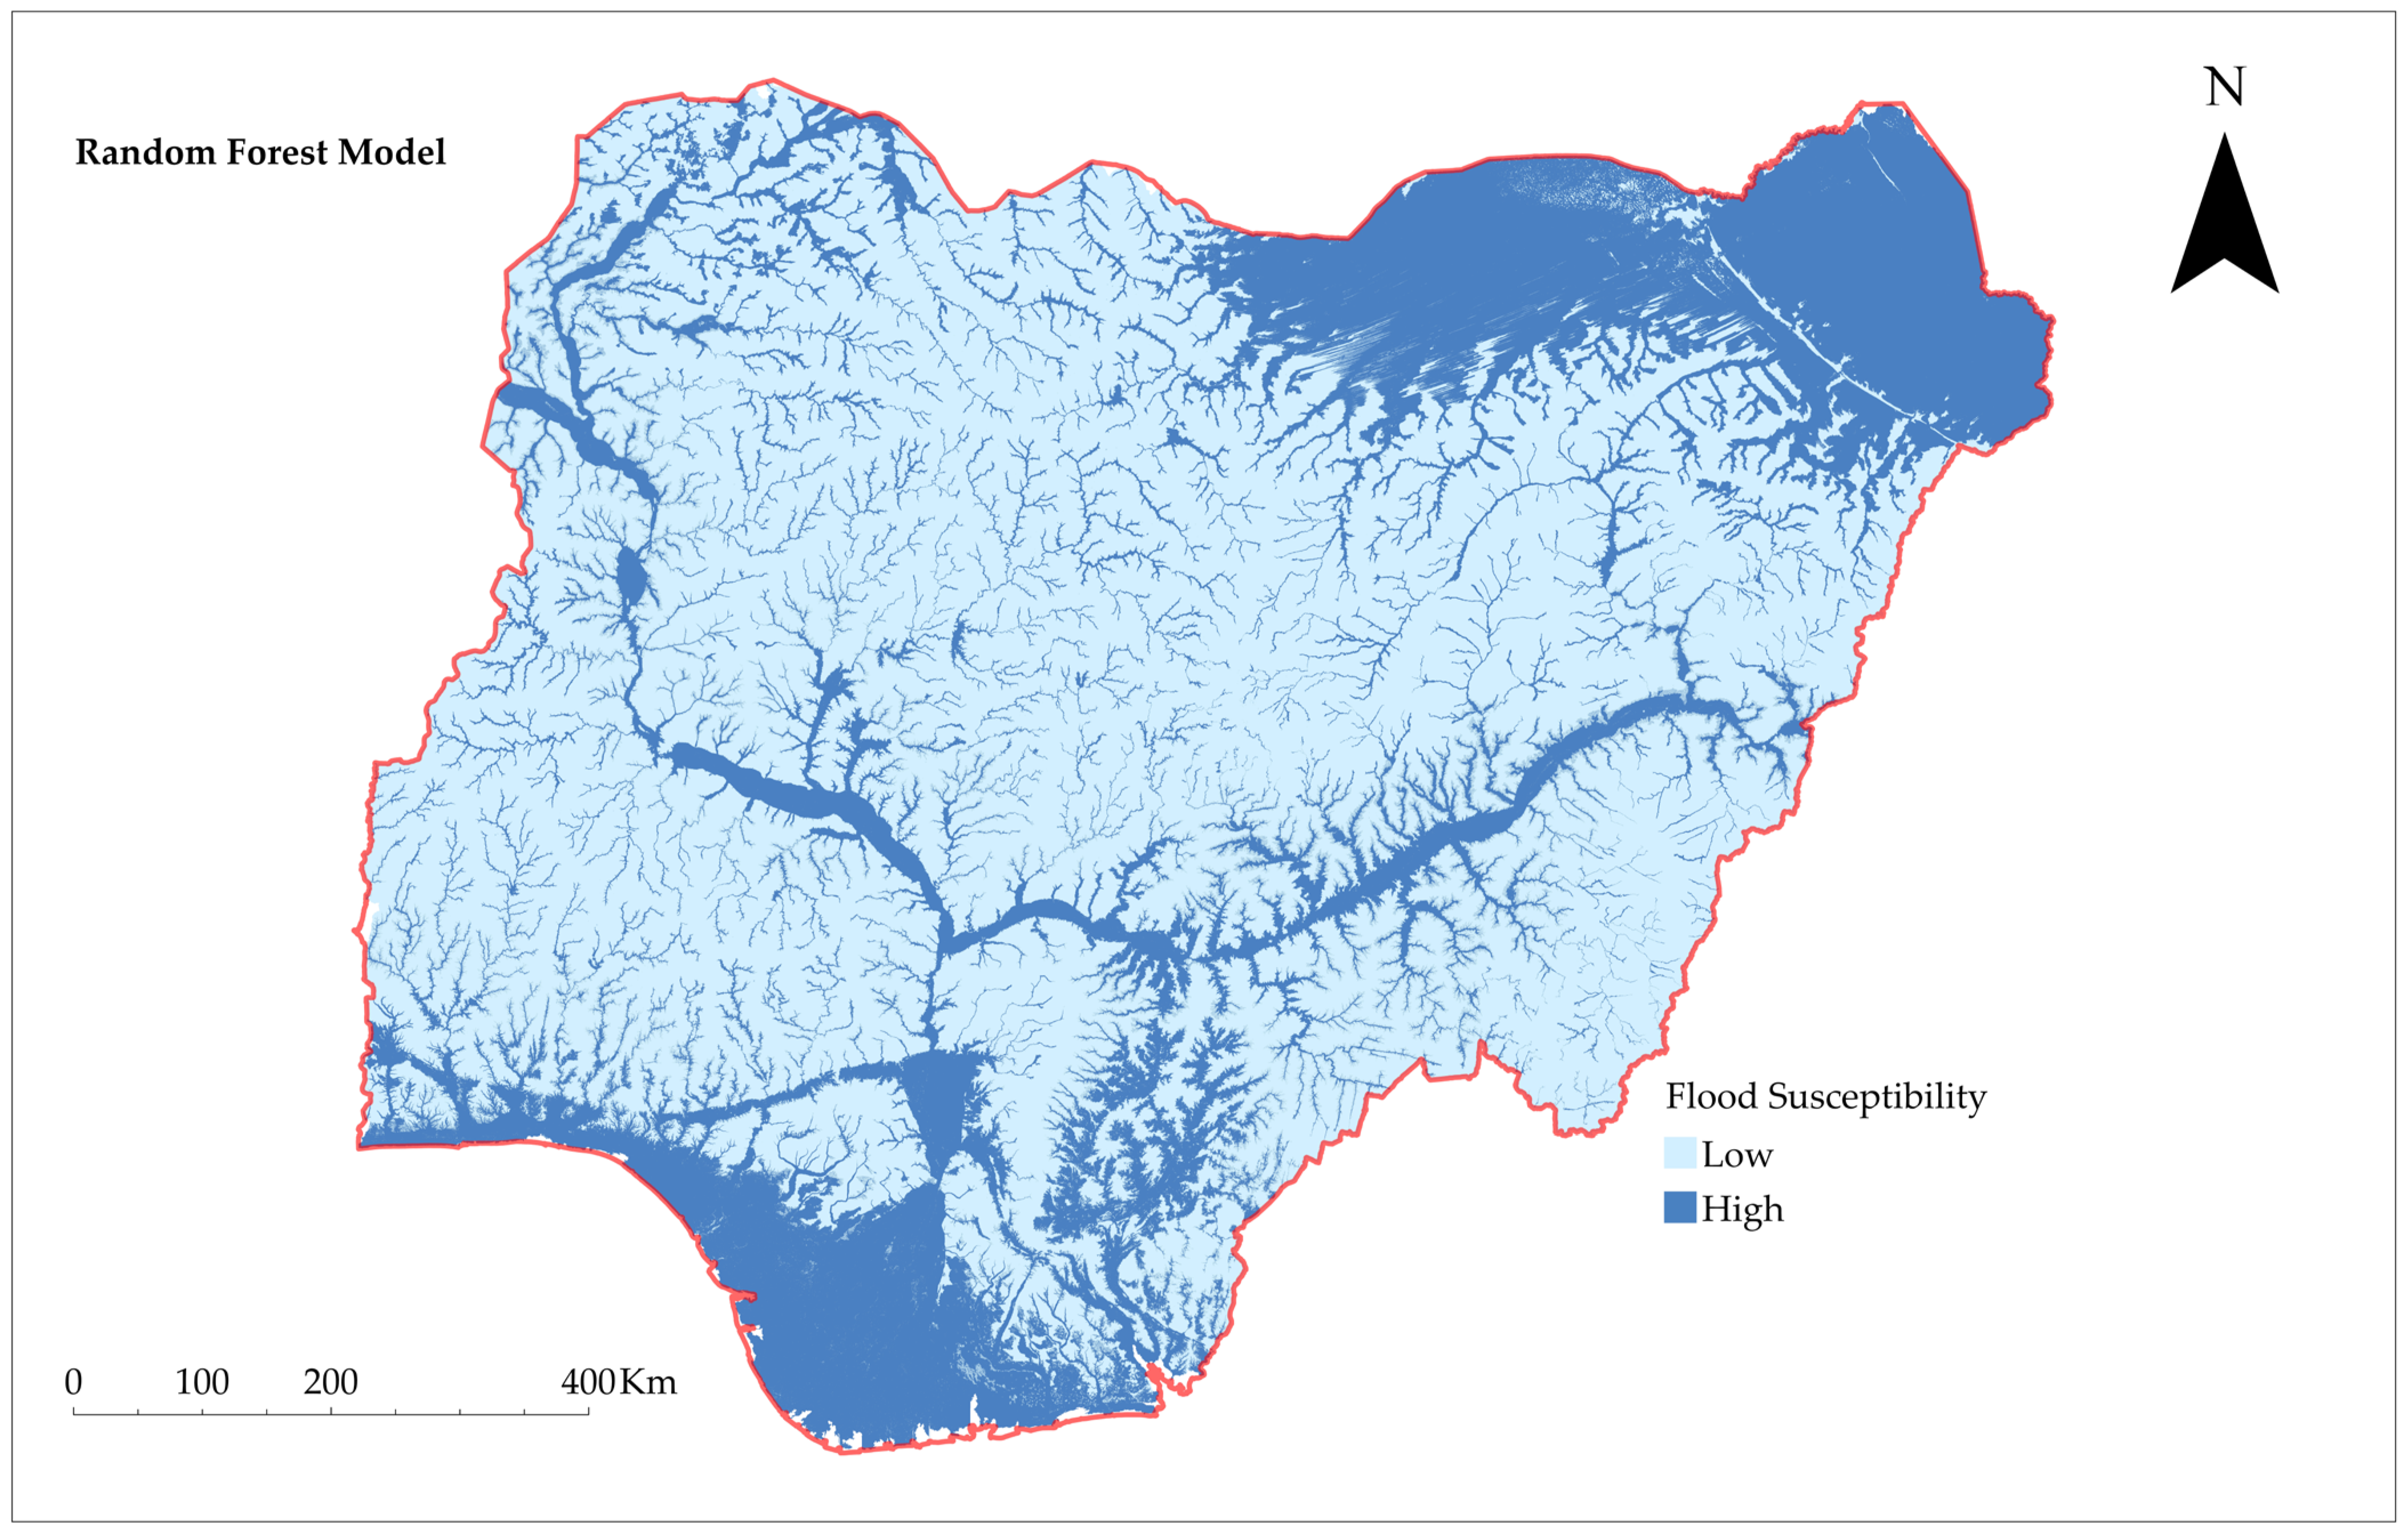
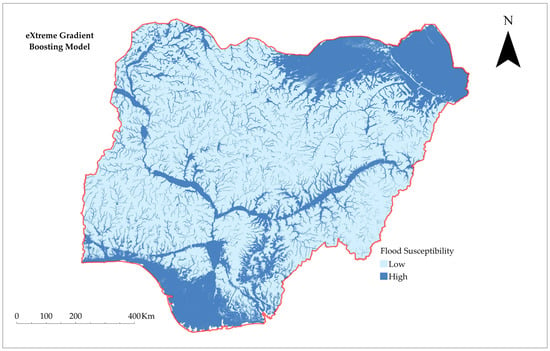
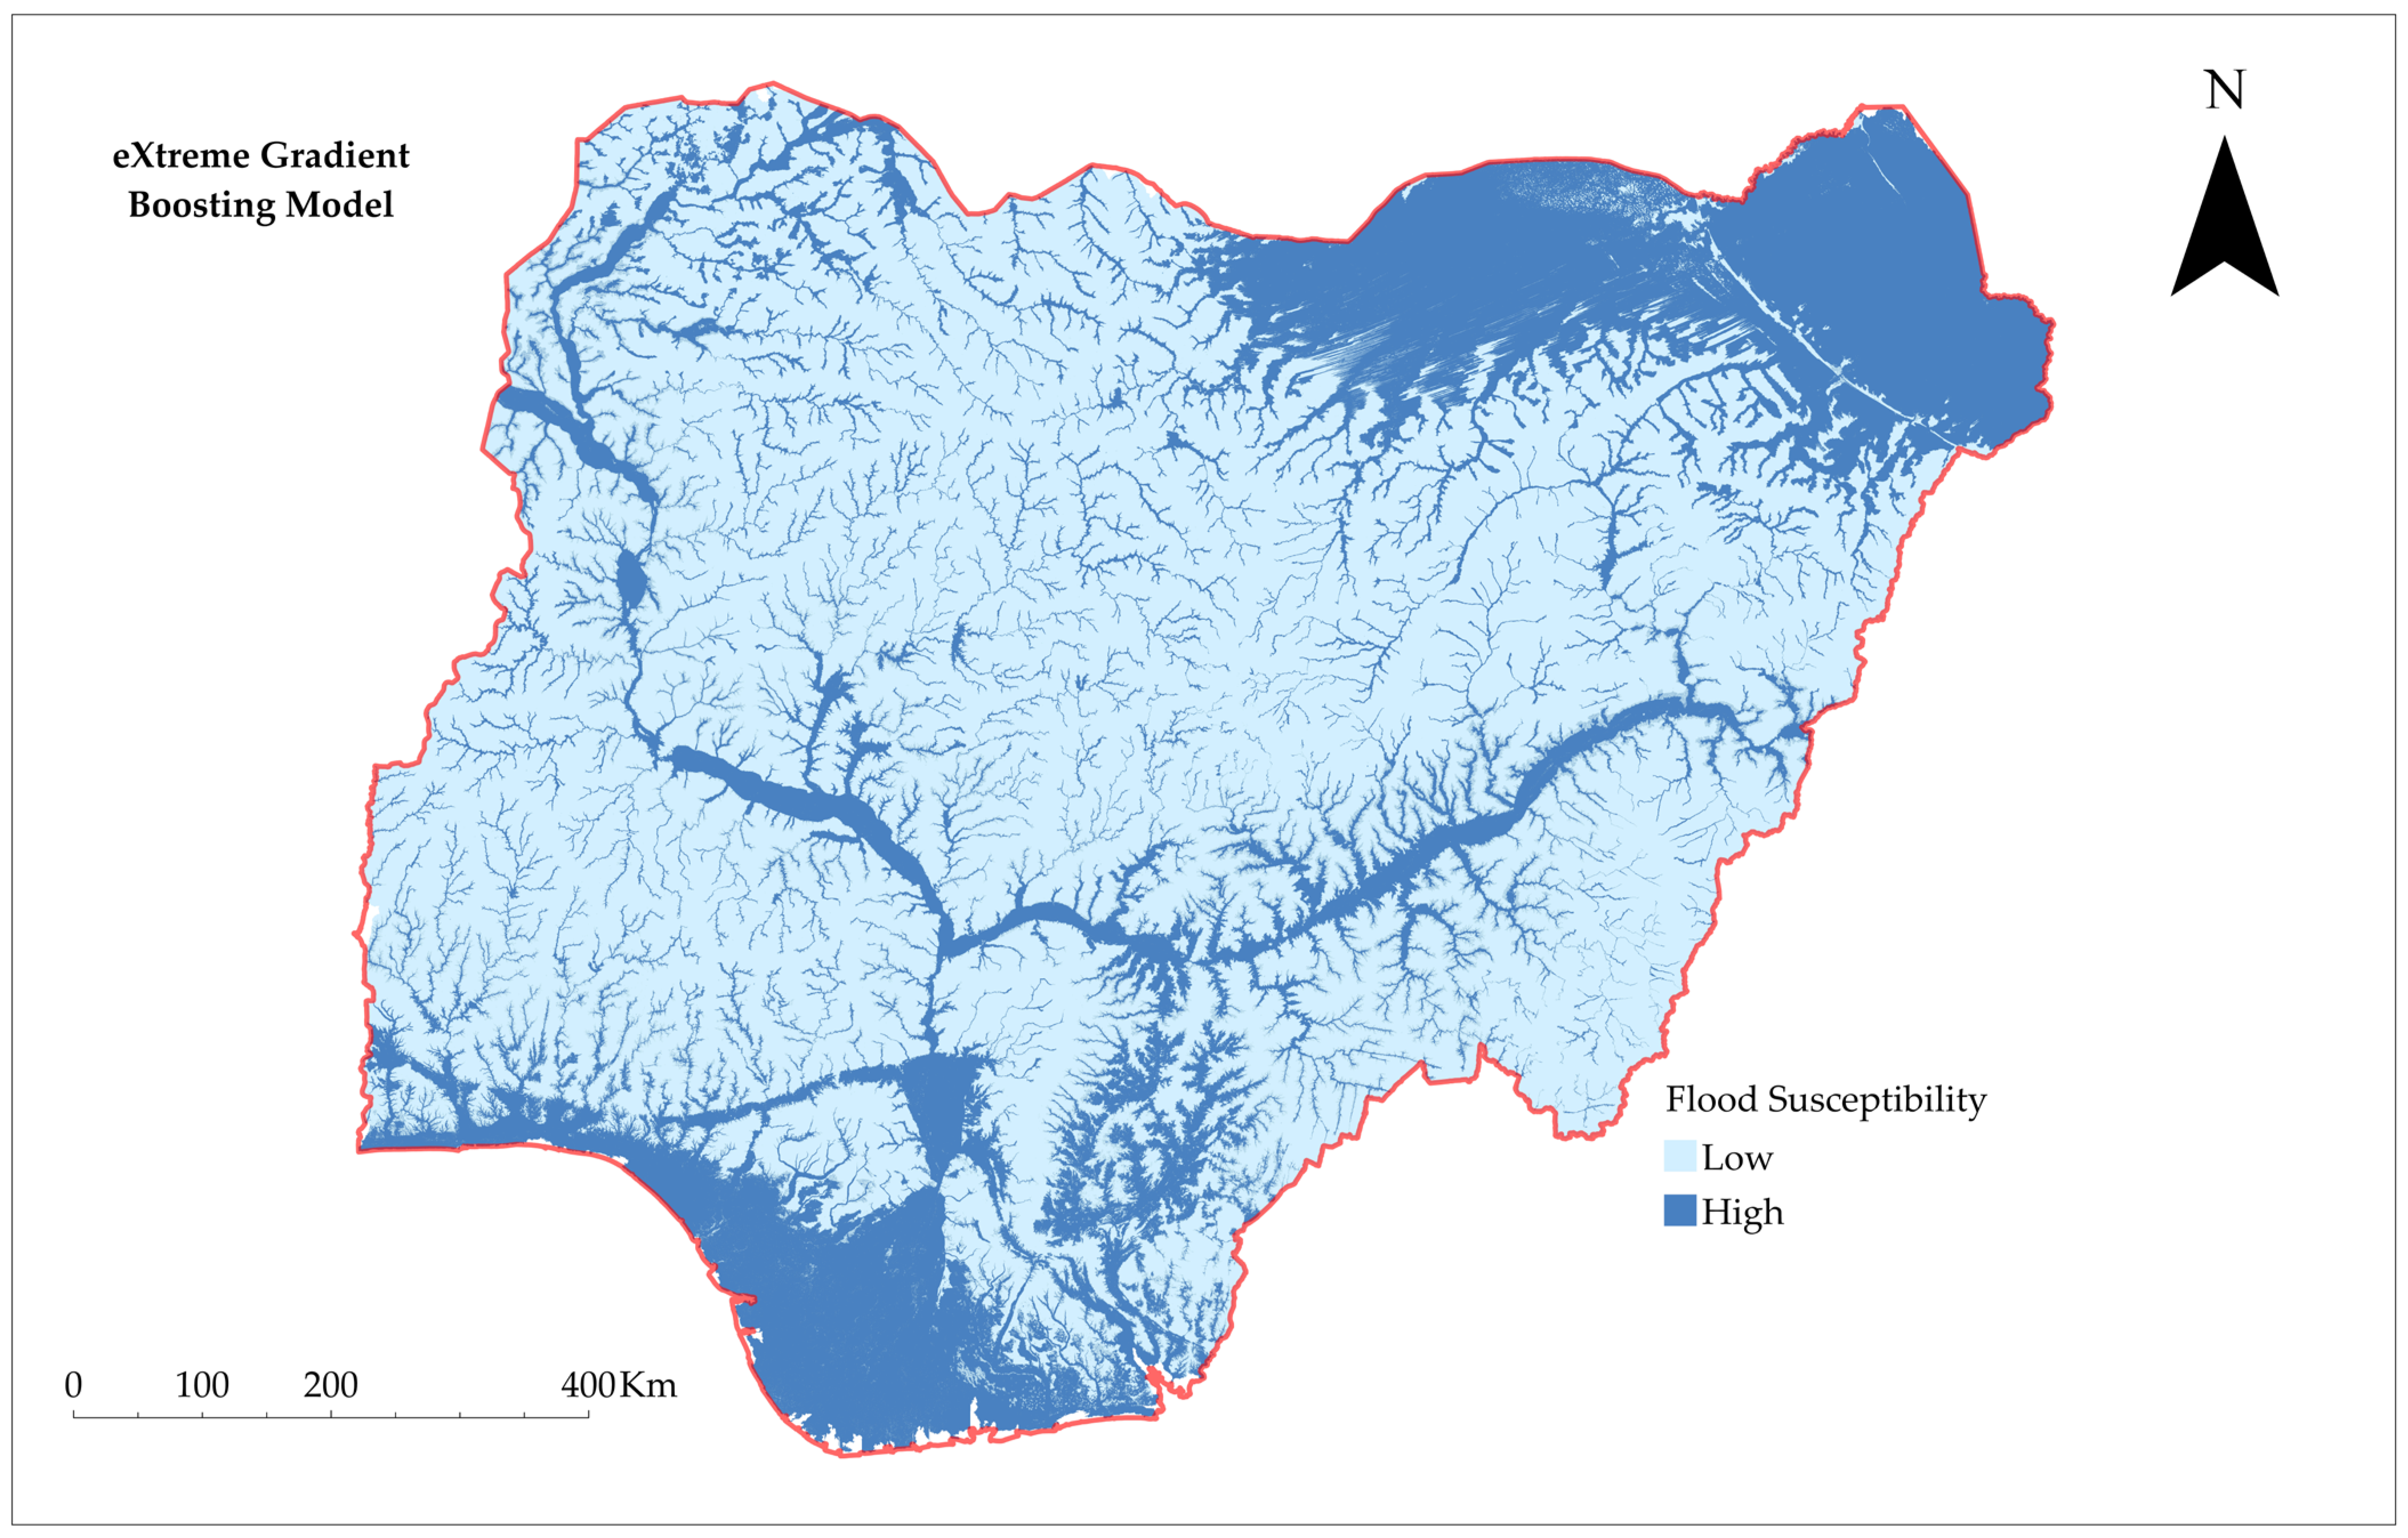
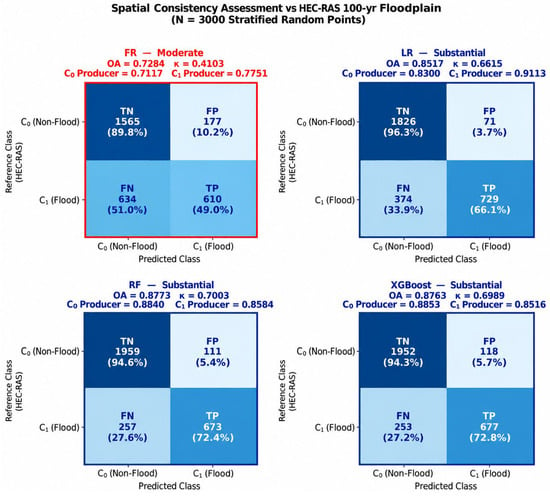
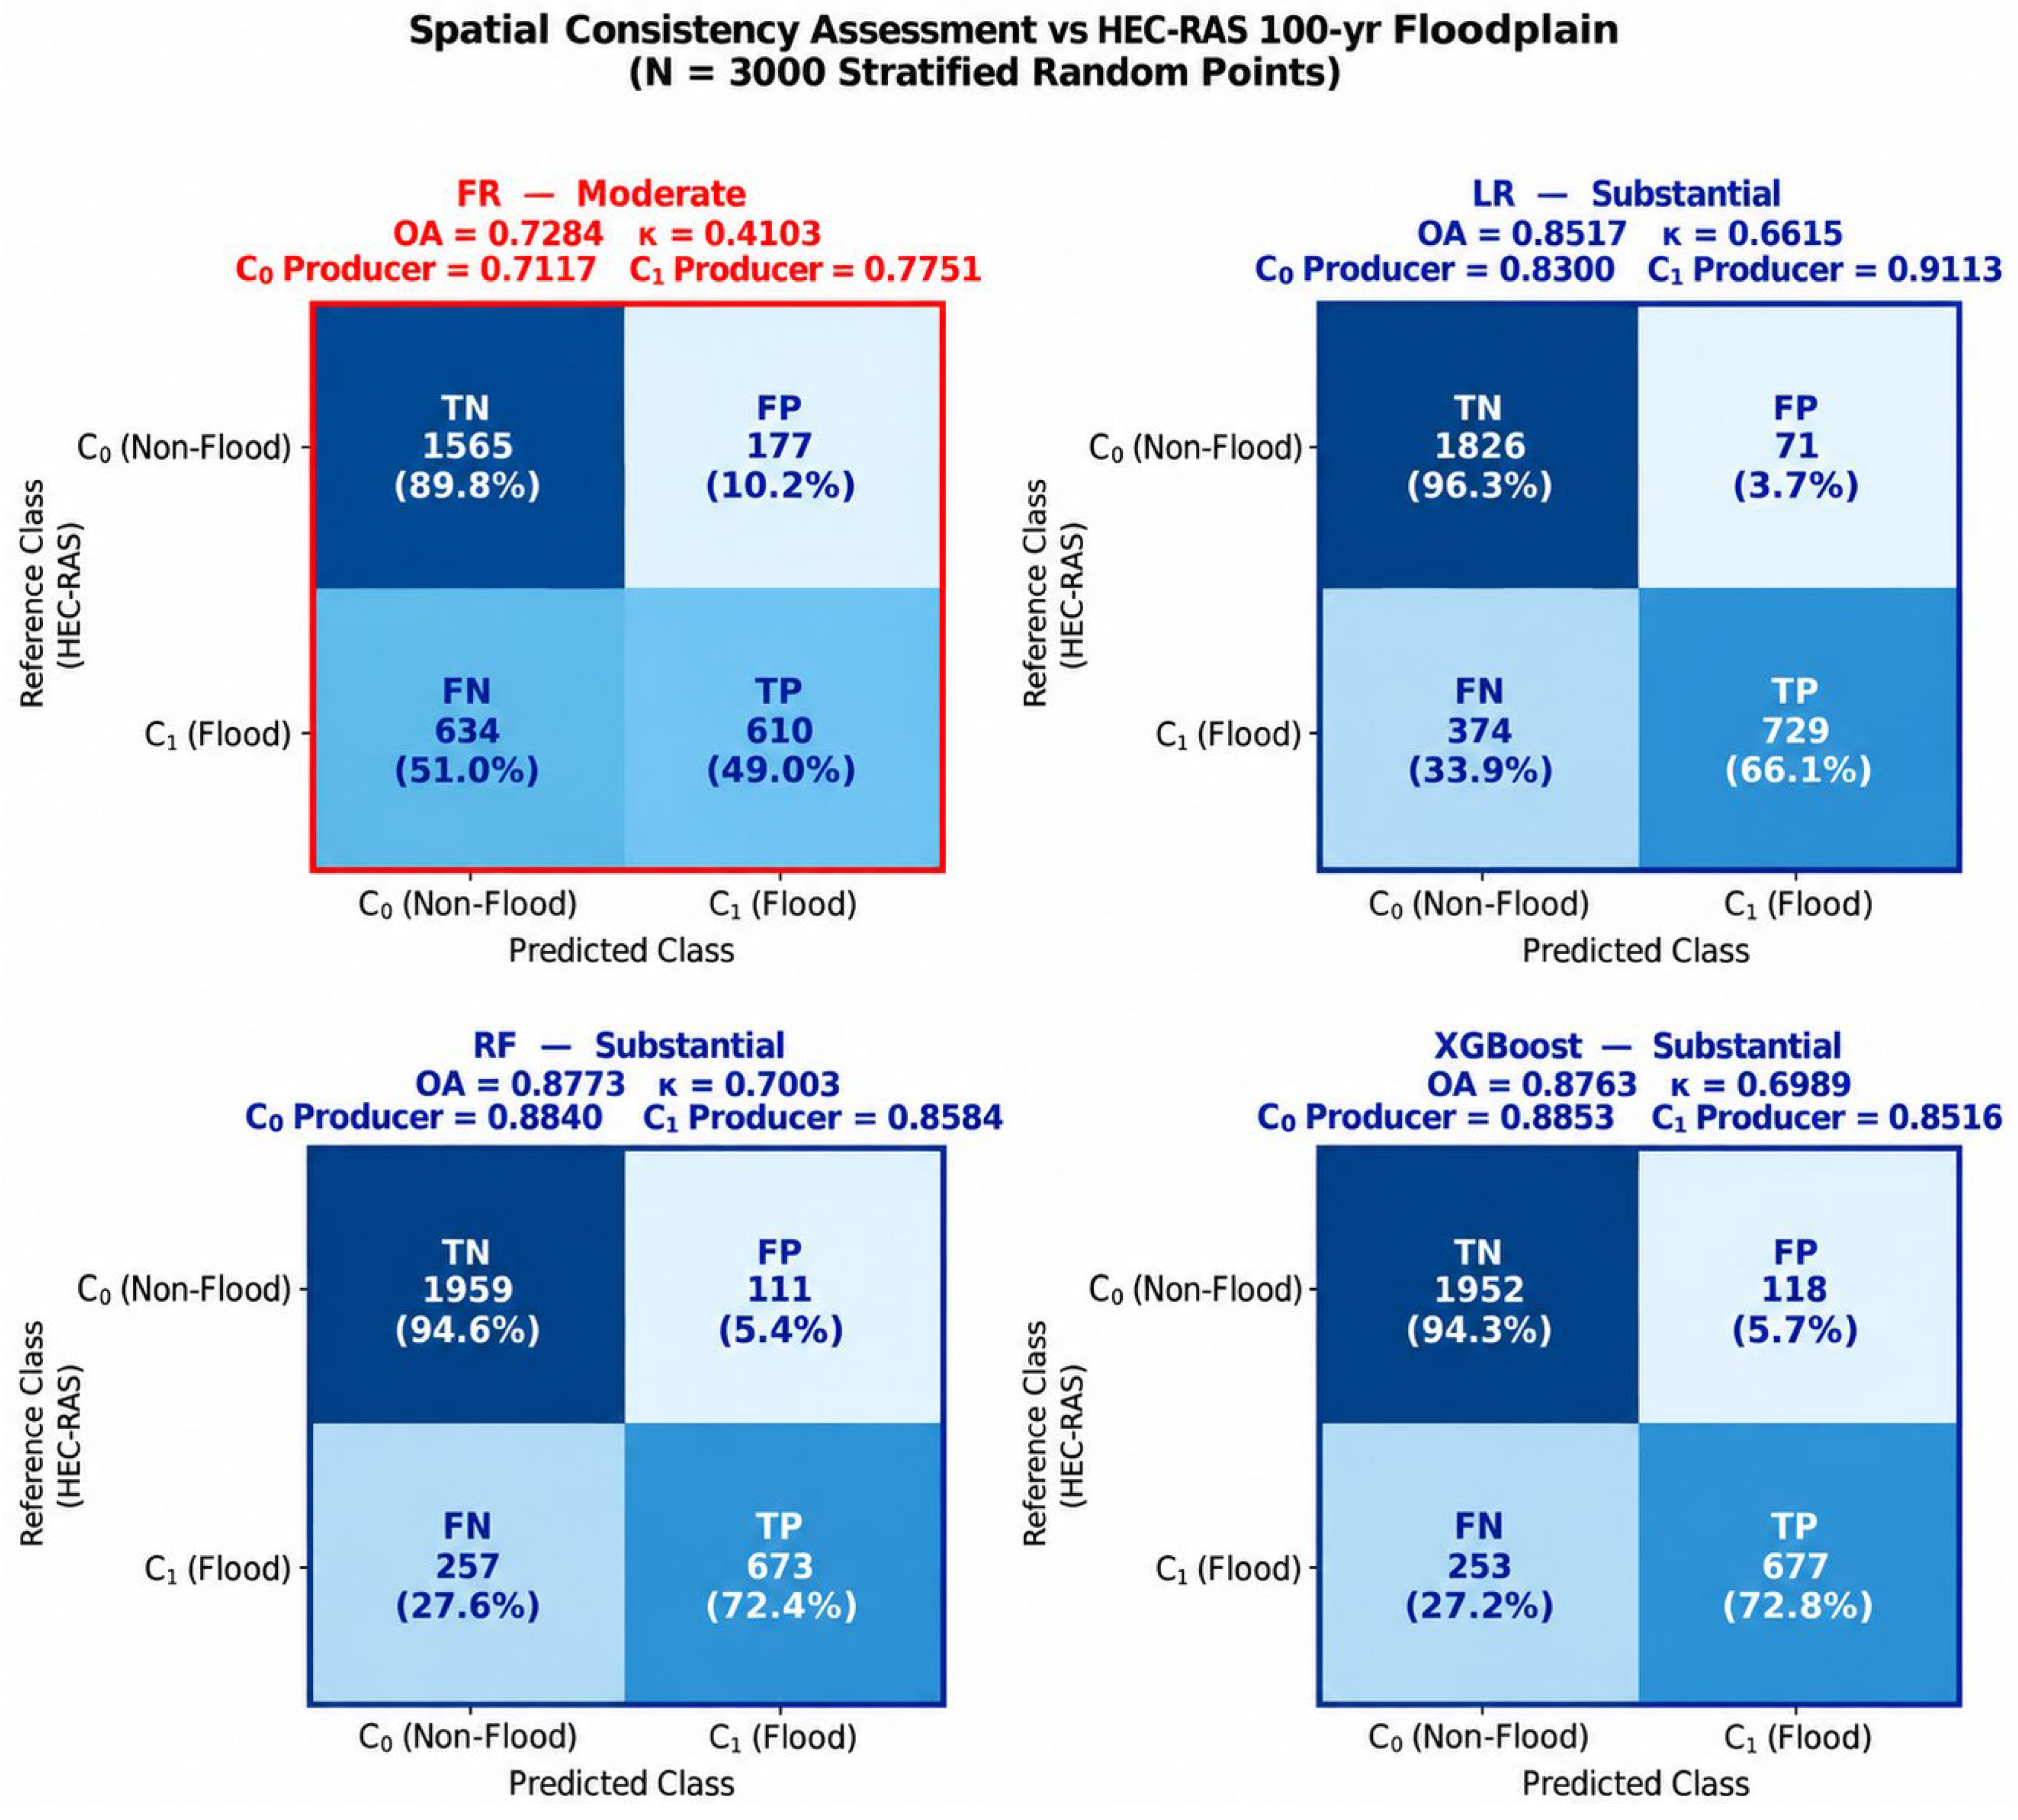
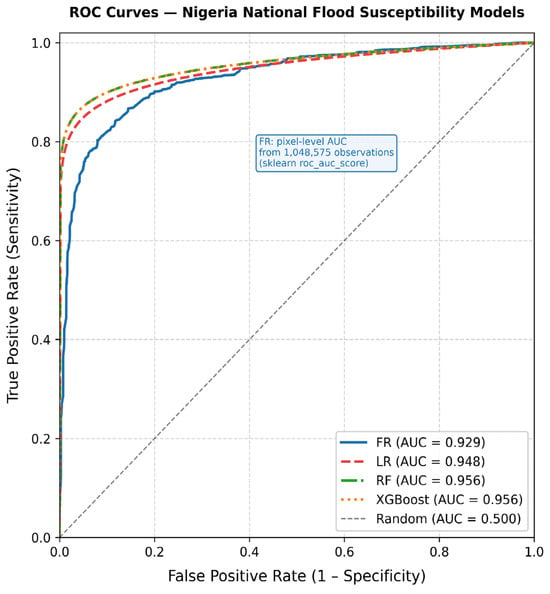
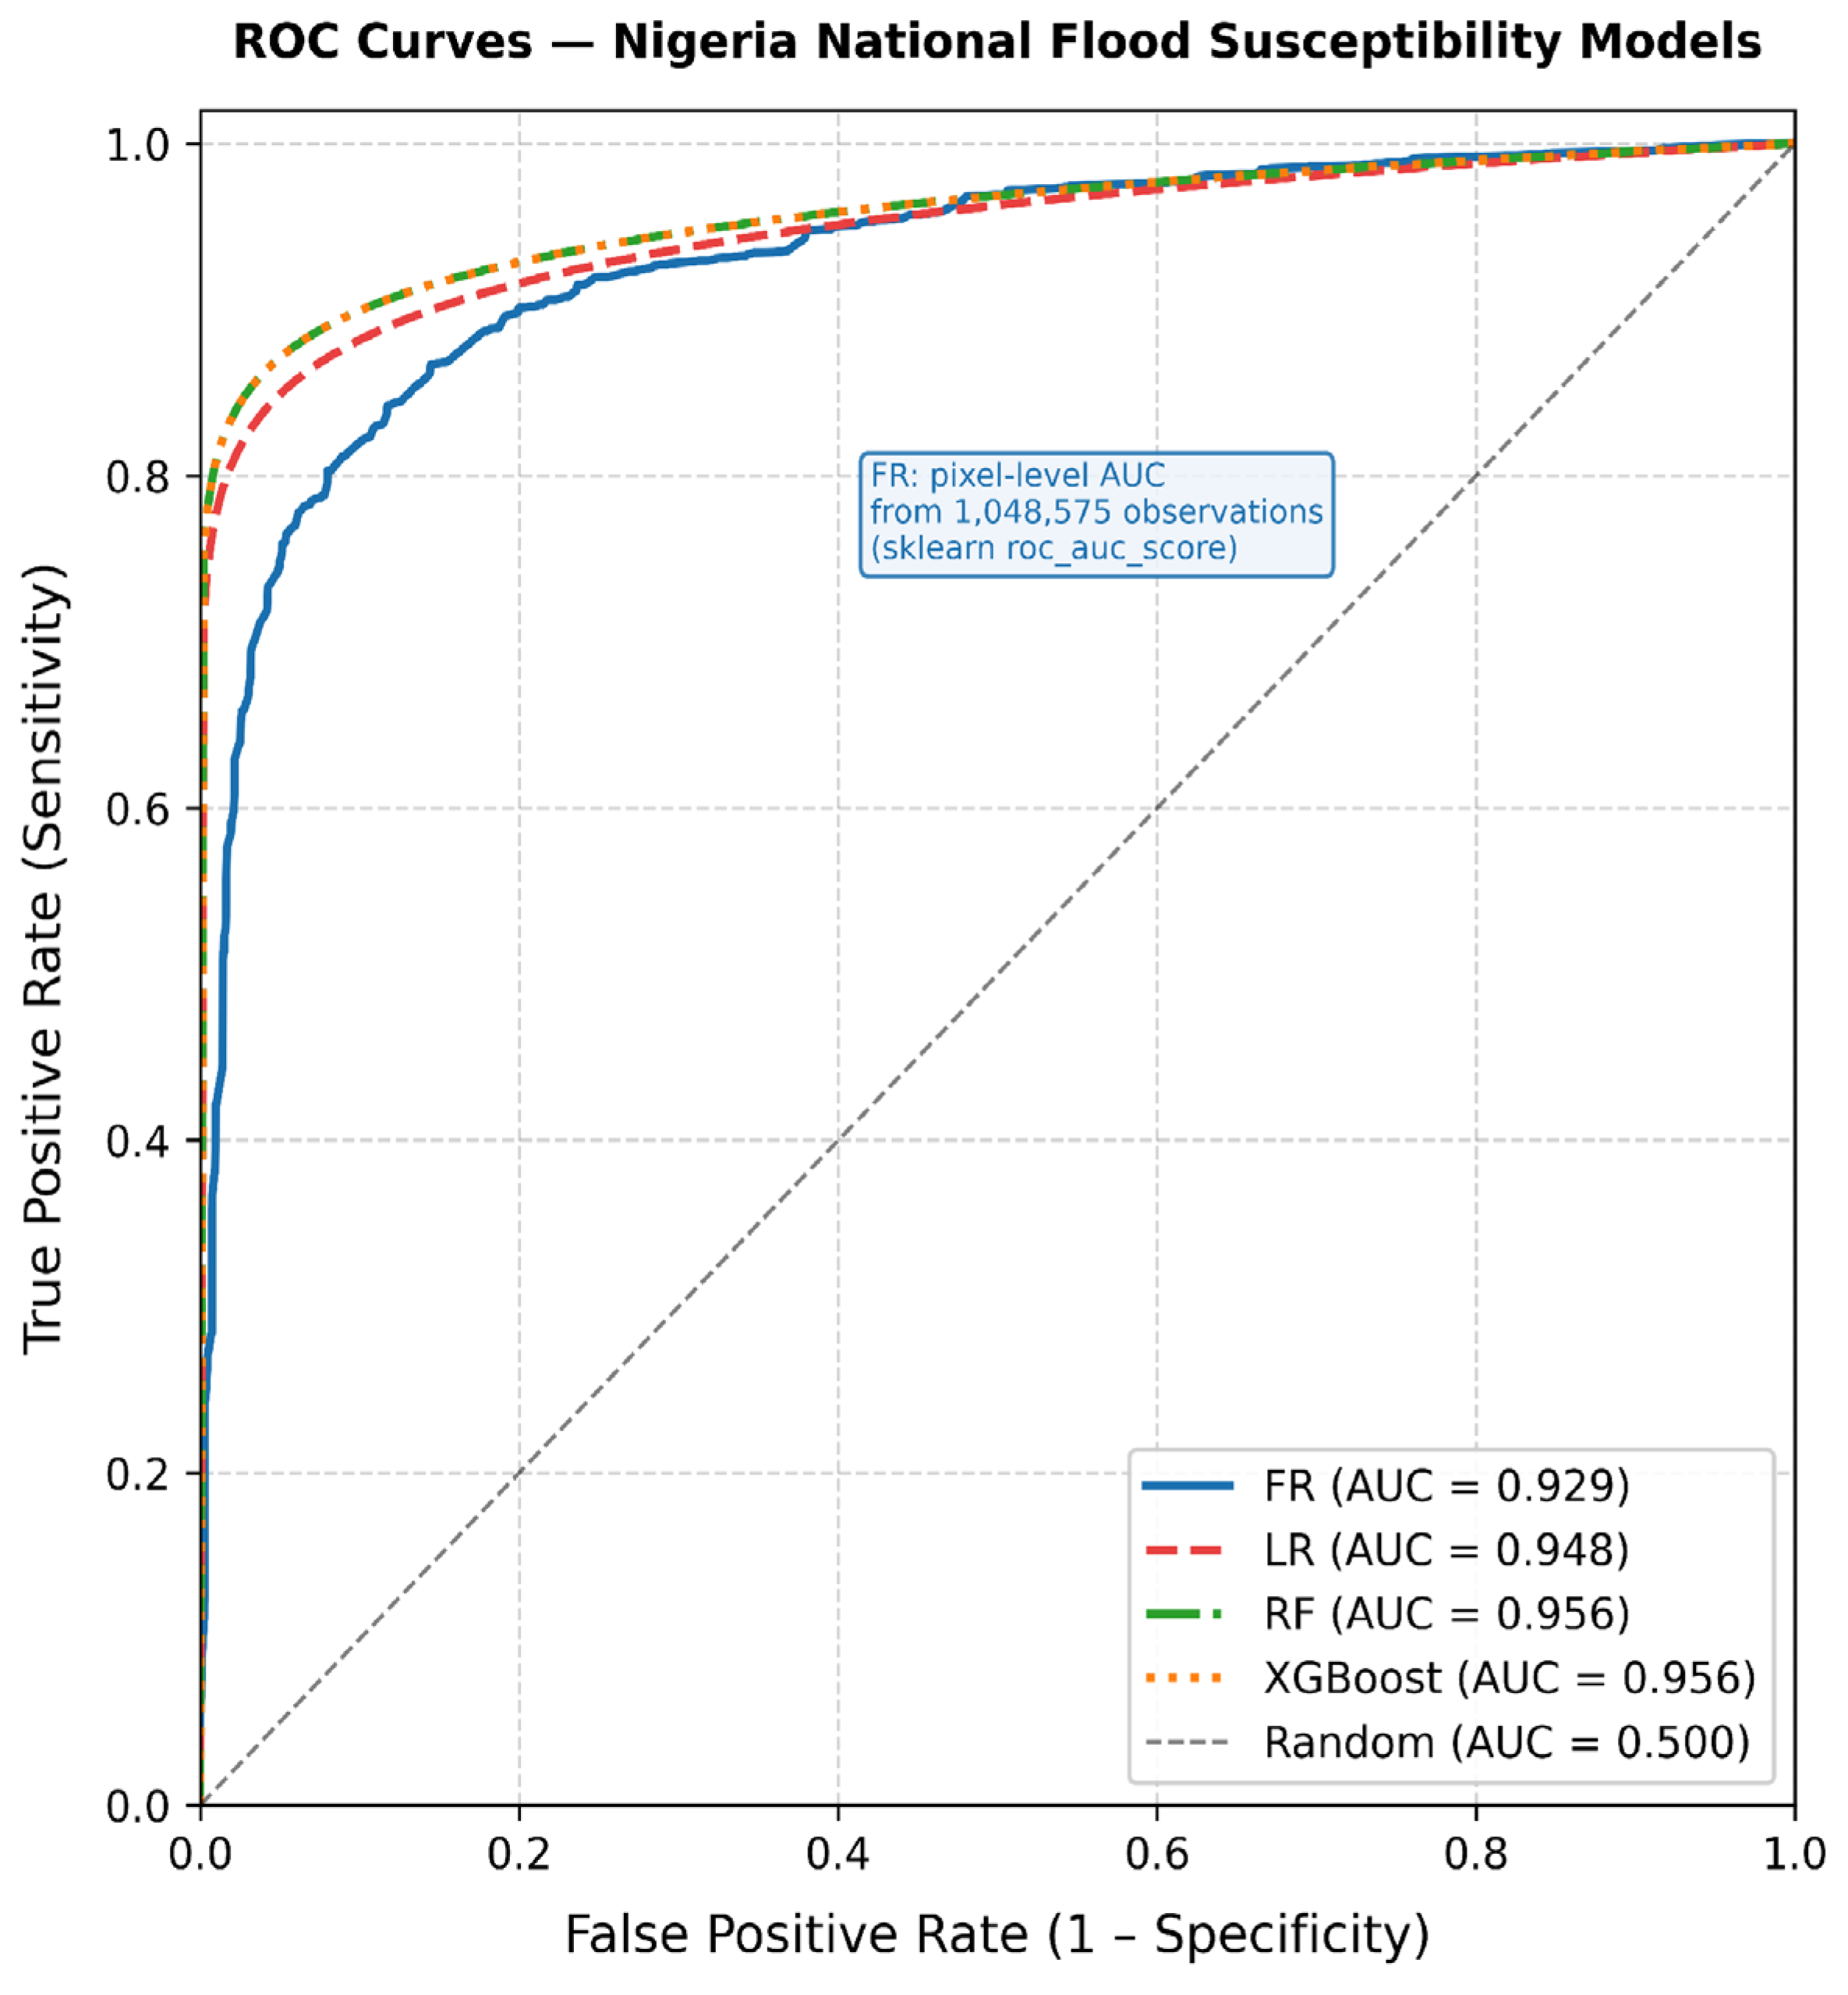
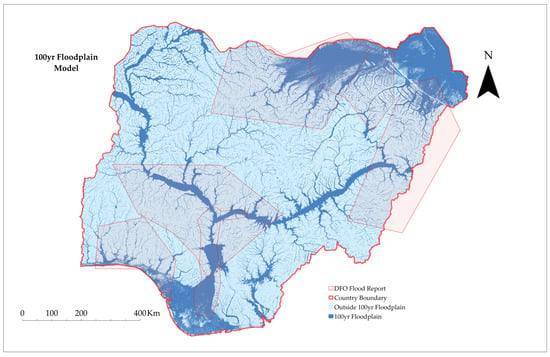
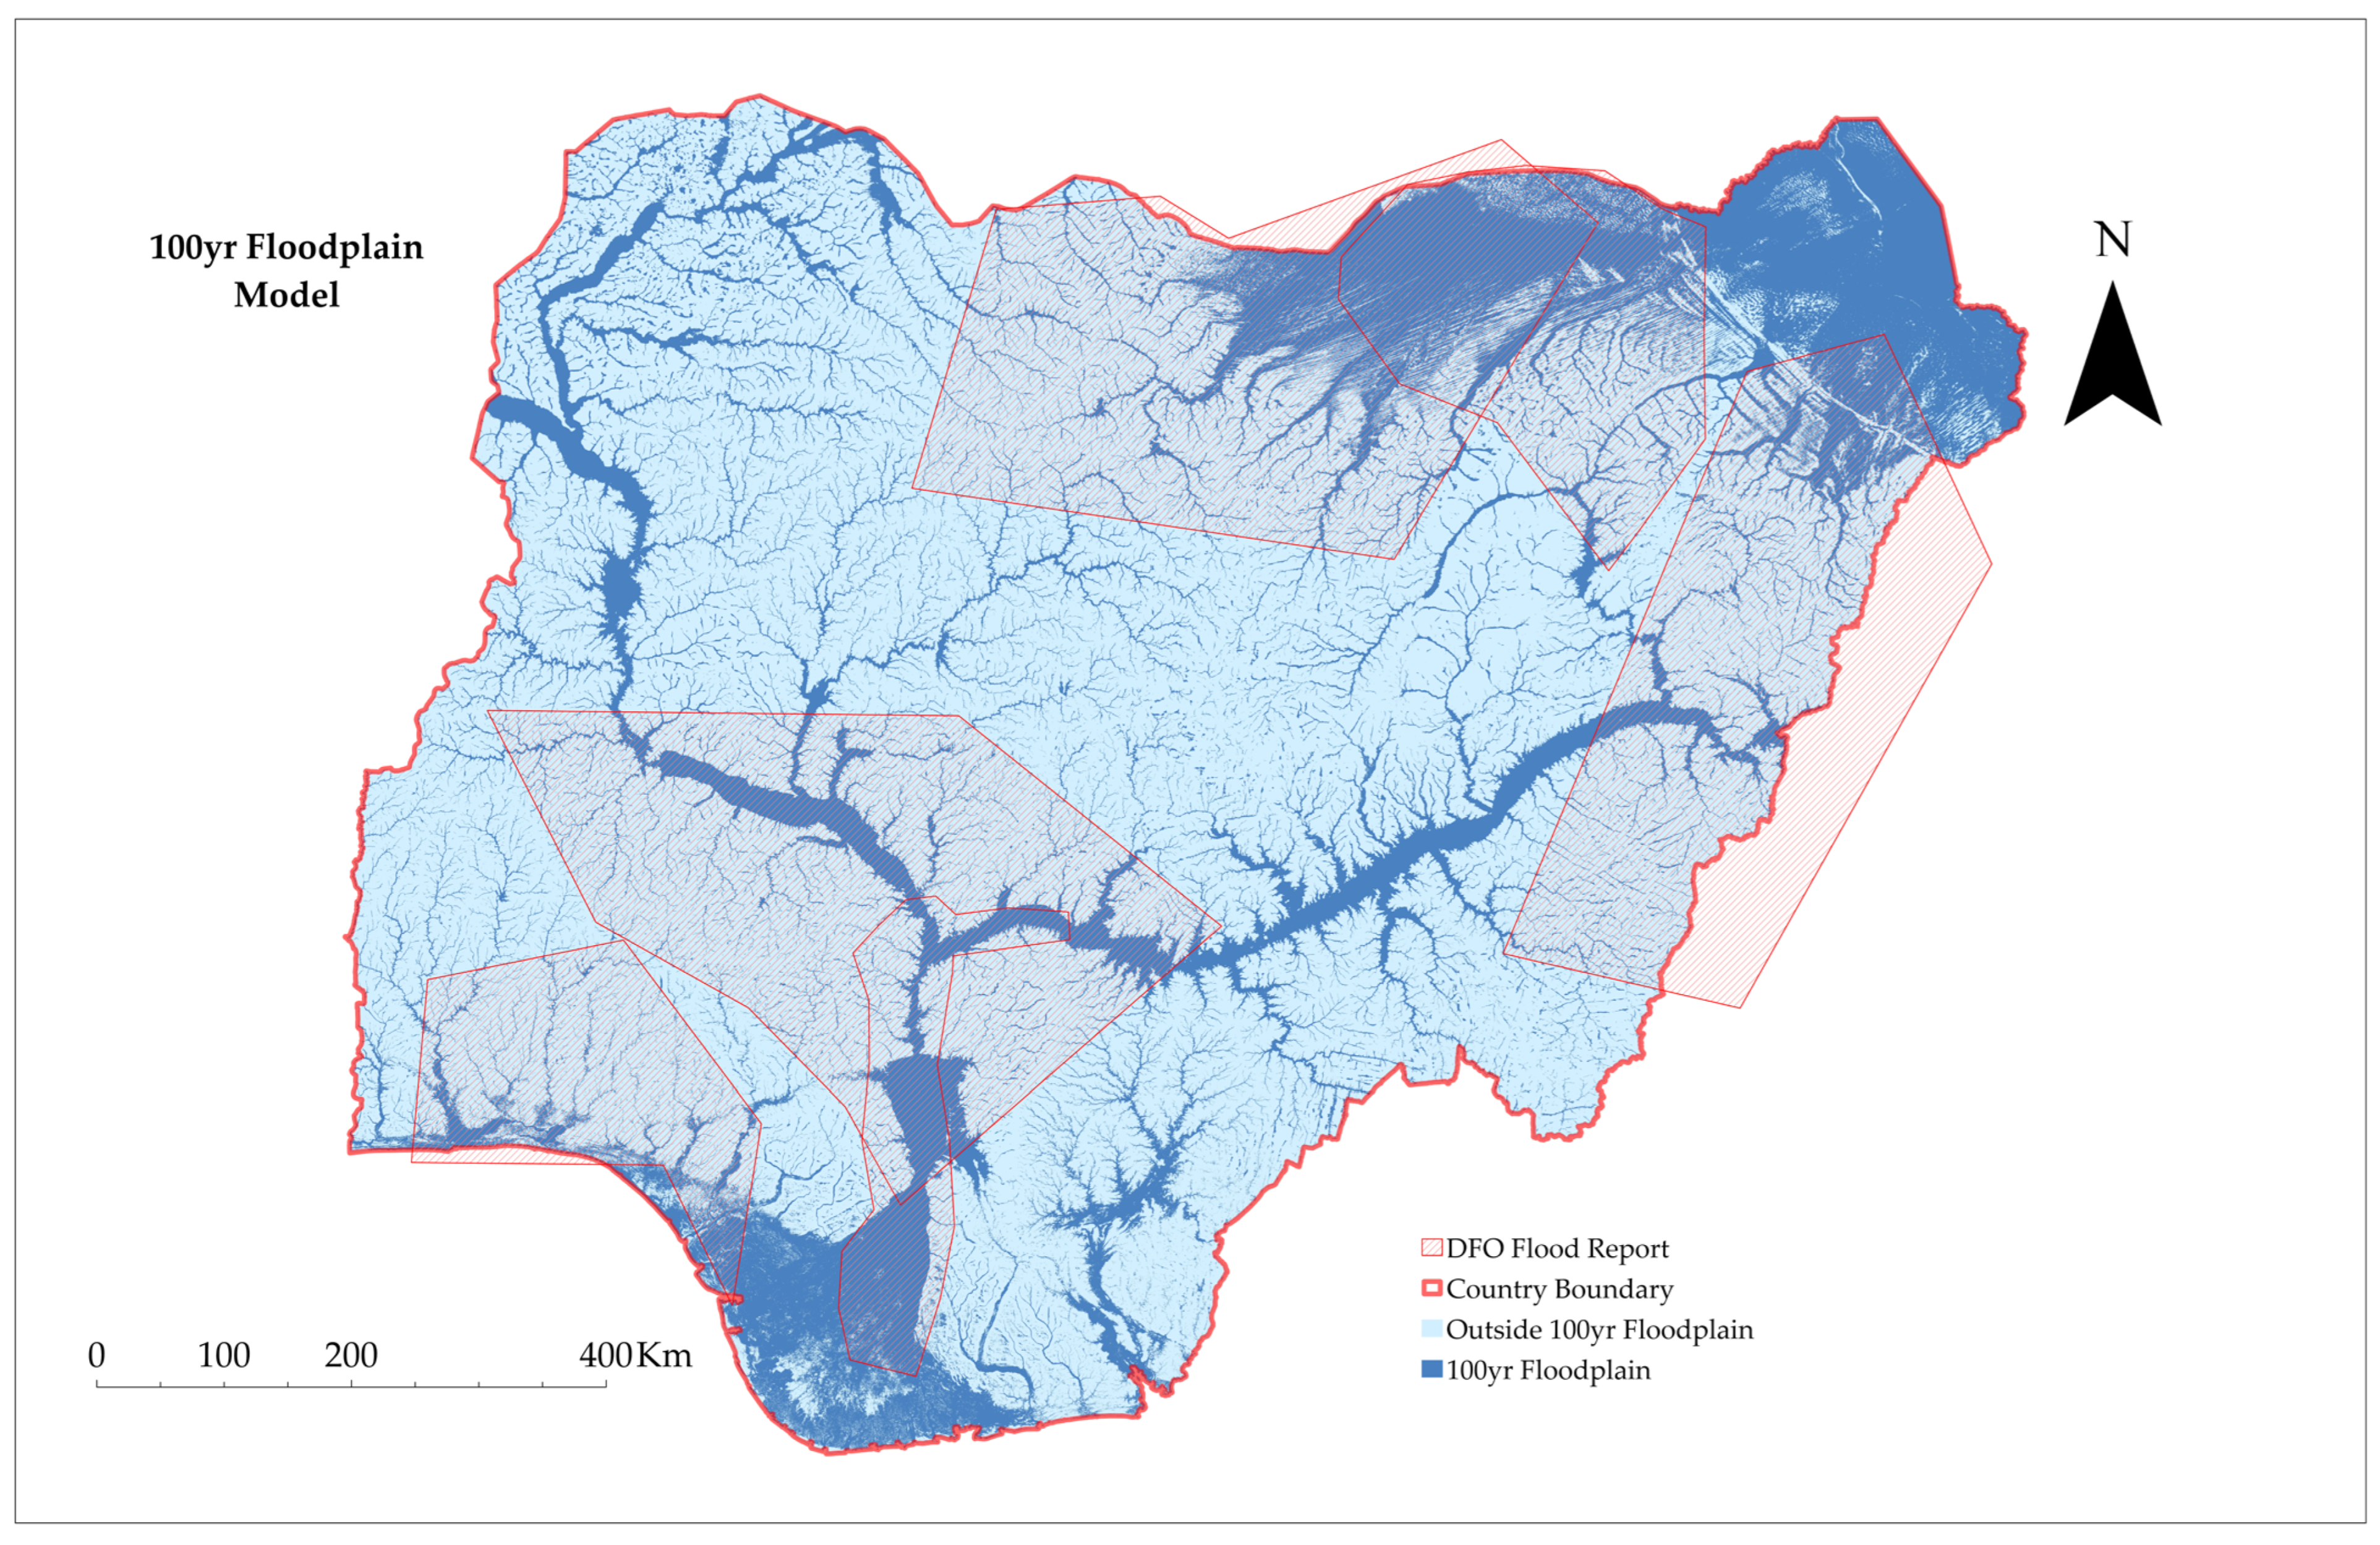
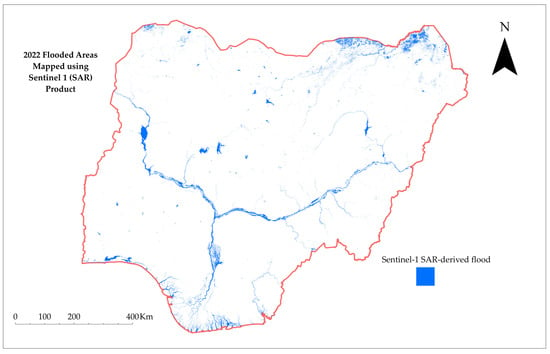
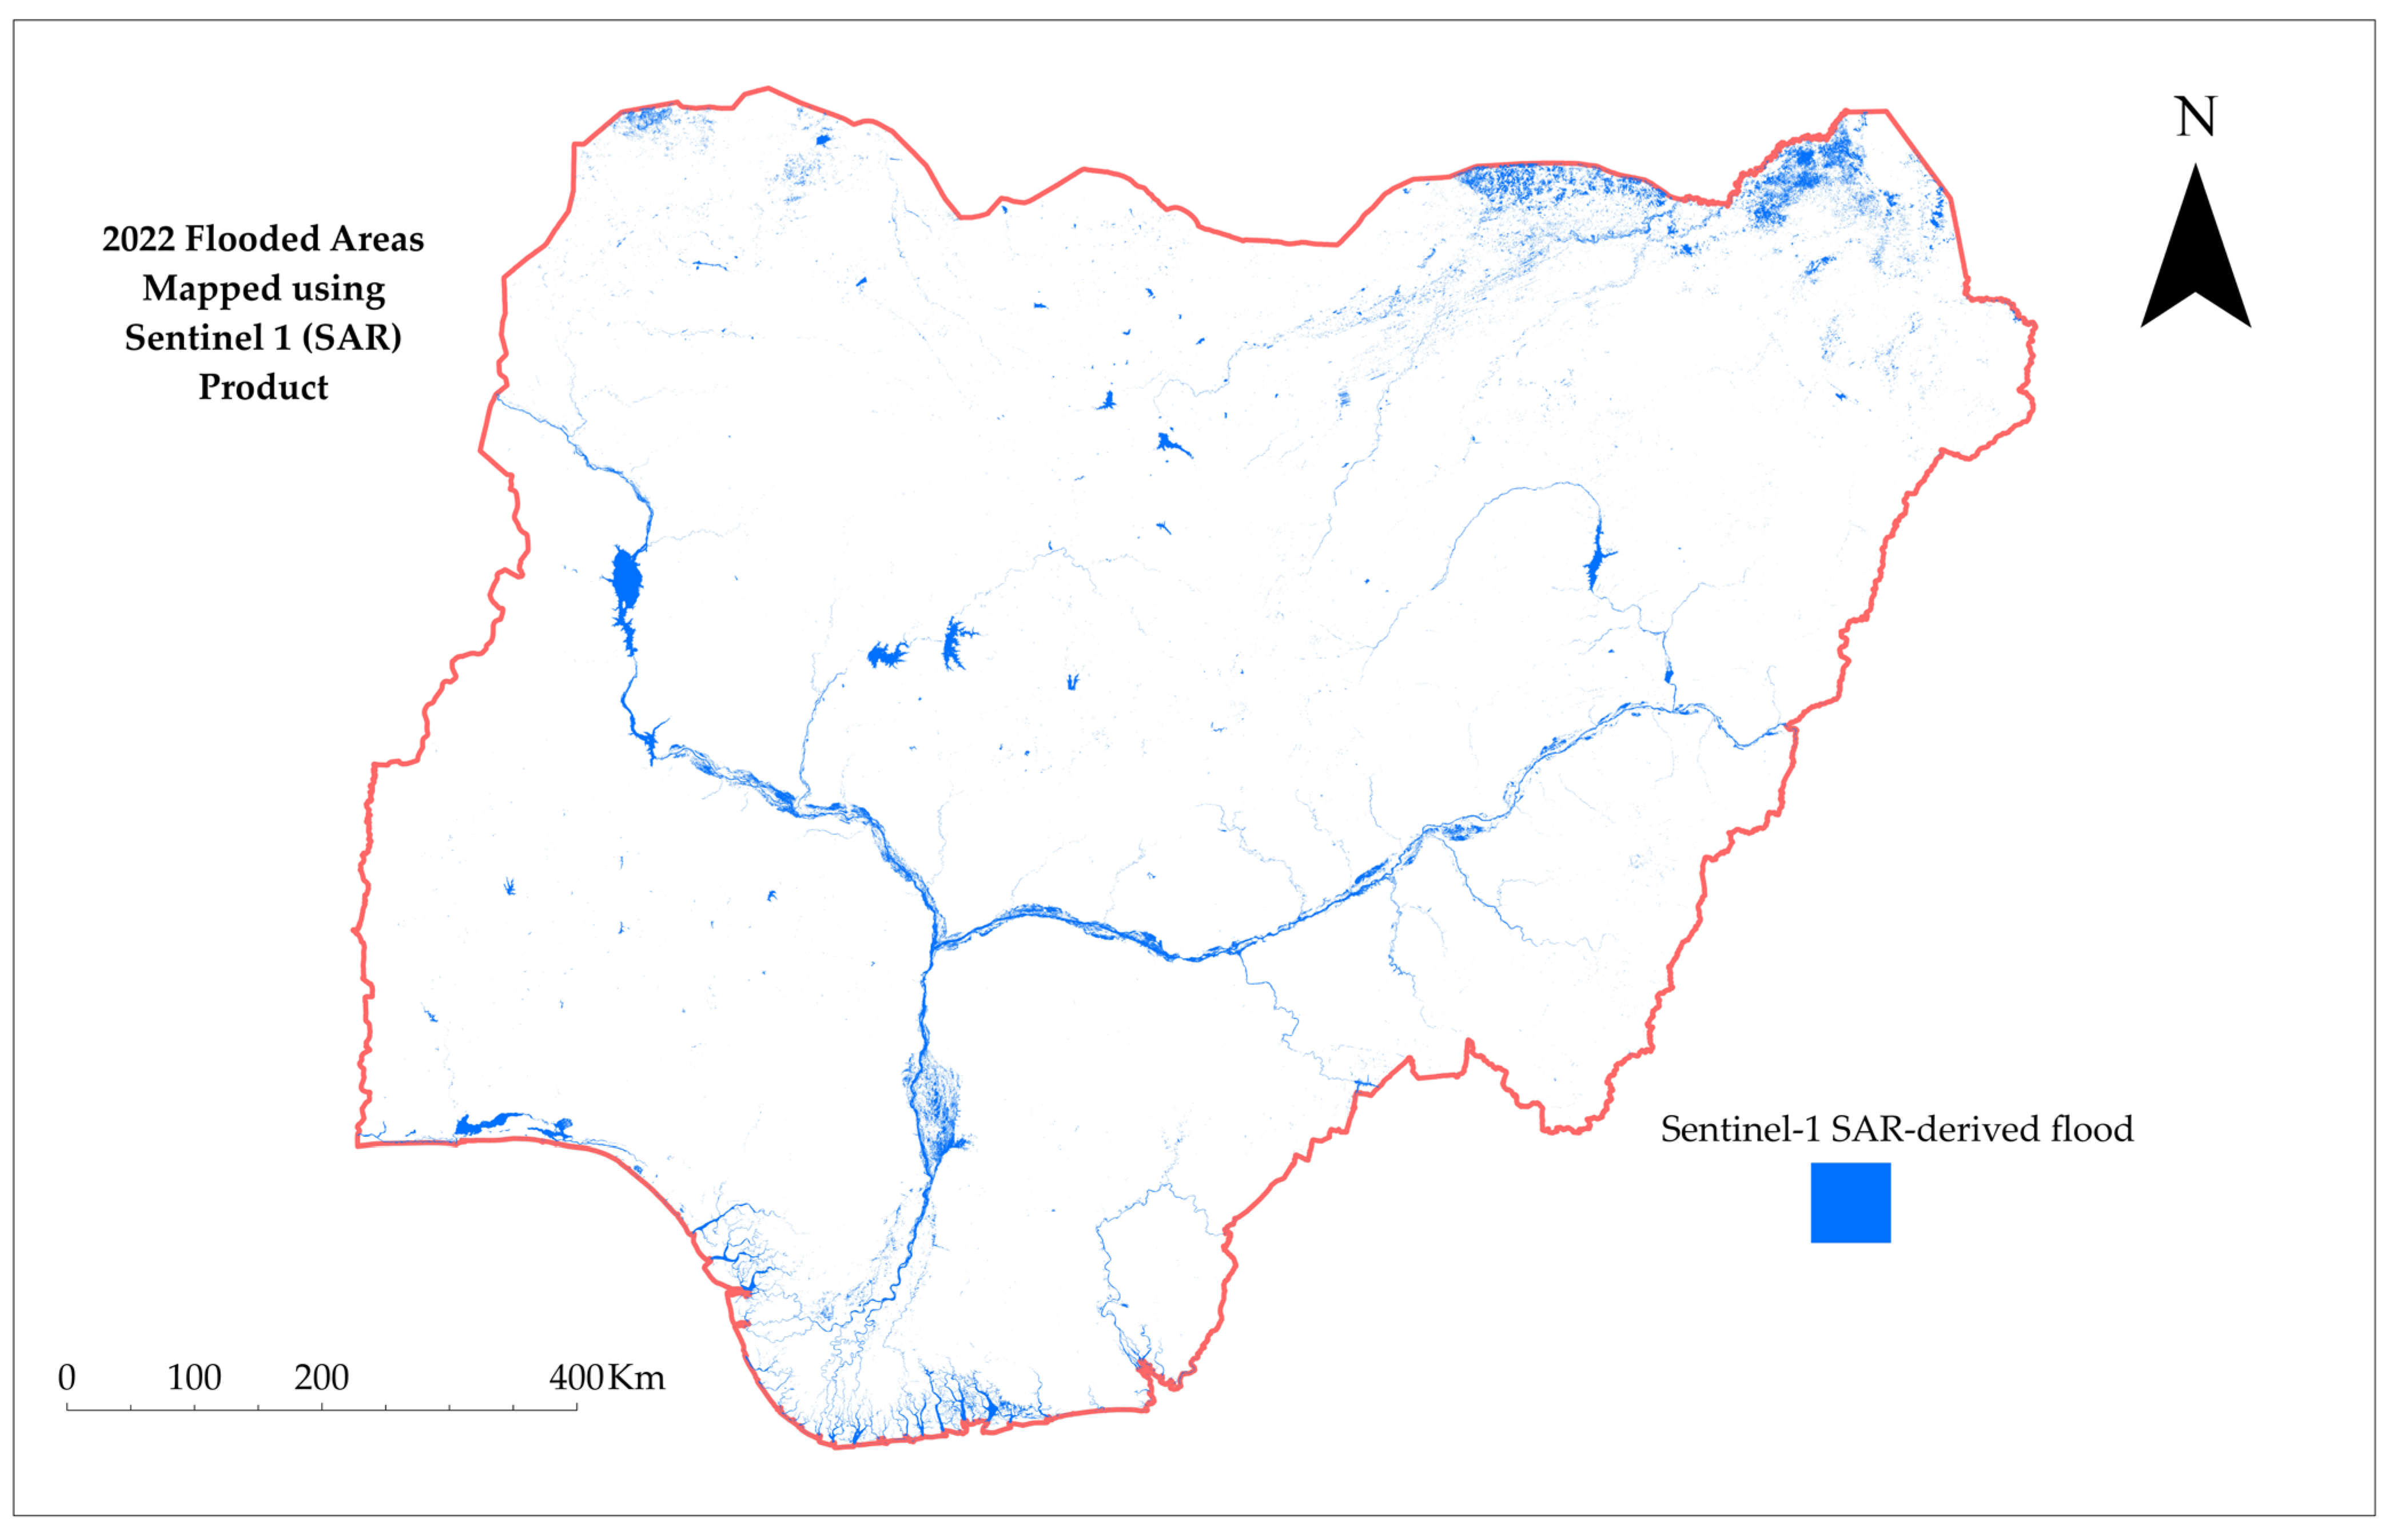

Disclaimer/Publisher’s Note: The statements, opinions and data contained in all publications are solely those of the individual author(s) and contributor(s) and not of MDPI and/or the editor(s). MDPI and/or the editor(s) disclaim responsibility for any injury to people or property resulting from any ideas, methods, instructions or products referred to in the content. |
© 2026 by the authors. Licensee MDPI, Basel, Switzerland. This article is an open access article distributed under the terms and conditions of the Creative Commons Attribution (CC BY) license.