Simple Summary
This study compared two brain imaging methods, 7T magnetic resonance spectroscopic imaging (MRSI), which can image metabolic processes, and 3T magnetic resonance fingerprinting (MRF), which can image magnetic relaxation times, in 12 people with brain tumors called gliomas. Our goal was to understand how well these two approaches corresponded to each other, and which metabolite or relaxation time map was closest to the clinical standard, a neuroradiologist’s tumor segmentation. In order to do this, we defined hotspots for each method and compared their overlaps. Additionally, we investigated the region around the tumor to look for evidence of possible tumor infiltration. The results of this study could improve how we use magnetic resonance imaging to monitor gliomas in patients.
Abstract
This paper investigated the correlation between magnetic resonance spectroscopic imaging (MRSI) and magnetic resonance fingerprinting (MRF) in glioma patients by comparing neuro-oncological markers obtained from MRSI to T1/T2 maps from MRF. Data from 12 consenting patients with gliomas were analyzed by defining hotspots for T1, T2, and various metabolic ratios, and comparing them using Sørensen–Dice similarity coefficients (DSCs) and the distances between their centers of intensity (COIDs). The median DSCs between MRF and the tumor segmentation were 0.73 (T1) and 0.79 (T2). The DSCs between MRSI and MRF were the highest for Gln/tNAA (T1: 0.75, T2: 0.80, tumor: 0.78), followed by Gly/tNAA (T1: 0.57, T2: 0.62, tumor: 0.54) and tCho/tNAA (T1: 0.61, T2: 0.58, tumor: 0.45). The median values in the tumor hotspot were T1 = 1724 ms, T2 = 86 ms, Gln/tNAA = 0.61, Gly/tNAA = 0.28, Ins/tNAA = 1.15, and tCho/tNAA = 0.48, and, in the peritumoral region, were T1 = 1756 ms, T2 = 102 ms, Gln/tNAA = 0.38, Gly/tNAA = 0.20, Ins/tNAA = 1.06, and tCho/tNAA = 0.38, and, in the NAWM, were T1 = 950 ms, T2 = 43 ms, Gln/tNAA = 0.16, Gly/tNAA = 0.07, Ins/tNAA = 0.54, and tCho/tNAA = 0.20. The results of this study constitute the first comparison of 7T MRSI and 3T MRF, showing a good correspondence between these methods.
1. Introduction
Over the last few decades, different approaches to magnetic resonance imaging (MRI), a non-invasive diagnostic technique that uses a strong magnetic field, dynamic gradient fields, and radio frequency pulses to create detailed images of the body’s internal structures with different types of contrasts, have been developed. Amongst other applications, MRI is a vital tool in the diagnosis, grading, and treatment monitoring of glioma, a type of brain tumor [1,2,3,4]. Modern MRI approaches include 3T MR fingerprinting (MRF) and 7T high-resolution MR spectroscopic imaging (MRSI), which aim to accumulate more specific information about gliomas than conventional T1/T2-weighted MR imaging, enhancing our understanding of these conditions [5,6].
1.1. Magnetic Resonance Spectroscopic Imaging
MRSI provides metabolic information beyond contrast-enhanced T1/T2 MRI. The methodology visualizes different neurochemical concentrations without the need for contrast agents, and is thus a powerful tool in the investigation of diseases that influence metabolite and neurotransmitter distributions in the brain, such as gliomas. Notably, certain metabolites, such as N-acetylaspartate (NAA), creatine (Cr), choline (Cho), glutamine (Gln), glycine (Gly), and myo-inositol (Ins), are well suited as neuro-oncological markers due to the differences in their concentrations between tumor and healthy brain tissue and because of their stability in spectroscopic imaging, based on the accumulated experience of 7T MRSI in gliomas [6,7].
Glutamine and glycine are amino acids that are involved in many metabolic processes in cells, including protein synthesis, energy production, and cell growth and re-pair [8,9]. For cancer cells, both glutamine and glycine can be their primary source of energy, and these compounds also play a role in the proliferation of cancer cells [10]. Choline, on the other hand, is a polyatomic ion that plays an important role as a precursor of the phospholipid phosphatidylcholine, a major component of cell membranes, which is vital for their structural integrity and fluidity. Cancer cells tend to have a high demand for choline to sustain their proliferation [11]. Ins is an abundant metabolite in the brain and has various biochemical functions including signal transduction, protein phosphorylation, gene expression, chromatin remodeling, and mRNA transport. It is found mostly in astrocytes and increased levels have been related to reactive gliosis and brain tumors, as well as neurodegenerative diseases and multiple sclerosis [12,13]. N-acetylaspartate (NAA) is used in magnetic resonance spectroscopy as a biomarker of neuronal health, integrity, and viability [14]. Using ratios between these metabolites instead of their absolute concentrations is more common in routine clinical practice due to their simpler acquisition and processing [15].
The MRSI approach we used acquires free induction decay (FID) signals, following concentric ring trajectories (CRTs) in k-space [16]. Apart from the method’s high sensitivity, one of its main advantages is its time efficiency. CRT-FID-MRSI can achieve high-resolution metabolic maps with a 64 × 64 × 39 matrix that covers the whole brain using an isotropic voxel size of 3.4 mm in 15 min, which presents a significant improvement compared to clinically available MRSI approaches. Due to the increased signal-to-noise ratio (SNR) and spectral resolution at higher field strengths, MRSI benefits from the use of modern ultra-high-field 7T systems. For example, it is possible to separate glutamate (Glu) and Gln at 7T, which is difficult at 3T due to the spectral overlap of the resonances of these metabolites [17].
1.2. Magnetic Resonance Fingerprinting
MRF, on the other hand, is a modern approach to mapping magnetic tissue properties, such as the T1 and T2 relaxation times [5]. Unlike conventional T1 and T2 mapping sequences, MRF derives the parameters of interest from a single acquisition wherein the flip angle, the repetition time (TR), and the echo time (TE) are varied pseudo-randomly during the acquisition of heavily undersampled data. The resulting data “fingerprint” can then be compared to a database, yielding T1 and T2 values. Since the result of this procedure is an actual T1 or T2 map and not just a T1- or T2-weighted image, MRF is considered a quantitative methodology, as it quantitatively estimates real physical quantities rather than providing arbitrary intensity parameters. These quantitative estimates are more useful as a basis for machine-learning models. Similar to CRT-MRSI, MRF uses non-Cartesian k-space sampling to improve upon conventional T1 and T2 mapping sequences by minimizing the total acquisition duration.
Morphologically, the T1 and T2 relaxation times can change as a result of a change in the microenvironment of the tumor. For example, an accumulation of water in the cancer increases both the T1 and T2 times, as relaxation times in free water are longer than in bound water [18,19].
1.3. Motivation and Purpose
Previously, the results obtained from MRSI acquisitions were compared to those of clinical positron emission tomography (PET) scans [7,20]. Now, we aimed to investigate the correlation between MRSI and MRF in glioma patients in this study, focusing on the correspondence between the hotspots identified in both methods. This constitutes an initial comparison of 7T MRSI and 3T MRF to determine whether these methods complement each other or whether they correlate.
The purpose of this work was to investigate, for the first time, whether metabolic changes detected by 7T MRSI correspond to structural changes found by 3T MRF in glioma patients by correlating the metabolic ratios of MRSI to T1 and T2 maps of MRF.
2. Materials and Methods
2.1. Study Population
We acquired the approval of the institutional review board of the Medical University of Vienna (protocol 1991/2018), as well as written, informed consent from all participants of this prospective study. Participants were selected consecutively between February and December 2019. The inclusion criteria were a suspected glioma diagnosis, as well as informed consent, and the absence of MRI contraindications. Subjects were excluded if they were not eligible for a 7T MRI, if the MRSI data quality was too poor to allow a reasonable data analysis based on the rejection criteria explained in Section 2.2, or if the subject’s tumor could not be histologically confirmed as a glioma.
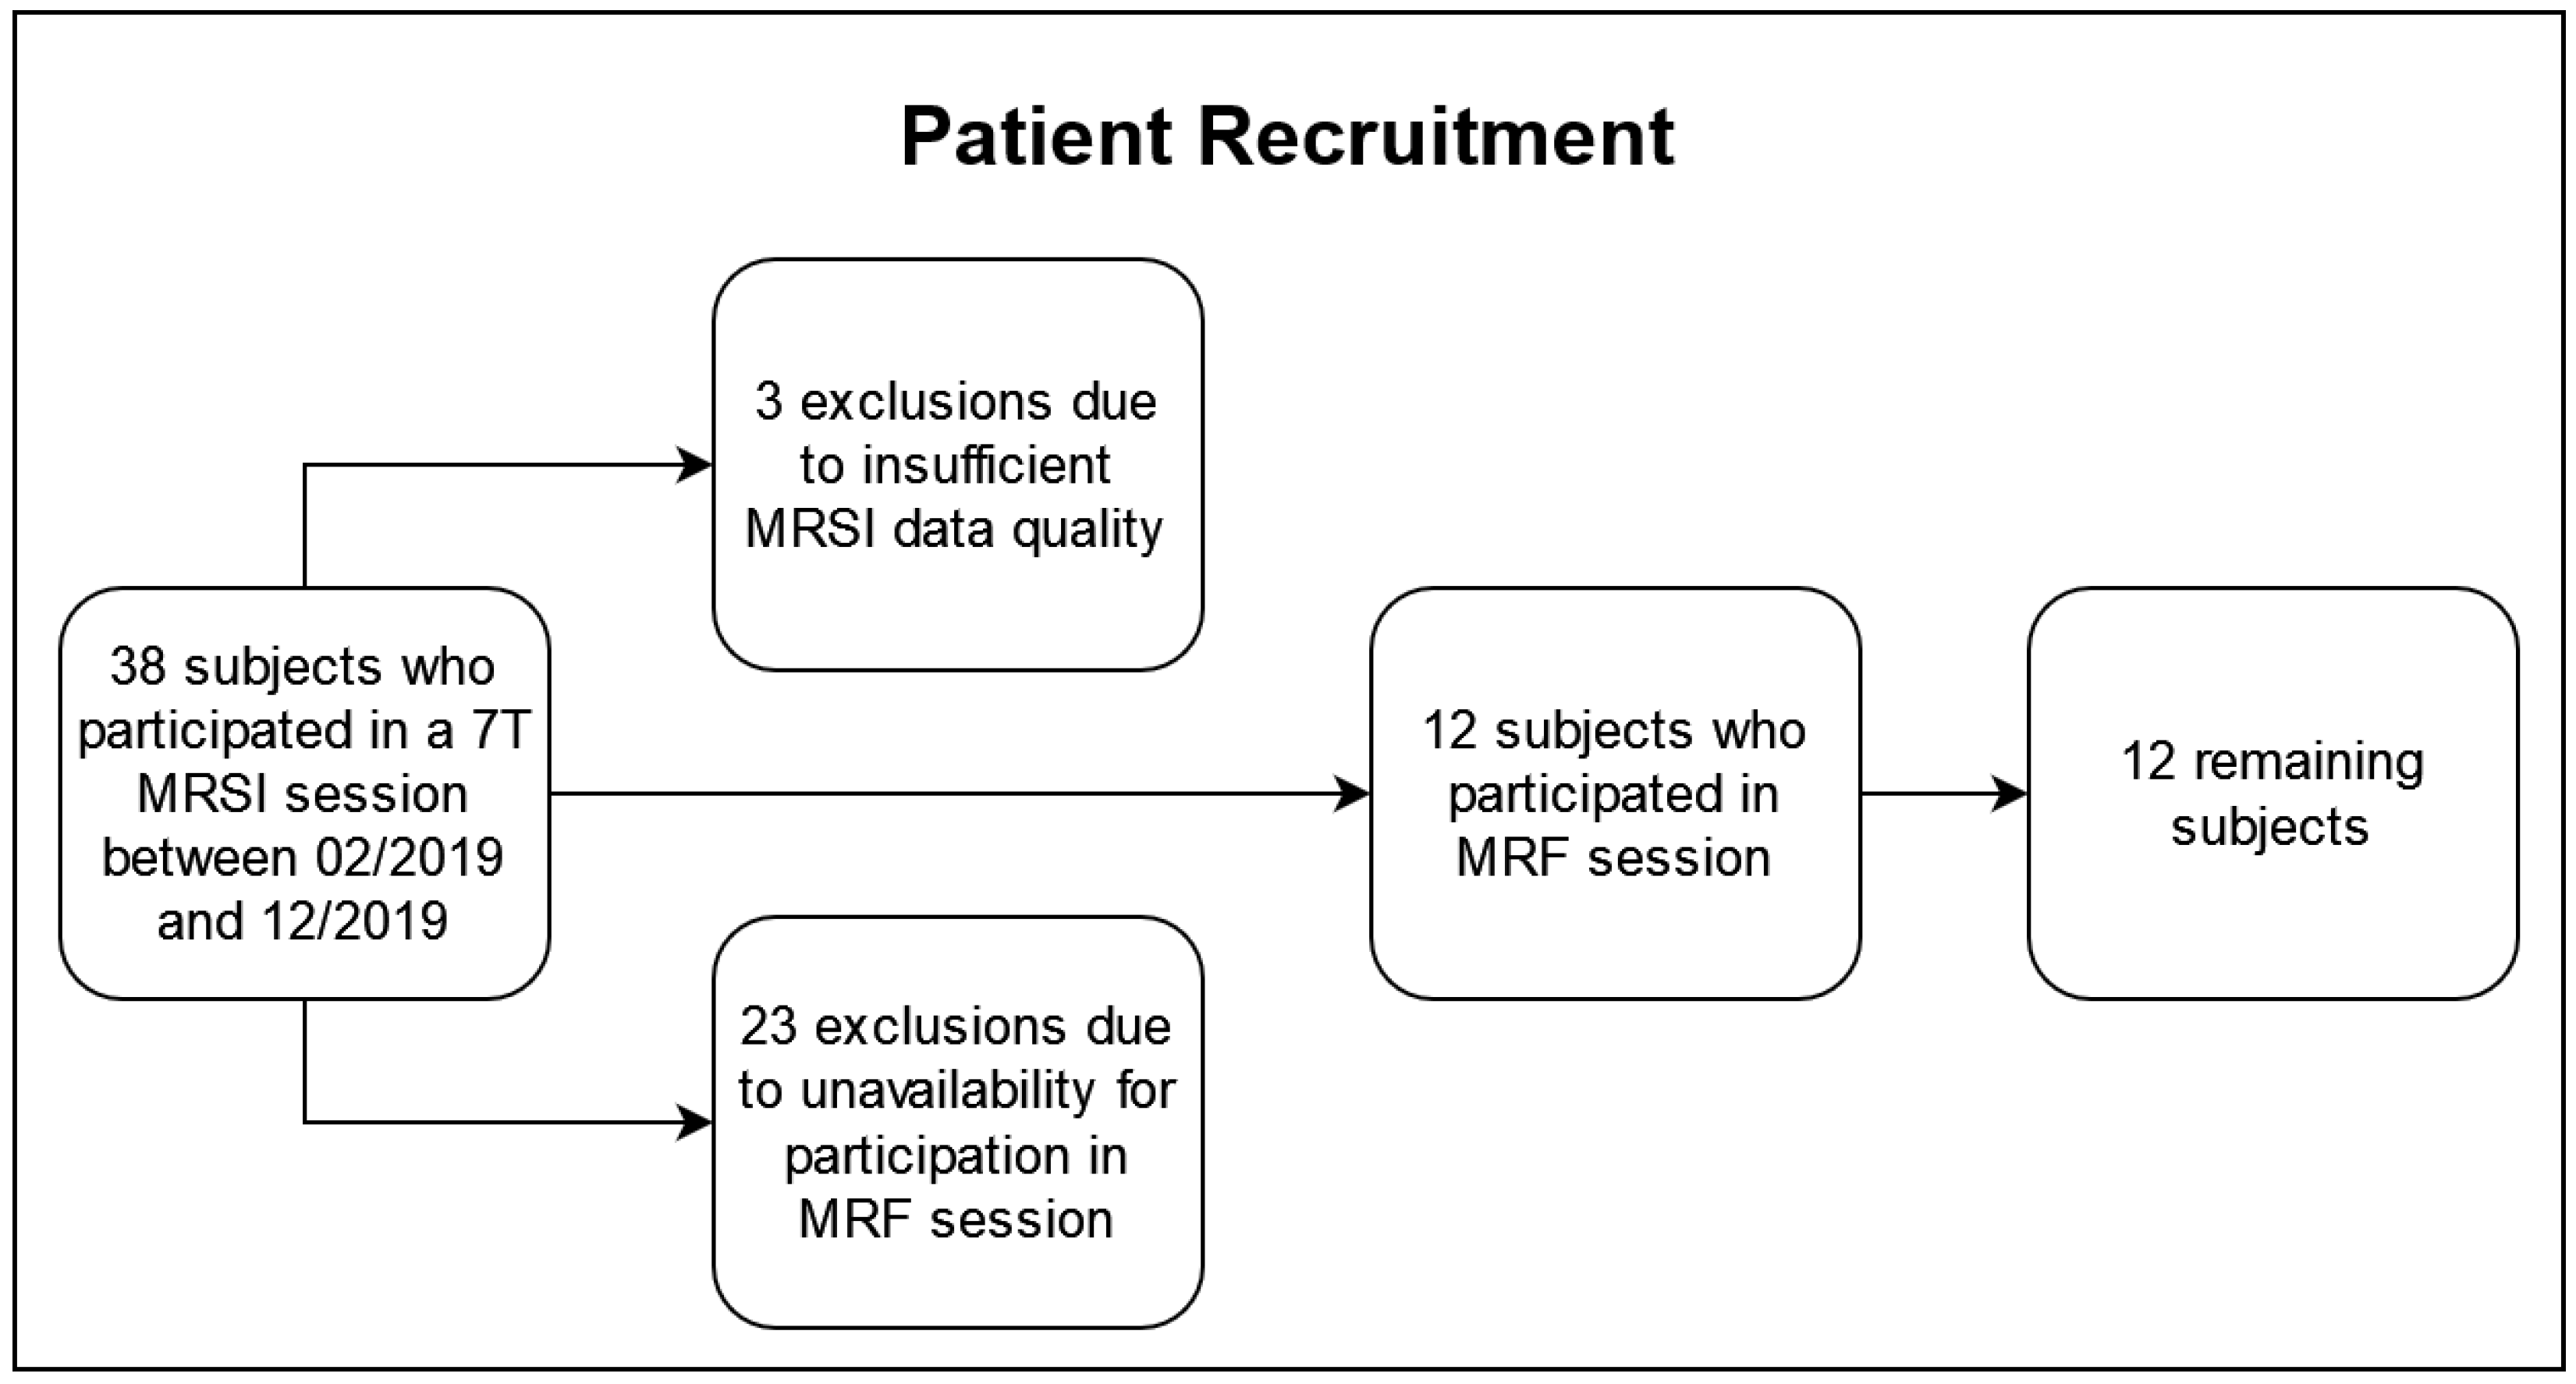
The patient recruitment is illustrated in Figure 1. Of the 38 subjects who underwent a 7T MRSI protocol, three were excluded based on our quality criteria described in Section 2.2 and 23 were unavailable for the additional MRF session. The remaining 12 subjects (five females, seven males), 48 ± 15 years of age, participated in a 3T and a 7T session within 50 h (median: same day) to guarantee consistency and comparability across the data sets. In the cohort, there were two IDH-mutant grade 2 astrocytomas, three IDH-mutant grade 3 astrocytomas, two IDH-mutant grade 2 oligodendrogliomas, one IDH-mutant grade 3 oligodendroglioma, and four IDH-wildtype grade 4 glioblastomas, according to the 2021 WHO classification of gliomas [21]. The patient cohort is listed in Table 1, and it overlapped with a cohort in previous papers (see Table S1) [6,7].

Figure 1.
Flowchart of the recruitment for this study.

Table 1.
An overview of the cohort containing 12 patients, including the histological diagnosis according to the WHO 2021 classification, the tumor grade, the IDH1 mutation status (IDH1 mutant, Mut; or wild type, WT), the age at the time of the 7T MRSI measurement in years (average: 48 ± 15), and the patient’s sex (5 females, F; and 7 males, M).
2.2. MRSI Protocol and Data Processing
The MRSI protocol was performed on a 7T Magnetom scanner (Siemens Healthineers, Erlangen, Germany) using a 1 Tx/32 Rx head coil (Nova Medical, Wilmington, MA, USA) and consisted of a T1-weighted MP2RAGE as the morphological reference, a B0 field map, a B1 field map for flip-angle optimization, and a CRT-FID-MRSI scan (TR = 450 ms, acquisition delay AD = 1.3 ms; FOV = 220 × 220 × 133 mm3, resolution = 3.4 × 3.4 × 3.4 mm3, TA = 15 min) [6,16].
MRSI post-processing used the previously introduced in-house pipeline and involved quantification in the spectral range of 1.8–4.1 ppm using LC Model [22]. A metabolite basis set consisting of 17 metabolites and a measured macromolecular baseline was used for fitting [23,24]. The metabolites included the previously mentioned neuro-oncological markers Cho (glycerol–phosphocholine and phosphocholine, summarized as total choline, tCho), Cr (creatine and phosphocreatine, summarized as total creatine, tCr), Gln, Gly, Ins, and NAA (NAA together with NAA–glutamate, summarized as total NAA, tNAA), as well as γ-aminobutyric acid, glutathione, scyllo-inositol, serine, taurine, 2-hydroxyglutarate, and glutamate. An overview of the processing parameters is given in Table S2 [25].
The spectral range selected for quantification is situated between the resonance frequencies of water and lipids. An expansion of this spectral window upfield to encompass the lactate resonance at 1.3 ppm would be problematic due to the introduction of artifacts attributable to lipid signals and necessitate the implementation of advanced signal processing techniques, such as L2 regularization. Conversely, extending the spectral range downfield would increase the risk of signal contamination from the residual water peak. For each metabolite map, voxels were discarded if their tCr FWHM was <0.15 ppm, their tCr SNR was <5, the metabolite CRLBs were above 80%, or the metabolite fit coefficient was >13 median absolute standard deviations [6]. Lastly, the metabolic maps were qualitatively assessed, and the patient’s dataset was discarded if the proportion of excluded voxels prevented a reasonable analysis, which may happen due to motion, lipid contamination, or B0 inhomogeneities.
Data analysis included the ratios of tCho/tNAA, Gln/tNAA, Gly/tNAA, Ins/tNAA, tCho/tCr, Gln/tCr, Gly/tCr, and Ins/tCr, as they are commonly used [2,11,12]. We specifically focused on the metabolite ratios to NAA because a drop in NAA, which corresponds to neuronal loss and is commonly seen in tumors, synergizes well with increases in tCho, Gln, Gly, and Ins, often producing well-defined hotspots in the ratio maps.
2.3. MRF and Clinical Protocol
The MRF scan was performed on a 3T Magnetom PrismaFit MR scanner using a 1 Tx/64 Rx head coil (Siemens Healthineers, Erlangen, Germany), and was based on a 2D Fast Imaging with Steady-state Precession (FISP) spiral readout (FOV = 256 × 256 mm, in-plane resolution = 1 × 1 mm, TA = 20 s per slice). To reduce the MRF’s long acquisition duration to an acceptable time, the number of acquired slices was kept as low as possible while still covering the entire tumor.
In addition to the MRF and MRSI protocol, a routine clinical 3T MRI was performed, consisting of a native T1-weighted image, a contrast-enhanced T1-weighted image, and a fluid-suppressed T2-weighted image. The clinical images were segmented by a neuroradiologist. Co-registered clinical morphological scans and segmentations were used to define the following regions of interest (ROIs): tumor segmentation (“TU”), which included contrast-enhancing and non-contrast-enhancing tissue within the tumor, as well as necrosis and edema; dilated tumor segmentation (“TU + PT”), which added the peritumoral region by first dilating TU by six voxels (effectively adding an approximately 2 cm thick layer surrounding the tumor); and peritumoral segmentation alone (“PT”), which we created by removing the original from the dilated tumor segmentation.
2.4. Data Analysis
We compared these segmentations to a normal-appearing white matter (NAWM) reference region, which was created by subtracting TU + PT from a white matter mask and eroding the resulting region once. Additionally, we investigated the metabolic abnormalities given by the median metabolite ratios and relaxation times in the different ROIs. Within each segmentation, we defined hotspots by including all voxels with a value greater than 150% of the respective median value of the NAWM reference region. For analysis, we compared the resulting T1 and T2 hotspots with the metabolite hotspots and with the tumor segmentation using Sørensen–Dice similarity coefficients (DSC), analogous to a previously established approach [7,26,27].
Since DSCs measure only the overlap of two regions, we also calculated the centers of intensity (i.e., the average position of all points of the ROI) of each region, according to
with the voxel vectors and the intensities , and then evaluated their distances from each other (“center of intensity distances”, COIDs):
Due to the possible tumor infiltrations of the surrounding regions, we extended our analysis to the peritumoral regions, again looking at DSCs between the MRF’s T1 and T2 hotspots and the MRSI’s metabolic hotspots. In addition to the similarity measures, we evaluated the median relaxation times and metabolic ratios in the hotspots within the different regions of interest (TU, TU + PT, PT) and the NAWM reference region. Last, we compared TU and PT using a two-sided paired Student’s t-test. Since our approach of using a threshold to define the hotspots in TU and PT naturally increased the median values in these regions compared to the un-thresholded regions, the comparison to NAWM would have been meaningless and was thus omitted.
3. Results
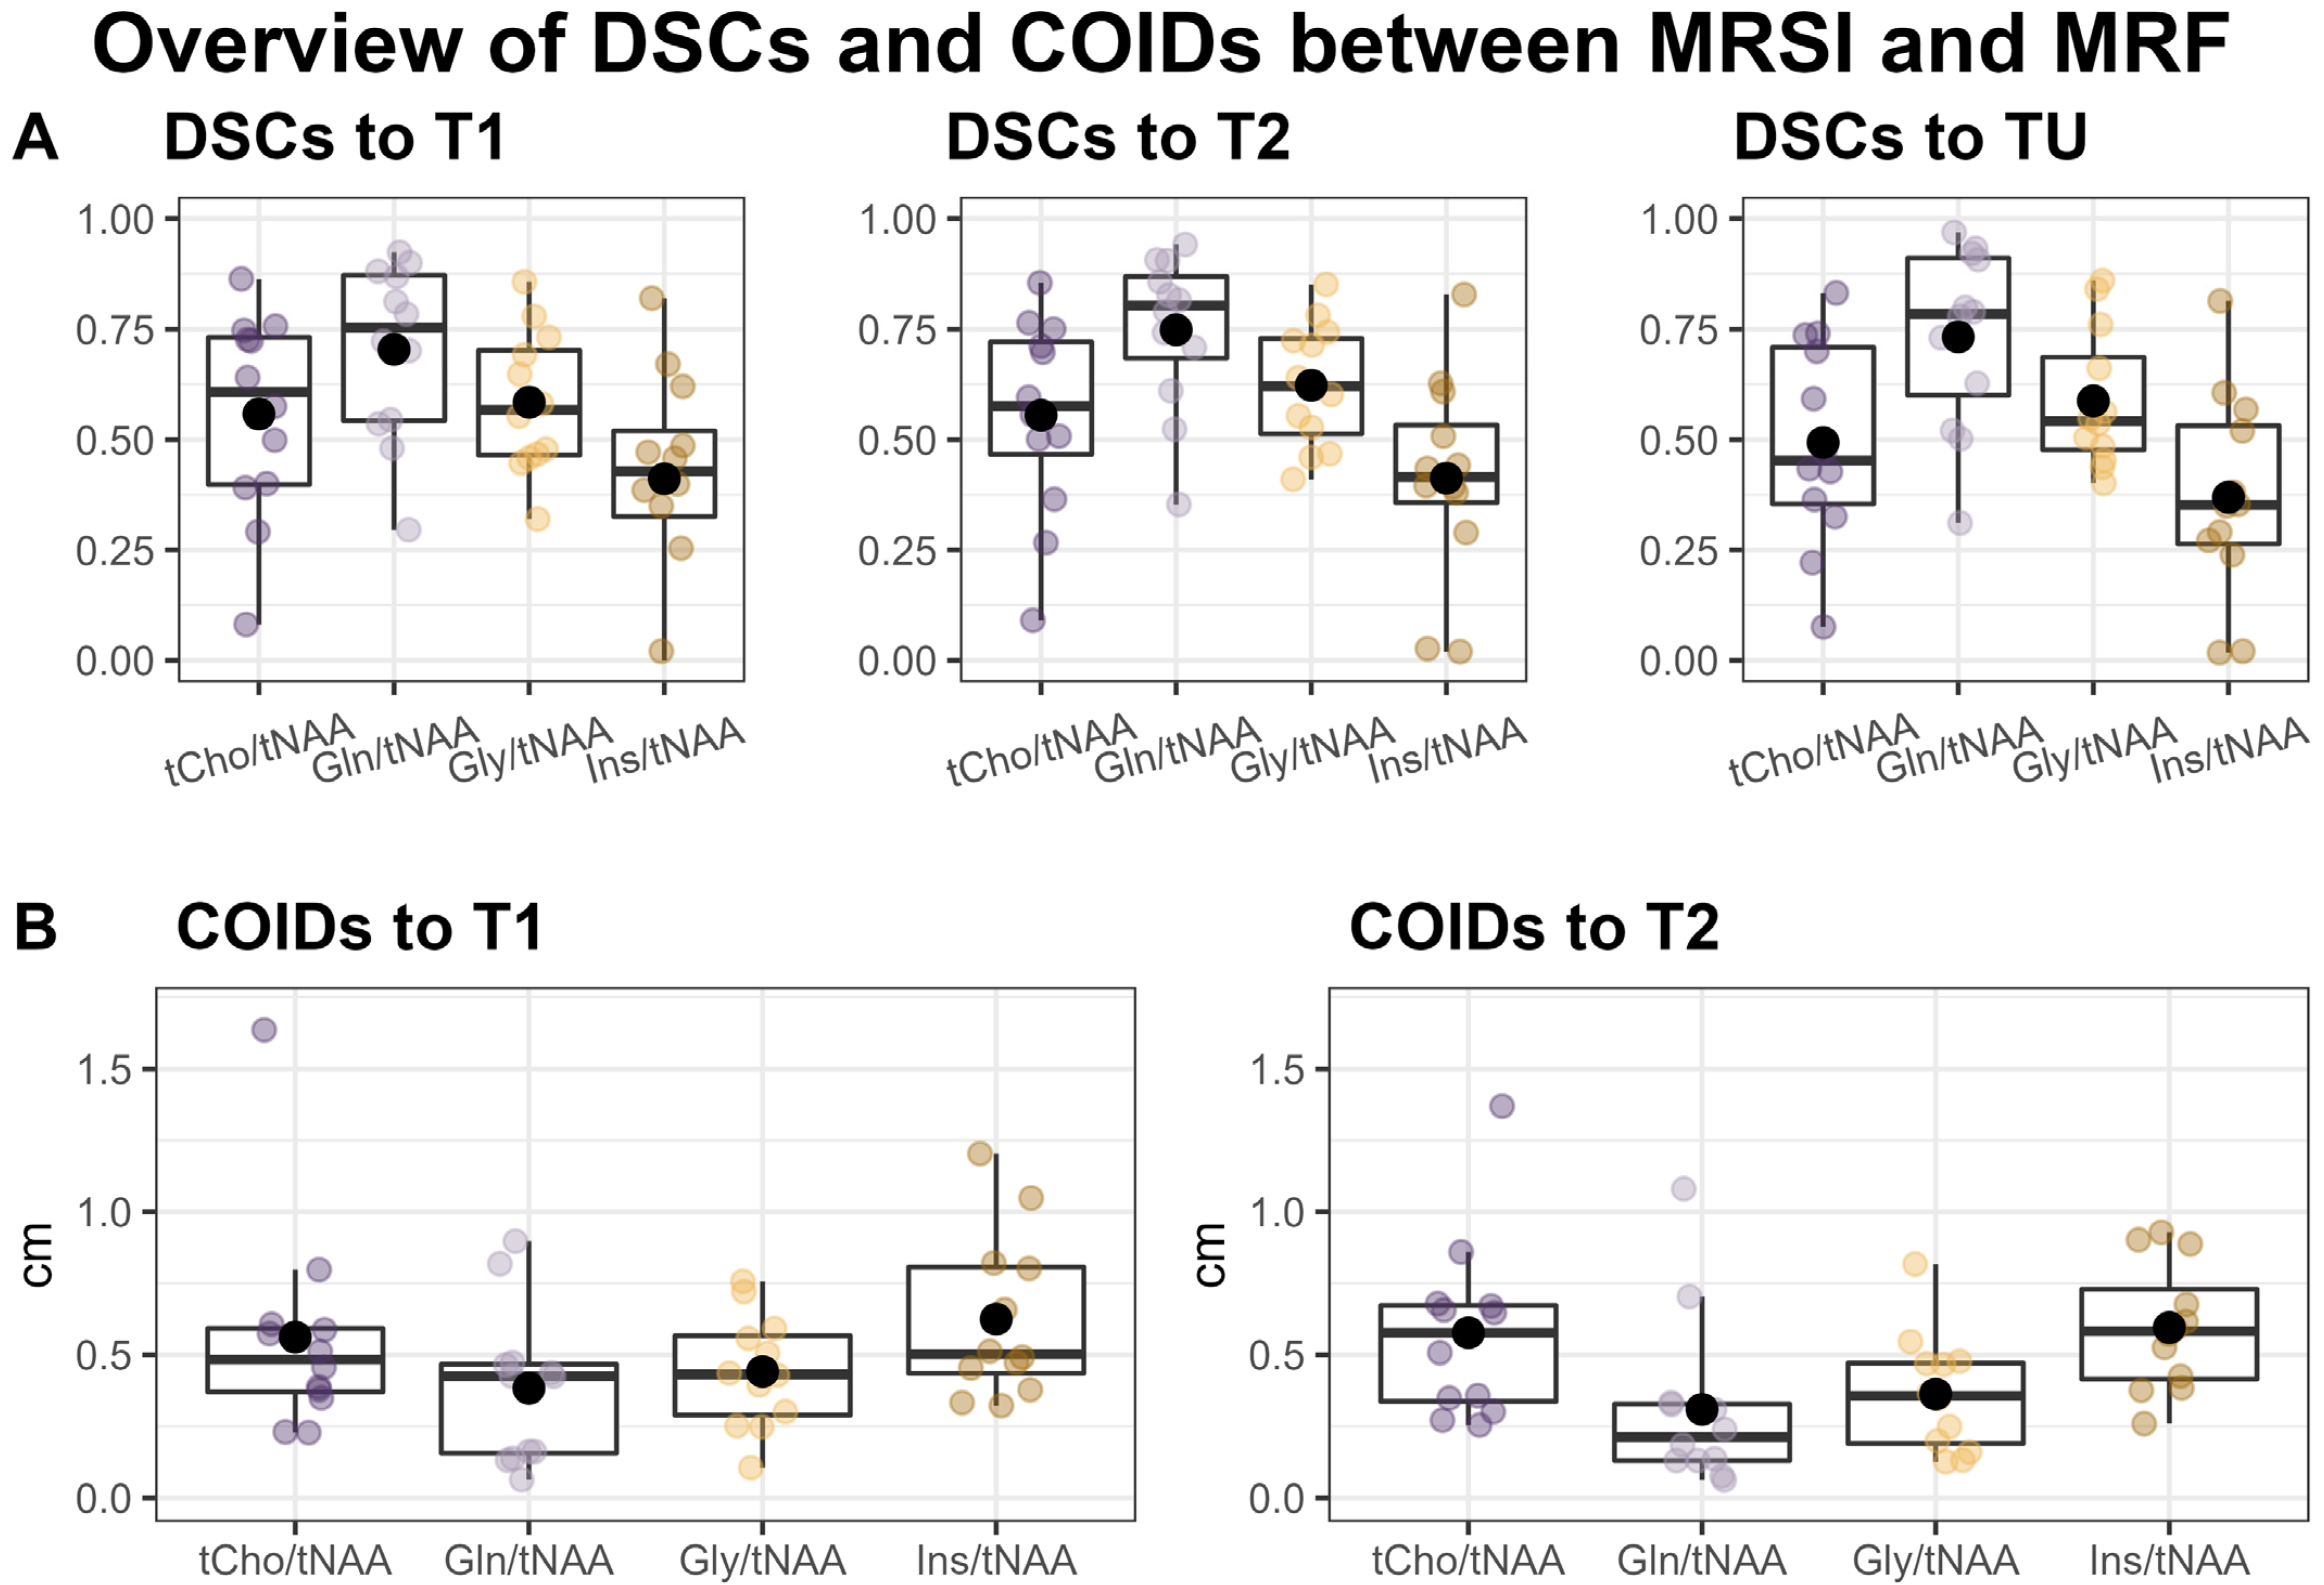
Overall, we found a very high correspondence between the hotspots in the ratio maps for both Gln/tNAA and Gly/tNAA and the MRF’s T1 and T2 maps, as well as the tumor segmentation, which is reflected in the respective DSCs and COIDs (see Figure 2 and Table 2).
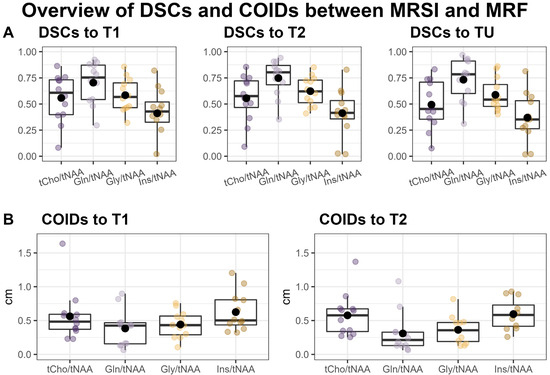
Figure 2.
Overview of Sørensen–Dice similarity coefficients (DSCs) between the MRSI’s metabolite ratio hotspots, MRF’s T1 and T2 hotspots, and the tumor segmentation (TU) (A) and the distances of the centers of intensity (COIDs) between the MRSI and MRF hotspots (B).
Table 2.
Sørensen–Dice similarity coefficients (DSCs, median and interquartile range IQR) of relaxation time hotspots (T1, T2), metabolite ratio hotspots (tCho/tNAA, Gln/tNAA, Gly/tNAA, Ins/tNAA), and different regions of interest (ROI), namely the tumor segmentation TU (containing non contrast-enhancing, contrast-enhancing, and necrotic tissue), the peritumoral region PT, and the combined region (TU + PT).
3.1. Median Relaxation Times and Metabolic Ratios
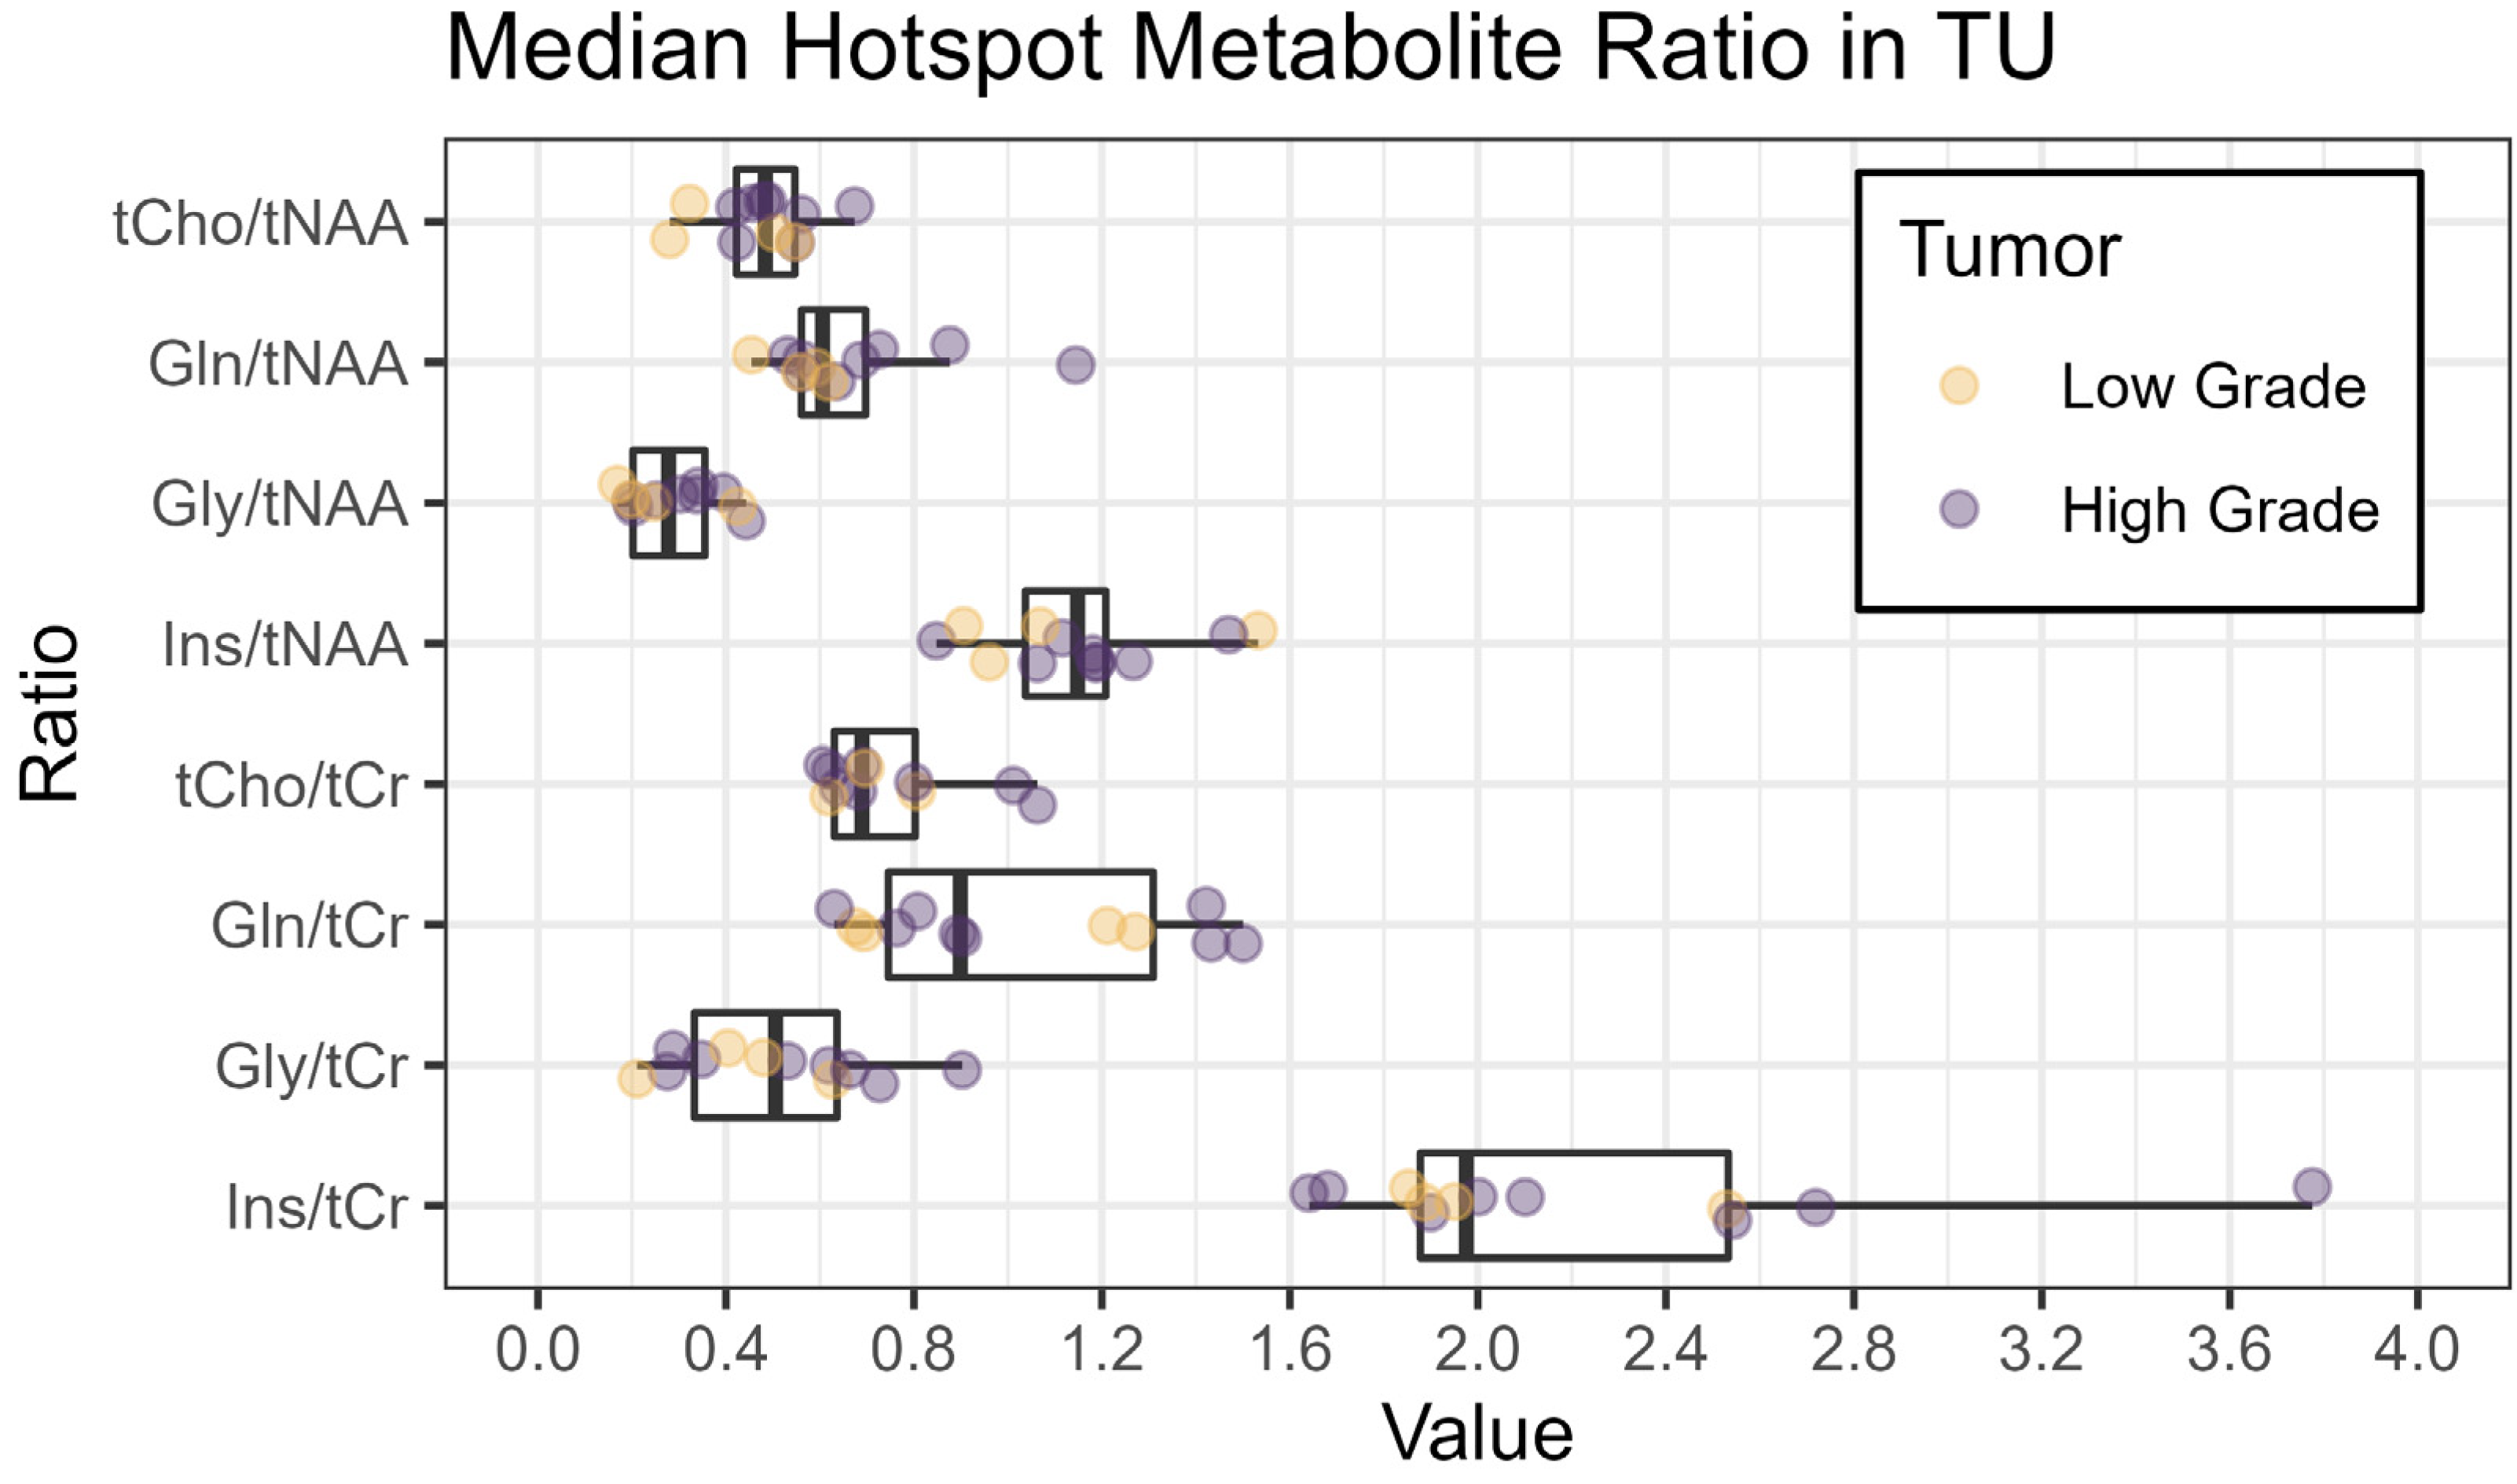
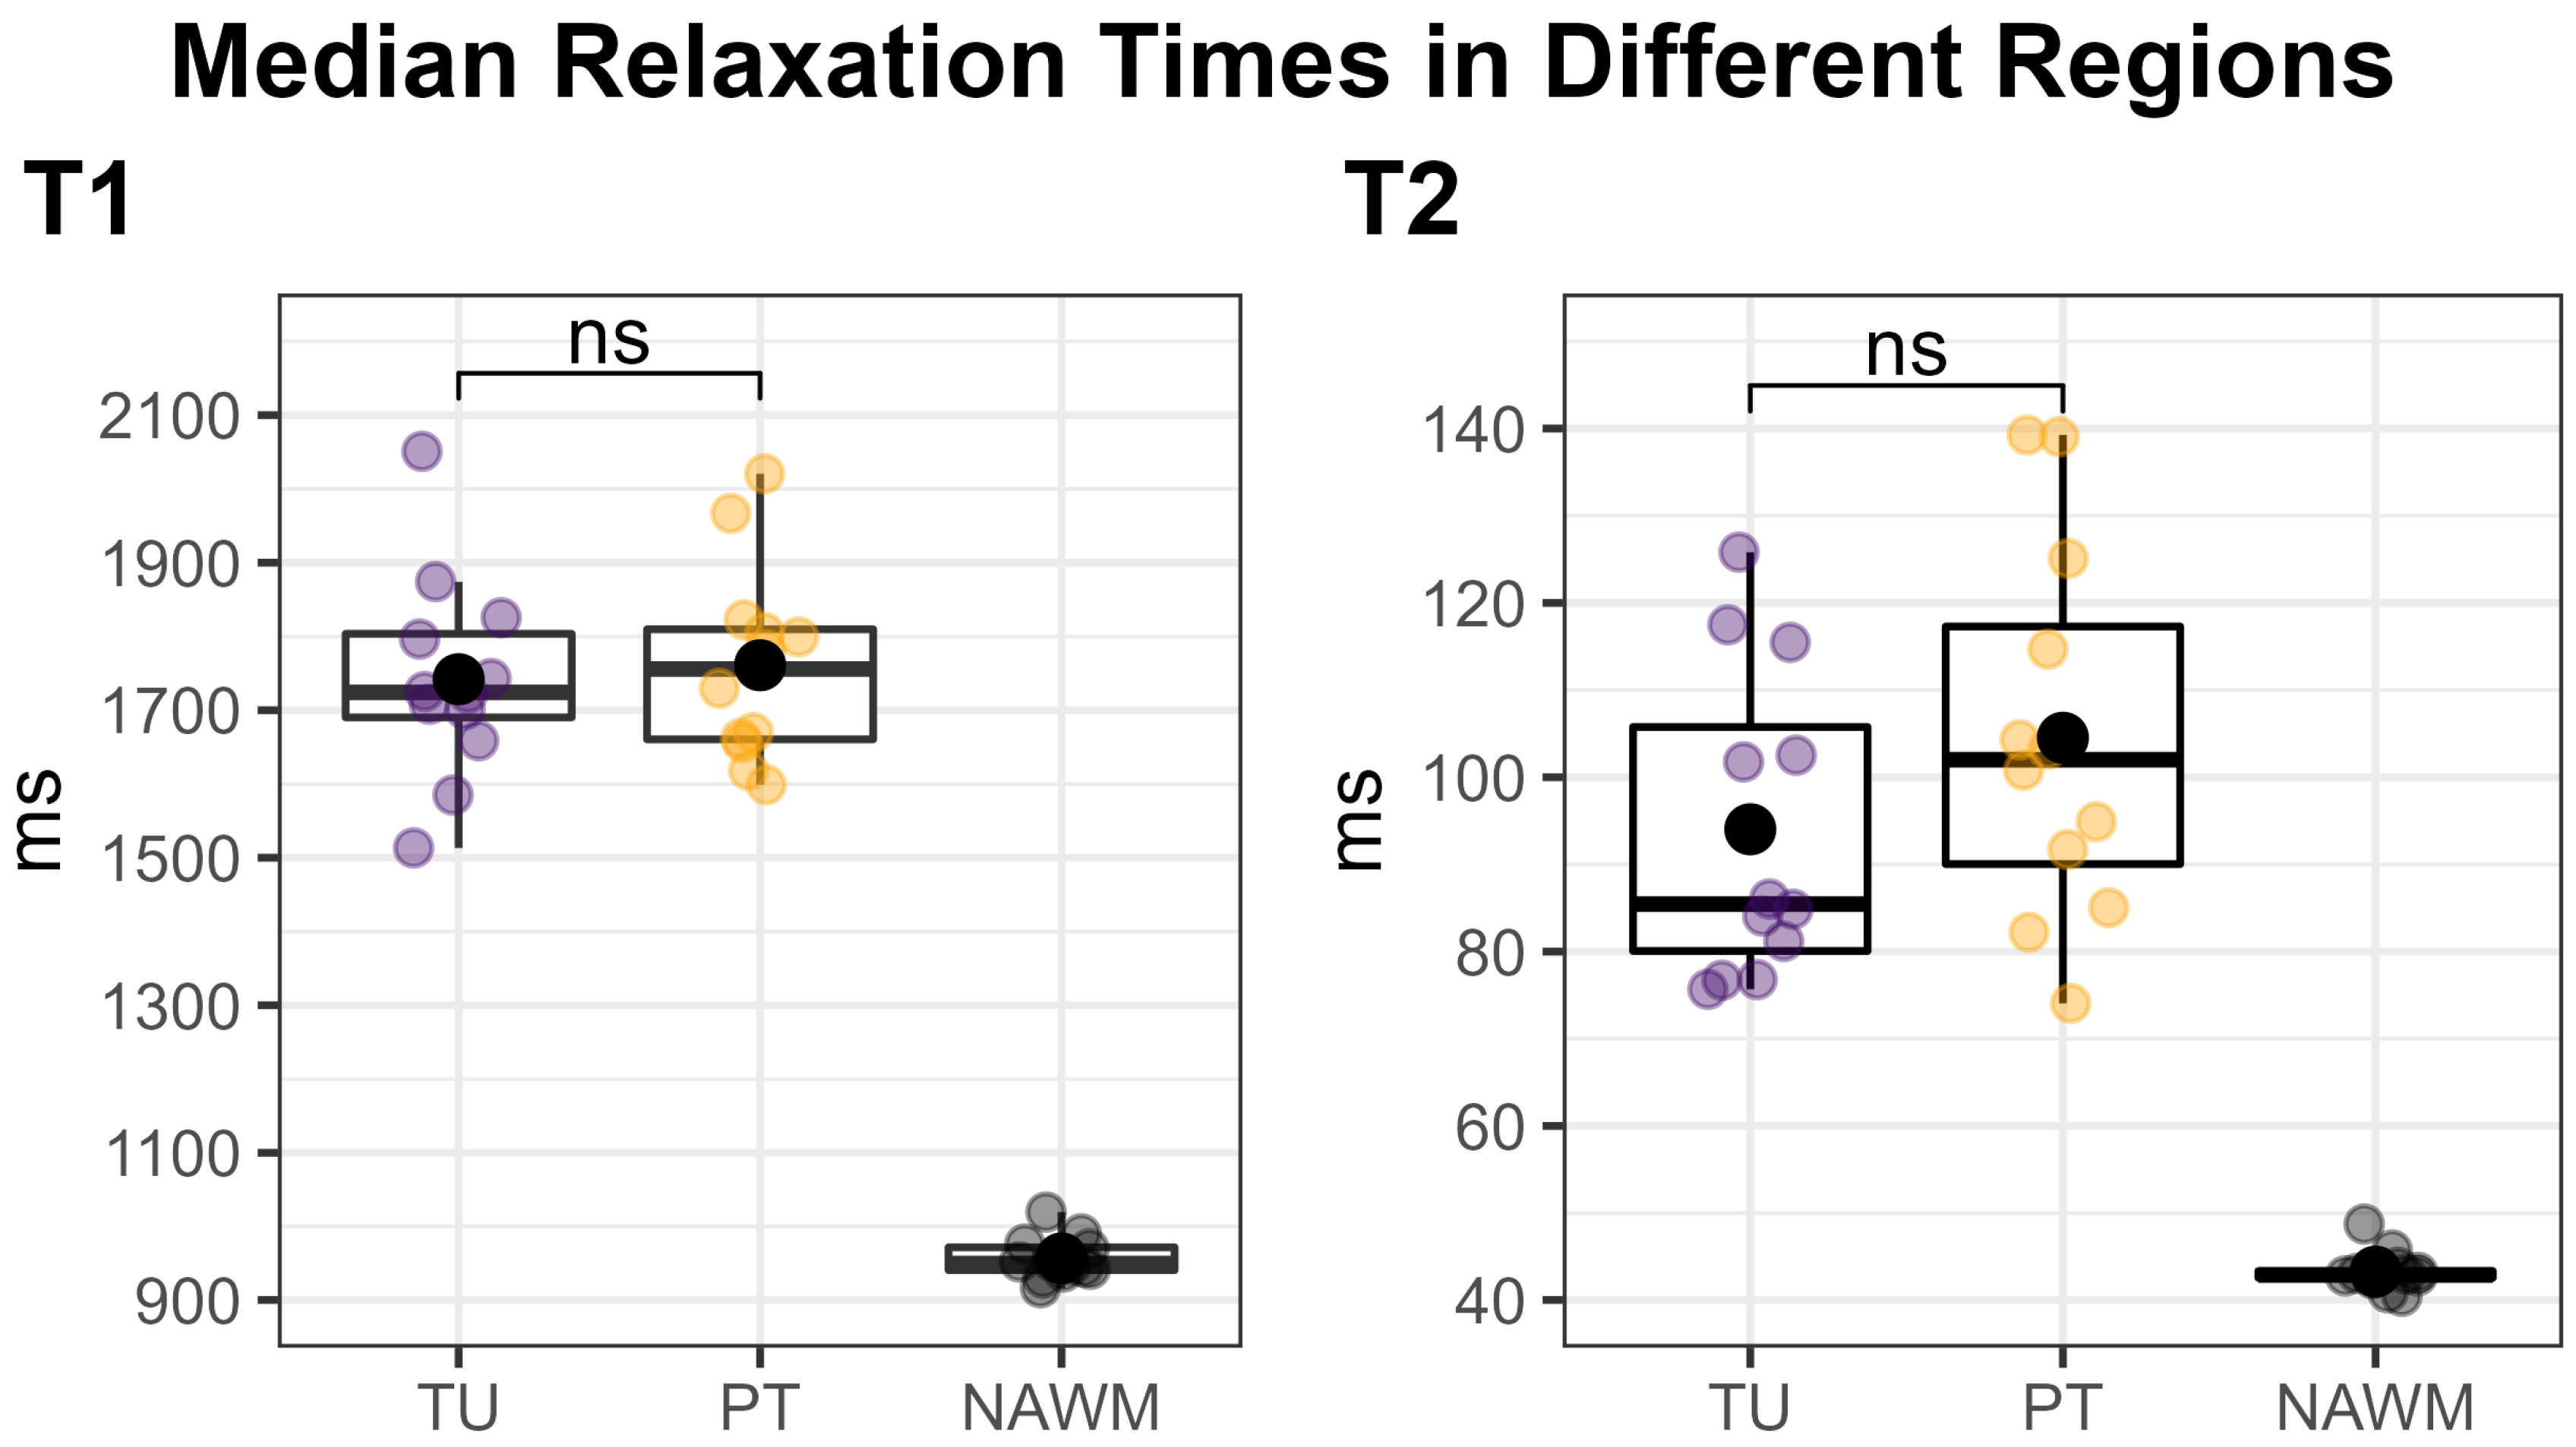
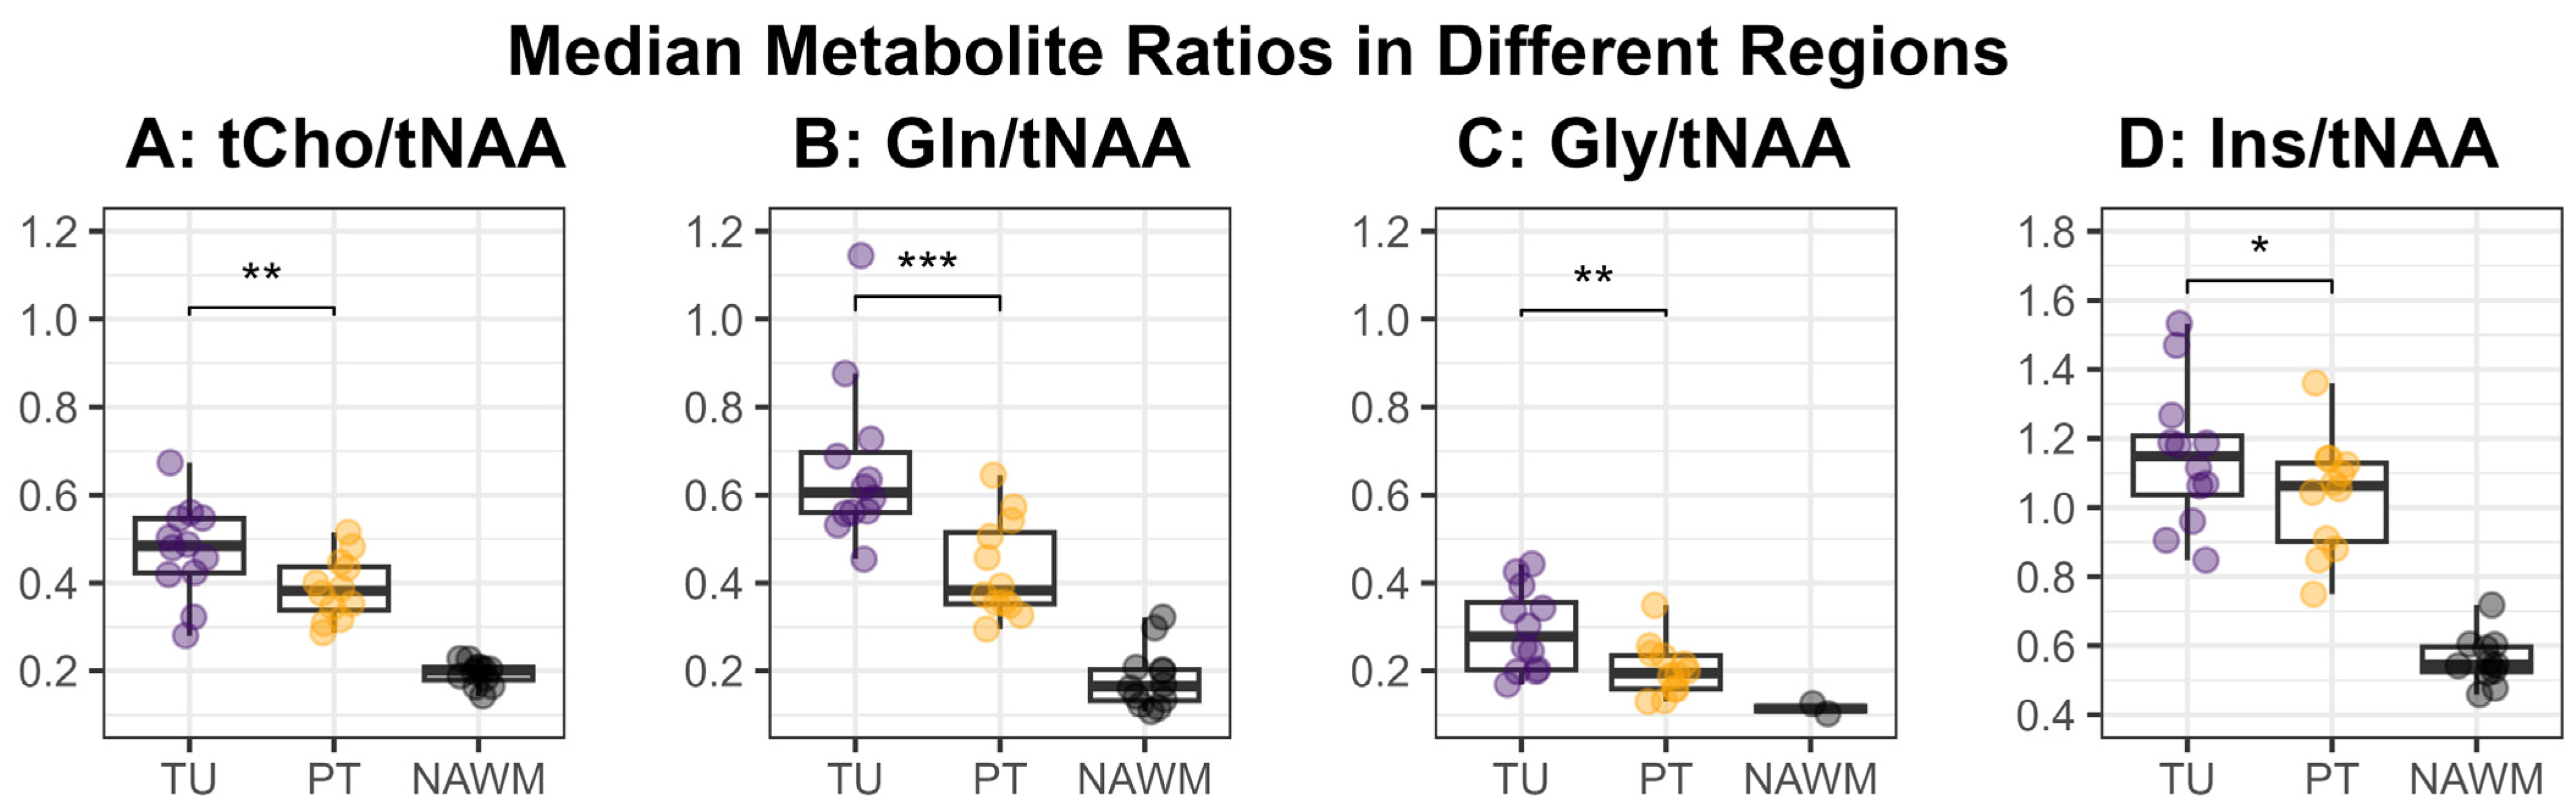
Regarding the metabolic ratio values, the cohort’s median in the tumor hotspot was the highest for Ins/tNAA (median = 1.15, [Q1, Q3] = [1.04, 1.21]), followed by Gln/tNAA (0.61, [0.56, 0.70]), tCho/tNAA (0.48, [0.42, 0.55]), and Gly/tNAA (0.28, [0.20, 0.36]), and the respective relaxation times were T1 = 1724 ms (Q1 = 1690 ms, Q3 = 1804 ms) and T2 = 85 ms (Q1 = 80 ms, Q3 = 106 ms). The corresponding values in NAWM were 0.54, [0.51, 0.59] for Ins/tNAA; 0.16, [0.13, 0.20] for Gln/tNAA; 0.20, [0.18, 0.21] for tCho/tNAA; and 0.07, [0.06, 0.10] for Gly/tNAA; and the relaxation times were T1 = 950 ms (Q1 = 941 ms, Q3 = 972 ms) and T2 = 42.9 ms (Q1 = 42.6 ms, Q3 = 43.3 ms). For an overview of these numbers, see Table 3.
Table 3.
Median values and first and third quartile (Q1, Q3) for the cohort’s median T1 and T2 relaxation times and metabolic ratios in the hotspots within the tumor (TU), the peritumoral region (PT), and the p-values when comparing TU and PT using a two-sided paired Student’s t-test, as well as the median values in the hotspots in the combined TU + PT region and in the normal appearing white matter control region (NAWM). p-values below 0.01 are in bold type. Notably, some metabolic ratios, such as Gln/tNAA, showed a statistically significant difference between TU and PT (e.g., p < 0.001 for Gln/tNAA), but the respective T1 and T2 values for MRF were not statistically significant. For a visualization of these data, see also Figure 3 and Figure 4.
Figure 3 shows an overview of the medians of the metabolite ratios in the tumor hotspot while illustrating the different tumor grades by color-coding. The cohort’s median metabolite ratios and median relaxation times for the hotspots in the TU, the PT, and the NAWM are noted in Table 3 and shown in more detail in Figure 4 and Figure 5. Notably, we found statistically significant differences between TU and PT in the metabolite ratios (with the values in TU higher than in PT), but no such effect was found for the relaxation times.

Figure 3.
Boxplots of median metabolite ratios for tCho/tNAA, Gln/tNAA, Gly/tNAA, and Ins/tNAA, as well as tCho/tCr, Gln/tCr, Gly/tCr, and Ins/tCr, within the hotspot in the tumor segmentation TU. The colors indicate the tumor grade (yellow: low grade, grade 2 or below; violet: high grade, grade 3 or above).
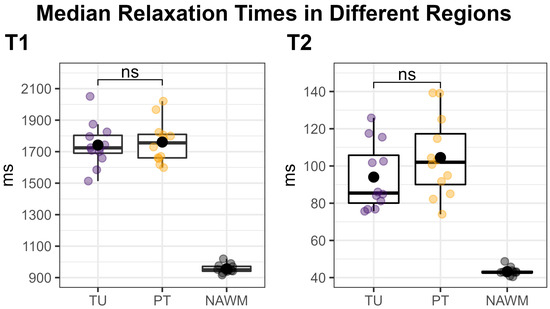
Figure 4.
Median T1 (left) and T2 (right) relaxation times within the tumor (TU, violet) and peritumoral (PT, yellow) segmentations’ hotspots, compared to the normal-appearing white matter (NAWM) control region (black). Each dot corresponds to one patient. TU and PT were compared using a two-sided paired t-test, which showed no significant difference (“ns”). Our approach of using a threshold to define the hotspots in TU and PT naturally increased the median values in these regions compared to the un-thresholded regions, which would have rendered a comparison to NAWM meaningless.
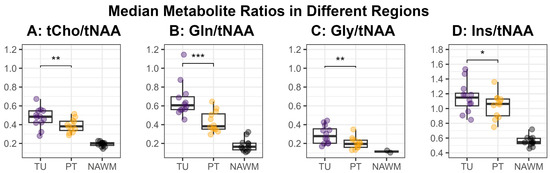
Figure 5.
Median values for the metabolite ratios tCho/tNAA (A), Gln/tNAA (B), Gly/tNAA (C), and Ins/tNAA (D) within the defined hotspots in the tumor (TU, violet) and peritumoral regions (PT, yellow), as well as the normal-appearing white matter control region (NAWM, black). The medians in the regions TU and PT were compared using a two-sided paired t-test and the resulting significance levels were noted in the plot (*: p < 0.05, **: p < 0.01, ***: p < 0.001).
3.2. Similarity Measures
When comparing the hotspots of MRSI within the tumor to the entire segmentation TU, we found the highest DSC for Gln/tNAA (median = 0.78, [Q1, Q3] = [0.60, 0.91]), followed by Gly/tNAA (0.54, [0.48, 0.69]), tCho/tNAA (0.45, [0.35, 0.71]), and Ins/tNAA (0.35, [0.26, 0.53]). The DSCs for MRF were similar for both T1 (0.73, [0.66, 0.83]) and T2 (0.79, [0.67, 0.86]).
Comparing MRSI to the MRF’s T1 hotspots in the tumor yielded the highest DSCs for Gln/tNAA (0.75, [0.54, 0.87]) and tCho/tNAA (0.61, [0.40, 0.73]), followed by Gly/tNAA (0.57, [0.46, 0.70]) and Ins/tNAA (0.43, [0.33, 0.52]). For T2, the DSCs were highest for Gln/tNAA (0.80, [0.68, 0.87]) and Gly/tNAA (0.62, [0.51, 0.73]), followed by tCho/tNAA (0.58, [0.47, 0.72]) and Ins/tNAA (0.41, [0.36, 0.53]). These results, together with the analogous results for the PT region, are noted in Table 2, and barplots of the entire cohort’s tumor DSCs are displayed in Figure S1.
The centers of intensity compared to the T1 hotspot were closest for Gln/tNAA (COIDS: median = 0.43 cm, [Q1, Q2] = [0.16 cm, 0.47 cm]) and Gly/tNAA (0.43, [0.29, 0.57]), and a bit higher for tCho/tNAA (0.48, [0.37, 0.59]) and Ins/tNAA (0.50, [0.44, 0.81]). For the T2 hotspot, the lowest COIDs were found for Gln/tNAA (0.21, [0.13, 0.33]) and Gly/tNAA (0.36, [0.19, 0.47]), and the values were again higher for tCho/tNAA (0.58, [0.34, 0.67]) and Ins/tNAA (0.58, [0.42, 0.73]). These values are illustrated in Figure 2.
3.3. Complementary Information
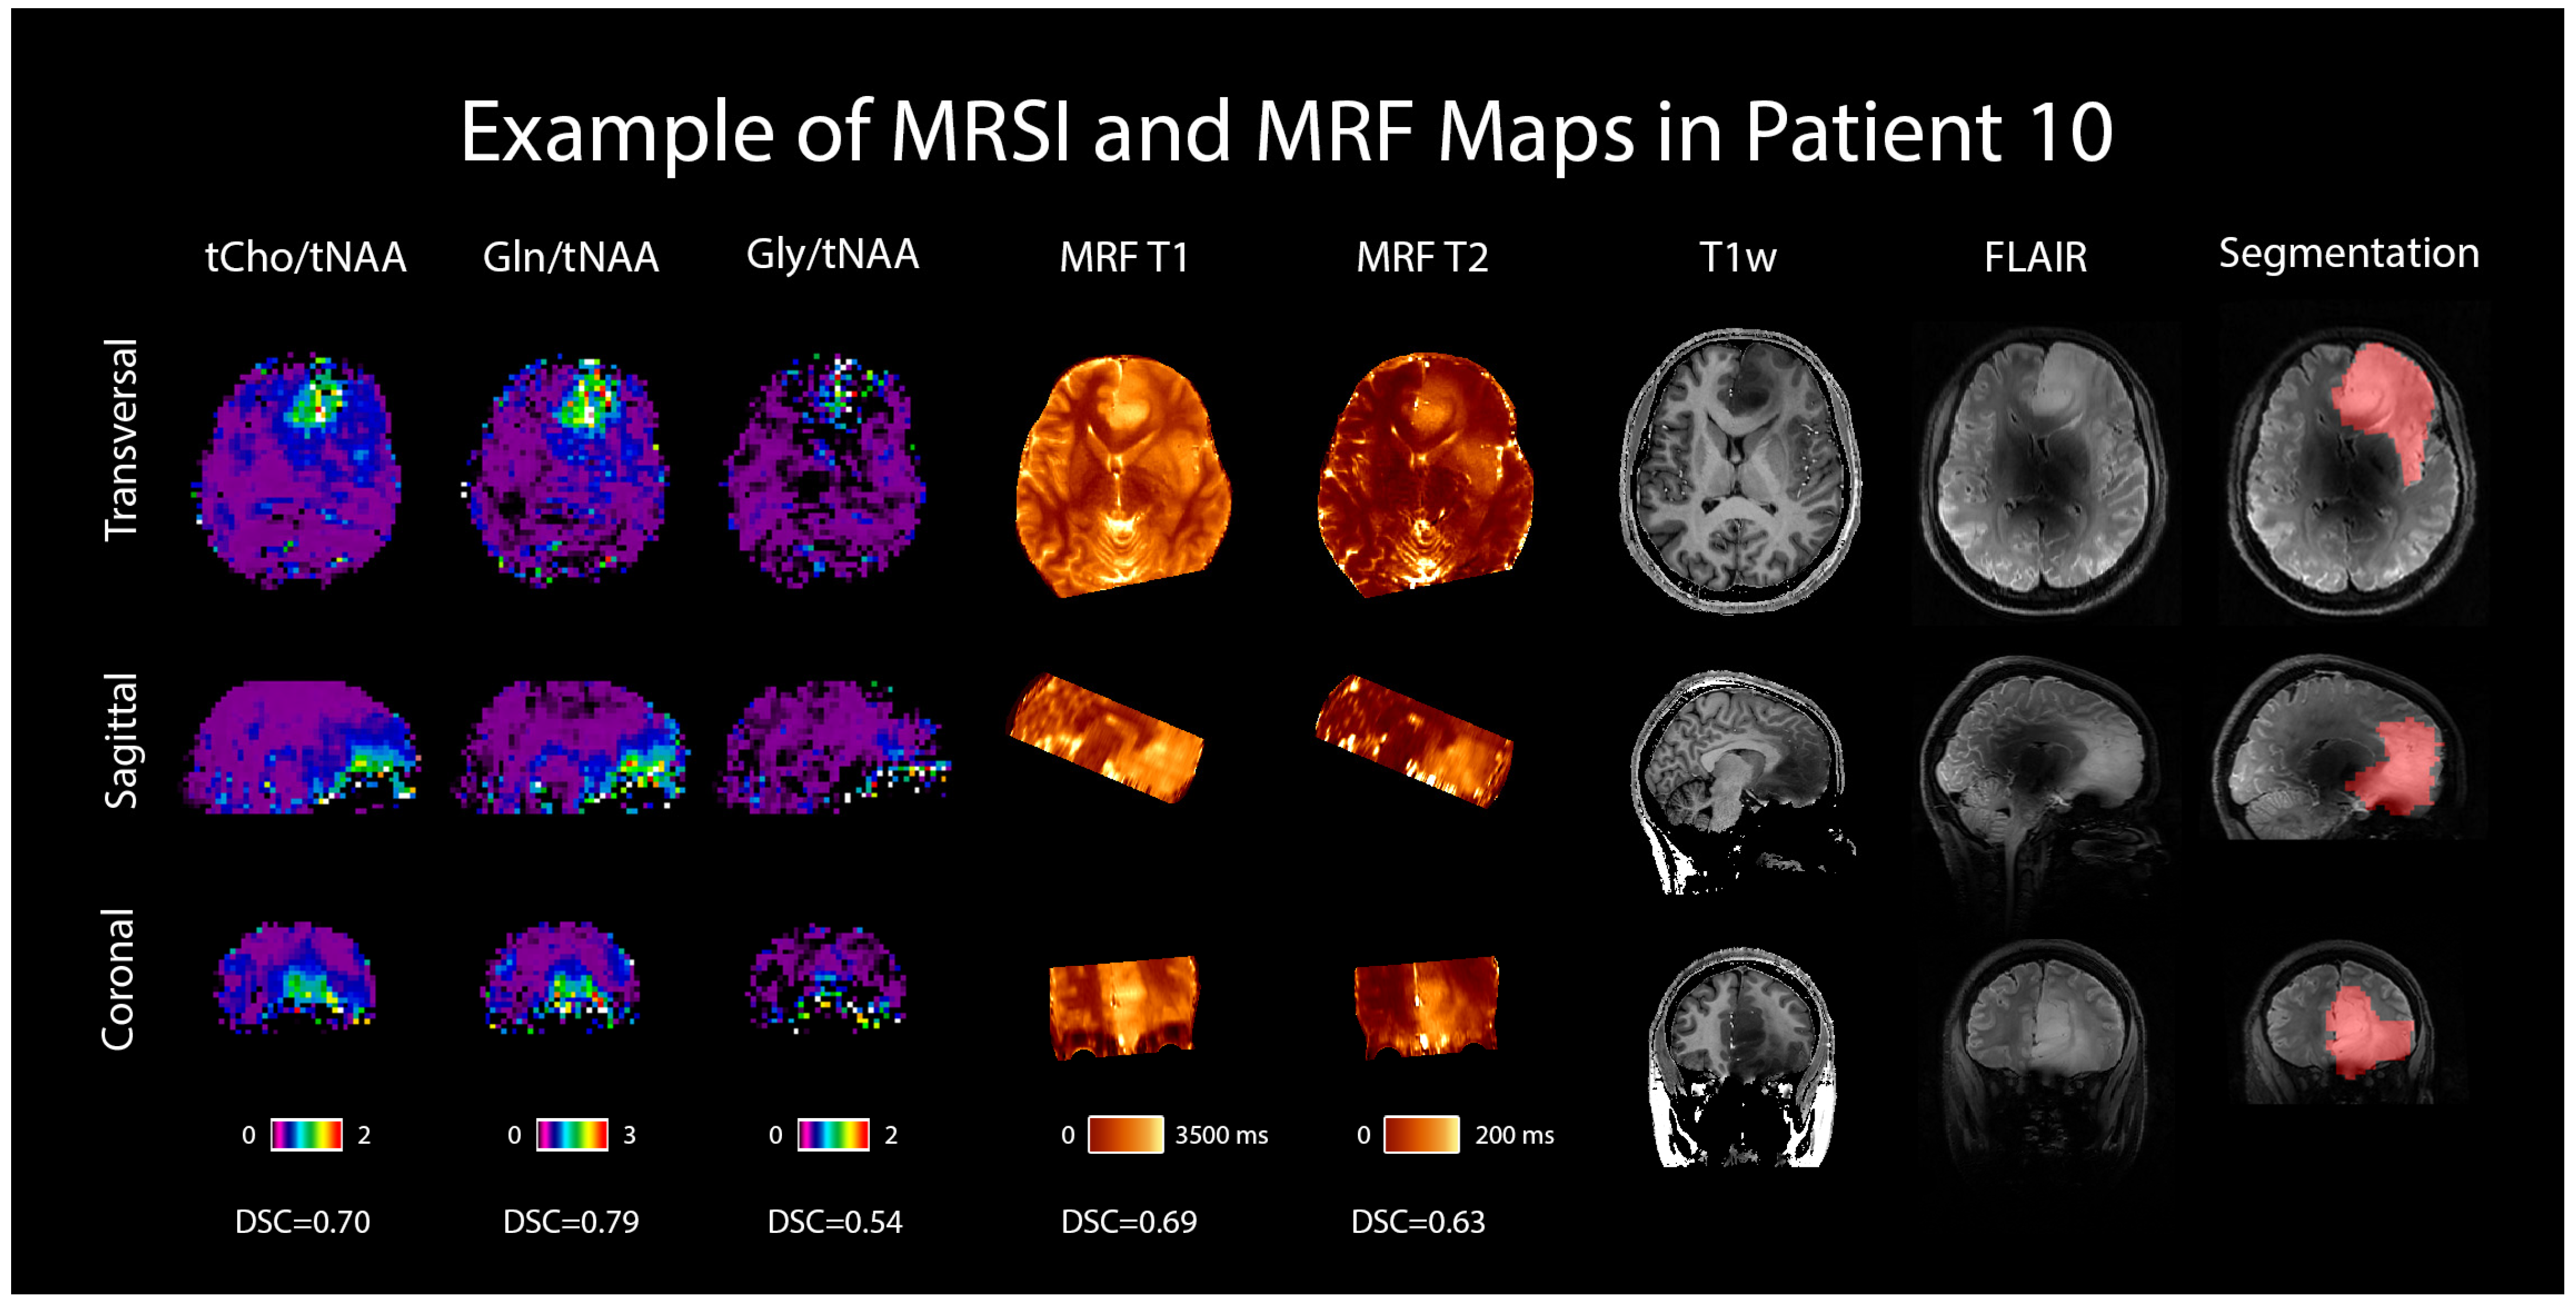
An example case is shown in Figure 6 in the form of the dataset of one selected patient with an IDH-mutant grade 3 astrocytoma, including the metabolic ratio maps of tCho/tNAA, Gln/tNAA, and Gly/tNAA, T1 and T2 maps from MRF, a T1w MP2RAGE, a T2w FLAIR (both acquired at 7T), and the radiologist’s segmentation.
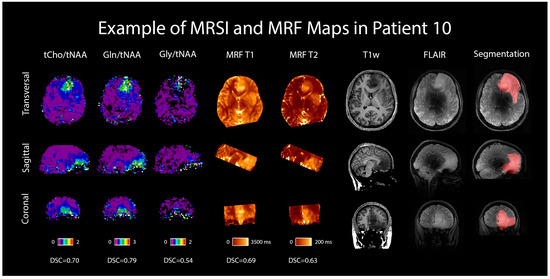
Figure 6.
MRSI and MRF maps in a 28-year-old female patient with a histologically confirmed grade 3 astrocytoma. For comparison, 7T T1w MP2RAGE and FLAIR images are shown, as well as the radiologist’s segmentation. Transversal, sagittal, and coronal views are shown, and Sørensen–Dice similarity coefficients comparing the hotspots to the segmentation are listed below the respective maps.
Last, Figure S2 shows the median metabolic ratios for different ROIs for the threshold of 1.50 and illustrates the influence of the hotspot threshold on the median hotspot values. Part A of this figure notably shows the metabolites that exhibit the largest differences between TU and PT, and part B illustrates the case of a threshold value of 0.00, which gives an indication of what the median values in the entire TU and PT regions (rather than the hotspot) would be.
4. Discussion
We successfully conducted the first comparison of 7T MRSI and 3T MRF in 12 glioma patients and found a high correspondence between the metabolic hotspots of Gln/tNAA and Gly/tNAA, the T1 and T2 relaxation time hotspots, and the radiologist’s tumor segmentation, resulting in high DSCs and low COIDs for those two metabolite ratios, as shown in Table 2 and Figure 2. This finding complements previous work [7], which showed a better correspondence of Gln/tNAA and Gly/tNAA to amino acid PET than the clinically used tumor marker tCho/tNAA. In Figure 3, we provide an overview of the median hotspot metabolite ratios in low and high-grade gliomas, and we also reported median values for T1 and T2 (Table 3 and Figure 4) and for metabolite ratios (Table 3 and Figure 5).
Glutamine and glycine are amino acids that are involved in many metabolic processes in cells, including protein synthesis, energy production, and cell growth and repair [8,9]. For cancer cells, both glutamine and glycine can be the primary source of energy, and they also play a role in the proliferation of cancer cells [10]. Choline, on the other hand, is a polyatomic ion that plays an important role as a precursor of the phospholipid phosphatidylcholine, a major component of cell membranes, which is vital for their structural integrity and fluidity. Cancer cells tend to have a high demand for choline to sustain their proliferation [11].
Our analysis of both MRF and MRSI data in the TU and PT segmentations showed similar T1 and T2 values but significantly different metabolic ratios in the hotspots of both regions (Figure 3 and Figure 4). The median values for the metabolic ratios and relaxation times were much higher in these hotspots than in the NAWM control region due to the use of thresholding for hotspot definition.
Unfortunately, the existing literature on MRF in gliomas is still very limited [28]. De Blank et al. conducted MRF scans in a cohort of children and young adults with mostly low-grade gliomas and found that T1 and T2 values tended to increase in tumors compared to a white matter control region. While there were some differences between their median values and ours in the tumor (T1: 1444 ± 254 ms, T2: 61 ± 22 ms), the values in NAWM are comparable to those found in this study [29]. Springer et al. also found that T1 and T2 values from MRF increased in tumors compared to NAWM [30], and Marik et al. showed that MRF is feasible in differentiating between low and high-grade gliomas with an accuracy of 82% [31]. Regarding MRSI, the median values we found in this study are in accordance with previous findings that Gln/tNAA and Gly/tNAA hotspots correspond well to PET in gliomas [7]. Due to the significant overlap of the cohorts of these studies, this primarily indicates the consistency of our data evaluation and processing when compared to our 2020 paper, but to further support our hypothesis that these metabolites may be useful biomarkers, further studies including larger cohorts are required [6]. In addition, increases in tCho/tNAA have been commonly reported in the literature [32,33].
Both modalities, MRSI and MRF, are quantitative methods in contrast to the qualitative assessment of gliomas by conventional MR imaging protocols. The good correspondence between MRSI and MRF allows the application of MRF with T1 and T2 mapping at a clinically widespread available field strength of 3T, whereas high-resolution MRSI is still restricted to 7T. Another benefit of MRF for clinical use is the relatively short examination time, which requires only one sequence and provides T1 and T2 relaxation time values with superior spatial resolution. Thus, this technique can be easily incorporated into a routine brain tumor protocol, providing additional ultrastructural information in gliomas. Additionally, new advances in radiomics using texture analysis methods such as the Grey Level Co-occurrence Matrix can further improve the sensitivity and specificity of MRF in the work-up of gliomas, not only for primary differential diagnosis but also in providing additional information for monitoring over time [34].
Limitations and Outlook
Due to the various types and grades of gliomas in this study, as well as the small cohort size, it was not possible to separately analyze each tumor’s diagnosis or grade. Our findings will need to be validated by a larger cohort to enable us to draw generalized conclusions, but we view this exploratory study as a first step toward such validation. Due to the thresholding approach for hotspot definition, p-values could be calculated only to compare TU and PT, but not for the control region. Additionally, we relied on data from NAWM for the hotspot definition, which has high CRLBs in the case of metabolites that are generally not detectable in the healthy brain, like Gln and Gly. We investigated the robustness of their fits in the supplementary material of [6], and expect an underestimation of 10–20% for Gln and Gly considering the SNR and CRLB we encounter in NAWM. We expect this to affect both the tumor and NAWM similarly, causing this effect to mostly cancel out with regard to the hotspots’ sizes and positions.
Furthermore, MRSI is still an experimental modality and the quality of the results can vary between subjects from very good to unacceptably bad, necessitating the exclusion of some data sets. In addition, the availability of (clinical) 7T MRI systems is still limited, which, together with the rather long measurement times for MRF and MRSI, reduces the clinical applicability of this research for the time being. Last, the commonly used metabolic ratios present a weakness insofar as the overall ratio significantly depends on its denominator. In the case of the NAA ratios used in this study, all hotspots significantly depend on the coldspots in the NAA maps, introducing a correlation between them. Additionally, in voxels without an NAA fit (e.g., in the presence of lipid artifacts), no ratio can be calculated. Compared to ratios, concentration estimates (CEs) offer more reliability and should be explored in future work [35]. Unfortunately, they come with their own challenges; in the case of internal water referencing, one needs to derive a water concentration in tumor tissue, which can be difficult in practice [36,37,38].
5. Conclusions
This preliminary study will provide a starting point for further studies, aiding in the development of more specific hypotheses that may be tested in larger cohort studies in the future, which should hopefully lead to better MRI-based delineation and classification of brain tumors. Ultimately, this work reinforces previous findings that glutamine and glycine show great promise as potential biomarkers in glioma imaging via the use of ultra-high-field MR spectroscopy.
Supplementary Materials
The following supporting information can be downloaded at: https://www.mdpi.com/article/10.3390/cancers16050943/s1, Figure S1: Sørensen-Dice Similarity Coefficients (DSCs) in the tumor segmentation between the segmentation (TU), the MRF’s relaxation time hotspots (T1, T2), and MRSI’s metabolite ratios (tCho/tNAA, Gln/tNAA, Gly/tNAA, Ins/tNAA). Gln/tNAA had the highest correspondence with the tumor segmentation and T1 and T2 hotspots; Figure S2: A: Metabolite ratios tCho/tNAA, Gln/tNAA, Gly/tNAA, and Ins/tNAA, as well as tCho/tCr, Gln/tCr, Gly/tCr, and Ins/tCr, for a hotspot threshold of 1.5, plotted separately for the tumor segmentation (TU), the tumor region and the peritumoral region (TU+PT), the peritumoral region alone (PT), and the normal-appearing white matter control region (NAWM). B: The same metabolite ratios for different hotspot thresholds, with one line each for TU, TU+PT, and PT; Figure S3: Overview of the volumes of the region of interest (ROI), the MRF hotspots (T1, T2), and the MRSI hotspots (tCho/tNAA, Gln/tNAA, Gly/tNAA, Ins/tNAA), in the tumor (A) and the peritumoral region (B); Figure S4: Example spectra of patient 10 (anaplastic astrocytoma, grade 3, female, 28 years of age). Normal appearing white matter spectrum (left) and tumor spectrum (right). Below, glutamine (Gln) maps overlaid with a T1w reference image are shown, and the voxel position is indicated; Table S1: Cohort overlap with previous publications [6,7]; Table S2: An overview according to the minimum reporting standards in MR spectroscopy [25]; Table S3: MRF sequence parameters.
Author Contributions
P.L. and G.H.: data analysis; P.L.: visualization, draft; P.L.C. and S.S.: data preparation; C.C., G.W. and K.R.: patient recruitment; C.C., W.M. and A.L.: study execution; T.R.-P. and J.F.: data creation; T.R.-P.: histopathological analysis; J.F.: segmentation; B.S. and L.H.: software development; M.P.: data supervision, diagnosis; W.B.: draft revision; G.W., K.R., S.T. and G.H.: supervision; S.T. and G.H.: study planning. All authors have read and agreed to the published version of the manuscript.
Funding
This work was supported by the Austrian Science Fund (FWF) projects KLI 646, KLI 1089, and KLI 679. The financial support by the Austrian Federal Ministry for Digital and Economic Affairs; the National Foundation for Research, Technology, and Development; the Christian Doppler Research Association; and the Comprehensive Cancer Center (Forschungsförderung der Initiative Krebsforschung, Medical University of Vienna) are gratefully acknowledged.
Institutional Review Board Statement
Institutional Review Board (IBR) approval was obtained by the IBR of the Medical University of Vienna, protocol 1991/2018.
Informed Consent Statement
Written informed consent was obtained from all subjects (patients) in this study. All subjects consented to a publication of their pseudonymized or anonymized data.
Data Availability Statement
The datasets used during this study can be made available by the corresponding author upon reasonable request.
Acknowledgments
ChatGPT (OpenAI, San Francisco, CA, USA) was used to assist in phrasing a few short passages of text in this manuscript. This manuscript was previously posted to arxiv.org: https://arxiv.org/abs/2304.05254, accessed on 22 February 2024. Furthermore, we acknowledge conflicts of interest of the authors Julia Furtner and Matthias Preusser (see below). Open Access Funding by the Austrian Science Fund (FWF).
Conflicts of Interest
The authors of this manuscript declare relationships with the following companies: Julia Furtner has received honoraria for lectures and consultation from the following for-profit companies: Novartis and Seagen. Matthias Preusser has received honoraria for lectures, consultation, or advisory board participation from the following for-profit companies: Bayer, Bristol-Myers Squibb, Novartis, Gerson Lehrman Group (GLG), CMC Contrast, GlaxoSmithKline, Mundipharma, Roche, BMJ Journals, MedMedia, Astra Zeneca, AbbVie, Lilly, Medahead, Daiichi Sankyo, Sanofi, Merck Sharp & Dohme, Tocagen, Adastra, Gan & Lee Pharmaceuticals, and Servier.
Abbreviations
| AD | Acquisition delay |
| CE | Concentration estimates |
| Cho | Choline |
| COID | Center of intensity differences |
| Cr | Creatine |
| CRT | Concentric ring trajectories |
| DSC | Sørensen–Dice similarity coefficient |
| FID | Free induction decay |
| FISP | Fast imaging with steady-state precession |
| FLAIR | Fluid-attenuated inversion recovery |
| FOV | Field of view |
| Gln | Glutamine |
| Glu | Glutamate |
| Gly | Glycine |
| Ins | Myo-inositol |
| MP2RAGE | Magnetization-prepared 2 rapid gradient-echo |
| MRF | Magnetic resonance fingerprinting |
| MRI | Magnetic resonance imaging |
| MRSI | Magnetic resonance spectroscopic imaging |
| NAA | N-acetylaspartate |
| NAWM | Normal-appearing white matter |
| PET | Positron emission tomography |
| PT | Peritumoral segmentation |
| ROI | Region of interest |
| SNR | Signal to noise ratio |
| TA | Acquisition time |
| tCho | Total choline |
| tCr | Total creatine |
| TE | Echo time |
| tNAA | Total N-acetylaspartate |
| TR | Repetition time |
| TU | Tumor segmentation |
References
- Petr, J.; Hogeboom, L.; Nikulin, P.; Wiegers, E.; Schroyen, G.; Kallehauge, J.; Chmelík, M.; Clement, P.; Nechifor, R.E.; Fodor, L.-A.; et al. A systematic review on the use of quantitative imaging to detect cancer therapy adverse effects in normal-appearing brain tissue. Magn. Reson. Mater. Phys. 2022, 35, 163–186. [Google Scholar] [CrossRef] [PubMed]
- Henriksen, O.M.; Del Mar Álvarez-Torres, M.; Figueiredo, P.; Hangel, G.; Keil, V.C.; Nechifor, R.E.; Riemer, F.; Schmainda, K.M.; Warnert, E.A.H.; Wiegers, E.C.; et al. High-Grade Glioma Treatment Response Monitoring Biomarkers: A Position Statement on the Evidence Supporting the Use of Advanced MRI Techniques in the Clinic, and the Latest Bench-to-Bedside Developments. Part 1: Perfusion and Diffusion Techniques. Front. Oncol. 2022, 12, 810263. [Google Scholar] [CrossRef]
- Booth, T.C.; Wiegers, E.C.; Warnert, E.A.H.; Schmainda, K.M.; Riemer, F.; Nechifor, R.E.; Keil, V.C.; Hangel, G.; Figueiredo, P.; Álvarez-Torres, M.D.M.; et al. High-Grade Glioma Treatment Response Monitoring Biomarkers: A Position Statement on the Evidence Supporting the Use of Advanced MRI Techniques in the Clinic, and the Latest Bench-to-Bedside Developments. Part 2: Spectroscopy, Chemical Exchange Saturation, Multiparametric Imaging, and Radiomics. Front. Oncol. 2022, 11, 811425. [Google Scholar] [CrossRef] [PubMed]
- Mert, A.; Kiesel, B.; Wöhrer, A.; Martínez-Moreno, M.; Minchev, G.; Furtner, J.; Knosp, E.; Wolfsberger, S.; Widhalm, G. Introduction of a standardized multimodality image protocol for navigation-guided surgery of suspected low-grade gliomas. Neurosurg. Focus. 2015, 38, E4. [Google Scholar] [CrossRef] [PubMed]
- Ma, D.; Gulani, V.; Seiberlich, N.; Liu, K.; Sunshine, J.L.; Duerk, J.L.; Griswold, M.A. Magnetic resonance fingerprinting. Nature 2013, 495, 187–192. [Google Scholar] [CrossRef] [PubMed]
- Hangel, G.; Cadrien, C.; Lazen, P.; Furtner, J.; Lipka, A.; Hečková, E.; Hingerl, L.; Motyka, S.; Gruber, S.; Strasser, B.; et al. High-resolution metabolic imaging of high-grade gliomas using 7T-CRT-FID-MRSI. Neuroimage Clin. 2020, 28, 102433. [Google Scholar] [CrossRef]
- Hangel, G.; Lazen, P.; Sharma, S.; Hristoska, B.; Cadrien, C.; Furtner, J.; Rausch, I.; Lipka, A.; Niess, E.; Hingerl, L.; et al. 7T HR FID-MRSI Compared to Amino Acid PET: Glutamine and Glycine as Promising Biomarkers in Brain Tumors. Cancers 2022, 14, 2163. [Google Scholar] [CrossRef]
- Amelio, I.; Cutruzzolá, F.; Antonov, A.; Agostini, M.; Melino, G. Serine and glycine metabolism in cancer. Trends Biochem. Sci. 2014, 39, 191–198. [Google Scholar] [CrossRef]
- DeBerardinis, R.J.; Cheng, T. Q’s next: The diverse functions of glutamine in metabolism, cell biology and cancer. Oncogene 2010, 29, 313–324. [Google Scholar] [CrossRef] [PubMed]
- Wise, D.R.; Thompson, C.B. Glutamine addiction: A new therapeutic target in cancer. Trends Biochem. Sci. 2010, 35, 427–433. [Google Scholar] [CrossRef] [PubMed]
- Sonkar, K.; Ayyappan, V.; Tressler, C.M.; Adelaja, O.; Cai, R.; Cheng, M.; Glunde, K. Focus on the glycerophosphocholine pathway in choline phospholipid metabolism of cancer. NMR Biomed. 2019, 32, e4112. [Google Scholar] [CrossRef] [PubMed]
- Nagashima, H.; Sasayama, T.; Tanaka, K.; Kyotani, K.; Sato, N.; Maeyama, M.; Kohta, M.; Sakata, J.; Yamamoto, Y.; Hosoda, K.; et al. Myo-inositol concentration in MR spectroscopy for differentiating high grade glioma from primary central nervous system lymphoma. J. Neurooncol 2018, 136, 317–326. [Google Scholar] [CrossRef]
- Best, J.G.; Stagg, C.J.; Dennis, A. Chapter 2.5—Other Significant Metabolites: Myo-Inositol, GABA, Glutamine, and Lactate. In Magnetic Resonance Spectroscopy; Stagg, C., Rothman, D., Eds.; Academic Press: San Diego, CA, USA, 2014; pp. 122–138. ISBN 978-0-12-401688-0. [Google Scholar]
- Moffett, J.R.; Ross, B.; Arun, P.; Madhavarao, C.N.; Namboodiri, A.M.A. N-Acetylaspartate in the CNS: From neurodiagnostics to neurobiology. Prog. Neurobiol. 2007, 81, 89–131. [Google Scholar] [CrossRef] [PubMed]
- Li, X.; Abiko, K.; Sheriff, S.; Maudsley, A.A.; Urushibata, Y.; Ahn, S.; Tha, K.K. The Distribution of Major Brain Metabolites in Normal Adults: Short Echo Time Whole-Brain MR Spectroscopic Imaging Findings. Metabolites 2022, 12, 543. [Google Scholar] [CrossRef]
- Hingerl, L.; Strasser, B.; Moser, P.; Hangel, G.; Motyka, S.; Heckova, E.; Gruber, S.; Trattnig, S.; Bogner, W. Clinical High-Resolution 3D-MR Spectroscopic Imaging of the Human Brain at 7 T. Investig. Radiol. 2020, 55, 239–248. [Google Scholar] [CrossRef]
- Tomiyasu, M.; Harada, M. In vivo Human MR Spectroscopy Using a Clinical Scanner: Development, Applications, and Future Prospects. Magn. Reson. Med. Sci. 2022, 21, 235–252. [Google Scholar] [CrossRef] [PubMed]
- Hattingen, E.; Müller, A.; Jurcoane, A.; Mädler, B.; Ditter, P.; Schild, H.; Herrlinger, U.; Glas, M.; Kebir, S. Value of quantitative magnetic resonance imaging T1-relaxometry in predicting contrast-enhancement in glioblastoma patients. Oncotarget 2017, 8, 53542–53551. [Google Scholar] [CrossRef]
- Liu, L.; Yin, B.; Geng, D.Y.; Lu, Y.P.; Peng, W.J. Changes of T2 Relaxation Time from Neoadjuvant Chemotherapy in Breast Cancer Lesions. Iran. J. Radiol. 2016, 13, e24014. [Google Scholar] [CrossRef]
- Mauler, J.; Maudsley, A.A.; Langen, K.-J.; Nikoubashman, O.; Stoffels, G.; Sheriff, S.; Lohmann, P.; Filss, C.; Galldiks, N.; Kops, E.R.; et al. Spatial Relationship of Glioma Volume Derived from 18F-FET PET and Volumetric MR Spectroscopy Imaging: A Hybrid PET/MRI Study. J. Nucl. Med. 2018, 59, 603–609. [Google Scholar] [CrossRef]
- Louis, D.N.; Perry, A.; Wesseling, P.; Brat, D.J.; Cree, I.A.; Figarella-Branger, D.; Hawkins, C.; Ng, H.K.; Pfister, S.M.; Reifenberger, G.; et al. The 2021 WHO Classification of Tumors of the Central Nervous System: A summary. Neuro-Oncology 2021, 23, 1231–1251. [Google Scholar] [CrossRef]
- Provencher, S.W. Automatic quantitation of localized in vivo 1H spectra with LCModel. NMR Biomed. 2001, 14, 260–264. [Google Scholar] [CrossRef]
- Považan, M.; Strasser, B.; Hangel, G.; Heckova, E.; Gruber, S.; Trattnig, S.; Bogner, W. Simultaneous mapping of metabolites and individual macromolecular components via ultra-short acquisition delay 1H MRSI in the brain at 7T. Magn. Reson. Med. 2018, 79, 1231–1240. [Google Scholar] [CrossRef]
- Považan, M.; Hangel, G.; Strasser, B.; Gruber, S.; Chmelik, M.; Trattnig, S.; Bogner, W. Mapping of brain macromolecules and their use for spectral processing of 1H-MRSI data with an ultra-short acquisition delay at 7T. NeuroImage 2015, 121, 126–135. [Google Scholar] [CrossRef]
- Lin, A.; Andronesi, O.; Bogner, W.; Choi, I.-Y.; Coello, E.; Cudalbu, C.; Juchem, C.; Kemp, G.J.; Kreis, R.; Krššák, M.; et al. Minimum Reporting Standards for in vivo Magnetic Resonance Spectroscopy (MRSinMRS): Experts’ consensus recommendations. NMR Biomed. 2021, 34, e4484. [Google Scholar] [CrossRef] [PubMed]
- Dice, L.R. Measures of the Amount of Ecologic Association Between Species. Ecology 1945, 26, 297–302. [Google Scholar] [CrossRef]
- Carass, A.; Roy, S.; Gherman, A.; Reinhold, J.C.; Jesson, A.; Arbel, T.; Maier, O.; Handels, H.; Ghafoorian, M.; Platel, B.; et al. Evaluating White Matter Lesion Segmentations with Refined Sørensen-Dice Analysis. Sci. Rep. 2020, 10, 8242. [Google Scholar] [CrossRef] [PubMed]
- Hirschler, L.; Sollmann, N.; Schmitz-Abecassis, B.; Pinto, J.; Arzanforoosh, F.; Barkhof, F.; Booth, T.; Calvo-Imirizaldu, M.; Cassia, G.; Chmelik, M.; et al. Advanced MR Techniques for Preoperative Glioma Characterization: Part 1. J. Magn. Reson. Imaging 2023, 57, 1655–1675. [Google Scholar] [CrossRef] [PubMed]
- de Blank, P.; Badve, C.; Gold, D.R.; Stearns, D.; Sunshine, J.; Dastmalchian, S.; Tomei, K.; Sloan, A.E.; Barnholtz-Sloan, J.S.; Lane, A.; et al. Magnetic Resonance Fingerprinting to Characterize Childhood and Young Adult Brain Tumors. Pediatr. Neurosurg. 2019, 54, 310–318. [Google Scholar] [CrossRef] [PubMed]
- Springer, E.; Cardoso, P.L.; Strasser, B.; Bogner, W.; Preusser, M.; Widhalm, G.; Nittka, M.; Koerzdoerfer, G.; Szomolanyi, P.; Hangel, G.; et al. MR Fingerprinting-A Radiogenomic Marker for Diffuse Gliomas. Cancers 2022, 14, 723. [Google Scholar] [CrossRef] [PubMed]
- Marik, W.; Cardoso, P.L.; Springer, E.; Bogner, W.; Preusser, M.; Widhalm, G.; Hangel, G.; Hainfellner, J.A.; Rausch, I.; Weber, M.; et al. Evaluation of Gliomas with Magnetic Resonance Fingerprinting with PET Correlation—A Comparative Study. Cancers 2023, 15, 2740. [Google Scholar] [CrossRef] [PubMed]
- Hangel, G.; Niess, E.; Lazen, P.; Bednarik, P.; Bogner, W.; Strasser, B. Emerging methods and applications of ultra-high field MR spectroscopic imaging in the human brain. Anal. Biochem. 2022, 638, 114479. [Google Scholar] [CrossRef] [PubMed]
- Hangel, G.; Schmitz-Abecassis, B.; Sollmann, N.; Pinto, J.; Arzanforoosh, F.; Barkhof, F.; Booth, T.; Calvo-Imirizaldu, M.; Cassia, G.; Chmelik, M.; et al. Advanced MR Techniques for Preoperative Glioma Characterization: Part 2. J. Magn. Reson. Imaging 2023, 57, 1676–1695. [Google Scholar] [CrossRef] [PubMed]
- Chekouo, T.; Mohammed, S.; Rao, A. A Bayesian 2D functional linear model for gray-level co-occurrence matrices in texture analysis of lower grade gliomas. Neuroimage Clin. 2020, 28, 102437. [Google Scholar] [CrossRef]
- Hangel, G.; Spurny-Dworak, B.; Lazen, P.; Cadrien, C.; Sharma, S.; Hingerl, L.; Hečková, E.; Strasser, B.; Motyka, S.; Lipka, A.; et al. Inter-subject stability and regional concentration estimates of 3D-FID-MRSI in the human brain at 7 T. NMR Biomed. 2021, 34, e4596. [Google Scholar] [CrossRef]
- Gottschalk, M.; Troprès, I.; Lamalle, L.; Grand, S.; Le Bas, J.-F.; Segebarth, C. Refined modelling of the short-T2 signal component and ensuing detection of glutamate and glutamine in short-TE, localised, (1) H MR spectra of human glioma measured at 3 T. NMR Biomed. 2016, 29, 943–951. [Google Scholar] [CrossRef]
- Schneider, J.F.; Confort-Gouny, S.; Viola, A.; Le Fur, Y.; Viout, P.; Bennathan, M.; Chapon, F.; Figarella-Branger, D.; Cozzone, P.; Girard, N. Multiparametric differentiation of posterior fossa tumors in children using diffusion-weighted imaging and short echo-time 1H-MR spectroscopy. J. Magn. Reson. Imaging 2007, 26, 1390–1398. [Google Scholar] [CrossRef] [PubMed]
- Lecocq, A.; Le Fur, Y.; Amadon, A.; Vignaud, A.; Cozzone, P.J.; Guye, M.; Ranjeva, J.-P. Fast water concentration mapping to normalize (1)H MR spectroscopic imaging. MAGMA 2015, 28, 87–100. [Google Scholar] [CrossRef] [PubMed]
Disclaimer/Publisher’s Note: The statements, opinions and data contained in all publications are solely those of the individual author(s) and contributor(s) and not of MDPI and/or the editor(s). MDPI and/or the editor(s) disclaim responsibility for any injury to people or property resulting from any ideas, methods, instructions or products referred to in the content. |
© 2024 by the authors. Licensee MDPI, Basel, Switzerland. This article is an open access article distributed under the terms and conditions of the Creative Commons Attribution (CC BY) license (https://creativecommons.org/licenses/by/4.0/).