
Valorization of Cork Stoppers, Coffee-Grounds and Walnut Shells in the Development and Characterization of Pectin-Based Composite Films: Physical, Barrier, Antioxidant, Genotoxic, and Biodegradation Properties

 ,
, 
 , , and
Abstract
1. Introduction
2. Materials and Methods
2.1. Materials
2.2. Preparation of the Films
2.3. Thickness and Water-Vapor Permeability (WVP)
2.4. Color and Opacity
2.5. Solubility and Moisture Content
2.6. Texture Measurements
2.7. Total Phenolic Content and Antioxidant Activity
2.8. Fourier-Transform Infrared Spectroscopy (FTIR)
2.9. Thermogravimetric Analysis (TGA)
2.10. Scanning Electron Microscopy (SEM)
2.11. Biodegradation Tests
2.11.1. Seawater
2.11.2. Soil
2.12. Genotoxicity Test
2.12.1. Acetic Acid Extraction
2.12.2. Ethanol Extraction
2.12.3. Ames Test
2.13. Statistical Analysis
3. Results and Discussion
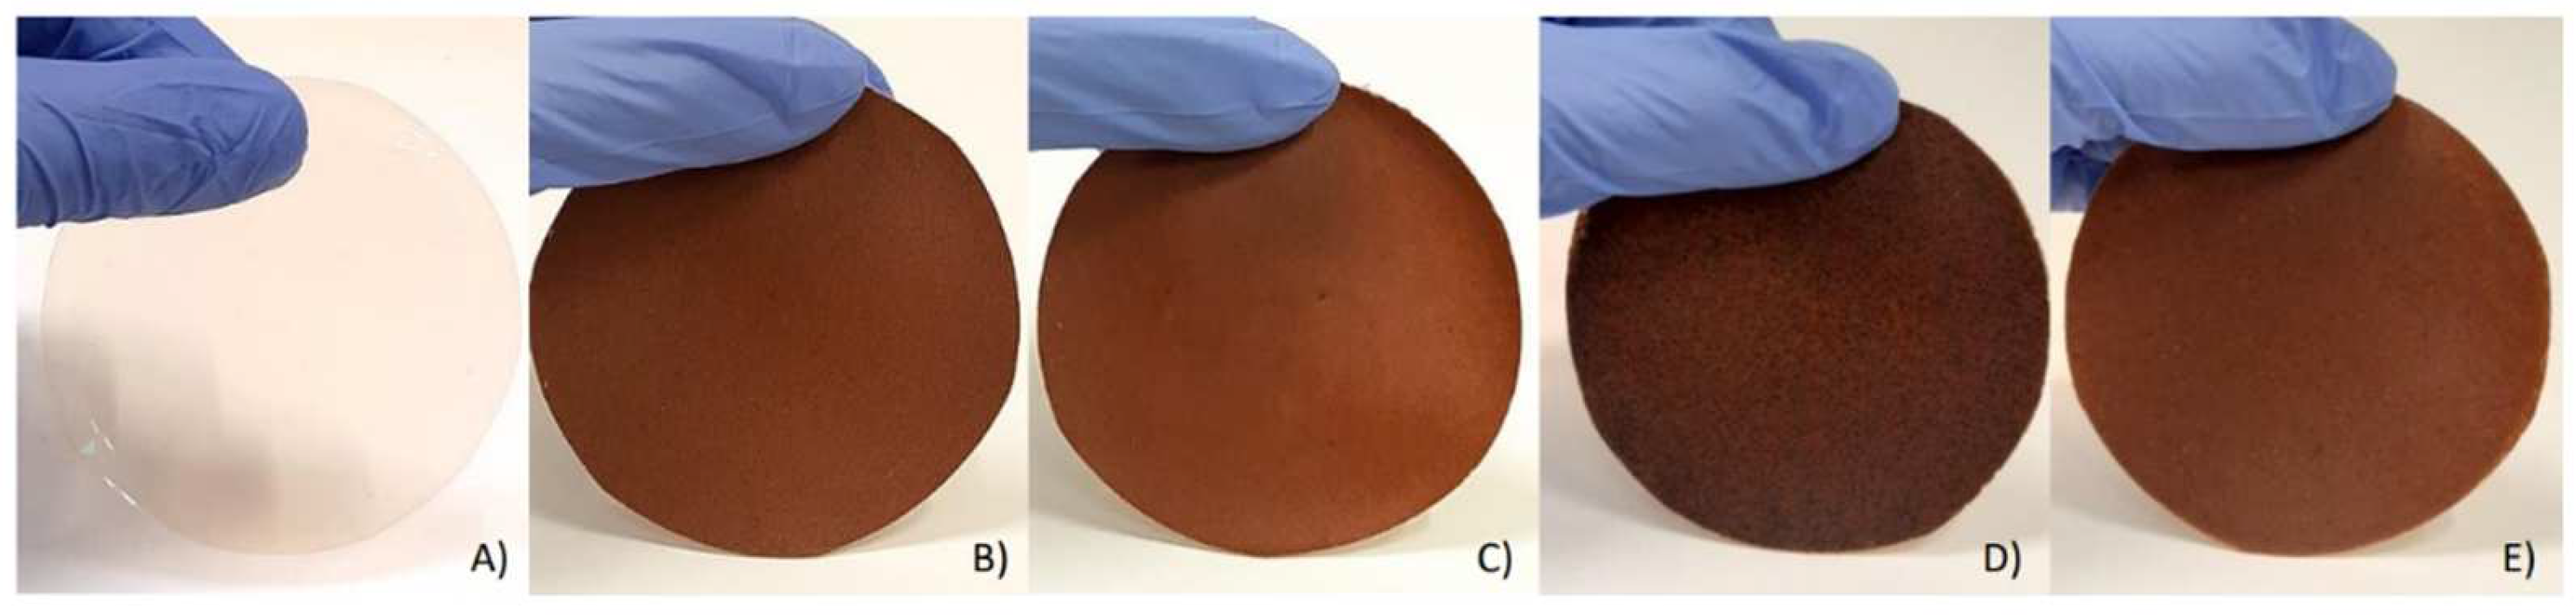
3.1. Physico-Mechanical and Antioxidant Properties
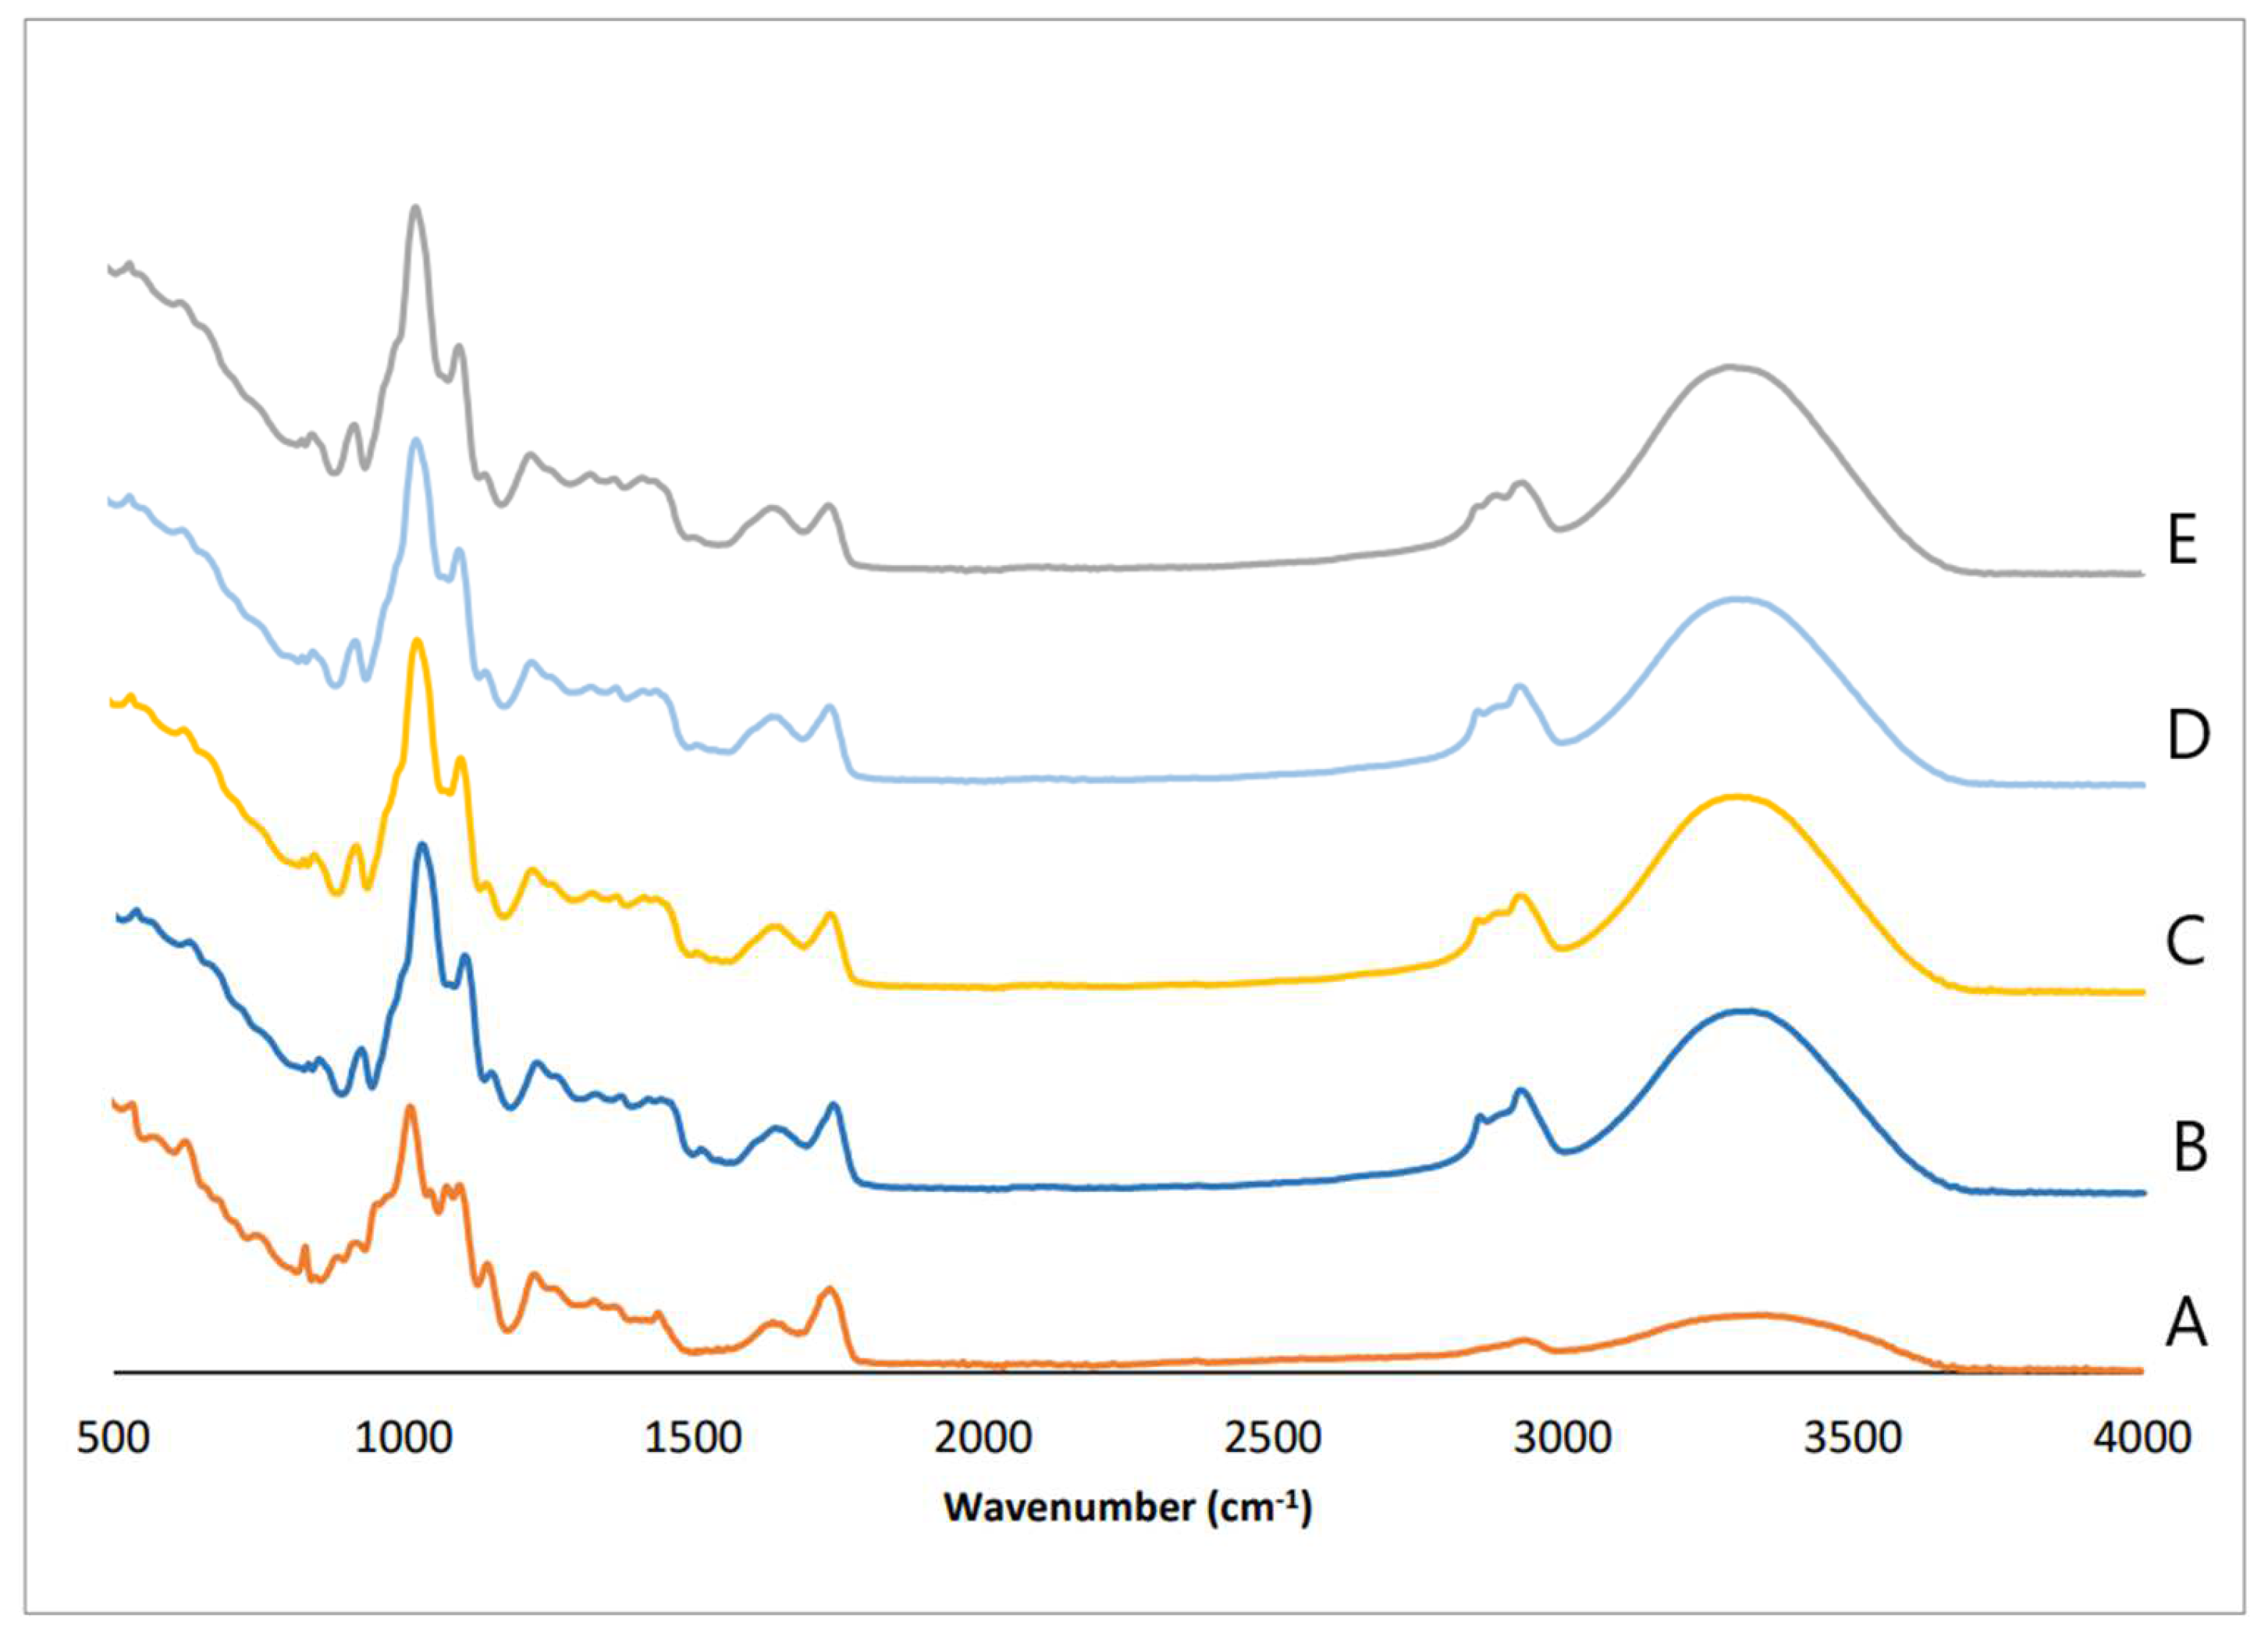
3.2. Fourier-Transform Infrared Spectroscopy (FTIR)
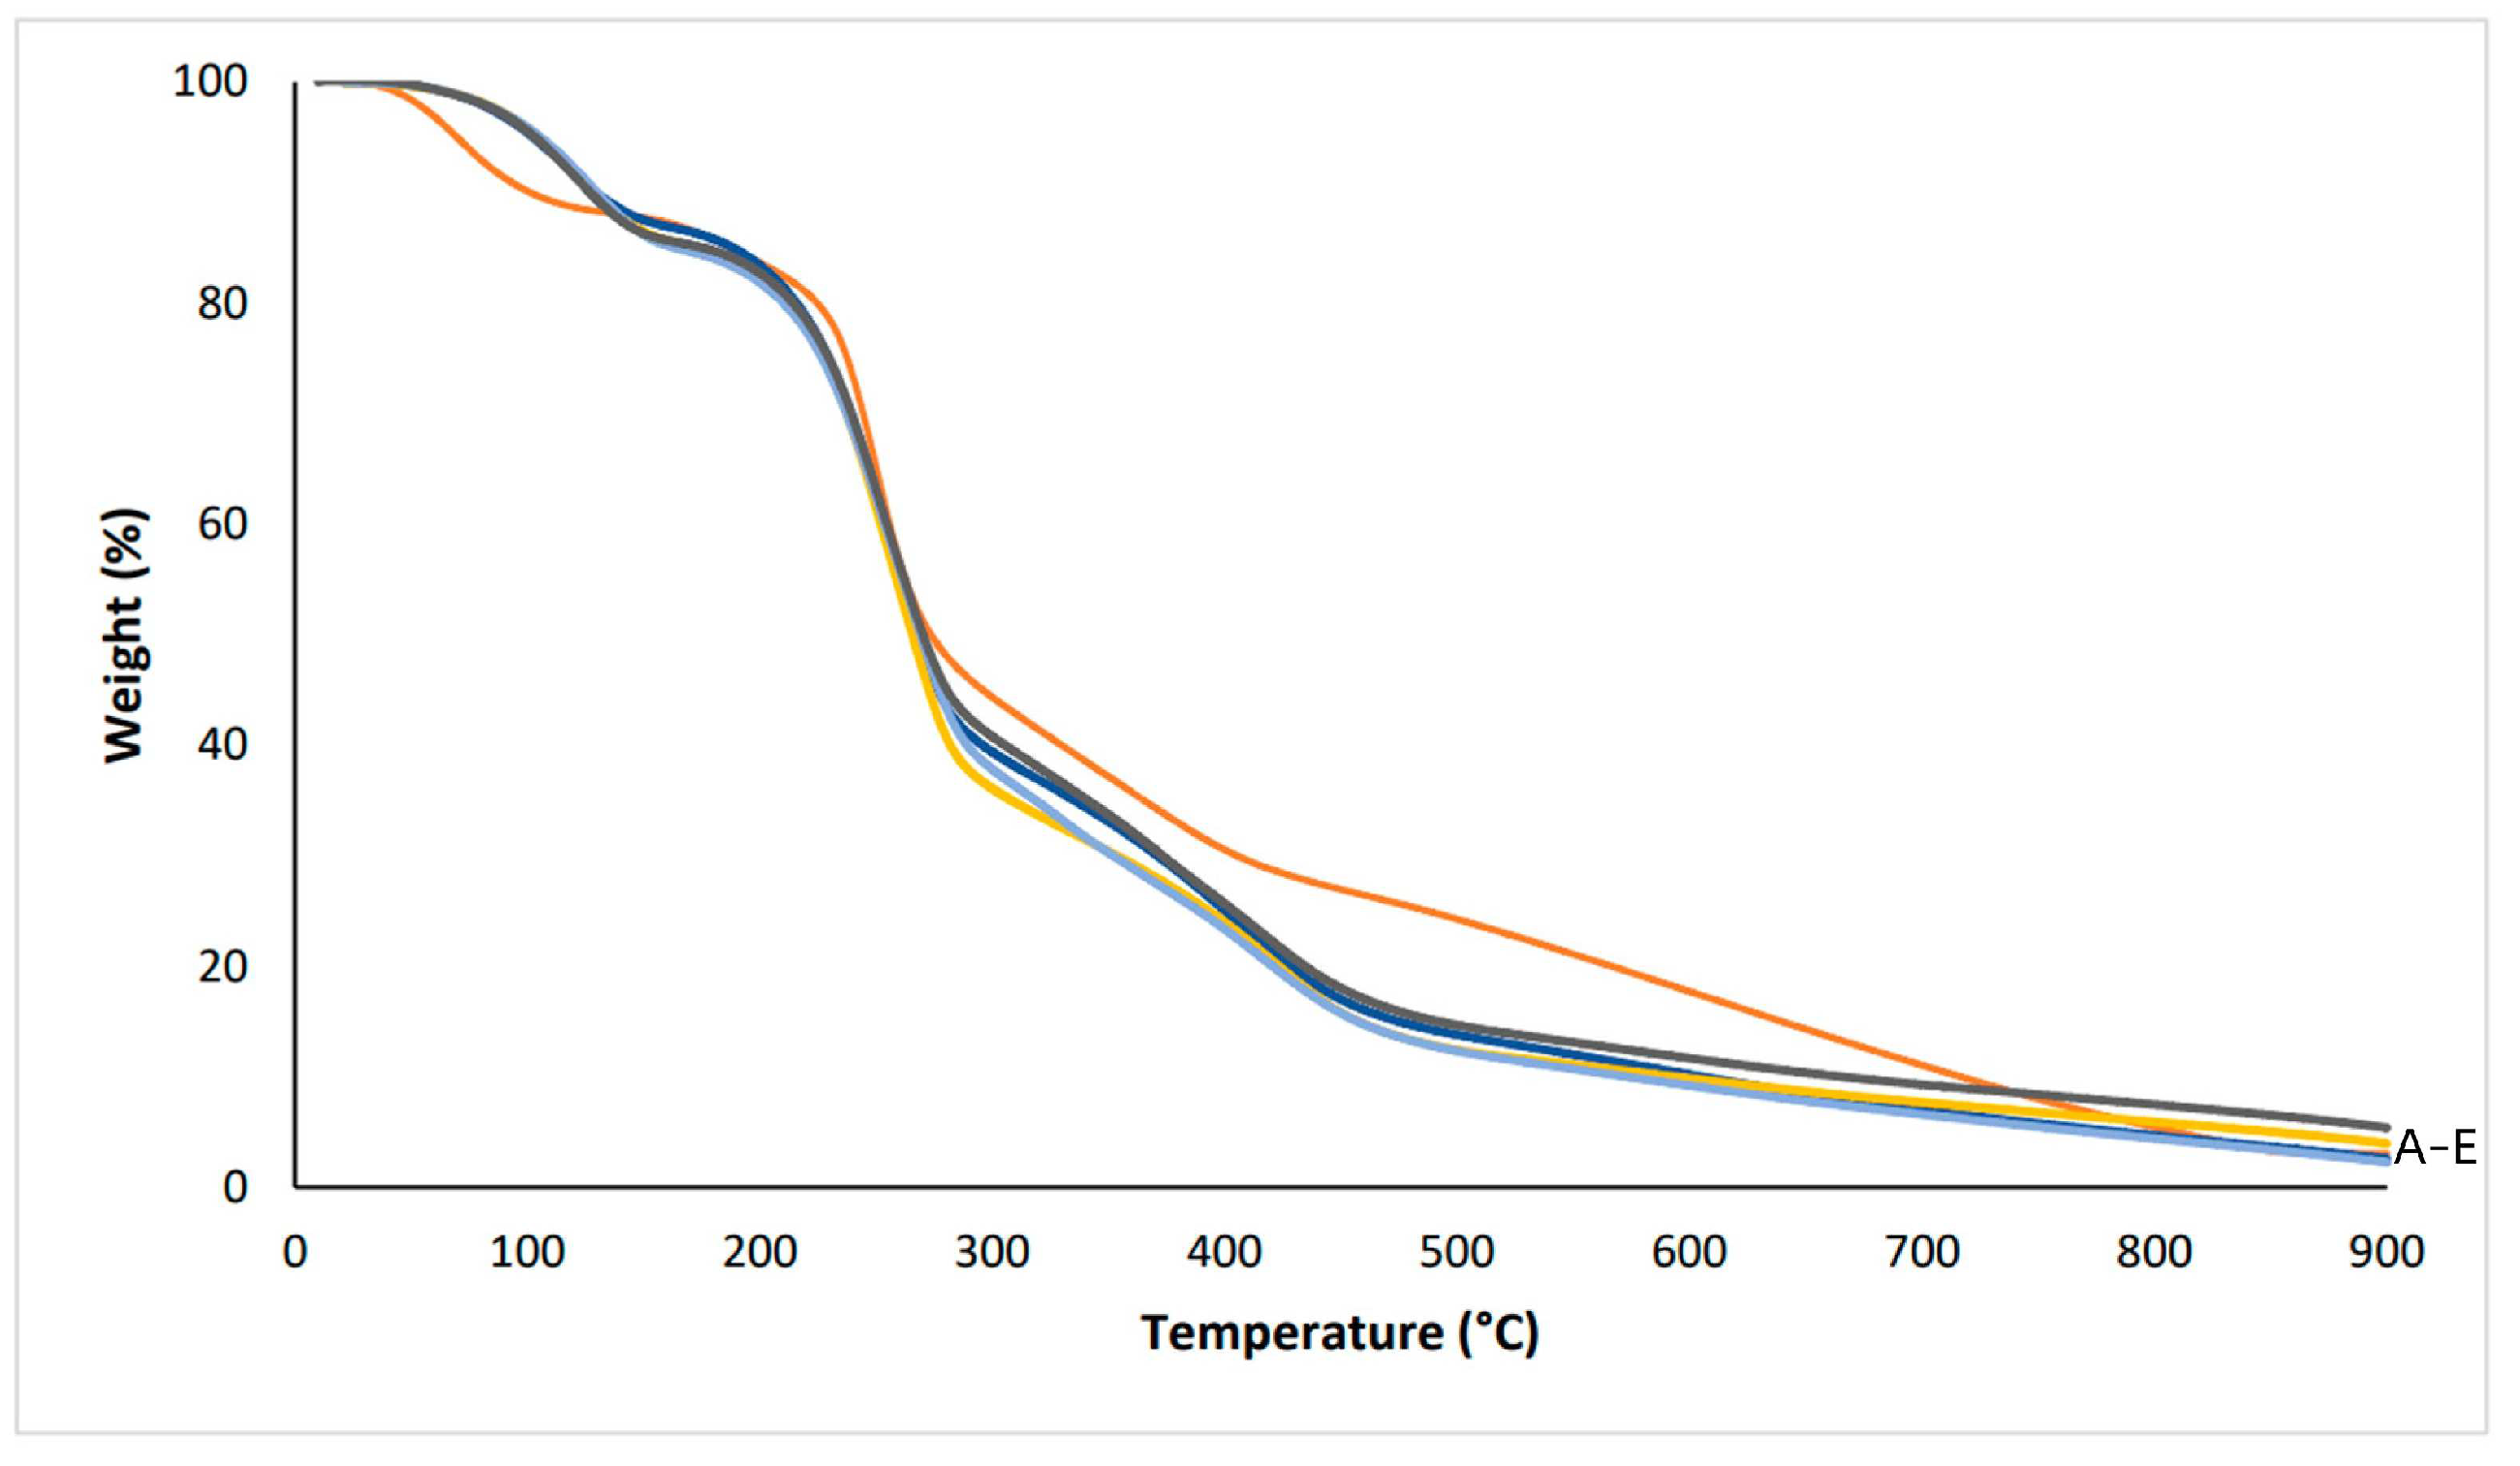
3.3. Thermogravimetric Analysis (TGA)
3.4. Scanning Electron Microscopy (SEM)
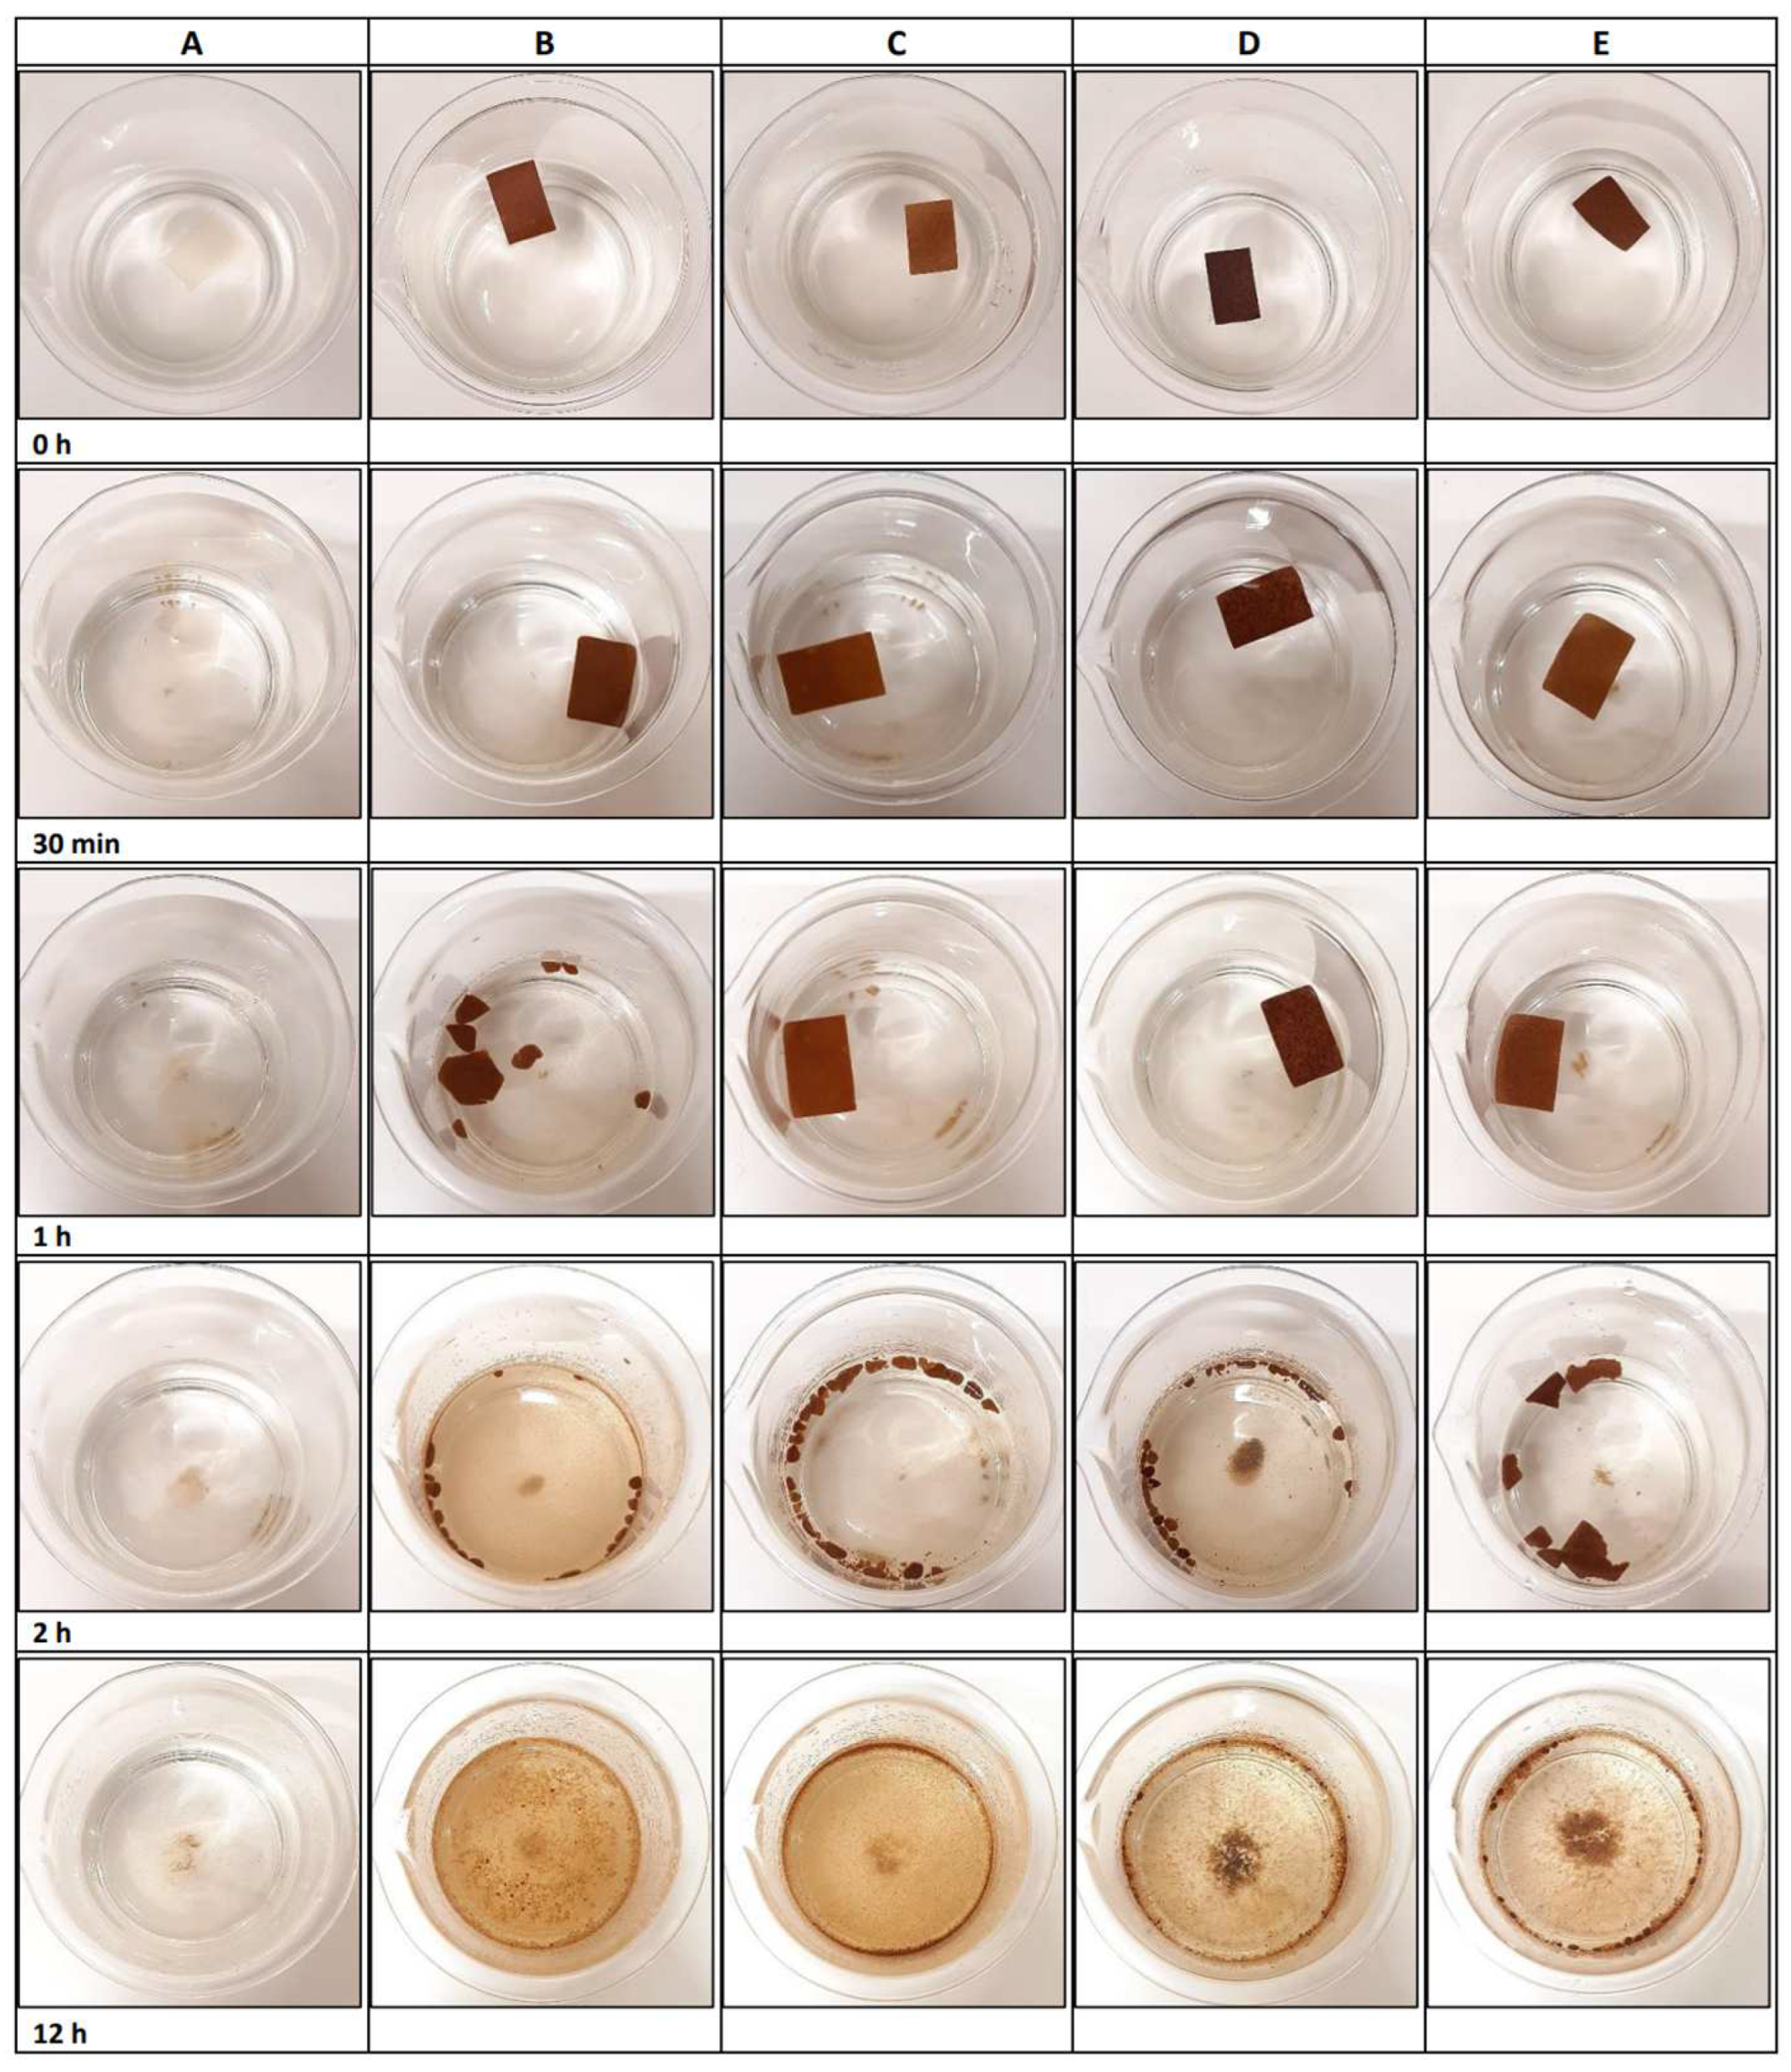
3.5. Biodegradation Properties
3.5.1. Seawater
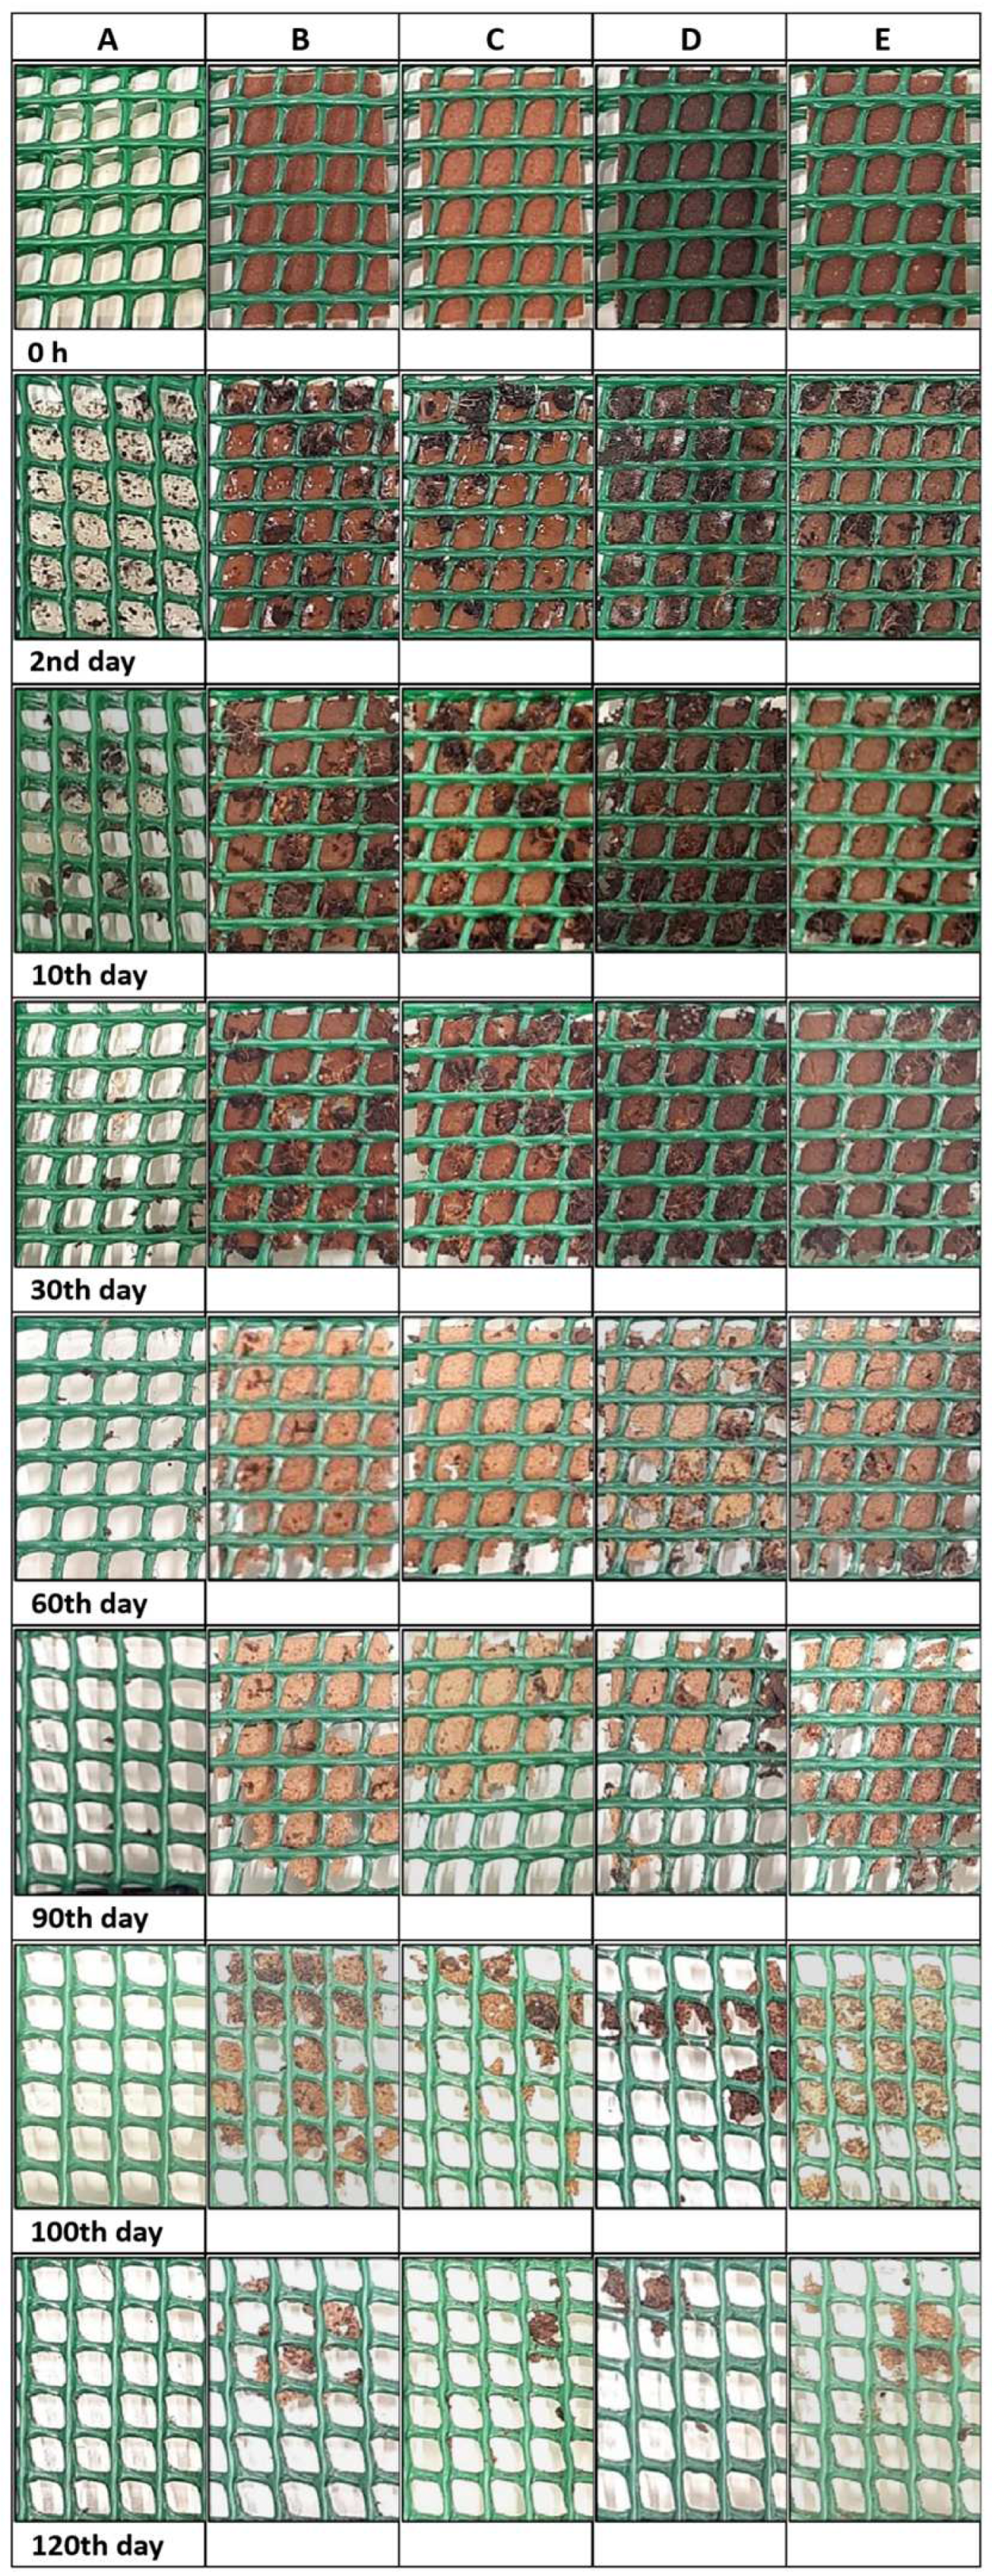
3.5.2. Soil
3.6. Genotoxicity
4. Conclusions
Author Contributions
Funding
Data Availability Statement
Acknowledgments
Conflicts of Interest
References
- Plastics Europe. Plastics—The Facts. 2022. Available online: https://plasticseurope.org/knowledge-hub/plastics-the-facts-2022/ (accessed on 8 October 2023).
- Robertson, G.L. Food Packaging: Principles and Practice, 3rd ed.; CRC Press: Boca Raton, FL, USA, 2016; ISBN 9781439862421. [Google Scholar]
- Singh, P.; Wani, A.A.; Langowski, H.-C. (Eds.) Food Packaging Materials: Testing & Quality Assurance; CRC Press: Boca Raton, FL, USA, 2017; ISBN 9781466559943. [Google Scholar]
- Jadhav, E.B.; Sankhla, M.S.; Bhat, R.A.; Bhagat, D.S. Microplastics from Food Packaging: An Overview of Human Consumption, Health Threats, and Alternative Solutions. Environ. Nanotechnol. Monit. Manag. 2021, 16, 100608. [Google Scholar] [CrossRef]
- Zhang, W.; Roy, S.; Assadpour, E.; Cong, X.; Jafari, S.M. Cross-Linked Biopolymeric Films by Citric Acid for Food Packaging and Preservation. Adv. Colloid Interface Sci. 2023, 314, 102886. [Google Scholar] [CrossRef] [PubMed]
- Kumar, R.; Verma, A.; Shome, A.; Sinha, R.; Sinha, S.; Jha, P.K.; Kumar, R.; Kumar, P.; Shubham; Das, S.; et al. Impacts of Plastic Pollution on Ecosystem Services, Sustainable Development Goals, and Need to Focus on Circular Economy and Policy Interventions. Sustainability 2021, 13, 9963. [Google Scholar] [CrossRef]
- Moshood, T.D.; Nawanir, G.; Mahmud, F.; Mohamad, F.; Ahmad, M.H.; AbdulGhani, A. Sustainability of Biodegradable Plastics: New Problem or Solution to Solve the Global Plastic Pollution? Curr. Res. Green Sustain. Chem. 2022, 5, 100273. [Google Scholar] [CrossRef]
- European Bioplastics. Bioplastics Market Development Update 2022. 2022. Available online: https://docs.european-bioplastics.org/publications/market_data/2022/Report_Bioplastics_Market_Data_2022_short_version.pdf (accessed on 8 October 2023).
- Rosenboom, J.-G.; Langer, R.; Traverso, G. Bioplastics for a Circular Economy. Nat. Rev. Mater. 2022, 7, 117–137. [Google Scholar] [CrossRef] [PubMed]
- Díaz-Montes, E.; Castro-Muñoz, R. Edible Films and Coatings as Food-Quality Preservers: An Overview. Foods 2021, 10, 249. [Google Scholar] [CrossRef]
- Teixeira, R.T. Cork Development: What Lies Within. Plants 2022, 11, 2671. [Google Scholar] [CrossRef]
- PricewaterhouseCoopers/ECOBILAN. Evaluation of the Environmental Impacts of Cork Stoppers versus Aluminium and Plastic Closures: Analysis of the Life Cycle of Cork, Aluminium and Plastic Wine Closures; Report Prepared for CORTICEIRA AMORIM, SGPS, SA; PricewaterhouseCoopers/ECOBILAN: Washington, DC, USA, 2008; pp. 1–126. Available online: https://www.amorim.com/xms/files/v1/Sustentabilidade/Casos_de_Estudo/2008_-_LCA_Final.pdf (accessed on 8 October 2023).
- Suffo, M.; Sales, D.L.; Cortés-Triviño, E.; de la Mata, M.; Jiménez, E. Characterization and Production of Agglomerated Cork Stoppers for Spirits Based on a Factor Analysis Method. Food Packag. Shelf Life 2022, 31, 100815. [Google Scholar] [CrossRef]
- Ihamouchen, C.; Djidjelli, H.; Boukerrou, A. Development and Characterization of a New Cork-Based Material. Mater. Today 2021, 36, 34–40. [Google Scholar] [CrossRef]
- Moutinho, L.G.; Soares, E.; Oliveira, M. Development of Bio-Based Expanded Cork Polymer Composites (ECPC) with Poly(Lactic Acid) (PLA). Mater. Sci. Eng. B Solid State Mater. Adv. Technol. 2023, 298, 116873. [Google Scholar] [CrossRef]
- Cobo-Ceacero, C.J.; Moreno-Maroto, J.M.; Guerrero-Martínez, M.; Uceda-Rodríguez, M.; López, A.B.; Martínez García, C.; Cotes-Palomino, T. Effect of the Addition of Organic Wastes (Cork Powder, Nut Shell, Coffee Grounds and Paper Sludge) in Clays to Obtain Expanded Lightweight Aggregates. Bol. Soc. Esp. Ceram. Vidr. 2023, 62, 88–105. [Google Scholar] [CrossRef]
- Bomfim, A.S.C.d.; de Oliveira, D.M.; Walling, E.; Babin, A.; Hersant, G.; Vaneeckhaute, C.; Dumont, M.-J.; Rodrigue, D. Spent Coffee Grounds Characterization and Reuse in Composting and Soil Amendment. Waste 2023, 1, 2–20. [Google Scholar] [CrossRef]
- Oliveira, G.; Passos, C.P.; Ferreira, P.; Coimbra, M.A.; Gonçalves, I. Coffee By-Products and Their Suitability for Developing Active Food Packaging Materials. Foods 2021, 10, 683. [Google Scholar] [CrossRef] [PubMed]
- Cataldo, V.A.; Cavallaro, G.; Lazzara, G.; Milioto, S.; Parisi, F. Coffee Grounds as Filler for Pectin: Green Composites with Competitive Performances Dependent on the UV Irradiation. Carbohydr. Polym. 2017, 170, 198–205. [Google Scholar] [CrossRef] [PubMed]
- Moustafa, H.; Guizani, C.; Dufresne, A. Sustainable Biodegradable Coffee Grounds Filler and Its Effect on the Hydrophobicity, Mechanical and Thermal Properties of Biodegradable PBAT Composites. J. Appl. Polym. Sci. 2017, 134, 1–11. [Google Scholar] [CrossRef]
- Abdolhosseini Sarsari, N.; Pourmousa, S.; Tajdini, A. Physical and Mechanical Properties of Walnut Shell Flour-Filled Thermoplastic Starch Composites. Bioresources 2016, 11, 6968–6983. [Google Scholar] [CrossRef]
- Beskopylny, A.N.; Stel’makh, S.A.; Shcherban’, E.M.; Mailyan, L.R.; Meskhi, B.; Shilov, A.A.; Chernil’nik, A.; El’shaeva, D. Effect of Walnut-Shell Additive on the Structure and Characteristics of Concrete. Materials 2023, 16, 1752. [Google Scholar] [CrossRef] [PubMed]
- Sowińska-Baranowska, A.; Maciejewska, M.; Duda, P. The Potential Application of Starch and Walnut Shells as Biofillers for Natural Rubber (NR) Composites. Int. J. Mol. Sci. 2022, 23, 7968. [Google Scholar] [CrossRef] [PubMed]
- Girgin, B.; Tugrul, N. Development of Dry Walnut Shell Edible Film Plasticized with Glycerol and/or Sorbitol and Incorporated with Aloe Vera Gel and Lemon Essential Oil. Period. Polytech. Chem. Eng. 2023, 67, 193–204. [Google Scholar] [CrossRef]
- Lizundia, E.; Luzi, F.; Puglia, D. Organic Waste Valorisation towards Circular and Sustainable Biocomposites. Green Chem. 2022, 24, 5429–5459. [Google Scholar] [CrossRef]
- Dörnyei, K.R.; Uysal-Unalan, I.; Krauter, V.; Weinrich, R.; Incarnato, L.; Karlovits, I.; Colelli, G.; Chrysochou, P.; Fenech, M.C.; Pettersen, M.K.; et al. Sustainable Food Packaging: An Updated Definition Following a Holistic Approach. Front. Sustain. Food Syst. 2023, 7, 1–12. [Google Scholar] [CrossRef]
- Mendes, J.F.; Norcino, L.B.; Manrich, A.; Pinheiro, A.C.M.; Oliveira, J.E.; Mattoso, L.H.C. Characterization of pectin films integrated with cocoa butter by continuous casting: Physical, thermal and barrier properties. J. Polym. Environ. 2020, 28, 2905–2917. [Google Scholar] [CrossRef]
- Bourtoom, T.; Chinnan, M.S. Preparation and properties of rice starch–chitosan blend biodegradable film. LWT Food Sci. Technol. 2008, 41, 1633–1641. [Google Scholar] [CrossRef]
- Martins, J.T.; Cerqueira, M.A.; Souza, B.W.S.; Carmo Avides, M.d.; Vicente, A.A. Shelf life extension of ricotta cheese using coatings of galactomannans from nonconventional sources incorporating nisin against Listeria monocytogenes. J. Agric. Food Chem. 2010, 58, 1884–1891. [Google Scholar] [CrossRef] [PubMed]
- Casariego, A.; Souza, B.W.S.; Cerqueira, M.A.; Teixeira, J.A.; Cruz, L.; Díaz, R.; Vicente, A.A. Chitosan/clay films’ properties as affected by biopolymer and clay micro/nanoparticles’ concentrations. Food Hydrocoll. 2009, 23, 1895–1902. [Google Scholar] [CrossRef]
- ASTM D 882; Standard Test Method for Tensile Properties of Thin Plastic Sheeting. ASTM International: West Conshohocken, PA, USA, 2002.
- Singleton, V.L.; Orthofer, R.; Lamuela-Raventós, R.M. Analysis of Total Phenols and Other Oxidation Substrates and Antioxidants by Means of Folin-Ciocalteu Reagent. In Oxidants and Antioxidants Part A; Elsevier: Amsterdam, The Netherlands, 1999; pp. 152–178. ISBN 9780121822002. [Google Scholar]
- Re, R.; Pellegrini, N.; Proteggente, A.; Pannala, A.; Yang, M.; Rice-Evans, C. Antioxidant Activity Applying an Improved ABTS Radical Cation Decolorization Assay. Free Radic. Biol. Med. 1999, 26, 1231–1237. [Google Scholar] [CrossRef] [PubMed]
- Ferri, M.; Gianotti, A.; Tassoni, A. Optimisation of Assay Conditions for the Determination of Antioxidant Capacity and Polyphenols in Cereal Food Components. J. Food Compost. Anal. 2013, 30, 94–101. [Google Scholar] [CrossRef]
- Accinelli, C.; Saccà, M.L.; Mencarelli, M.; Vicari, A. Deterioration of bioplastic carrier bags in the environment and assessment of a new recycling alternative. Chemosphere 2012, 89, 136–143. [Google Scholar] [CrossRef] [PubMed]
- Altaee, N.; El-Hiti, G.A.; Fahdil, A.; Sudesh, K.; Yousif, E. Biodegradation of different formulations of polyhydroxybutyrate films in soil. SpringerPlus 2016, 5, 762. [Google Scholar] [CrossRef]
- Rainer, B.; Mayrhofer, E.; Redl, M.; Dolak, I.; Mislivececk, D.; Czerny, T.; Kirchnawy, C.; Marin-Kuan, M.; Schilter, B.; Tacker, M. Mutagenicity Assessment of Food Contact Material Migrates with the Ames MPF Assay. Food Addit. Contam. Part A Chem. Anal. Control Expo. Risk Assess. 2019, 36, 1419–1432. [Google Scholar] [CrossRef]
- Nisar, T.; Wang, Z.-C.; Alim, A.; Iqbal, M.; Yang, X.; Sun, L.; Guo, Y. Citrus pectin films enriched with thinned young apple polyphenols for potential use as bio-based active packaging. CyTA J. Food 2019, 17, 695–705. [Google Scholar] [CrossRef]
- Mendes, J.F.; Martins, J.T.; Manrich, A.; Sena Neto, A.R.; Pinheiro, A.C.M.; Mattoso, L.H.C.; Martins, M.A. Development and Physical-Chemical Properties of Pectin Film Reinforced with Spent Coffee Grounds by Continuous Casting. Carbohydr. Polym. 2019, 210, 92–99. [Google Scholar] [CrossRef] [PubMed]
- Valdespino-León, M.; Calderón-Domínguez, G.; De La Paz Salgado-Cruz, M.; Rentería-Ortega, M.; Farrera-Rebollo, R.R.; Morales-Sánchez, E.; Gaona-Sánchez, V.A.; Terrazas-Valencia, F. Biodegradable Electrosprayed Pectin Films: An Alternative to Valorize Coffee Mucilage. Waste Biomass Valorization 2021, 12, 2477–2494. [Google Scholar] [CrossRef]
- Mongkholrattanasit, R.; Nakpathom, M.; Vuthiganond, N. Eco-Dyeing with Biocolorant from Spent Coffee Ground on Low Molecular Weight Chitosan Crosslinked Cotton. Sustain. Chem. Pharm. 2021, 20, 100389. [Google Scholar] [CrossRef]
- Wei, H.; Pascall, M.A. Evaluation of Structural and Functional Properties of Citrus Pectin Film Enriched with Green Tea Extract. Polym. Eng. Sci. 2023, 63, 2522–2533. [Google Scholar] [CrossRef]
- Dias, A.B. Desenvolvimento e Caracterização de Filmes Biodegradáveis Obtidos de Amido e de Farinha de Arroz. Universidade Federal de Santa Catarina. 2008, pp. 1–116. Available online: http://repositorio.ufsc.br/xmlui/handle/123456789/92138 (accessed on 11 December 2023).
- Meneguin, A.; Cury, B.; Evangelista, R. Films from resistant starch-pectin dispersions intended for colonic drug delivery. Carbohydr. Polym. 2014, 99, 140–149. [Google Scholar] [CrossRef] [PubMed]
- Aristizabal-Gil, M.V.; Santiago-Toro, S.; Sanchez, L.T.; Pinzon, M.I.; Gutierrez, J.A.; Villa, C.C. ZnO and ZnO/CaO Nanoparticles in Alginate Films. Synthesis, Mechanical Characterization, Barrier Properties and Release Kinetics. Lebenson. Wiss. Technol. 2019, 112, 108217. [Google Scholar] [CrossRef]
- Chen, Y.; Xu, L.; Wang, Y.; Chen, Z.; Zhang, M.; Chen, H. Characterization and Functional Properties of a Pectin/Tara Gum Based Edible Film with Ellagitannins from the Unripe Fruits of Rubus chingii Hu. Food Chem. 2020, 325, 126964. [Google Scholar] [CrossRef]
- Ren, W.; Qiang, T.; Chen, L. Recyclable and Biodegradable Pectin-Based Film with High Mechanical Strength. Food Hydrocoll. 2022, 129, 107643. [Google Scholar] [CrossRef]
- Priyadarshi, R.; Riahi, Z.; Rhim, J.-W. Antioxidant Pectin/Pullulan Edible Coating Incorporated with Vitis vinifera Grape Seed Extract for Extending the Shelf Life of Peanuts. Postharvest Biol. Technol. 2022, 183, 111740. [Google Scholar] [CrossRef]
- Santos, S.A.O.; Pinto, P.C.R.O.; Silvestre, A.J.D.; Neto, C.P. Chemical Composition and Antioxidant Activity of Phenolic Extracts of Cork from Quercus suber L. Ind. Crops Prod. 2010, 31, 521–526. [Google Scholar] [CrossRef]
- Andrade, C.; Perestrelo, R.; Câmara, J.S. Bioactive Compounds and Antioxidant Activity from Spent Coffee Grounds as a Powerful Approach for Its Valorization. Molecules 2022, 27, 7504. [Google Scholar] [CrossRef] [PubMed]
- Wang, X.; Zhao, M.; Su, G.; Cai, M.; Zhou, C.; Huang, J.; Lin, L. The Antioxidant Activities and the Xanthine Oxidase Inhibition Effects of Walnut (Juglans regia L.) Fruit, Stem and Leaf. Int. J. Food Sci. Technol. 2015, 50, 233–239. [Google Scholar] [CrossRef]
- Nisar, T.; Wang, Z.-C.; Yang, X.; Tian, Y.; Iqbal, M.; Guo, Y. Characterization of Citrus Pectin Films Integrated with Clove Bud Essential Oil: Physical, Thermal, Barrier, Antioxidant and Antibacterial Properties. Int. J. Biol. Macromol. 2018, 106, 670–680. [Google Scholar] [CrossRef]
- Sabbah, M.; Al-Asmar, A.; Younis, D.; Al-Rimawi, F.; Famiglietti, M.; Mariniello, L. Production and Characterization of Active Pectin Films with Olive or Guava Leaf Extract Used as Soluble Sachets for Chicken Stock Powder. Coatings 2023, 13, 1253. [Google Scholar] [CrossRef]
- Queirós, C.S.G.P.; Cardoso, S.; Lourenço, A.; Ferreira, J.; Miranda, I.; Lourenço, M.J.V.; Pereira, H. Characterization of Walnut, Almond, and Pine Nut Shells Regarding Chemical Composition and Extract Composition. Biomass Convers. Biorefin. 2020, 10, 175–188. [Google Scholar] [CrossRef]
- Quilez-Molina, A.I.; Chandra Paul, U.; Merino, D.; Athanassiou, A. Composites of Thermoplastic Starch and Lignin-Rich Agricultural Waste for the Packaging of Fatty Foods. ACS Sustain. Chem. Eng. 2022, 10, 15402–15413. [Google Scholar] [CrossRef]
- Cerna, M.; Barros, A.S.; Nunes, A.; Rocha, S.M.; Delgadillo, I.; Copikova, J.; Coimbra, M.A. Use of FT-IR spectroscopy as a tool for the analysis of polysaccharide food additives. Carbohydr. Polym. 2003, 51, 383–389. [Google Scholar] [CrossRef]
- Lorevice, M.V.; Otoni, C.G.; Moura, M.R.d.; Mattoso, L.H.C. Chitosan nanoparticles on the improvement of thermal, barrier, and mechanical properties of high and low-methyl pectin films. Food Hydrocoll. 2016, 52, 732–740. [Google Scholar] [CrossRef]
- Ye, S.; Zhu, Z.; Wen, Y.; Su, C.; Jiang, L.; He, S.; Shao, W. Facile and green preparation of pectin/cellulose composite films with enhanced antibacterial and antioxidant behaviors. Polymers 2019, 11, 57. [Google Scholar] [CrossRef] [PubMed]
- Syntsya, A.; Čpíková, J.; Marounek, M.; Mlčochová, P.; Sihelková, L.; Blafková, P.; Tkadlecová, M.; Havlíček, J. Preparation of N-alkylamides of highly methylated (HM) citrus pectin. Czech J. Food Sci. 2011, 21, 162–166. [Google Scholar] [CrossRef]
- Singthong, J.; Cui, S.; Ningsanond, S.; Douglasgoff, H. Structural Characterization, Degree of Esterification and Some Gelling Properties of Krueo Ma Noy (Cissampelos pareira) Pectin. Carbohydr. Polym. 2004, 58, 391–400. [Google Scholar] [CrossRef]
- Yu, H.; Peng, C.; Li, F.-C.; Yu, P. Effect of chloride salt type on the physicochemical, mechanical and morphological properties of fish gelatin film. Mater. Res. Express 2019, 6, 126414. [Google Scholar] [CrossRef]
- Alvarez-Zeferino, J.C.; Beltrán-Villavicencio, M.; Vázquez-Morillas, A. Degradation of plastics in seawater in laboratory. Open J. Polym. Chem. 2015, 5, 55–62. [Google Scholar] [CrossRef]
- Suhasini, M.R.; Rajeshwari, K.M.; Bindya, S.; Hemavathi, A.B.; Vishwanath, P.M.; Syed, A.; Eswaramoorthy, R.; Amachawadi, R.G.; Shivamallu, C.; Chattu, V.K.; et al. Pectin/PVA and Pectin-MgO/PVA Films: Preparation, Characterization and Biodegradation Studies. Heliyon 2023, 9, e15792. [Google Scholar] [CrossRef]
- Nakayama, A.; Yamano, N.; Kawasaki, N. Biodegradation in seawater of aliphatic polyesters. Polym. Degrad. Stab. 2019, 166, 290–299. [Google Scholar] [CrossRef]
- EN 13432:2000; Packaging—Requirements for Packaging Recoverable through Composting and Biodegradation—Test Scheme and Evaluation Criteria for the Final Acceptance of Packaging. British Standards Institution: London, UK, 2000; pp. 1–26.
- Shah, A.A.; Hasan, F.; Hameed, A.; Ahmed, S. Biological degradation of plastics: A comprehensive review. Biotechnol. Adv. 2008, 26, 246–265. [Google Scholar] [CrossRef] [PubMed]
- Rech, C.R.; da Silva Brabes, K.C.; Bagnara e Silva, B.E.; Bittencourt, P.R.S.; Koschevic, M.T.; da Silveira, T.F.S.; Martines, M.A.U.; Caon, T.; Martelli, S.M. Biodegradation of eugenol-loaded polyhydroxybutyrate films in different soil types. Case Stud. Chem. Environ. Eng. 2020, 2, 100014. [Google Scholar] [CrossRef]
- Folino, A.; Karageorgiou, A.; Calabrò, P.S.; Komilis, D. Biodegradation of Wasted Bioplastics in Natural and Industrial Environments: A Review. Sustainability 2020, 12, 6030. [Google Scholar] [CrossRef]
- Webb, H.; Arnott, J.; Crawford, R.; Ivanova, E. Plastic Degradation and Its Environmental Implications with Special Reference to Poly(Ethylene Terephthalate). Polymers 2012, 5, 1–18. [Google Scholar] [CrossRef]
- Oluwoye, I.; Machuca, L.L.; Higgins, S.; Suh, S.; Galloway, T.S.; Halley, P.; Tanaka, S.; Iannuzzi, M. Degradation and Lifetime Prediction of Plastics in Subsea and Offshore Infrastructures. Sci. Total Environ. 2023, 904, 166719. [Google Scholar] [CrossRef] [PubMed]
- Chamas, A.; Moon, H.; Zheng, J.; Qiu, Y.; Tabassum, T.; Jang, J.H.; Abu-Omar, M.; Scott, S.L.; Suh, S. Degradation Rates of Plastics in the Environment. ACS Sustain. Chem. Eng. 2020, 8, 3494–3511. [Google Scholar] [CrossRef]
- Olaosebikan, O.O.; Alo, M.N.; Ugah, U.I.; Olayemi, A.M. Environmental effect on biodegradability of plastic and paper bags. IOSR J. Environ. Sci. Toxicol. Food Technol. 2014, 8, 22–29. [Google Scholar] [CrossRef]
- Mayrhofer, E.; Prielinger, L.; Sharp, V.; Rainer, B.; Kirchnawy, C.; Rung, C.; Gruner, A.; Juric, M.; Springer, A. Safety Assessment of Recycled Plastics from Post-Consumer Waste with a Combination of a Miniaturized Ames Test and Chromatographic Analysis. Recycling 2023, 8, 87. [Google Scholar] [CrossRef]
- Garza-Cadena, C.; Ortega-Rivera, D.M.; Machorro-García, G.; Gonzalez-Zermeño, E.M.; Homma-Dueñas, D.; Plata-Gryl, M.; Castro-Muñoz, R. A Comprehensive Review on Ginger (Zingiber officinale) as a Potential Source of Nutraceuticals for Food Formulations: Towards the Polishing of Gingerol and Other Present Biomolecules. Food Chem. 2023, 413, 135629. [Google Scholar] [CrossRef]


| Sample Code | A | B | C | D | E |
|---|---|---|---|---|---|
| Sample weight (g) | 0.0424 | 0.2663 | 0.2739 | 0.2383 | 0.3000 |
| Dried sample residue (g) | 0 | 0.1313 | 0.1229 | 0.114 | 0.1470 |
| Sample in acetic acid (g) | 0.0424 | 0.135 | 0.151 | 0.1243 | 0.1530 |
| Percentage of sample extracted by acetic acid (%) | 100 | 51 | 55 | 52 | 51 |
| Sample concentration in solvent (mg/mL) | 14.3 | 64.3 | 71.7 | 59.3 | 72.4 |
| Sample Code | A | B | C | D | E |
|---|---|---|---|---|---|
| Sample weight (g) | 0.0379 | 0.3002 | 0.2413 | 0.2378 | 0.2794 |
| Dried sample residue (g) | 0.0338 | 0.158 | 0.1197 | 0.1202 | 0.1498 |
| Sample in ethanol (g) | 0.0424 | 0.1350 | 0.1510 | 0.1243 | 0.1530 |
| Percentage of sample extracted by ethanol (%) | 11% | 47% | 50% | 49% | 46% |
| Sample concentration in solvent (mg/mL) | 1.48 | 57.15 | 47.65 | 46.18 | 51.67 |
| Film A | Film B | Film C | Film D | Film E | |
|---|---|---|---|---|---|
| Thickness (mm) | 0.074 ± 0.003 a | 0.552 ± 0.021 b | 0.487 ± 0.014 c | 0.572 ± 0.014 b | 0.553 ± 0.028 b |
| Color | |||||
| L* | 91.86 ± 0.18 a | 33.32 ± 0.51 b | 33.93 ± 0.84 b | 25.30 ± 0.78 c | 30.52 ± 1.14 b |
| a* | 1.20 ± 0.12 a | 14.76 ± 0.39 b | 14.73 ± 0.40 b | 6.19 ± 0.38 c | 12.60 ± 1.43 b |
| b* | 15.62 ± 0.71 a | 16.39 ± 0.79 a | 16.39 ± 0.82 a | 6.55 ± 0.53 b | 13.77 ± 1.67 a |
| Opacity (%) | 12.00 ± 0.40 a | 99.50 ± 0.54 b,c | 99.70 ± 0.62 b,c | 99.80 ± 0.54 c | 96.70 ± 1.71 b,d |
| Water-vapor permeability (g/(m.s.Pa)) | 3.84 × 10⁻¹⁰ ± 1.82 × 10⁻¹¹ a | 1.75 × 10⁻⁹ ± 2.27 × 10⁻¹¹ b | 1.88 × 10⁻⁹ ± 4.00 × 10⁻¹¹ b | 4.52 × 10⁻⁹ ± 1.60 × 10⁻¹⁰ c | 5.87 × 10⁻⁹ ± 1.82 × 10⁻¹⁰ d |
| Water solubility (%) | 100.00 ± 0.00 a | 55.70 ± 2.50 b | 70.10 ± 2.60 c | 51.90 ± 6.70 b,c | 56.20 ± 6.20 b,c |
| Moisture content (%) | 12.80 ± 7.20 a | 49.50 ± 3.60 b | 49.60 ± 4.50 b | 48.60 ± 3.40 b | 45.90 ± 0.20 b |
| Elongation at break (%) | 2.50 ± 0.5 a | 36.30 ± 3.25 b | 32.24 ± 1.88 b | 7.50 ± 0.76 c | 2.50 ± 0.19 a |
| Young’s modulus (MPa) | 0.99 ± 0.07 a | 0.16 ± 0.01 b | 0.15 ± 0.03 b,c | 0.19 ± 0.01 c | 0.16 ± 0.02 b,c |
| Tensile strenght (MPa) | 20.47 ± 2.55 a | 0.91 ± 0.19 b | 1.09 ± 0.08 b | 0.99 ± 0.09 b | 1.05 ± 0.06 b |
| TPC (mg Gallic acid/g)DPPH (mg Trolox/g)ABTS (mg Trolox/g) | 0.96 ± 0 a 0.31 ± 0 a 0.99 ± 0.01 a | 3.76 ± 0.02 b 5.57 ± 0.21 b,c 8.73 ± 0.04 b | 3.17 ± 0.01 c 4.49 ± 0.06 d 6.34 ± 0.40 c | 3.88 ± 0.02 d 5.60 ± 0.10 b 6.80 ± 0.10 d | 4.24 ± 0.02 e 5.35 ± 0.05 c 9.08 ± 0.30 b |
| Sample | TA98 | TA98 + S9 | TA100 | TA100 + S9 |
|---|---|---|---|---|
| A_A | - | - | - | - |
| B_A | - | - | - | - |
| C_A | - | - | - | - |
| D_A | - | - | - | - |
| E_A | - | - | - | - |
| Acetic Acid | - | - | - | - |
| A_E | - | - | - | - |
| B_E | - | - | - | - |
| C_E | - | - | - | - |
| D_E | - | - | - | - |
| E_E | - | - | - | - |
| 95% Ethanol | - | - | - | - |
Disclaimer/Publisher’s Note: The statements, opinions and data contained in all publications are solely those of the individual author(s) and contributor(s) and not of MDPI and/or the editor(s). MDPI and/or the editor(s) disclaim responsibility for any injury to people or property resulting from any ideas, methods, instructions or products referred to in the content. |
© 2024 by the authors. Licensee MDPI, Basel, Switzerland. This article is an open access article distributed under the terms and conditions of the Creative Commons Attribution (CC BY) license (https://creativecommons.org/licenses/by/4.0/).
Share and Cite
Cruz, R.M.S.; Rainer, B.; Wagner, I.; Krauter, V.; Janalíková, M.; Vicente, A.A.; Vieira, J.M. Valorization of Cork Stoppers, Coffee-Grounds and Walnut Shells in the Development and Characterization of Pectin-Based Composite Films: Physical, Barrier, Antioxidant, Genotoxic, and Biodegradation Properties. Polymers 2024, 16, 1053. https://doi.org/10.3390/polym16081053
Cruz RMS, Rainer B, Wagner I, Krauter V, Janalíková M, Vicente AA, Vieira JM. Valorization of Cork Stoppers, Coffee-Grounds and Walnut Shells in the Development and Characterization of Pectin-Based Composite Films: Physical, Barrier, Antioxidant, Genotoxic, and Biodegradation Properties. Polymers. 2024; 16(8):1053. https://doi.org/10.3390/polym16081053
Chicago/Turabian StyleCruz, Rui M. S., Bernhard Rainer, Isabella Wagner, Victoria Krauter, Magda Janalíková, António A. Vicente, and Jorge M. Vieira. 2024. "Valorization of Cork Stoppers, Coffee-Grounds and Walnut Shells in the Development and Characterization of Pectin-Based Composite Films: Physical, Barrier, Antioxidant, Genotoxic, and Biodegradation Properties" Polymers 16, no. 8: 1053. https://doi.org/10.3390/polym16081053
APA StyleCruz, R. M. S., Rainer, B., Wagner, I., Krauter, V., Janalíková, M., Vicente, A. A., & Vieira, J. M. (2024). Valorization of Cork Stoppers, Coffee-Grounds and Walnut Shells in the Development and Characterization of Pectin-Based Composite Films: Physical, Barrier, Antioxidant, Genotoxic, and Biodegradation Properties. Polymers, 16(8), 1053. https://doi.org/10.3390/polym16081053