Article

Using Time Series Sentinel Images for Object-Oriented Crop Extraction of Planting Structure in the Google Earth Engine

1
School of Resources and Environment, Anhui Agricultural University, Hefei 230036, China
2
Anhui Provincial Engineering Laboratory for Beidou Precision Agriculture Information, Hefei 230036, China
*
Author to whom correspondence should be addressed.
Agronomy 2023, 13(9), 2350; https://doi.org/10.3390/agronomy13092350
Submission received: 21 July 2023 / Revised: 29 August 2023 / Accepted: 5 September 2023 / Published: 10 September 2023
(This article belongs to the Special Issue Remote Sensing in Smart Agriculture)

Abstract

:
Timely and accurate extraction of crop planting structure information is of great importance for food security and sustainable agricultural development. However, long time series data with high spatial resolution have a much larger data volume, which seriously limits the quality and efficiency of the application of remote sensing to agriculture in complex crop rotation areas. To address this problem, this paper takes Lujiang County, a typical complex crop rotation region in the middle and lower reaches of the Yangtze River in China as an example, and proposes utilizing the Google Earth Engine (GEE) platform to extract the Normalized Difference Vegetation Index (NDVI), Normalized Difference Yellowness Index (NDYI) and Vertical-Horizontal Polarization (VH) time series sets of the whole planting year, and combining the Simple Non-Iterative Clustering (SNIC) multi-scale segmentation with the Support Vector Machine (SVM) and Random Forest (RF) algorithms to realize the fast and high-quality planting information of the main crop rotation patterns in the complex rotation region. The results show that by combining time series and object-oriented methods, SVM leads to better improvement than RF, with its overall accuracy and Kappa coefficient increasing by 4.44% and 0.0612, respectively, but RF is more suitable for extracting the planting structure in complex crop rotation areas. The RF algorithm combined with time series object-oriented extraction (OB + T + RF) achieved the highest accuracy, with an overall accuracy and Kappa coefficient of 98.93% and 0.9854, respectively. When compared to the pixel-oriented approach combined with the Support Vector Machine algorithm based on multi-temporal data (PB + M + SVM), the proposed method effectively reduces the presence of salt-and-pepper noise in the results, resulting in an improvement of 6.14% in overall accuracy and 0.0846 in Kappa coefficient. The research results can provide a new idea and a reliable reference method for obtaining crop planting structure information efficiently and accurately in complex crop rotation areas.

1. Introduction

Agriculture is the foundation of social and economic development. Crop planting structure can reflect the current situation of agricultural development in a region [1,2]. Extracting crop planting structure information timely and accurately is key to monitoring field crops, forecasting crops yield, water-saving irrigation, evaluation of agricultural non-point-source pollution, etc. [3,4,5]. Additionally, it can provide an important basis for the adjustment of agricultural industrial structure and the formulation of scientific and rational food policies [6,7,8]. Additionally, it is of terrific significance for rational and efficient utilization of agricultural resources, ensuring food security and promoting sustainable development [9,10].
There are two ways to extract crop structure information, statistical survey and remote sensing extraction [11]. Compared to statistical survey, remote sensing extraction has the advantages of wide coverage, strong timeliness and low cost, so remote sensing extraction has become the main method of extracting plant structure in a wide range of crops [12,13,14,15,16,17]. As far back as 1991, researchers utilized Landsat TM multi-temporal data to classify surface vegetation cover types, demonstrating that the application of multi-temporal classification yields greater accuracy compared to single-temporal classification [12]. Jia et al. [16] used HJ satellite to classify and extract wheat, the main crop in the North China Plain, and the results showed that it was necessary to select the flowering date of wheat to obtain better results in the single-temporal classification, and it was still necessary to select the special phenological stage of the crops to be divided in the multi-temporal selection. The extraction results using single-phase and multi-temporal data have high accuracy only when extracting single crops with obvious special phenological periods [17]. In order to achieve higher-precision classification of a variety of crops with less phenological experience, scholars began to apply time series remote sensing data [18,19,20,21]. High-temporal-resolution MODIS (Moderate-resolution Imaging Spectroradiometer) data have been widely used for more than 20 years, and are suitable for constructing time series datasets to extract multiple crops at the same time over large areas with concentrated cultivated land resources [20,22,23,24]. In the early 21st century, Wardlow et al. [22] used MODIS data to build a 15-day time series NDVI dataset to map a large area of crops in the central Great Plain of the United States. The classification accuracy of various crops was greater than 80%, but crops planted in small plots could not be identified. In fact, time series data with medium and low spatial resolution still cannot meet the application needs of fragmented areas of cultivated land plots. The Sentinel-2B satellite, launched in 2017, has the same spatial resolution of 10 m as the Sentinel-2A satellite, and its combined re-visit period is five days. Scholars began to use Sentinel-2 data to extract crop planting structure information [25,26,26,27,28]. Through the integration of Sentinel-2 and Landsat data, we effectively generated maps of cropping intensity for crops such as wheat, maize, rice, and soybean across extensive areas within seven agricultural regions of China, achieving an overall accuracy of 93% [26]. To showcase the versatility of Sentinel-2 data across various regions, researchers employed time series Sentinel-2 data to map potato cultivation across three study sites in Iran and an experimental area in the United States, achieving overall accuracies exceeding 93% [28].
However, as optical remote sensing data, Sentinel-2 is susceptible to cloud interference. Over the past two years, many scholars have chosen Sentinel-1 as an alternative to enhancing optical time series [6,29,30,31]. The integration of Sentinel-1/2 fused time series data and phenology features was employed to enhance the effective utilization intervals of classified features and to map the distribution of rice planting. This approach yielded improvements of 5.82% and 2.39% in accuracy compared to the use of Sentinel-1 or Sentinel-2 time series data alone, respectively [29]. Fatchurrachman et al. [32] Synthesized the time series dataset of Sentinel-1 VH polarization and Sentinel-2 NDVI month by month, and conducted unsupervised classification of rice by k-means clustering. The overall accuracy and Kappa coefficient of rice extraction were 95.95% and 0.92. Time series Sentinel-1/2 data can provide a high-resolution data source for the classification of various crops. However, when more of the extracted crops are planted on plots with an area of less than 100 square meters, higher resolution data are required. On the other hand, high-resolution remote sensing images are more likely to produce “pepper and salt phenomenon” in pixel-oriented crop extraction, and have higher requirements for computing power [33,34,35]. Combining the parcel information and Sentinel-1/2 data can simplify the image segmentation and avoid the “salt-and-pepper phenomenon” in the classification of summer maize, but the parcel information is also variable and difficult to obtain [33]. The SNIC algorithm can achieve image segmentation without relying on auxiliary data, different seed pixel spacing will affect the extraction accuracy, and the optimal seed pixel spacing can be found through multiple experiments [30]. However, it takes many experiments and a lot of time to determine the optimal interseed pixels in the study area by the local computer [36,37,38]. Xue et al. [36] and Luo et al. [38], using the GEE platform SNIC algorithm for time series of Sentinel data fast segmentation, realized the high precision in cultivated land resources concentrated area of crop classification. However, most of the crops extracted in these studies are one kind of crops (rice), or the planting information is extracted from the planting structure area of simple crops with one crop per year.
The purpose of this study is to verify the effectiveness of time series data for extraction planting information of complex crop rotation patterns and the applicability of object-oriented methods and Random Forest algorithms in regions with fragmented arable land resources basis on the powerful computing power of GEE. The research results can provide a reliable reference method for efficient and high-precision extraction of complex rotation pattern planting information in arable land resource fragmentation areas, which is of great value to ensure the efficiency of agricultural remote sensing application and promote the efficient application of agricultural resources.

2. Materials and Methods
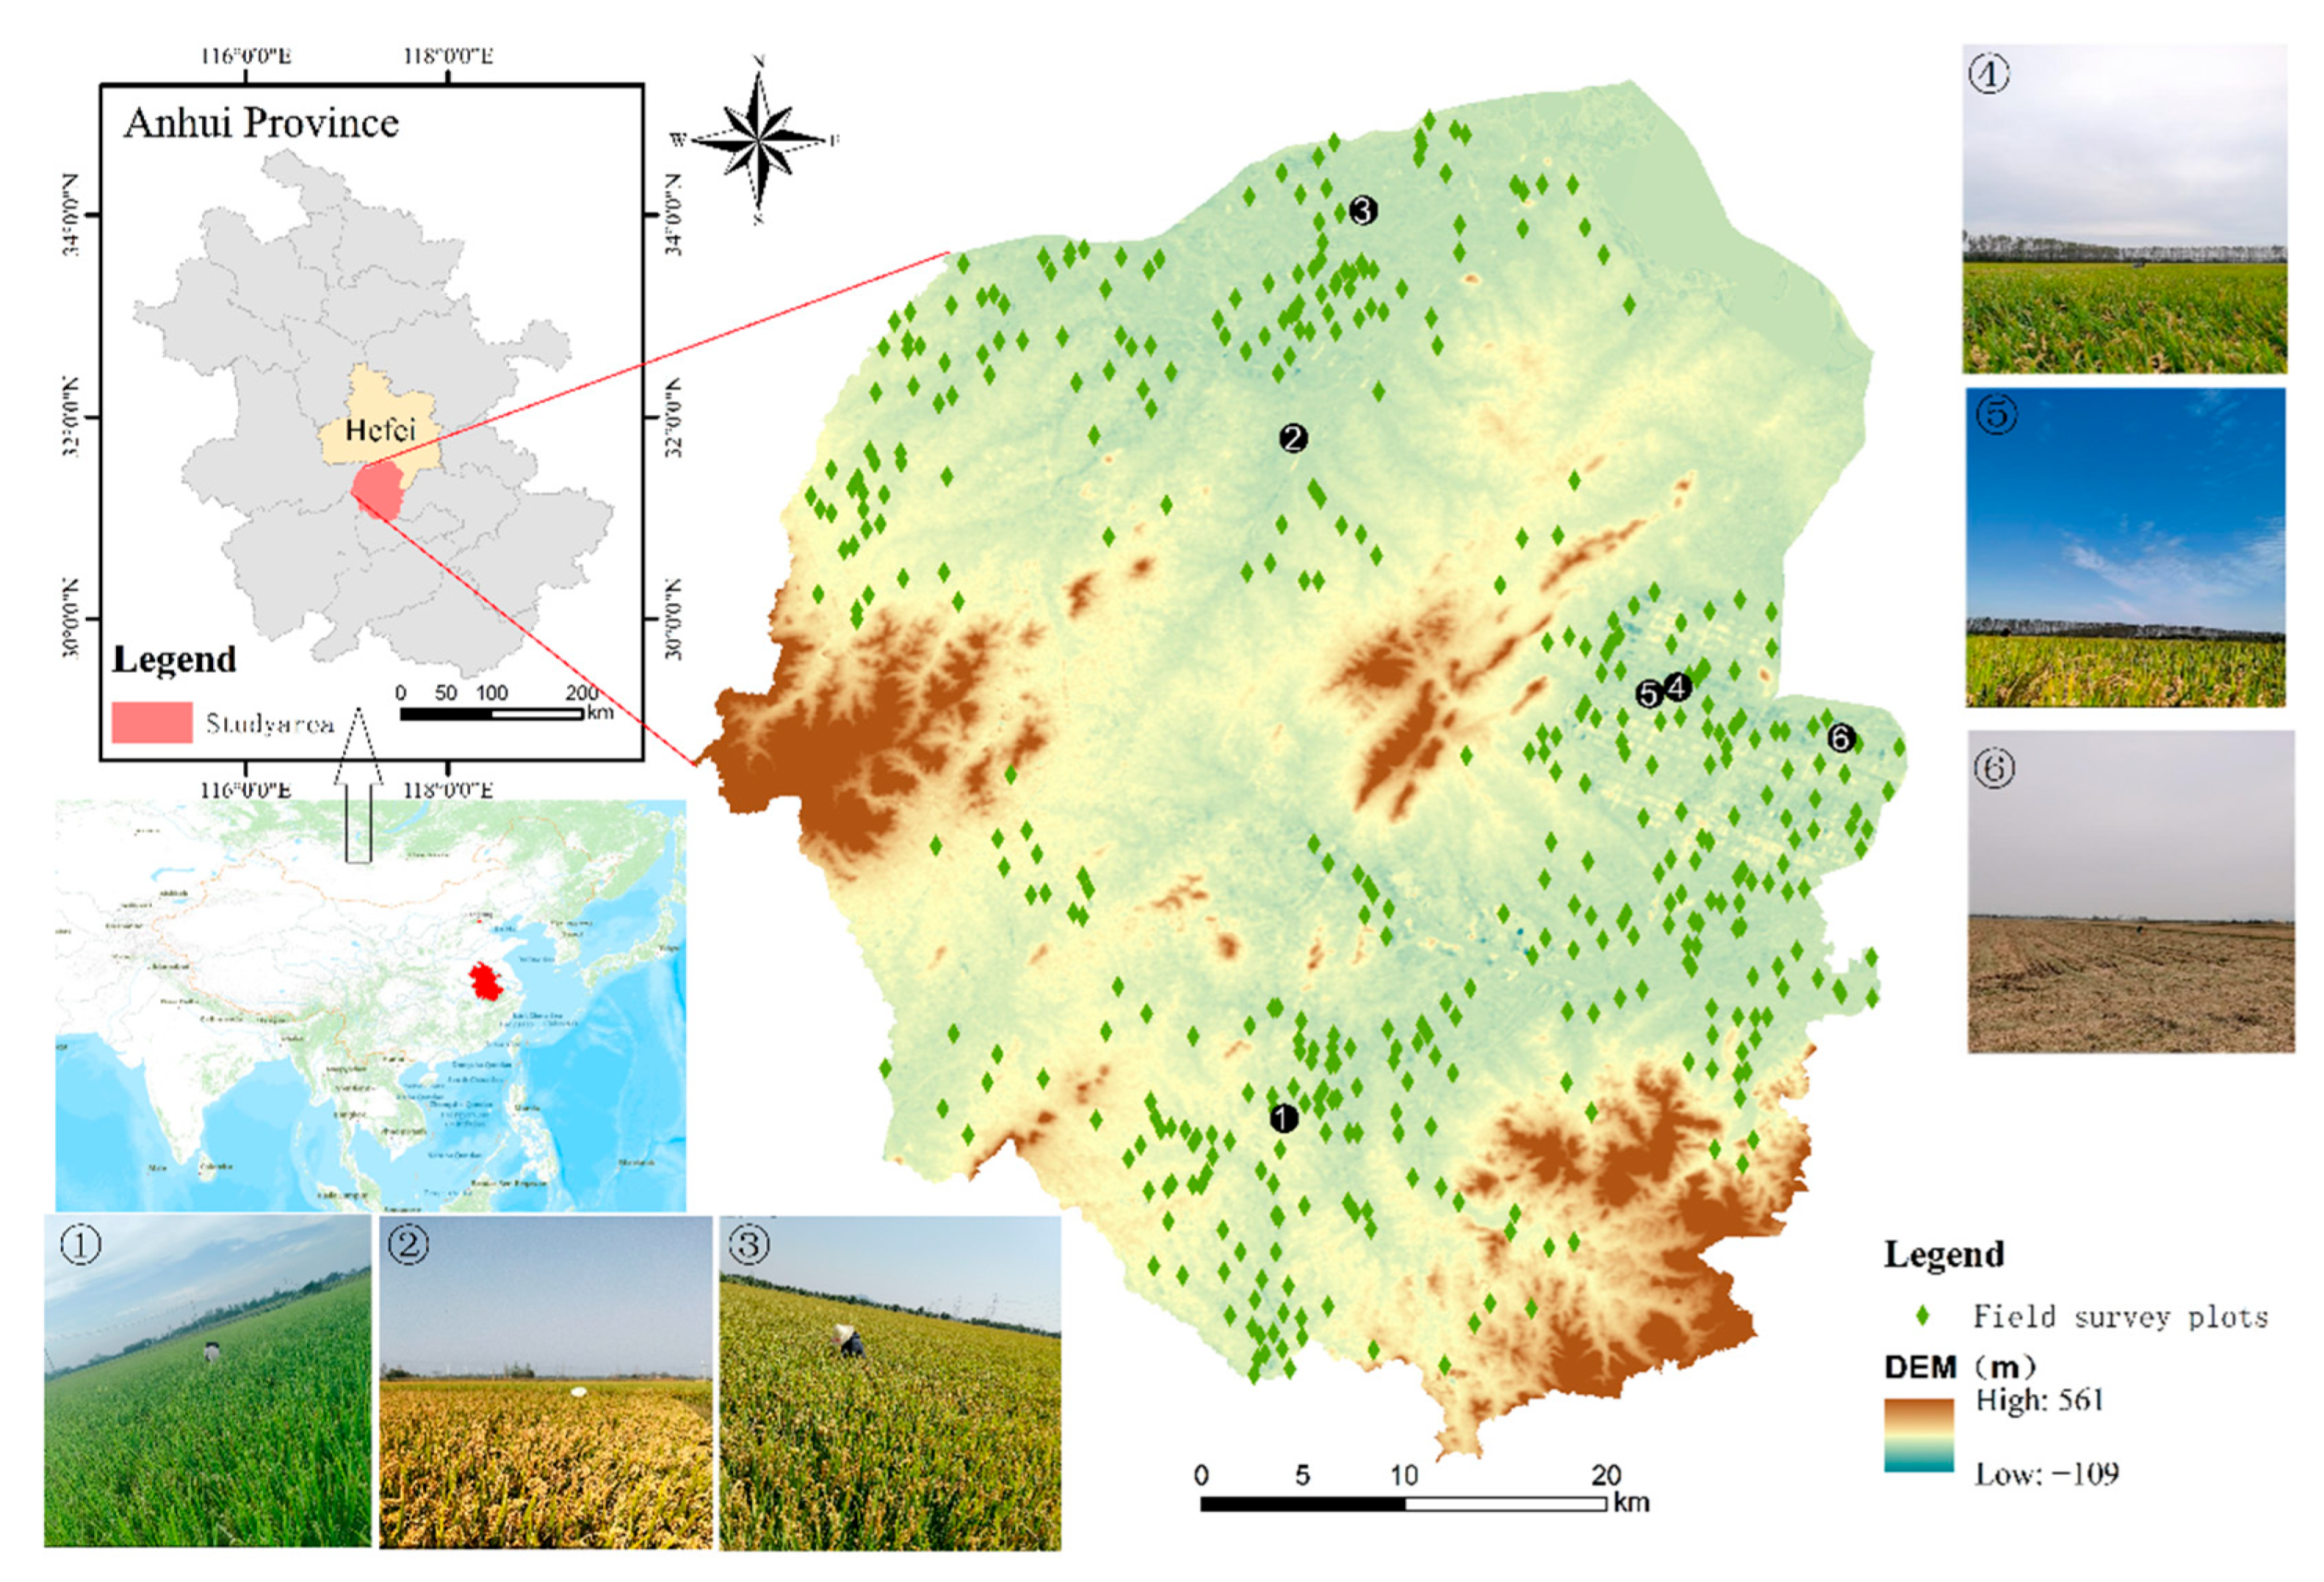
2.1. Study Area

Lujiang County belongs to Hefei City, Anhui Province, China (Figure 1). It is located in the Jianghuai region, near the Yangtze River in the south and Chaohu Lake in the north. The landform type is mainly plain, and the hilly area is mostly in the southwest. It belongs to the subtropical monsoon climate area, with abundant rainfall and dense river network. Lujiang County is a two-season crop area, and agriculture is an important supporting industry. Rice is the main crop grown in Lujiang County, the rice planting area in 2021 is 91,173 hectares. “Lujiang Rice” was selected into the first batch of National Famous and excellent new agricultural products list in 2021, and China’s first rice museum “China Rice Museum” is also located in Lujiang County. In Lujiang County, wheat–rice rotation, double-cropping rice rotation and rape–rice rotation are the main crops, among which double-cropping rice is the largest planting area in Anhui Province.

2.2. Sample Point Data

The field survey data were collected in October 2021, and the investigation mainly included crop rotation patterns, latitude and longitude, and phenological period (Figure 2). Because the rotation pattern involved first-season crops, it was only known through farmer surveys. All the survey rotation sample points were verified one by one with Sentinel-2 cloud-free images in March and April 2021, combined with Google Earth high-resolution images to select buildings, water, forest and other land-type sample points. Finally, 422 crop sample plots were obtained (Among them, 181 wheat–rice rotations, 80 double-cropping rice rotations, 85 rapeseed–rice rotations, and 76 other rotations). Pixels were randomly acquired within each plot, totaling 3860 pixels (Among them, there were 1632 wheat–rice rotations, 761 double-cropping rice rotations, 646 rapeseed–rice rotations and 821 other rotations.) All pixel points are randomly divided into training sample points for extracting feature time series curves, supervising classification and accuracy verification points for evaluating different extraction methods according to the ratio of 6:4. The distribution of sample plots is shown in Figure 1.

2.3. Remote Sensing Data

For remote sensing data, Sentinel-2 high-resolution multi-spectral imagery and Sentinel-1 remote sensing data were selected. Sentinel-2 images are generated by two complementary Sentinel-2A and Sentinel-2B satellites with a revisit period of 5 days and a resolution of 10–60 m in each band. Sentinel-2 images used in this study were directly invoked from the GEE platform with atmospheric correction and orthographic correction of Sentinel-2 Level-2A surface reflectance data. The selection range was based on one planting year (1 October 2020 to 31 October 2021), and the pixels with cloud probability greater than 50% were removed, and a total of 110 landscape images were obtained. The NDVI and NDYI indexes were constructed, because the NDVI could reflect the change in crop growth better [7,22]. The NDYI can reflect the yellowness index of crops, and can be better distinguished from other crops at the flowering stage [39].
Sentinel-1 data used in this study were invoked on the GEE platform by the ‘COPERNICUS/S1_GRD’ dataset (synthetic aperture radar GRD product), also with a planting year as the time range, totaling 33 images. The dual-polarized VH band in interference Wide width (IW) mode was chosen because it is more sensitive to rice backscattering than VV [32,40]. The detailed data used by the research are shown in Table 1, and the distribution of the number of effective Sentinel data observations in the rotation cycle of the study area is shown in Figure 3.

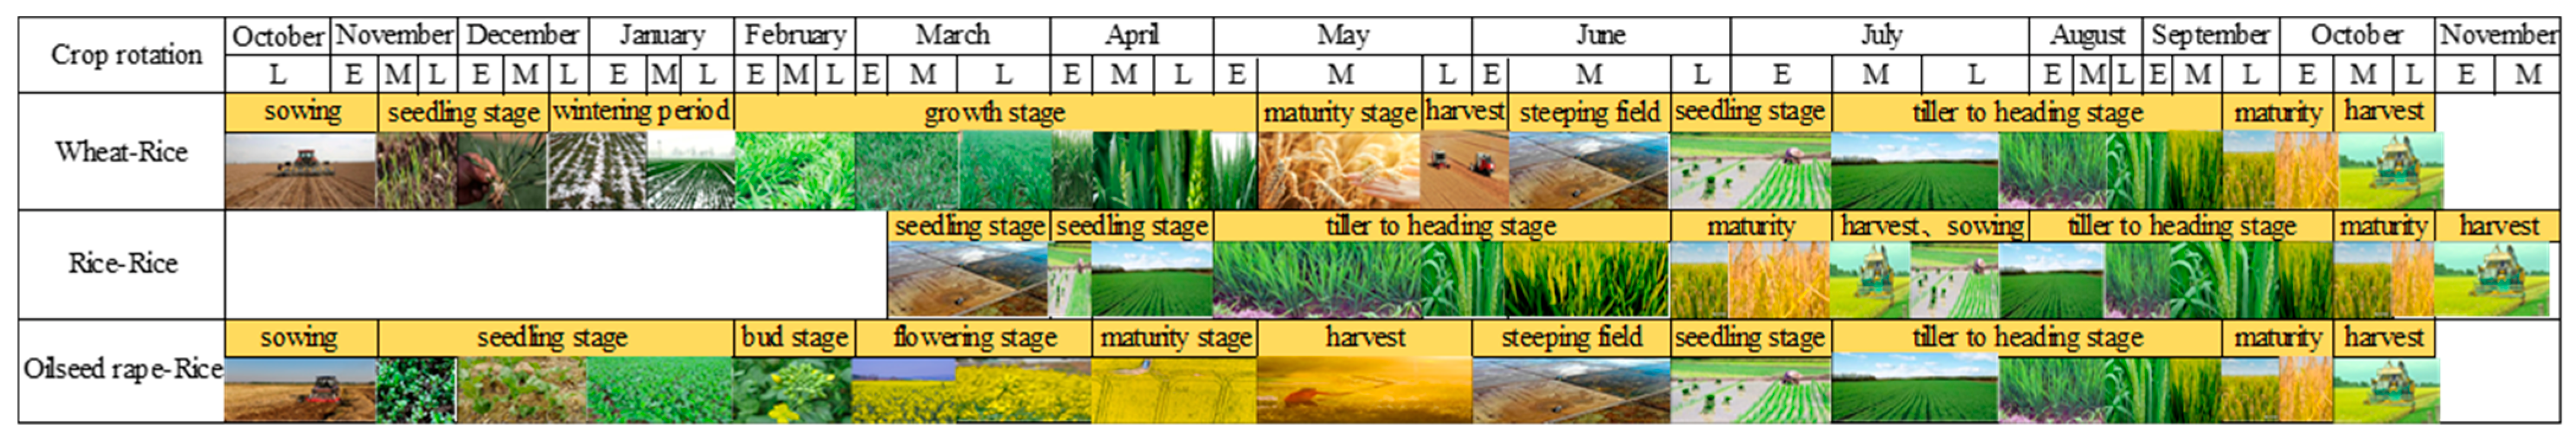
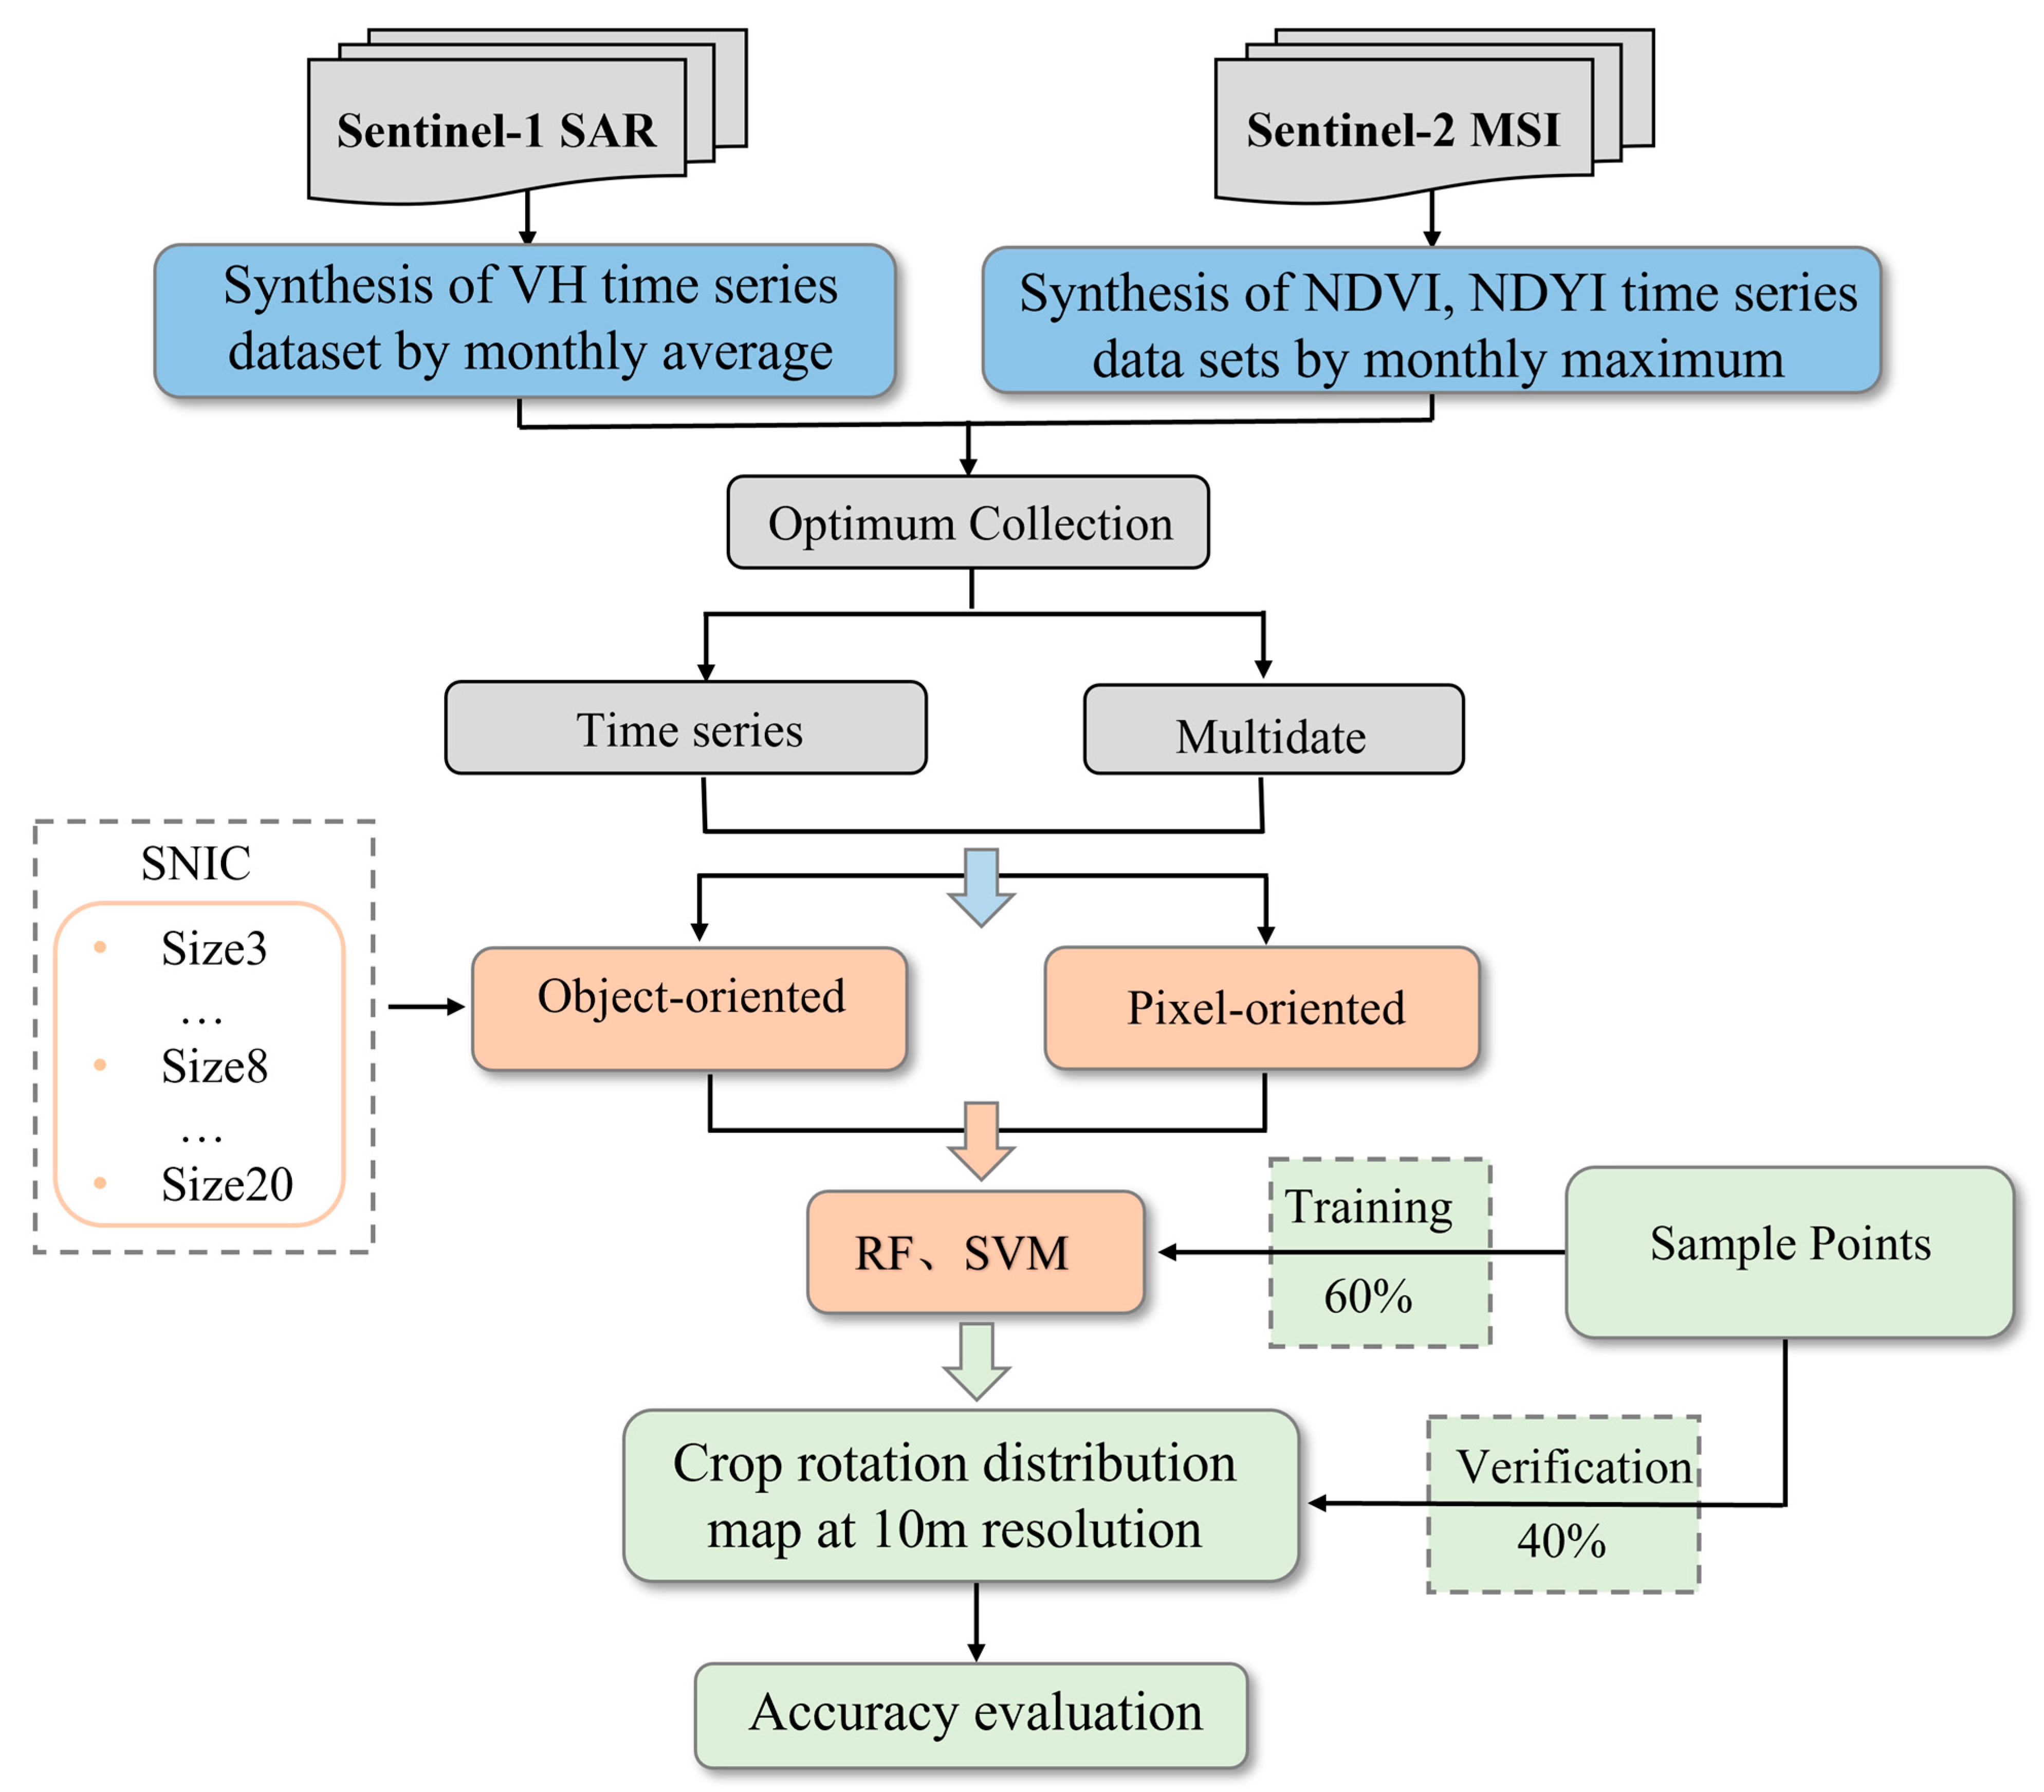
2.4. The Planting Structure Extraction Method

The main technical route of this study is shown in Figure 4; it includes (1) constructing a time series feature dataset; (2) selecting the optimal feature dataset—the information of crop planting structure was extracted by the object-oriented or pixel-based method; (3) precision comparison and selection of the optimal extraction model.

2.4.1. Constructing the Feature Dataset

Feature selection is of great significance to operation speed and extraction accuracy. The optimal feature combination should have the characteristics of strong correlation between feature and target, small redundancy between features and strong separability between classes. Since the selection of feature index was mainly based on other research results, this study added NDYI and VH time series to the NDVI time series set to form a time series dataset, and combined RF and SVM to extract crop planting structure and verify accuracy, so as to explore the applicability of NDVI, NDYI and VH in this study area.
When the time resolution is one month, it can ensure that each pixel has data in all periods, and it can better match the phenological information of various crop rotation patterns in Section 2.2. NDVI and NDYI are easily affected by observation time, cloud cover and aerosol, and the adverse effects of external factors can be effectively reduced by maximum synthesis. Therefore, we used the “max” function in GEE to calculate the maximum values of NDVI and NDYI of each pixel month by month. The calculation formula is as follows:
N D V I = ( ρ N I R ρ R ) / ( ρ N I R + ρ R )
N D Y I = ( ρ G ρ B ) / ( ρ G + ρ B )
In the formula, ρ N I R is the reflectivity of near infrared band; ρ R is the reflectance of the red band, ρ G is the reflectance of the green band, and ρ B is the reflectance of the blue band.
Sentinel-1 data are not affected by cloud cover, but are significantly affected by the noise signal. Therefore, the “median” function was used to synthesize the monthly median value of VH to reduce the noise in the data [15]. Due to the difference in data acquisition time between Sentinel-1 and Sentinel-2, the monthly synthesis of VH can also ensure that the time was neat with Sentinel-2 data. Finally, the “addBands” function was used to fuse the time series datasets of NDVI, NDYI and VH, and the time series curves of wheat and rice, rapeseed and rice, double cropping rice and other crops were constructed (Figure 5).
The window period recognition of multi-temporal extraction is mainly selected through feature importance evaluation combined with regional phenological characteristics. The calculation of the importance of features is based on the measure of the importance of the Random Forest algorithm itself. In GEE, “ee.classifier.explain” was used to calculate the importance score of each feature in the process of crop planting structure information extraction, and at last, the importance of each feature factor was sorted in ascending order.

2.4.2. Simple Non-Iterative Clustering

The SNIC algorithm is an improved version of simple linear iterative clustering. Because the SLIC algorithm needs to iteratively converge cluster centers, it will occupy a large amount of memory, while the SNIC algorithm uses a priority queue to replace the k-means iterative clustering process of the SLIC algorithm, reducing the memory consumption and generating superpixels more quickly [30,37,41]. Both algorithms use the same distance measure, that is, using CIELAB color distance and spatial Euclidean distance weighting to calculate the distance between pixels and the cluster center. When CIELAB color d = i , a , b T and spatial position x = x , y T , the distance between the j pixel to be processed and C k of the k cluster center is:
d j , k = | | x j x k | | 2 2 s + | | c j c k | | 2 2 m
In the formula, s and m are the normalized factors of space distance and color distance, respectively. m is also known as the compact factor. The larger the value of m , the larger the weight value of the space distance in the overall distance, and the more regular the generated superpixel, but at the same time, the boundary will be less fit. When the value is 0 , spatial distance weighting is not considered. In the GEE platform, “ee.Algorithms.Image.Segmentation.SNIC” can be directly invoked to realize the SNIC segmentation algorithm. The segmentation effect is mainly determined by four main parameters: Seed pixel spacing (Size) determines the spacing distance between clustering centers. The larger the Size value, the smaller the number of seeds, and the larger the segmented object; Compactness determines the degree and shape of segmentation. The larger the value of Compactness, the tighter the segmentation result and the more regular the shape. Connectivity Defines the connectivity direction chosen when merging adjacent superpixels (4 or 8 directions). Neighborhood size sets the maximum pixel value allowed for the generated hyperpixel. The main parameter of image segmentation scale is Size. Therefore, six different seed pixel spacing are set: 3, 5, 8, 10, 15 and 20, and the segmentation results are conducted for model training and accuracy verification, so as to select the optimal seed pixel spacing. According to the distribution characteristics of cultivated land in the study area, the compactness was set to 5, the connectivity to 8, and the neighborhood size to 256.

2.4.3. The Planting Structure Extraction Algorithm

In this study, two algorithms, Random Forest (RF) and Support Vector Machine (SVM), were used to extract the crop planting structure in the study area. The RF algorithm selects random sample points and feature variables with the return, establishes multiple decision trees for extraction, and takes the result with the highest voting result as the output result. The RF algorithm has the advantages of fast training speed, high classification accuracy, strong anti-noise ability, and strong objectivity [42,43,44]. The SVM algorithm is an algorithm that integrates data analysis, classification and regression. By introducing the principle of risk minimization and the probability of kernel function, the SVM algorithm can find the optimal hyperplane extracted in a small sample space, which has small sample demand, good robustness and high execution efficiency [45,46,47].
The GEE platform Integrates the RF and SVM algorithms, which can be directly invoked to achieve the extraction of crop planting structure. The RF algorithm has two user-defined parameters: the number of decision trees (ntree) and the number of features selected when the decision tree is generated (mtry). Through repeated tests, it was found that when ntree was set to 200, the extraction accuracy tends to be stable. mtry was set to the algorithm default setting which is the square root of the total number of features. The kernel function of the SVM algorithm selects the default lLinear kernel function, which was found to have better extraction effect than “radial basis function (RBF)” in this study.
Combining the RF and SVM algorithms with time series data and multi-temporal data before and after segmentation, and eight different classification models are constructed for crop planting structure extraction., respectively, were: the multi-temporal element-oriented SVM algorithm model (PB + M + SVM), the multi-temporal object-oriented combined SVM algorithm model (OB + M + SVM), the time series-oriented pixel-combined SVM algorithm model (PB + T + SVM), the object-oriented combined SVM algorithm model based on time series (OB + T + SVM), the multi-temporal element-oriented combination RF algorithm model (PB + M + RF), the object-oriented integrated RF algorithm model based on multi-temporal (OB + M + RF), the time series-oriented pixel-binding RF algorithm model (PB + T + RF), and the object-oriented combined RF algorithm model based on time series (OB + T + RF). Finally, the optimal model was selected by comparing 8 models to extract the verification accuracy of crop planting structure.

2.5. Accuracy Evaluation

In this study, the method of sampling outside the bag was selected for accuracy verification, and various sample points were randomly divided into training sets and verification sets according to the ratio of 6:4. Only the training sets were uploaded to the GEE platform for the training of each model, and the extraction results of each model were used in the local computer for accuracy evaluation using the verification set. The method of confusion matrix was used to evaluate the accuracy of the model with the indexes of overall accuracy (OA), Kappa coefficient, producer accuracy (PA) and user accuracy (UA). O A is the probability of extracting correct results from the model on the verification set; K a p p a coefficient is an index to test the consistency between the validation sample and the extraction results, and its range is 0~1. The larger the value, the higher the consistency of the extraction model. U A represents the probability of the verification point falling on the category on the resulting graph; P A is the probability that the verification point of the class is correctly classified. The calculation formula is as follows:
O A = j = 1 t m j D
K a p p a = D j = 1 t m j j = 1 t ( F j L j ) D 2 j = 1 t ( F j L j )
U A = m j F j
P A = m j L j
In the formula, m j is the number of correct samples extracted for class j ; F j is the total number of real pixels of class j ; L j is the total number of extracted pixels of class j . D is the total number of extracted pixels; t is the number of extraction categories.

3. Result Analysis

3.1. The Optimal Feature Set

By adding NDYI and VH time series data, the accuracy of extraction results can be improved (Figure 6a–c), and the SVM algorithm accuracy improved more, Kappa and OA increasing by 0.0228 and 1.67%, respectively, and RF Kappa and OA increasing by 0.0039 and 0.28%, respectively. It can effectively avoid the misdivision and leakage of wheat–rice rotation and double-cropping rice rotation. The addition of NDYI can effectively improve the user accuracy of wheat–rice rotation and the producer accuracy of wheat–rice rotation and double-cropping rice rotation. On this basis, the addition of VH can significantly improve the user accuracy of wheat–rice rotation and the producer accuracy of wheat–rice rotation and double-cropping rice rotation.
The identification of the extraction window period mainly used the RF algorithm to evaluate the importance of the features, and combines the regional phenological features for selection. The evaluation results of feature importance are shown in Figure 6d, features with importance greater than 60 are NDVI6, NDYI3, NDVI3, VH4, and NDVI10_n. Therefore, the NDVI, NDYI and VH datasets of March, April, June and October of the harvest year were constructed with the extraction window periods.

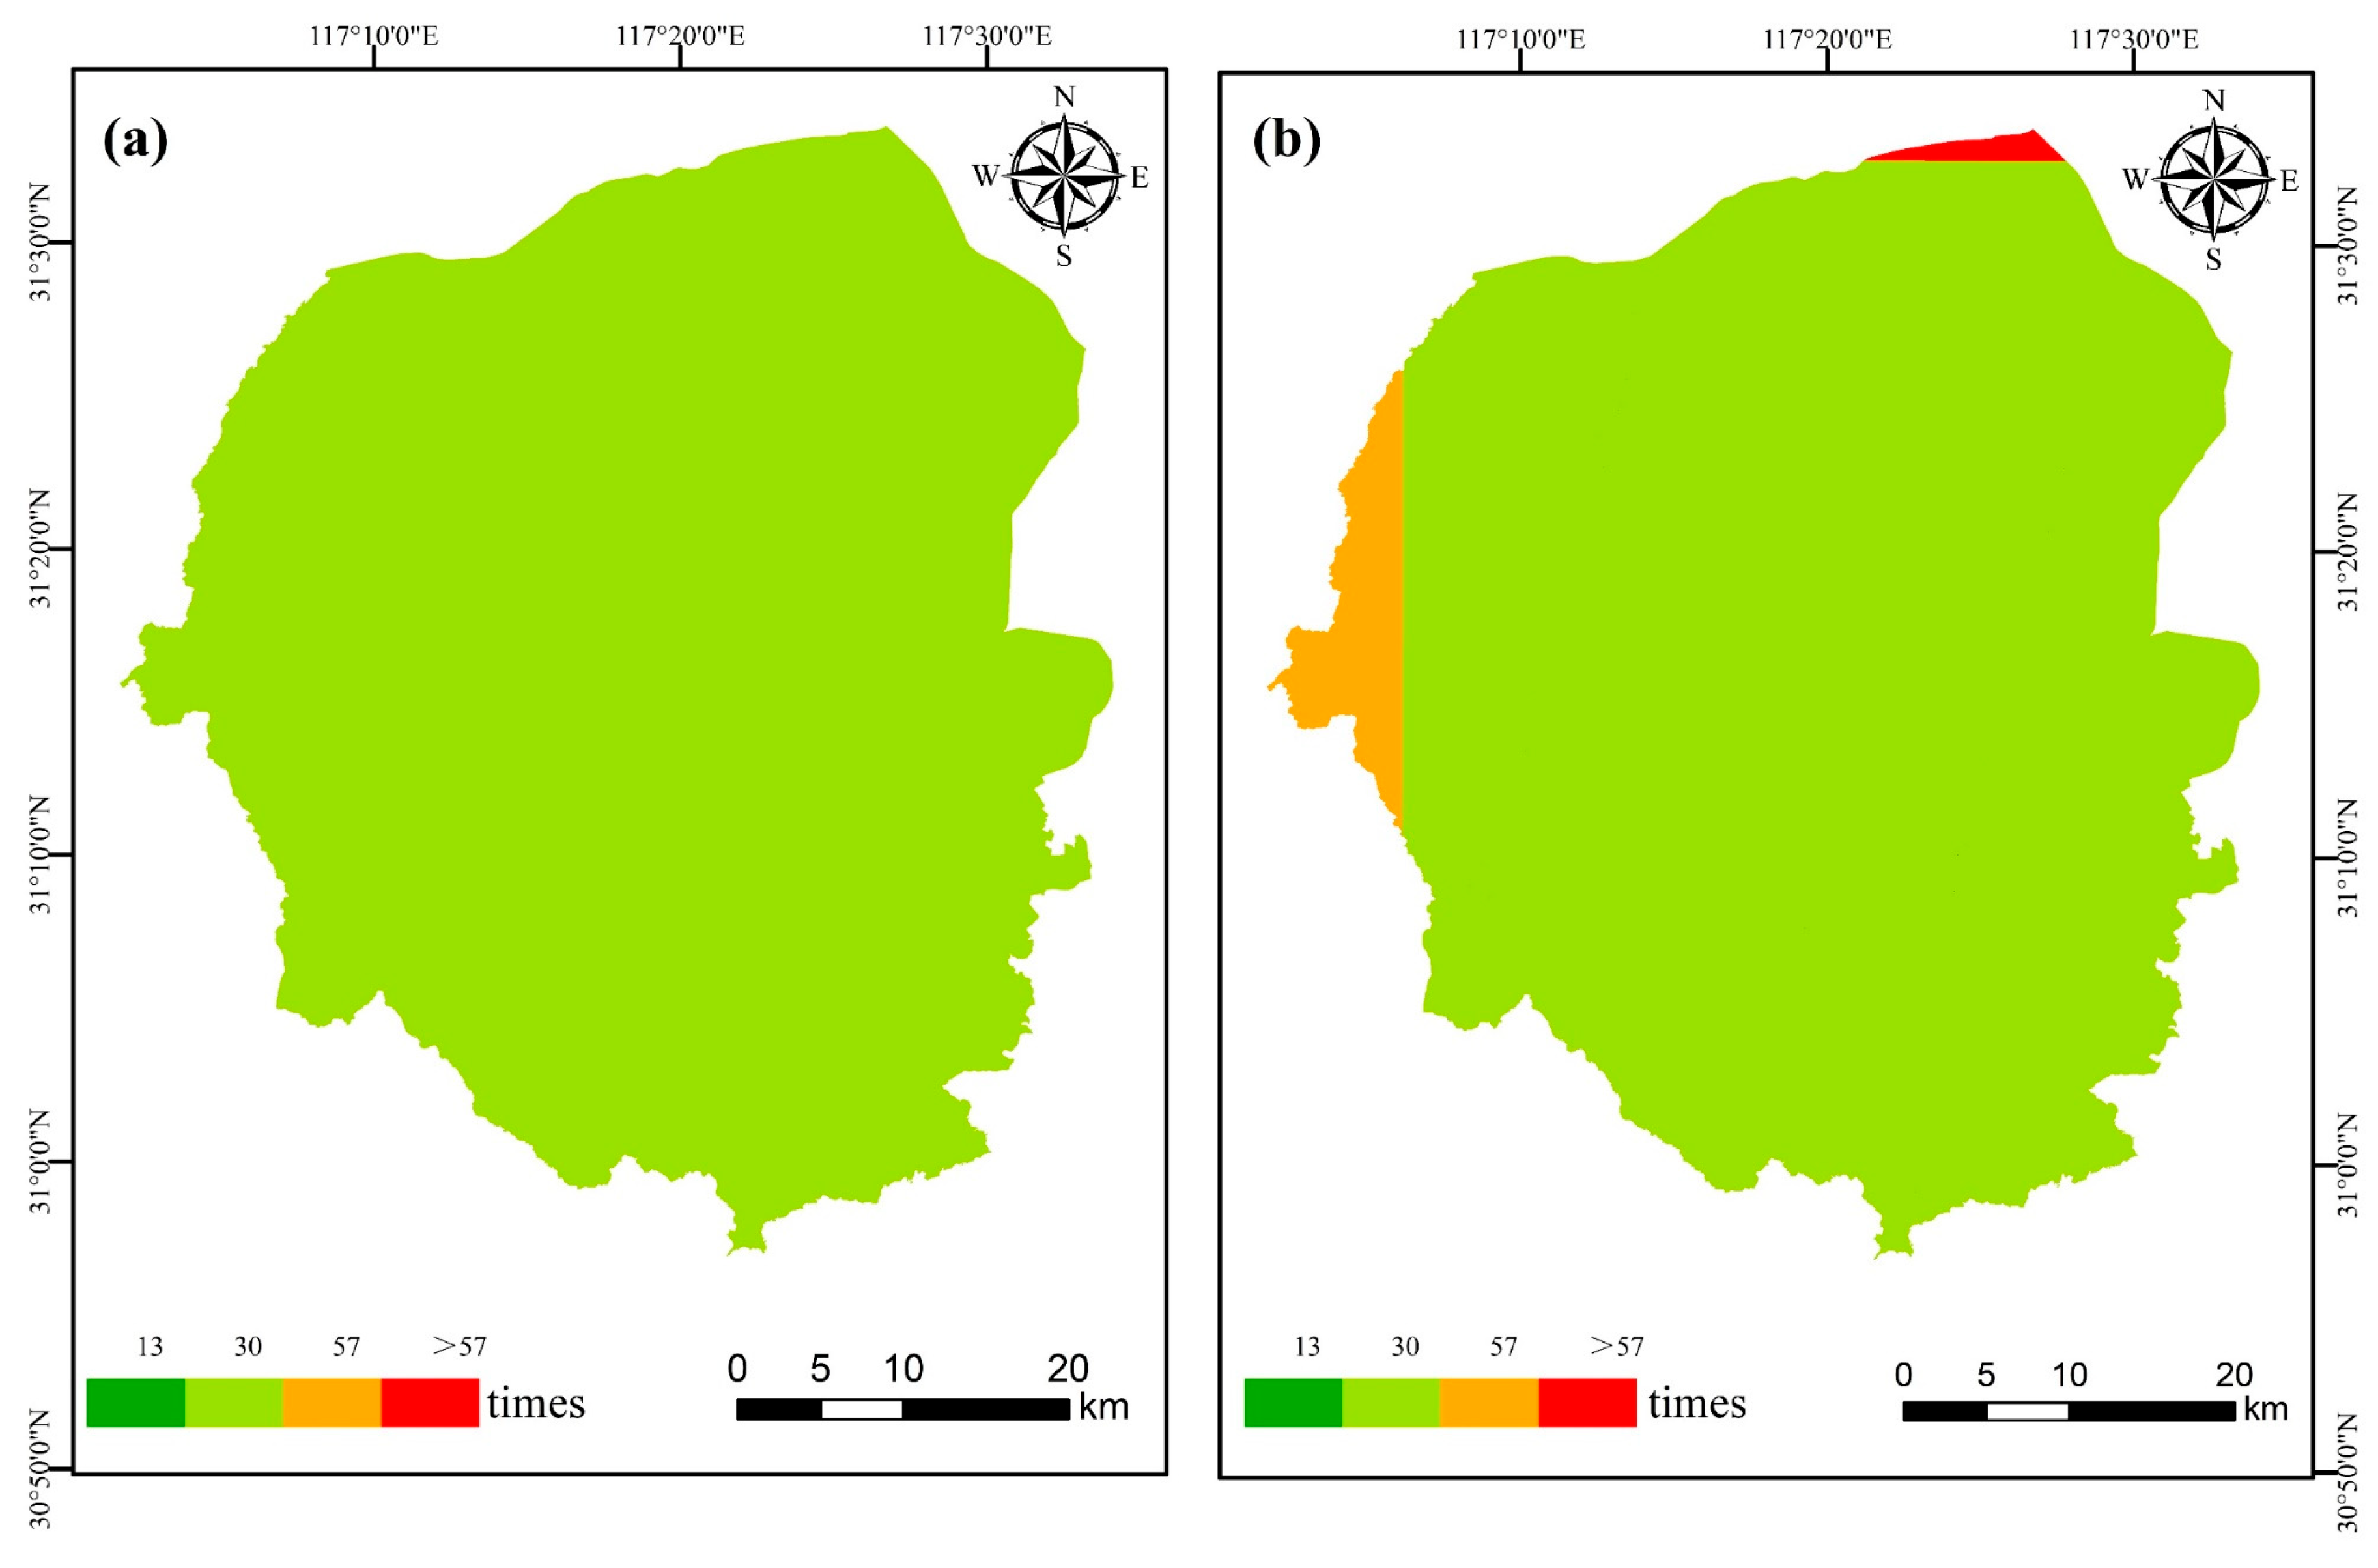
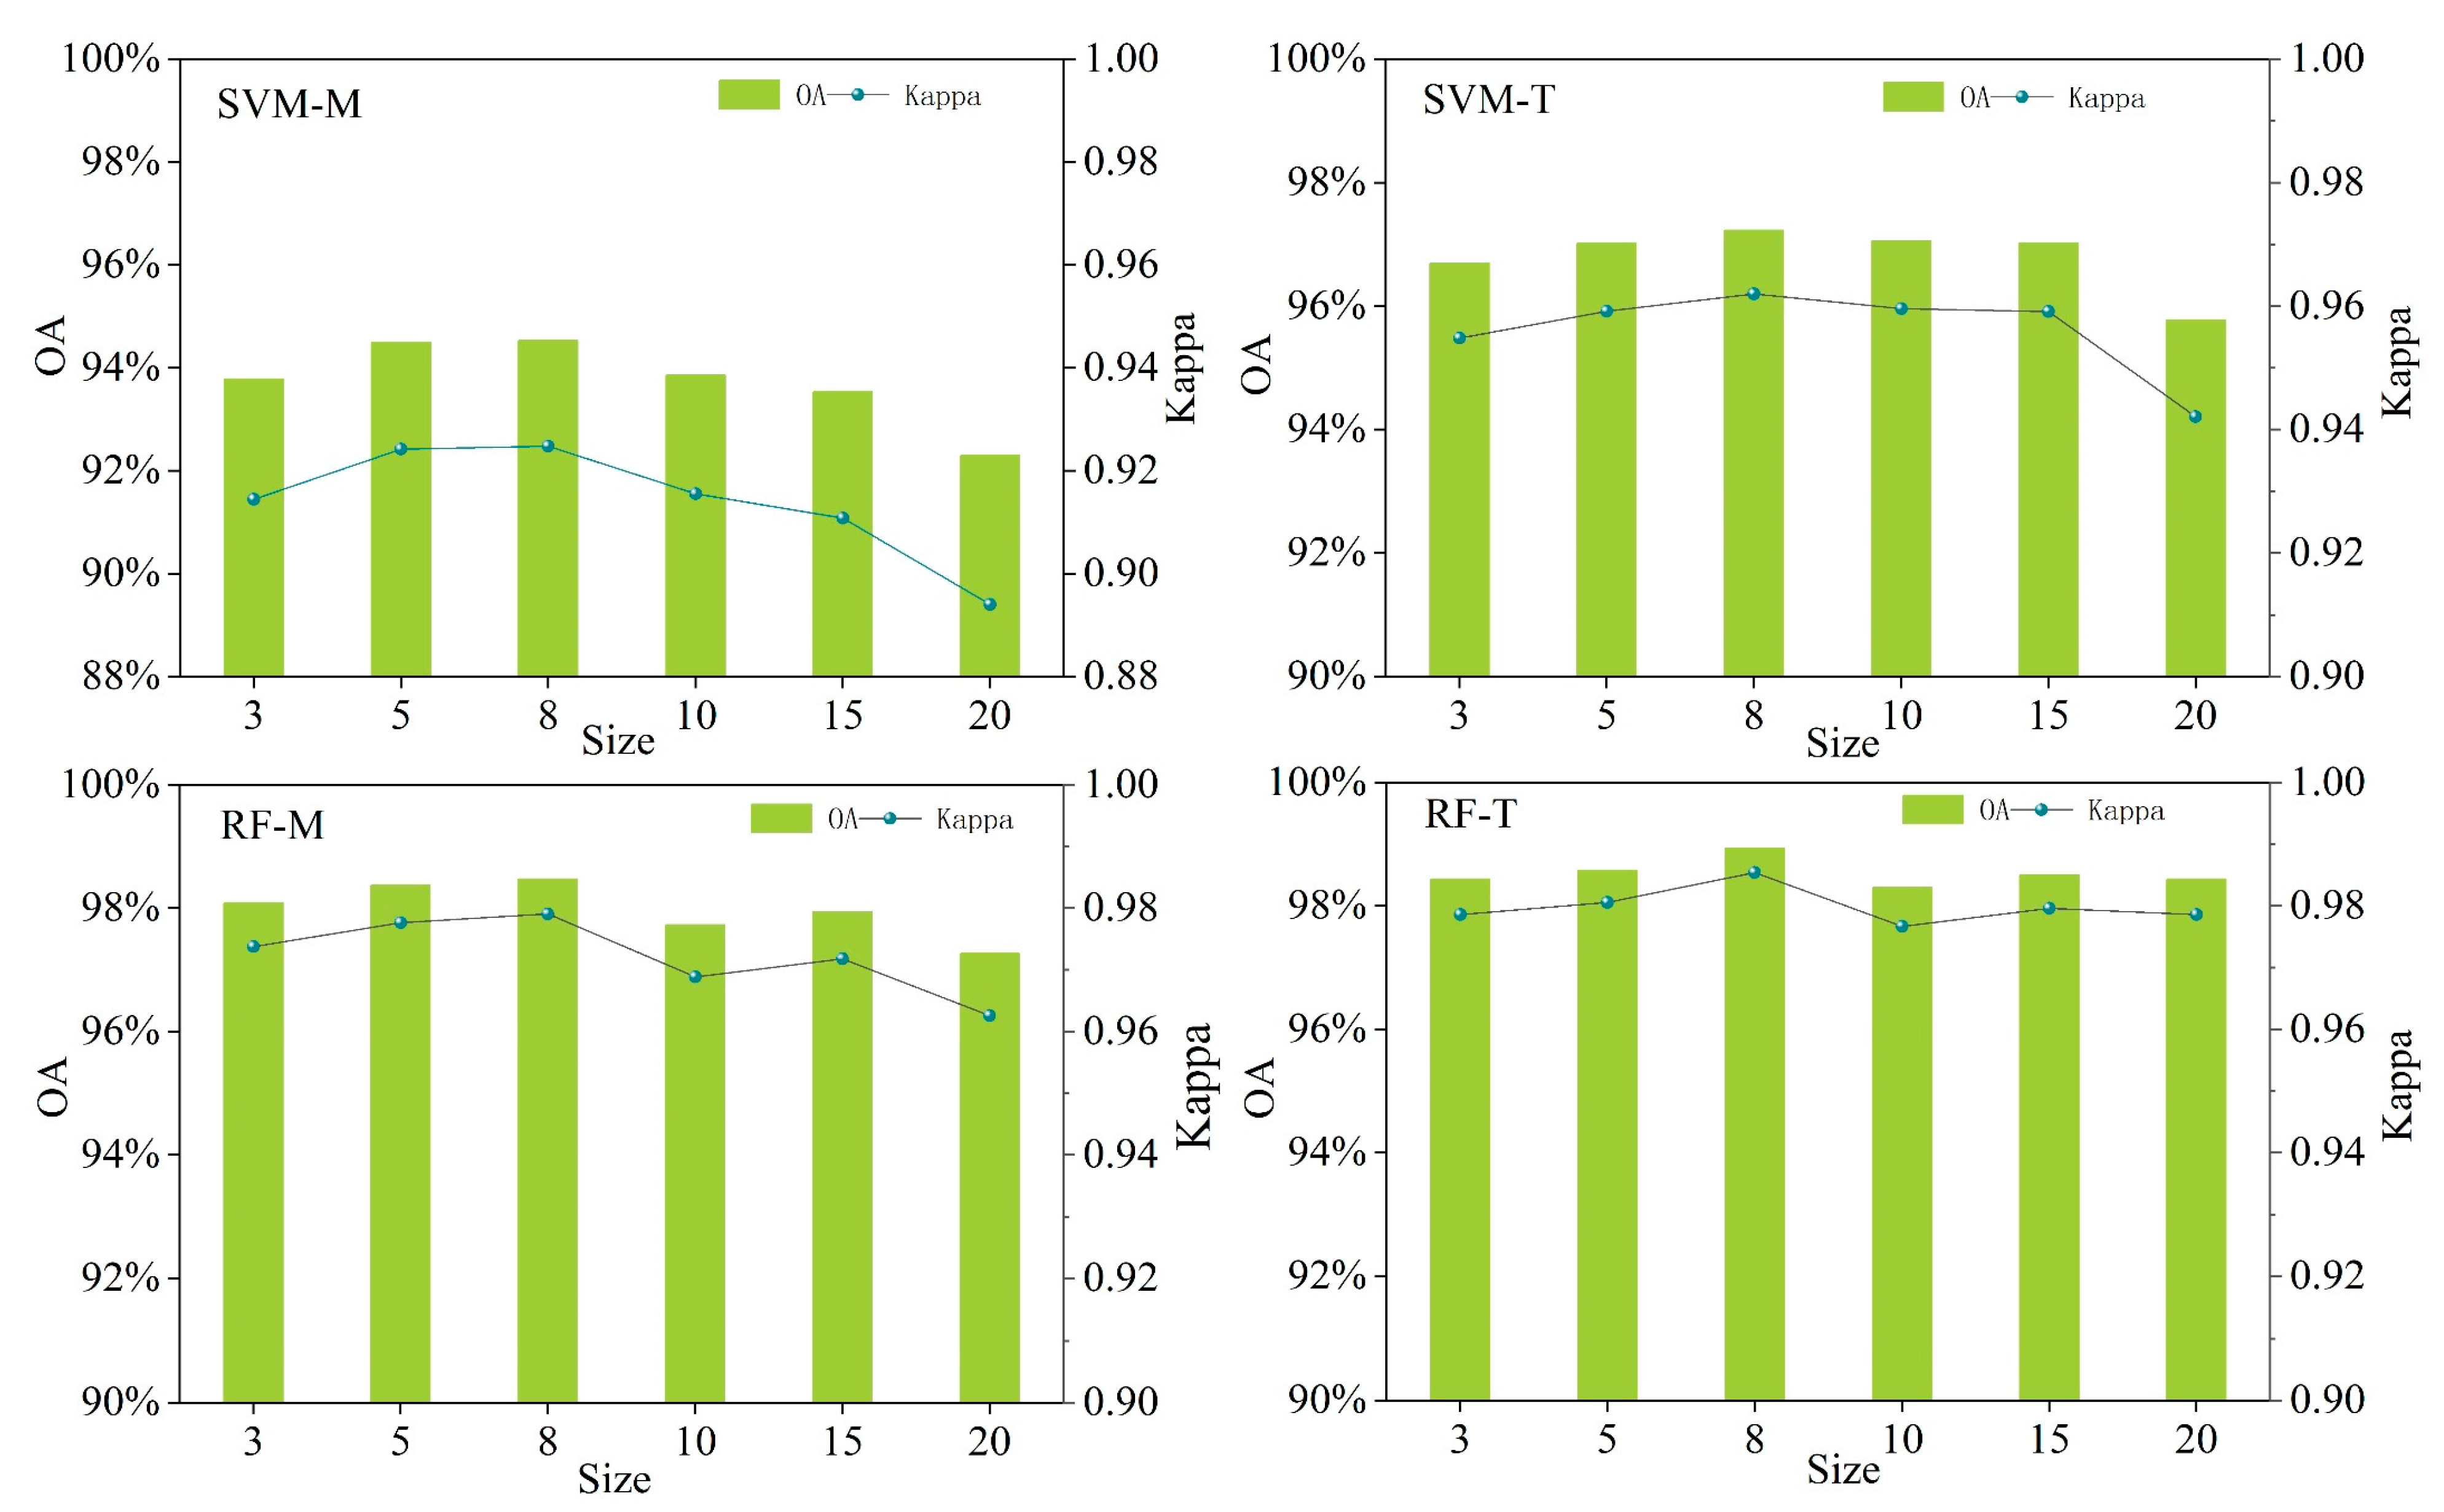
3.2. Optimal Seed Pixel Spacing

In this study, the distance of seed pixels was set as 3, 5, 8, 10, 15 and 20, respectively, and the optimal segmentation scale was screened, and the extraction accuracy was shown in Figure 7. The overall accuracy and Kappa coefficient of OB + M + SVM, OB + M + SVM, OB + M + RF and OB + T + RF extraction models were all the largest when the seed pixel distance was 8, which were 94.53%, 0.9145; 97.23%, 0.9620; 98.47%, 0.9791; 98.93%, 0.9854. At this time, the accuracy of each object-oriented extraction model is the highest, so eight was selected as the seed pixel distance of SNIC segmentation.

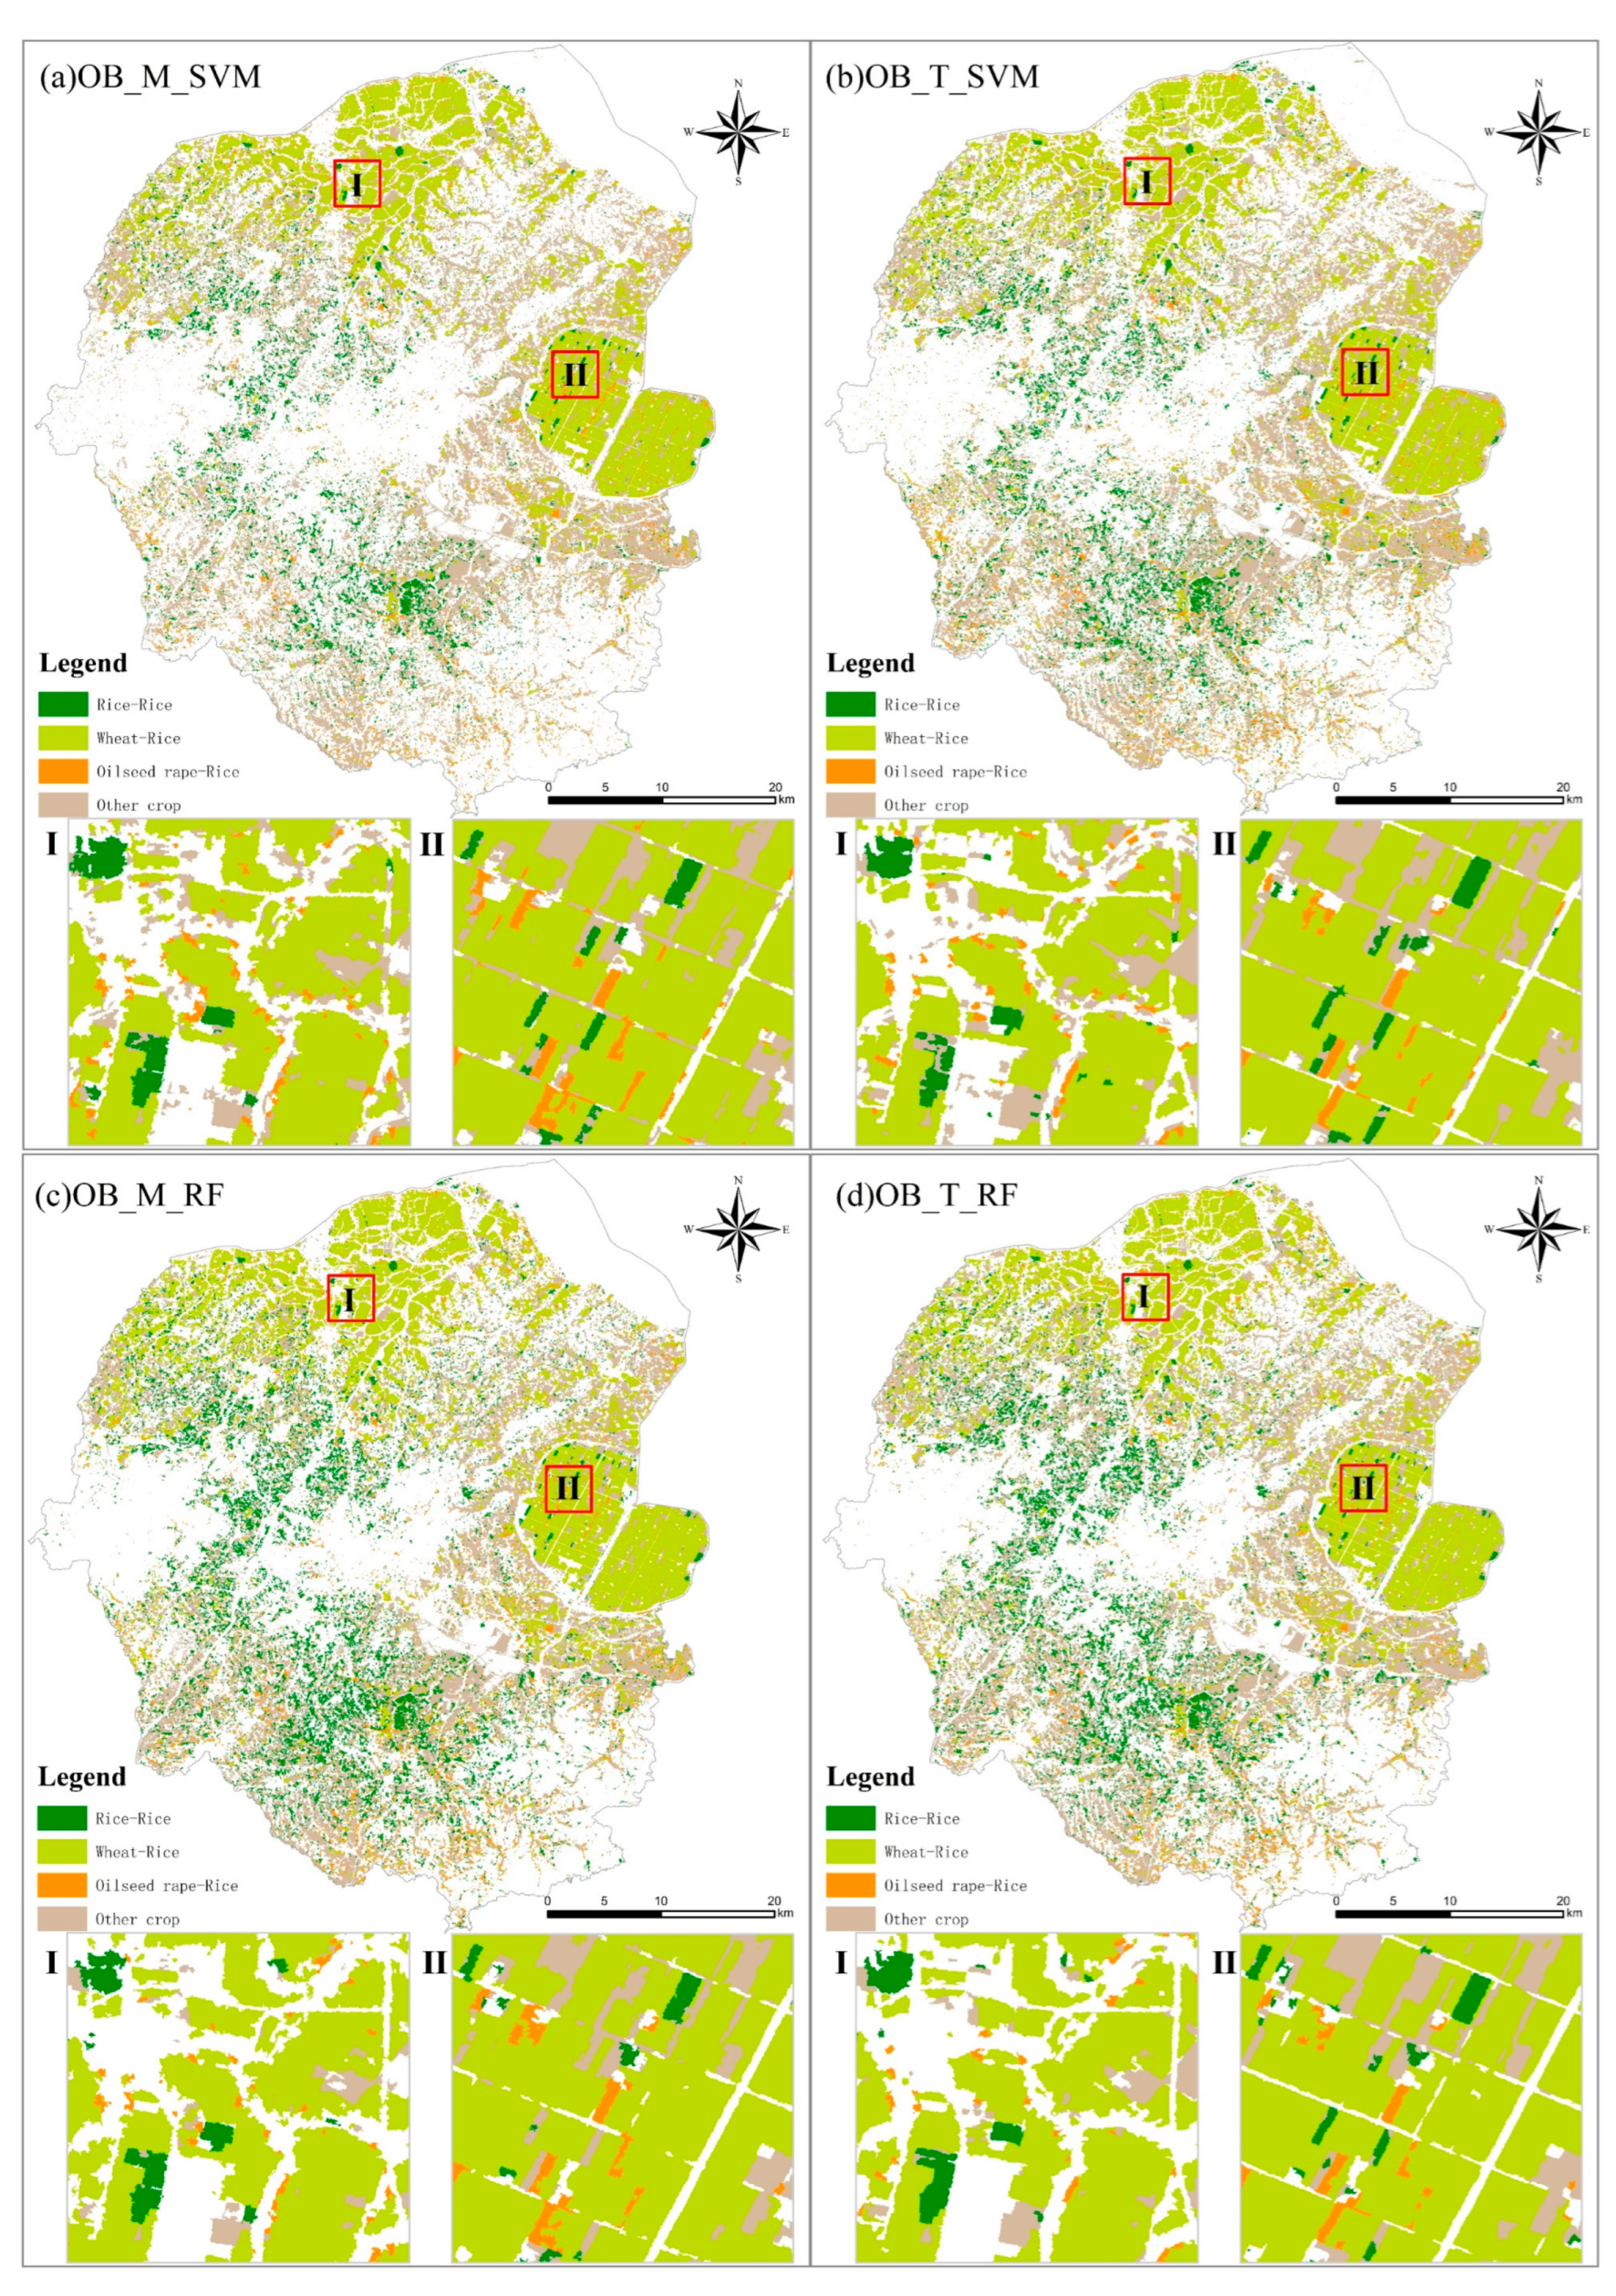
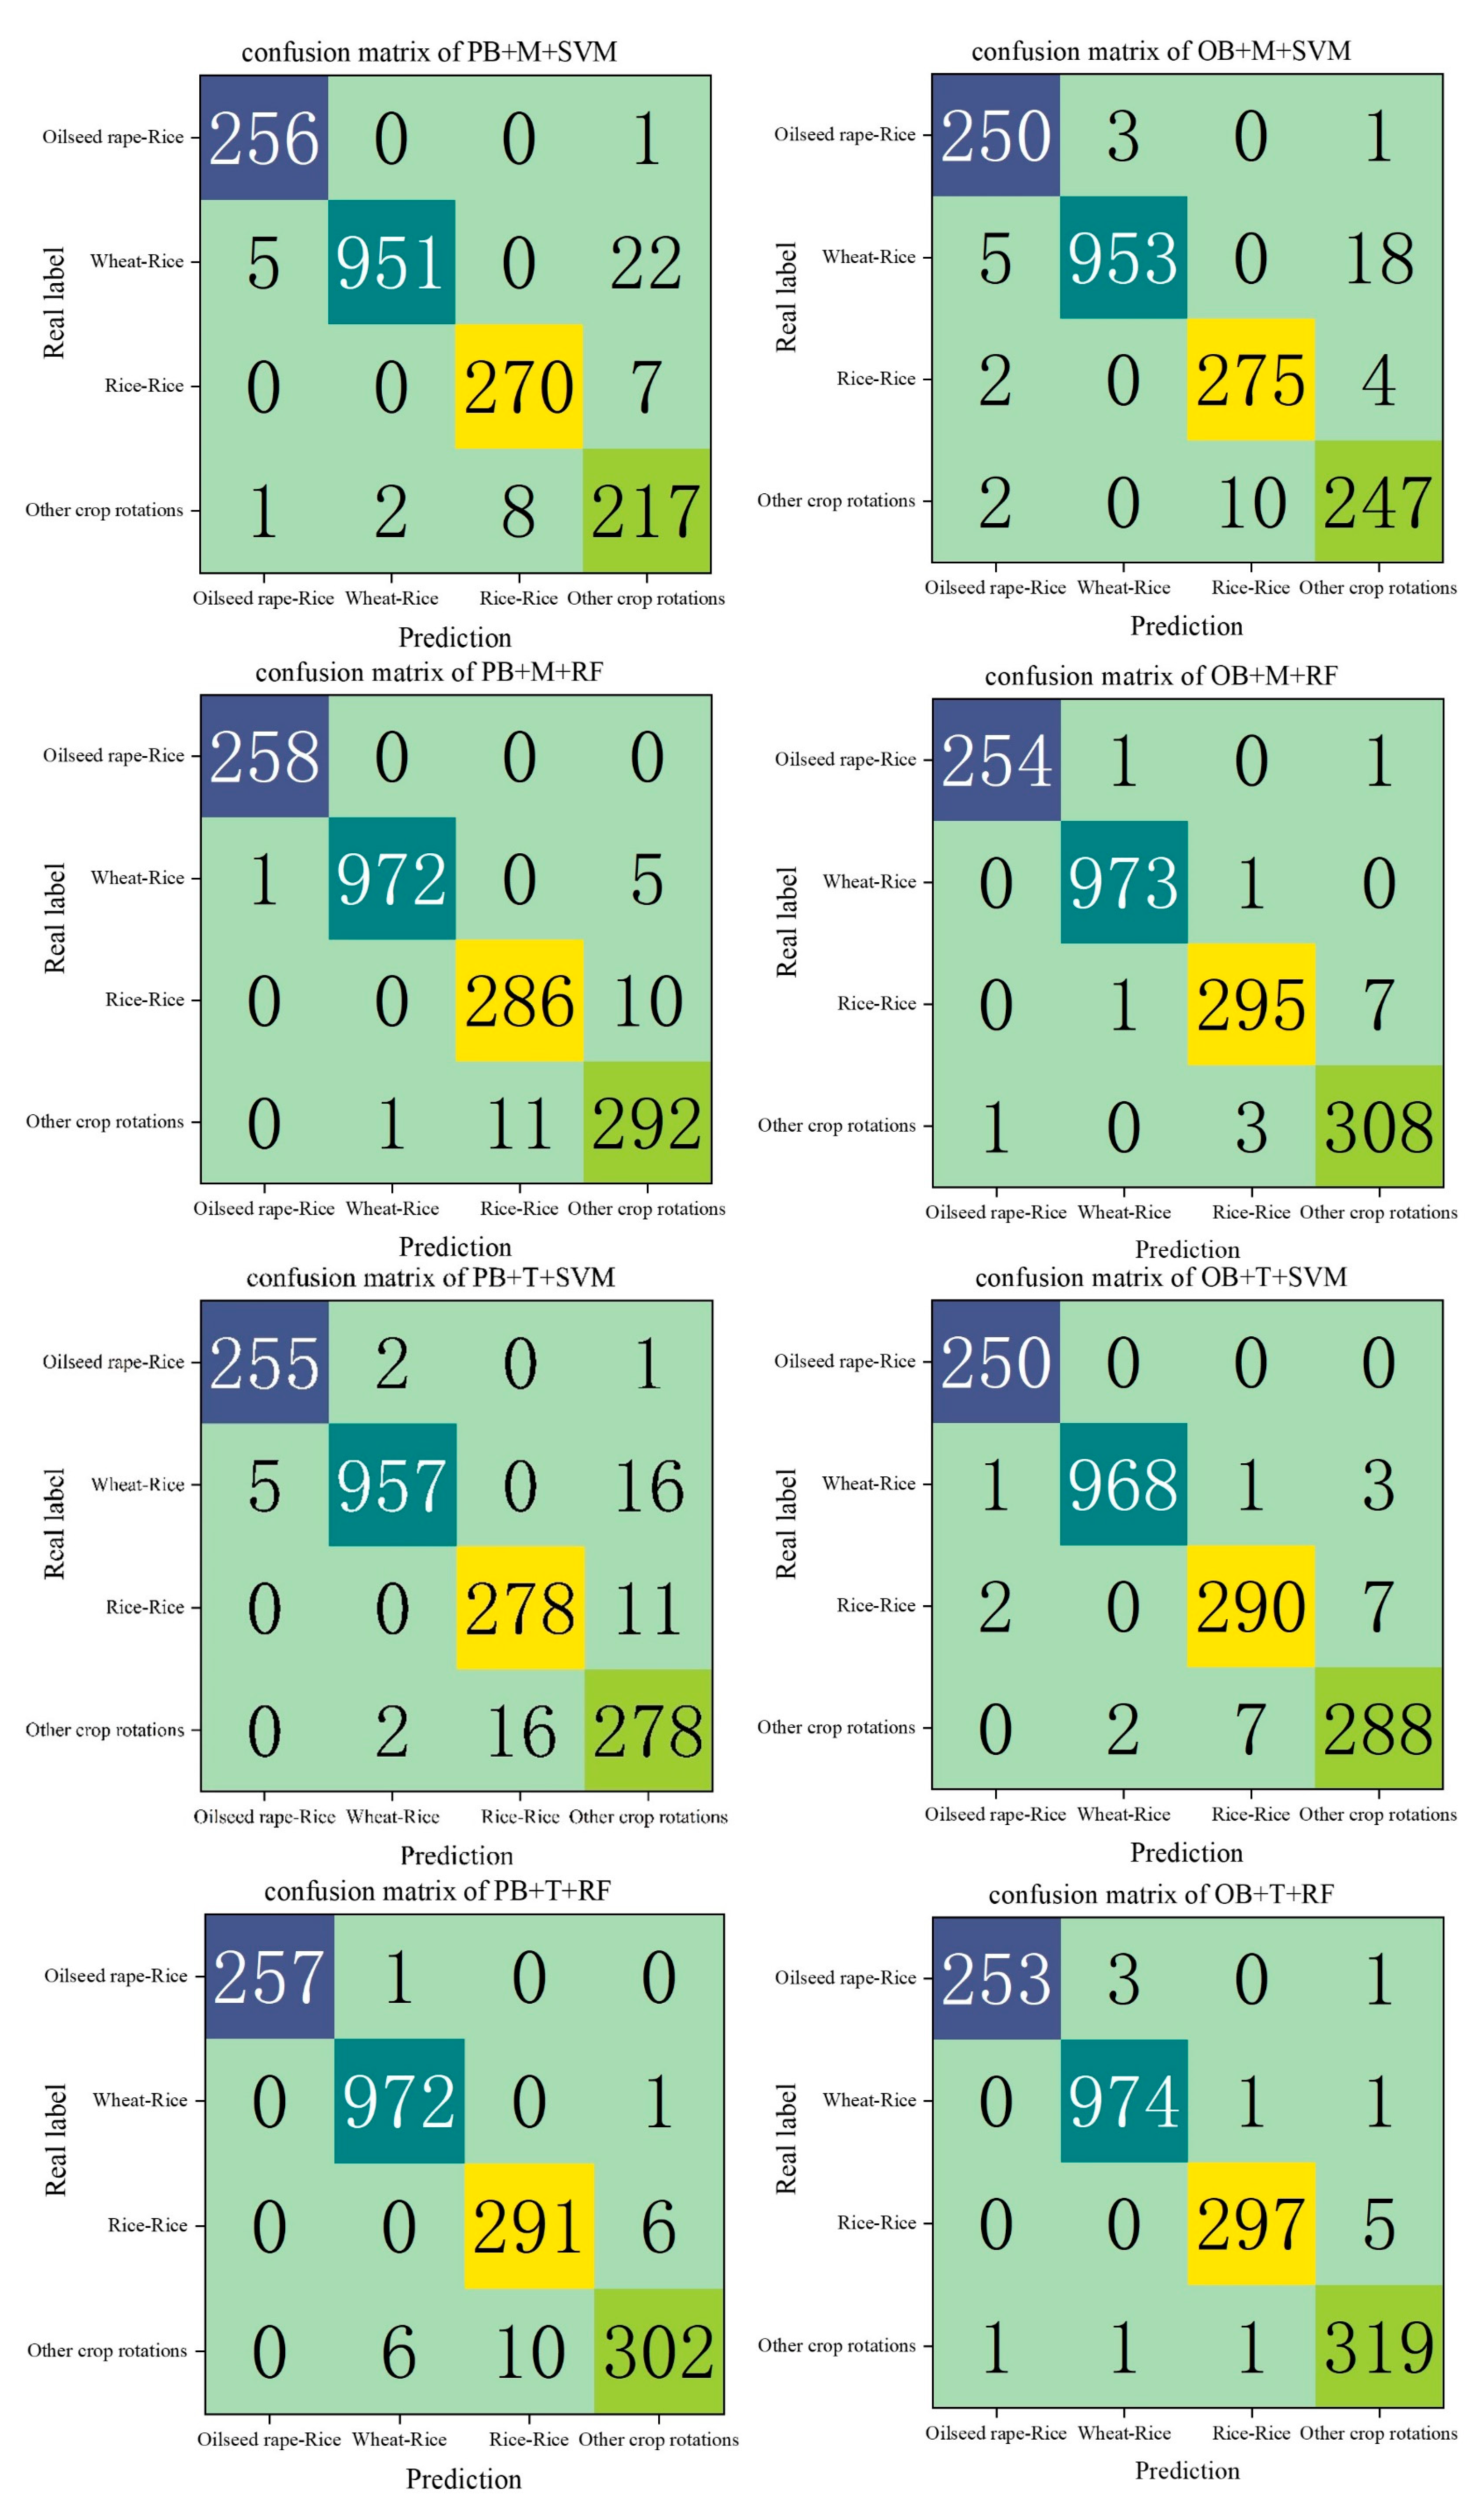
3.3. Extraction Results and Precision Analysis

The eight extraction models in Section 2.4.3 for extracting crop planting structure information, and two typical regions (Ⅰ and Ⅱ) were intercepted at the same time, and the extraction effects of the eight models were compared on a small scale. The pixel-based extraction results are shown in Figure 8, and the object-oriented extraction results are shown in Figure 9. In general, the spatial distribution of various crop rotation patterns in the eight extraction results was consistent. Wheat–rice rotation was mainly distributed in the north and east of the study area, double-cropping rice was mainly distributed in the middle and south of the study area, and rapeseed–rice rotation was distributed along roads and rivers. The difference was reflected in the degree of influence by the noise value of the original image. Among the extraction results of PB + M + SVM, PB + T + SVM, PB + M + RF and PB + T + RF, the “salt-and-pepper phenomenon” was serious, and the “salt-and-pepper phenomenon” was more serious in the extraction results of PB + M + SVM and PB + T + SVM models. The pattern spots in the extraction results of OB + M + SVM, OB + T + SVM, OB + M + RF and OB + T + RF were more regular and the boundary information was more obvious, which can effectively suppress the “pepper and salt phenomenon”, and the extraction effect has been significantly improved.
Based on the validation sample data, the accuracy of the extraction results of eight models was further evaluated, the evaluation results are shown in Table 2 and Figure 10. For the overall accuracy and Kappa coefficient. The extraction accuracy of the eight models was ranked as OB + T + RF > OB + M + RF > PB + T + RF > PB + M + RF > OB + T + SVM > PB + T + SVM > PB + M + SVM, among which OB + T + RF performed best, the overall accuracy and Kappa coefficient of the extraction model were the highest. 98.93% and 0.9854, respectively; PB + M + SVM extraction model was the lowest, 92.79% and 0.9008, respectively.
In general, the object-oriented crop planting structure extraction based on time series combined with the RF algorithm had the highest accuracy. The accuracy of object-oriented extraction was higher than that of pixel-based extraction, and the SVM algorithm increased the extraction accuracy more obviously in object-oriented extraction. The extraction result of the RF algorithm was better than the SVM algorithm. The extraction accuracy based on time series data was higher than that of multi-temporal data, and did not depend on phenological characteristics. Among the three main crop rotation patterns, because of the special flowering period of rape, the extraction accuracy of oil rice crop rotation pattern was the highest.

4. Discussion

4.1. The Potential of OB + T + RF to Extract Complex Crop Rotation Patterns

Time series data have been widely used in the field of remote sensing extraction of crop planting information, and object-oriented method has attracted much attention from scholars. Xue et al. [36]. study proved the feasibility of object-oriented crop classification based on time series, but it only classified single-season crops in the study area. In this study, an object-oriented method of crop rotation pattern extraction using the RF algorithm based on the time series dataset was proposed, and compared with the multi-temporal dataset and pixel-based extraction. The results are shown in Table 2, Figure 8, Figure 9 and Figure 10. The object-oriented extraction method based on time series data can effectively avoid the “pepper and salt phenomenon” of pixel-based extraction methods, and has higher verification accuracy. At the same time, compared with multi-temporal data, time series data can fully reflect the crop growth status of the whole rotation cycle, and can achieve higher extraction accuracy than multi-temporal data without the need to investigate phenological data in the region. The extraction accuracy of the RF algorithm and the SVM algorithm had been effectively improved by combining with object-oriented method. The reason why the SVM algorithm can improve more by combining with object-oriented method is that its own boundary generalization ability was poor. However, the accuracy of each model constructed by the RF algorithm is higher than that constructed by the SVM algorithm, so the RF algorithm performs better in complex crop rotation pattern extraction.

4.2. Advantages of Feature Construction and Extraction on the GEE Platform

The time series data constructed in this study are the Sentinel data, with a total of 143 landscape images and a resolution of 10 m, and it took a long time to perform data downloading, preprocessing, index construction, etc., on the local computer. At the same time, the use of time series high-resolution image to extract crop planting structure has high requirements for computer processor, graphics card computing power and speed. GEE cloud computing platform has a huge amount of data, segmentation algorithms and classification algorithms, which can quickly build a high-resolution time series datasets directly in the cloud, segment images at different scales, and extract crop planting structure by using classification algorithms. GEE cloud computing platform can achieve efficient and high-resolution crop planting structure extraction under the condition of low computer hardware configuration, which not only improves the research efficiency, but also ensures the timeliness in agricultural production and application.

4.3. The Limitation of the Algorithm and the Uncertainty of the Segmentation Scale

Although efficient and high-resolution extraction of crop structure in complex rotation areas has been realized based on the GEE platform, only SVM and RF were used in extraction algorithms in this research. Deep learning can realize powerful feature learning ability by establishing complex network structure [48,49,50]. However, deep learning has high requirements for hardware configuration and computing power, subsequent studies consider combining deep learning and other algorithms with the GEE platform to screen out the optimal algorithm. In this study, for the main crop types in the study area, a characteristic time series dataset that can be well distinguished from other crops and ground objects was selected. When extracting in other study areas, it is necessary to reconsider the selection of appropriate indicators to construct a time series dataset according to the actual situation.
Although the main crop rotation patterns in the study area can represent the typical crop rotation patterns in the middle and lower reaches of the Yangtze River in China, they cannot include the more abundant crop rotation patterns in the world. Moreover, the difference of cultivated land resources in different regions will lead to the difference of the optimal seed pixel spacing. Therefore, when the research results are extended to global applications, it is still necessary to evaluate the importance of features and determine the optimal seed pixel spacing. What is exciting is that GEE can quickly evaluate the importance of features and determine the optimal seed pixels for any region, which can extract relatively high-precision results more efficiently than using local computers.

5. Conclusions

In this study, NDVI, NDYI and VH time series feature sets were constructed based on Sentinel data of the GEE platform. The RF algorithm was used to evaluate the feature importance, and the extraction window period was determined based on phenological characteristics. The influence of different time series feature sets and multi-temporal datasets on the extraction accuracy of the SVM and RF algorithms was explored, and the SNIC algorithm was used for object-oriented extraction to realize the extraction of crop planting structure information in complex rotation region. The main conclusions are as follows:
(1)
The optimal extraction model was OB + T + RF and the overall accuracy and Kappa coefficient were 98.93% and 0.9854, respectively. The extraction accuracy of the model constructed by the RF algorithm was higher than that of the model constructed by the SVM algorithm.
(2)
The GEE platform can be used to extract high-efficiency and high-precision crop planting structure information. The GEE platform can directly call Sentinel data with high temporal resolution and high spatial resolution; at the same time, it also has a strong cloud computing capability, which can quickly conduct image preprocessing, build feature index and time series datasets, and extract crop planting structure information.
(3)
When crop planting structure information is extracted at a 10 m spatial resolution, the accuracy of the object-oriented extraction method is higher than that of the pixel-based extraction method.
(4)
The extraction accuracy of time series data is higher than that of multi-temporal data, and time series data can better reflect the characteristics of each stage of crop growth, and high-precision crop planting structure information can be extracted with less phenological information.

Author Contributions

Conceptualization, L.W., Y.M. and D.Z.; methodology, L.W. and D.Z.; software, D.Z.; validation, D.Z.; formal analysis, D.Z. and Z.M.; investigation, X.W., C.Y. and D.Z.; resources, L.W. and Y.M.; data curation, D.Z.; writing—original draft preparation, D.Z.; writing—review and editing, D.Z., L.W., C.Y. and Z.M.; visualization, Z.M. and D.Z.; supervision, L.W.; project administration, L.W.; funding acquisition, L.W. and Y.M. All authors have read and agreed to the published version of the manuscript.

Funding

This research was funded by the National Natural Science Foundation of China, grant number U2243228, Major Science and Technology Project of Anhui Province, grant number 202003a06020002, and Research Grants Program for Stabling and Introducing Talents of Anhui Agricultural University, China, grant number rc522013.

Data Availability Statement

The data presented in this study are available from the corresponding author upon reasonable request.

Acknowledgments

The authors thank USGS and Google Earth Engine platform for providing rich computing resources.

Conflicts of Interest

The authors declare that they have no conflict of interest.

References

  1. Li, H.; Song, X.-P.; Hansen, M.C.; Becker-Reshef, I.; Adusei, B.; Pickering, J.; Wang, L.; Wang, L.; Lin, Z.; Zalles, V.; et al. Development of a 10-m resolution maize and soybean map over China: Matching satellite-based crop classification with sample-based area estimation. Remote Sens. Environ. 2023, 294, 113623. [Google Scholar] [CrossRef]
  2. Garajeh, M.K.; Salmani, B.; Naghadehi, S.Z.; Goodarzi, H.V.; Khasraei, A. An integrated approach of remote sensing and geospatial analysis for modeling and predicting the impacts of climate change on food security. Sci. Rep. 2023, 13, 1057. [Google Scholar] [CrossRef] [PubMed]
  3. Di, Y.; Zhang, G.; You, N.; Yang, T.; Zhang, Q.; Liu, R.; Doughty, R.B.; Zhang, Y. Mapping Croplands in the Granary of the Tibetan Plateau Using All Available Landsat Imagery, A Phenology-Based Approach, and Google Earth Engine. Remote Sens. 2021, 13, 2289. [Google Scholar] [CrossRef]
  4. Jin, Z.; Azzari, G.; You, C.; Di Tommaso, S.; Aston, S.; Burke, M.; Lobell, D.B. Smallholder maize area and yield mapping at national scales with Google Earth Engine. Remote Sens. Environ. 2019, 228, 115–128. [Google Scholar] [CrossRef]
  5. Donohue, R.J.; Lawes, R.A.; Mata, G.; Gobbett, D.; Ouzman, J. Towards a national, remote-sensing-based model for predicting field-scale crop yield. Field Crops Res. 2018, 227, 79–90. [Google Scholar] [CrossRef]
  6. Wang, X.; Fang, S.; Yang, Y.; Du, J.; Wu, H. A New Method for Crop Type Mapping at the Regional Scale Using Multi-Source and Multi-Temporal Sentinel Imagery. Remote Sens. 2023, 15, 2466. [Google Scholar] [CrossRef]
  7. Weiss, M.; Jacob, F.; Duveiller, G. Remote sensing for agricultural applications: A meta-review. Remote Sens. Environ. 2020, 236, 111402. [Google Scholar] [CrossRef]
  8. Franch, B.; Vermote, E.F.; Skakun, S.; Roger, J.C.; Becker-Reshef, I.; Murphy, E.; Justice, C. Remote sensing based yield monitoring: Application to winter wheat in United States and Ukraine. Int. J. Appl. Earth Obs. Geoinf. 2019, 76, 112–127. [Google Scholar] [CrossRef]
  9. Becker-Reshef, I.; Justice, C.; Barker, B.; Humber, M.; Rembold, F.; Bonifacio, R.; Zappacosta, M.; Budde, M.; Magadzire, T.; Shitote, C.; et al. Strengthening agricultural decisions in countries at risk of food insecurity: The GEOGLAM Crop Monitor for Early Warning. Remote Sens. Environ. 2020, 237, 111553. [Google Scholar] [CrossRef]
  10. Cai, Y.; Guan, K.; Peng, J.; Wang, S.; Seifert, C.; Wardlow, B.; Li, Z. A high-performance and in-season classification system of field-level crop types using time-series Landsat data and a machine learning approach. Remote Sens. Environ. 2018, 210, 35–47. [Google Scholar] [CrossRef]
  11. Tian, G.; Li, H.; Jiang, Q.; Qiao, B.; Li, N.; Guo, Z.; Zhao, J.; Yang, H. An Automatic Method for Rice Mapping Based on Phenological Features with Sentinel-1 Time-Series Images. Remote Sens. 2023, 15, 2785. [Google Scholar] [CrossRef]
  12. Conese, C.; Maselli, F. Use of multitemporal information to improve classification performance of TM scenes in complex terrain. ISPRS J. Photogramm. Remote Sens. 1991, 46, 187–197. [Google Scholar] [CrossRef]
  13. Khatami, R.; Mountrakis, G.; Stehman, S.V. A meta-analysis of remote sensing research on supervised pixel-based land-cover image classification processes: General guidelines for practitioners and future research. Remote Sens. Environ. 2016, 177, 89–100. [Google Scholar] [CrossRef]
  14. Orynbaikyzy, A.; Gessner, U.; Conrad, C. Crop type classification using a combination of optical and radar remote sensing data: A review. Int. J. Remote Sens. 2019, 40, 6553–6595. [Google Scholar] [CrossRef]
  15. Wang, M.; Wang, J.; Cui, Y.; Liu, J.; Chen, L. Agricultural Field Boundary Delineation with Satellite Image Segmentation for High-Resolution Crop Mapping: A Case Study of Rice Paddy. Agronomy 2022, 12, 2342. [Google Scholar] [CrossRef]
  16. Jia, K.; Wu, B.; Li, Q. Crop classification using HJ satellite multispectral data in the North China Plain. J. Appl. Remote Sens. 2013, 7, 073576. [Google Scholar] [CrossRef]
  17. Larranaga, A.; Alvarez-Mozos, J. On the Added Value of Quad-Pol Data in a Multi-Temporal Crop Classification Framework Based on RADARSAT-2 Imagery. Remote Sens. 2016, 8, 335. [Google Scholar] [CrossRef]
  18. Whelen, T.; Siqueira, P. Use of time-series L-band UAVSAR data for the classification of agricultural fields in the San Joaquin Valley. Remote Sens. Environ. 2017, 193, 216–224. [Google Scholar] [CrossRef]
  19. Hao, P.; Wang, L.; Niu, Z.; Aablikim, A.; Huang, N.; Xu, S.; Chen, F. The Potential of Time Series Merged from Landsat-5 TM and HJ-1 CCD for Crop Classification: A Case Study for Bole and Manas Counties in Xinjiang, China. Remote Sens. 2014, 6, 7610–7631. [Google Scholar] [CrossRef]
  20. Zhan, Y.; Muhammad, S.; Hao, P.; Niu, Z. The effect of EVI time series density on crop classification accuracy. Optik 2018, 157, 1065–1072. [Google Scholar] [CrossRef]
  21. Kang, Y.; Hu, X.; Meng, Q.; Zou, Y.; Zhang, L.; Liu, M.; Zhao, M. Land Cover and Crop Classification Based on Red Edge Indices Features of GF-6 WFV Time Series Data. Remote Sens. 2021, 13, 4522. [Google Scholar] [CrossRef]
  22. Wardlow, B.D.; Egbert, S.L. Large-area crop mapping using time-series MODIS 250 m NDVI data: An assessment for the US Central Great Plains. Remote Sens. Environ. 2008, 112, 1096–1116. [Google Scholar] [CrossRef]
  23. Sakamoto, T.; Yokozawa, M.; Toritani, H.; Shibayama, M.; Ishitsuka, N.; Ohno, H. A crop phenology detection method using time-series MODIS data. Remote Sens. Environ. 2005, 96, 366–374. [Google Scholar] [CrossRef]
  24. Hao, P.; Zhan, Y.; Wang, L.; Niu, Z.; Shakir, M. Feature Selection of Time Series MODIS Data for Early Crop Classification Using Random Forest: A Case Study in Kansas, USA. Remote Sens. 2015, 7, 5347–5369. [Google Scholar] [CrossRef]
  25. Phan Thanh, N.; Kappas, M. Comparison of Random Forest, k-Nearest Neighbor, and Support Vector Machine Classifiers for Land Cover Classification Using Sentinel-2 Imagery. Sensors 2018, 18, 18. [Google Scholar] [CrossRef]
  26. Liu, L.; Xiao, X.; Qin, Y.; Wang, J.; Xu, X.; Hu, Y.; Qiao, Z. Mapping cropping intensity in China using time series Landsat and Sentinel-2 images and Google Earth Engine. Remote Sens. Environ. 2020, 239, 111624. [Google Scholar] [CrossRef]
  27. Ni, R.; Tian, J.; Li, X.; Yin, D.; Li, J.; Gong, H.; Zhang, J.; Zhu, L.; Wu, D. An enhanced pixel-based phenological feature for accurate paddy rice mapping with Sentinel-2 imagery in Google Earth Engine. ISPRS J. Photogramm. Remote Sens. 2021, 178, 282–296. [Google Scholar] [CrossRef]
  28. Ashourloo, D.; Shahrabi, H.S.; Azadbakht, M.; Rad, A.M.; Aghighi, H.; Radiom, S. A novel method for automatic potato mapping using time series of Sentinel-2 images. Comput. Electron. Agric. 2020, 175, 105583. [Google Scholar] [CrossRef]
  29. Jiang, Q.; Tang, Z.; Zhou, L.; Hu, G.; Deng, G.; Xu, M.; Sang, G. Mapping Paddy Rice Planting Area in Dongting Lake Area Combining Time Series Sentinel-1 and Sentinel-2 Images. Remote Sens. 2023, 15, 2794. [Google Scholar] [CrossRef]
  30. Yang, L.; Wang, L.; Abubakar, G.A.; Huang, J. High-Resolution Rice Mapping Based on SNIC Segmentation and Multi-Source Remote Sensing Images. Remote Sens. 2021, 13, 1148. [Google Scholar] [CrossRef]
  31. Saad El Imanni, H.; El Harti, A.; Hssaisoune, M.; Velastegui-Montoya, A.; Elbouzidi, A.; Addi, M.; El Iysaouy, L.; El Hachimi, J. Rapid and Automated Approach for Early Crop Mapping Using Sentinel-1 and Sentinel-2 on Google Earth Engine; A Case of a Highly Heterogeneous and Fragmented Agricultural Region. J. Imaging 2022, 8, 316. [Google Scholar] [CrossRef] [PubMed]
  32. Fatchurrachman; Rudiyanto; Soh, N.C.; Shah, R.M.; Giap, S.G.E.; Setiawan, B.I.; Minasny, B. High-Resolution Mapping of Paddy Rice Extent and Growth Stages across Peninsular Malaysia Using a Fusion of Sentinel-1 and 2 Time Series Data in Google Earth Engine. Remote Sens. 2022, 14, 1875. [Google Scholar] [CrossRef]
  33. Wang, Y.Y.; Fang, S.H.; Zhao, L.L.; Huang, X.X.; Jiang, X.Q. Parcel-based summer maize mapping and phenology estimation combined using Sentinel-2 and time series Sentinel-1 data. Int. J. Appl. Earth Obs. Geoinf. 2022, 108, 102720. [Google Scholar] [CrossRef]
  34. Maiti, A.; Acharya, P.; Sannigrahi, S.; Zhang, Q.; Bar, S.; Chakraborti, S.; Gayen, B.K.; Barik, G.; Ghosh, S.; Punia, M. Mapping active paddy rice area over monsoon asia using time-series Sentinel-2 images in Google earth engine; a case study over lower gangetic plain. Geocarto Int. 2022, 37, 10254–10277. [Google Scholar] [CrossRef]
  35. Xing, H.Q.; Chen, B.Y.; Feng, Y.Y.; Ni, Y.L.; Hou, D.Y.; Wang, X.; Kong, Y.W. Mapping irrigated, rainfed and paddy croplands from time-series Sentinel-2 images by integrating pixel-based classification and image segmentation on Google Earth Engine. Geocarto Int. 2022, 37, 13291–13310. [Google Scholar] [CrossRef]
  36. Xue, H.; Xu, X.; Zhu, Q.; Yang, G.; Long, H.; Li, H.; Yang, X.; Zhang, J.; Yang, Y.; Xu, S.; et al. Object-Oriented Crop Classification Using Time Series Sentinel Images from Google Earth Engine. Remote Sens. 2023, 15, 1353. [Google Scholar] [CrossRef]
  37. Li, M.; Zhang, R.; Luo, H.; Gu, S.; Qin, Z. Crop Mapping in the Sanjiang Plain Using an Improved Object-Oriented Method Based on Google Earth Engine and Combined Growth Period Attributes. Remote Sens. 2022, 14, 273. [Google Scholar] [CrossRef]
  38. Luo, C.; Qi, B.S.; Liu, H.J.; Guo, D.; Lu, L.P.; Fu, Q.; Shao, Y.Q. Using Time Series Sentinel-1 Images for Object-Oriented Crop Classification in Google Earth Engine. Remote Sens. 2021, 13, 561. [Google Scholar] [CrossRef]
  39. Zamani-Noor, N.; Feistkorn, D. Monitoring Growth Status of Winter Oilseed Rape by NDVI and NDYI Derived from UAV-Based Red-Green-Blue Imagery. Agronomy 2022, 12, 2212. [Google Scholar] [CrossRef]
  40. Duy Ba, N.; Gruber, A.; Wagner, W. Mapping rice extent and cropping scheme in the Mekong Delta using Sentinel-1A data. Remote Sens. Lett. 2016, 7, 1209–1218. [Google Scholar] [CrossRef]
  41. Achanta, R.; Shaji, A.; Smith, K.; Lucchi, A.; Fua, P.; Suesstrunk, S. SLIC Superpixels Compared to State-of-the-Art Superpixel Methods. IEEE Trans. Pattern Anal. Mach. Intell. 2012, 34, 2274–2281. [Google Scholar] [CrossRef] [PubMed]
  42. Pal, M. Random forest classifier for remote sensing classification. Int. J. Remote Sens. 2005, 26, 217–222. [Google Scholar] [CrossRef]
  43. Rodriguez-Galiano, V.F.; Ghimire, B.; Rogan, J.; Chica-Olmo, M.; Rigol-Sanchez, J.P. An assessment of the effectiveness of a random forest classifier for land-cover classification. ISPRS J. Photogramm. Remote Sens. 2012, 67, 93–104. [Google Scholar] [CrossRef]
  44. Park, S.; Im, J.; Park, S.; Yoo, C.; Han, H.; Rhee, J. Classification and Mapping of Paddy Rice by Combining Landsat and SAR Time Series Data. Remote Sens. 2018, 10, 447. [Google Scholar] [CrossRef]
  45. Pal, M.; Mather, P.M. Support vector machines for classification in remote sensing. Int. J. Remote Sens. 2005, 26, 1007–1011. [Google Scholar] [CrossRef]
  46. Kok, Z.H.; Shariff, A.R.M.; Alfatni, M.S.M.; Khairunniza-Bejo, S. Support Vector Machine in Precision Agriculture: A review. Comput. Electron. Agric. 2021, 191, 106546. [Google Scholar] [CrossRef]
  47. Jia, Y.; Zhang, X.; Zhang, H.; Su, Z. Crop Classification Based on A Gaofen 1/Wide-Field-View Time Series. Eng. Agric. 2022, 42. [Google Scholar] [CrossRef]
  48. Cheng, G.; Xie, X.; Han, J.; Guo, L.; Xia, G.-S. Remote Sensing Image Scene Classification Meets Deep Learning: Challenges, Methods, Benchmarks, and Opportunities. IEEE J. Sel. Top. Appl. Earth Obs. Remote Sens. 2020, 13, 3735–3756. [Google Scholar] [CrossRef]
  49. Sun, X.; Wang, B.; Wang, Z.; Li, H.; Li, H.; Fu, K. Research Progress on Few-Shot Learning for Remote Sensing Image Interpretation. Ieee J. Sel. Top. Appl. Earth Obs. Remote Sens. 2021, 14, 2387–2402. [Google Scholar] [CrossRef]
  50. Jiang, H.; Peng, M.; Zhong, Y.; Xie, H.; Hao, Z.; Lin, J.; Ma, X.; Hu, X. A Survey on Deep Learning-Based Change Detection from High-Resolution Remote Sensing Images. Remote Sens. 2022, 14, 1552. [Google Scholar] [CrossRef]
Figure 1. Topographic map of Lujiang County. It shows the geographical location and terrain information of Lujiang County. Actual surveyed plot locations and partial plot survey photographs are also shown. 1–6 represent partial survey point locations and corresponding survey photos.
Agronomy 13 02350 g001
Figure 2. Phenological phases of the main rotation patterns in the study area. E means the early 10 days of a month, M is the middle 10 days, and L represents the later 10 days.
Agronomy 13 02350 g002
Figure 3. Distribution map of the number of effective observations of Sentinel data in the rotation cycle of the study area. (a) Sentinel-1 data; (b) Sentinel-2 data.
Agronomy 13 02350 g003
Figure 4. Flow chart of crop planting structure extraction.
Agronomy 13 02350 g004
Figure 5. Time series figure and dataset simplification diagram. The variation characteristics of NDVI, NDYI and VH in different periods under different rotation patterns are shown.
Agronomy 13 02350 g005
Figure 6. Evaluation of extraction accuracy and feature importance. Kappa and Overall Accuracy of extracted results for different datasets and different algorithms are shown in (a), the User Accuracy and Producer Accuracy extracted by the dataset and the algorithm for different rotation patterns are shown in (b,c). (d) is the result of feature importance evaluation, NDVI6 means NDVI synthesized in June; NDVI10_n means NDVI synthesized in October of the harvest year.
Agronomy 13 02350 g006
Figure 7. Effect of different segmentation scales on extraction accuracy. “SVM” means the Support Vector Machine algorithm, “RF” means the Random Forest algorithm; “M” means multi-temporal data; “T” means time series data.
Agronomy 13 02350 g007
Figure 8. Pixel-based extraction results. “PB” means pixel based, “SVM” means the Support Vector Machine algorithm, “RF” means the Random Forest algorithm; “M” means multi-temporal data; “T” means time series data.
Agronomy 13 02350 g008
Figure 9. Object-oriented extraction results. “OB” means object oriented, “SVM” means the Support Vector Machine algorithm, “RF” means the Random Forest algorithm; “M” means multi-temporal data; “T” means time series data.
Agronomy 13 02350 g009
Figure 10. Extract the confusion matrix of the results. “PB” means pixel based, “OB” means object oriented, “SVM” means the Support Vector Machine algorithm, “RF” means the Random Forest algorithm; “M” means multi-temporal data; “T” means time series data.
Agronomy 13 02350 g010
Table 1. Remote sensing data used in this study.
NumberSensorDateQuantityNumberSensorDateQuantity
1S2October 20201014S1GRDOctober 20203
2S2November 20201215S1GRDNovember 20202
3S2December 20201216S1GRDDecember 20203
4S2January 2021717S1GRDJanuary 20212
5S2February 2021318S1GRDFebruary 20213
6S2March 2021619S1GRDMarch 20212
7S2April 2021520S1GRDApril 20213
8S2May 2021821S1GRDMay 20212
9S2June 2021522S1GRDJune 20213
10S2July 2021823S1GRDJuly 20212
11S2August 2021824S1GRDAugust 20213
12S2September 20211525S1GRDSeptember 20212
13S2October 20211126S1GRDOctober 20213
Table 2. Precision comparison of eight extraction models.
ModelKappa
Coefficient
Overall
Accuracy
Crop Rotation
Pattern
Producer’s
Accuracy
User’s
Accuracy
PB 1 + M 2 + SVM 30.900892.79%Wheat–Rice81.58%66.16%
Rice–Rice95.07%88.82%
Oilseed Rape–Rice99.48%97.14%
PB + M + RF 40.964597.41%Wheat–Rice94.19%89.02%
Rice–Rice94.70%94.08%
Oilseed Rape–Rice99.69%99.28%
PB + T 5 + SVM0.947096.13%Wheat–Rice88.82%84.76%
Rice–Rice94.24%91.45%
Oilseed Rape–Rice99.58%97.75%
PB + T + RF0.973398.05%Wheat–Rice94.38%92.07%
Rice–Rice97.00%95.72%
Oilseed Rape–Rice99.69%99.28%
OB 6 + M + SVM0.924894.53%Wheat–Rice89.49%75.30%
Rice–Rice96.15%90.46%
Oilseed Rape–Rice99.48%97.34%
OB + M + RF0.979198.47%Wheat–Rice96.55%93.90%
Rice–Rice98.66%97.04%
Oilseed Rape–Rice99.69%99.39%
OB + T + SVM0.962097.23%Wheat–Rice96.00%87.80%
Rice–Rice96.67%95.39%
Oilseed Rape–Rice99.69%98.88%
OB + T + RF0.985498.93%Wheat–Rice97.26%97.26%
Rice–Rice99.33%97.70%
Oilseed Rape–Rice99.49%99.49%
1 “PB” means pixel based; 2 “M” means multi-temporal data; 3 “SVM” means the Support Vector Machine algorithm; 4 “RF” means the Random Forest algorithm; 5 “T” means time series data; 6 “OB” means object oriented.
Disclaimer/Publisher’s Note: The statements, opinions and data contained in all publications are solely those of the individual author(s) and contributor(s) and not of MDPI and/or the editor(s). MDPI and/or the editor(s) disclaim responsibility for any injury to people or property resulting from any ideas, methods, instructions or products referred to in the content.

