Abstract
The adhesion of dust particles on the surface of the dust collector tends to cause great resistance to the dust collector and affects the operating efficiency. In order to visualize particles in the filtration process and to grasp the mechanism of particle viscosity and sphericity on filtration performance, a numerical simulation study was conducted to investigate the deposition behavior of particles during filtration, employing FLUENT-EDEM coupling technology. By examining the deposition process, the role of particle characteristics on dust behavior within the entire filtration system was elucidated. The effects of varying particle surface energy and particle sphericity on filtration pressure drop and cake porosity were analyzed. The findings reveal that under the force of the air, particles on the surface of the filter membrane experience compaction, leading to a reduction in the porosity of the formed cake layer. The diminution of porosity serves to impede the air, consequently augmenting the pressure drop across the filtration system and hindering the operational efficacy of the dust collector. As the surface energy of the particles increases, the adhesive forces between particles are intensified, leading to an elevation in the porosity of the cake layer and a subsequent decrease in the pressure drop. When the surface energy of the particles is increased from 0.01 J/m2 to 0.04 J/m2, the porosity experiences a modest increase of only 9.1%, yet the pressure drop is significantly reduced by half, amounting to a decrease of 1594 Pa. Under high particle surface energy, as filtration air velocity increases, particles are compressed, resulting in a decrease in cake porosity and an increase in pressure drop. Concurrently, our findings indicate that as the sphericity of particles increases, their surfaces become increasingly smooth which in turn results in a decreased porosity of the cake layer and, consequently, an elevation in the filtration pressure drop.
1. Introduction
During the industrial production process in sectors such as coal, cement, mining, metallurgy, and mechanical processing, a considerable amount of dust particles was released [1]. These particles are disseminated widely throughout the air [2], with extreme cases potentially leading to explosion accidents [3,4]. Long-term exposure to high-concentration dust environments elevates the risk of respiratory diseases, including pharyngitis and pneumoconiosis [5], posing a substantial threat to the physical and mental health of relevant personnel and the smooth operation of industrial production [6,7]. Consequently, the collection and management of particulate pollutants are essential.
On the front of pollution treatment, we can use advanced artificial intelligence and a variety of strategies to monitor and prevent particles [8], but on the end, air filtration technology is essential for the removal of harmful particles and needs to be utilized extensively. Bag filter filtration technology stands out for its high efficiency in particle capture, significantly mitigating the release of particulate matter and consequently finding broad application across industrial sectors. Nevertheless, an inherent challenge arises in practical operation: as dust particles are trapped by the fibers, they progressively accumulate on the filter’s surface, forming a dense dust layer. This accumulation serves to augment the resistance encountered during the filtration process, thereby increasing filtration pressure. Adhesive dust particles, moreover, have a tendency to agglomerate and adhere to the filter surface, leading to clogging [9], which severely impairs the filtration performance of the dust collector. Therefore, understanding the variation of cake structure plays a very important role in the optimization of filtration. Filtration resistance is affected by the structure of the cake stack: the looser the cake structure, the smaller the corresponding cake resistance, and the cake stack structure is closely related to the force between the particles. The inter-particle forces mainly include liquid bridge and van der Waals forces [10] and electrostatic forces in the presence of an applied electric field. Liquid bridge forces are used in humid environments, where they greatly increase the adhesion of the particles, leading to the collisional agglomeration of the particles [11]. Van der Waals forces are proximal in nature and are strongly influenced by the nature of the particle contact surface and are related to particle surface roughness and contact deformation [12,13]. Therefore, the study of particle viscosity and shape helps us to understand the particle stresses in the filtration process and thus analyze the changes in the end particles and the filter cake.
At present, many scholars at home and abroad conduct a large number of theoretical and experimental studies on particle deposition characteristics and filtration characteristics. Shi et al. [14] utilized PFC 5.0 software to simulate the deposition behavior of particles on filter media surfaces, observing that an increase in air relative humidity and rolling resistance coefficients between particles leads to a larger porosity of the dust layer and smaller filtration resistance. Umer et al. [15] investigated the flow behavior of wet particles on leaves and concluded that the stacking pattern of wet particles was different, as influenced by liquid bridge forces. Zhou et al. [16] employed CFD-DPM technology to simulate the aggregation of wet particles on filter bags, concluding that higher relative humidity and dust moisture content contribute to reducing dust cake resistance. Xue et al. [17] conducted a simulation study on the deposition of high-humidity viscous dust on the surface of PTFE microporous membrane filter media and found that by increasing the filtration air velocity and increasing the particle size and viscosity, the particles are more likely to form stable dendritic structures on the surface of the filter media, which improves the adhesion efficiency. Khirouni et al. [18] investigated the regeneration efficiency of fiber filters clogged by metal ultrafine particles, reporting that under certain humidity conditions, water molecules react with metal particles to alter the dust cake structure, resulting in a cleaning efficiency reduction from 30% after aging in dry air to 10% after aging in 80% humidity. The above studies show that the viscosity of particles plays a very important role in particle deposition as well as filtration, and the particles are mainly affected by the liquid-bridging force, which makes it easy to adhere to the surface of the filter media or be agglomerated in the watershed. In addition to the liquid bridge forces, the contact forces between the particles themselves play an important role in the filtration process. Maddineni et al. [19] simulated the collision process of particles on the surface of the filter media and found that higher velocities, larger particle sizes, and higher porosity were the key factors for particles to rebound or penetrate the filter media. Shi et al. [20] investigated random bouncing in 3D space caused by the edges and corners of non-spherical particles after particle-wall collisions and showed a significant decrease in the normal coefficient of restitution for non-spherical regular particles and a slight change in the tangential coefficient of restitution for aspherical regular particles as compared to spherical particles. Nie et al. [21] utilized DEM technology to study the influence of particle friction coefficient on the mechanical properties of particle materials, explaining the intrinsic mechanism of rock evolution from the perspectives of particle motion and structural anisotropy. Han et al. [22] employed the discrete element method to generate a flexible ribbon particle model for numerical simulations of biomass materials and other flexible materials encountered in industry, revealing the impact of initial particle configuration, particle shape distribution, and particle size distribution on macroscopic and microstructural properties. Srivastava et al. [23] evaluated the disordered accumulation of spherical particles in a filled bed and found that different filling methods and particle characteristics have an important effect on the pore size and shape of the bed and that loose fillers lead to a greater variation in the mosaic area of the filler structure.
Most of the existing studies have investigated the cake buildup of viscous particles on filter media and their filtration resistance in terms of liquid bridge forces, while the studies on particle shapes have been biased towards their friction coefficients as well as the effects of material properties on the filtration buildup. There is a lack of research on the combined effect of particle viscosity and shape on the porosity and pressure drop of the filter cake during filtration. Therefore, in this study, the coupled FLUENT-EDEM technique is used as a support to simulate non-spherical particles by the DEM method, and particle accumulation experiments and filtration experiments are used to verify the accuracy of the model parameters so that the simulated particles can achieve the same effect as the real particles. Numerical simulations of the filtration deposition process of the particles were also carried out to investigate the effects of different particle surface energies as well as different degrees of sphericity on the comprehensive filtration performance of the dust particles. The study enables the visualization of viscous particles in the filtration process and helps to grasp the mechanism of particle viscosity and sphericity on filtration performance.
2. Numerical Modeling
2.1. Filtration Model
To study the deposition of dust particles in the filter medium, the 3D model of the filter system was constructed, as shown in Figure 1. The upper part of the model is the filtering chamber, the middle part is the filtering medium, and the lower part is the clean chamber.
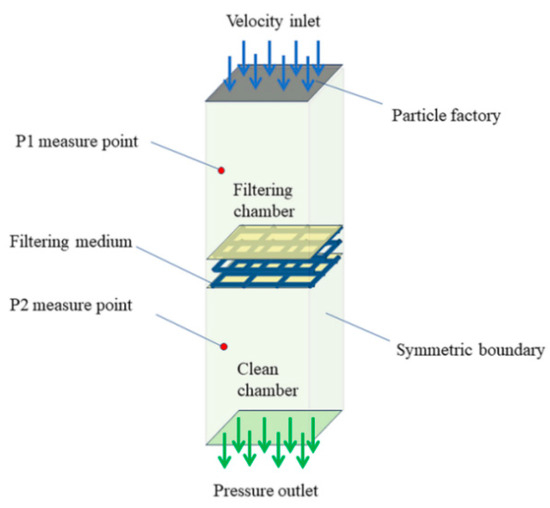
Figure 1.
The model of the filter system.
The model of the filter system was structured with ICEM 2021R1 software, with a maximum grid size of 1 mm and a minimum grid size of 0.6 mm. The top boundary of the model was defined as the velocity inlet, the bottom boundary was defined as the pressure outlet, and the boundary conditions for the calculation region were set as symmetric. The surface of the filter medium was set as a no-slip wall boundary condition. The system was configured with FLUENT 2021R1, using the Euler–Lagrange model to establish a continuous gas phase and a discrete solid phase mixed model and selecting transient for simulation calculation. The calculation of the fluid phase was based on the laminar flow model, and the fluid in the simulation process was an unsteady, compressible, and isothermal ideal gas. The filter medium used metal fiber material, the filter layer was set as a porous media region, the viscous resistance was set to 7.06 × 10¹¹ m−2, and the inertial resistance was set to 3.47 × 10⁶ m−1. The ideal air entered the filtering chamber at a certain velocity from the velocity inlet, exited the clean chamber through the pressure outlet, and pressure measurement points were set in the middle of the filtering and clean chambers to monitor pressure drop changes during the filtration process.
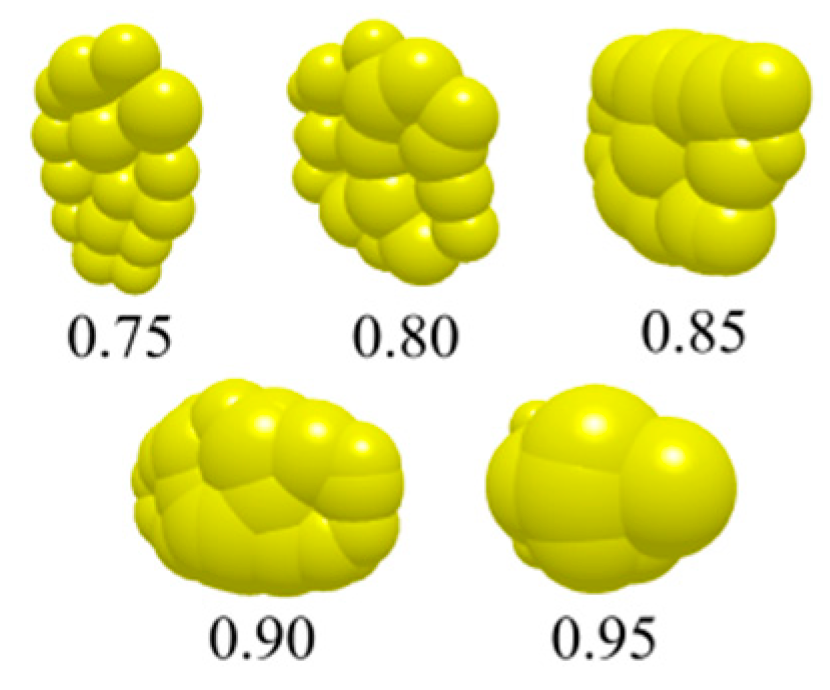
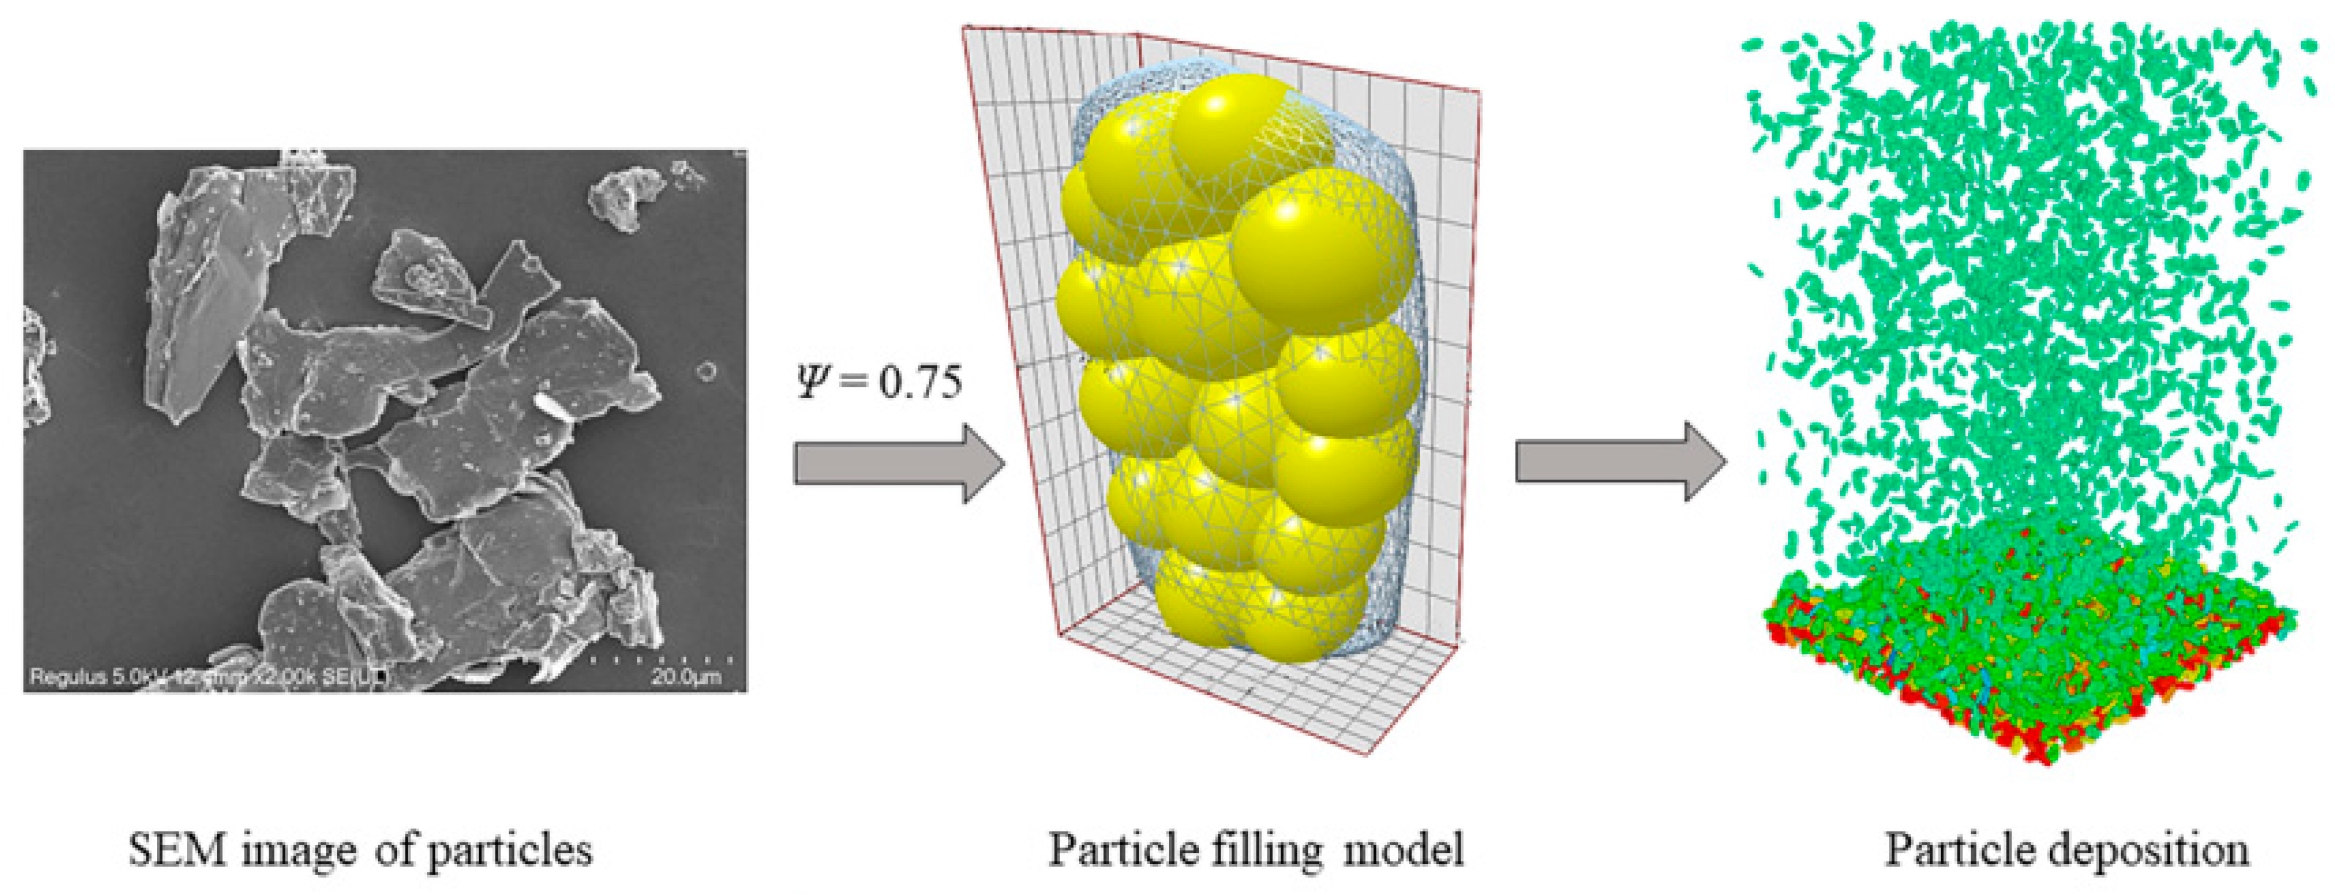
In engineering practice, there are often very small particles and huge numbers of particles in the DEM system, which greatly reduces the computational efficiency. In order to improve computational efficiency, coarse-grained methods [24] are usually used to process particles. In this study, considering the correlation between grid size [25,26] and particle size [27,28], a 20-fold enlargement was chosen. The sphericity index was used to describe the shape characteristics of the particles, represented by Ψ. The value is the ratio of the surface area of the sphere under the same volume to the actual surface area of the particle. The shape and appearance of dust particles were obtained through the scanning electron microscopy of talc powder. Then, the CAD 2019 software was used to construct five models of non-spherical particles from 0.75 to 0.95. We imported the model into EDEM 2021 to obtain non-spherical particles, as shown in Figure 2. The particle generation surface was set up on the upper part of the model of the filter system and a particle factory was added to continuously generate particles. Particle filtration simulation experiments by FLUENT-EDEM coupling yielded microscopic images of particles deposited on the filter medium, as shown in Figure 3.

Figure 2.
Particle model with different sphericities.

Figure 3.
Particle modeling and deposition.
To ensure that the particle factory can stably deliver particles into the fluid domain, the particle generation rate was set to 1 × 10⁴ particles per second. The particles were randomly generated and moved together with the airflow. Since the calculation involves two gas–solid species, its time step was related to the equilibrium stability of the whole coupled calculation. The time steps of fluent and EDEM used integer multiples (usually 1:1–1:100) of the relationship to achieve stable operation of the solver [29]. From our experience, For computationally stable operation and to obtain accurate particle information, the time step of EDEM was generally set to be 50~100 times smaller than that in FLUENT, exactly 100 times here. Considering the calculation time as well as the accuracy, we determined that the time step in EDEM was 3 × 10⁷ s, the grid cell size was set to 3R min, and the number of grids was 1,223,424. In FLUENT, with a time step of 3 × 10⁵ s, the number of time steps was set to 8 × 10⁴ steps and a total simulation time of 2.4 s. The computer configuration for the FLUENT-EDEM coupling simulation was dual E5-2686V4, with 128 G memory, and the average simulation time for each condition was about 50 h.
2.2. Fluid–Particle Coupling Model
In this study, we employed the FLUENT-EDEM coupling technique to simulate a continuous gas phase and a discrete solid phase mixing model using the Euler–Lagrangian framework. The fluid phase calculation was based on the laminar model, considering the granular phase effect in the Euler model. To perform the fluid–solid coupling analysis, we added the volume fraction term γ to the Navier–Stokes equation. The continuity and momentum equations for the particle filtration stage are presented as follows [30]:
where γ is the volume fraction; T is time, u is the velocity; ui is the velocity component of the x, y, and z directions; g is the acceleration of gravity; Ffp is the interaction force between the fluid and the particle; ρ is the density; and χ is the stress tensor.
The drag model adopted the Wen-Yu and Ergen model [31]. The Wen-Yu model is based on the standard drag function of a single particle, and the drag equation acting on the particle is defined as follows:
where D is the drag equation, and vf, vp, and mp are the gas velocity, particle velocity, and particle mass, respectively.
The Ergen drag force model is calculated based on the fixed bed pressure drop experiment, which is suitable for dense particle flow [32]. The drag force equation is defined as follows:
where Cd is the drag coefficient, Re is the Reynolds number, θf is the gas volume fraction, θp is the particle volume fraction, ρf is the gas density, rp is the particle radius, ρp is the particle density, and μf is the dynamic viscosity of the gas.
As particle size approaches the micron or sub-micron level, additional consideration must be given to the forces between particles, as well as the adhesion forces between particles and particle-fiber media. Consequently, this investigation employed the Johnson–Kendall–Roberts (JKR) adhesion contact model incorporated into the EDEM 2021 software [33]. This model takes into account the interaction between particle surface energy and the material surface, enabling an accurate portrayal of particle adhesion on the material surface.
In the JKR model, the contact force is calculated from the contact radius, surface energy, and interaction parameters [34].
where Fn,l is the contact force, E is the elastic modulus, and R1 and R2 are the particle radius. R* is the equivalent radius, E1 and E2 are the Young’s modulus, E* is the equivalent Young’s modulus, ∆γ is the surface energy, a0 is the contact radius, and e1 and e2 are the Poisson’s ratio.
3. Experimental Validation
3.1. Validation of Stacking Angle Experiment
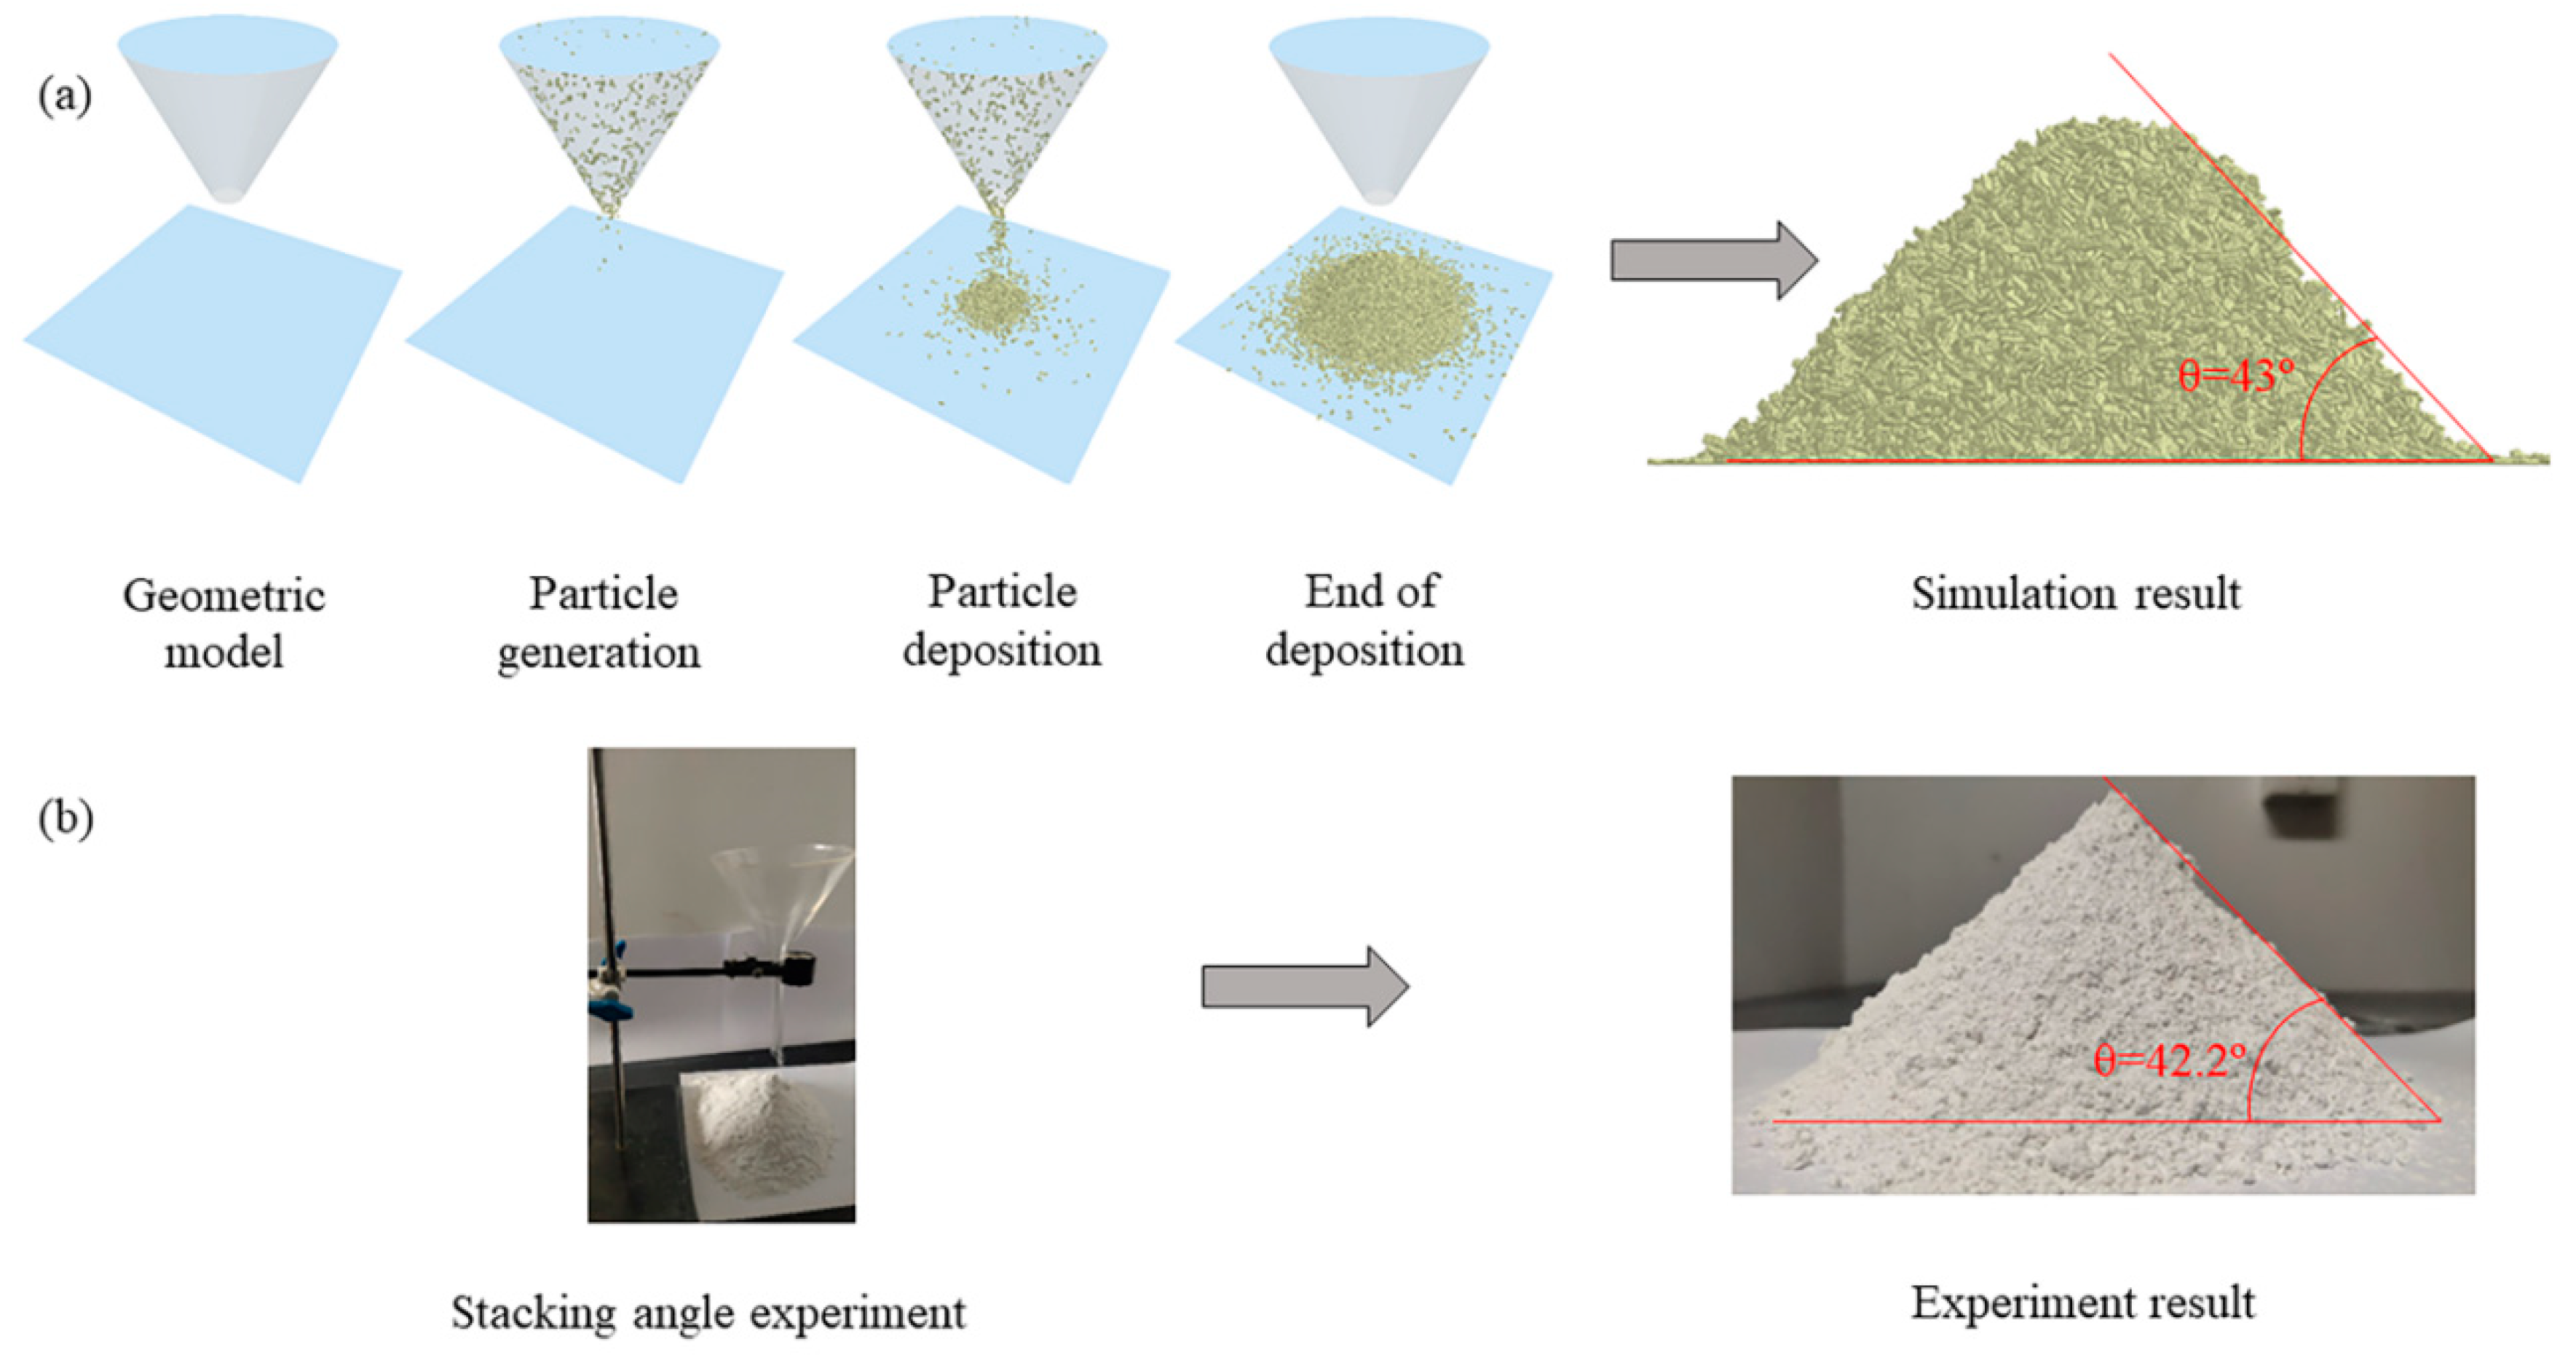
In EDEM, particle contact parameters play a crucial role in determining the actual movement state. Drawing upon the relevant literature [35,36], the selected material parameters are presented in Table 1 and Table 2. To assess the accuracy of the parameters, a stacking angle experiment was conducted and compared with experimental values. The EDEM 2021R1 software was utilized to create a geometric model consisting of a circular funnel without thickness and a bottom panel. The funnel opening diameter was set at 1 mm, the upper opening diameter at 6 mm, and the funnel height at 5 mm. The particle surface diameter was 6 mm, and the particle drop height was 8 mm. Under gravity, particles naturally fell to the plane, aggregating to form a stacking angle. The simulated stacking angle was obtained by software measurement, as shown in Figure 4. The stacking experiment employed 1250-mesh industrial-grade talc powder, with specific parameters detailed in Table 1. The bottom area injection method was used for determination. That is, the talc powder particles were naturally dropped from the funnel mouth to the plane, and then the bottom corner of the cone formed by powder was measured.

Table 1.
Material attribute parameters.
Table 2.
Particle contact parameters.

Figure 4.
Experimental validation of the stacking angle: (a) simulation, (b) experiment.
The simulation result and experimental result are shown in Figure 4. The stacking angle of the EDEM simulation is 43° (Figure 4a), and the experimental result is 42.2° (Figure 4b). The error between simulated and experimental results amounts to 1.9%. Consequently, this particle model with its specified parameters and shape demonstrates sufficient accuracy in verifying the filtration deposition process of dust particles.
3.2. Validation of Filtration Experiment
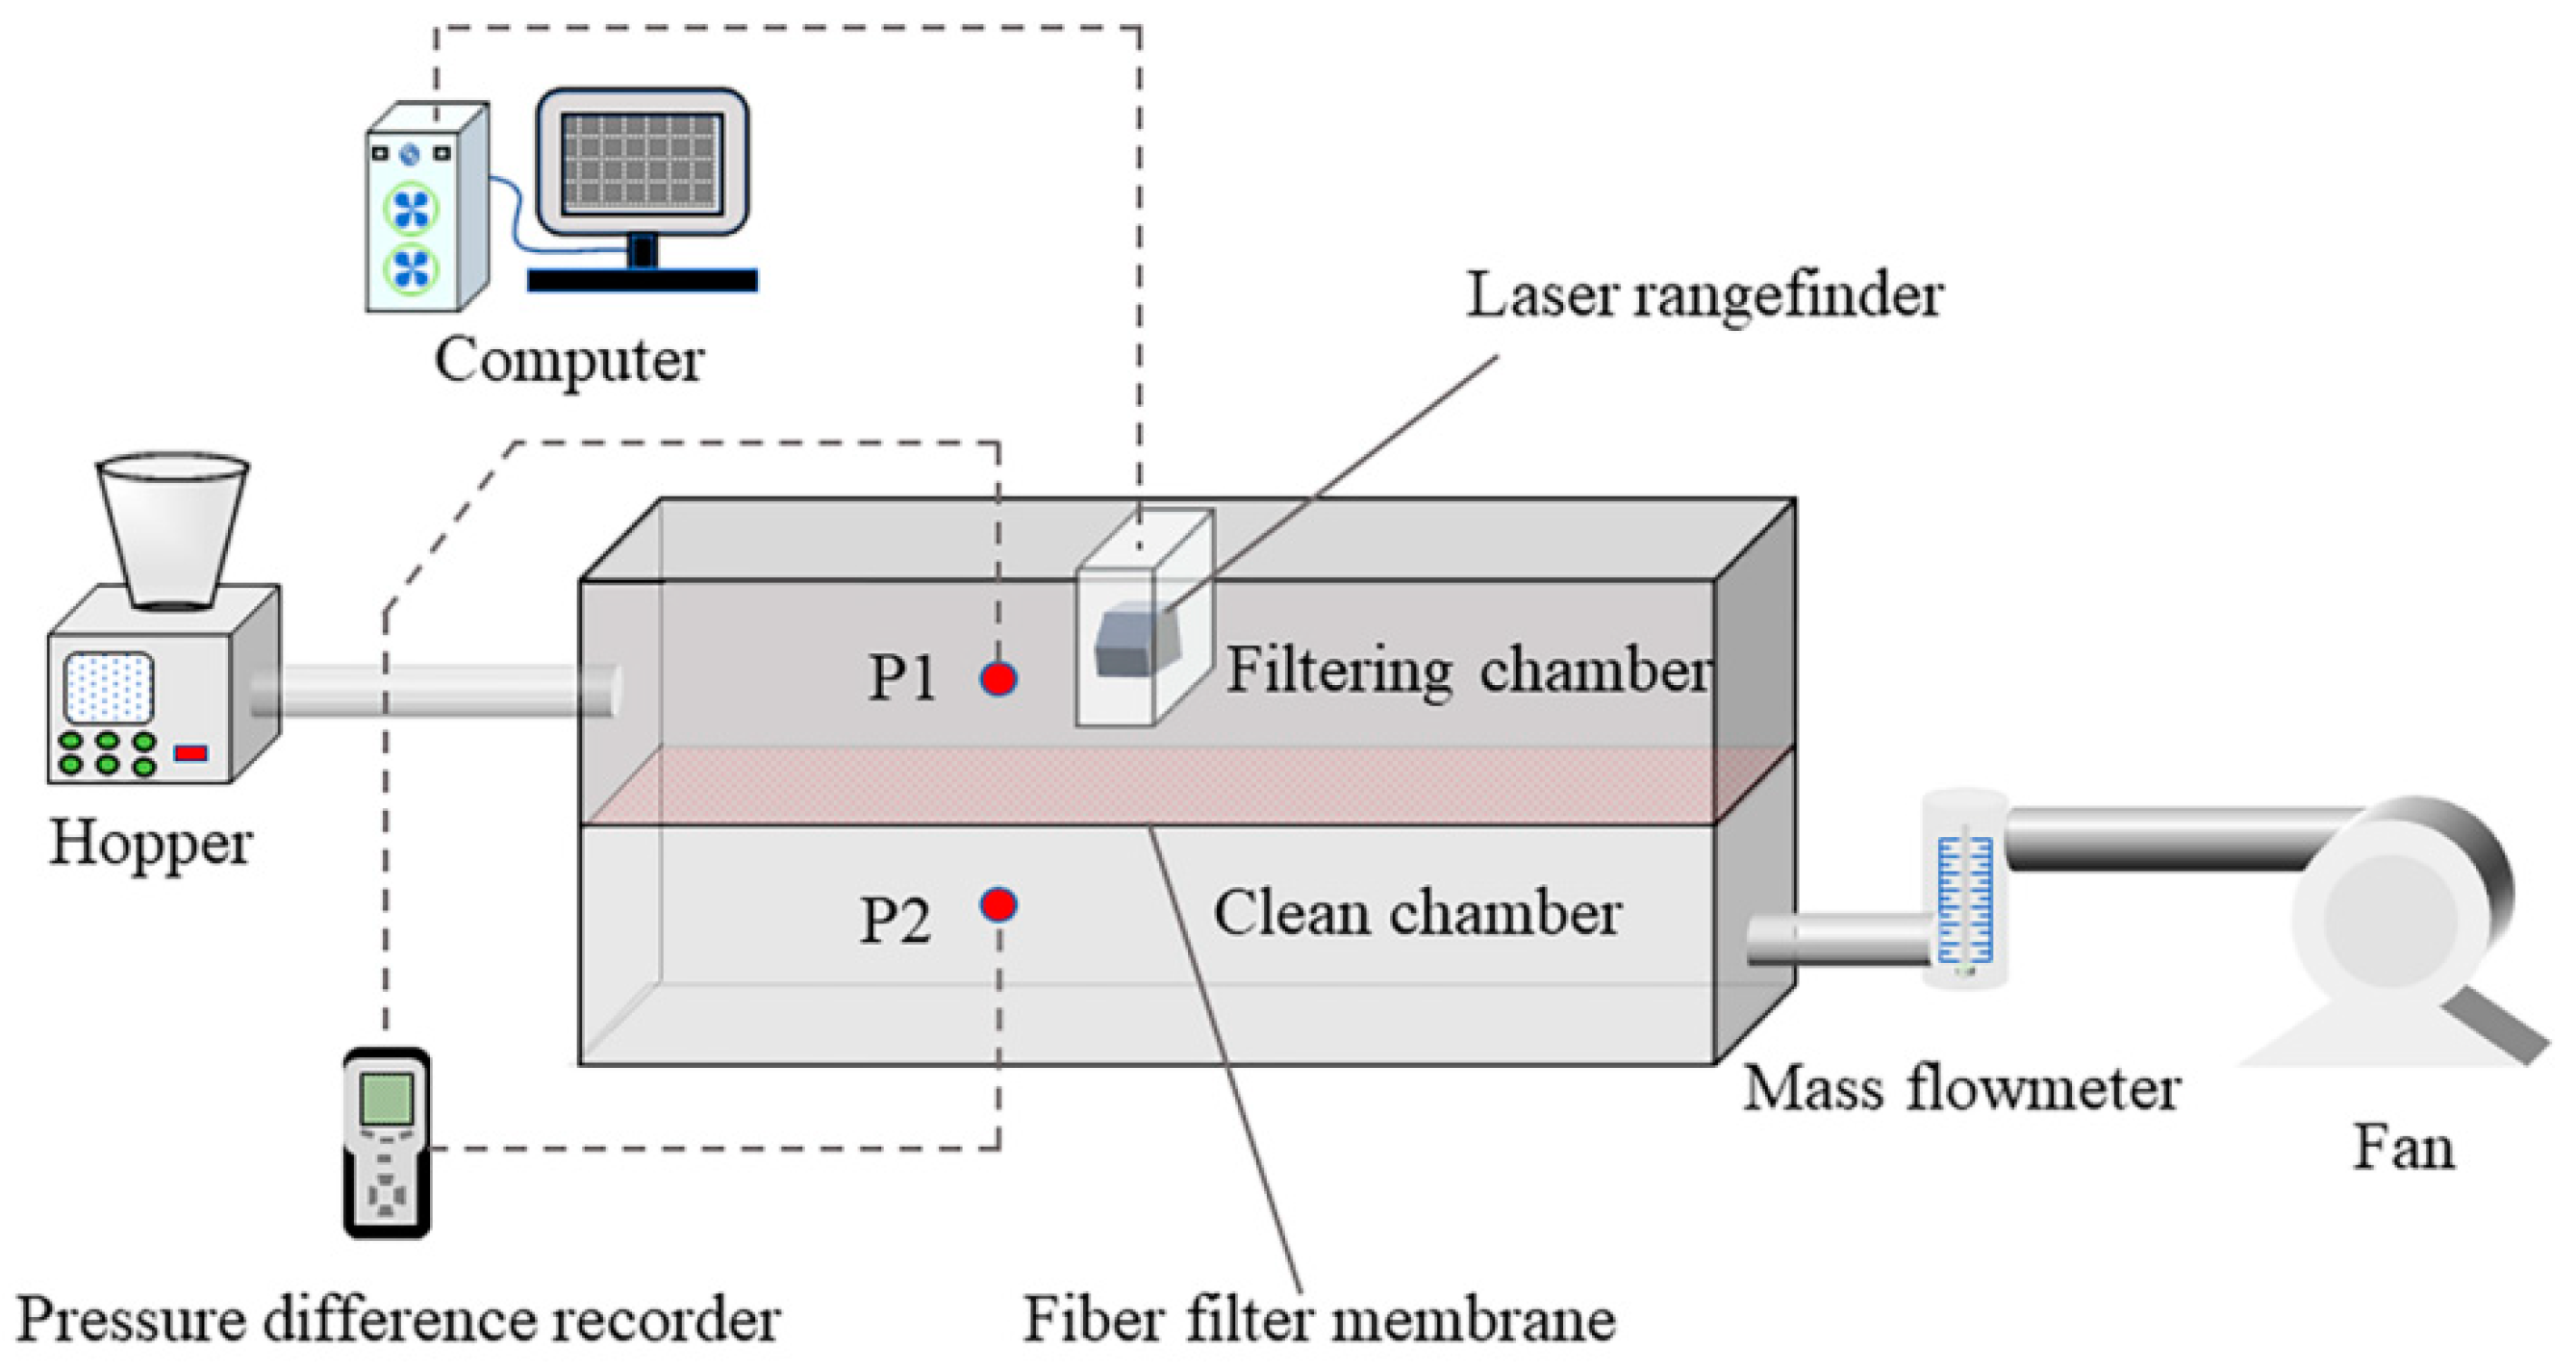
To further confirm the precision of the numerical simulation results regarding the dust particle filtration process, a filtration experimental device was developed, as shown in Figure 5. The box dimensions measure 500 mm × 100 mm × 100 mm, with the filter element dimensions being 500 mm × 100 mm and a thickness of 0.5 mm. The device was mainly divided into four sectors: hopper, filtering chamber, clean chamber, and fan. The two chambers were constructed from acrylic boards, sandwiching a metal fiber filter membrane between them. A laser rangefinder was mounted in the center of the filter chamber. Dust was introduced into the filter chamber from the hopper via the fan’s negative pressure, where it was trapped by the metal fiber filter membrane, forming a dust cake on the filter membrane’s surface. The airflow exited through the right of the clean chamber. Pressure measurement points were established in both chambers to monitor the pressure drop changes throughout the filtration process.

Figure 5.
Schematic diagram of the experimental filtering system.
The experimental testing system primarily comprised a laser rangefinder (Kistler CMOS multifunctional analog laser sensor IL-S025 probe, IL-1000 amplifier unit, DL-RS1A communication unit, and serial communication assistant software), a pressure difference recorder (DT-8920 model, capable of monitoring pressure differences within the range of 6 kPa), and a mass flowmeter (MF-5000 series).
The filtration experiment used a 5000-mesh metal filter membrane with a thickness of 0.5 mm and 1250-mesh industrial-grade talc powder, with material parameters shown in Table 1. The experimental setup had an airflow rate of 30 L/min and a filtration air velocity of 0.013 m/s.
The specific steps of the experiment were as follows:
- (1)
- Turn on the fan and adjust it to the set airflow.
- (2)
- Adjust the required airflow through the flowmeter and wait for the airflow to stabilize.
- (3)
- Turn on the laser rangefinder and pressure difference recorder, add dust to the hopper, and carry out the filtration experiment.
- (4)
- Monitor and measure the formed dust cake in real-time through the laser rangefinder, and record the pressure drop in real-time through the general pressure difference recorder.
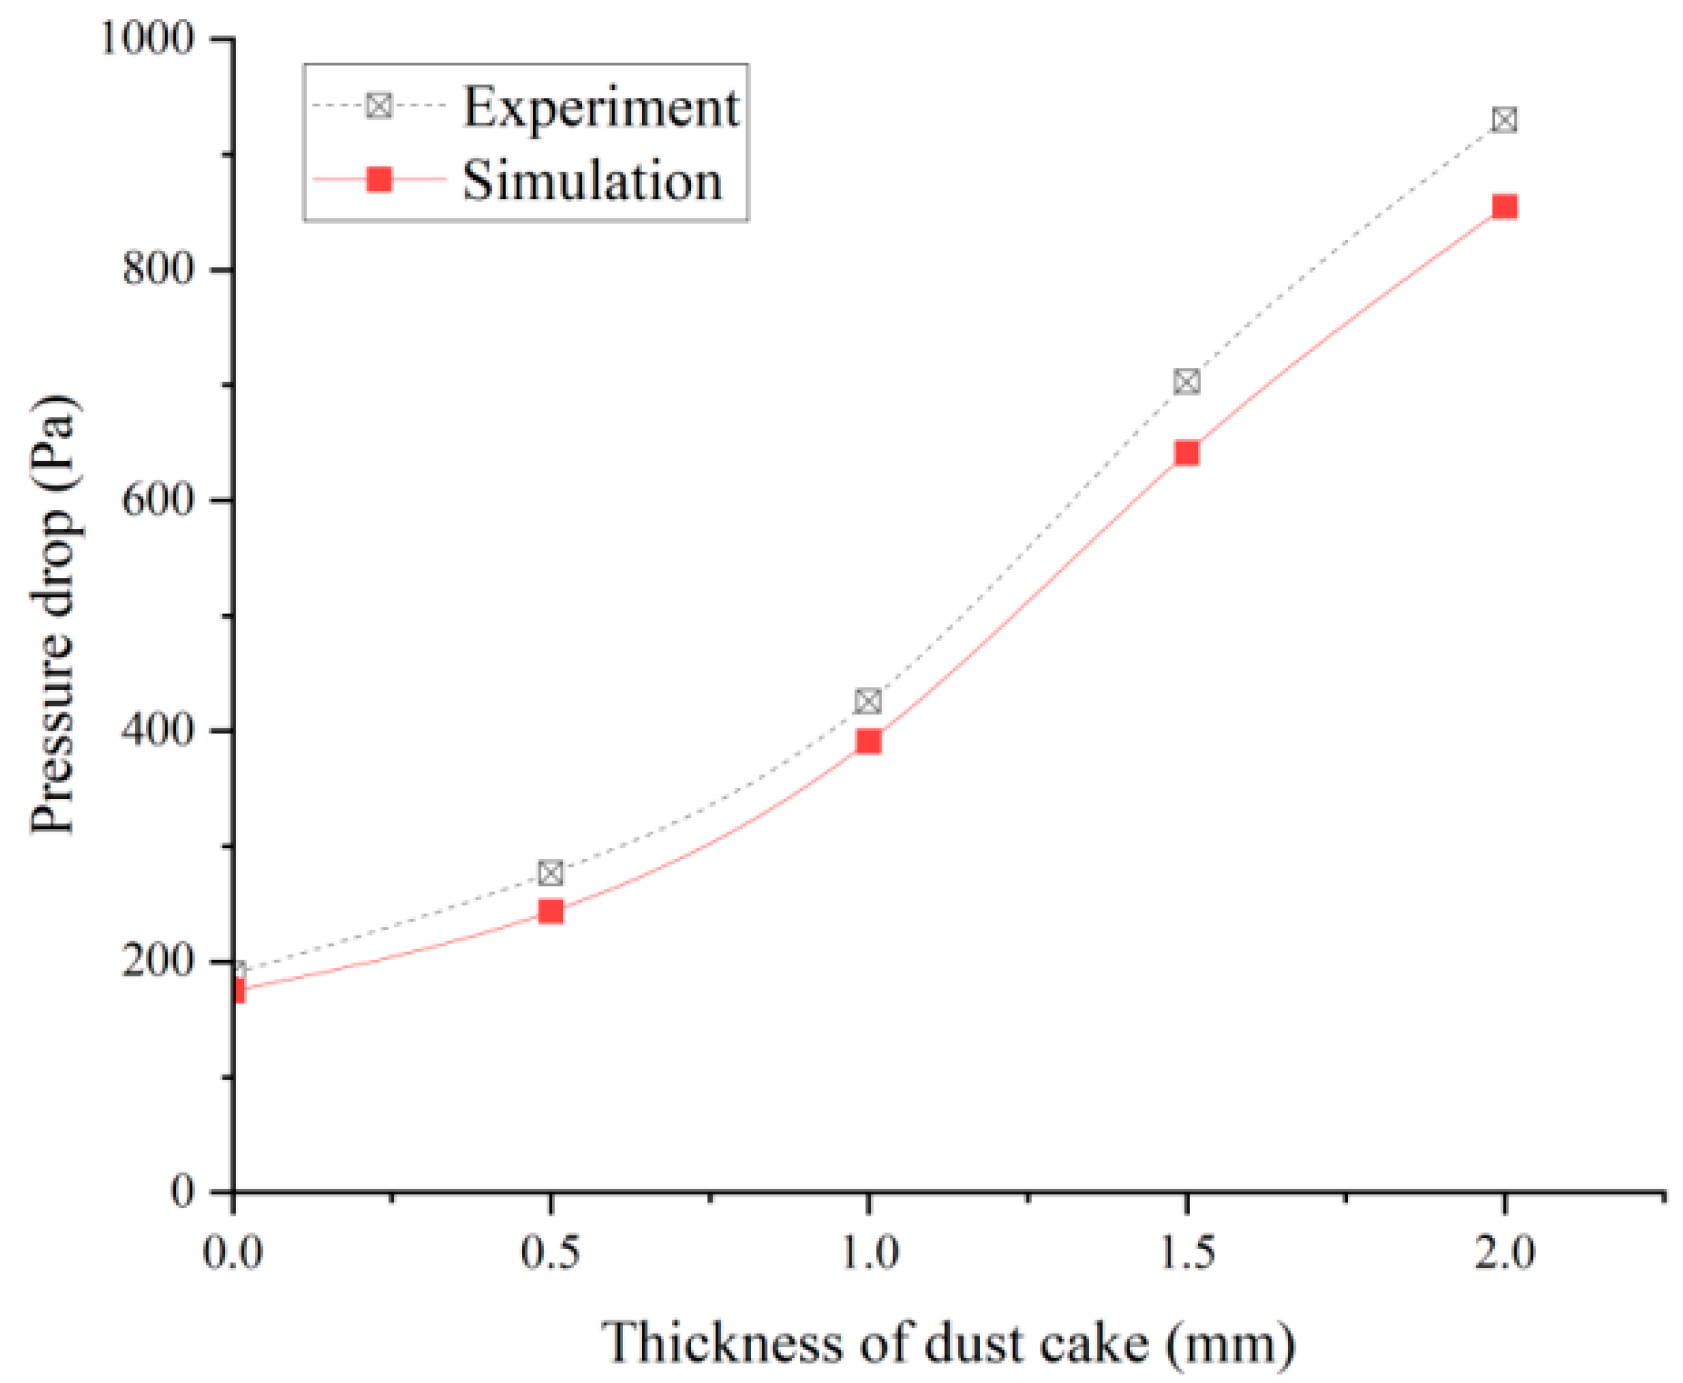
Under the conditions of a filtration air velocity of v = 0.013 m/s, a particle surface energy of E = 0.001 J/m2, and a sphericity of ψ = 0.75, the variation in pressure drop with different dust cake thicknesses, obtained from both experiments and simulations, is presented in Figure 6. The figure demonstrates that as the dust cake thickness increases, the pressure drop obtained from both experiments and simulations continues to escalate, although the experimental value remains slightly higher than the simulated one. This discrepancy may be attributed to microdeformations that occur during the production process of metal fibers, causing pore blockage. In contrast, the simulation assumes a uniformly distributed porous medium, which leads to a larger experimental value. Overall, the experimental results are largely consistent with the simulation results, suggesting that the numerical simulation results align with the actual analysis requirements. The established fluid–particle two-way coupling simulation is thus feasible and accurately reflects the particle filtration deposition process.
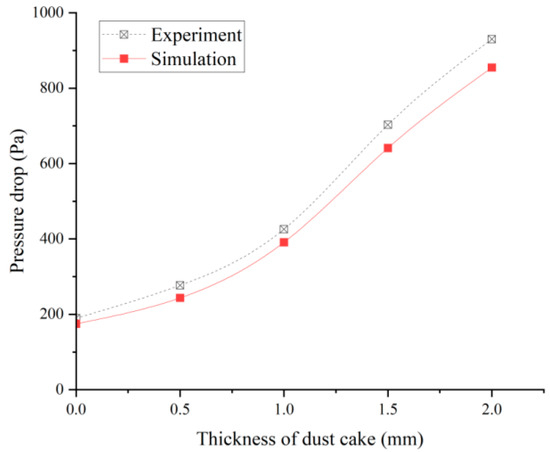
Figure 6.
Validation and comparison of filtration experimental and simulation results (v = 0.013 m/s, E = 0.0001 J/m2, ψ = 0.75).
4. Results and Discussion
4.1. Filtration Deposition Morphology of Particles under the Different Surface Energies
Due to the difference in particle surface energies, the dust cake will have different characteristics during the actual filtration process. In this study, the variation in surface energy E = 0.01~0.04 J/m2 was analyzed. Figure 7 and Figure 8 show the results of experiments carried out with a filtration air velocity of v = 0.03 m/s and a sphericity of ψ = 0.75. Figure 7 illustrates the variation in the number of particles from 0 mm to 2 mm across varied surface energy surfaces. As the thickness of the dust cake rises, the particle count increases accordingly. Notably, the quantity of particles is greatest at 0.01 J/m2 and smallest at 0.04 J/m2, especially at a dust cake thickness of 2 mm. This suggests that a higher surface energy leads to fewer dust cake particles at the same thickness.
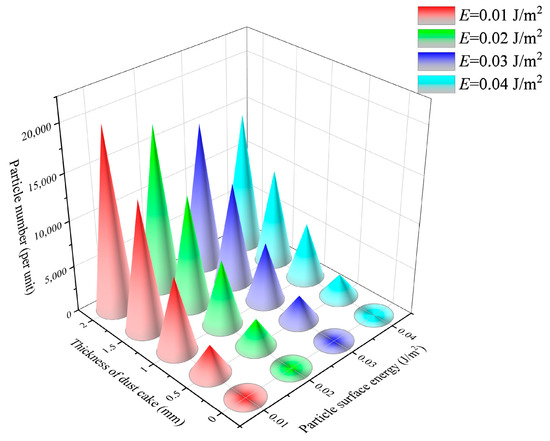
Figure 7.
Particle numbers change with the thickness of the dust cake under different surface energies.
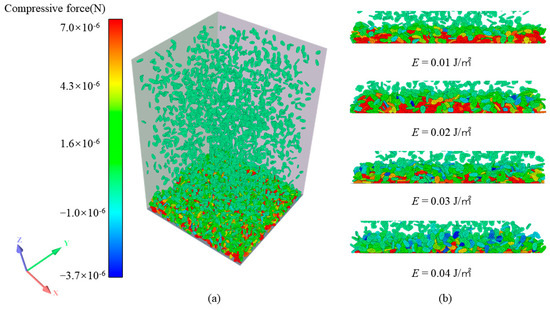
Figure 8.
Force distribution of deposited particles with different surface energies (v = 0.03 m/s, ψ = 0.75, H = 0.5 mm): (a) particle deposition. (b) particle forces at different surface energies.
Figure 8 illustrates the force distribution of deposited particles at varying surface energies. As depicted in Figure 8a, the particles’ force distribution follows the gradient of the dust cake thickness during deposition. This results in the particles being solely subjected to the airflow’s thrust while being supported by the lower part’s force, causing the velocity to drop to zero. As the particles at the rear make contact with those in front, the bottom particles continuously experience pressure, which gradually intensifies. As shown in Figure 8b, as the surface energy of the particles increases from 0.01 J/m2 to 0.04 J/m2, the number of red particles decreases while the number of green and blue particles increases, implying that the force on the lower particles gradually decreases. Surface energy mainly affects the surface wettability, i.e., the liquid bridge force, which in turn affects the inter-particle adhesive force. The increase in surface energy makes it easier for particles to bridge and adhere to each other, which is manifested by the agglomeration of particles on the surface of the filter membrane and the formation of dendritic structures by longitudinal adhesion. This increases the resistance to tangential motion and rotation between the contacting particles, resulting in the fluid trailing force being difficult to transfer along the particles to the weak links in the agglomerates so that the deformation ability of the agglomerates becomes poorer and the dendritic structure is stabilized. This structure results in an uneven distribution of particles, a looser dust cake, and increased porosity. When the surface energy is small, the dendritic structure is unstable, the airflow will disperse it, and the particles undergo structural reorganization and tend to be close to the surface of the membrane [17,37]. Consequently, the particles form dendritic structures on the filter membrane surface and require only a minimal number of particles to maintain stability.
4.2. Effects of Different Particle Surface Energies on Filtration Performance
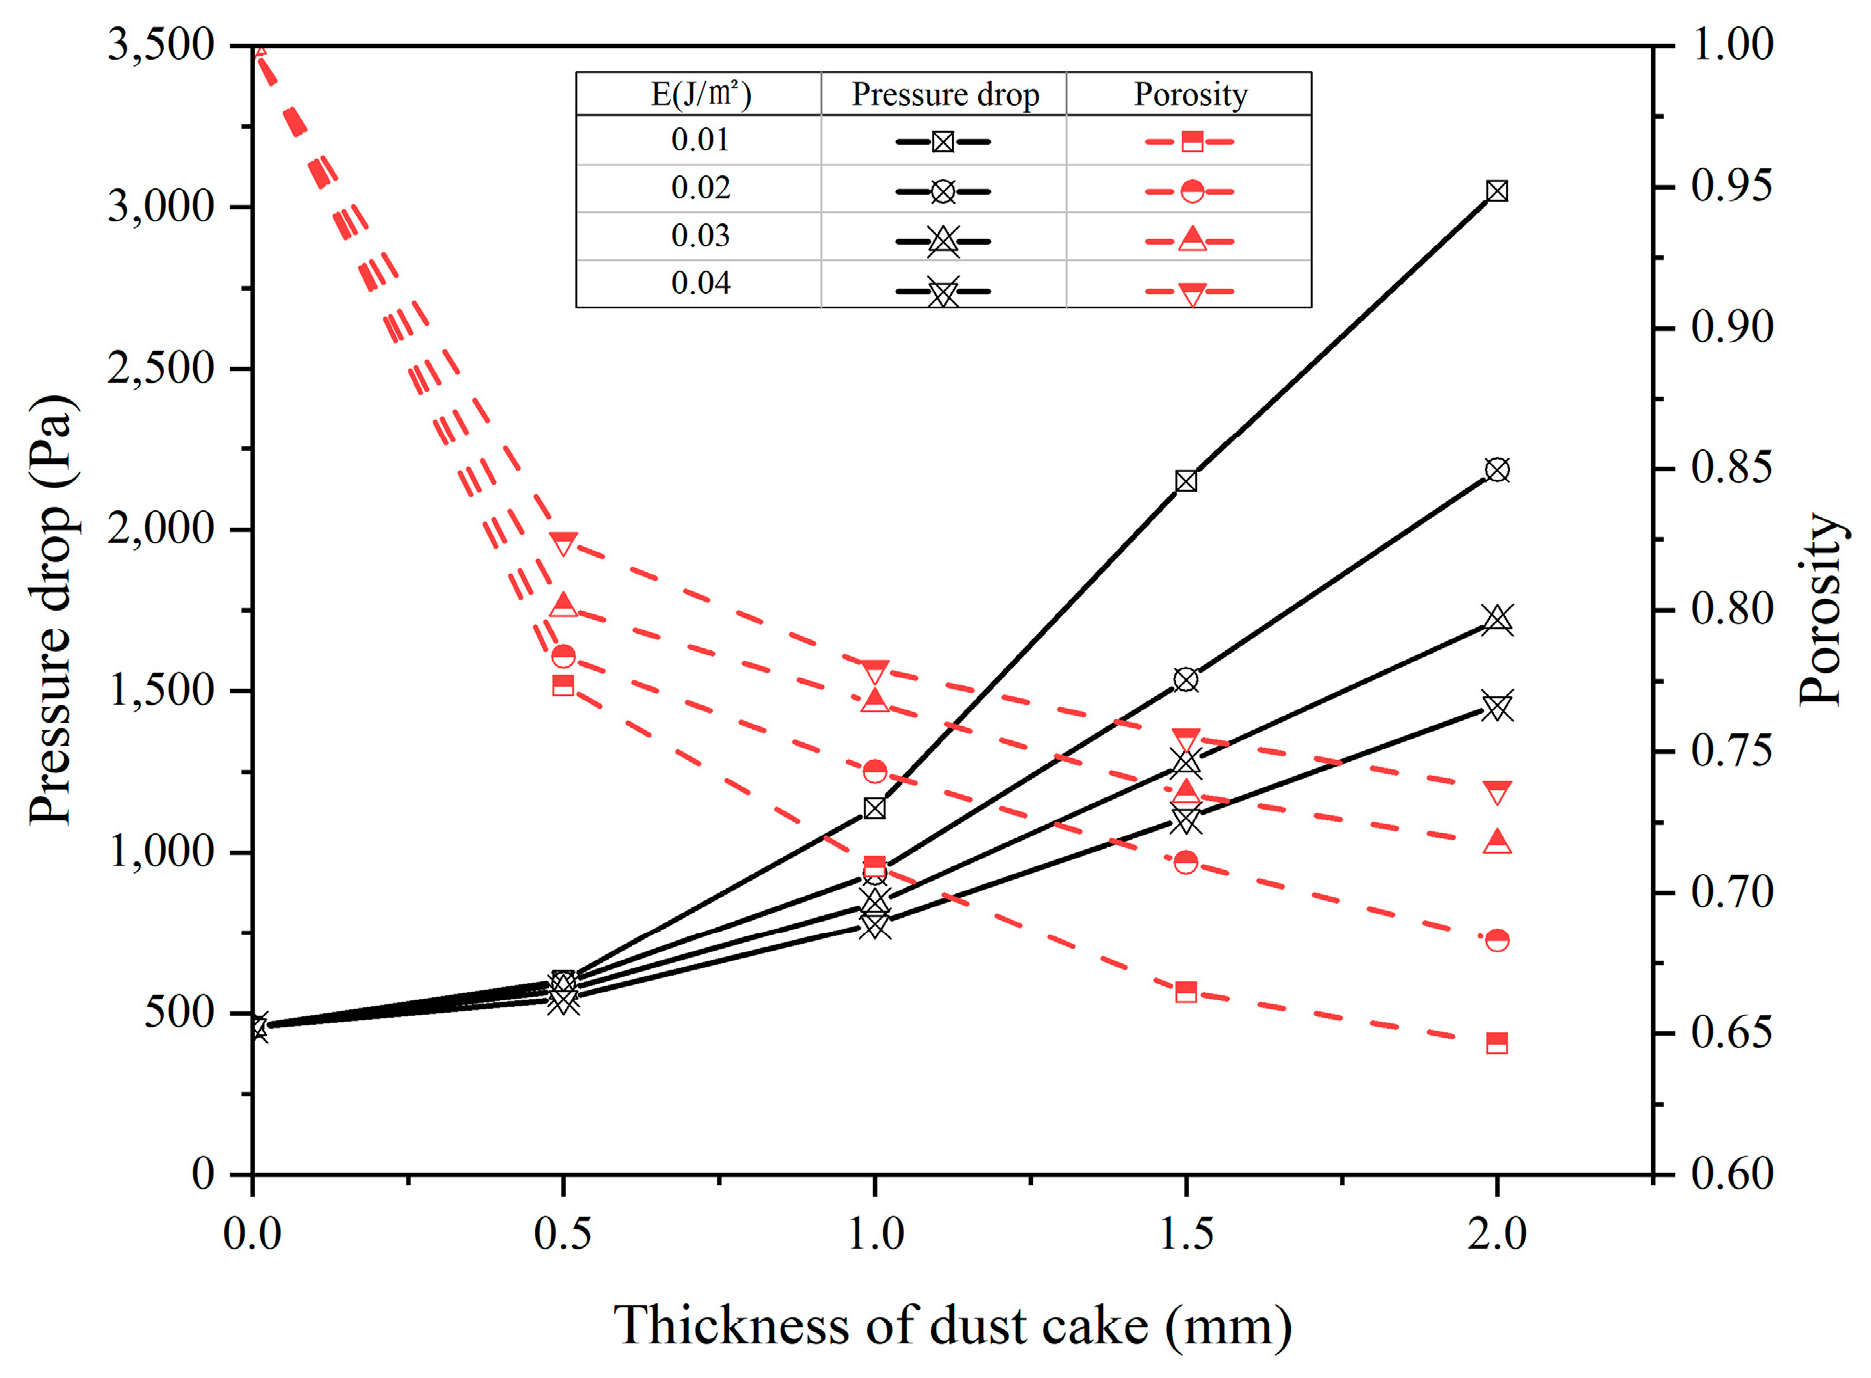
Figure 9 illustrates the effect of particle surface energy on filtration performance at a filtration air velocity of v = 0.03 m/s and a sphericity of ψ = 0.75. As shown in the diagram, when surface energy is held constant, increasing the thickness of the dust cake leads to a decrease in porosity and an increase in pressure drop. Under fixed dust cake thickness, an increase in surface energy leads to an increase in dust cake porosity, which, in turn, results in a decrease in pressure drop. When the dust cake thickness is 2 mm, the dust cake’s porosity is 64.6% and the pressure drop is 3051 Pa at E = 0.01 J/m2. Meanwhile, at E = 0.04 J/m2, the dust cake’s porosity increases to 73.7% and the pressure drop decreases to 1457 Pa. Compared to E = 0.01 J/m2, the porosity of E = 0.04 J/m2 increased by 9.1%, resulting in a 1594 Pa decrease in pressure drop.
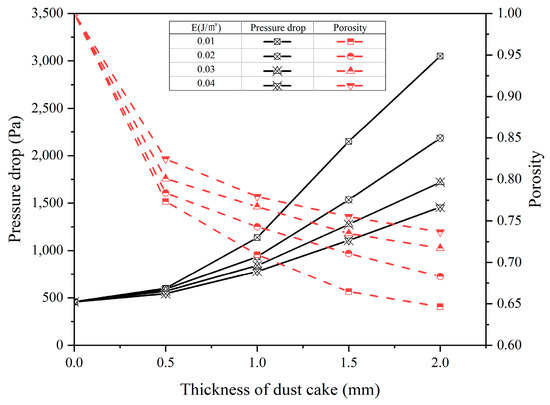
Figure 9.
Change in pressure drop and porosity with the thickness of the dust cake under different surface energies (v = 0.03 m/s, ψ = 0.75).
This suggests that heightened particle surface energy intensifies adhesion forces between particles, causing them to aggregate into a loosely packed dust cake layer under airflow pressure. The reduction in the number of particles per unit volume and the increase in porosity between particles result in a more manageable flow of air through the dust cake and, in turn, a decrease in the pressure drop during filtration.
4.3. Effects of Different Filtration Air Velocities on Filtration Performance
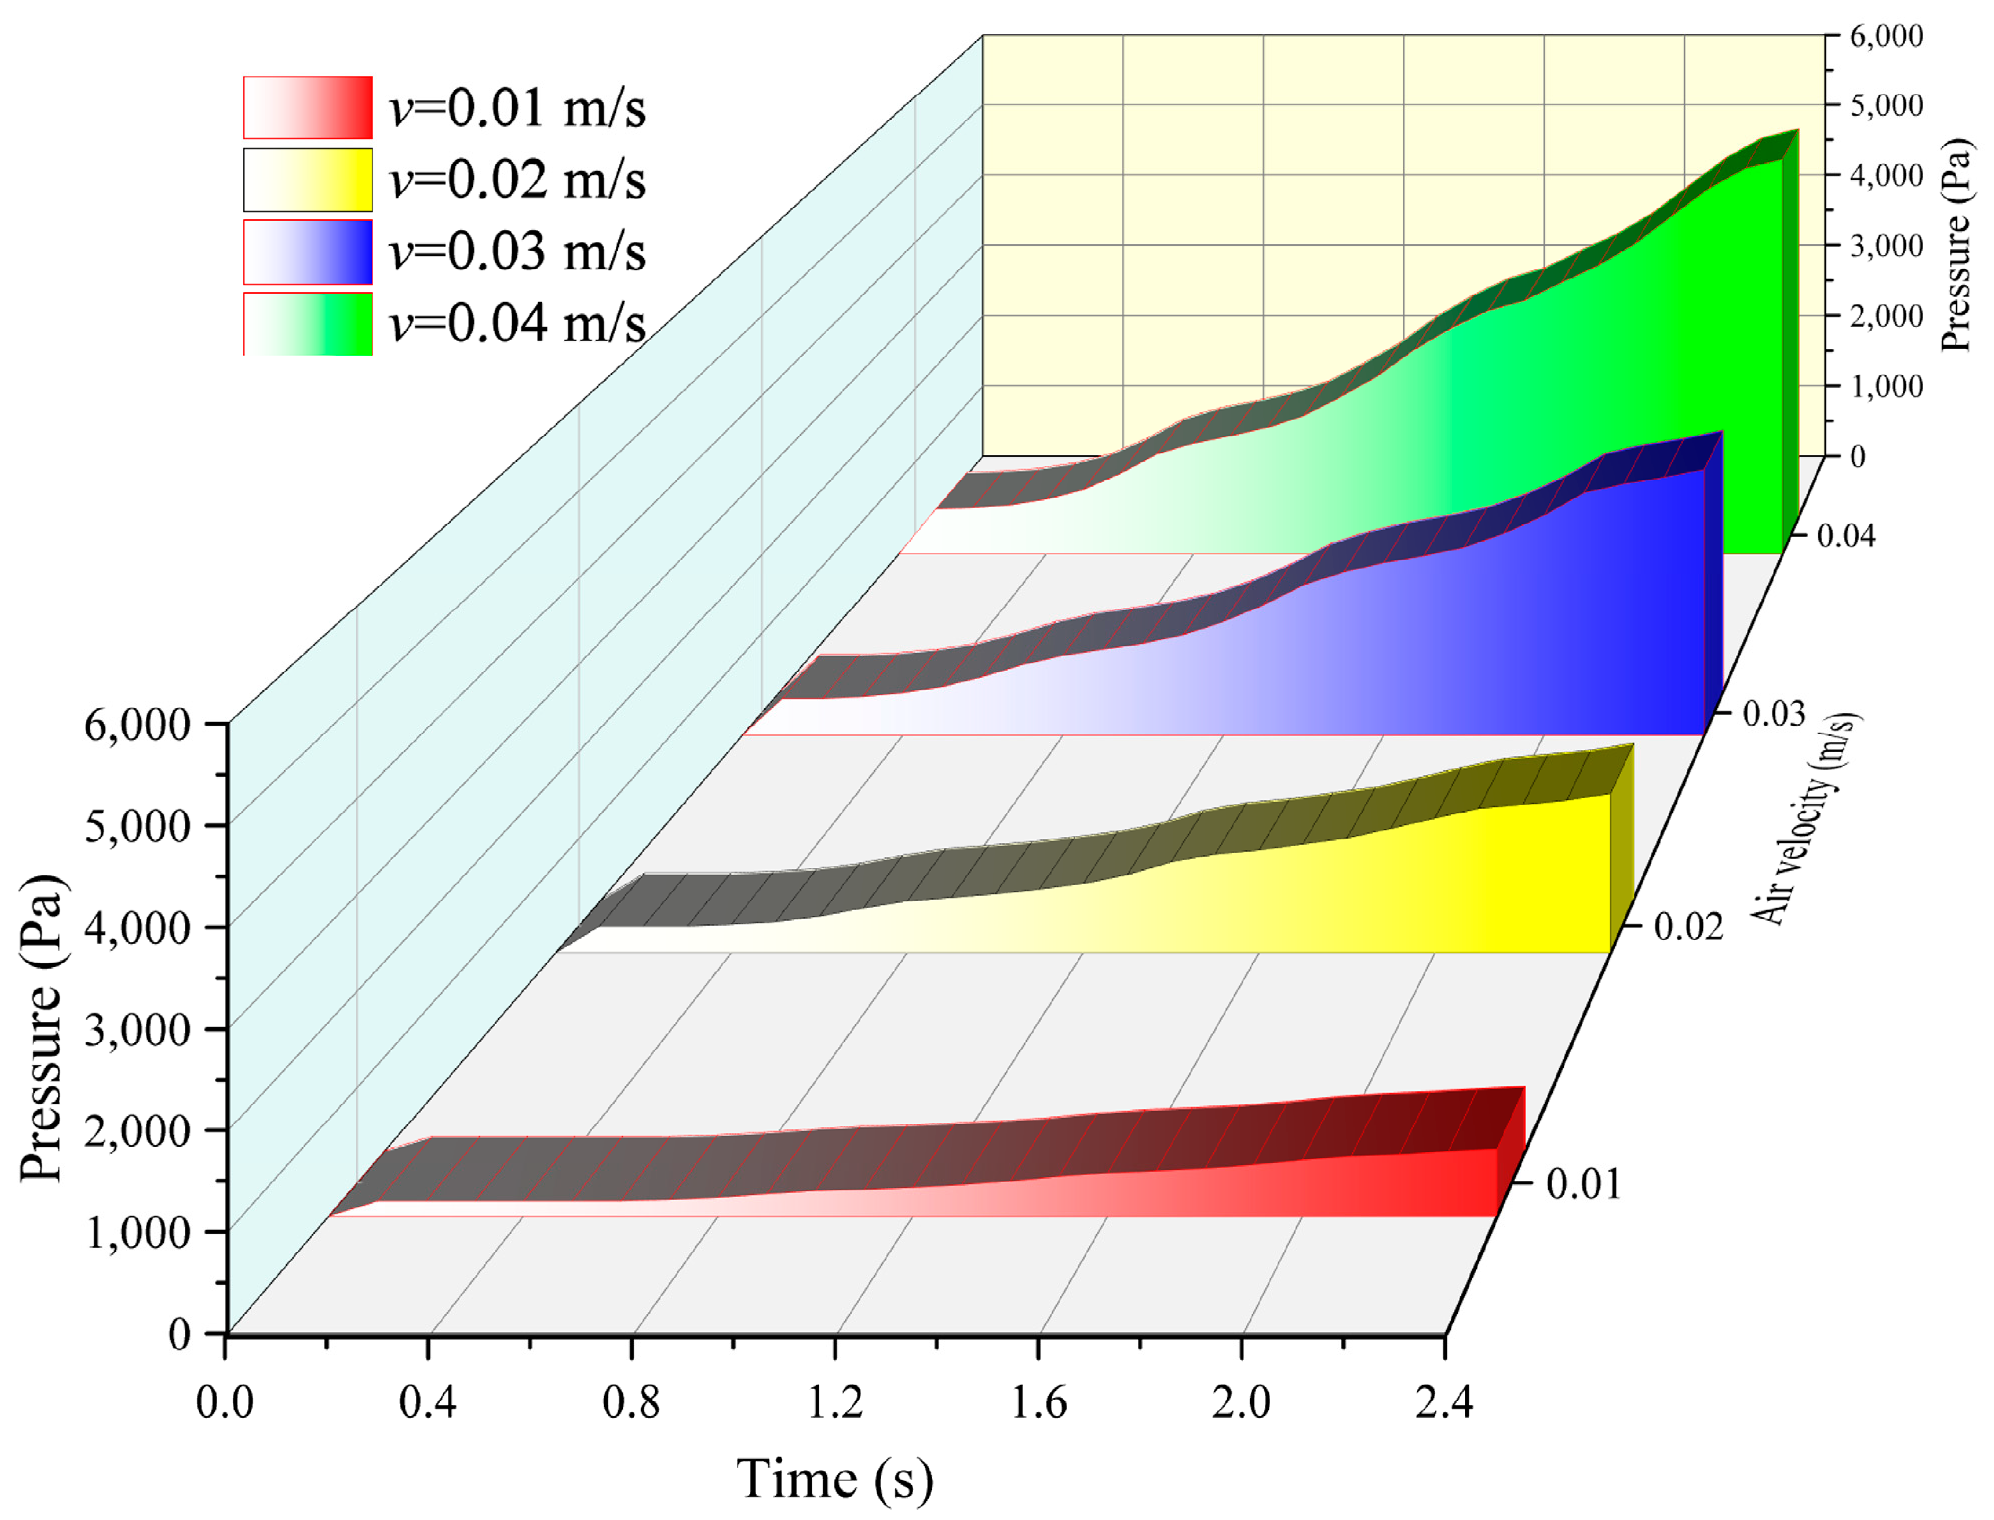
During particle filtration, the air velocity significantly impacts the system. Figure 10 and Figure 11 show the varying effects of different filtration air velocities on performance at a surface energy of E = 0.01 J/m2 and a sphericity of ψ = 0.75. Figure 10 illustrates the relationship between filtration pressure and time under diverse air velocities, revealing that an increase in air velocity results in substantial pressure changes. At the filtration time of 2.4 s, as the air velocity increased from 0.01 m/s to 0.04 m/s, the filtration pressure increased from 687 Pa to 5383 Pa, increasing by nearly seven times. Figure 11 displays the variation in filter pressure drop and dust cake porosity with dust cake thickness under the given conditions. It can be observed from the figure that in the initial stage of filtration, the filter pressure drop is relatively small due to the fewer particles deposited on the filter membrane. When the dust cake thickness reaches 1 mm, the compression and collision between particles intensify, resulting in a gradual decrease in porosity and a rapid increase in pressure drop. As the filtration air velocity increases, the number of particles intercepted by the filter membrane at the same time increases, making the dust cake more compact and reducing the porosity. Consequently, the filter pressure drop increases under the same dust cake thickness. At a dust cake thickness of 2 mm, the dust cake under v = 0.04 m/s exhibits a maximum pressure drop of 4765 Pa and a porosity of 63.2%. In contrast, the dust cake under v = 0.01 m/s presents a minimum pressure drop of 613 Pa and a porosity of 70.5%.

Figure 10.
Change in filter pressure over time at different filtration air velocities (E = 0.01 J/m2, ψ = 0.75).
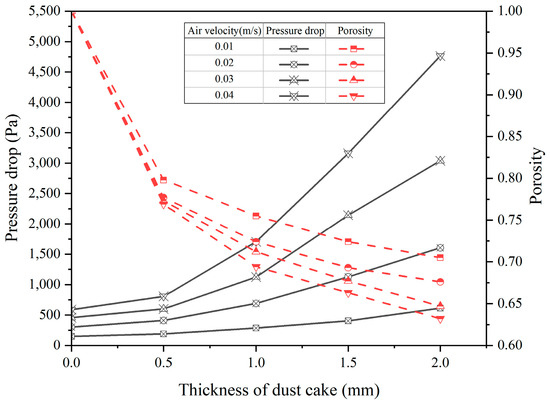
Figure 11.
Change in pressure drop and porosity with the thickness of the dust cake under different filtration air velocities (E = 0.01 J/m2, ψ = 0.75).
The result indicates that an increase in filtration air velocity leads to increased collision and compression between particles, thereby disrupting the adhesion force on the surface of sticky particles and reducing or even eliminating the dendritic structure of the dust cake layer. This, in turn, causes an increase in the number of particles within the same dust cake thickness and a decrease in the interparticle pores. Consequently, the dust cake porosity decreases, and the system filter pressure drop increases. Therefore, for sticky dust, it is essential to consider the impact of filtration air velocity on filtration resistance and select dust removal treatment under a smaller filtration air velocity.
4.4. Effects of Different Particle Sphericities on Filtration Performance
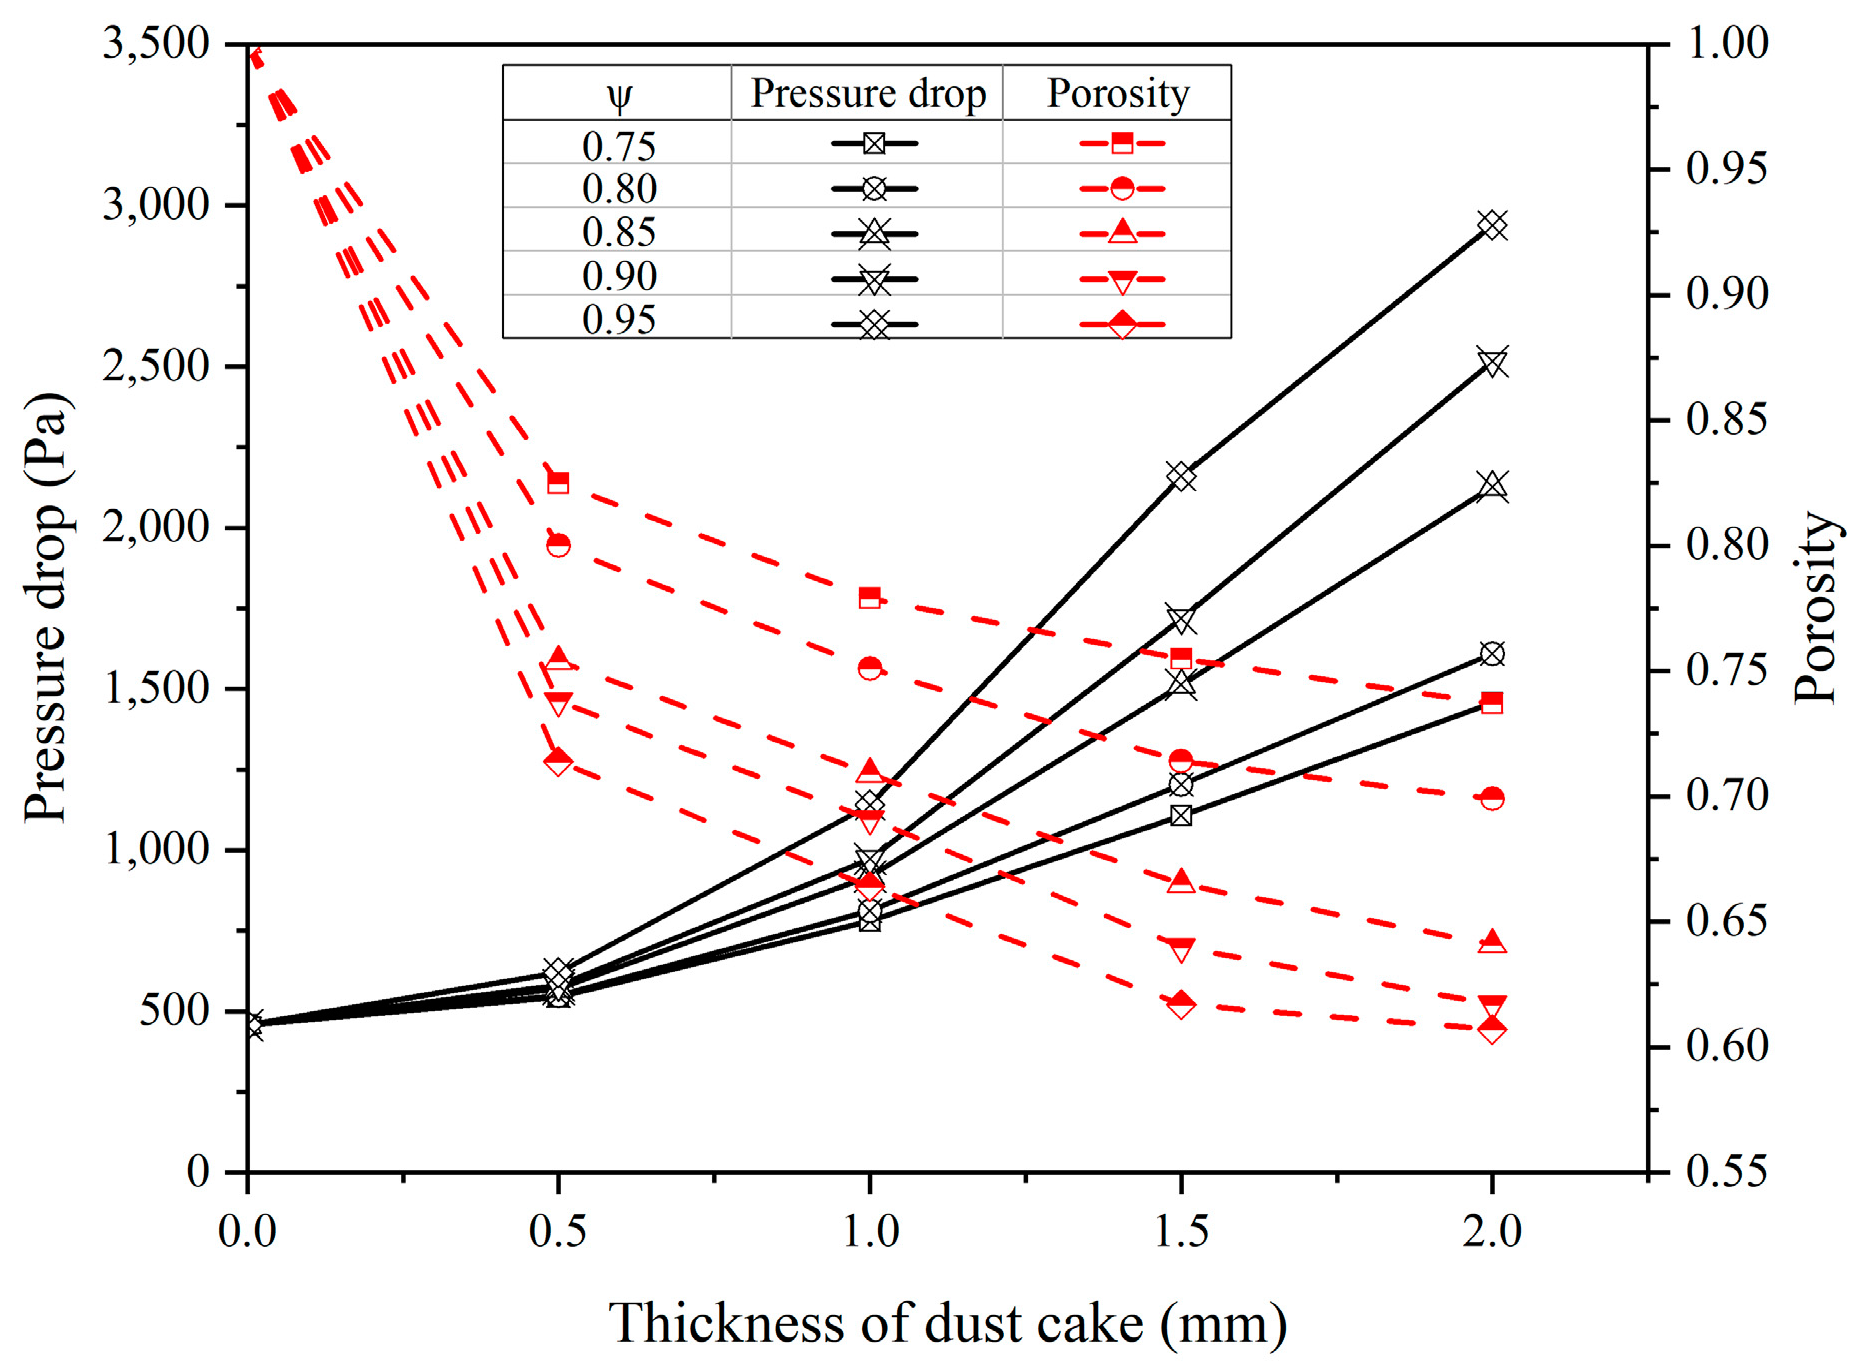
To investigate the impact of particle shape on particle filtration performance, we created particles within the sphericity range of 0.75 to 0.95, as illustrated in Figure 2. Figure 12 shows the effects of particles with different sphericity on filtration performance under the conditions of a filtration air velocity of v = 0.03 m/s and a surface energy of E = 0.04 J/m2. As the sphericity increases, the dust cake porosity decreases and the pressure drop increases. When the thickness is 2 mm, the particle with a sphericity of ψ = 0.75 has a porosity of 73.7% and a pressure drop of 1457 Pa, while the particle with ψ = 0.95 has a porosity of 60.7% and a pressure drop of 2939 Pa. Compared with ψ = 0.75, particles with ψ = 0.95 have a decreased porosity of 13% and an increased pressure drop of 1482 Pa.
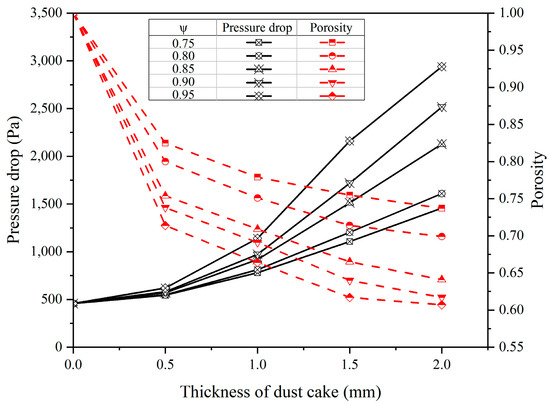
Figure 12.
Change in pressure drop and porosity with the thickness of the dust cake under different sphericities (v = 0.03 m/s, E = 0.04 J/m2).
The findings demonstrate that the angular surface of small spherical particles leads to a greater dispersion of support between particles and makes the compression of the dust cake more challenging. The results show that the surface of the particles with small sphericity is angular, which made the support between the particles greater, and the dust cake is difficult to compress. Due to the smooth surface of large particles with high sphericity, the particles rotate more easily, and under the action of airflow, the dust cake is easily compressed and its distribution is more uniform, resulting in a reduction in pore space, thus the pressure drop increases. Simultaneously, under high surface energy, the surface area of particles with low sphericity is greater at the same volume. This increases the adhesion between particles and expands the pores, leading to a decrease in system pressure drop. Therefore, for sticky dust, a larger sphericity of particles will result in a greater pressure drop, which is detrimental to filtration.
4.5. Analysis of Particle Deposition Mechanism under Different Influencing Factors
From the previous analysis of the data, it can be observed that the surface energy ranged from 0.01 J/m2 to 0.04 J/m2, the air velocity ranged from 0.01 m/s to 0.04 m/s, and the sphericity ranged from 0.75 to 0.95. In this range, the effect of air velocity is the largest, and the pressure drop at a 2 mm cake thickness increased from 613 Pa at 0.01 m/s to 4765 Pa at 0.04 m/s, an increase of 4152 Pa. The pressure drop per unit thickness increased by 2076 Pa. The surface energy effect is followed by a reduction in pressure drop at a 2 mm cake thickness from 3051 Pa at 0.01 J/m2 to 1457 Pa at 0.04 J/m2. The reduction in pressure drop per unit thickness is 797 Pa. For sphericity, the pressure drop at a 2 mm cake thickness increased from 1457 Pa at 0.75 to 2939 Pa at 0.95, an increase in pressure drop per unit thickness of 741 Pa. From a pressure drop perspective alone, air velocity has a much greater influence on particle filtration than surface energy and sphericity. In practice, however, surface energy and sphericity have a wider range than this, and expanding their range can help us to further understand their mechanisms.
The deposition mechanism of particles under different influencing factors is shown in Figure 13. When ordinary particles settle, the particles are scattered and piled up, as shown in Figure 13a. Particle surface energy affects liquid bridge forces. The degree of sphericity affects the smoothness of the particles; the lower the sphericity of the particles, the rougher their surface and the more contact points, which corresponds to an increase in the contact area of the contacting particles, thus enhancing the intermolecular van der Waals forces. The grooves on the surface of the particles can also trap moisture and increase adhesion. Air velocity affects air traction. Surface energy, sphericity, and air velocity combine to affect the motion of particles. Air traction causes the particles to move downward and the particles are intercepted and captured by the filter membrane. Subsequent intensification of particle compression decreases the porosity of the filter cake and increases the pressure drop, as shown in Figure 13d. The particles collide with each other and form dendritic structures by adhesion and agglomeration under the action of liquid bridge forces, as shown in Figure 13b. Low-sphericity particles increase the van der Waals and adhesion forces, the agglomeration of particles is more intense, and tangential movement and rotation are more difficult to carry out. This results in an increase in porosity and a decrease in pressure drop, as shown in Figure 13c. Under these three forces, the particle agglomerates reach force equilibrium and the dendritic structure stabilizes. It can help us understand the state of motion of microscopic particles and analyze which force plays a dominant role in this, which in turn guides macroscopic filtration phenomena.
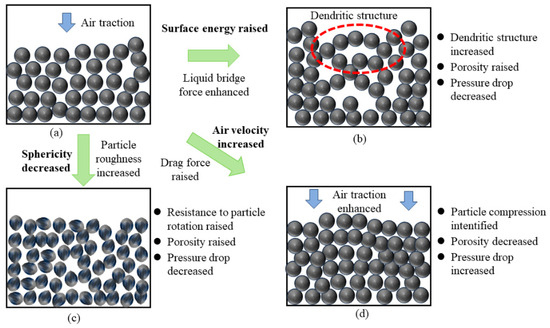
Figure 13.
Particle deposition mechanism under different influencing factors: (a) particle deposition, (b) with surface energy raised, (c) with sphericity decreased, (d) with air velocity increased.
5. Conclusions
The filtration performance of sticky dust was analyzed using the FLUENT-EDEM coupled numerical simulation technique in this study. The stacking angle experiment was used to determine the contact parameters between particles, while the filtration experiment was conducted to validate the simulation. The study investigated the impact of particle surface energy and sphericity on filtration performance, as well as analyzing particle deposition behavior. The findings are as follows:
- (1)
- As the surface energy of the particles increases, the particles agglomerate into a dendritic structure, which can effectively buffer the pressure of the airflow, so that the number of particles under the same thickness is reduced. Therefore, the porosity of the dust cake increases with the increase in particle surface energy, and the pressure drop decreases with the increase in particle surface energy. At a dust cake thickness of 2 mm, with an increase in surface energy from 0.01 J/m2 to 0.04 J/m2, the porosity increased by 9.1% and the pressure drop decreased by 1594 Pa.
- (2)
- The increase in filtration air velocity leads to greater thrust on the particles by the airflow, which destroys adhesion between the particles, causing the dust cake to deposit faster and more densely. This results in a decrease in porosity and an increase in pressure drop. The filtration air velocity v increased from 0.01 m/s to 0.04 m/s, the porosity decreased by 7.3%, and the pressure drop increased by 4152 Pa. Therefore, for the removal of sticky particles, it is advisable to choose a low air velocity.
- (3)
- As the sphericity increases, the particles become smoother and create smaller pores between them, resulting in greater resistance as airflow passes through the dust cake. Consequently, there is an increase in pressure drop. When the sphericity increased from 0.75 to 0.95, the porosity decreased by 13% and the pressure drop increased by 1482 Pa. The greater the sphericity of particles under high surface energy, the more unfavorable to filtration performance.
- (4)
- Particle surface energy, sphericity, and velocity combine to filter particles. The effect of air velocity on particle filtration is the largest in terms of pressure results; however, it is more limited in industrial applications. The range of particle surface energy and sphericity is much larger, and the combined effect of both deserves attention. Their range can be increased in the future to further improve the experiments.
Author Contributions
Conceptualization, J.L. and Q.W.; software, Q.W., D.C. and J.Z.; validation, J.L.; data curation, Q.W.; writing—original draft preparation, Q.W.; writing—review and editing, Q.W., S.H. and J.L.; supervision, Z.X., J.C. and J.L.; funding acquisition, B.Y., H.H., Z.M., D.Y., J.L. and D.W. All authors have read and agreed to the published version of the manuscript.
Funding
This work was supported by the National Natural Science Foundation of China (52064037), the Basic Research Funds of China Academy of Work Safety (2023JBKY21), the Open Fund Project of NHC Key Laboratory for Engineering Control of Dust Hazard (KLECDH2023030101), the Cultivating Project for Academic and Technical Leader of Key Discipline of Jiangxi Province (20225BCJ23027), and the Graduate Student Innovation Special Fund Project of Jiangxi Province (YC2023-S166).
Institutional Review Board Statement
Not applicable.
Informed Consent Statement
Not applicable.
Data Availability Statement
The data presented in this study are available on request from the corresponding author. The data are not publicly available due to privacy.
Conflicts of Interest
The authors declare no conflicts of interest.
References
- Li, G.; Hu, J.; Chen, S. A review of dust control/removal methods in metal mines in china. Powder Technol. 2023, 430, 119035. [Google Scholar] [CrossRef]
- Eckhoff, R.K. Fighting dust explosion hazards in the process industries. J. Loss Prev. Process Ind. 2020, 67, 104225. [Google Scholar] [CrossRef]
- Yuan, Z.; Khakzad, N.; Khan, F.; Amyotte, P. Dust explosions: A threat to the process Industries. Process Saf. Environ. Prot. 2015, 98, 57–71. [Google Scholar] [CrossRef]
- Islas, A.; Fernández, A.R.; Betegón, C.; Martínez-Pañeda, E.; Pandal, A. Biomass Dust explosions: CFD simulations and venting experiments in a 1 m3 Silo. Process Saf. Environ. Prot. 2023, 176, 1048–1062. [Google Scholar] [CrossRef]
- Sun, Y.; Kinsela, A.S.; Waite, T.D. Elucidation of alveolar macrophage cell response to coal dusts: Role of ferroptosis in pathogenesis of coal workers’ pneumoconiosis. Sci. Total Environ. 2022, 823, 153727. [Google Scholar] [CrossRef] [PubMed]
- Yang, Y.; Lu, X.; Yu, B.; Zuo, L.; Wang, L.; Lei, K.; Fan, P.; Liang, T.; Rennert, T.; Rinklebe, J. Source-specific risk judgement and environmental impact of potentially ioxic elements in fine road dust from an integrated industrial city, north China. J. Hazard. Mater. 2023, 458, 131982. [Google Scholar] [CrossRef]
- Long, Z.; Zhu, H.; Bing, H.; Tian, X.; Wang, Z.; Wang, X.; Wu, Y. Contamination, sources and health risk of heavy metals in soil and dust from different functional areas in an industrial city of panzhihua city, southwest China. J. Hazard. Mater. 2021, 420, 126638. [Google Scholar] [CrossRef] [PubMed]
- Owais, M. Location strategy for traffic emission remote sensing monitors to capture the violated emissions. J. Adv. Transp. 2019, 2019, 6520818. [Google Scholar] [CrossRef]
- Qi, H.; Wang, J.; Gu, X.; Feng, L. Research progress on agglomeration mechanisms and fluidization behavior of cohesive particles. Chin. J. Process Eng. 2019, 19, 55–63. [Google Scholar]
- Pan, S.; Ma, J.; Liu, D.; Chen, X.; Liang, C. Theoretical and experimental insight into the homogeneous expansion of wet particles in a fluidized bed. Powder Technol. 2022, 397, 117016. [Google Scholar] [CrossRef]
- Ennis, B.; Li, J.; Tardos, G.; Pfeffer, R. The influence of viscosity on the strength of an axially strained pendular liquid bridge. Chem. Eng. Sci. 1990, 45, 3071–3088. [Google Scholar] [CrossRef]
- Liu, P.; LaMarche, C.Q.; Kellogg, K.M.; Leadley, S.; Hrenya, C.M. Cohesive grains: Bridging microlevel measurements to macrolevel flow behavior via surface roughness. AIChE J. 2016, 62, 3529–3537. [Google Scholar] [CrossRef]
- LaMarche, C.Q.; Leadley, S.; Liu, P.; Kellogg, K.M.; Hrenya, C.M. Method of quantifying surface roughness for accurate adhesive force predictions. Chem. Eng. Sci. 2017, 158, 140–153. [Google Scholar] [CrossRef]
- Shi, D.; Li, J.; Du, Y.; Wu, Q.; Huang, S.; Huang, H.; Wu, D. Influence of relative humidity on the characteristics of filter cake using particle flow code simulation. Atmosphere 2022, 13, 770. [Google Scholar] [CrossRef]
- Umer, M.; Siraj, M.S. DEM studies of polydisperse wet granular flows. Powder Technol. 2018, 328, 309–317. [Google Scholar] [CrossRef]
- Zhou, G.; Low, Z.-X.; Feng, S.; Zhang, F.; Zhong, Z.; Xing, W. Effect of relative humidity and dust moisture content on filtration performance of bag filter. Sep. Purif. Technol. 2022, 308, 122952. [Google Scholar] [CrossRef]
- Xue, Z.; Qian, F.; Zhu, J.; Dong, W.; Han, Y.; Lu, J. Numerical simulation of deposition characteristics for high moisture viscous particles on the surface of polytetrafluoroethylene microporous membrane filtration materials. Chin. J. Process Eng. 2020, 20, 521–530. [Google Scholar]
- Khirouni, N.; Charvet, A.; Thomas, D.; Bémer, D. Regeneration of dust filters challenged with metallic nanoparticles: Influence of atmospheric aging. Process Saf. Environ. Prot. 2020, 138, 1–8. [Google Scholar] [CrossRef]
- Maddineni, A.K.; Das, D.; Damodaran, R.M. Air-borne particle capture by fibrous filter media under collision effect: A CFD-based approach. Sep. Purif. Technol. 2018, 193, 1–10. [Google Scholar] [CrossRef]
- Shi, X.; Xie, F.; Ji, J.; Tian, Z.; Xu, C.; Sun, A. The collision behaviors of non-spherical regular particle-wall in three-dimensional space: Experimental investigation. Powder Technol. 2024, 434, 119387. [Google Scholar] [CrossRef]
- Nie, Z.; Huang, C.; Zhao, P.; Fang, C. Influence of the interparticle friction coefficient on the mechanical behaviour of breakable granular materials with realistic shape. Adv. Powder Technol. 2023, 34, 104223. [Google Scholar] [CrossRef]
- Han, J.; Shen, K.; Guo, Y.; Xiong, H.; Lin, J. Discrete element simulations of flexible ribbon-like particles. Powder Technol. 2023, 429, 118950. [Google Scholar] [CrossRef]
- Srivastava, A.; Nigam, K.D.P.; Roy, S. Quantification of local structure of disordered packing of spherical particles. Chem. Eng. J. 2019, 377, 119771. [Google Scholar] [CrossRef]
- Lu, L.; Konan, A.; Benyahia, S. Influence of grid resolution, parcel size and drag models on bubbling fluidized bed simulation. Chem. Eng. J. 2017, 326, 627–639. [Google Scholar] [CrossRef]
- Eshraghi, H.; Amani, E.; Saffar-Avval, M. Coarse-graining algorithms for the Eulerian-Lagrangian simulation of particle-laden flows. J. Comput. Phys. 2023, 493, 112461. [Google Scholar] [CrossRef]
- Lu, L.; Gao, X.; Shahnam, M.; Rogers, W.A. Bridging particle and reactor scales in the simulation of biomass fast pyrolysis by coupling particle resolved simulation and coarse grained CFD-DEM. Chem. Eng. Sci. 2020, 216, 115471. [Google Scholar] [CrossRef]
- Jiang, Z.; Rai, K.; Tsuji, T.; Washino, K.; Tanaka, T.; Oshitani, J. Upscaled DEM-CFD model for vibrated fluidized bed based on particle-scale similarities. Adv. Powder Technol. 2020, 31, 4598–4618. [Google Scholar] [CrossRef]
- Ye, Y.; Xu, J.; Ge, W. Soft coarse-grained particle model for particle-fluid systems. Particuology. 2024, 84, 178–193. [Google Scholar] [CrossRef]
- Norouzi, H.R.; Reza, Z.; Rahmat, S.; Navid, M. Coupled Cfd-Dem Modeling: Fomulation, Implementation and Applications to Multiphase Flows; John Wiley & Sons: Chichester, UK, 2016. [Google Scholar]
- Sousani, M.; Hobbs, A.M.; Anderson, A.; Wood, R. Accelerated heat transfer simulations using coupled DEM and CFD. Powder Technol. 2019, 357, 367–376. [Google Scholar] [CrossRef]
- Ozel, A.; Gu, Y.; Milioli, C.C.; Kolehmainen, J.; Sundaresan, S. Towards filtered drag force model for non-cohesive and cohesive particle-gas flows. Phys. Fluids 2017, 29, 103308. [Google Scholar] [CrossRef]
- Khalloufi, M.; Capecelatro, J. Drag force of compressible flows past random arrays of spheres. Int. J. Multiph. Flow 2023, 165, 104496. [Google Scholar] [CrossRef]
- Hærvig, J.; Kleinhans, U.; Wieland, C.; Spliethoff, H.; Jensen, A.L.; Sørensen, K.; Condra, T.J. On the adhesive JKR contact and rolling models for reduced particle stiffness discrete element simulations. Powder Technol. 2017, 319, 472–482. [Google Scholar] [CrossRef]
- Baran, O.; DeGennaro, A.; Ramé, E.; Wilkinson, A.; Nakagawa, M.; Luding, S. DEM simulation of a schulze ring shear tester. In Proceedings of the AIP Conference Proceedings; AIP: Golden, CO, USA, 2009; pp. 409–412. [Google Scholar]
- Pedrolli, L.; Nadimi, S.; Maramizonouz, S.; Achiaga Menor, B.; López, A. Kinetic adhesion test to determine particle surface energy. HardwareX 2023, 14, e00437. [Google Scholar] [CrossRef] [PubMed]
- Moreno Baqueiro Sansao, B.; Kellar, J.J.; Cross, W.M.; Schottler, K.; Romkes, A. Comparison of surface energy and adhesion energy of surface-treated particles. Powder Technol. 2021, 384, 267–275. [Google Scholar] [CrossRef]
- Ma, X.; Wang, W.; Qiu, Y. Numerical simulation of dispersion of adhesive particulate agglomerates in the shear flow field. China Plast. Ind. 2019, 47, 45–48. [Google Scholar]


Disclaimer/Publisher’s Note: The statements, opinions and data contained in all publications are solely those of the individual author(s) and contributor(s) and not of MDPI and/or the editor(s). MDPI and/or the editor(s) disclaim responsibility for any injury to people or property resulting from any ideas, methods, instructions or products referred to in the content. |
© 2024 by the authors. Licensee MDPI, Basel, Switzerland. This article is an open access article distributed under the terms and conditions of the Creative Commons Attribution (CC BY) license (https://creativecommons.org/licenses/by/4.0/).