Abstract
A significant decrease in surface PM2.5 concentrations has been reported since the implementation of the Air Pollution Prevention and Control Action Plan in 2013. In this study, we use the GEOS-Chem model to simulate the trend in surface PM2.5 pollution in China from 2013 to 2017, as well as the relative contributions of emission reduction and meteorology. The simulated decline rate averaged over monitoring sites in China is around −4.7 μg m−3 yr−1 in comparison with the value of −6.4 μg m−3 yr−1 from observations. The model also captures the variations over different regions, with r in the range of 0.85–0.95. Based on the sensitivity tests against emissions and meteorology, the study finds that the decline in PM2.5 concentrations is mainly driven by the reduction in anthropogenic emissions. The variation in open biomass burning (OBB) is not significant, except in Northeast China (NEC) and Pearl River Delta (PRD), where the changes originated from OBB are 40% and 30% of those associated with anthropogenic emission reductions. Changes in meteorology from 2013 to 2017 led to significant increases in PM2.5 concentrations in most areas in China, except in NEC. The increase attributed to meteorology, to a large extent, could be explained by the significant decrease in surface wind speed (WS) and planetary boundary layer height (PBLH) between 2013 and 2017, combined with their negative correlation with PM2.5. The decrease in PM2.5 concentrations in NEC, on the other hand, could be explained by the significant decrease in relative humidity (RH) there combined with the positive correlation of RH with PM2.5, while the changes in WS and PBLH there are relatively small compared with other areas. The change in meteorology, therefore, hinders the improvement of air quality via emission controls in most of China. In Sichuan Basin (SCB), the increase due to meteorology almost compensates for the decrease associated with emission reduction, leading to the least change in PM2.5 concentrations, although the decrease due to emission controls is the largest compared with other areas.
1. Introduction
With accelerating urbanization and rapid population growth, China has been facing serious air pollution during the past decades, with frequent haze events generally associated with extremely high PM2.5 pollution levels. For instance, PM2.5 concentrations reached 311.2 μg m−3 in Beijing during the heavy haze cases in 2014 [1], three times more than the National Class 2 standards (75 μg m−3 for 24-h average). High PM2.5 concentrations were also reported in Nanjing (up to 292 ± 70 μg m−3) [2] and Sichuan Basin (SCB) (149 ± 72 μg m−3) [3] during the haze episodes in 2013. The high level of PM2.5 pollution diminishes visibility [4], degrades air quality [5], and consequently results in adverse health effects [4,6,7]. In addition, PM2.5 pollution can also change the earth–atmosphere radiative balance by directly scattering/absorbing solar radiation or indirectly altering cloud microphysical properties. The estimated radiative forcing of PM2.5 under clear sky over China is −15.7 ± 9.0 W m−2 at the surface and 16.0 ± 9.2 W m−2 inside the atmospheric column [8]. These values indicate the significant amount of solar radiation trapped inside the atmosphere by aerosols, leading to the heating of the atmosphere. Additionally, the value of direct radiative forcing in the atmosphere in China is much larger than the global average value of 3.01 W m−2 [9].
In order to improve air quality and protect public health, the Chinese government promulgated the Air Pollution Prevention and Control Action Plan in 2013 (http://www.gov.cn/zwgk/2013-09/12/content_2486773.htm, accessed on 20 June 2024). Significant decreases in PM2.5 concentrations have been observed since then. Zhang et al. estimated a 32% reduction in the national population-weighted annual mean PM2.5 concentrations from 2013 (61.8 µg m−3) to 2017 (42.0 µg m−3) [10]. Since the abatement measures target different emission sources and pollutants, the emission reduction varies among regions and chemical species, leading to significant variations in the magnitude of the PM2.5 decrease across different regions in China. For example, studies reported that the Beijing–Tianjin–Hebei (BTH) area witnessed the largest reduction of 39.10% in PM2.5 concentrations from 2013 to 2017, followed by the Yangtze River Delta (YRD) and Pearl River Delta (PRD) areas with reductions of 33.97% and 26.37%, respectively [11,12]. The reduction is even more significant in megacities during similar periods, e.g., 54% reduction in Wuhan city [13] and 46% in Hangzhou city [14].
In addition to emission control, meteorological conditions also play a key role in affecting ambient air pollution. Stagnant air conditions associated with high relative humidity generally favor the formation of haze events [15]. However, it is still controversial whether the meteorological conditions during the past decade promote or hinder the alleviation of air pollution associated with emission control measures. A study by Zhai et al. [16] reported that changes in meteorology led to a decrease of 12% in PM2.5 from 2013 to 2018 averaged in China, with 14% decrease in BTH, 19% decrease in PRD, 27% in SCB, and 25% decrease in Xi’an. Similarly, a study by Feng found that lower air stagnation intensity during 2013–2018 contributed to the improved air quality in North China [17]. In contrast, a slight increase in PM2.5 concentrations from 2013 to 2017 was observed in Ningxia and Shaanxi, which was attributed to the change in meteorological conditions [18]. Similarly, Li et al. reported an increase of 23% in PM2.5 concentrations in the Taklimakan Desert Region due to prevailing wind directions that caused sand activities [14].
Additionally, meteorological conditions exert a crucial influence on the occurrence of open biomass burning. The combination of drought and high temperatures significantly increases the likelihood of fires [19,20]. For instance, a 1-degree increase in the monthly average of maximum daily temperatures in the Brazilian Amazon leads to a 30% increase in fire counts [21]. Similarly, an approximate 1-degree increase in statewide temperature and a 30% decrease in precipitation led to an overall increase of 20% in the Fire Weather Index during autumn in California [22]. However, few studies have investigated the change in open biomass burning emissions and its impact on PM2.5 pollution in China.
In this study, we use the chemical transport model GEOS-Chem to simulate the temporal and spatial variations of PM2.5 pollution from 2013 to 2017 in China, with a special focus on regional differences. The aim of this study is to (1) comprehensively assess the trends in PM2.5 pollution over different regions in China; (2) investigate the relative impacts of emission reduction as well as interannual variation of open biomass burning (OBB) and meteorology on the trends in PM2.5 pollutions in China; and (3) explore regional differences in the dominant factors contributing to the variations in PM2.5 pollution trends in China.
2. Data and Model Description
We use the chemical transport model GEOS-Chem (version 12.0.0, http://www.geos-chem.org, accessed on 20 June 2024) to simulate PM2.5 over China from 2013–2017. The GEOS-Chem model is driven by the assimilated meteorological field GEOS-FP, of which meteorological data include the planetary boundary layer height (PBLH), temperature, wind speed, precipitation, relative humidity (RH), etc. The simulation in our study is conducted in a nested grid with a native horizontal resolution of 0.25° × 0.3125° (latitude × longitude) and 47 vertical levels over East Asia (70°–140° E, 15°–55° N). The boundary conditions are provided by a global simulation with a horizontal resolution of 2° × 2.5°. The simulation consists of a detailed representation of coupled O3-NOx-VOCs-aerosol chemistry [23,24] and cloud heterogeneous chemistry [25]. Simulated aerosols include inorganic aerosols (SO42−-NO3−-NH4+), organic aerosols, black carbon, sea salt, and dust [26,27,28,29,30].
Anthropogenic emissions used in the study are from the 2010 Asian mixed emissions inventory, overwritten by the Multi-resolution Emission Inventory of China (MEIC) over mainland China (http://www.meicmodel.org/, accessed on 20 June 2024) [31,32]. The latter includes monthly emissions from industry, power, agriculture, residential, and transport sectors for the years 2013–2017. Open biomass burning (OBB) emissions are from Quick Fire Emissions Datasets (QFED-v2.4) [33] with a horizontal resolution of 0.1° × 0.1° and a time resolution of 1 day. The biogenic volatile organic compound (BVOC) emissions are from the Model of Emissions of Gases and Aerosols from Nature (MEGAN2.1) [34].
We conducted a series of simulation cases to investigate the relative contributions of anthropogenic emissions, OBB, and meteorological conditions to the changes in surface PM2.5 in China. The detailed model setup for each case is listed in Table 1. The Base case is simulated from 2013 to 2017 with the emissions mentioned above, which represents the variation of PM2.5 driven by the combined effects of the changes in emissions and meteorological fields. The S1 case is only conducted for the year 2017, but with both anthropogenic and OBB emissions for the year 2013 instead of 2017. The difference between the Base case for the year 2013 and the S1 case could indicate the impact of changes in meteorological parameters between 2013 and 2017, while the difference between the Base case for the year 2017 and the S1 case represents the impact of the changes in anthropogenic and OBB emissions from 2013 to 2017. The S2 case is similar to the S1 case but uses anthropogenic emissions in 2017. The difference between the Base and the S2 case for the year 2017 thus reflects the impact of the changes in OBB emissions from 2013 to 2017.

Table 1.
GEOS-Chem model setup for different simulation cases.
The study focuses on the PM2.5 trends and associated driving factors in seven major regions in China: Northeast China (NEC, 41°–48° N & 123°–128° E), BTH (37°–41° N & 114°–118° E), Guanzhong Plain (GZP, 33.5°–35.5° N & 107.5°–111° E), SCB (28.5°–31.5° N & 103.5°–107° E), YRD (30°–33° N & 118°–122° E), Central China (CC, 27°–31° N & 111°–116° E), and PRD (21.5°–24° N & 112°–115.5° E) (areas are marked as black rectangles in Figure 1). In addition, we simply divide China into two regions: eastern China (EC) with longitudes ≥ 103 ° and western China (WC) with longitudes < 103°. The latter mainly includes Xinjiang, Tibet, Qinghai, and parts of Inner Mongolia, Gansu, Sichuan, and Yunnan.
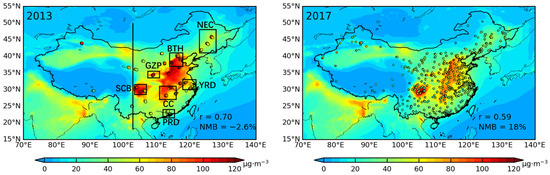
Figure 1.
The spatial distribution of observed and simulated annual PM2.5 mass concentrations in the years 2013 and 2017. The correlation coefficients (r) and normalized mean bias (NMB) are inset. The areas defined for NEC, BTH, GZP, YRD, SCB, CC, and PRD are also marked by rectangles. The black vertical line represents the dividing line between eastern and western China.
In this study, we also use ground-level hourly data of PM2.5 published by the China National Environmental Monitoring Center (CNEMC, https://quotsoft.net/air/, accessed on 20 June 2024) to evaluate the model performance of the PM2.5 simulation. The network was launched in 2013 as part of the Clean Air Action Plan and had about 280 sites at the beginning, which gradually increased to more than 1600 sites across China in 2017. Only sites with more than 90% valid data are included in the comparison. After all, data at 264–334 sites in China are used in the comparison, of which 15–57 are in BTH, 19–66 in SCB, 24–103 in YRD, 18–66 in PRD, 23–108 in CC, 13–27 in GZP, and 30–82 in NEP (also marked as dots in Figure 1). The ranges represent the increase in the number of sites from 2013 to 2017. The observed PM2.5 is averaged over the model grid to match the simulated PM2.5. In order to focus on the synoptic-scale variability and to access the comparison between observed and simulated PM2.5 time series, the model data are deseasonalized and detrended on the 0.25° × 0.3125° grid. The deseasonalized and detrended monthly PM2.5 data are obtained by subtracting the 50-day moving average from the daily mean PM2.5 [16,35].
3. Results
3.1. Simulated Trends in PM2.5 Concentrations in Comparison with Observations
Figure 1 shows the spatial distributions of observed and simulated annual mean PM2.5 concentrations in 2013 and 2017. Both observations and simulated results show a sharp contrast between eastern and western China, with high concentrations in eastern China, especially over the BTH, SCB, GZP, and CC regions. This could be expected from the high level of urbanization as well as the large number of industries and manufacturing facilities in those areas. The correlation coefficient (r) between the observed and simulated PM2.5 is 0.70 for 2013 and 0.59 for 2017. The normalized mean bias (, where Mi and Oi represent simulated and observed PM2.5 concentrations, respectively, at site i) [36] is negligible in 2013 at around −3% but slightly higher in 2017 with a value of 18%. It should be noted that the changes in r and NMB between 2013 and 2017 are mainly attributed to the increase in the number of monitoring sites from 2013 to 2017, while the model performance is quite similar between the two years. Overall, the model well simulates the PM2.5 concentrations in most of eastern China but underestimates those in western China. The underestimation in western China is more obvious in 2017, as more monitoring sites were available there in 2017. Likewise, due to the scarcity of monitoring sites in western China in the early years, the contrast in PM2.5 concentrations between 2013 and 2017 is not available from observations. Therefore, we focus on the evaluation of the model performance in eastern China, with special attention to the interannual variations.
Figure 2 shows the time series of observed and simulated monthly PM2.5 concentrations averaged in China and the seven major regions. The observed data show obvious seasonality in all regions, peaking in winter with monthly concentrations reaching more than 200 μg m−3 in January in the GZP area. Significant decline trends are also observed in all regions, with decreasing rates ranging from −3.6 μg m−3 yr−1 in PRD to −9.0 μg m−3 yr−1 in BTH, and a mean value of −6.4 μg m−3 yr−1 averaged in China. The largest reduction observed in the BTH area could be anticipated, as it is one of the target regions for reducing air pollution in the 2013 Clean Air Action [37]. The minimal decline rate in PRD is partly due to its relatively clean condition compared with the other six regions. The monthly PM2.5 concentrations in PRD are, in general, below 80 μg m−3, while in other regions, they are above 100 μg m−3. Indeed, the more recent plan released in July 2018 has removed PRD from the list of target regions but added GZP [38]. While most regions show continuous decrease rates, the time series in the GZP shows a sharp decrease from 2013 to 2015 but a rebound from 2015 to 2017. Zhai et al. reported similar PM2.5 trends in Xi’an, a major city in GZP, and attributed the rebound to the influence of meteorology [16]. However, due to the sharp decrease during 2013–2015, the overall decline rate in GZP is still significant, with a value of −7.5 μg m−3 yr−1, only after BTH and CC (−8.1 μg m−3 yr−1).
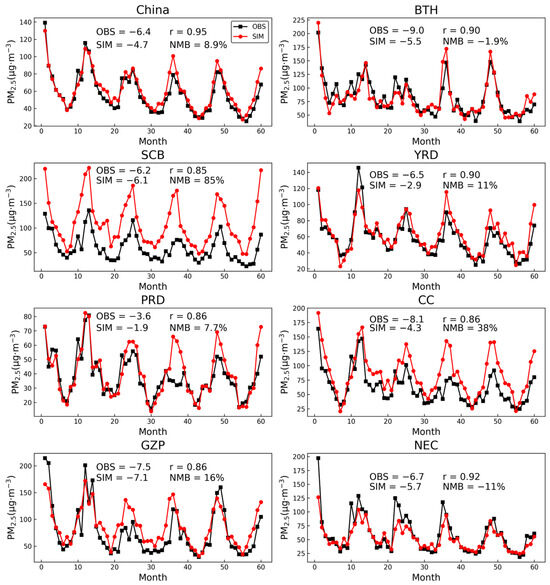
Figure 2.
Time series of observed and simulated monthly mean PM2.5 concentrations averaged in China and its 7 major regions during 2013–2017. The correlation coefficients (r), normalized model bias (NMB), and the decline rates in units of μg m−3 yr−1 for both observations (OBS) and model results (SIM) are inset.
The model well reproduces the seasonal and interannual variability of the observations in all regions, with r ranging from 0.85 to 0.95. The NMB for the monthly PM2.5 concentrations is, in general, in the range of −11–16%, except in the CC and SCB areas, where the values are 38% and 85%, respectively. The bias in the CC is mainly driven by overestimates in the years 2015–2017, when the model shows little year-to-year changes. In contrast, observations show a sharp decrease during 2013–2016, followed by the 2016–2017 flattening in the same region. As a result, the decreasing trend simulated in the CC is much lower than that from observations (−4.3 vs. −8.1 μg m−3 yr−1). The relatively large overestimation in the SCB could be attributed to the complex terrain combined with the relatively coarse model resolution, resulting in the poor model performance there [39,40]. On the other hand, the overestimate in the SCB seems to be uniformly distributed over time and thus does not affect the accuracy of the simulated trend from 2013 to 2017, with a value of −6.1 μg m−3 yr−1 that is similar to the observed trend of −6.2 μg m−3 yr−1. Simulated trends of PM2.5 over GZP and NEC are also quite similar to those from observations (differ by 2–10%). However, due to the overestimation of PM2.5 in the winter of 2016–2017, the simulated decline rates in BTH, YRD, and PRD are 40–50% lower than the observations, which could probably be attributed to the overestimation of emissions. When averaged over China, the simulated decline rate is −4.7 μg m−3 yr−1, slightly lower than the observed one (−6.4 μg m−3 yr−1). Overall, the model moderately captures the mean PM2.5 concentrations and the decreasing trends in PM2.5 concentrations as well as the regional differences in China.
3.2. Factors Controlling the Trend of PM2.5 Pollution in China
Figure 3 and Figure 4 show the differences in PM2.5 concentrations between 2013 and 2017 and the relative changes driven by emissions and meteorology. The annual mean concentration in eastern China in 2013 was 44 ± 27 μg m−3 and decreased to 37 ± 23 μg m−3 in 2017, decreasing by 16%. The concentrations and the corresponding decrease rates were smaller in western China (from 16 ± 15 μg m−3 to 13 ± 12 μg m−3), but the relative change is similar (14%). The largest reduction is found in the BTH, with a decrease of 18 ± 7.9 μg m−3 (23%), followed by GZP (10 ± 3.0 μg m−3, 16%), YRD (9.3 ± 3.5 μg m−3, 16%), NEC (9.3 ± 3.0 μg m−3, 24%), CC (9.1 ± 4.7 μg m−3, 12%), PRD (4.4 ± 2.2 kg m−3, 12%), and SCB (3.6 ± 8.9 μg m−3, 3.6%).
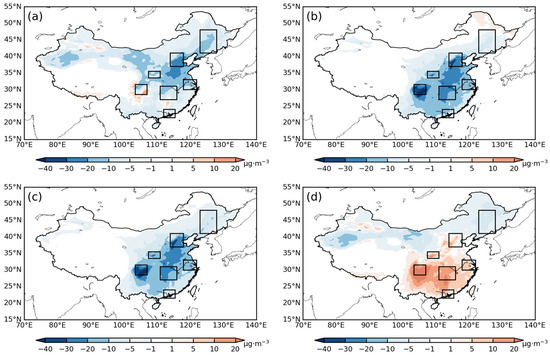
Figure 3.
Changes in PM2.5 concentrations in China from 2013 to 2017 (a) and those attributed to the difference in total emissions (b), only anthropogenic emissions (c), and meteorology (d).
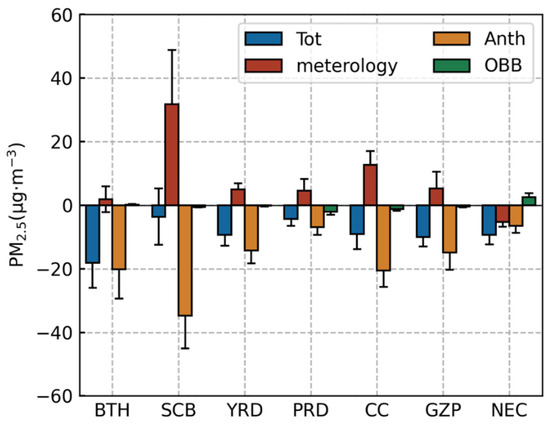
Figure 4.
Changes in PM2.5 concentrations in the seven major regions (Tot) and the relative contributions from meteorology as well as anthropogenic (Anth) and open biomass burning (OBB) emissions.
3.2.1. The Role of Emission Variations
The sensitivity tests against the emissions, as well as meteorology, indicate that the changes in PM2.5 concentrations between 2013 and 2017 are mainly driven by the emission reduction associated with the Clean Air Action in general. However, there is an obvious contrast between eastern and western China. In the eastern region, the decrease in PM2.5 concentrations is about 9.5 ± 8.6 μg m−3, which is even larger than the overall change resulting from the combined influence of all emissions and meteorology (relative change of 21% vs. 16%). The largest reduction occurs in SCB, with a decrease of 35 ± 10 μg m−3 (35%), followed by CC (21 ± 5.1 μg m−3, 27%), BTH (20 ± 9.2 μg m−3, 26%), GZP (15 ± 5.3 μg m−3, 23%), YRD (14 ± 4.0 μg m−3, 23%), PRD (6.9 ± 2.5 μg m−3, 19%), and NEC (6.6 ± 2.2 μg m−3, 17%). The changes in all regions, except for NEC, are higher than the magnitude of the total change. For the case of NEC, although the change is relatively small, it still accounts for 70% of the total. Therefore, the reduction in anthropogenic emission serves as a dominant factor driving the decrease in PM2.5 concentrations in eastern China. In contrast, the decrease in PM2.5 concentrations attributed to anthropogenic emission reduction in the western region is only 0.69 ± 1.4 μg m−3, which accounts for approximately one-third of the total change.
This spatial variation is aligned with the spatial distribution of the reduction in anthropogenic emissions. Zheng et al. describe detailed changes in anthropogenic emissions of SO2, NOx, NH3, BC, and OC, which are major components or precursors of PM2.5, from different sectors over China from 2010 to 2017 [32]. National emissions of the five pollutants were 25, 28, 11, 1.7, and 3.1Tg, respectively, in 2013, most of which were emitted from eastern China. Since the emission control measures are most effective when targeting power plants and industries, the largest cut is found in SO2 emissions from 2013 to 2017 (15 Tg, 59%), attributed to the elimination of small coal-fired industrial boilers, the switch to lower-sulfur coals and other cleaner fuel, and the desulfurization of plant gases [32,41]. Previous studies have suggested that the SO2 emission controls are the major driver of the decline trend in PM2.5 [16,42]. The total SO2 emission reduction in the seven regions is 5.8 Tg, accounting for 39% of the total national reduction. The largest reduction is presented in CC (1.4 Tg) and BTH, followed by SCB, YRD, NEC, GZP, and PRD. This ranking is slightly different from the PM2.5 decrease associated with emission controls. The reduction in NOx emissions is the second largest (5.7 Tg, 21%), followed by OC (1.0 Tg, 32%) and BC (0.49 Tg, 28%). Similar to SO2, the reductions of NOx, OC, and BC in the seven regions account for 35%, 34%, and 37% of the total national reduction, respectively. The change in national NH3 emissions is quite small (0.37 Tg, 3.5%), as they are mainly associated with agricultural activities.
The variation in OBB emissions, on the other hand, has a relatively small influence on PM2.5 concentrations between 2013 and 2017 in most areas, leading to an increase of 0.2 ± 1.6 μg m−3 in eastern China (0.45%) but a decrease of 0.02 ± 0.85 μg m−3 in western China (0.13%). This is consistent with the changes in OBB emissions, the national total of which only differs by 5.5–13% for SO2, NOx, NH3, BC, and OC. Also, the OBB emissions generally decrease from 2013 to 2017, except in NEC and BTH, where PM2.5 concentrations are increased by 2.5 ± 1.3 μg m−3 (6.4%) and 0.17 ± 0.22 μg m−3 (0.22%), respectively. The largest decrease attributed to OBB emissions is in PRD, with a value of 2.1 ± 0.89 μg m−3 (5.7%), followed by CC (1.3 ± 0.55 μg m−3, 1.6%), SCB (0.57 ± 0.17 μg m−3, 0.58%), GZP (0.44 ± 0.26 μg m−3, 0.69%), and YRD (0.19 ± 0.19 μg m−3, 0.32%). Overall, the variation in total emissions resulted in decreases of 9.3 ± 9.4 μg m−3 and 0.71 ± 1.8 μg m−3, respectively, in eastern and western China from 2013 to 2017. The changes are mainly driven by the controls on anthropogenic emissions, while the influence of OBB is negligible in most regions. There are only a few areas where the influence of OBB variation is significant. For example, the amplitude of the change in PM2.5 due to OBB variations is about 40% and 30% of that associated with anthropogenic emission reductions in NEC and PRD, respectively, although the direction of the change is opposite in NEC.
3.2.2. The Role of Meteorology
As mentioned above, the change associated with emission reduction is larger than the total change in PM2.5 concentrations, implying the negative effect of meteorology on alleviating air pollution. The sensitivity test against meteorology shows that with the same emissions (including anthropogenic and OBB emissions), the PM2.5 concentrations would increase in most regions in China from 2013 to 2017, especially in SCB (32 ± 17 μg m−3, 32%) and CC (13 ± 4.3 μg m−3, 16%), whose amplitudes are about 91% and 62% of that associated with emission reduction, respectively. The increase in SCB due to meteorology almost compensates for the decrease attributed to emission reduction, resulting in the least change in PM2.5 concentrations in this area compared with the other six regions. The increases in other regions are also significant: 5.3 ± 5.2 μg m−3 (8.3%) for GZP, 5.0 ± 1.9 μg m−3 (8.3%) for YRD, 4.6 ± 3.7 μg m−3 (12%) for PRD, and 1.9 ± 4.1 μg m−3 (2.5%) for BTH, accounting for 35%, 36%, 67%, and 9.5% of the amplitude of the change attributed to the emission reduction. However, meteorology also causes decreases in concentrations in northern China. Especially, the decrease in NEC due to meteorology (5.2 ± 1.6 μg m−3, 13%) is close to the one from emission reduction (6.6 ± 2.2 μg m−3).
To identify the main meteorological variables contributing to the changes in PM2.5 concentrations, Figure 5 shows the correlation of daily PM2.5 concentrations with the individual meteorological variables. Six meteorological variables are considered in this study, including surface wind speed (WS), RH, temperature (T), meridional wind velocity at 850 hPa (V850), PBLH, and total surface precipitation flux (PRECTOT) from the GEOS-FP reanalysis products, which are also used to drive the GEOS-Chem simulation. Previous studies have shown that those meteorological variables have strong correlations with PM2.5, varying with seasons and locations [16,43,44]. Therefore, the correlation analysis here is conducted for each season in addition to the spatial distribution. We define winter as January, February, and December; spring as March, April, and May; summer as June, July, and August; and autumn as September, October, and November.
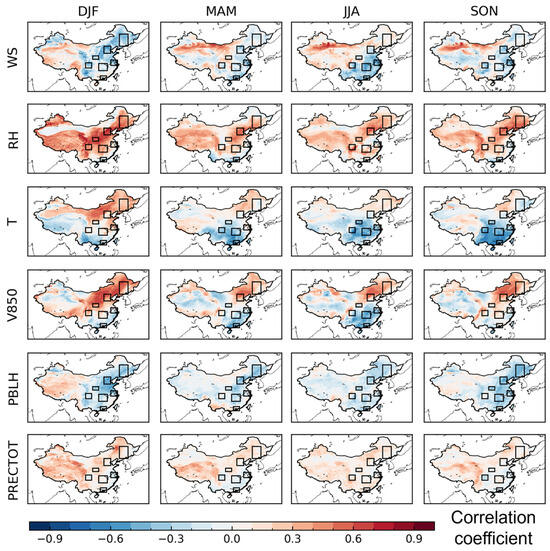
Figure 5.
The correlation coefficients (r) between PM2.5 concentrations and key meteorological parameters in China during different seasons in 2013–2017. The meteorological parameters considered here include surface wind speed (WS), relative humidity (RH), temperature (T), meridional wind velocity at 850 hPa (V850), planetary boundary layer height (PBLH), and total surface precipitation flux (PRECTOT).
PM2.5 in most regions, especially in eastern China, is negatively correlated with WS, as higher WS usually means more ventilation [45]. This negative correlation is the most obvious in winter. For instance, r in BTH ranges from −0.65 to −0.10, in contrast to that in summer (−0.41–0.053). However, a positive correlation between PM2.5 and WS also exists in northern and southwestern China. The positive correlation in northern China, especially in areas of the northwest, is mainly because higher WS induces more dust events [46,47]. On the other hand, the relationship in southwestern China is probably due to the influence of long-range transport, as local emissions are quite small [48].
RH is generally positively correlated with PM2.5, as it favors secondary formation via aqueous-phase or heterogeneous processes [49]. The positive correlation is the most significant in winter. The exception is found in northwestern China, where it is more affected by dust pollution driven by high wind speeds and dry conditions [50]. There is also a negative correlation between RH and PM2.5 in southern China, e.g., PRD. Zhai et al. also observed this negative correlation and attributed it to the association of high RH with precipitation and onshore wind [16]. The correlation of T with PM2.5 is positive in northern China but negative in southern China. Tai et al. [43] suggested that the positive correlation could reflect the covariation of T with other meteorological variables. The negative correlation implies the volatilization of ammonium nitrate at high T, which may also explain why the negative correlation is more significant in summer and autumn.
The spatial distribution of the correlation of V850 with PM2.5 is similar to that of T but for different reasons. The same distribution is also reported by the study of Zhai et al. [16]. V850 serves as a predictor of PM2.5 pollution in winter in northern China, with northerly wind, namely negative V850, which stands for good ventilation [51]. The negative correlation in southern China, especially in summer, could be explained by the fact that southerly wind (positive V850) brings more clean marine air to the continent. The correlation of PBLH with PM2.5 is, in general, negative in eastern China but positive in western China. This could be explained by the fact that eastern China is more affected by local emissions, where high PBLH represents good ventilation, while western China is more affected by long-range transport. Su et al. also reported that the correlation between PBLH and surface PM2.5 is nonlinear, with the magnitude, significance, and even sign of correlation coefficients varying considerably depending on location, season, and meteorological conditions [52]. The correlation between precipitation and PM2.5 concentrations is relatively weak, with r mostly in the range of −0.2–0.3. The negative effect is only found in southern China during the spring and autumn seasons, which may be explained by the scavenging of PM2.5 during precipitation [53,54]. In contrast, the positive effect is found in winter in most regions of China, which could be attributed to the covariance with other meteorological variables, such as RH [16].
Figure 6 shows changes in the key meteorological variables from 2013 to 2017. The variable with the largest change is PBLH, which decreased by 68 m (−37%) in the national annual average, followed by WS (−0.23 m s−1, −15%). Combined with their negative correlation with PM2.5 in eastern China, these changes would result in an increase in PM2.5 there. Among all seven regions, the decrease in PBLH and WS is the largest in SCB and CC, respectively. This is consistent with the above results that the influence of meteorology is the largest in these two areas, implying that WS and PBLH may be the key meteorological variables driving the changes in PM2.5. On the other hand, T increases over most areas but with a relatively small magnitude (0.22 K, 0.22%). This would lead to an increase in northern China but a decrease in southern China. The change in RH varies largely with location, with the most significant decrease in northeast China. Therefore, the decrease in PM2.5 associated with meteorology in NEC, in contrast to the other areas, could be explained by the combined effects of the relatively small decrease in WS and PBLH as well as the significant decrease in RH there. The change in V850 is also relatively small. Precipitation increases in most areas, especially in southwestern China. However, due to the weak correlation with PM2.5, it may have little influence on the trends of PM2.5.
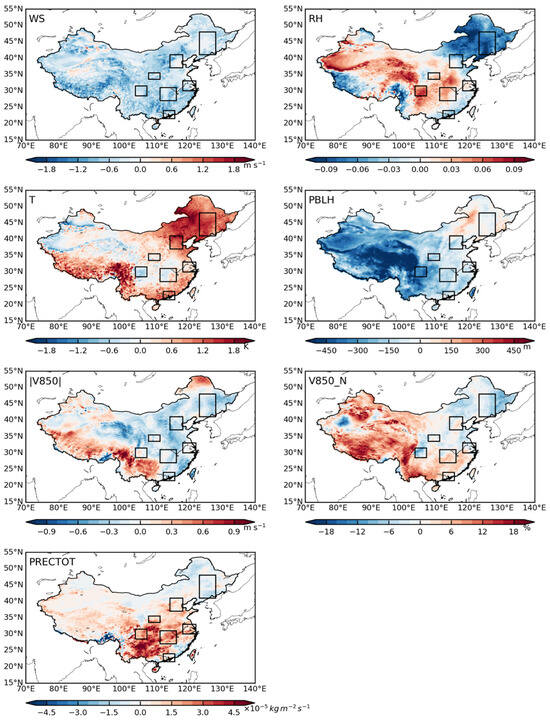
Figure 6.
Changes in key meteorological parameters from 2013 to 2017 in China. The meteorological parameters considered here include surface wind speed (WS), relative humidity (RH), temperature (T), meridional wind velocity at 850 hPa (V850), planetary boundary layer height (PBLH), and total surface precipitation flux (PRECTOT). The changes in V850 presented here include the change in absolute velocity (|V850|) and the change in the percentages of northerly wind, namely negative V850 (V850_N).
4. Conclusions
We use GEOS-Chem to analyze the trends and associated driving factors of surface PM2.5 pollution in China during 2013–2017. Simulated annual surface PM2.5 concentrations and the decline rates over different regions in China are validated through comparison with ground-based measurements by CNEMC. The observed PM2.5 concentrations demonstrate an obvious decline trend from 2013 to 2017 in all regions, with a mean decline rate of −6.4 µg m−3 yr−1 averaged over China. Among the seven major regions in China, BTH has the largest decline rate of −9.0 µg m−3 yr−1, while PRD has the slowest decline rate of −3.6 µg m−3 yr−1. The model generally captures the observed variations in all regions, with r in the range of 0.85–0.95. Simulated decline trends are slightly lower than observations, with a mean value of −4.7 µg m−3 yr−1 averaged in China. The model performance regarding the PM2.5 decline trends is better in SCB, GZP, and NEC, with a bias of less than 10%. However, it underestimates the decline rates in BTH, CC, YRD, and PRD, with bias in the range of 40–50%.
Based on the sensitivity tests, the results show that the decline trends in PM2.5 are mainly driven by the reduction in anthropogenic emissions upon Clean Air Action:
- (1)
- The largest reduction in PM2.5 due to emission controls is found in SCB (35 ± 10 μg m−3, 35%), followed by CC (21 ± 5.1 μg m−3, 27%), BTH (20 ± 9.2 μg m−3, 26%), GZP (15 ± 5.3 μg m−3, 23%), YRD (14 ± 4.0 μg m−3, 23%), PRD (6.9 ± 2.5 μg m−3, 19%), and NEC (6.6 ± 2.2 μg m−3, 17%).
- (2)
- The changes in all regions, except for NEC, are larger than the total change in PM2.5, implying an opposite effect from other factors, e.g., meteorology. Although the change due to emission controls in NEC is less than the total change, it still accounts for 70% of the total.
- (3)
- While emission reduction controls the trends of PM2.5 in eastern China, its effect in western China is small, around one-third of the total change.
By comparison, the influence due to OBB variation is relatively small in most of China, except for NEC and PRD. The decrease due to OBB in PRD is about 30% of the decrease attributed to emission controls. In contrast, OBB causes a significant increase in PM2.5 in NEC, which is about 40% of the reduction achieved through emission controls.
Meteorology exerts a negative effect on air quality in most of China, except in NEC. The largest increase in PM2.5 associated with meteorology occurs in SCB and CC, where the magnitude of the change is about 91% and 62% of reductions from emission controls. The increase in SCB due to meteorology almost compensates for the decrease by emission controls, leading to the least change in PM2.5 there between 2013 and 2017 among all seven regions. The increase from meteorology could be explained by the significant decrease in WS and PBLH combined with their negative correlation with PM2.5 in most of China. In contrast, the decrease in PM2.5 due to meteorology in NEC could be attributed to the significant decrease in RH combined with its positive correlation with PM2.5, as well as the relatively small change in WS and PBLH.
Author Contributions
Formal analysis, G.L.; Investigation, Y.D., B.Z. and Z.F.; Project administration, L.C.; Resources, M.L.; Software, B.S.; Validation, Y.Z. and Q.W.; Writing—original draft, Y.T.; Writing—review and editing, Y.Z. and Q.W. All authors have read and agreed to the published version of the manuscript.
Funding
The work was supported by the National Natural Science Foundation of China (42377093, 42105107), the Basic and Applied Basic Research Foundation of Guangzhou Basic Research Program (2024A04J3959), the Special Fund Project for Science and Technology Innovation Strategy of Guangdong Province (2019B121205004), State Environmental Protection Key Laboratory of Formation and Prevention of the Urban Air Pollution Complex (SEPAir-2022080592).
Data Availability Statement
The data presented in this study are available on request from the corresponding author. The ground-level hourly PM2.5 data used in this study are openly accessible and published by China National Environmental Monitoring Center (CNEMC, https://quotsoft.net/air/, accessed on 20 June 2024). Other data are not publicly available due to privacy concerns.
Conflicts of Interest
The authors declare no conflicts of interest.
References
- Yan, R.C.; Yu, S.C.; Zhang, Q.Y.; Li, P.F.; Wang, S.; Chen, B.X.; Liu, W.P. A heavy haze episode in Beijing in February of 2014: Characteristics, origins and implications. Atmos. Pollut. Res. 2015, 6, 867–876. [Google Scholar] [CrossRef]
- Zhang, T.; Chillrud, S.N.; Ji, J.; Chen, Y.; Pitiranggon, M.; Li, W.; Liu, Z.; Yan, B. Comparison of PM2.5 Exposure in Hazy and Non-Hazy Days in Nanjing, China. Aerosol Air Qual. Res. 2017, 17, 2235–2246. [Google Scholar] [CrossRef] [PubMed]
- Liao, T.; Wang, S.; Ai, J.; Gui, K.; Duan, B.; Zhao, Q.; Zhang, X.; Jiang, W.; Sun, Y. Heavy pollution episodes, transport pathways and potential sources of PM2.5 during the winter of 2013 in Chengdu (China). Sci. Total Environ. 2017, 584, 1056–1065. [Google Scholar] [CrossRef]
- Pui, D.Y.H.; Chen, S.-C.; Zuo, Z. PM2.5 in China: Measurements, sources, visibility and health effects, and mitigation. Particuology 2014, 13, 1–26. [Google Scholar] [CrossRef]
- Ye, W.F.; Ma, Z.Y.; Ha, X.Z. Spatial-temporal patterns of PM2.5 concentrations for 338 Chinese cities. Sci. Total Environ. 2018, 631–632, 524–533. [Google Scholar] [CrossRef] [PubMed]
- Guascito, M.R.; Lionetto, M.G.; Mazzotta, F.; Conte, M.; Giordano, M.E.; Caricato, R.; Bartolomeo, A.R.D.; Dinoi, A.; Cesari, D.; Merico, E.; et al. Characterisation of the correlations between oxidative potential and in vitro biological effects of PM10 at three sites in the central Mediterranean. J. Hazard. Mater. 2023, 448, 130872. [Google Scholar] [CrossRef] [PubMed]
- Shindell, D.; Kuylenstierna, J.C.; Vignati, E.; van Dingenen, R.; Amann, M.; Klimont, Z.; Anenberg, S.C.; Muller, N.; Janssens-Maenhout, G.; Raes, F.; et al. Simultaneously mitigating near-term climate change and improving human health and food security. Science 2012, 335, 183–189. [Google Scholar] [CrossRef] [PubMed]
- Li, Z.Q.; Lee, K.; Wang, Y.S.; Xin, J.Y.; Hao, W.M. First observation-based estimates of cloud-free aerosol radiative forcing across China. J. Geophys. Res.-Atmos. 2010, 115, D00K18. [Google Scholar] [CrossRef]
- Su, W.; Loeb, N.G.; Schuster, G.L.; Chin, M.; Rose, F.G. Global all-sky shortwave direct radiative forcing of anthropogenic aerosols from combined satellite observations and GOCART simulations. J. Geophys. Res.-Atmos. 2013, 118, 655–669. [Google Scholar] [CrossRef]
- Zhang, Q.; Zheng, Y.; Tong, D.; Shao, M.; Wang, S.; Zhang, Y.; Xu, X.; Wang, J.; He, H.; Liu, W.; et al. Drivers of improved PM2.5 air quality in China from 2013 to 2017. Proc. Natl. Acad. Sci. USA 2019, 116, 24463–24469. [Google Scholar] [CrossRef]
- Feng, Y.; Ning, M.; Lei, Y.; Sun, Y.; Liu, W.; Wang, J. Defending blue sky in China: Effectiveness of the “Air Pollution Prevention and Control Action Plan” on air quality improvements from 2013 to 2017. J. Environ. Manag. 2019, 252, 109603. [Google Scholar] [CrossRef]
- Wang, Y.; Gao, W.; Wang, S.; Song, T.; Gong, Z.; Ji, D.; Wang, L.; Liu, Z.; Tang, G.; Huo, Y.; et al. Contrasting trends of PM2.5 and surface-ozone concentrations in China from 2013 to 2017. Natl. Sci. Rev. 2020, 7, 1331–1339. [Google Scholar] [CrossRef]
- Deng, M.; Chen, D.; Zhang, G.; Cheng, H. Policy-driven variations in oxidation potential and source apportionment of PM2. 5 in Wuhan, central China. Sci. Total Environ. 2022, 853, 158255. [Google Scholar] [CrossRef] [PubMed]
- Li, X.; Ma, Q.; Li, Y.; Wang, S. The Impact of the “Air Pollution Prevention and Control Action Plan” on PM2.5 Concentration in China During 2014–2019. In Proceedings of the 2021 IEEE International Geoscience and Remote Sensing Symposium IGARSS, Brussels, Belgium, 11–16 July 2021; IEEE: Piscataway, NJ, USA, 2021; pp. 1939–1942. [Google Scholar]
- Sun, Y.; Jiang, Q.; Wang, Z.; Fu, P.; Li, J.; Yang, T.; Yin, Y. Investigation of the sources and evolution processes of severe haze pollution in Beijing in January 2013. J. Geophys. Res.-Atmos. 2014, 119, 4380–4398. [Google Scholar] [CrossRef]
- Zhai, S.; Jacob, D.J.; Wang, X.; Shen, L.; Li, K.; Zhang, Y.; Gui, K.; Zhao, T.; Liao, H. Fine particulate matter (PM2.5) trends in China, 2013–2018: Separating contributions from anthropogenic emissions and meteorology. Atmos. Chem. Phys. 2019, 19, 11031–11041. [Google Scholar] [CrossRef]
- Feng, J.; Liao, H.; Li, Y.; Zhang, Z.; Tang, Y. Long-term trends and variations in haze-related weather conditions in north China during 1980–2018 based on emission-weighted stagnation intensity. Atmos. Environ. 2020, 240, 117830. [Google Scholar] [CrossRef]
- Liu, Z.Y.; Xue, W.B.; Ni, X.F.; Qi, Z.L.; Zhang, Q.Y.; Wang, J.N. Fund gap to high air quality in China: A cost evaluation for PM2.5 abatement based on the Air Pollution Prevention and control Action Plan. J. Clean Prod. 2021, 319, 128715. [Google Scholar] [CrossRef]
- Dong, L.; Leung, L.R.; Qian, Y.; Zou, Y.; Song, F.; Chen, X. Meteorological Environments Associated with California Wildfires and Their Potential Roles in Wildfire Changes during 1984–2017. J. Geophys. Res.-Atmos. 2021, 126, e2020JD033180. [Google Scholar] [CrossRef]
- Shen, H.; Tao, S.; Chen, Y.; Odman, M.T.; Zou, Y.; Huang, Y.; Chen, H.; Zhong, Q.; Zhang, Y.; Chen, Y.; et al. Global Fire Forecasts Using Both Large-Scale Climate Indices and Local Meteorological Parameters. Glob. Biogeochem. Cycle 2019, 33, 1129–1145. [Google Scholar] [CrossRef]
- Lima, C.H.R.; AghaKouchak, A.; Randerson, J.T. Unraveling the Role of Temperature and Rainfall on Active Fires in the Brazilian Amazon Using a Nonlinear Poisson Model. J. Geophys. Res.-Biogeosci. 2018, 123, 117–128. [Google Scholar] [CrossRef]
- Goss, M.; Swain, D.L.; Abatzoglou, J.T.; Sarhadi, A.; Kolden, C.A.; Williams, A.P.; Diffenbaugh, N.S. Climate change is increasing the likelihood of extreme autumn wildfire conditions across California. Environ. Res. Lett. 2020, 15, 094016. [Google Scholar] [CrossRef]
- Bey, I.; Jacob, D.J.; Yantosca, R.M.; Logan, J.A.; Field, B.D.; Fiore, A.M.; Li, Q.B.; Liu, H.G.Y.; Mickley, L.J.; Schultz, M.G. Global modeling of tropospheric chemistry with assimilated meteorology: Model description and evaluation. J. Geophys. Res.-Atmos. 2001, 106, 23073–23095. [Google Scholar] [CrossRef]
- Hudman, R.C.; Jacob, D.J.; Turquety, S.; Leibensperger, E.M.; Murray, L.T.; Wu, S.; Gilliland, A.B.; Avery, M.; Bertram, T.H.; Brune, W.; et al. Surface and lightning sources of nitrogen oxides over the United States: Magnitudes, chemical evolution, and outflow. J. Geophys. Res.-Atmos. 2007, 112, D12S05. [Google Scholar] [CrossRef]
- Eastham, S.D.; Weisenstein, D.K.; Barrett, S.R.H. Development and evaluation of the unified tropospheric–stratospheric chemistry extension (UCX) for the global chemistry-transport model GEOS-Chem. Atmos. Environ. 2014, 89, 52–63. [Google Scholar] [CrossRef]
- Marais, E.A.; Jacob, D.J.; Jimenez, J.L.; Campuzano-Jost, P.; Day, D.A.; Hu, W.; Krechmer, J.; Zhu, L.; Kim, P.S.; Miller, C.C.; et al. Aqueous-phase mechanism for secondary organic aerosol formation from isoprene: Application to the Southeast United States and co-benefit of SO2 emission controls. Atmos. Chem. Phys. 2016, 16, 1603–1618. [Google Scholar] [CrossRef]
- Park, R.; Jacob, D.; Kumar, N.; Yantosca, R. Regional visibility statistics in the United States: Natural and transboundary pollution influences, and implications for the Regional Haze Rule. Atmos. Environ. 2006, 40, 5405–5423. [Google Scholar] [CrossRef][Green Version]
- Park, R.j.; Jacob, D.J. Sources of carbonaceous aerosols over the United States and implications for natural visibility. J. Geophys. Res. 2003, 108, 4355. [Google Scholar] [CrossRef]
- Park, R.J.; Jacob, D.J. Natural and transboundary pollution influences on sulfate-nitrate-ammonium aerosols in the United States: Implications for policy. J. Geophys. Res. 2004, 109, D15204. [Google Scholar] [CrossRef]
- Pye, H.O.T.; Seinfeld, J.H. A global perspective on aerosol from low-volatility organic compounds. Atmos. Chem. Phys. 2010, 10, 4377–4401. [Google Scholar] [CrossRef]
- Li, M.; Zhang, Q.; Kurokawa, J.-i.; Woo, J.-H.; He, K.; Lu, Z.; Ohara, T.; Song, Y.; Streets, D.G.; Carmichael, G.R.; et al. MIX: A mosaic Asian anthropogenic emission inventory under the international collaboration framework of the MICS-Asia and HTAP. Atmos. Chem. Phys. 2017, 17, 935–963. [Google Scholar] [CrossRef]
- Zheng, B.; Tong, D.; Li, M.; Liu, F.; Hong, C.; Geng, G.; Li, H.; Li, X.; Peng, L.; Qi, J.; et al. Trends in China’s anthropogenic emissions since 2010 as the consequence of clean air actions. Atmos. Chem. Phys. 2018, 18, 14095–14111. [Google Scholar] [CrossRef]
- Anton, S.; Darmenov, A.M.d.S. The Quick Fire Emissions Dataset (QFED): Documentation of Versions 2.1, 2.2 and 2.4; NASA Technical Report Series on Global Modeling and Data Assimilation; NASA: Washington, DC, USA, 2015; Volume 38. Available online: http://gmao.gsfc.nasa.gov/pubs/docs/Darmenov796.pdf (accessed on 20 June 2024).
- Guenther, A.; Karl, T.; Harley, P.; Wiedinmyer, C.; Palmer, P.I.; Geron, C. Estimates of global terrestrial isoprene emissions using MEGAN (Model of Emissions of Gases and Aerosols from Nature). Atmos. Chem. Phys. 2006, 6, 3181–3210. [Google Scholar] [CrossRef]
- Tai, A.P.K.; Mickley, L.J.; Jacob, D.J. Correlations between fine particulate matter (PM2.5) and meteorological variables in the United States: Implications for the sensitivity of PM2.5 to climate change. Atmos. Environ. 2010, 44, 3976–3984. [Google Scholar] [CrossRef]
- Wang, Q.Q.; Jacob, D.J.; Spackman, J.R.; Perring, A.E.; Schwarz, J.P.; Moteki, N.; Marais, E.A.; Ge, C.; Wang, J.; Barrett, S.R.H. Global budget and radiative forcing of black carbon aerosol: Constraints from pole-to-pole (HIPPO) observations across the Pacific. J. Geophys. Res.-Atmos. 2014, 119, 195–206. [Google Scholar] [CrossRef]
- Action Plan on Air Pollution Prevention and Control. Available online: http://www.gov.cn/zwgk/2013-09/12/content_2486773.htm (accessed on 20 June 2024).
- Three-Year Action Plan on Defending the Blue Sky. Available online: https://www.gov.cn/zhengce/content/2018-07/03/content_5303158.htm (accessed on 20 June 2024).
- Zhang, L.; Gong, S.; Zhao, T.; Zhou, C.; Wang, Y.; Li, J.; Ji, D.; He, J.; Liu, H.; Gui, K. Development of WRF/CUACE v1. 0 model and its preliminary application in simulating air quality in China. Geosci. Model Dev. 2021, 14, 703–718. [Google Scholar] [CrossRef]
- Xie, X.; Ying, Q.; Zhang, H.; Hu, J. Spatial and Temporal Variations in the Atmospheric Age Distribution of Primary and Secondary Inorganic Aerosols in China. Engineering 2023, 28, 117–129. [Google Scholar] [CrossRef]
- Zhao, B.; Zheng, H.; Wang, S.; Smith, K.R.; Lu, X.; Aunan, K.; Gu, Y.; Wang, Y.; Ding, D.; Xing, J. Change in household fuels dominates the decrease in PM2. 5 exposure and premature mortality in China in 2005–2015. Proc. Natl. Acad. Sci. USA 2018, 115, 12401–12406. [Google Scholar] [CrossRef]
- Shao, P.; Tian, H.; Sun, Y.; Liu, H.; Wu, B.; Liu, S.; Liu, X.; Wu, Y.; Liang, W.; Wang, Y. Characterizing remarkable changes of severe haze events and chemical compositions in multi-size airborne particles (PM1, PM2. 5 and PM10) from January 2013 to 2016–2017 winter in Beijing, China. Atmos. Environ. 2018, 189, 133–144. [Google Scholar] [CrossRef]
- Tai, A.P.; Mickley, L.J.; Jacob, D.J.; Leibensperger, E.; Zhang, L.; Fisher, J.A.; Pye, H. Meteorological modes of variability for fine particulate matter (PM2.5) air quality in the United States: Implications for PM2.5 sensitivity to climate change. Atmos. Chem. Phys. 2012, 12, 3131–3145. [Google Scholar] [CrossRef]
- Chen, Z.; Xie, X.; Cai, J.; Chen, D.; Gao, B.; He, B.; Cheng, N.; Xu, B. Understanding meteorological influences on PM2.5 concentrations across China: A temporal and spatial perspective. Atmos. Chem. Phys. 2018, 18, 5343–5358. [Google Scholar] [CrossRef]
- He, J.; Gong, S.; Yu, Y.; Yu, L.; Wu, L.; Mao, H.; Song, C.; Zhao, S.; Liu, H.; Li, X. Air pollution characteristics and their relation to meteorological conditions during 2014–2015 in major Chinese cities. Environ. Pollut. 2017, 223, 484–496. [Google Scholar] [CrossRef] [PubMed]
- Han, Y.; Dai, X.; Fang, X.; Chen, Y.; Kang, F. Dust aerosols: A possible accelerant for an increasingly arid climate in North China. J. Arid Environ. 2008, 72, 1476–1489. [Google Scholar] [CrossRef]
- Lyu, Y.; Qu, Z.; Liu, L.; Guo, L.; Yang, Y.; Hu, X.; Xiong, Y.; Zhang, G.; Zhao, M.; Liang, B. Characterization of dustfall in rural and urban sites during three dust storms in northern China, 2010. Aeolian Res. 2017, 28, 29–37. [Google Scholar] [CrossRef]
- Chen, S.; Wang, W.; Li, M.; Mao, J.; Ma, N.; Liu, J.; Bai, Z.; Zhou, L.; Wang, X.; Bian, J. The Contribution of Local Anthropogenic Emissions to Air Pollutants in Lhasa on the Tibetan Plateau. J. Geophys. Res.-Atmos. 2022, 127, e2021JD036202. [Google Scholar] [CrossRef]
- Song, S.; Gao, M.; Xu, W.; Sun, Y.; Worsnop, D.R.; Jayne, J.T.; Zhang, Y.; Zhu, L.; Li, M.; Zhou, Z. Possible heterogeneous chemistry of hydroxymethanesulfonate (HMS) in northern China winter haze. Atmos. Chem. Phys. 2019, 19, 1357–1371. [Google Scholar] [CrossRef]
- Wang, X.; Wang, Q.; Prass, M.; Pöhlker, C.; Moran-Zuloaga, D.; Artaxo, P.; Gu, J.; Yang, N.; Yang, X.; Tao, J. The export of African mineral dust across the Atlantic and its impact over the Amazon Basin. Atmos. Chem. Phys. 2023, 23, 9993–10014. [Google Scholar] [CrossRef]
- Cai, W.; Li, K.; Liao, H.; Wang, H.; Wu, L. Weather conditions conducive to Beijing severe haze more frequent under climate change. Nat. Clim. Chang. 2017, 7, 257–262. [Google Scholar] [CrossRef]
- Su, T.; Li, Z.; Kahn, R. Relationships between the planetary boundary layer height and surface pollutants derived from lidar observations over China: Regional pattern and influencing factors. Atmos. Chem. Phys. 2018, 18, 15921–15935. [Google Scholar] [CrossRef]
- Liu, Z.; Shen, L.M.; Yan, C.Y.; Du, J.S.; Li, Y.; Zhao, H. Analysis of the Influence of Precipitation and Wind on PM2.5 and PM10 in the Atmosphere. Adv. Meteorol. 2020, 2020, 5039613. [Google Scholar] [CrossRef]
- Feng, X.; Wang, S. Influence of different weather events on concentrations of particulate matter with different sizes in Lanzhou, China. J. Environ. Sci. 2012, 24, 665–674. [Google Scholar] [CrossRef]


Disclaimer/Publisher’s Note: The statements, opinions and data contained in all publications are solely those of the individual author(s) and contributor(s) and not of MDPI and/or the editor(s). MDPI and/or the editor(s) disclaim responsibility for any injury to people or property resulting from any ideas, methods, instructions or products referred to in the content. |
© 2024 by the authors. Licensee MDPI, Basel, Switzerland. This article is an open access article distributed under the terms and conditions of the Creative Commons Attribution (CC BY) license (https://creativecommons.org/licenses/by/4.0/).