Abstract
Complex fracture technology is key to the successful development of unconventional oil and gas reservoirs, such as shale. Most current studies focus on how to improve the complexity of the fracture network. It is still unclear whether proppant can enter the branch fractures at all levels after the formation of complex fractures. The effects of construction displacement, proppant particle size, proppant density, fracturing fluid viscosity, sand ratio, and other factors on proppant migration in single fractures and complex fractures were studied using an experimental device independently developed by the laboratory. The results show that the lowest point height of the sandbank and the equilibrium height of the sandbank are directly proportional to the particle concentration and density, respectively, and inversely proportional to the displacement and fracturing fluid viscosity. The equilibrium time of the sandbank is inversely proportional to the displacement, particle concentration, and density, respectively, and proportional to the viscosity of the fracturing fluid. Under the same experimental conditions, the larger the branch angle, the smaller the height of the main/secondary fracture sandbank. In the design of the fracturing process, fracturing fluid with varying viscosities and proppant with different densities should be selected according to the formation conditions and fracturing targets. In the face of long fracture lengths, the combination of low-viscosity fracturing fluid with an appropriate viscosity and low-density proppant can meet the goal of placing proppant over long distances and effectively supporting fractures over extended lengths. Subsequently, high-density proppant or reduced construction displacement are adopted to usefully support fractures in the near-wellbore area. The results of this paper can provide theoretical support for proppant selection and fracturing program design.
1. Introduction
As traditional oil and gas generation continues to decline, nontraditional energy sources have become increasingly significant in meeting the energy supply demand traditionally fulfilled by oil and gas [1,2]. Shale reservoirs have small matrix voids, poor connectivity, and basically no natural productivity [3,4,5]. Therefore, it is necessary to effectively transform shale reservoirs to obtain economic productivity. At present, hydraulic fracturing technology is a necessary method for increasing the generation of unconventional energy oil and gas [6,7]. The key to the success of hydraulic fracturing is to build a complicated fracture network within the formation and then effectively place proppant in these fractures to ensure that the fractures maintain sufficient conductivity after fracturing [8,9]. The distribution of proppant in fractured fractures is directly related to the production capacity of shale oil and gas in the later development process. Therefore, studying the migration law of proppant in fractures of unconventional reservoirs plays a crucial role in the success of fracturing.
In terms of the issue of proppant migration in fracturing fractures, researchers have carried out a range of experimental tests and numerical simulation research. The experimental study on the migration law of proppant in fractures can be traced back to 1959. Kern [10] first researched the migration law of proppant in small plate fractures. On the basis of Kern’s research, Babcock [11] first constructed visual experimental equipment to research the migration law of proppant and divided the sand embankment into four areas: no sand area, suspension area, tumble area, and sand embankment area in the longitudinal height. Subsequently, Bello [12], Fernández [13], Fjaestad [14], and Clark [15] researched the impact of fluid viscosity, proppant size, and sand concentration on the migration law of proppant in a single fracture by using a visual parallel-plate experimental device, used cameras, and other means to record the process of proppant migration. Guo [16] analyzed the influence of fracturing fluid flowback on proppant distribution. In terms of numerical simulation, Xu [17] simulated and studied the distribution of proppant in two-dimensional tortuous micro-fractures based on COMSOL Multiphysics software (Software Version 6.2). Zheng [18] and Wu [19] used the CFD-DEM coupling method to simulate proppant migration in fractures after flow pressure. Wang [20] established a proppant migration model in the fracture using fluid dynamics methods and identified the distribution characteristics of proppant in the fracture.
Most of the above studies focused on the migration of proppant in conventional oil and gas reservoirs. As nontraditional oil and gas resources [21,22,23,24] continue to gain prominence, more and more attention has been paid to the migration of proppant in shale fracturing fractures. Unlike conventional fractures, the fractures formed after shale fracturing are spatial network structures [25,26]. To address this, scholars have successively constructed a series of complex fracture proppant migration experimental devices to trigger the migration law of proppant in complicated fractures. The complex fracture proppant migration experimental device is based on a single fracture device to construct a fracture model where a branch fracture with a certain angle intersects the main fracture in the flow direction. Dayan [27] first designed an experimental device with two secondary fractures. The secondary fracture was fixed at 90°, and the influence of displacement on the migration law of proppant in complicated fractures was experimentally analyzed. Based on the experimental model of Dayan [27], Sahai [28] and Klingensmith [29] established two different types of proppant transport experimental devices, which are shown in Figure 1 and Figure 2. Experimental studies on the influence of elements including construction displacement, fracturing fluid properties, proppant particle size density, and branch seam angle on proppant migration law have been made with both experimental devices. At present, most of the experimental devices for complex fracture proppant migration are improved on the basis of the above-two experimental devices. For example, Wen [30], Alotaibi [31], Guo [32], Li [33], and Pan [34,35] designed different complex fracture proppant migration devices.
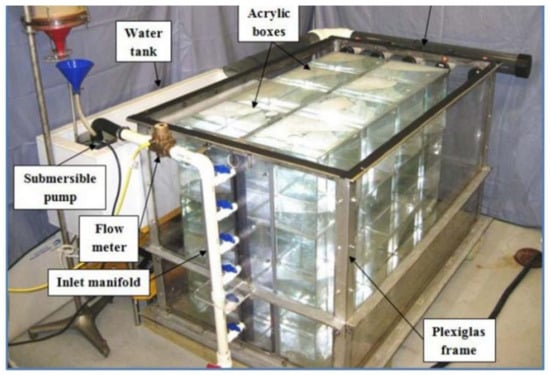
Figure 1.
Large complex fracture proppant migration equipment diagram [28].
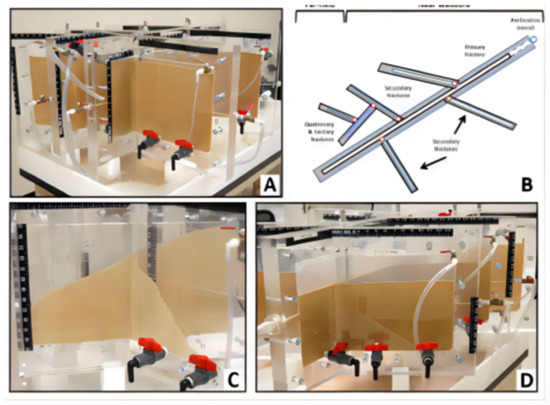
Figure 2.
Complex fracture proppant migration device diagram [29]: (A) physical diagram of indoor installation; (B) Interior installation diagrame; (C) major fracture; (D) Branch fracture.
Although researchers have carried out relevant experimental studies on the proppant migration law, the current experimental equipment used to simulate the proppant migration law is small in scale, and the migration distance of proppant in the fracture is short, which is not able to truly simulate the migration law of proppant in the fracture. The shape and scale of the fracture simulation module are relatively fixed, and the influence of the fracture shape and scale change on proppant migration and distribution cannot be studied. The experimental instrument is mainly made of transparent plexiglass, and its bearing capacity is weak, so it cannot simulate the migration law of proppant under the condition of high displacement. Therefore, to study the migration and distribution of proppant in the complex fracture volumeter fracturing of shale reservoirs, an experimental device for proppant migration in complex fractures was constructed, characterized by a large size, strong bearing capacity, and flexible adjustment of the fracture morphology. The effects of proppant displacement, proppant particle size, proppant density, fracturing fluid viscosity, sand ratio, and other factors on proppant migration in single fractures and complex fractures were investigated using a complex fracture transport experimental device. The research results can provide theoretical support for proppant selection and fracturing program design.
2. Experimental Method
2.1. Experimental Installation
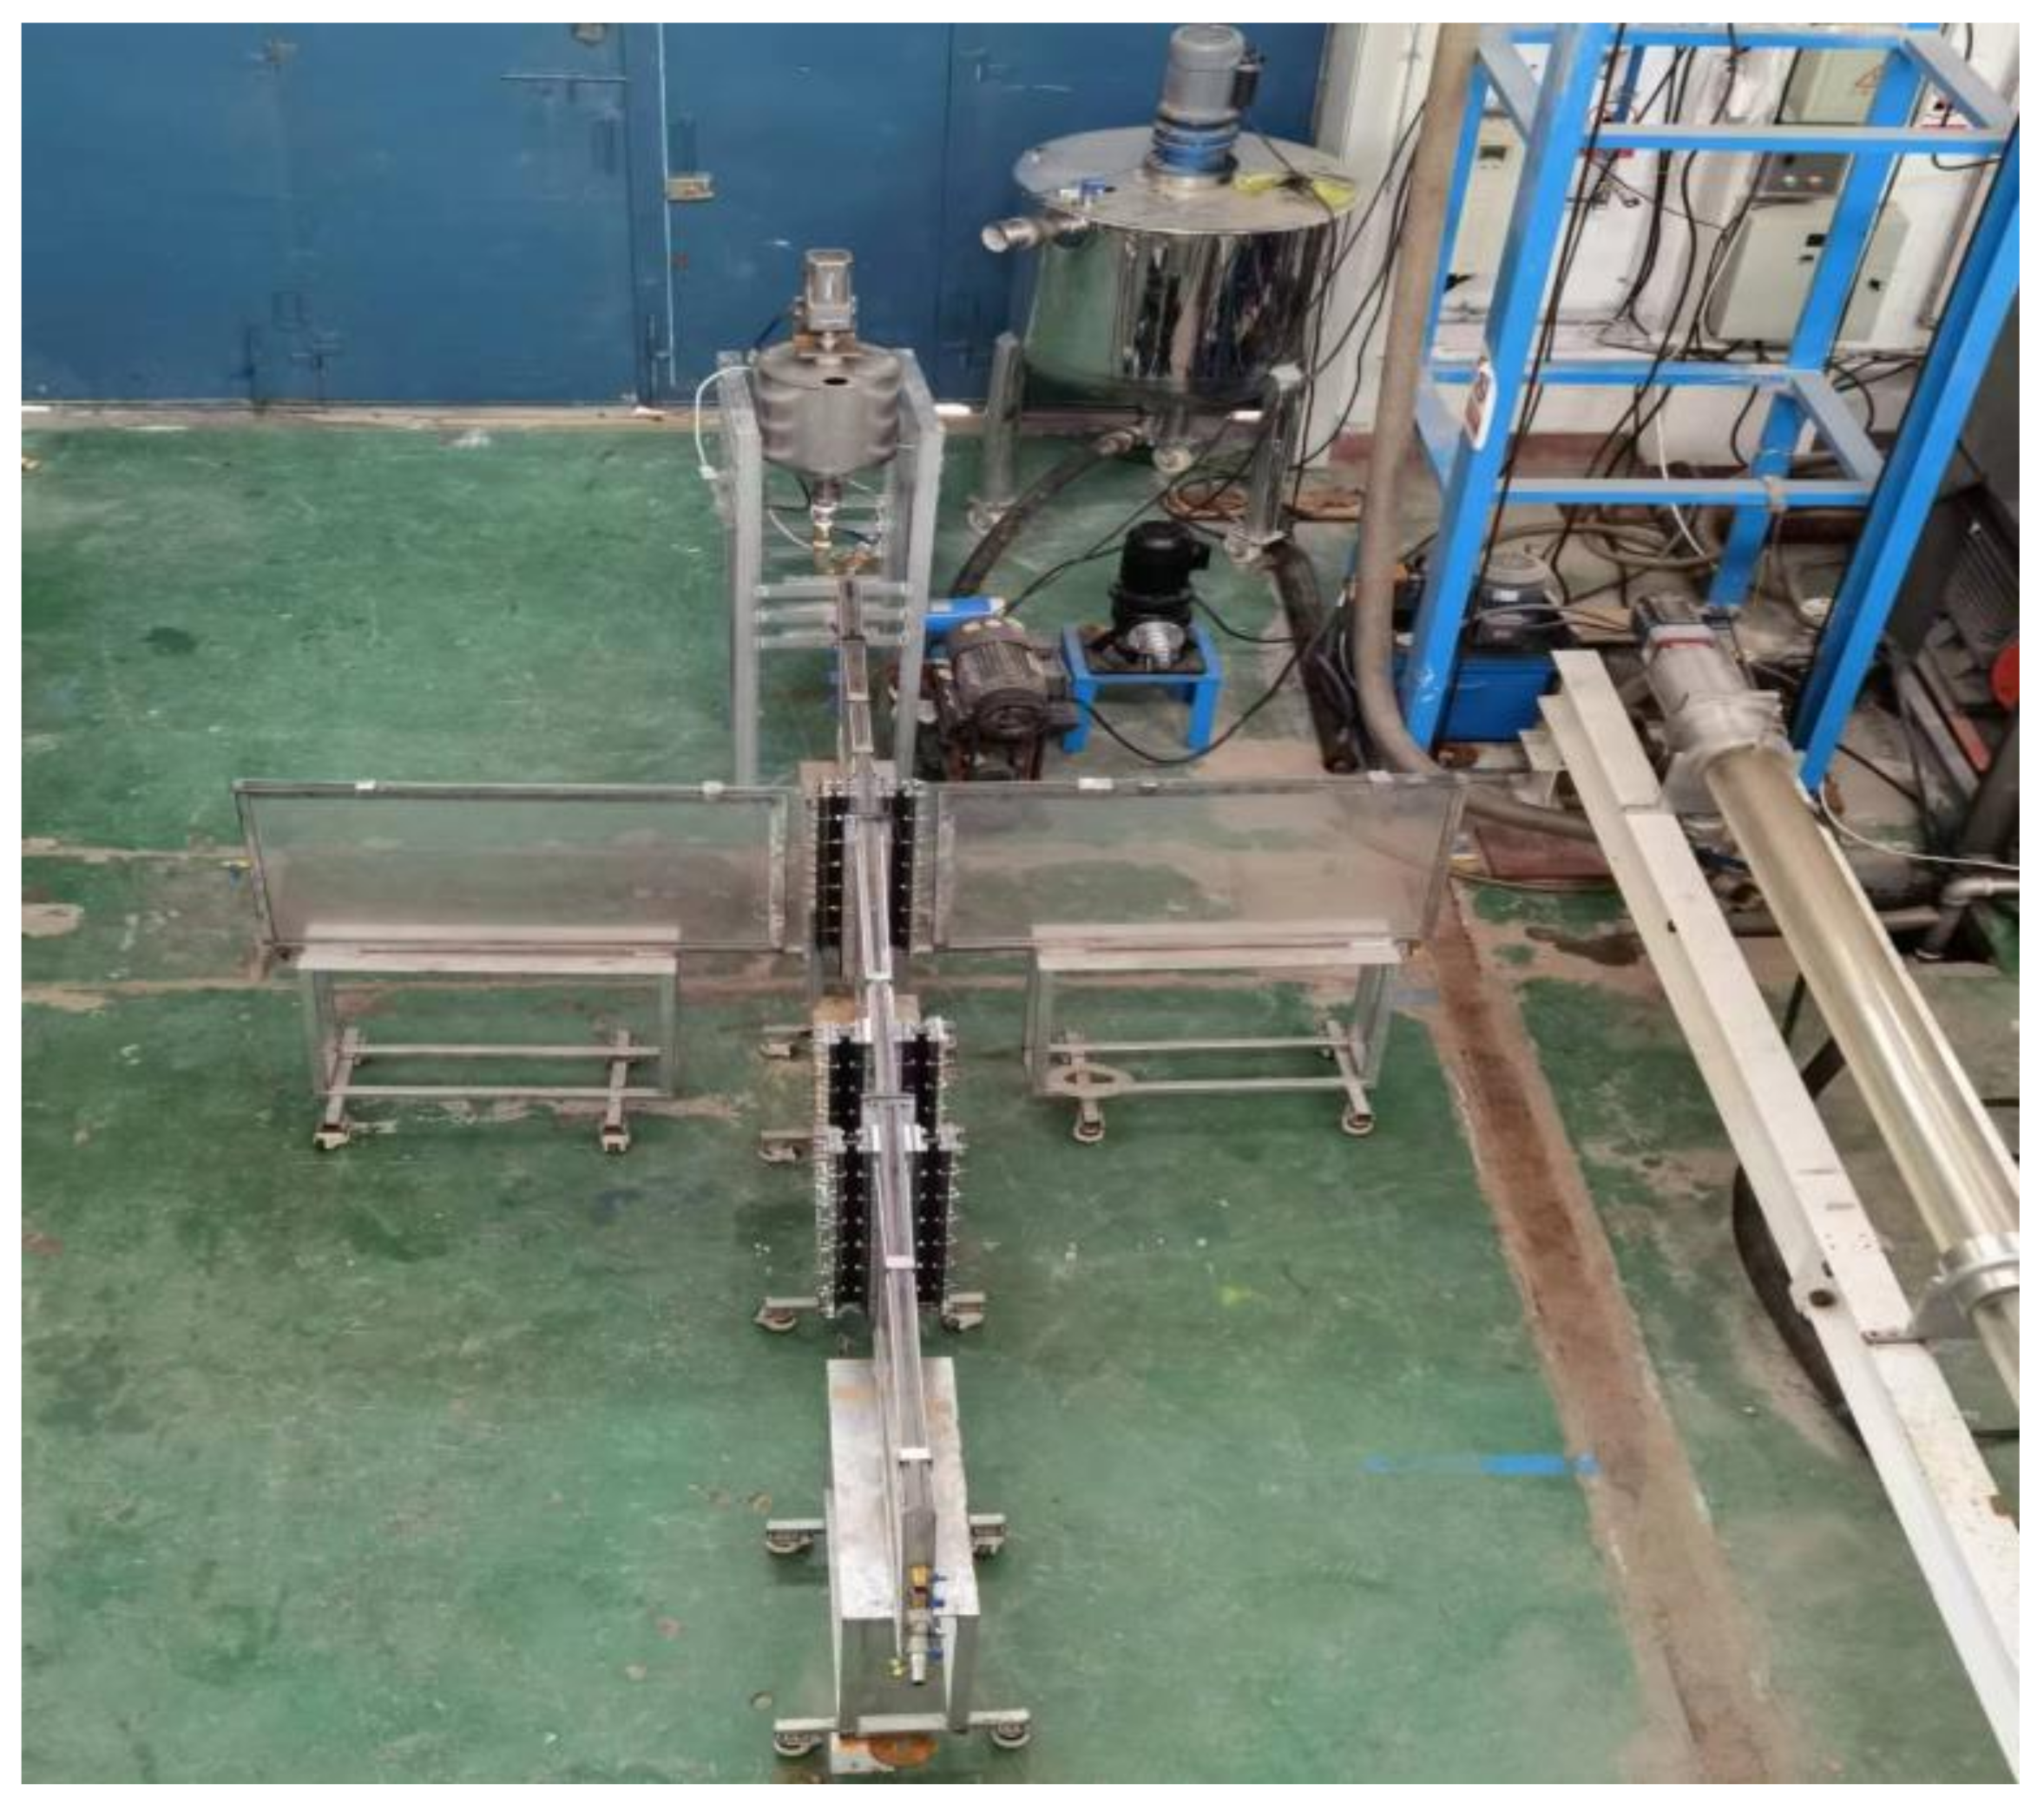
Based on the hydraulic fracturing construction process and fracture morphology of shale reservoirs, a proppant migration experimental device for complex fractures was constructed, as shown in Figure 3. The most important part of the experimental device is the fracture physical model. The fracture is made from a transparent acrylic sheet with a main seam size of 3000 mm × 600 mm × 6 mm. Two branch joints are arranged on both sides of the main joint. The angle of the branch joint can be adjusted and disassembled arbitrarily, and the angle of the branch crack can be adjusted to 30°, 45°, 150°, 135°, or 90°. The length of each branch joint is 1000 mm × 600 mm × 6 mm. In addition to the fracture model, the unit consists of a sand-mixing tank, a sand pump, and other auxiliary units. The sand-mixing tank is made of 304 stainless steel with a capacity of 200.0 L. A 3.0 kW electric motor is installed on the upper part of the sand-mixing tank for mixing, mainly for mixing the fracturing fluid and proppant. The mixing speed can be adjusted. Once the fracturing fluid and sand are configured, the fracturing fluid containing a certain sand ratio is injected from one end of the fracture using a G60-2 screw pump with an injection rate of 0 to 50.0 m3/h. A flow meter, flow control valve, and pressure gauge are used to control and record the fluid flow during the experiment, providing basic parameters for subsequent analysis.

Figure 3.
Experimental device for proppant migration in complex fractures.
2.2. Experimental Principles
In order to more realistically simulate the migration process of proppant under construction circumstances, based on the similarity criterion, the experimental flow rate was set to be the same as the flow rate in the reservoir fracture during the actual fracturing operation. The calculation formulas of the experimental flow rate and flow rate in the reservoir fracture during the actual fracturing construction were as follows [36]:
According to the equal velocity of flow in the experimental and actual seams, it could be established that:
where wn is the actual fracture width, m; wm is the crack physical model in the experimental setup width, m; Qn is the actual construction displacement, m3/min; Qm is the test displacement in the laboratory, m3/min; hn is the actual fracture height, m; hm is the height of the test device, m; vn is the actual construction fluid velocity, m/s; and vm is the test fluid velocity, m/s.
2.3. Experimental Materials and Schemes
The experiment used three types of slickwater with viscosities of 1 mPa·s, 10 mPa·s, and 20 mPa·s mixed with proppant particles. The proppant was selected as ceramsite particles with diameters of 0.64 mm, 0.45 mm, and 0.32 mm and densities of 2450 kg/m3, 2600 kg/m3, and 2830 kg/m3. It was assumed that the main fracture height of hydraulic fracturing was 60 m and the fracture width was 0.01 m. The fracture height of the test device in this paper was 0.6 m, and the fracture width was 0.006 m. The field displacement rates were 4.17 m3/min, 5.50 m3/min, and 6.96 m3/min. Using Formula (3), the experimental fluid flow rates were calculated to be 1.5 m3/h, 2.0 m3/h, and 2.5 m3/h, respectively. Under the condition of experimental displacement, the maximum sand ratio that the sand-mixing pump can withstand is 6%, so the sand ratios selected in the experiment were 2%, 4%, and 6%, respectively. Table 1 shows the specific experimental scheme.

Table 1.
Parameter settings of different experiments.
2.4. Experimental Procedure
- Based on the set flow data, the corresponding speed data of the variable speed mixer were calculated, and the type of flow channel required for the experiment was determined and assembled;
- The water valve and screw pump of the sand-mixing tank were opened and pure liquid without particles was injected into the experimental flow channel so that the pure liquid filled the whole flow channel device;
- The liquid and particles required for the experimental particle concentration were added to the sand-mixing tank, and the mixer was switched on to mix the liquid and particles in the sand-mixing tank evenly;
- The valve of the corresponding device was opened, the screw pump was started to adjust the flow rate necessary for the experiment, the sand-carrying liquid was injected into the flow channel device, and the pressure balance in the flow channel was maintained by opening the outlet of the flow channel;
- A high-definition camera was used to record the shape of the sand dyke generated by the sand-carrying liquid entering the flow channel every 1 min, and the time required for the sand dyke shape to realize the equilibrium height and related parameters was recorded;
- During the experiment, high-speed cameras were adopted to obtain pictures of the shape of the proppant sand embankment at different times and under different influencing factors. According to the size data of the physical model, GetData software (Software Version 2.20) was used to accurately read the results of the experimental sand embankment;
- To reduce the interference of uncertain factors in the experiment and improve the accuracy of the experimental measurement results, each group of experiments was repeated three times. In the subsequent data processing, only the experimental data with a standard deviation less than 5% were retained, and the average of the three tests was calculated as the final result;
- At the end of the experiment, the flow channel device was rinsed with a high flow of water. The experimental process is shown in Figure 4.
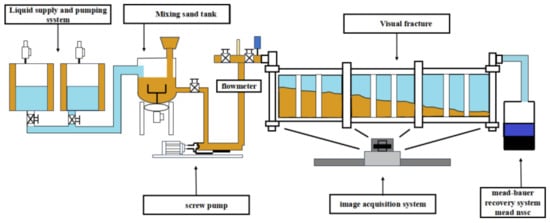 Figure 4. Flow chart of the proppant transport experiment.
2.5. Illustration of Experimental Outcomes
The major coefficients characterizing the shape of the sand dyke in the fracture are the equilibrium height and equilibrium time of the sand dyke. These two coefficients can show the shape of the sand dyke to some degree, but they cannot characterize the level of sand filling in the near-wellbore area. To quantitatively and intuitively describe the shape of the sand embankment, based on the proposed equilibrium height and equilibrium time, the lowest point height hEQ of the front margin of the sand embankment is introduced to characterize the shape of the sand embankment. The lowest point height hEQ of the leading margin of the sandbank refers to the height of the proppant piled up near the fracture entrance when the sandbank reaches equilibrium. The effective stacking height can effectively realize the sand-filling effect near the inlet of the flow channel and better solve the necking phenomenon near the inlet of the flow channel, and a higher diversion effect of the flow channel can be obtained. Therefore, a higher parameter for the lowest point height of the front margin of the sandbank is preferable.
3. Results and Discussion
3.1. Proppant Migration Law of Single Fracture
3.1.1. The Formation Process of Sandbanks
Figure 5 presents a picture of the shape of the sand embankment at different times during experiment 1. In the figure, the change in proppant color from green to black indicates that the injection order is from early to late. In the early injection stage, the proppant began to settle due to its own gravity. However, due to the high experimental displacement, the proppant did not immediately accumulate in large amounts at the entrance of the fracture but dispersed evenly at the bottom of the whole fracture. With the continuous injection of proppant, a high amount of proppant accumulates at the distal end of the fracture and gradually forms a sand embankment, as shown in Figure 5a. During the middle stage of injection, due to the blocking effect of the early formed sandbank on the flow field in the fracture, the solid particles injected in this stage are more inclined to deposit near the fracture mouth. As the height of the sand embankment increases, its blocking effect on the flow field in the fracture is enhanced, such that the flow field turns upward near the fracture. Therefore, the solid particles injected in the medium term are lifted vertically, resulting in most of the particles deposited at the front end of the sand embankment, thus forming an inclined surface at the top of the sand embankment. On the back side of the sand embankment, due to the weakening of the nearby flow field, the erosion of the sand embankment surface by the sand-carrying liquid is weakened, and the rolling and friction between the solid particles control the shape of the back side of the sand embankment, thus forming a highly inclined surface, as shown in Figure 5b. In the later injection stage, with the continuous growth of the height of the sand embankment, there is a decrease in the flow section above the sand embankment and an increase in the flow rate of the sand-carrying liquid, which increases erosion on the surface of the sand embankment. When the sedimentation flux and resuspension flux of the solid particles at the top of the sand embankment reach equilibrium, the height of the sand embankment stops growing, indicating that the equilibrium height has been reached. When the equilibrium height is reached, the subsequent injected particles are lifted vertically near the fracture mouth and then carried over the sandbank to the depth of the fracture, as displayed in Figure 5c. During sand dyke formation, a large unfilled area of particles is formed near the fracture due to the erosion of the sand-carrying fluid. For hydraulic fracturing, the unfilled fracture area of particles will close after the fracturing construction, thus affecting the fracturing effect.

Figure 5.
The formation process of the sand dyke: (a) t = 60 s; (b) t = 120 s; (c) t = 120 s.
3.1.2. Proppant Migration Law under Different Displacements
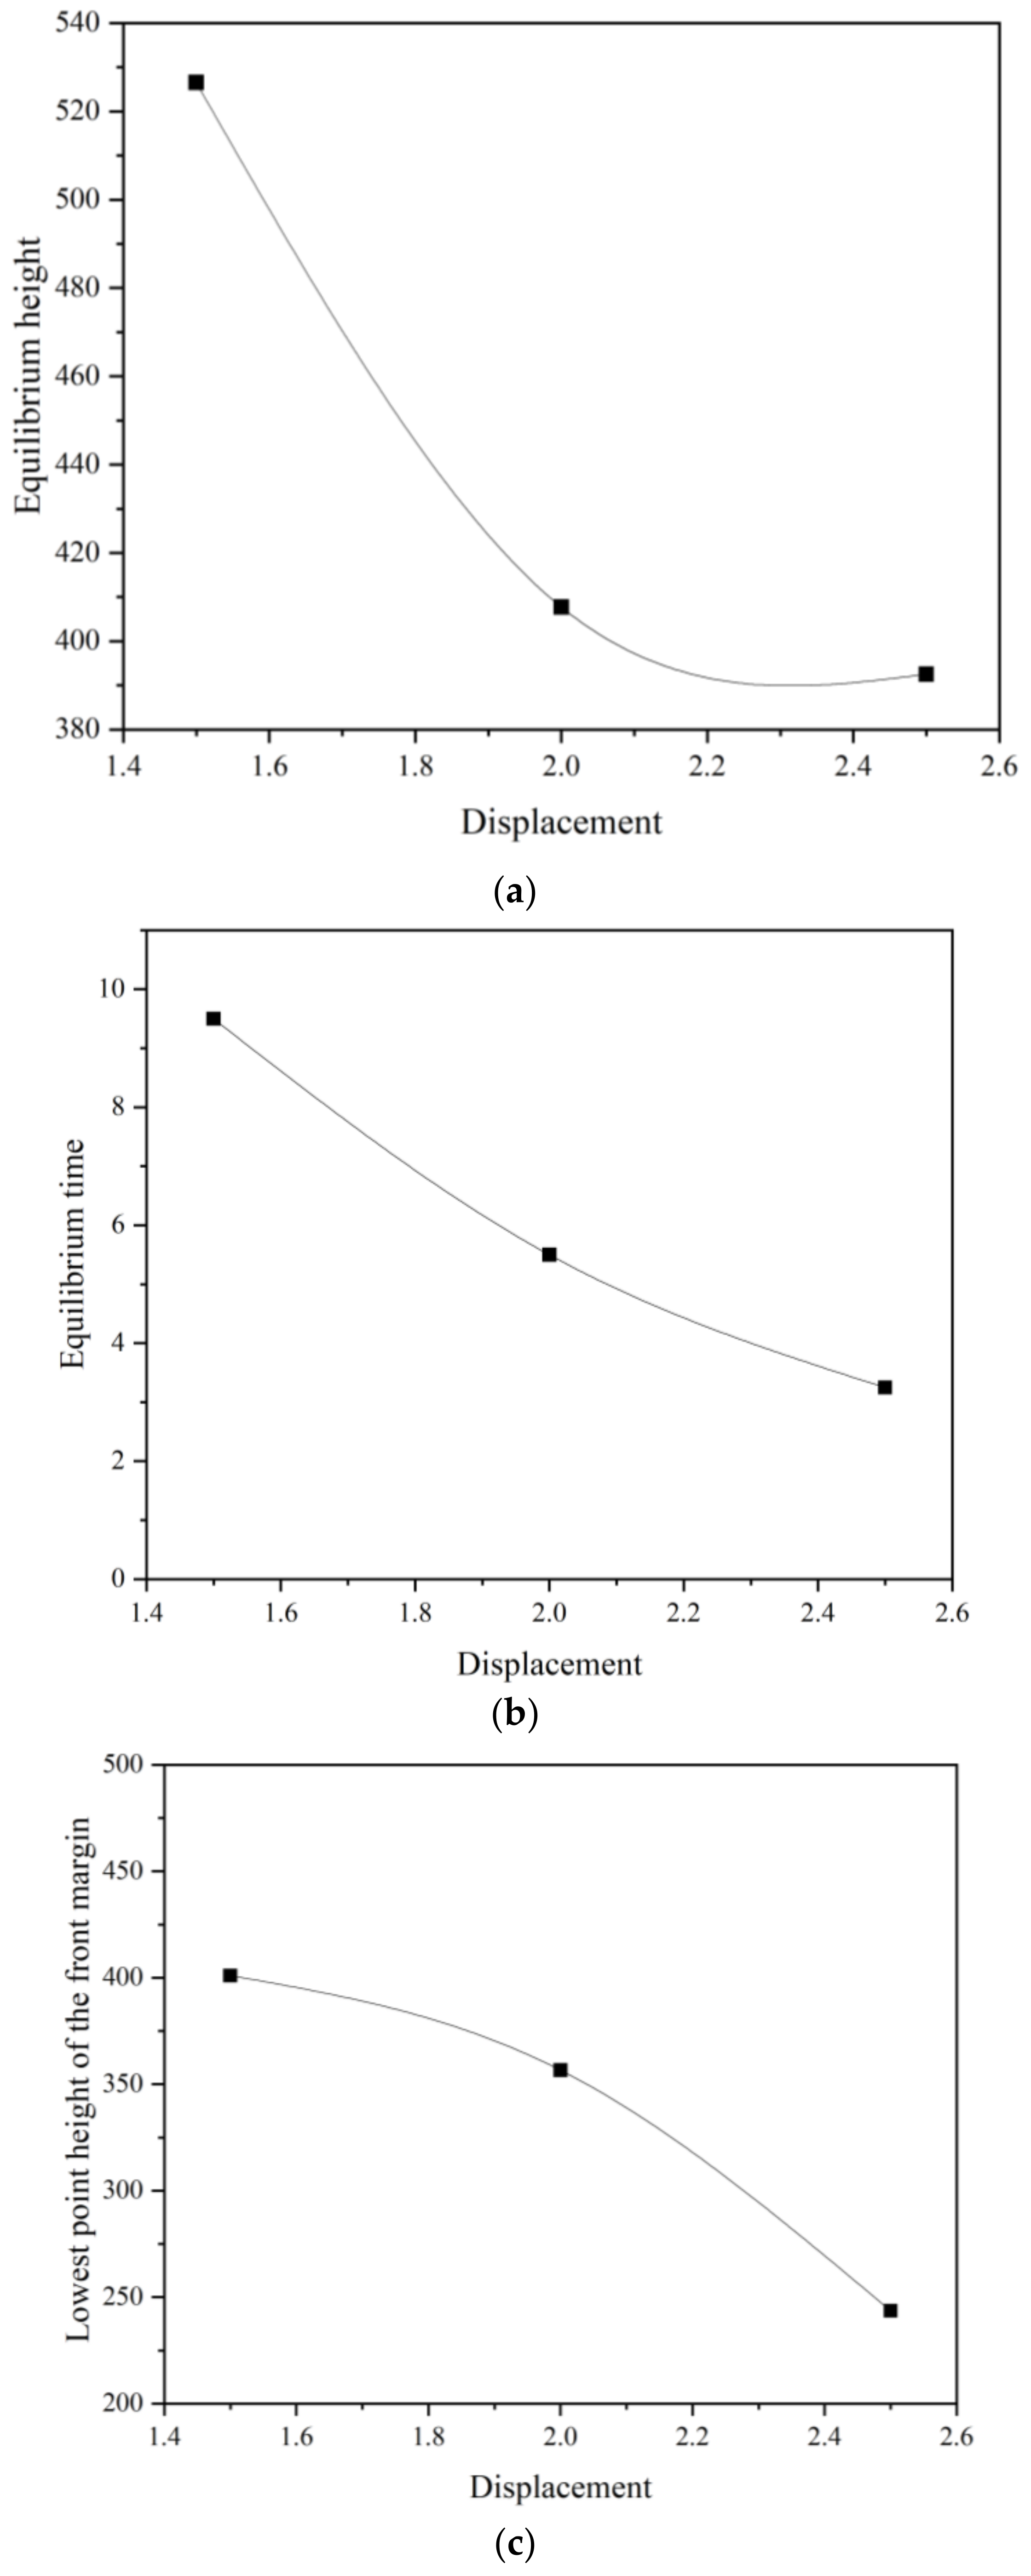
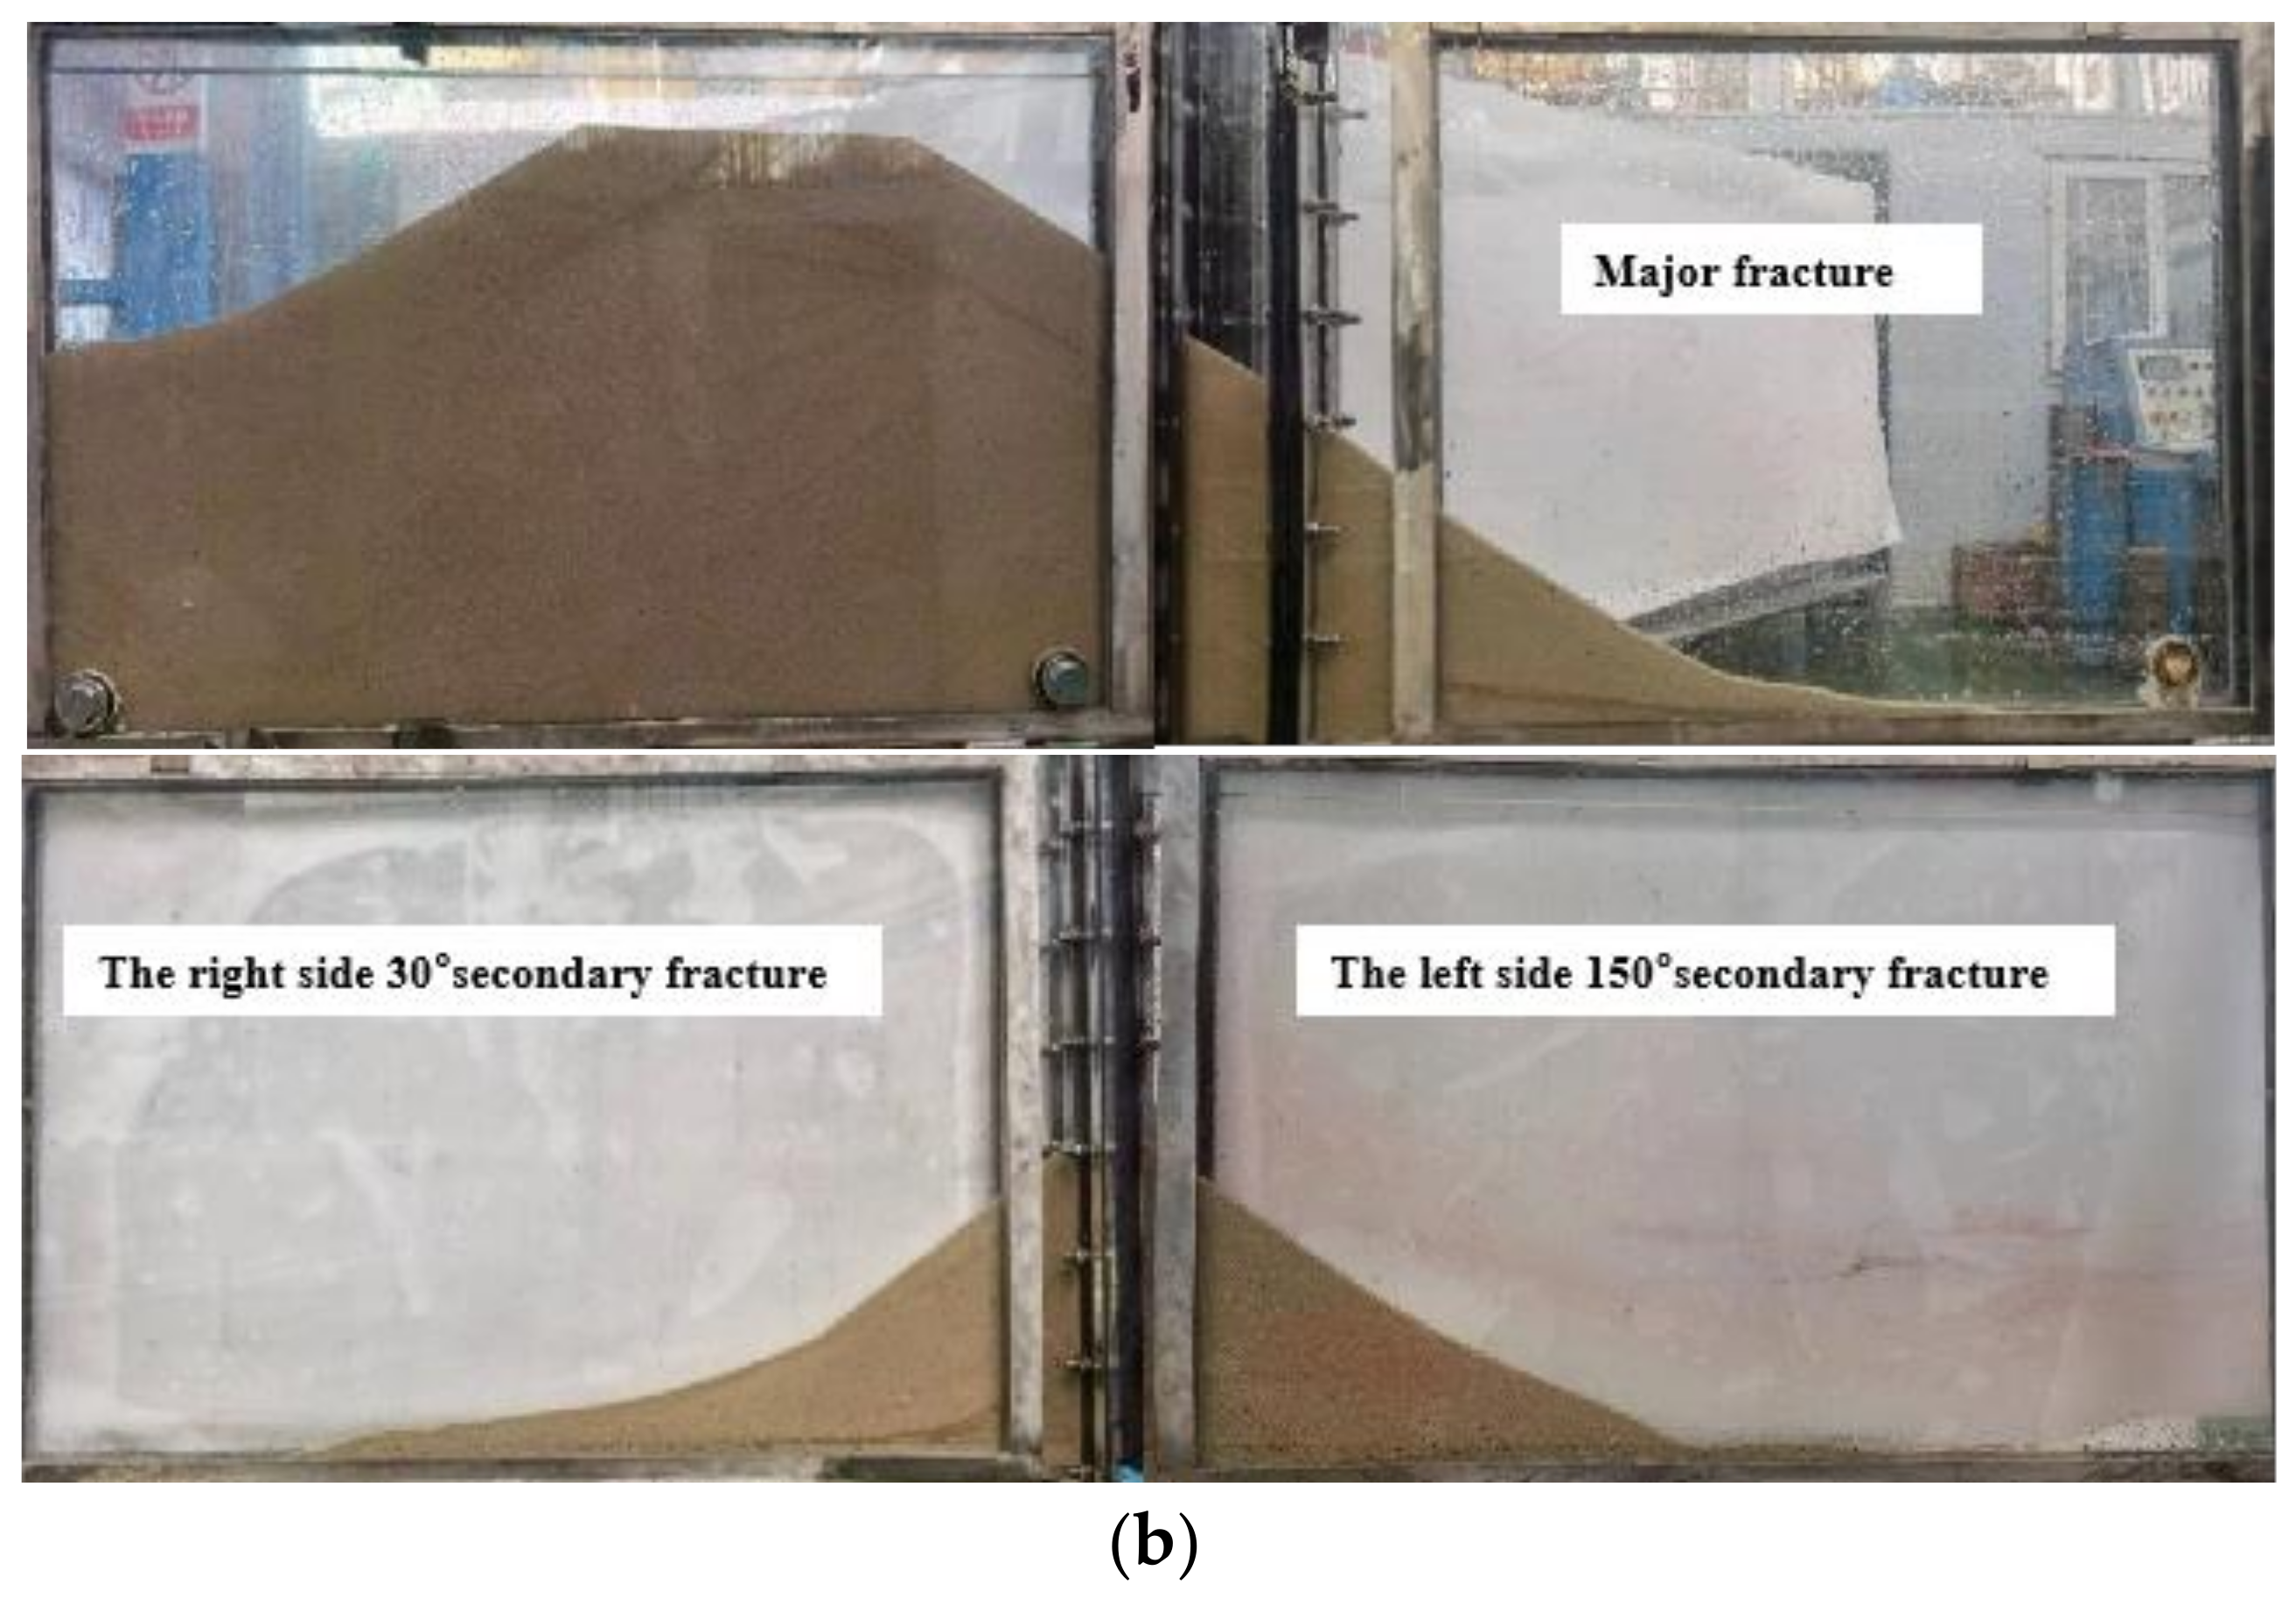
Figure 6 displays the curve of sandbank coefficients with displacements when the sandbank reaches equilibrium in experiment 1, experiment 2, and experiment 5. Figure 6 shows that as the displacement increased, the equilibrium time, the lowest point height of the front margin of the sandbank, and the equilibrium height of the sandbank gradually decreased. For the equilibrium velocity of the flow field at a low injection displacement, a higher sandbank height is required to form a smaller flow area. Therefore, as the displacement increased, the equilibrium height of the sandbank decreased, and the corresponding equilibrium time decreased. At the same time, the high flow velocity caused by high displacement will scour the sandbank near the fracture, so that some particles flow to the far end of the flow channel. Therefore, in the equilibrium state, the height of the lowest point of the sandbank front decreased as the flow rate grows. During fracturing, appropriate displacement should be used to ensure that sufficient proppant can be filled in the fracture inlet and the fracture depth to ensure that the fracture has sufficient conductivity.

Figure 6.
Sandbank coefficients with the displacement curve: (a) equilibrium height with the displacement curve; (b) equilibrium time with the displacement curve; (c) the lowest point height of the front margin of the sandbank with the displacement curve.
3.1.3. Proppant Migration Law under Different Displacements
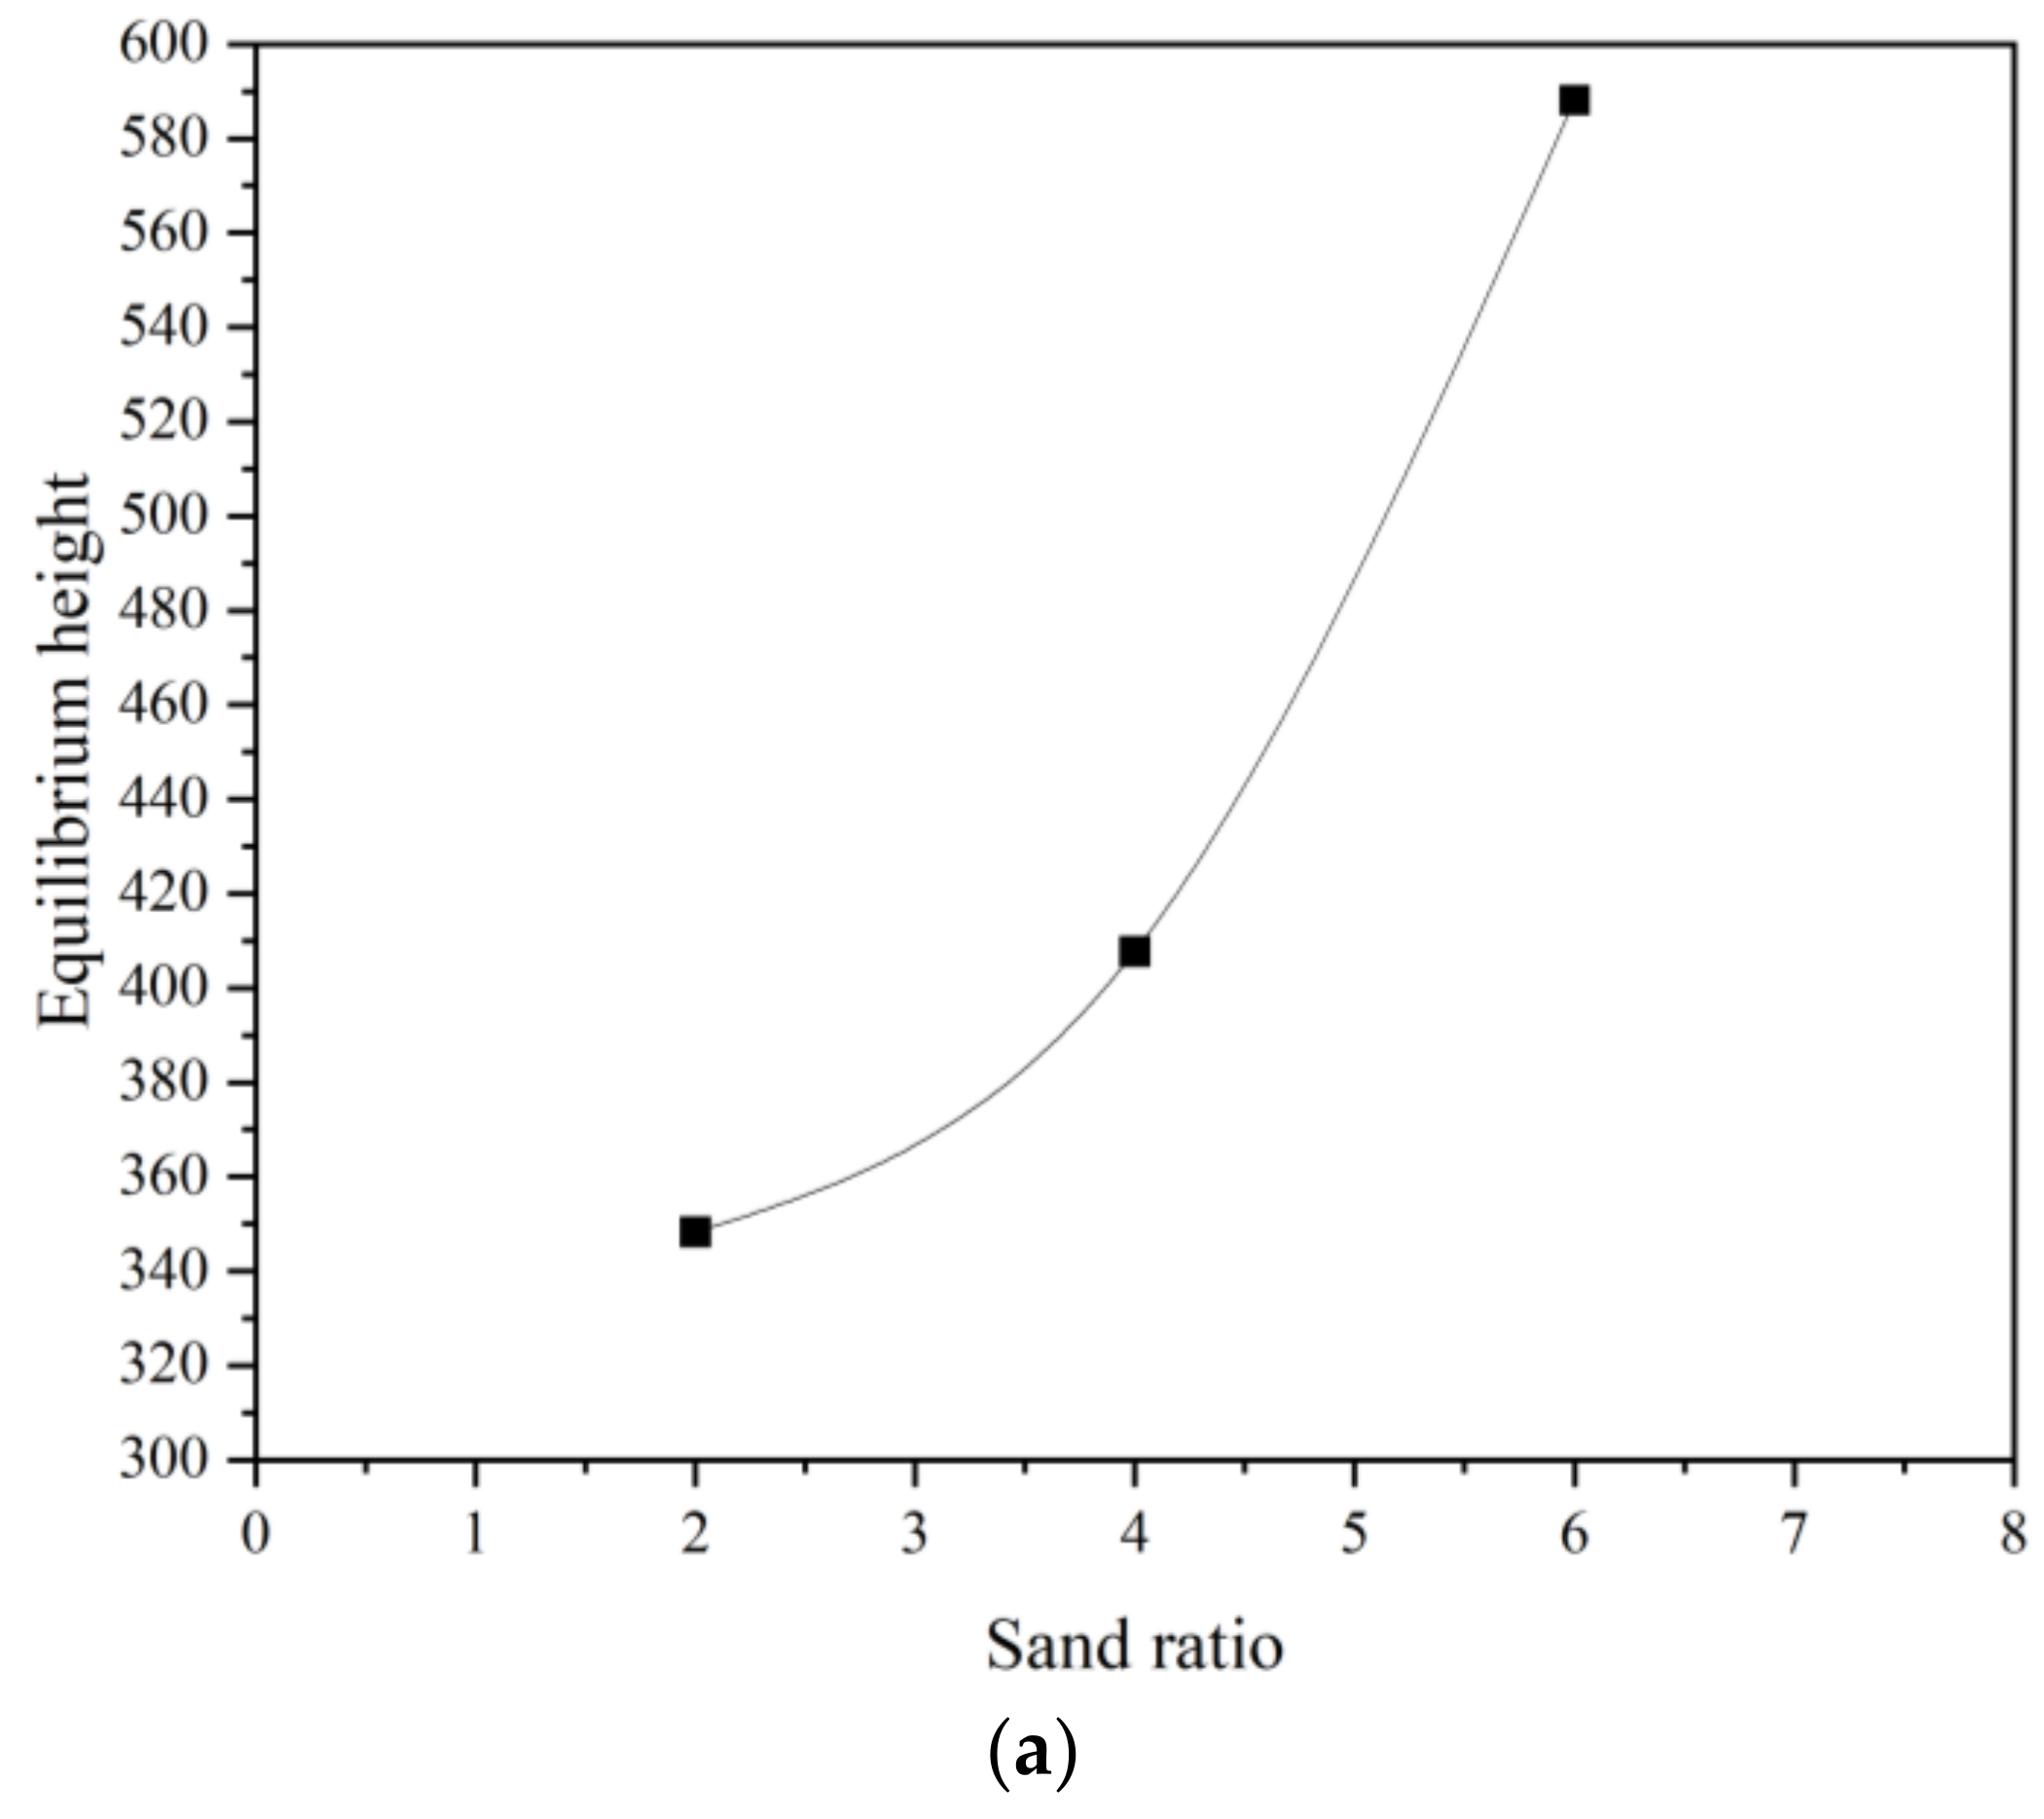
Figure 7 presents the curve of the sand embankment coefficients with the sand ratio when the sand embankment reaches equilibrium in experiment 2, experiment 8, and experiment 9. With the increase in the particle concentration, the minimum height of the main edge of the sand embankment and the equilibrium height of the sand embankment gradually increase, and the equilibrium time gradually decreases. This is because as the sand proportion grows, the sand-carrying fluid carries more proppant into the fracturing fractures. When the other conditions are the same, more proppant will settle, and the height of the sandbank will increase quickly, so the equilibrium time of the sandbank declines. This is due to the collision between the proppants, which costs a large amount of energy provided by the sand-carrying fluid. Under the same other conditions, the bigger the sand proportion, the more energy the proppant consumes, and a larger equilibrium height is needed to realize the equilibrium flow velocity. Therefore, as the proppant concentration increases, the sand embankment height increases. At the same time, with the increase in the sand ratio, although the sand embankment is affected by erosion, more proppant can continue to settle and supplement it, so the height of the lowest point at the front margin of the sand embankment gradually increases.
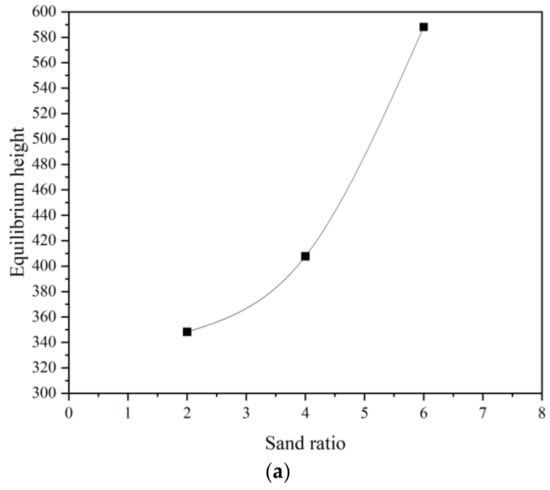

Figure 7.
Sandbank coefficients with the sand ratio curve: (a) equilibrium height with the sand ratio curve; (b) equilibrium time with the sand ratio curve; (c) lowest point height of the front margin of the sandbank with the sand ratio curve.
3.1.4. Proppant Migration Law under Different Densities
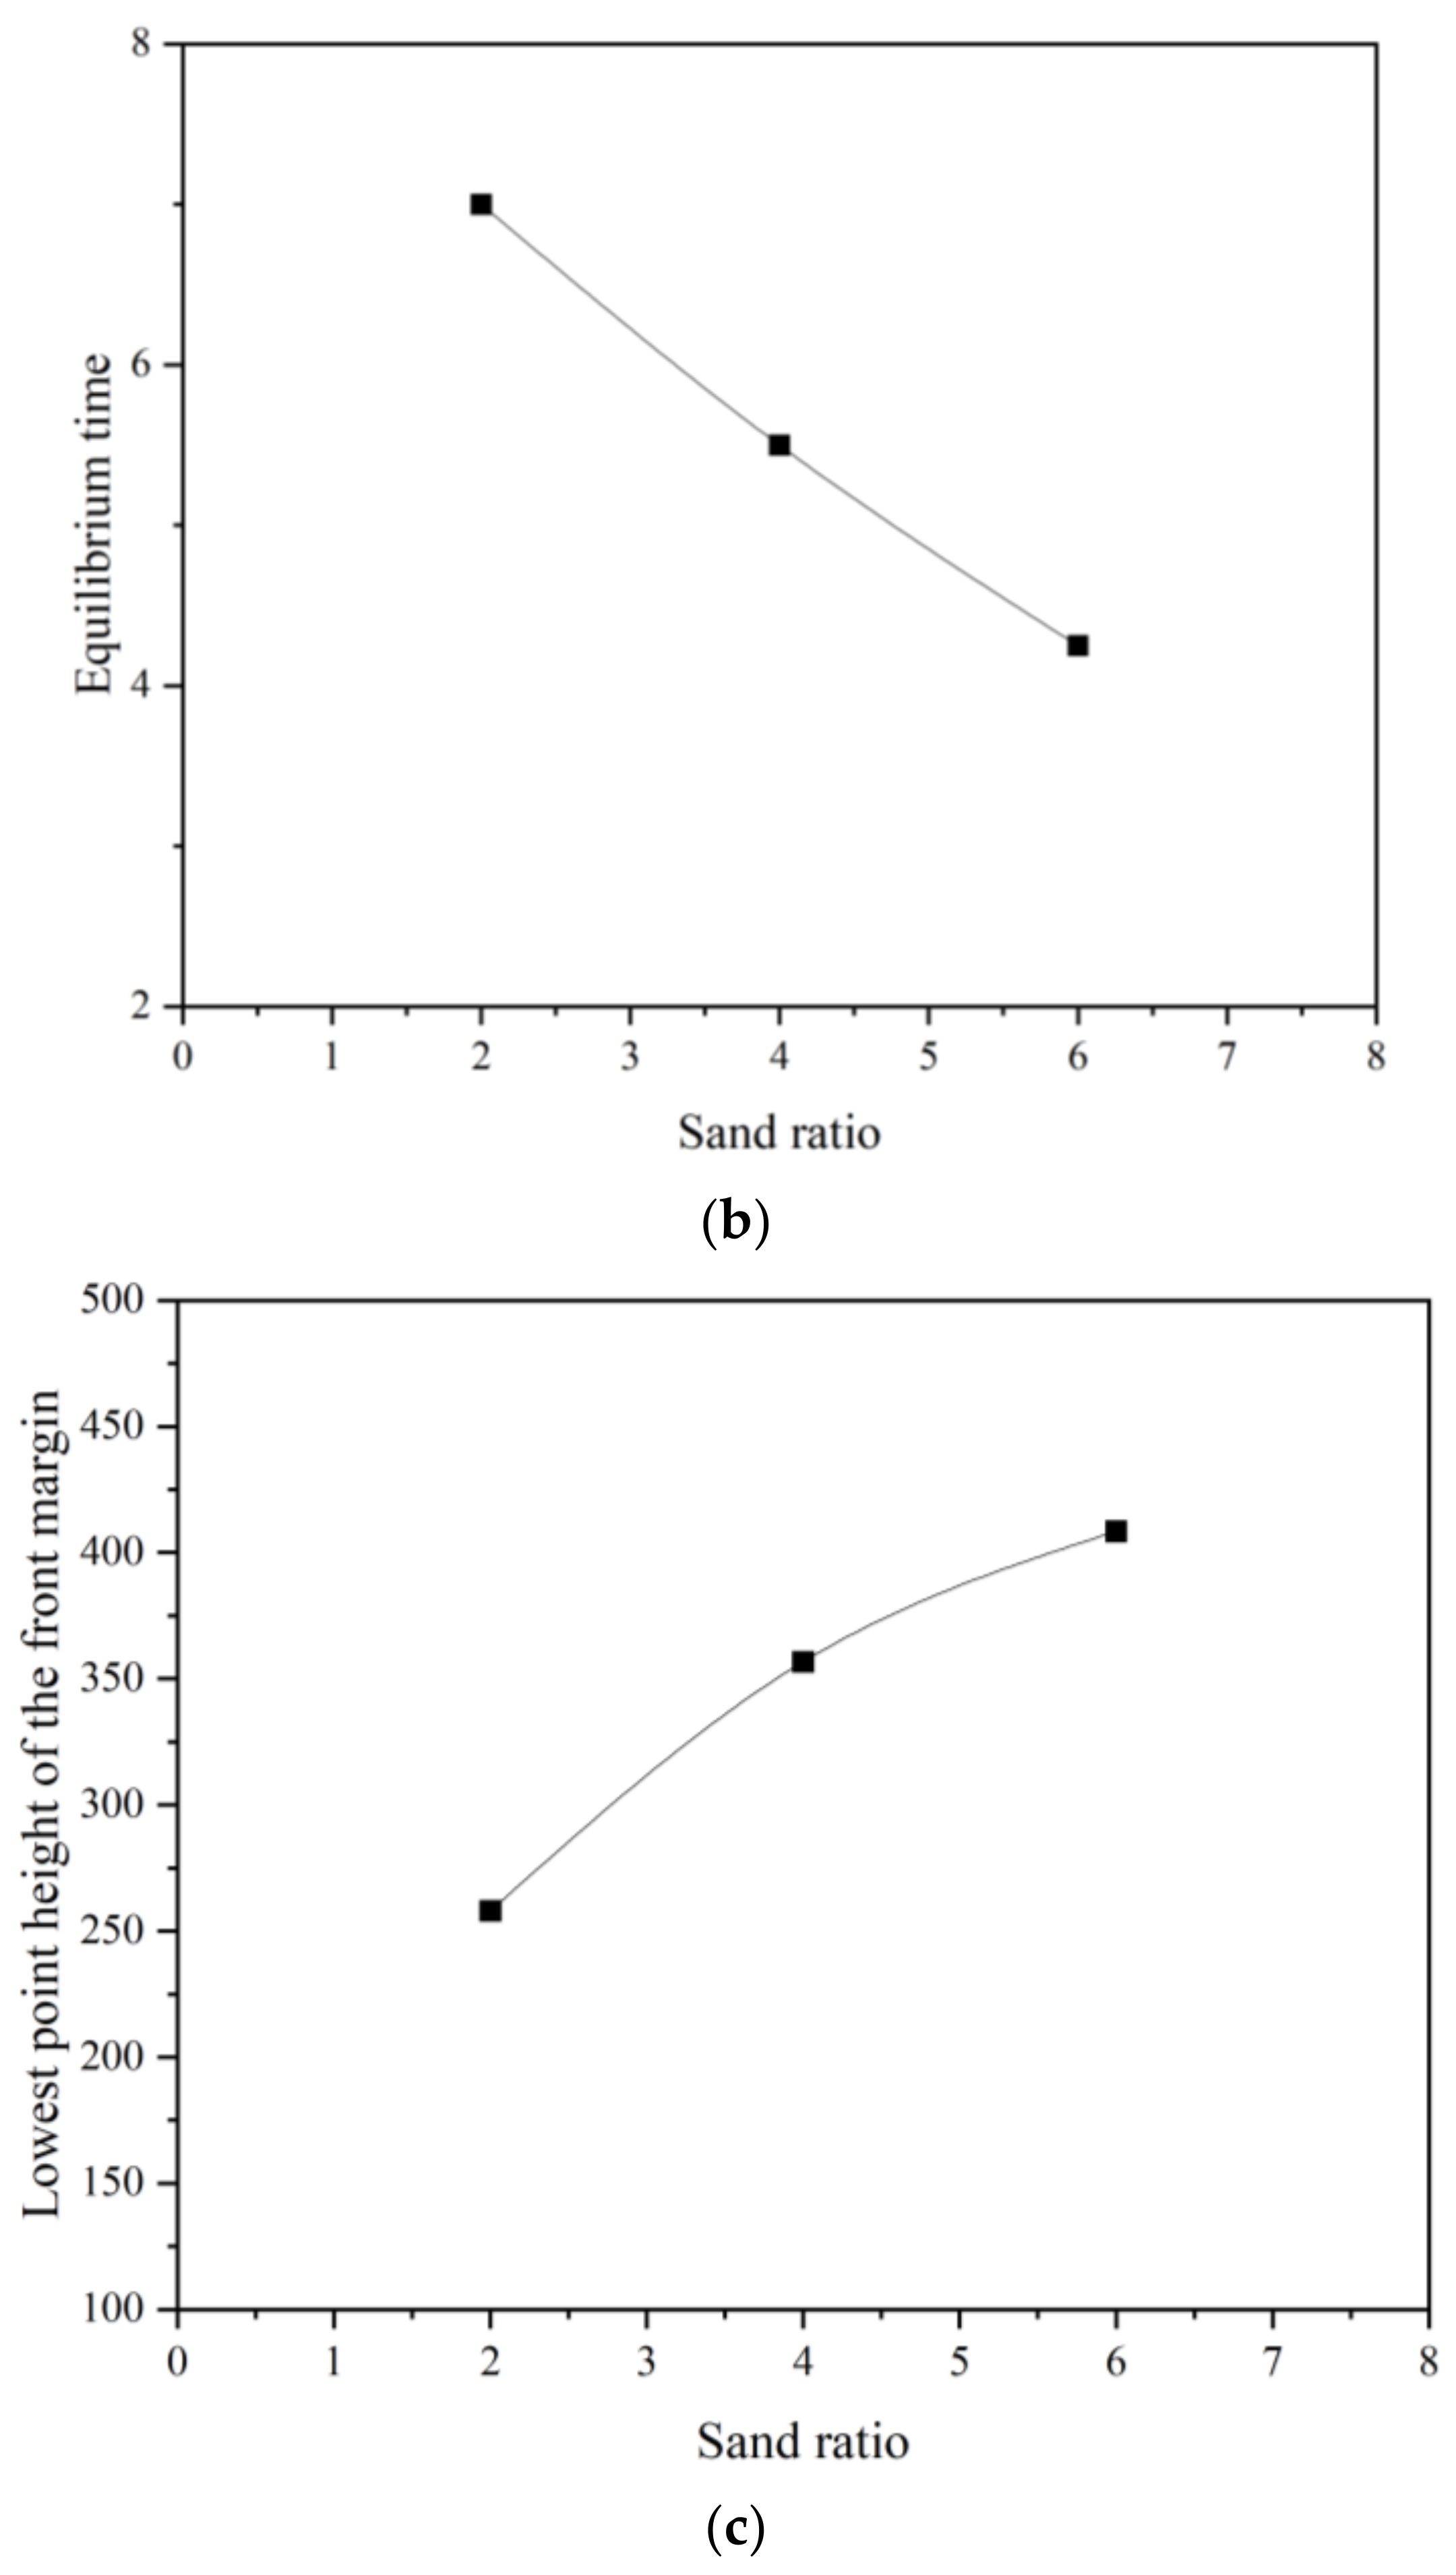
Figure 8 shows the change curve of the sand dyke coefficients with the proppant density when the sand dyke reaches equilibrium in experiments 5, 6, and 7. As the proppant density grows, the minimum height of the main margin of the sand embankment and the equilibrium height of the sand embankment gradually increase, and the equilibrium time gradually decreases because with the increase in the particle density, the fracturing fluid is difficult to carry the high-density proppant. Hence, for the equilibrium flow velocity, a smaller cross-section of the upper part of the sandbank is required. Hence, with the increase in the proppant density, the height of the sandbank grows. Due to the rapid settlement rate of the high-density proppant, the balance time of the sandbank is slightly reduced. At the same time, as the proppant density increases, the ability of sand dyke to resist erosion is greater, so the height of the lowest point at the front edge of sand dyke increases. The proppant density directly determines where the proppant starts to settle; therefore, in the design of fracturing construction, a proppant with the appropriate density should be chosen based on the generation conditions. For long-fracture fracturing, a low-density proppant should be used first to facilitate its settlement at the distal end of the fracture, and then a high-density proppant should be used to effectively support the fractures in the near-wellbore area.

Figure 8.
Sandbank coefficients with the proppant density curve: (a) equilibrium height with the proppant density curve; (b) equilibrium time with the proppant density curve; (c) lowest point height of the front margin of the sandbank with the proppant density curve.
3.1.5. Proppant Migration Law under Various Fracturing Fluid Viscosities
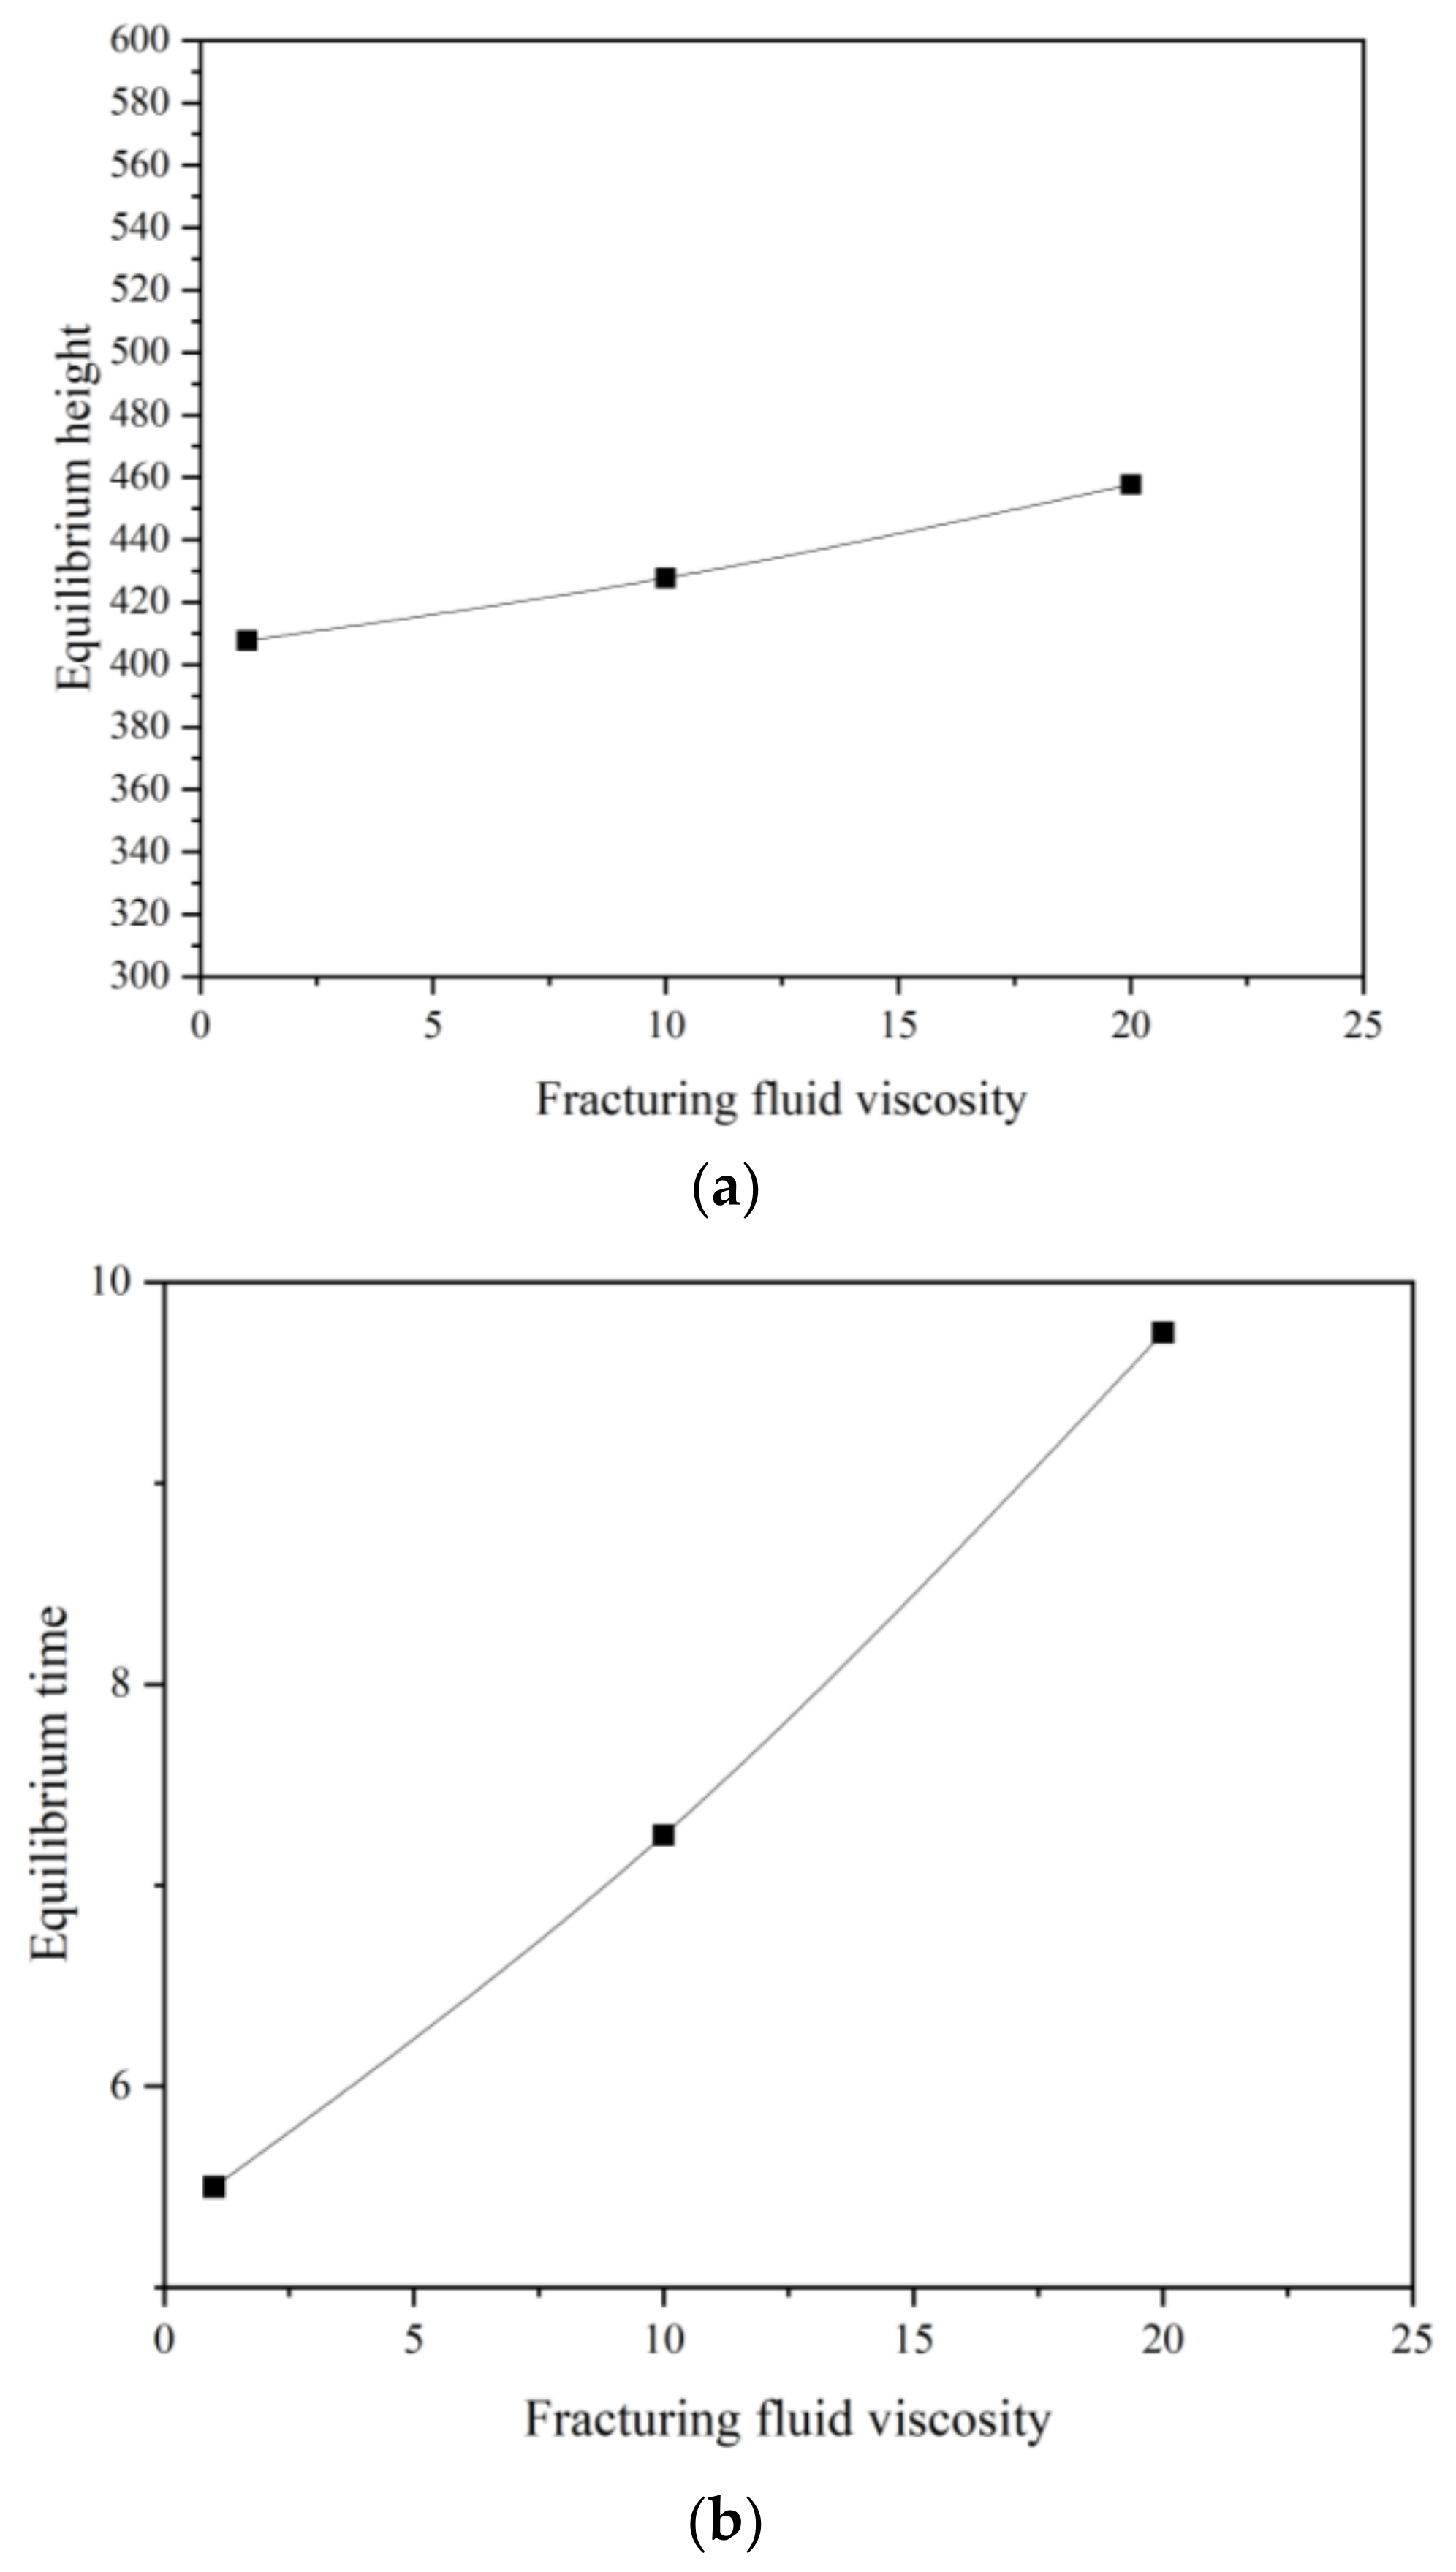
Figure 9 shows the curve of the sandbank parameters with the viscosity of the fracturing fluid when the sandbanks of experiment 2, experiment 3, and experiment 4 reach equilibrium. As the viscosity of the fracturing fluid increased, the equilibrium height of the proppant sandbank and the lowest point height of the sandbank front edge decreased, and the equilibrium time increased gradually. This is because with the high fluid viscosity of the fracturing fluid, the smaller the acceleration of the proppant in the vertical direction, the larger the sand-carrying capacity of the fracturing fluid in the horizontal direction, and the stronger the erosion effect. Therefore, the longer the time to reach the equilibrium height, the lower the required equilibrium flow rate, the smaller the corresponding equilibrium height, and the smaller the lowest point height of the sand embankment front. Although the high-viscosity fracturing fluid is helpful for carrying sand, it also suffers strong resistance along the path and significant energy loss during the flow in the fracture. Therefore, in the face of long-fracture fracturing, low-viscosity fracturing fluid and low-density proppant can be used as a combination method to meet the goal of long-distance placement of the proppant and obtain longer effective support fractures.
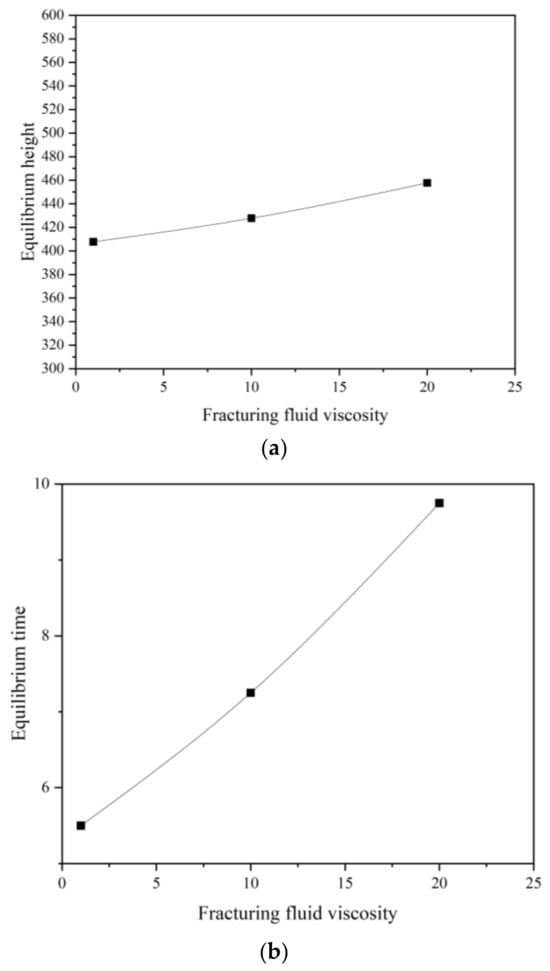

Figure 9.
Sandbank coefficients with the fracturing fluid viscosity curve: (a) equilibrium height with the fracturing fluid viscosity curve; (b) equilibrium time with the fracturing fluid viscosity curve; (c) lowest point height of the front margin of the sandbank with the fracturing fluid viscosity curve.
3.2. Proppant Migration Law in Complex Fractures
3.2.1. The Influence of Displacement on the Shape of Complex Fractured Sand Dykes
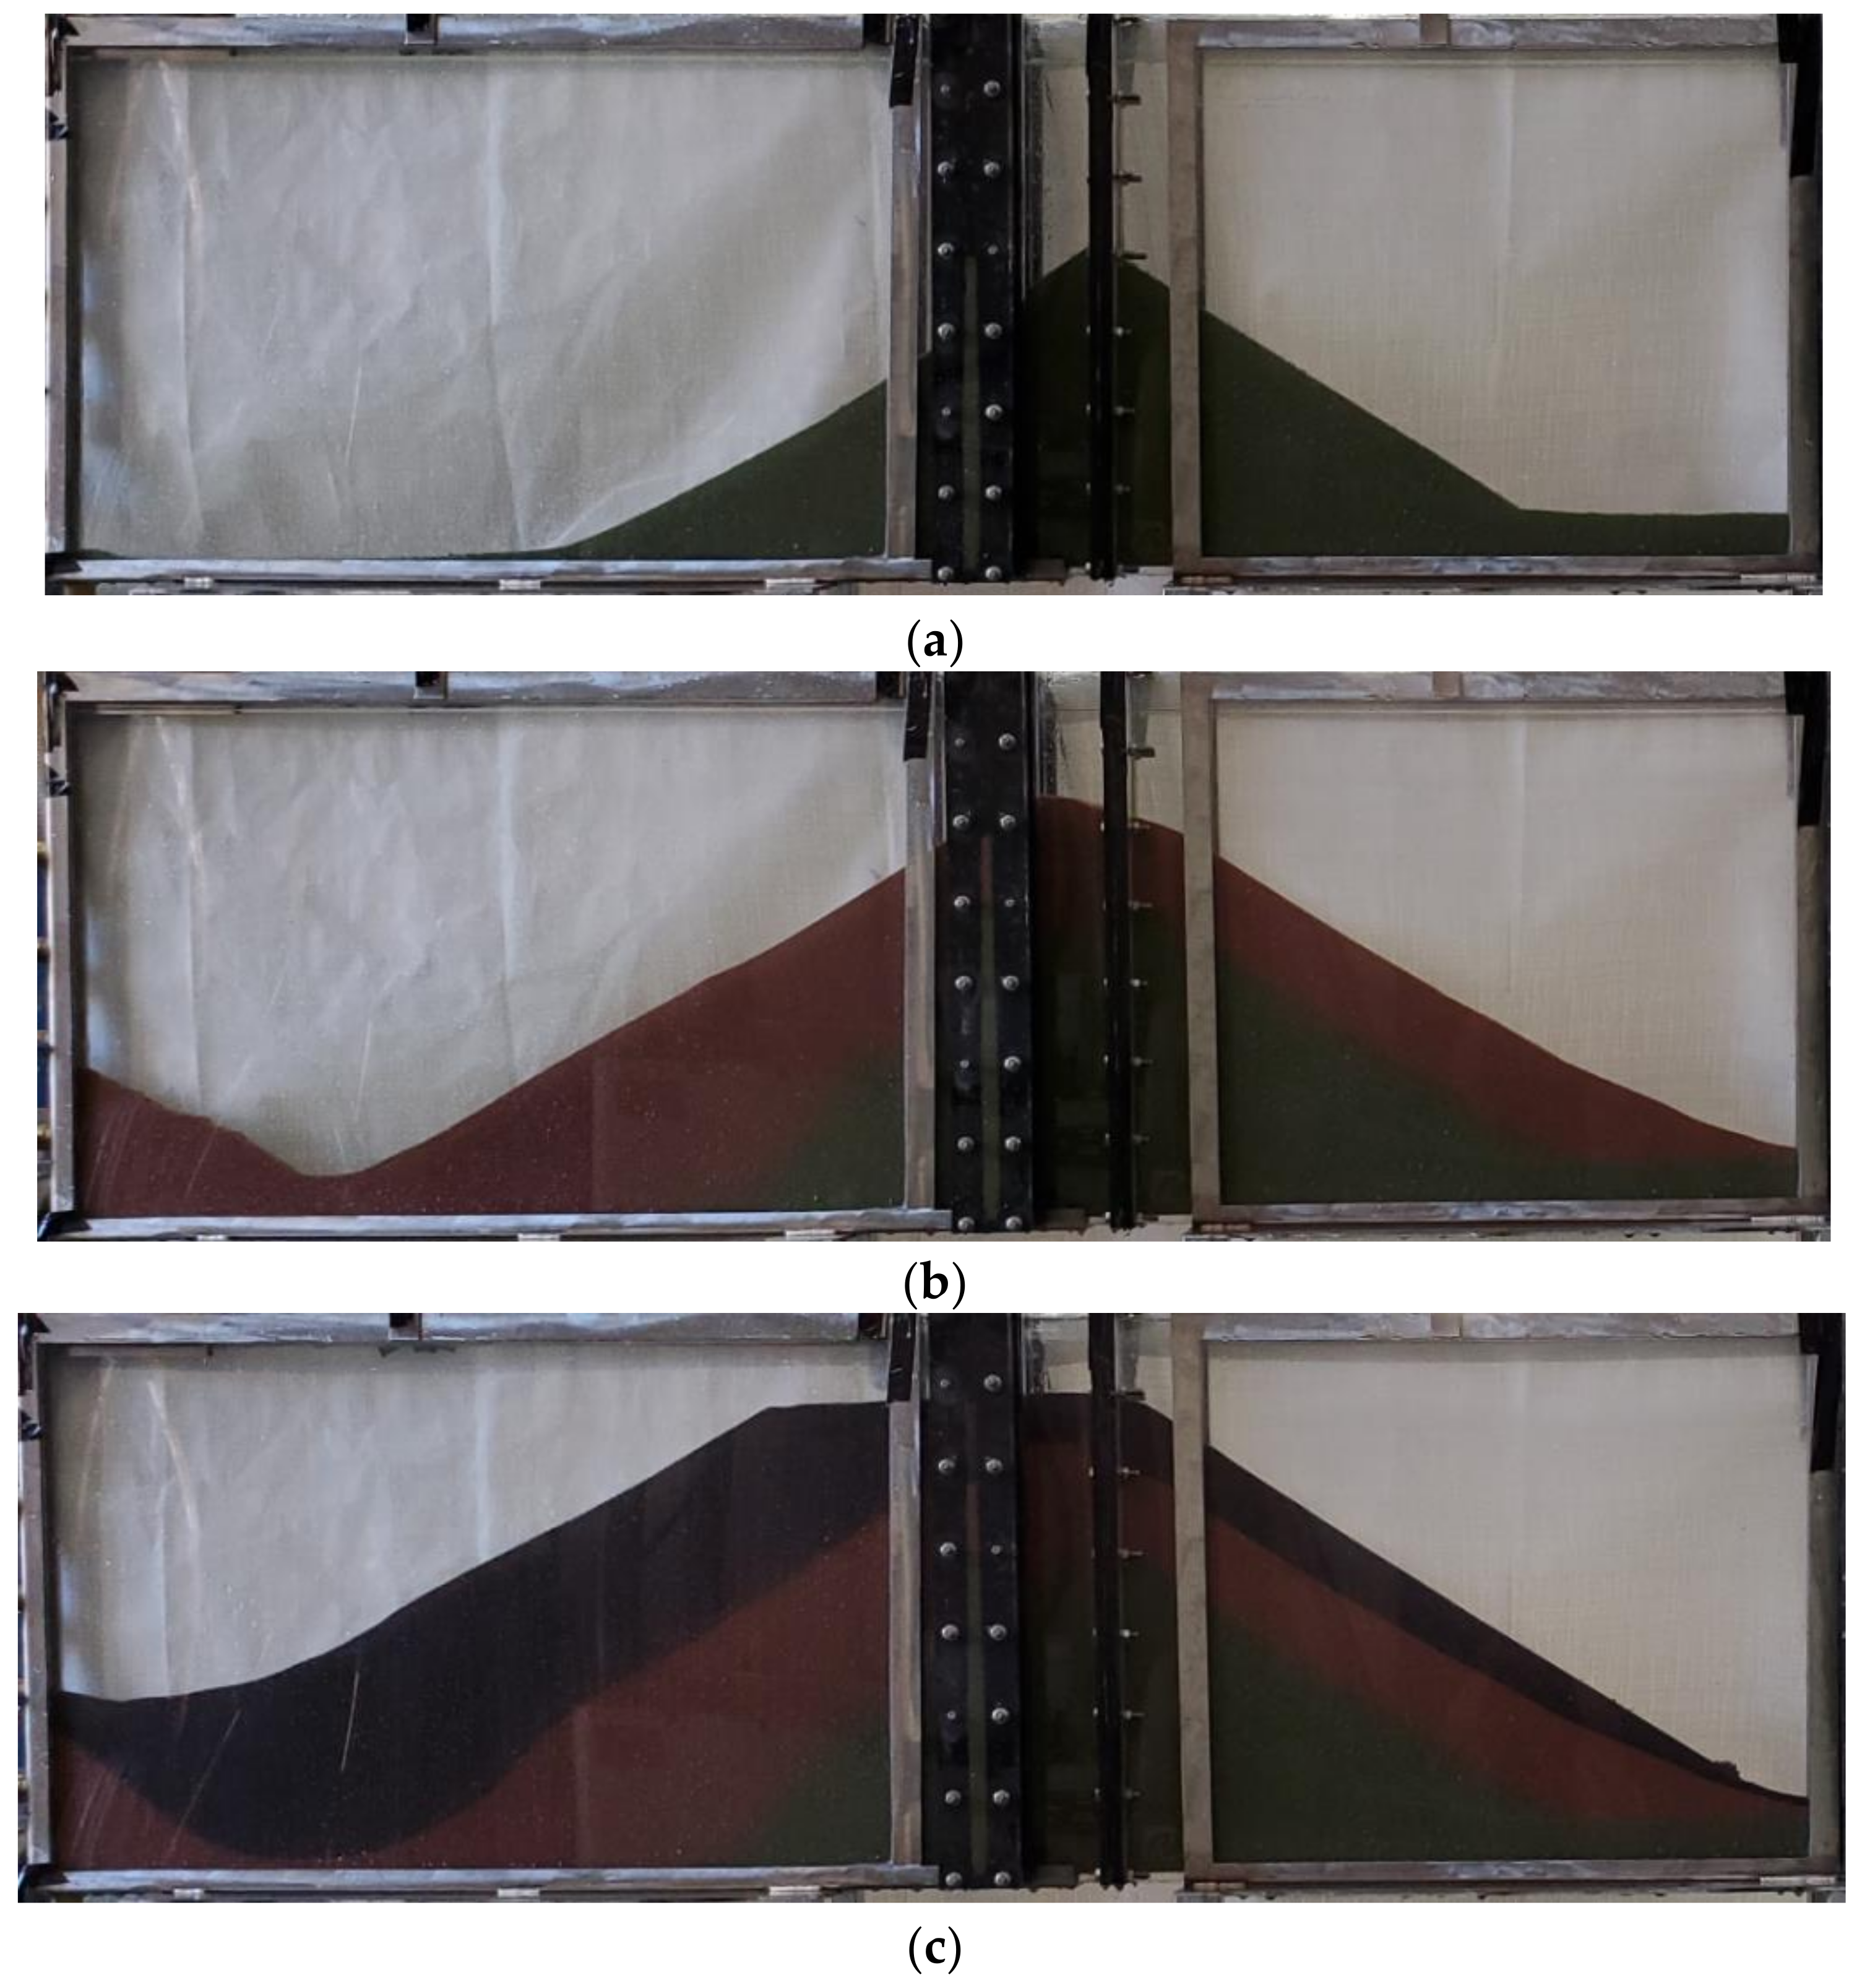
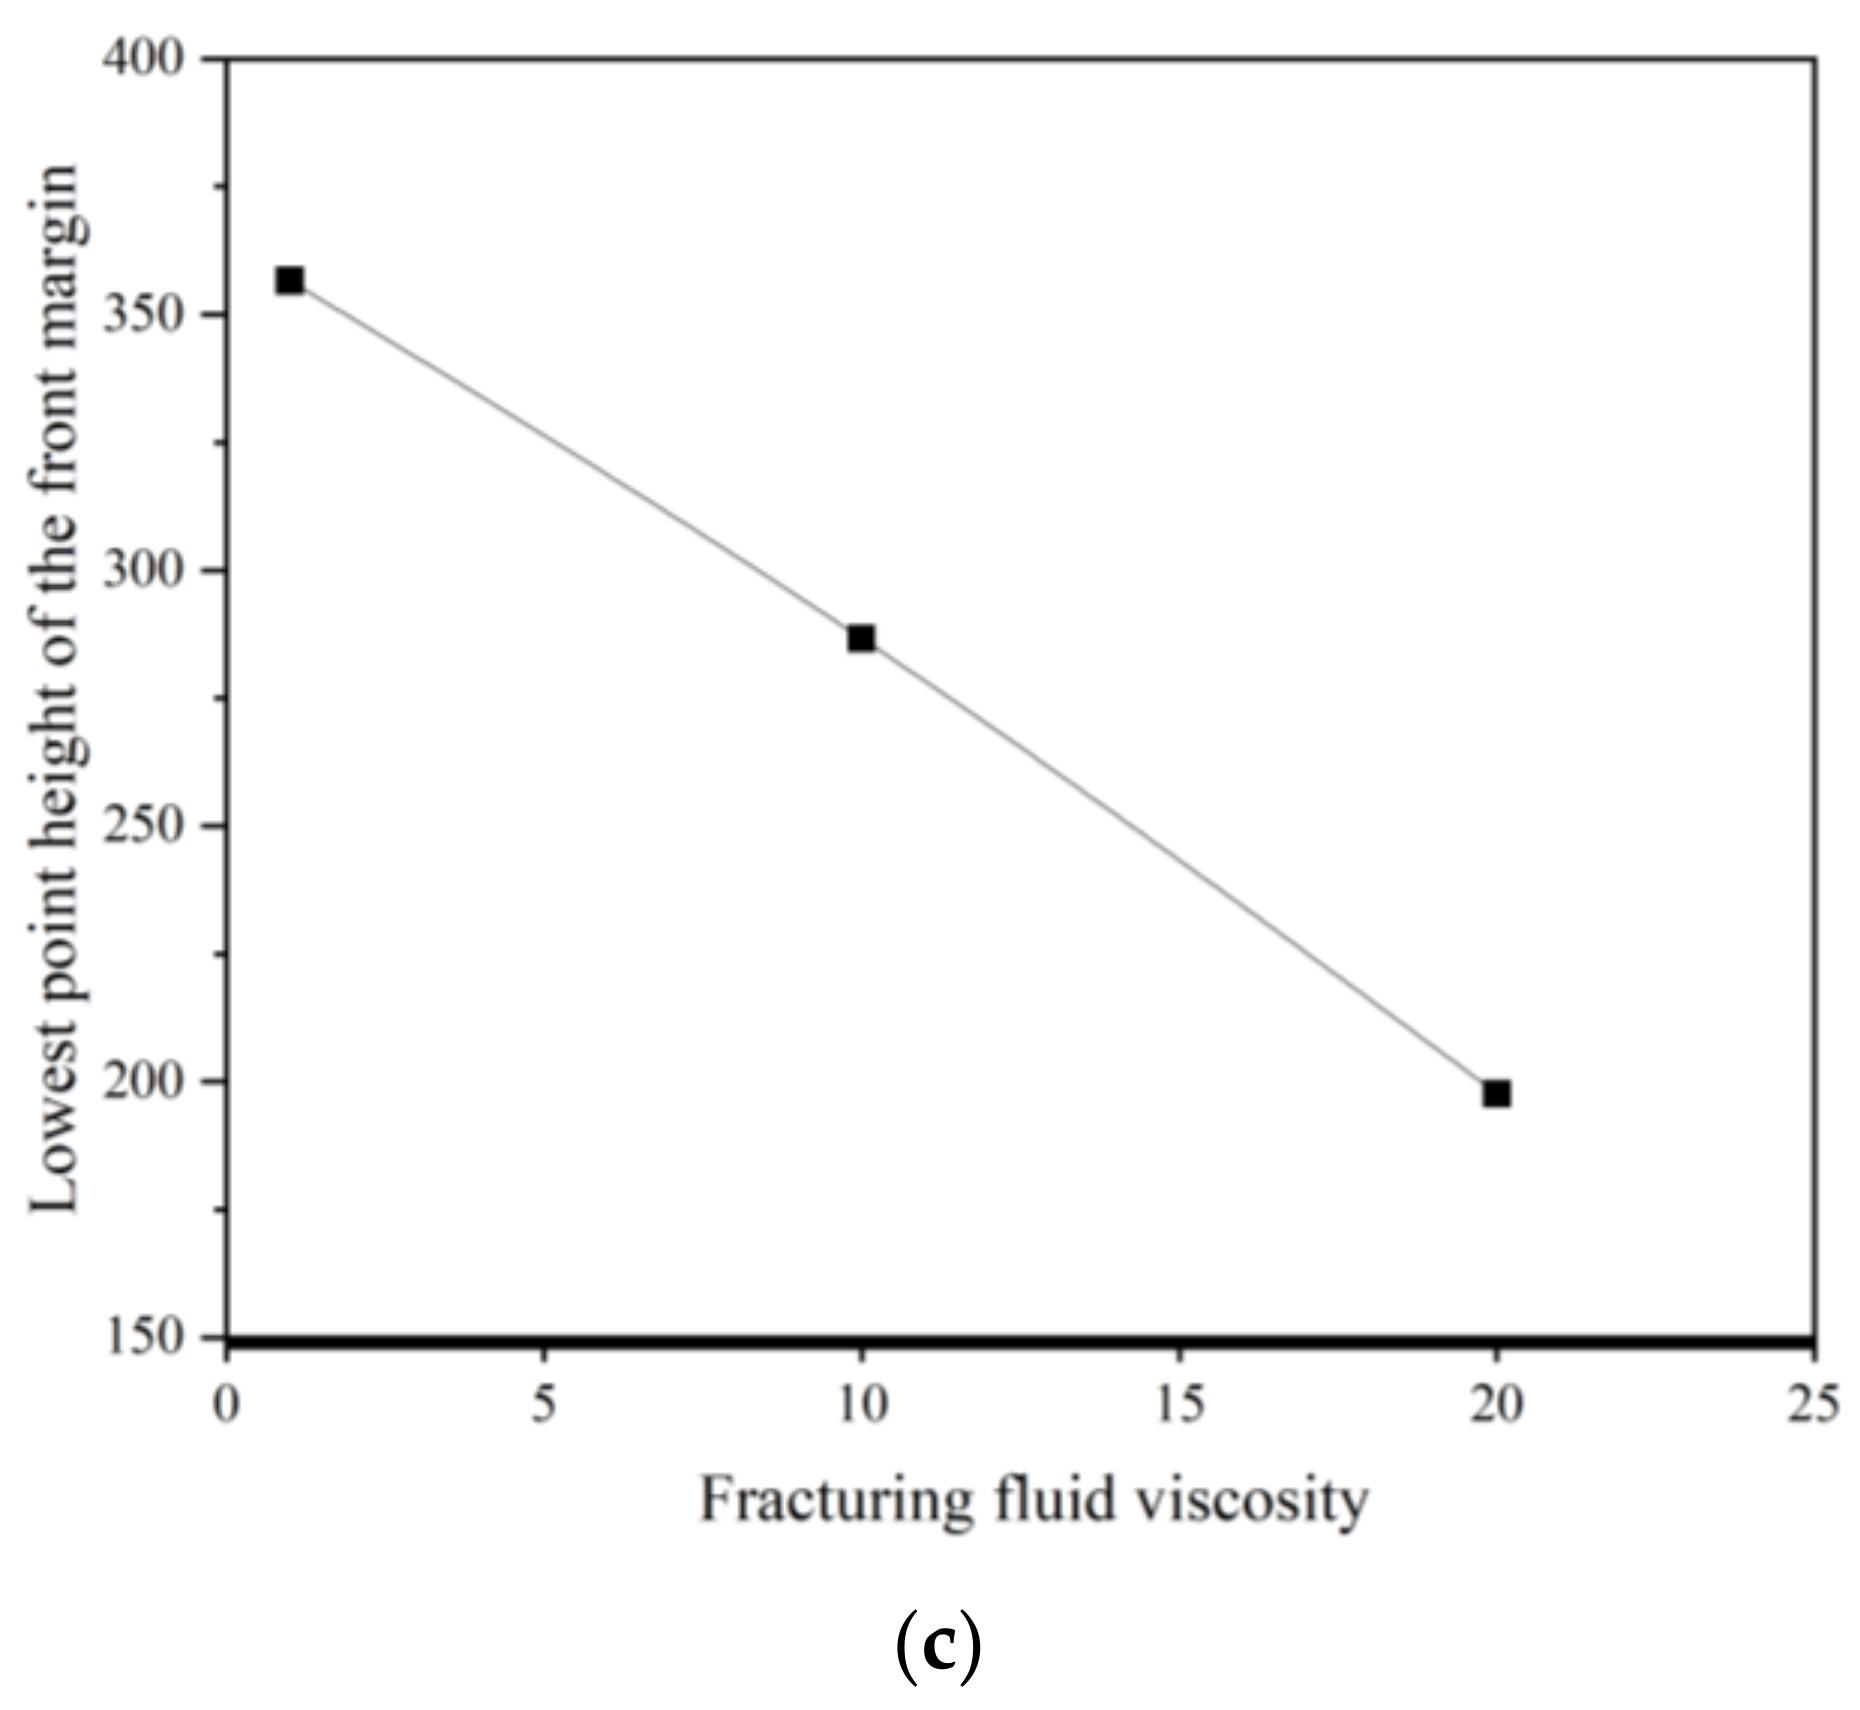
Figure 10 displays the shape of the sandbank in the complex fracture when the sandbank reaches equilibrium in experiment 10 and experiment 13. It can be observed through the experiments that the proppant settled in the major fracture before migrating to the secondary fracture. This process is basically consistent with the law of the single fracture. When the proppant migrates to the entrance of the secondary fracture, due to the difference in density between the proppant and the liquid, some of the liquid and a small amount of the proppant enter the secondary fracture under the action of inertia and drag force, while the fluid in the major fracture continues to migrate along the direction of the fracture propagation. As the displacement increases, the length of the sand dyke in the major fracture and the branch fracture increases. This is because the horizontal carrying force of the proppant in the fracturing fracture grows as the flow rate increases, resulting in a greater migration distance in the main/secondary fracture after the branch; consequently, the length of the supporting fracture in the main/secondary fracture becomes progressively longer.
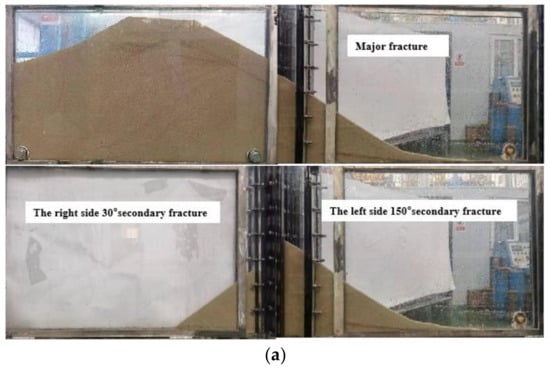

Figure 10.
The shape of complex fractured sand dykes with the various displacements: (a) the shape of the complex fractured sand dykes with the displacement of 2.0 m3/h; (b) the shape of the complex fractured sand dykes with the displacement of 2.5 m3/h.
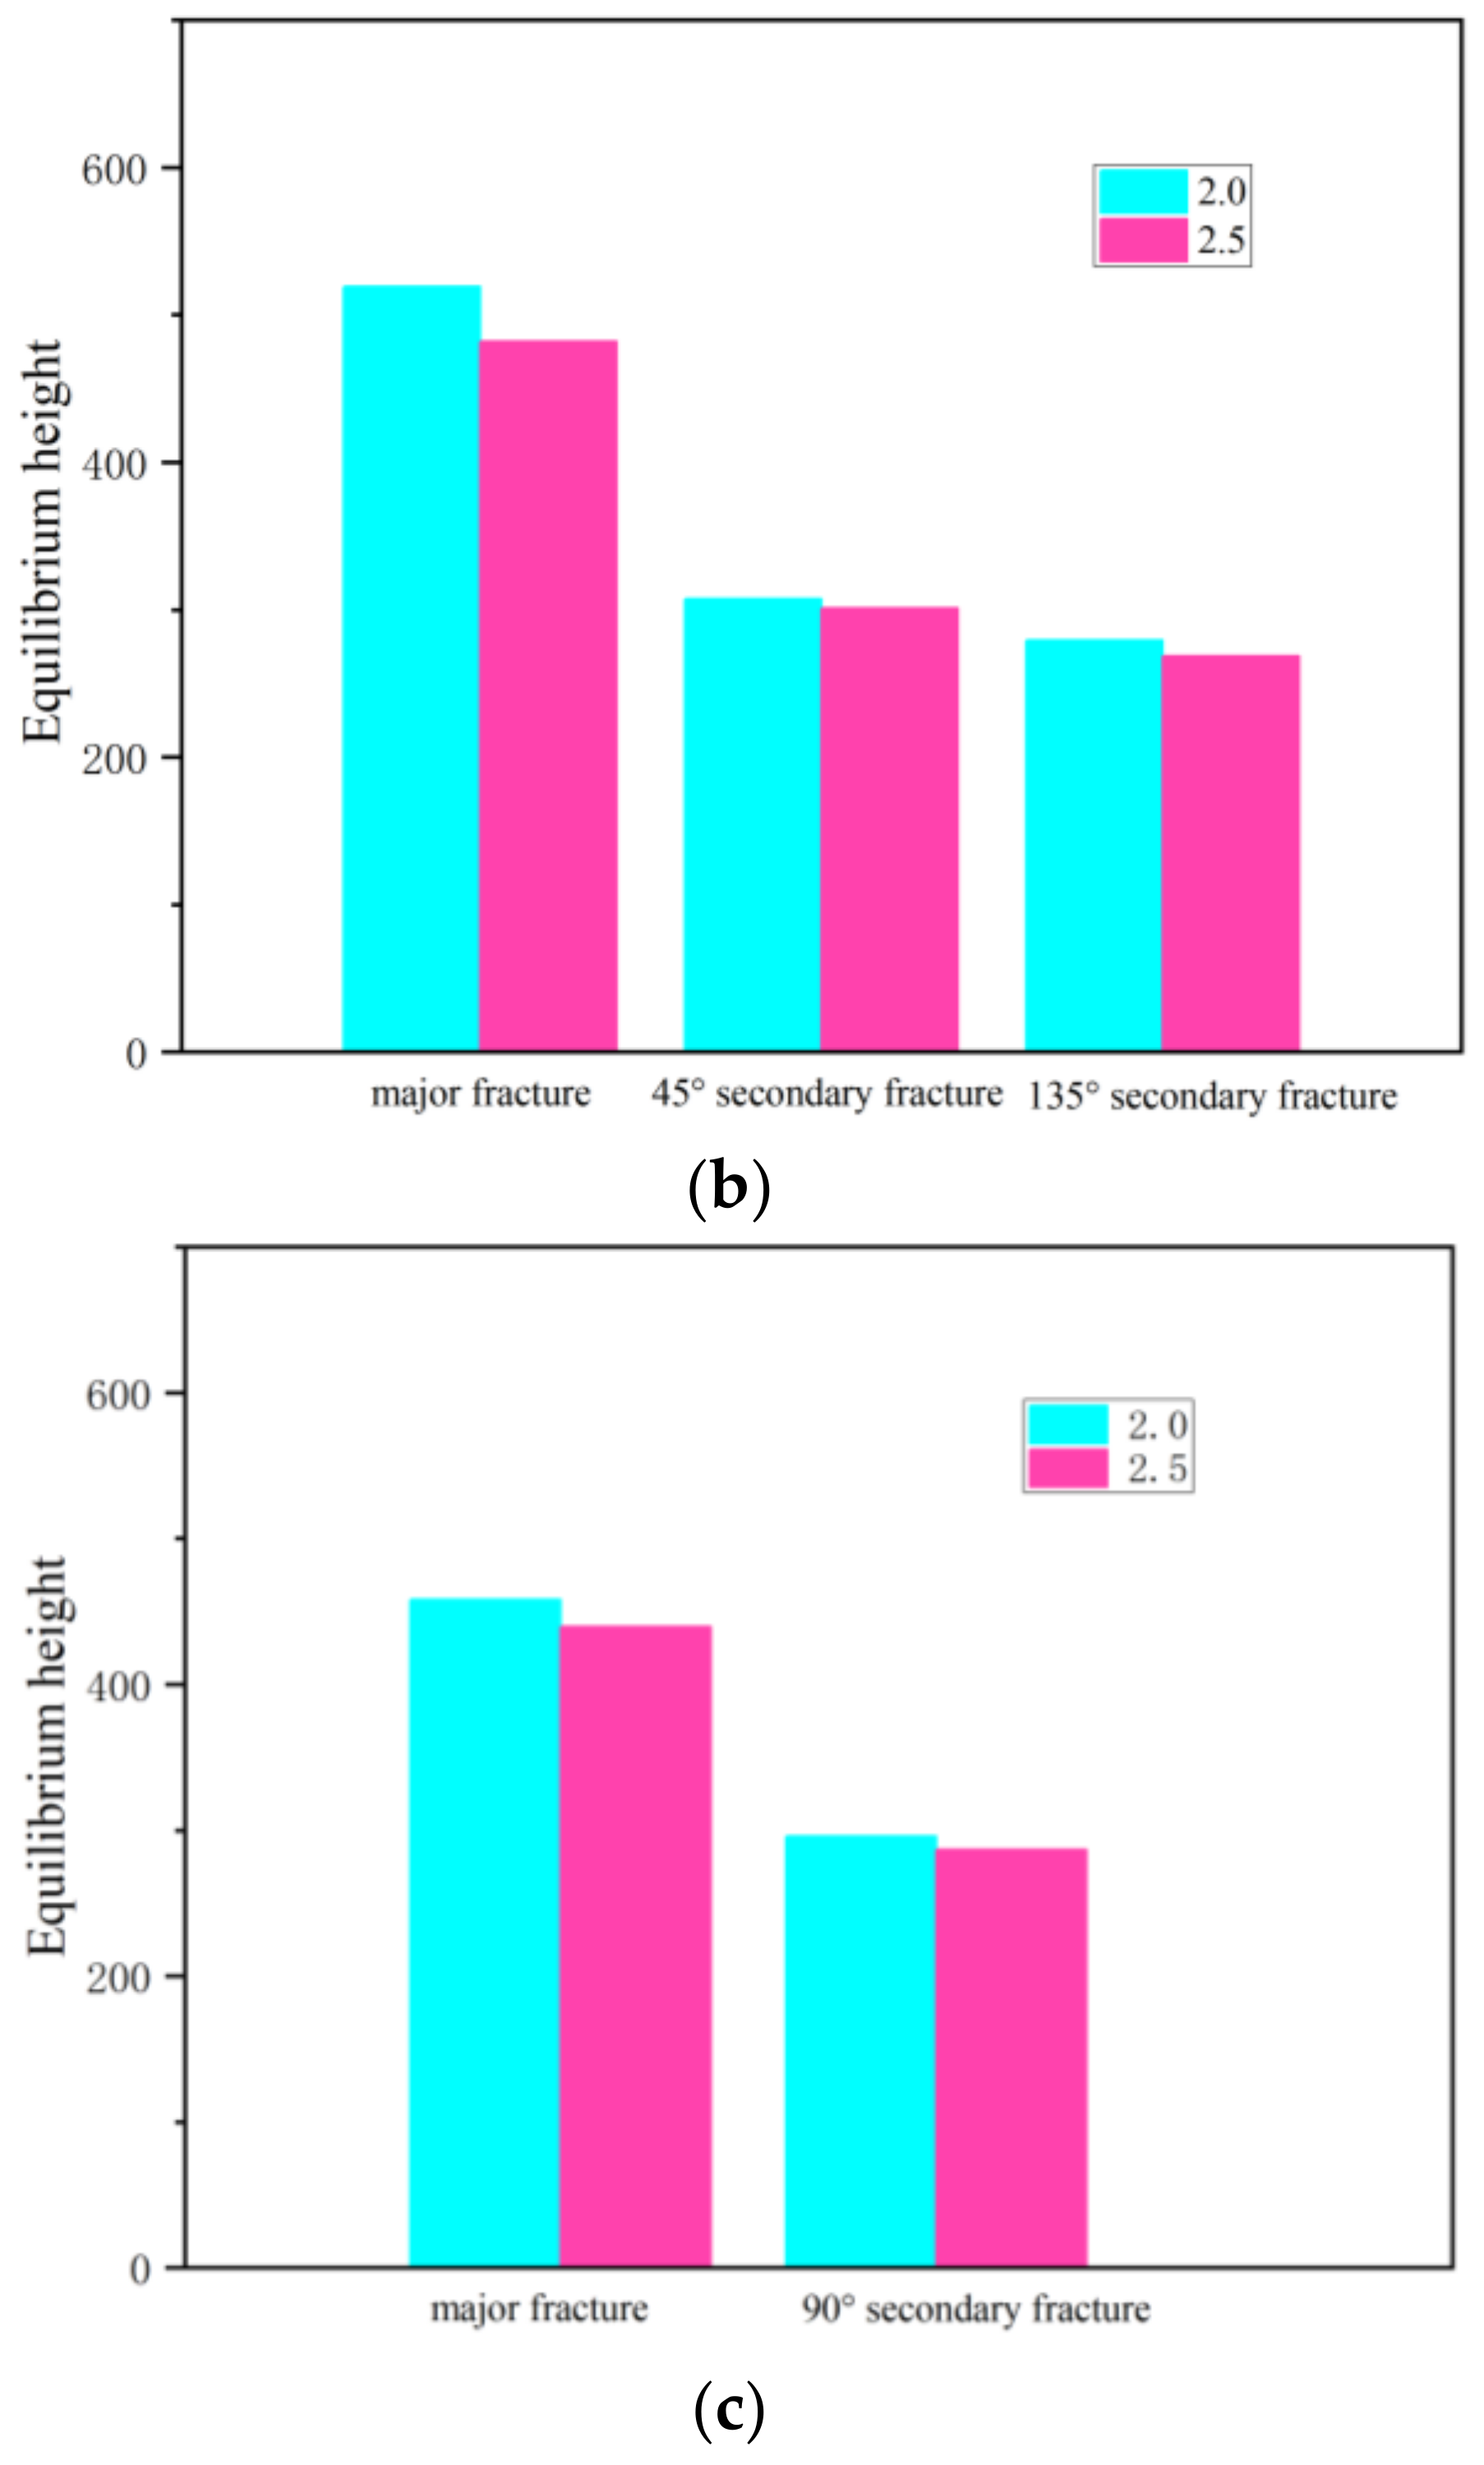
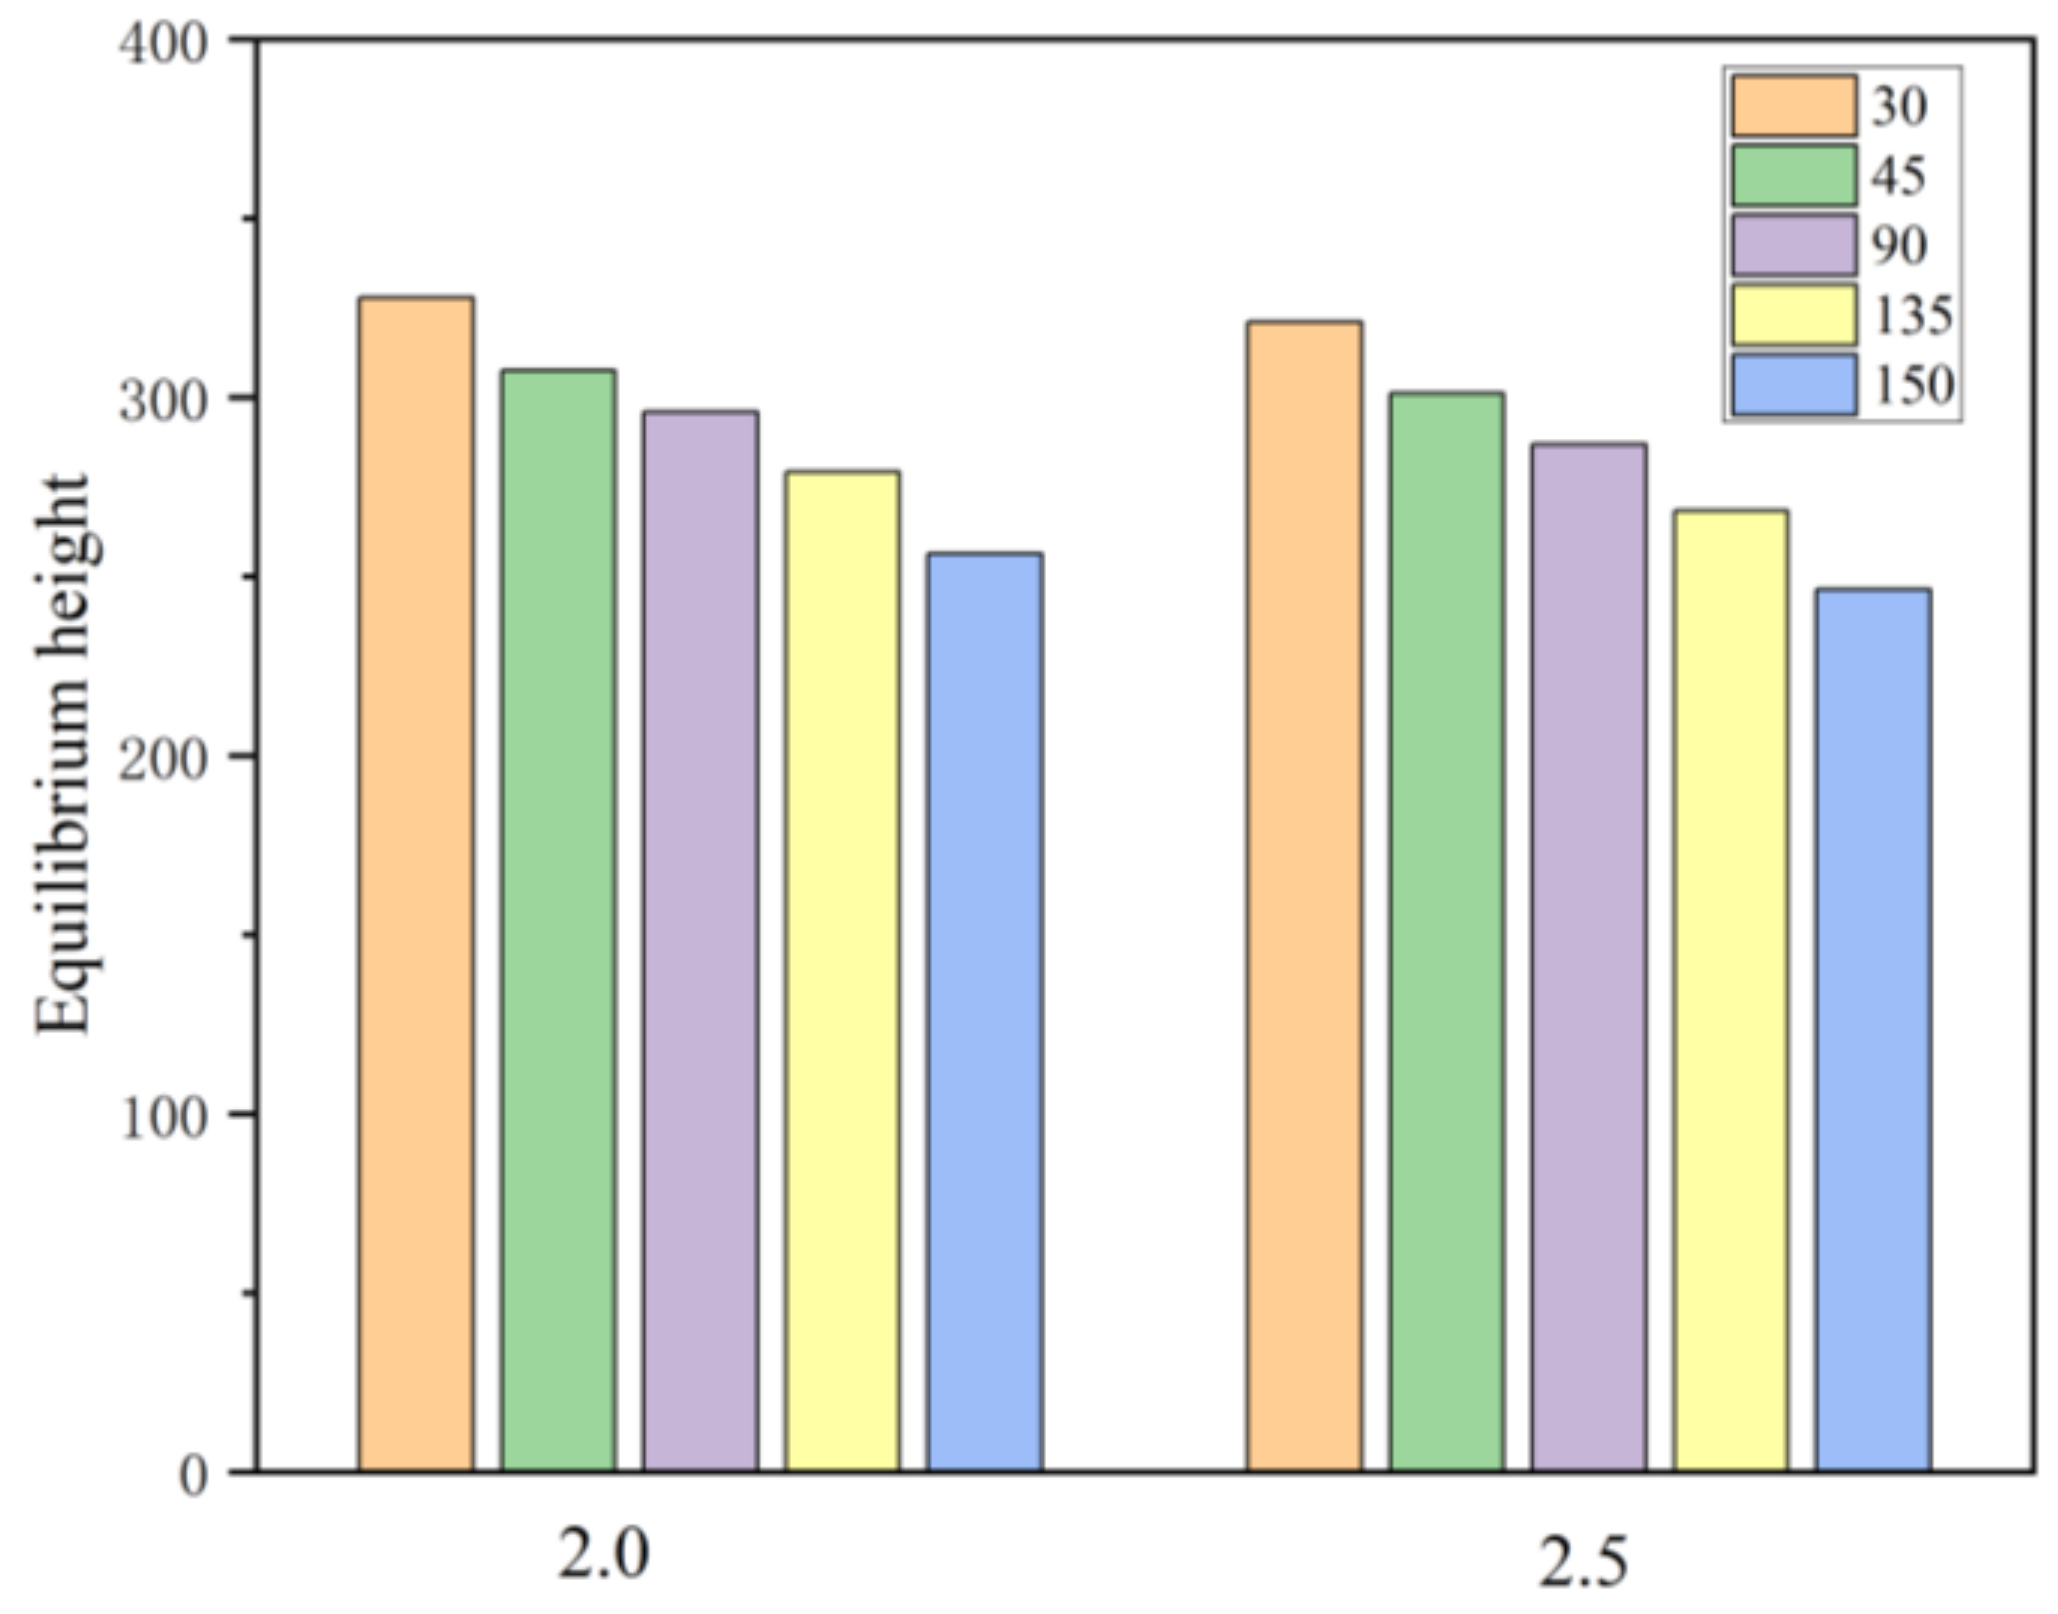
Figure 11 displays the distribution features of the height of the sand dyke in complex fractures under different displacement rates when the sand dyke reaches equilibrium in experiments 10–15. When the fracture was 30°/150°, the displacement increased from 2.0 to 2.5, and the height of the sand embankment decreased by 8.19%, 2.13%, and 3.91%, respectively. When the fracture was 45°/135°, the displacement increased from 2.0 to 2.5, and the height of the sand embankment decreased by 7.13%, 2.27%, and 3.94%, respectively. When the fracture was 90°/90°, the displacement increased from 2.0 to 2.5, and the height of the sand embankment decreased by 3.93% and 3.04%, respectively. This is because higher flow rates increase the erosion of particles on the upper end of the sand embankment at the entrance of the main joint and the branch channel, causing them to move forward and reducing the corresponding proppant height.
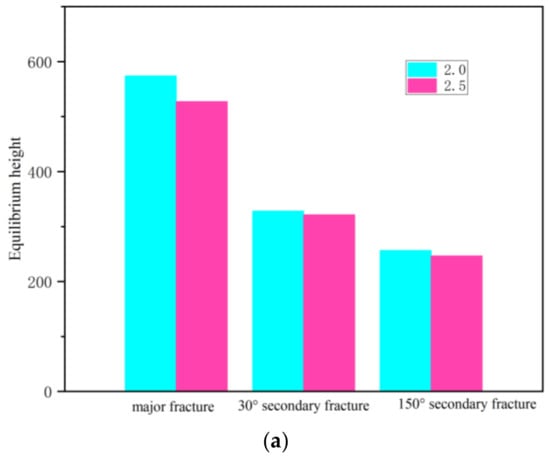
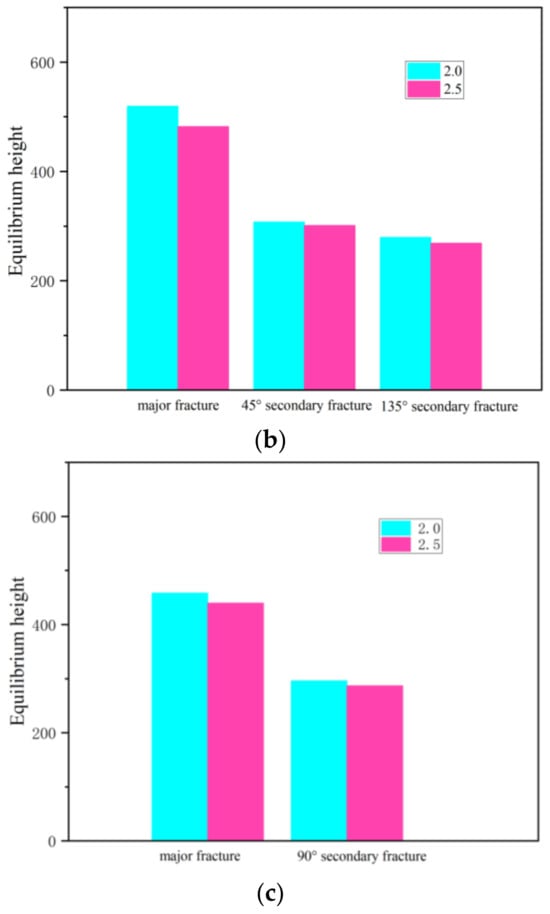
Figure 11.
Variation curve of the height of the sand dyke with displacement in complex fractures: (a) equilibrium height of 30°/150° complex fractured sand; (b) equilibrium height of 45°/135° complex fractured sand; (c) equilibrium height of 90° complex fractured sand.
3.2.2. The Influence of the Branch Joint Angle on the Shape of the Sand Embankment
Figure 12 shows the distribution characteristics of the height of the sandbank in the complex fracture under different branch angles when the sandbank reaches equilibrium in experiments 10–15. From Figure 11, it can be seen that under the same displacement condition, the bigger the branch angle, the smaller the height of the major/secondary fracture sand embankment. This is because the larger the branch angle, the bigger the angle between the fracture and the proppant migration direction in the opposite direction, and the harder it is for the proppant to turn into the branch fracture. At the same time, due to the shunting action of the fracturing fluid, some of the sand-carrying fluid entering the branch seam exerts a drag effect on the proppant at the entrance of the branch seam, resulting in the collision and aggregation of the proppant at the entrance of the branch seam, hindering the entry of the fracturing fluid, leading to an insufficient flow rate. At this point, only some of the proppant enters the branch seam at a large angle with the fracturing fluid. When the angle of the branch joint is small, the angle between it and the main fracture is also small, resulting in less resistance to proppant entry. Consequently, the proppant enters the branch joint with the sand liquid more easily, so the height is larger.
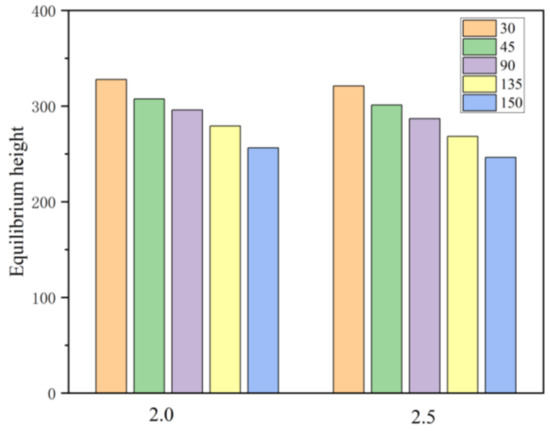
Figure 12.
Equilibrium height of complex fractures with a branch angle curve.
3.2.3. The Role of Proppant Particle Size in the Morphology of Branch Fracture Sand Dykes
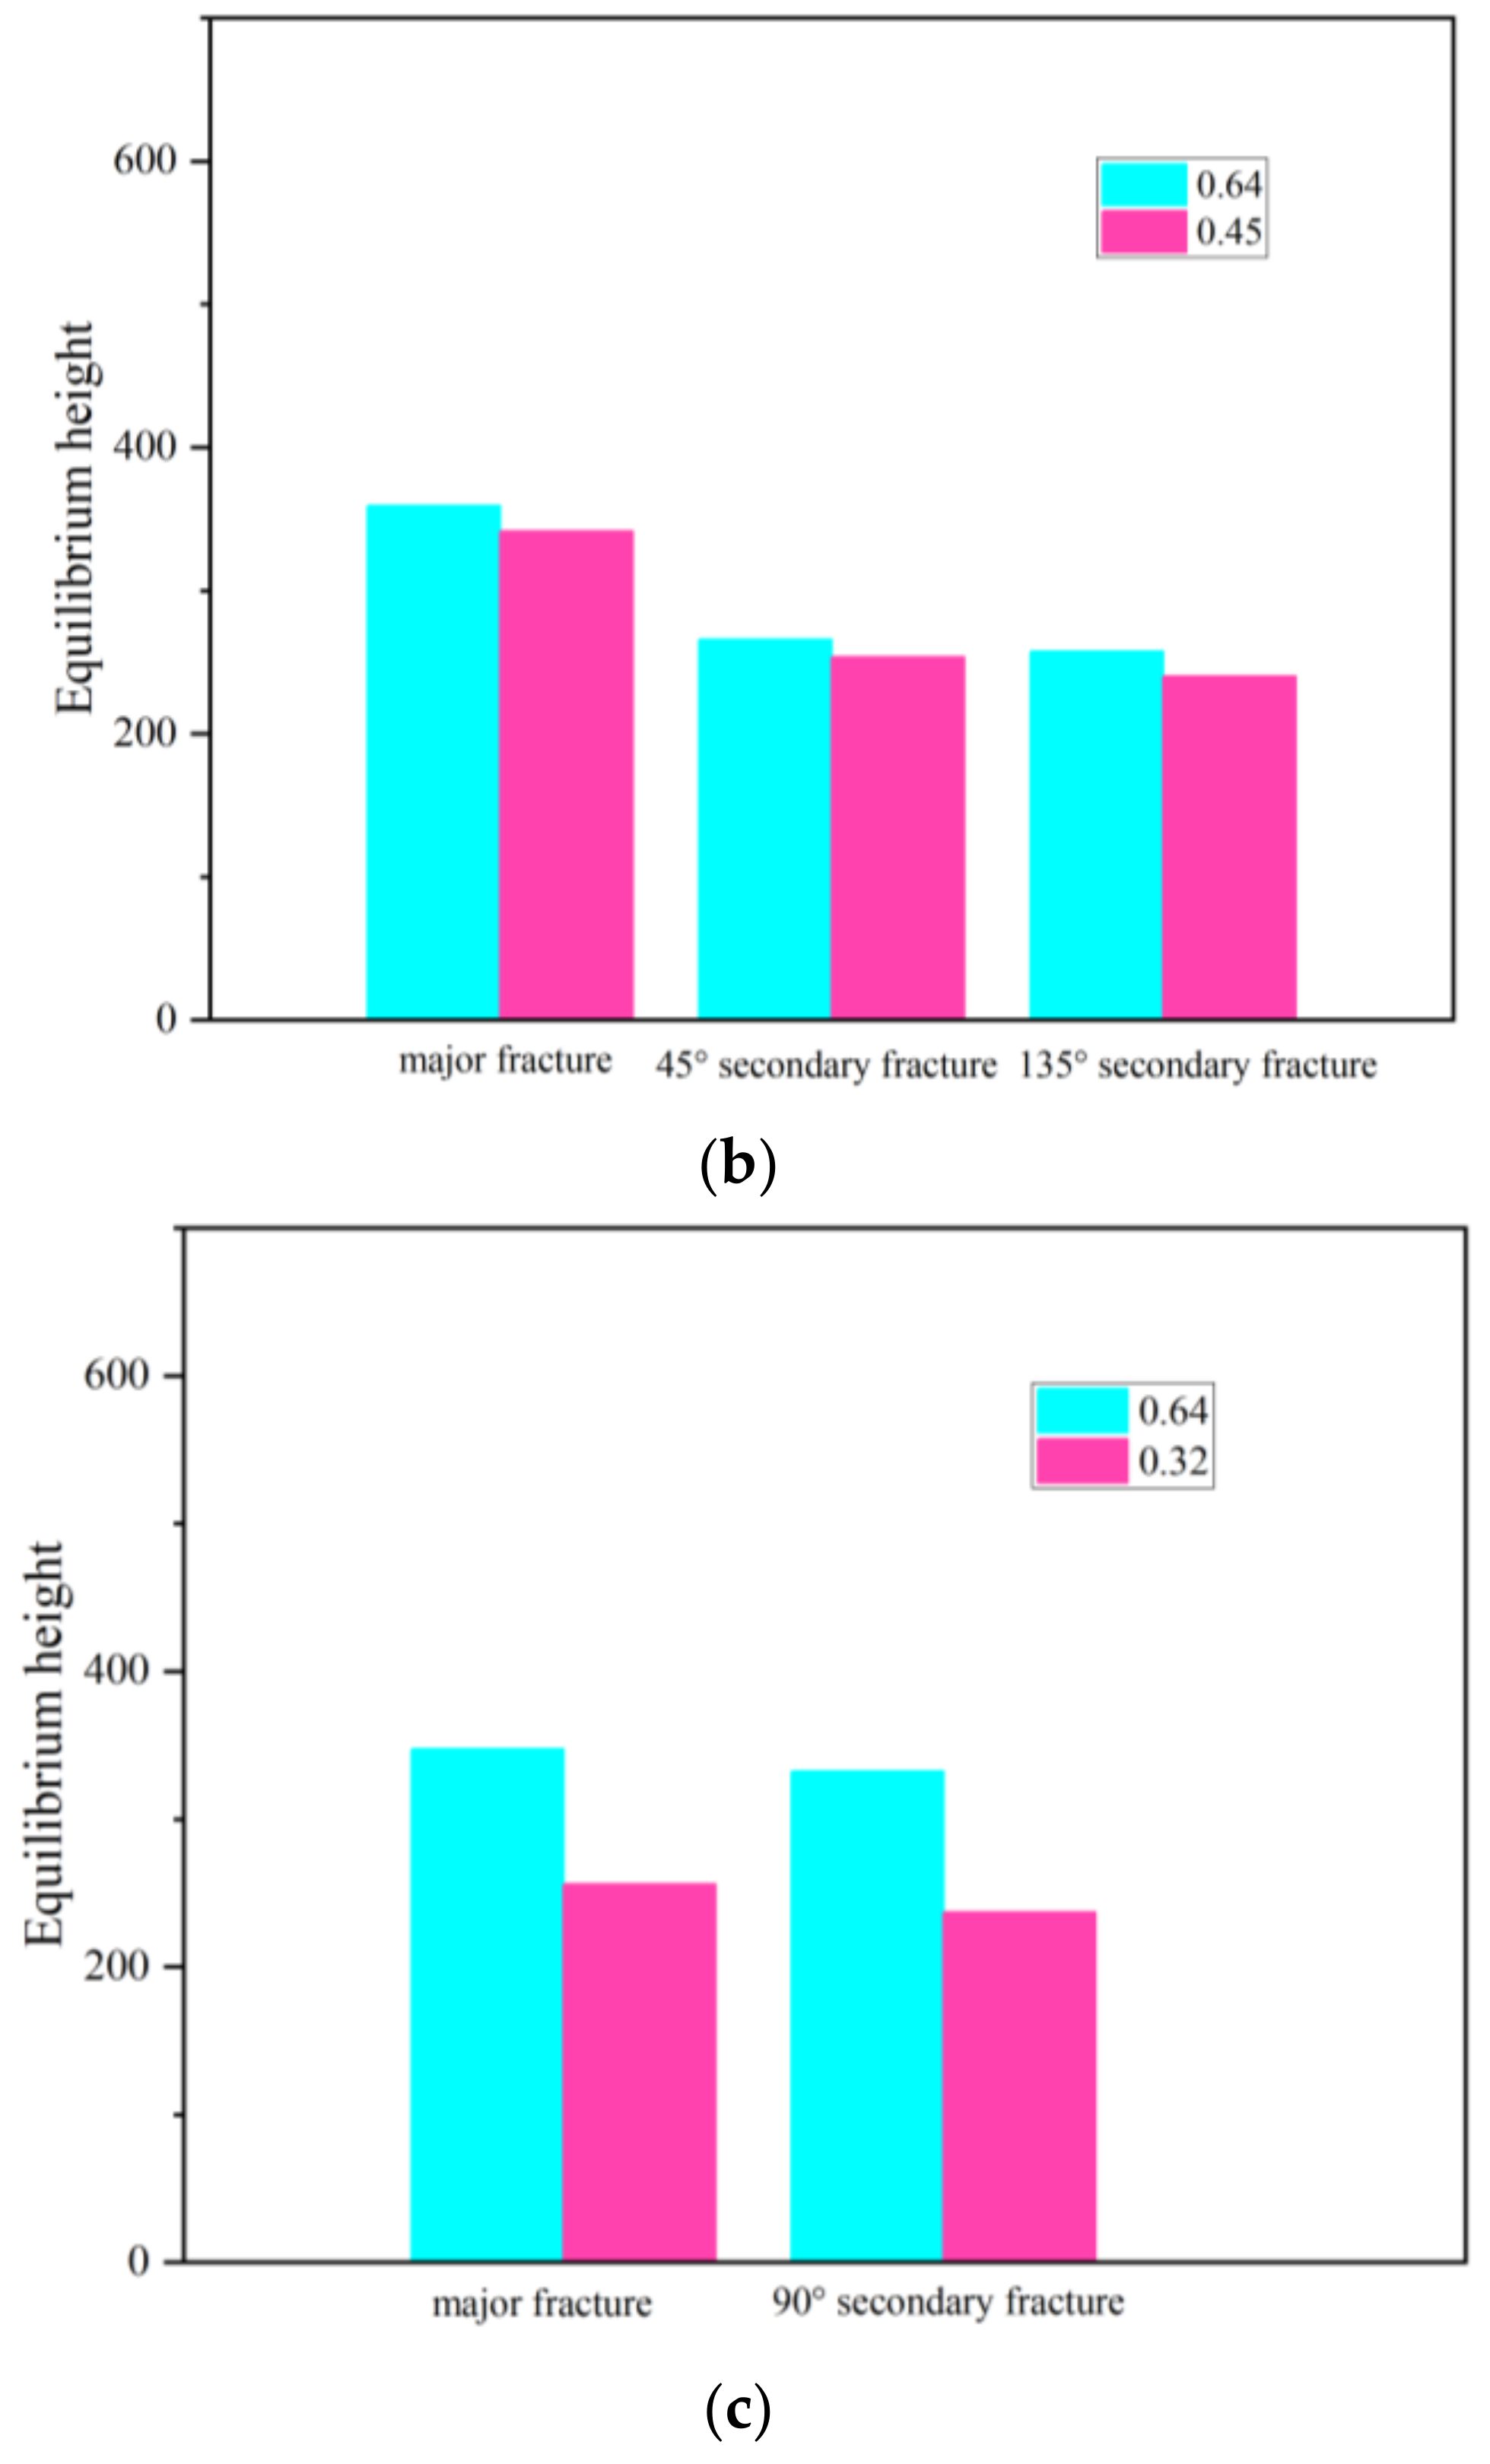
Figure 13 displays the distribution features of the height of the sand dyke in complex fractures under different particle sizes when the sand dyke reaches equilibrium in experiments 16–21. When the fracture was 30°/150°, the proppant particle size increased from 0.45 mm to 0.64 mm, and the sand embankment height of the main fracture, 30° branch fracture, and 150° branch fracture increased by 1.55%, 3.37%, and 8.02%, respectively. When the fracture was 45°/135°, the particle size of the extender increased from 0.45 mm to 0.64 mm, and the height of the sand embankment decreased by 5.28%, 4.72%, and 7.50%, respectively. When the fracture was 90°/90°, the particle size of the extender increased from 0.45 mm to 0.64 mm, and the height of the sand embankment in the main joint and the 90° branch joint decreased by 17.23% and 19.42%, respectively. This is because the settlement rate of the solid phase particles is proportional to the square of their particle size, and the dragging force of the fluid on the solid phase particles is proportional to their particle size, so the dragging role of the sand-carrying liquid in the big-particle-size proppant is smaller, the big-particle-size proppant is easier to settle, and the height of the sandbank increases.
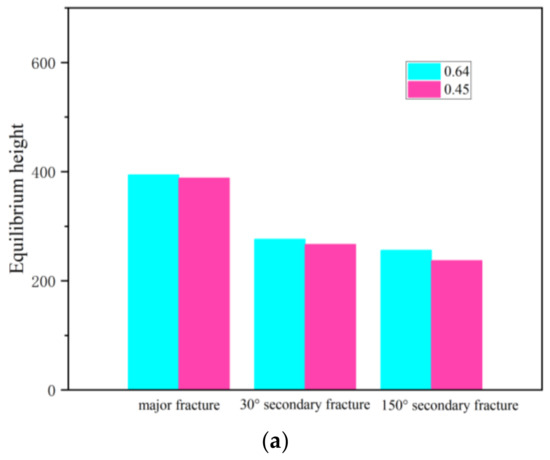

Figure 13.
Variation curve of the height of the sandbank with the proppant particle size in complex fractures: (a) equilibrium height of 30°/150° complex fractured sand; (b) equilibrium height of 45°/135° complex fractured sand; (c) equilibrium height of 90° complex fractured sand.
3.2.4. The Influence of Sand Proportion on the Shape of Branch Fracture Sand Dykes
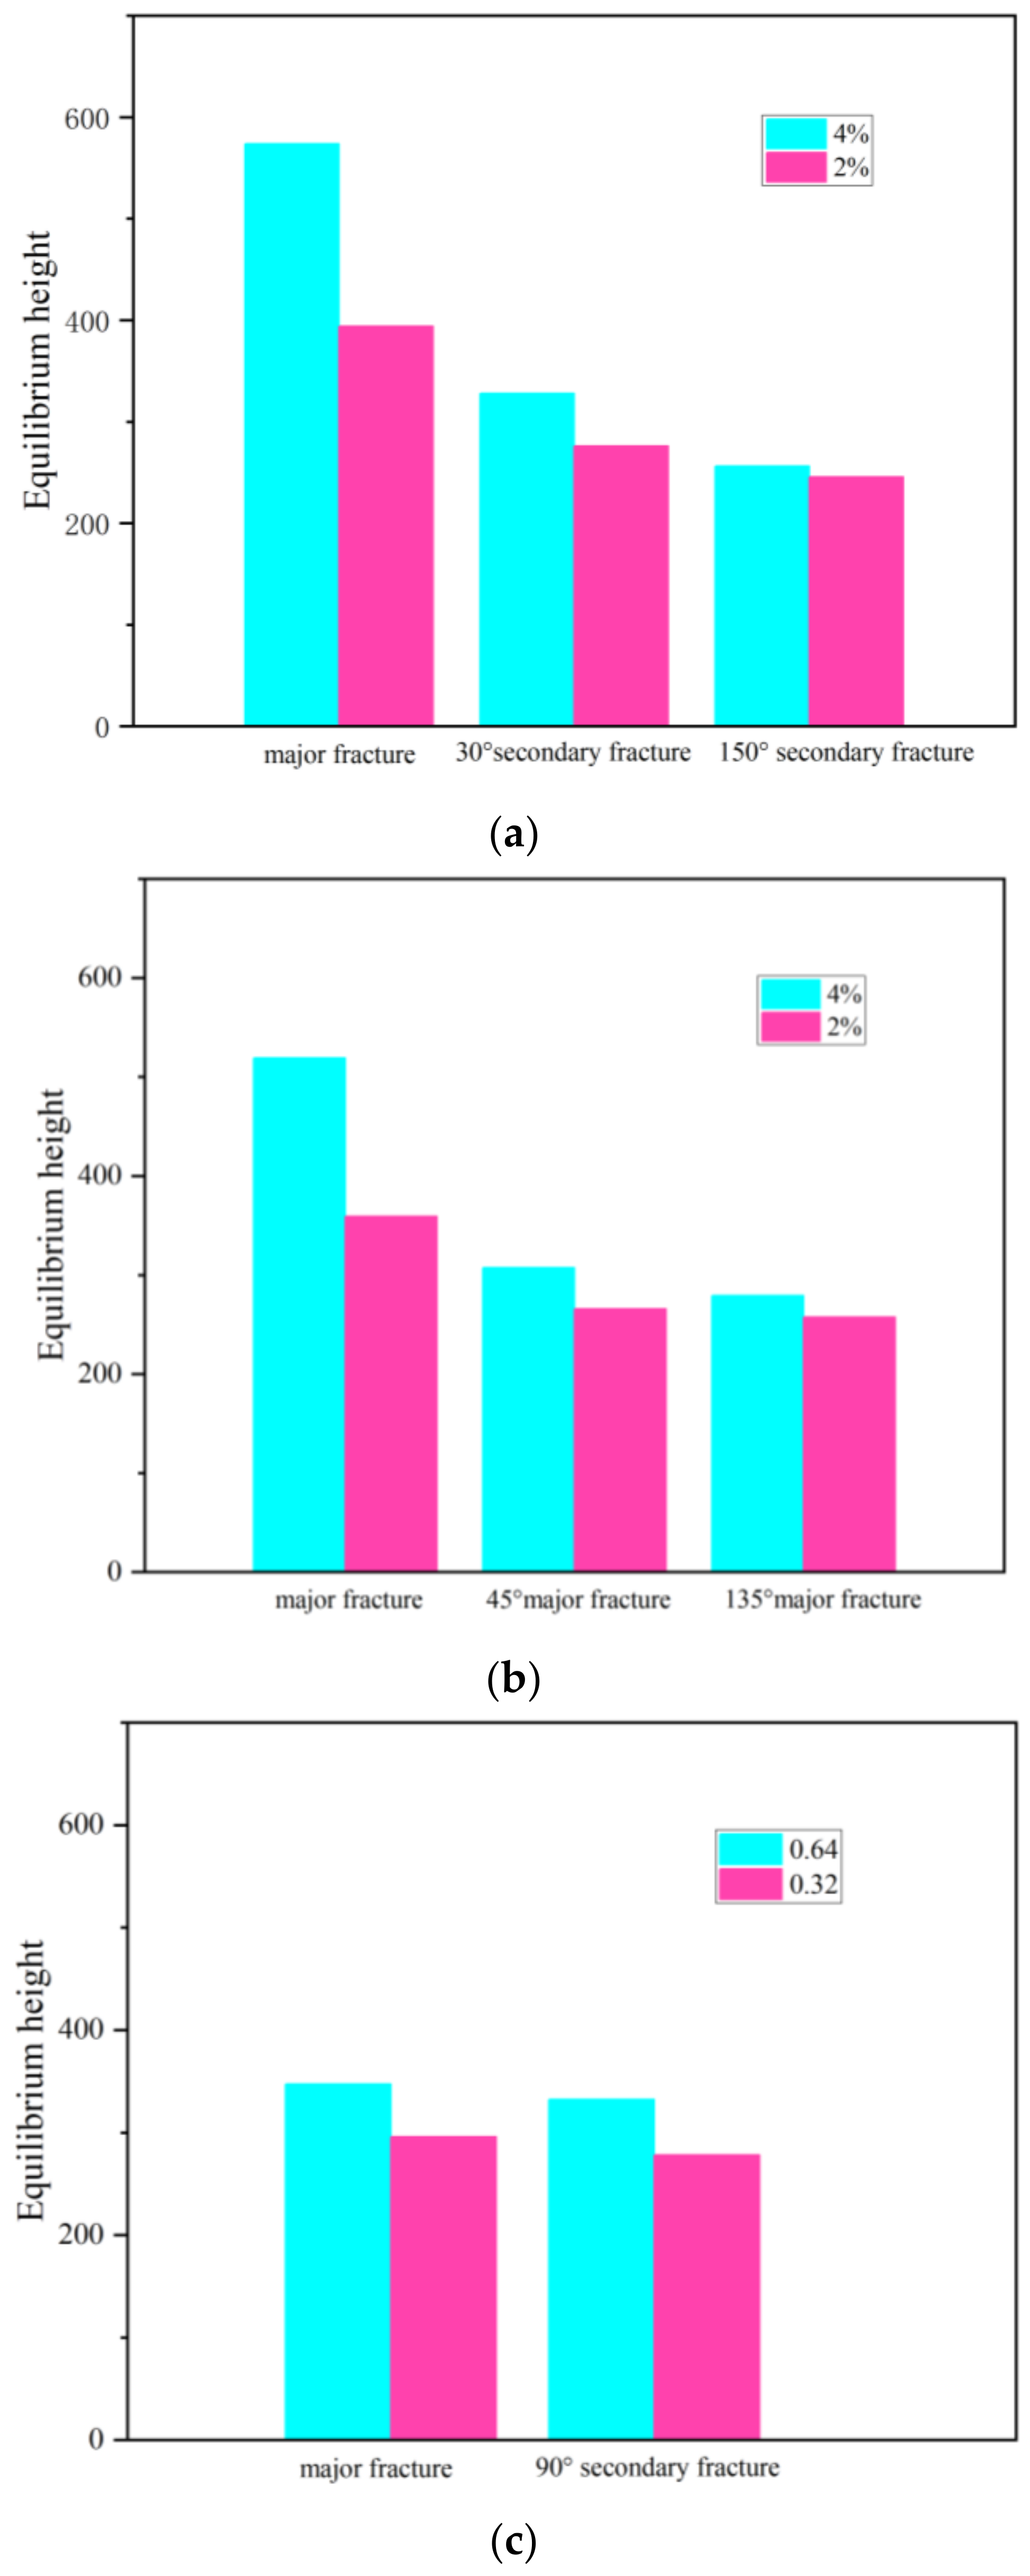
Figure 14 displays the distribution characteristics of the height of the sand embankment in the complex fracture under various sand proportions when the sand embankment reaches equilibrium in experiments 10, 11, 12, 19, 20, and 21. When the fracture was 30°/150°, the proppant concentration increased from 2% to 4%, and the sand embankment height increased by 45.69%, 18.84%, and 4.07%, respectively, in the main fracture, 30° branch fracture, and 150° branch fracture. When the fracture was 45°/135°, the proppant concentration increased from 2% to 4%, and the sand embankment height decreased by 44.57%, 15.79%, and 8.14%, respectively, in the main fracture, 45° branch fracture, and 135° branch fracture. When the fracture was 90°/90°, the proppant concentration increased from 2% to 4%, and the sandbank height of the main fracture and the 90° branch fracture decreased by 31.99% and 8.14%, respectively. This is because, as the sand proportion grows, the sand-carrying fluid carries more proppant into the fracturing fractures; consequently, more proppant will settle under similar conditions. The interaction between the proppants exacerbates their settlement at the entrance of the fracture; as a result, the proppant continues to deposit, leading to rapid growth in the height of the sandbank.

Figure 14.
Variation curve of the height of the sandbank with the proppant concentration in complex fractures: (a) equilibrium height of 30°/150° complex fractured sand; (b) equilibrium height of 45°/135° complex fractured sand; (c) equilibrium height of 90° complex fractured sand.
4. Conclusions
This paper uses the experimental device of proppant migration in complicated fractures to research the migration law of proppant in single fractures and complex fractures, respectively. The impact of construction displacement, proppant particle size, proppant density, fracturing fluid viscosity, and sand proportion on the migration law of proppant is clarified. The injection capacity is the most important factor. The results of this study can provide data support for the selection of proppant and fracturing fluid in the fracturing process, and also provide theoretical guidance for the determination of fracturing construction parameters, such as construction displacement and sand concentration. It should be noted that the existing experimental devices used to simulate proppant migration often overlook factors such as fracture tortuosity, roughness, and fracturing fluid filtration, which affect the proppant migration law. As a result, the experimental test conditions and on-site construction conditions cannot be fully matched. Therefore, future research should focus on developing a proppant migration experimental device that closely mimics the actual fracturing fractures in terms of fracture morphology and fracture wall performance. This would enable more realistic investigation of proppant migration and allocation within fracturing fractures.
Author Contributions
Conceptualization, Y.L.; methodology, Y.Y.; validation, Y.C.; investigation, X.Z.; writing—original draft preparation, Z.H.; visualization, J.F. All authors have read and agreed to the published version of the manuscript.
Funding
This research was funded by the Hainan Provincial Joint Project of Sanya Yazhou Bay Science and Technology City, grant number 2021CXLH0028.
Data Availability Statement
This study did not generate any new data.
Conflicts of Interest
Author Yuan Yuan was employed by the Daqing Oilfield Limited Company and Author Ye Chen was employed by the PetroChina Southwest Oil & Gasfield Company. The remaining authors declare that the research was conducted in the absence of any commercial or financial relationships that could be construed as a potential conflict of interest.
Nomenclature
| wn | actual fracture width, m |
| wm | crack physical model in experimental setup width, m |
| Qn | the actual construction displacement, m3/min |
| Qm | the test displacement in laboratory, m3/min |
| hn | the actual fracture height, m |
| hm | the height of the test device, m |
| vn | the actual construction fluid velocity, m/s |
| vm | the test fluid velocity, m/s |
References
- Liu, H.Y.; Pu, X.Y.; Zhang, L.H. Beneficial development of shale gas in China: Theoretical logic, practical logic and prospect. Nat. Gas Ind. B 2023, 43, 177–183. [Google Scholar]
- Xu, Y.; Lun, Z.; Pan, Z. Occurrence space and state of shale oil: A review. J. Pet. Sci. Eng. 2022, 211, 110183. [Google Scholar] [CrossRef]
- Yan, T.; Xu, R.; Sun, S.H. A real-time intelligent lithology identification method based on a dynamic felling strategy weighted random forest algorithm. Pet. Sci. 2024, 21, 1135–1148. [Google Scholar] [CrossRef]
- Sun, L.D.; Cui, B.W.; Zhu, R.K. Shale oil enrichment evaluation and production law in Gulong Sag, Songliao Basin, NE China. Pet. Explor. Dev. 2023, 50, 441–454. [Google Scholar] [CrossRef]
- Jiang, C.B.; Wang, Y.F.; Duan, M.K. Experimental study on the evolution of pore-fracture structures and mechanism of permeability enhancement in coal under cyclic thermal shock. Fuel 2021, 304, 121455. [Google Scholar] [CrossRef]
- Wang, F.; Xu, H.; Liu, Y. Mechanism of low chemical agent adsorption by high pressure for hydraulic fracturing-assisted oil displacement technology: A study of molecular dynamics combined with laboratory experiments. Langmuir 2023, 39, 16628–16636. [Google Scholar] [CrossRef] [PubMed]
- Vengosh, A.; Warner, N.; Jackson, R. The effects of shale gas exploration and hydraulic fracturing on the quality of water resources in the United States. Procedia Earth Planet. Sci. 2013, 7, 863–866. [Google Scholar] [CrossRef]
- Yi, S.S.; Wu, C.H.; Sharma, M.M. Proppant distribution among multiple perforation clusters in plug-and-perforate stages. SPE Prod. Oper. 2018, 33, 654–665. [Google Scholar] [CrossRef]
- Asadi, M.B.; Dejam, M.; Zendehboudi, S. Semi-analytical solution for productivity evaluation of a multi-fractured horizontal well in a bounded dual-porosity reservoir. J. Hydrol. 2020, 581, 124288. [Google Scholar] [CrossRef]
- Kern, L.; Perkins, T.; Wyant, R. The mechanics of sand movement in fracturing. J. Pet. Technol. 1959, 11, 55–57. [Google Scholar] [CrossRef]
- Babcock, R.E.; Prokop, C.L.; Kehle, R.O. Distribution of Propping Agents in Vertical Fractures; American Petroleum Institute Publisher: Washington, DC, USA, 1967; Volume 851, Report No. CONF-670346-. [Google Scholar]
- Bello, A.; Ozoani, J.; Kuriashov, D. Proppant transport in hydraulic fractures by creating a capillary suspension. J. Pet. Sci. Eng. 2022, 208, 109508. [Google Scholar] [CrossRef]
- Fernández, M.E.; Sánchez, M.; Pugnaloni, L.A. Proppant transport in a scaled vertical planar fracture: Vorticity and dune placement. J. Pet. Sci. Eng. 2019, 173, 1382–1389. [Google Scholar] [CrossRef]
- Fjaestad, D.; Tomac, I. Experimental investigation of sand proppant particles flow and transport regimes through narrow slots. Powder Technol. 2019, 343, 495–511. [Google Scholar] [CrossRef]
- Thompson, T.L.; Clark, N.N. A holistic approach to particle drag prediction. Powder Technol. 1991, 67, 57–66. [Google Scholar] [CrossRef]
- Guo, S.; Wang, B.; Li, Y.; Hao, H.; Zhang, M. Impacts of proppant flowback on fracture conductivity in different fracturing fluids and flowback conditions. ACS Omega 2022, 7, 6682–6690. [Google Scholar] [CrossRef] [PubMed]
- Xu, J.X.; Ding, Y.H.; Yang, L.F. Transportation and distribution laws of proppants in tortuous micro-fractures. Acta Pet. Sin. 2019, 40, 965–974. [Google Scholar]
- Zheng, C.; Wang, D.B.; Yu, B. Numerical Investigation on the Migration Law of Temporary Plugging Agent in Rough Fractures Based on CFD-DEM Coupling. J. Eng. Thermophys. 2023, 44, 422–429. [Google Scholar]
- Wu, C.H.; Sharma, M.M. Modeling proppant transport through perforations in a horizontal wellbore. SPE J. 2019, 24, 1777–1789. [Google Scholar] [CrossRef]
- Wang, J.; Elsworth, D.; Denison, M.K. Propagation, proppant transport and the evolution of transport properties of hydraulic fractures. J. Fluid Mech. 2018, 855, 503–534. [Google Scholar] [CrossRef]
- Wang, Q.; Chen, X.; Jha, A.N. Natural gas from shale formation-the evolution, evidences and challenges of shale gas revolution in United States. Renew. Sustain. Energy Rev. 2014, 30, 1–28. [Google Scholar] [CrossRef]
- Meakin, P.; Huang, H.; Malthe-Sørenssen, A. Shale gas: Opportunities and challenges. Environ. Geosci. 2013, 20, 151–164. [Google Scholar] [CrossRef]
- Feng, Q.; Xu, S.; Xing, X. Advances and challenges in shale oil development: A critical review. Adv. Geo-Energy Res. 2020, 4, 406–418. [Google Scholar] [CrossRef]
- Sun, X.; Yao, D.; Qu, J. A novel transient hole cleaning algorithm for horizontal wells based on drift-flux model. Geoenergy Sci. Eng. 2024, 233, 212517. [Google Scholar] [CrossRef]
- Hou, B.; Chen, M.; Li, Z. Propagation area evaluation of hydraulic fracture networks in shale gas reservoirs. Pet. Explor. Dev. 2014, 41, 833–838. [Google Scholar] [CrossRef]
- Zheng, Y.; Fan, Y.; Yong, R. A new fracturing technology of intensive stage+ high-intensity proppant injection for shale gas reservoirs. Nat. Gas. Ind. B 2020, 7, 292–297. [Google Scholar] [CrossRef]
- Dayan, A.; Stracener, S.M.; Clark, P.E. Proppant transport in slickwater fracturing of shale gas formations. In Proceedings of the SPE Annual Technical Conference and Exhibition, New Orleans, LA, USA, 4–7 October 2009. [Google Scholar]
- Sahai, R.; Miskimins, J.L.; Olson, K.E. Laboratory results of proppant transport in complex fracture systems. In Proceedings of the SPE Hydraulic Fracturing Technology Conference, The Woodlands, TX, USA, 4–6 February 2014. [Google Scholar]
- Klingensmith, B.C.; Hossaini, M.; Fleenor, S. Considering far-field fracture connectivity in stimulation treatment designs in the Permian Basin. In Proceedings of the SPE/AAPG/SEG Unconventional Resources Technology Conference, URTEC, San Antonio, TX, USA, 20–22 July 2015. URTEC-2153821-MS. [Google Scholar]
- Wen, Q.; Wang, S.; Duan, X. Experimental investigation of proppant settling in complex hydraulic-natural fracture system in shale reservoirs. J. Nat. Gas Sci. Eng. 2016, 33, 70–80. [Google Scholar] [CrossRef]
- Alotaibi, M.A.; Miskimins, J.L. Slickwater proppant transport in hydraulic fractures: New experimental findings and scalable correlation. SPE Prod. Oper. 2018, 33, 164–178. [Google Scholar] [CrossRef]
- Guo, T.K.; Lyu, M.K.; Chen, M. Proppant transport law in multi-branched fractures induced by volume fracturing. Pet. Explor. Dev. 2023, 50, 955–970. [Google Scholar] [CrossRef]
- Li, N.; Li, J.; Zhao, L. Laboratory testing on proppant transport in complex-fracture systems. SPE Prod. Oper. 2017, 32, 382–391. [Google Scholar] [CrossRef]
- Pan, L.; Zhang, Y.; Cheng, L. Migration and distribution of complex fracture proppant in shale reservoir volume fracturing. Nat. Gas Ind. B 2018, 5, 606–615. [Google Scholar] [CrossRef]
- Pan, L.; Zhang, Y.; Wang, H.B. Mechanism study on proppants division during shale complex fracturing of shale rocks. J. China Univ. Pet. (Ed. Nat. Sci.) 2020, 44, 61–70. [Google Scholar]
- Zhao, Z.F.; Zhang, Y.J.; Wang, J.H. Experiment on proppant placement for channel fracturing. J. China Univ. Pet. 2019, 43, 104–111. [Google Scholar]


Disclaimer/Publisher’s Note: The statements, opinions and data contained in all publications are solely those of the individual author(s) and contributor(s) and not of MDPI and/or the editor(s). MDPI and/or the editor(s) disclaim responsibility for any injury to people or property resulting from any ideas, methods, instructions or products referred to in the content. |
© 2024 by the authors. Licensee MDPI, Basel, Switzerland. This article is an open access article distributed under the terms and conditions of the Creative Commons Attribution (CC BY) license (https://creativecommons.org/licenses/by/4.0/).