Article

Spatial Synergy between Tourism Resources and Tourism Service Facilities in Mountainous Counties: A Case Study of Qimen, Huangshan, China

1
Institute of Geographic Sciences and Natural Resources Research, University of Chinese Academy of Sciences, Beijing 100101, China
2
State Key Laboratory of Resources and Environmental Information Systems, Institute of Geographic Sciences and Natural Resources Research, University of Chinese Academy of Sciences, Beijing 100101, China
3
University of Chinese Academy of Sciences, Beijing 100049, China
4
Key Laboratory of Regional Sustainable Development Analysis and Simulation, Institute of Geographic Sciences and Natural Resources Research, University of Chinese Academy of Sciences, Beijing 100101, China
5
School of Tourism and Geography, Shaoguan University, Shaoguan 512005, China
*
Authors to whom correspondence should be addressed.
Land 2024, 13(7), 999; https://doi.org/10.3390/land13070999
Submission received: 23 May 2024 / Revised: 27 June 2024 / Accepted: 3 July 2024 / Published: 6 July 2024

Abstract

:
Under the influence of mountainous terrain, the spatial synergy between tourism resources and tourism service facilities has emerged as a pivotal factor affecting the overall efficiency enhancement of regional tourism destinations. In order to explore the synergistic effect of the two, taking Qimen County as the study site, this study utilizes Point of Interest (POI) data of tourism resources and tourism service facilities. It constructs a fine-scale multidimensional spatial synergy methodology based on grid vectorization to conduct scenario-based comparative analyses of altitude and population density. The objective is to elucidate the effects of fine-scale tourism development synergy and propose enhancement strategies. The findings are as follows: (1) The vertical zonation of mountains has led to a widespread, decentralized distribution of natural tourism resources in mid-to-high-altitude areas, while humanistic tourism resources in low-altitude urbanized areas exhibit a granular, clustered distribution. These contrasting scenarios manifest a polarization, making it difficult to achieve supply–demand matching of the layout pattern of tourism service facilities along transportation routes. (2) The spatial gradient effect of the synergy between the two in mountainous counties is significant, with a higher synergy level in core towns and obvious misalignment in peripheral areas. (3) Altitude and population density are critical factors influencing the supply of tourism service facilities. Through scale aggregation guidance and cost–benefit mechanisms, the spatial distribution can be classified, stratified, and optimized to better serve resource development. This study provides valuable insights into understanding laws governing development and utilization within mountainous county areas for academic research purposes.

Graphical Abstract

1. Introduction

Tourism resources and tourism service facilities maintain a symbiotic relationship, and their spatial synergy represents the rationality of regional tourism spatial structure and the facilitation of services, which are crucial for enhancing the efficiency of tourism destination development. Influenced by natural and built elements, there are varying degrees of misalignment between tourism resources and tourism service facilities [1,2,3], affecting the comprehensive benefits of regional tourism development [4,5]. Mountain tourism serves as a primary place for global tourism development, with mountain tourism’s share of international tourists increasing steadily to 18–20% by 2023 compared to pre-pandemic levels1. However, the vertical zonation of mountainous areas engenders natural population distribution disparities and scale effects of tourism resources at different altitudes, leading to a chain effect of scale similarity in the types and sizes of tourism service facilities. Spatial misalignment of tourism resources and service facilities has resulted in a hindrance to the timely satisfaction of the rapidly growing tourist demand, thus becoming a critical obstacle to the development of mountain tourism. Effectively matching tourism resources with service facilities and proposing optimized allocation strategies are crucial components of the tourism industry system. These actions are key to enhancing the value of tourism resources and improving industrial efficiency in mountain tourism counties.
Given the immobility of tourism resources [6], regional tourism industry development relies significantly on the spatial synergy between tourism resources and tourism service facilities [7,8]. Influenced by the tourism market, tourism service facilities exhibit dual characteristics in terms of service targets and levels [9,10]. Providers of tourism service facilities need to consider both the supply capacity of facilities and the possibility of their radiating out to non-tourism demands in order to address the normalized demands of residents and the non-normalized pressures caused by tourists [11,12]. Studies have shown that service facilities primarily consider accessibility, spatial equity, and socio-economic benefits in a spatial configuration [13,14]. As a crucial component therein, the layout of tourism service facilities mainly considers factors such as the principle of “seeking profit and avoiding harm”, service radii, linear multidirectional flow of tourists’ displacement, and spatial characteristics of aggregation nodes [10], which is mostly based on tour routes, itineraries, and transportation conditions, with service radii positioned at tourist nodes and both sides of tourist routes [15]. Mountainous counties exhibit significant polarization in terms of topography, transportation, and population distribution, resulting in relatively weak configurations of tourism service facilities and pronounced imbalances [16,17]. Therefore, tourism service facilities should fully consider the diverse demands arising from different types and structural forms of tourism resources so as to undertake targeted regulation and construction through stratified, classified, and graded approaches.
Up to now, only a limited number of studies have examined the correlation between tourism resources and service facilities, with a focus on aspects such as spatial matching relationships [1], spatial misalignment distribution [18], and spatial coordination zoning [19]. However, these studies predominantly use specific regions as their research sites, and the conclusions are centered around these case study areas, resulting in certain limitations. From the perspective of research methods, spatial statistical analysis techniques, such as Kernel Density Analysis, Standard Deviational Ellipse, Band Statistics Analysis, Collaborative Location Quotient, and the Spatially Constrained Multivariate Clustering Model, have been employed based on Points of Interest (POI) as the core data source [1,18,19] and have played a crucial role in the quantitative overlay analysis of the two. Additionally, numerous studies have explored the relationship between tourism resources and service facilities, which have provided significant support for this research, such as through constructing the geographical profiles of tourist attractions [20], investigating the mechanisms influencing tourism resource patterns [8,21,22], analyzing the distribution mechanisms of urban tourism facilities [23,24], examining the practical linkages between the two [25,26], and so on. Nevertheless, there is a gap in the spatial coordination methodology research focusing on fine-scale mountainous counties, making it difficult to effectively identify tourism development obstacles caused by spatial misalignment of tourism elements in such areas.
In light of the above, this paper leverages the technical advantages of existing methods such as Collaborative Location Quotient and integrates the unique conditions of mountainous counties to develop a fine-scale multidimensional spatial synergy methodology. On this basis, using Qimen County as a case study, this paper investigates the synergistic relationship between the two based on POI data for tourism resources and tourism service facilities, including transportation, catering, accommodation, and medical services. Adapting the fine-scale multidimensional spatial synergy methodology, this study conducted a scenario-based comparative analyses of altitude and population density. Overall, the primary contribution of this paper lies in its methodological innovation, which offers significant application advantages in small-scale mountainous areas. The aim is to provide methodological and technical support for optimizing fine-scale synergistic effects and development strategies. The Framework of this study is shown in Figure 1.

2. Materials and Methods
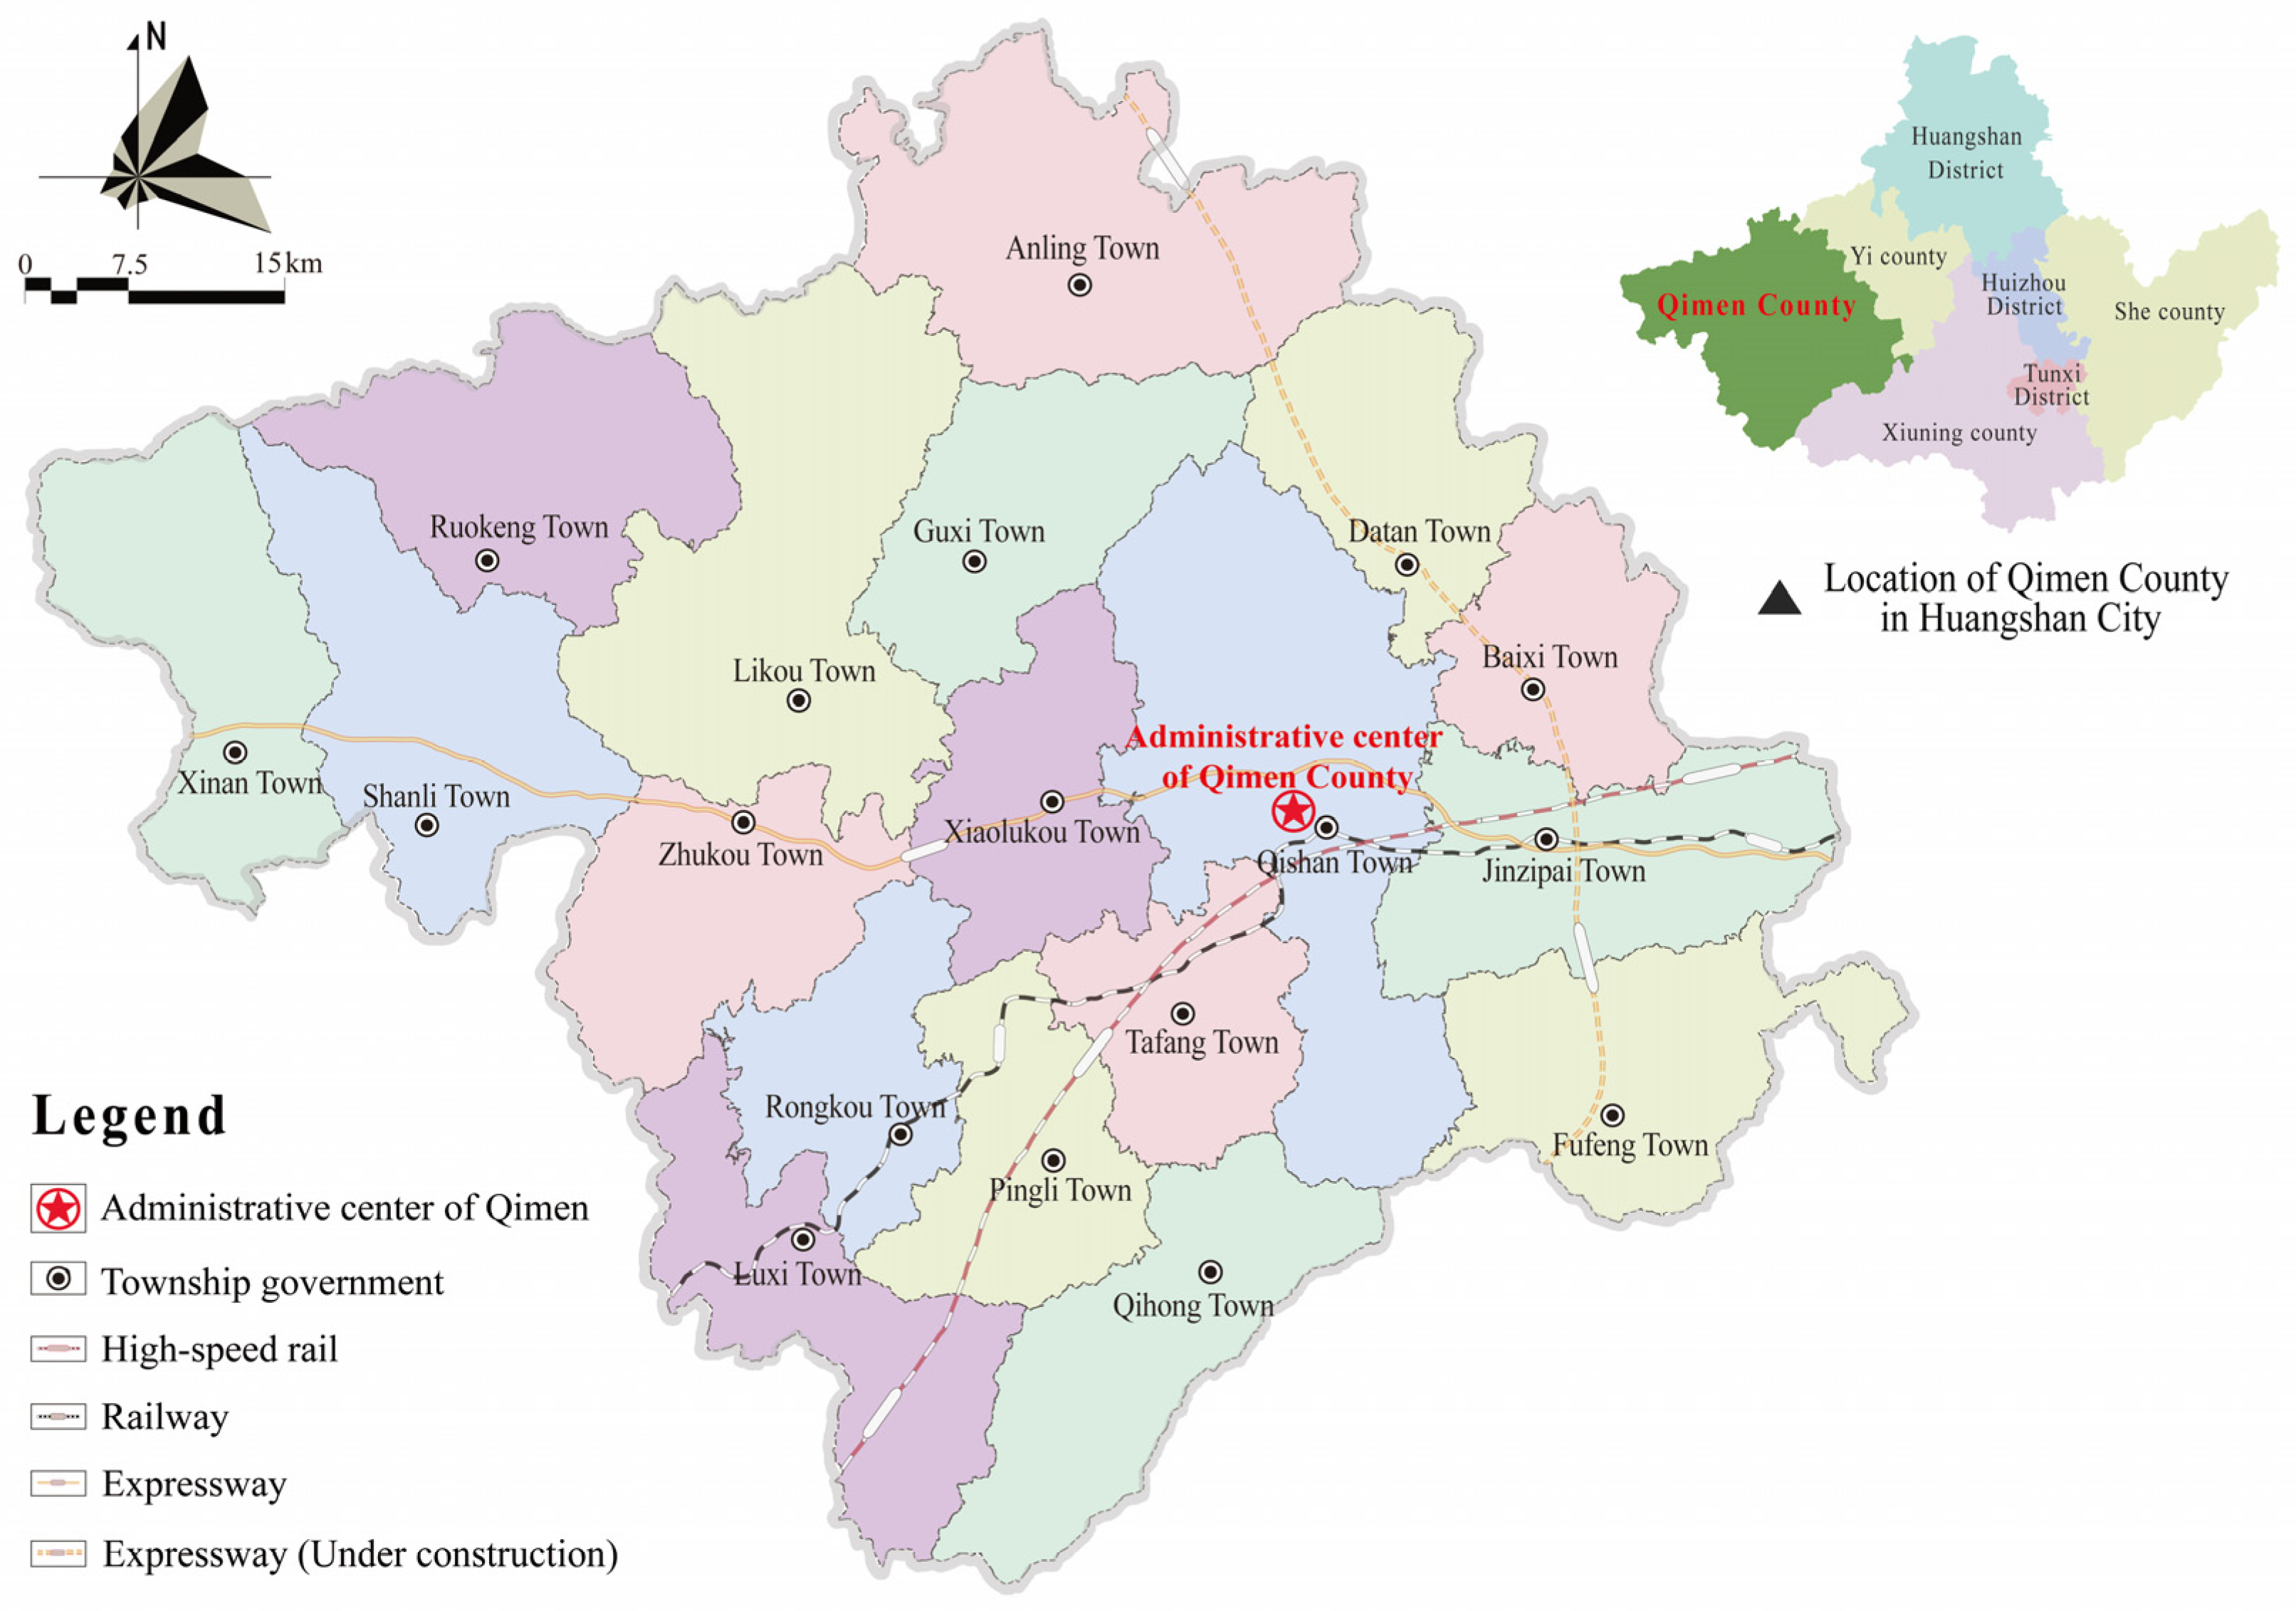
2.1. Study Site

Qimen County is located in the Huangshan District of China, with an area of 2257 km², as shown in Figure 2. It is a typical mountainous county characterized by “90% mountains, 5% water, and 5% farmland”. Qimen County boasts diverse natural scenery, unique cultural landscapes, and valuable historical relics, with a total of 2879 tourism resources primarily centered around tea, mountain landscapes, and historical architecture. In 2023, its total tourism revenue reached 20.3 billion yuan, accounting for 21.5% of the county’s total economic income. In recent years, with the accelerated development and construction of mountain tourism resources, the inadequacy and spatial misalignment of tourism facilities have become critical factors constraining tourism development in Qimen.

2.2. Research Methodology

Based on existing research, the term “synergy” in this study refers to the simultaneous enhancement of two or more research objects [27,28,29]; correspondingly, “misalignment” refers to the simultaneous weakening or inverse changes of two or more research objects [3]. In regional tourism, tourism resources and tourism service facilities typically exhibit a point-like spatial distribution pattern. Previous studies often quantified them based on administrative boundaries [30], which can lead to homogenization issues within the region and make it difficult to conduct refined analyses of key aggregation areas. Therefore, this study constructs a fine-scale multidimensional spatial synergy methodology based on the following steps (Figure 3) to enhance the precision and effectiveness of synergy analysis: (1) quantifying distribution patterns through the gridding of tourism resources and service facilities; (2) identifying and extracting multidimensional zones using the Voronoi Diagram Model; (3) conducting specific analyses of synergy level and pattern using overlay analysis, Local Indicator of Spatial Association (LISA), the Collaborative Location Quotient (CLQ) model, and so on.

2.2.1. Gridding of Tourism Resources and Tourism Service Facilities

(1)
Gridding of tourism resources
Gridding of tourism resources refers to the process of distributing tourism resource data within administrative regions into grids with appropriate cell sizes based on specific mathematical models. This transformation converts statistical units from administrative regions to grid cells, overcoming the drawbacks of uniform distribution of tourism resource statistical indicators within each unit caused by analysis based on administrative regions. Additionally, it allows for the expression of spatial differentiation patterns of tourism resources in regional units across gradients [31,32]. Therefore, gridding of tourism resources based on administrative regions can serve as one of the methods for spatial analysis and evaluation of tourism resources [33]. In this study, a grid file with a pixel size of 500 × 500 was created using ArcGIS Pro 2.5 to cover the entire research area. Thus, Qimen County was divided into 9248 equally-sized grids, with tourism resources allocated to each grid, which is the gridded tourism resource data.
(2)
Gridding of tourism service facilities
Considering the unique mountainous terrain of Qimen and referring to the existing research, different driving speed attributes and speed settings are set for each grid cell, as shown in Table 1. Based on Table 1, the time cost for each grid cell is calculated using the raster calculator, whereby the Qimen transportation time cost grid (500 m × 500 m) is generated. Subsequently, the Qimen transportation time cost dataset is constructed based on network analysis methods, and an OD cost matrix is established to obtain the accessibility grid data of tourism resources. Secondly, based on the Qimen grid file, transportation facility point data are allocated to each grid cell to construct gridded data on the quantity of transportation facilities. Finally, referring to existing research [34], accessibility and facility quantity data are weighted separately as 0.4 and 0.6 after data standardization; thus, the transportation grid data are generated.
Regarding the catering, accommodation, and medical gridding data, the point data of the three types of facilities are vectorized. Based on the Qimen grid file, the data for each type of facility are allocated to the grid cells, and thus the correspondingly gridded data are constructed.

2.2.2. Recognition and Extraction of Tourism Resource and Tourism Service Facility Zones

The Voronoi Diagram Model is utilized to achieve the recognition and extraction of multidimensional zones for tourism resources and service facilities on the gridded layout. It is a pattern that combines graph theory and geometric solution, defining spatial adjacency as polygonal adjacency, incorporating the three basic geometric data types of points, lines, and polygons into a set of adjacent objects [36]. This enables the description of spatial adjacency relationships and the extraction of zones with different densities [37]. Thus, the adaptive hierarchical grid spatial indexing method [38] can be applied to encode the distribution zones, facilitating standardized presentation and analysis of each zone.

2.2.3. Analysis of the Synergistic Level Pattern between Tourism Resources and Tourism Service Facilities

(1)
Overlay analysis of tourism resources and tourism service facilities
Overlay analysis refers to a series of set operations performed on two datasets within the same spatial reference system, with the purpose of analyzing the spatial characteristics and distinctive attributes of spatial objects with certain spatial relationships. Overlay analysis of multi-layered data not only produces new spatial relationships but also generates new attribute relationships. It can uncover differences, connections, and changes among multiple layers of data [39,40].
(2)
Synergistic pattern between tourism resources and tourism service facilities
The Local Indicator of Spatial Association (LISA) is employed to investigate the synergistic pattern between tourism resources and tourism service facilities, thus revealing their spatial distribution correlation and dependency characteristics [41,42]. The formulas for global and local spatial autocorrelation are as follows, and the specific interpretations are shown in Table 2:
Global spatial autocorrelation:
B M o r a n s I = i = 1 n j = 1 n w i j ( x i x ¯ ) ( y i y ¯ ) S 2 i = 1 n j = 0 n w i j
Local spatial autocorrelation:
I i = z i j = 1 n w i j z j
(3)
Synergistic level between tourism resources and tourism service facilities
This study employs the Collaborative Location Quotient ( C L Q ) model to investigate the synergistic level between tourism resources and service facilities. The C L Q demonstrates distinct advantages in assessing the synergy patterns (mutual spatial attraction) between two types of point features [43,44], encompassing both global CLQ ( G C L Q ) and local C L Q ( L C L Q ). For the purposes of the study, only the attractiveness of tourism resources to the layout of tourism service facilities is explored.
The G C L Q provides a holistic measurement of the degree to which tourism resources attract the spatial layout of tourism service facilities. The formula is as follows and the specific interpretations are shown in Table 2.
G C L Q I J = N I J / N I N J / ( N 1 )
L C L Q can reveal the spatial heterogeneity of correlations among different factors, as expressed in the following formula, with the specific interpretations shown in Table 2.
L C L Q I m J = N I m J N J / ( N 1 ) ;   N I m J = n = 1 N [ w m n f m n n = 1 N w m n ] , ( n m ) ;   w m n = exp [ 0.5 × d m n 2 d m b 2 ]

2.3. Data Sources

(1)
Tourism resource data
The tourism resource data were generated through three main processes: web mining, field survey, and interior coding, so that the foundational database could be formed. The timeframes for these processes were from March to June, 19 to 27 July, and August to September, 2022. During the web mining phase, tourism resource data were primarily sourced from government official websites, tourism platforms, Points of Interest (POI), Baidu searches, and so on, resulting in a total of 1907 resource points. Subsequently, during the field survey phase, three survey teams comprising 17 researchers conducted comprehensive surveys in Qimen, focusing on collecting information such as resource categories and geographic coordinates, resulting in 1259 resource points. In the interior coding phase, the resource points obtained in the previous phases were merged and refined, eliminating duplicates and low-value tourism points. Furthermore, based on the county’s land use, vegetation classification, transportation, and river network data acquired during the field survey, data validation and supplementation were performed, ultimately confirming 2879 tourism resources.
Considering the unique tourism development environment in Qimen, the 2879 tourism resources were categorized into two major types: natural and cultural. The former encompasses various subtypes, such as physiographic landscape, water area landscape, biological landscape, and weather and climatic landscapes, while the latter includes buildings and facilities, and cultural and historical sites.
(2)
POI data for tourism service facilities
Tourism service facilities encompass four major categories: catering, accommodation, medical, and transportation. Catering facilities include rural and urban restaurants, dessert shops, beverage shops, tea houses, pastry shops, and so on, while accommodation facilities comprise hotels, inns, hostels, and guesthouses. Medical facilities include comprehensive and specialty hospitals, pharmacies, and clinics, while transportation facilities consist of parking lots, train stations, airports, highway service areas, and toll stations.
POI data for tourism service facilities (longitude, latitude, name, address, etc.) were collected using Python 3.11 from both Amap (Alibaba, Beijing, China) and Baidu Maps (Baidu, Beijing, China) in October 2023. The number of catering, accommodation, medical, and transportation facilities collected was 715, 904, 893, and 846, respectively. Following data cleaning, the final effective numbers were 644, 885, 872, and 794, respectively.
(3)
Basic geospatial data
The administrative boundary data of Qimen County and inner townships were obtained from the Geospatial Data Cloud (http://www.gscloud.cn, accessed on 16 May 2024), yielding a total of 18 townships. Transportation data were sourced from the 2023 OpenStreetMap (OSM) public map (https://www.openstreetmap.org/, accessed on 16 May 2024). Digital Elevation Model (DEM) data with a resolution of 12.5 m were acquired from the European Space Agency (https://dataspace.copernicus.eu/, accessed on 16 May 2024). Population grid data with a resolution of 100 m from the 7th National Population Census of China (2020) were obtained from the figshare platform (https://figshare.com/s/d9dd5f9bb1a7f4fd3734, accessed on 16 May 2024) [45].

3. Results

3.1. Distribution Characteristics of Tourism Resources

Based on the distribution of tourism resources, a gridded calculation was employed to generate a spatial distribution grid map of tourism resources (Figure 4). From Figure 4, with increasing altitude, the density of resources gradually decreases. The vertical zonation of Qimen results in a widespread, decentralized distribution of natural tourism resources in mid-to-high-altitude areas, while humanistic tourism resources in low-altitude urbanized areas exhibit a granular, clustered distribution, with these two scenarios manifesting a polarization. Among mid-to-high-altitude areas, the northern Guniujiang Mountain area is a typical zone enriched with natural tourism resources, being a part of the largest national-level natural reserve in East China. It features a diversified distribution of geological, forest, and biological resources, possessing high tourism, ecological, and scientific research value. Among low-altitude urban construction areas, the county seat, the area southwest of Daohu, Shanli area, and Anling area exhibit characteristics of political and economic centers, port distribution hubs, dense historical villages, and rich areas of agricultural resources, respectively. These areas are densely populated, rich in humanistic resources, and possess high visibility and uniqueness, making them focal points for county-level tourism development.

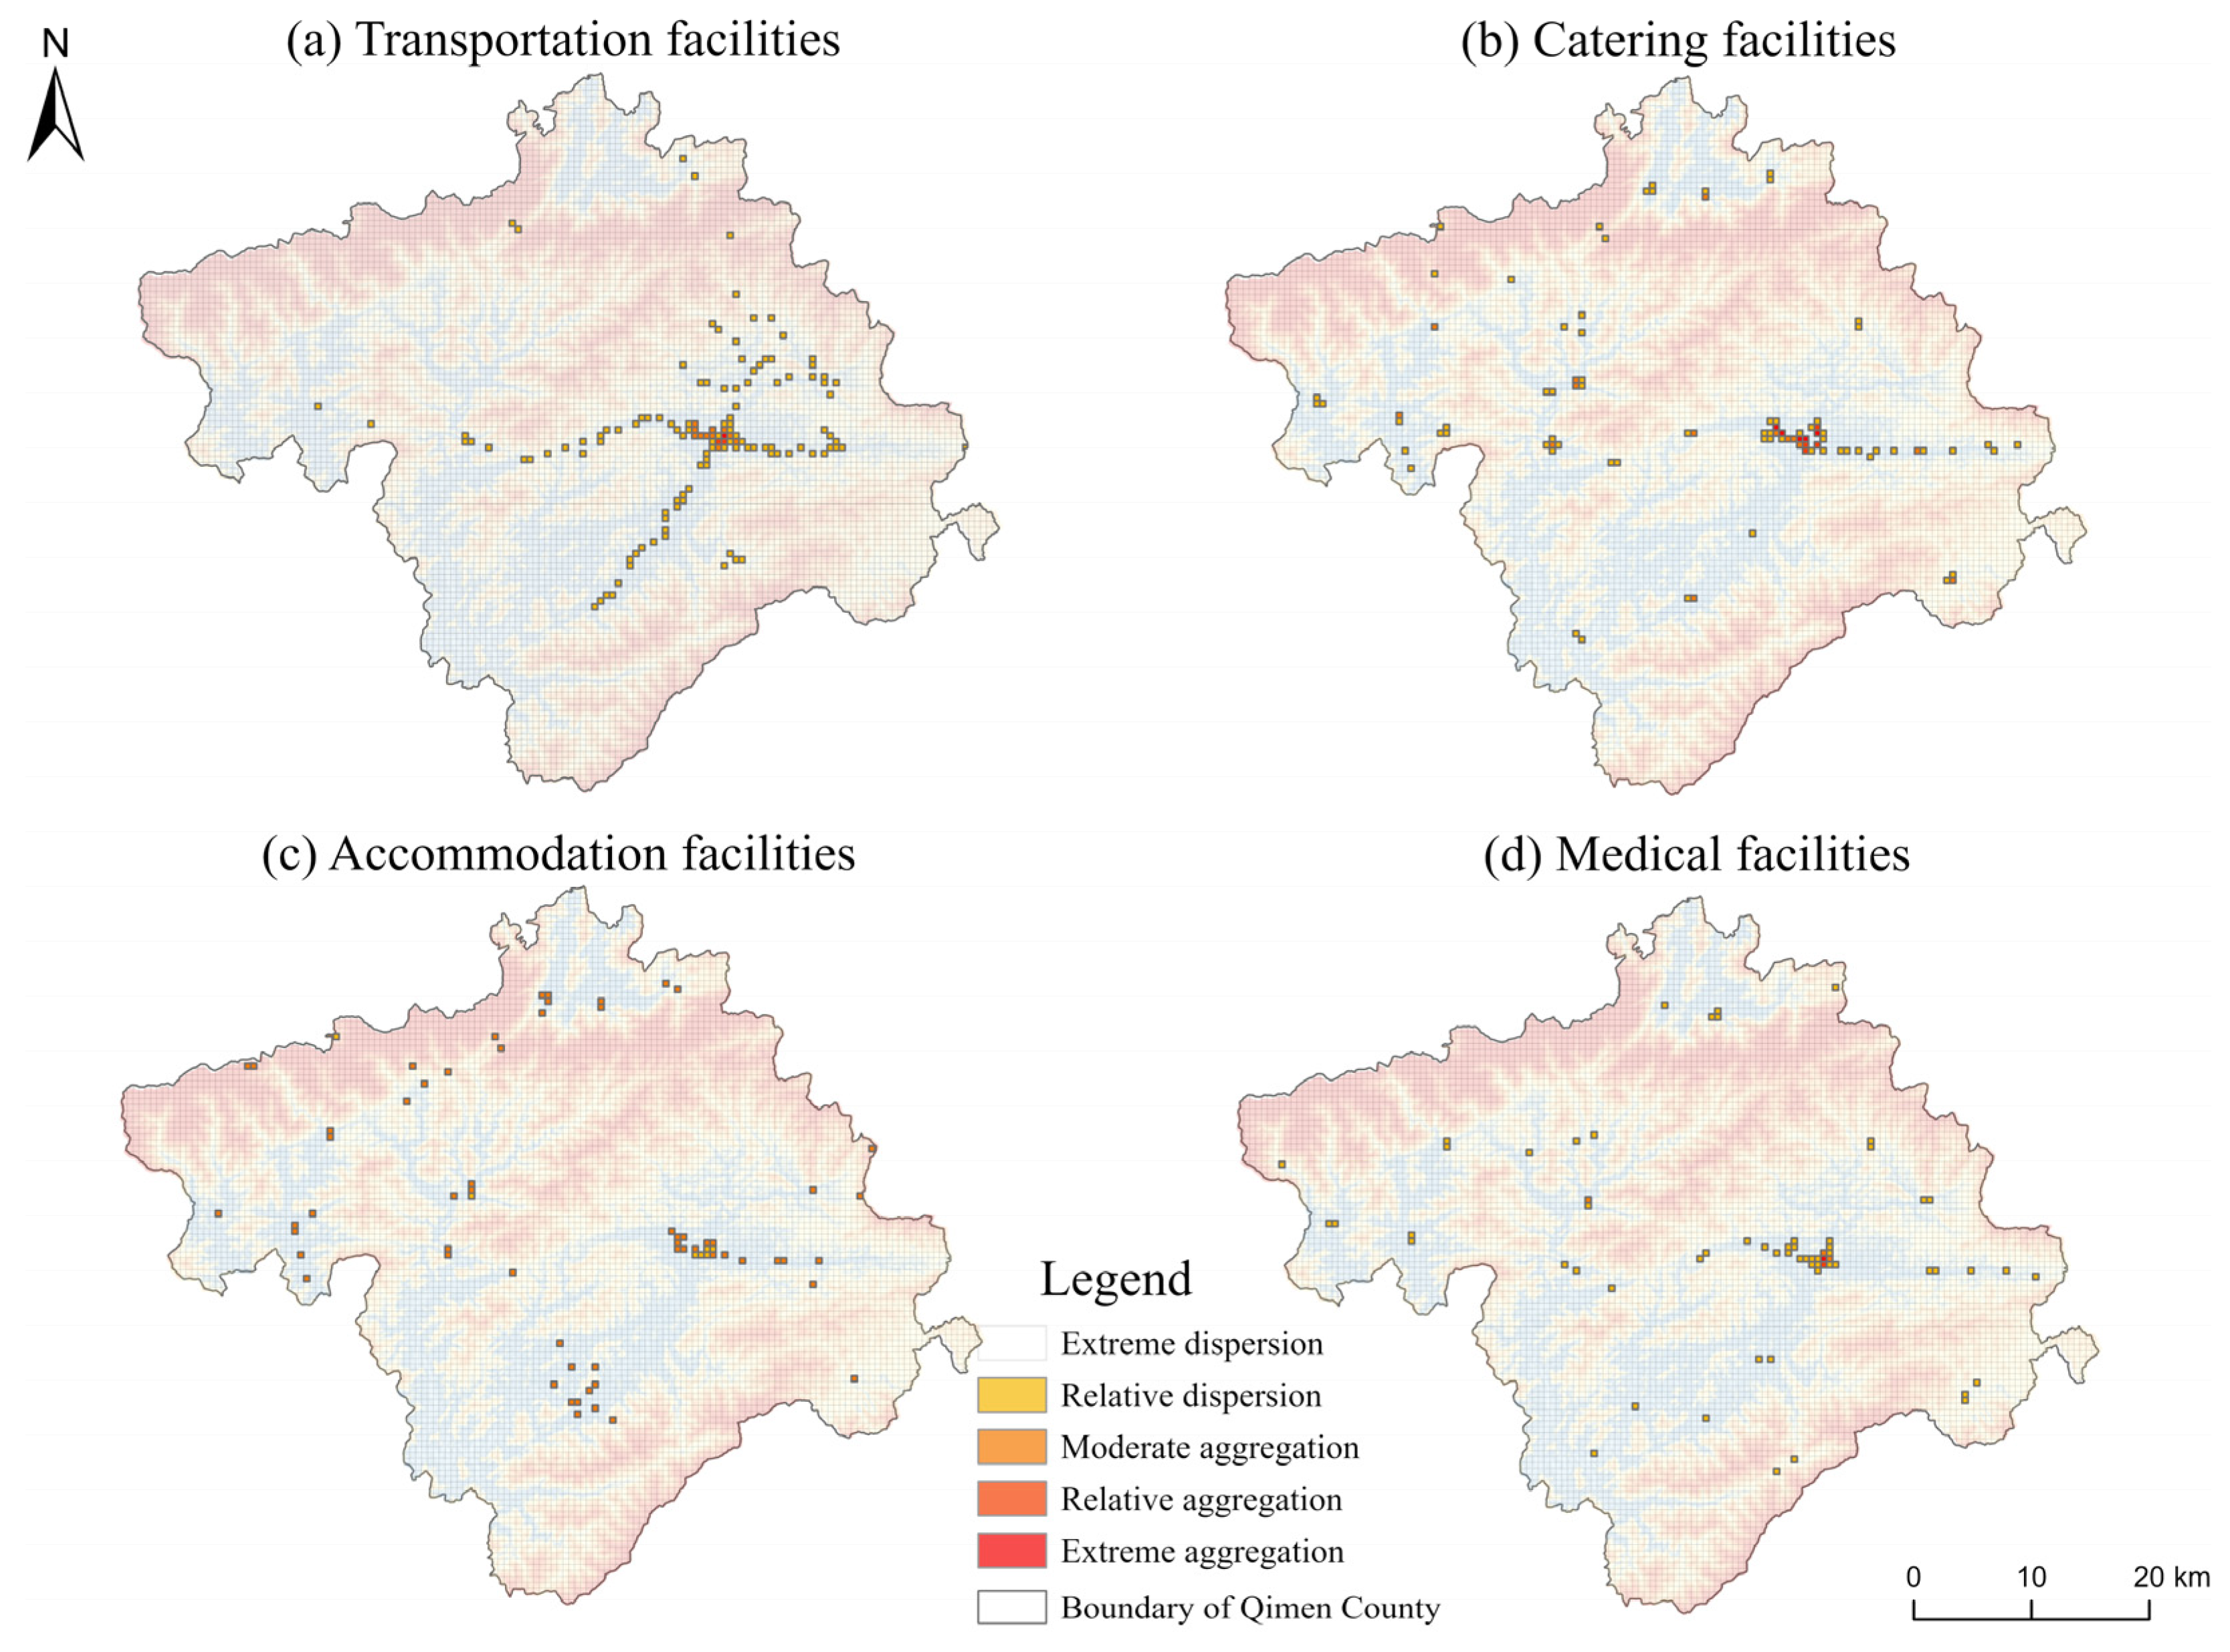
3.2. Distribution Characteristics of Tourism Service Facilities

Utilizing gridded calculations based on tourism service facilities, a spatial distribution grid map of each service facility was generated (Figure 5). The concentration of tourism service facilities predominantly aligns along transportation routes in low-altitude areas, reflecting the composite aspects of settlement/population distribution, service accessibility, and construction feasibility. Among them, transportation facilities exhibit a high degree of consistency with the road network pattern, while catering and accommodation facilities form dense distributions centered around major towns, and medical facilities are relatively dispersed. In Figure 5a, transportation facilities primarily exhibit a linear distribution pattern along the road network, with the county seat serving as the core, and form a densely distributed area resembling a cross. In Figure 5b, catering facilities are most densely concentrated in the county seat, followed by the Likou area, while in Figure 5c, accommodation facilities primarily form two major clusters in the county seat and Pingli area, reflecting the active tourism economies of the county seat, Likou, and Pingli where service facilities are relatively complete. At the same time, accommodation facilities present a linear distribution trend consistent with the mountainous terrain in southern Guniujiang, reflecting its relatively clear development trend. In Figure 5d, apart from the county seat, medical facilities exhibit severe dispersion, making it challenging to meet the increasing local tourism demands, indicating a crucial area requiring significant enhancement in the future.

3.3. Spatial Synergistic Level between Tourism Resources and Tourism Service Facilities

Based on the distribution of resources/facilities and the corresponding gridded results, hierarchical distribution areas were extracted during the Voronoi Diagram Model (Figure 6): (1) Drawing from existing research [35], resource-intensive areas were extracted with criteria set as central polygon density ≥ 0.12/km², polygon area ≤ 5 km², and distance between control points ≤ 2.5 km. (2) Based on the topographical division results of Qimen (Section 3.1), resource-sparse areas were delineated by excluding resource-intensive areas and using mountain ranges as boundaries. (3) Considering the polarized and dispersed pattern of tourism service facilities, areas outside facility-intensive areas were designated as dispersed areas. The coding of distribution areas and resource densities is illustrated in Figure 6a and Table 3. Noteworthy resource-intensive distribution areas extracted from the results include A2, B2, B3, C2, C3, C5, C6, and D3.

3.3.1. Spatial Overlay Analysis of Tourism Resources and Tourism Service Facilities

The overlay analysis method was employed to preliminarily discern the spatial synergy between tourism resources and service facilities. As depicted in Figure 6b, a dualistic coexistence pattern of synergy and misalignment between tourism resources and service facilities is observed spatially, with notable synergy in core urban areas and pronounced misalignment in peripheral regions. Specifically, C5 represents a significantly synergistic area, followed by B3 and C3; meanwhile, misalignment phenomena are evident in the peripheral regions. C5, characterized by frequent economic activities and dense population, serves as a crucial tourism hub with abundant tourism resources and comprehensive service facilities. Conversely, B3 and C3, designated as a mountainous ecological tourist destination and the planned construction site of Pingli Town, respectively, exhibit pronounced synergy between resources and catering/accommodation facilities, as well as between resources and transportation/accommodation facilities. To some extent, this reflects the focal points and shortcomings of core urban development. For instance, B3 should further strengthen the enhancement of transportation and medical facilities, while C3 should promptly address deficiencies in catering and medical facilities.
Figure 6. Spatial synergy between tourism resources and tourism service facilities.
Land 13 00999 g006

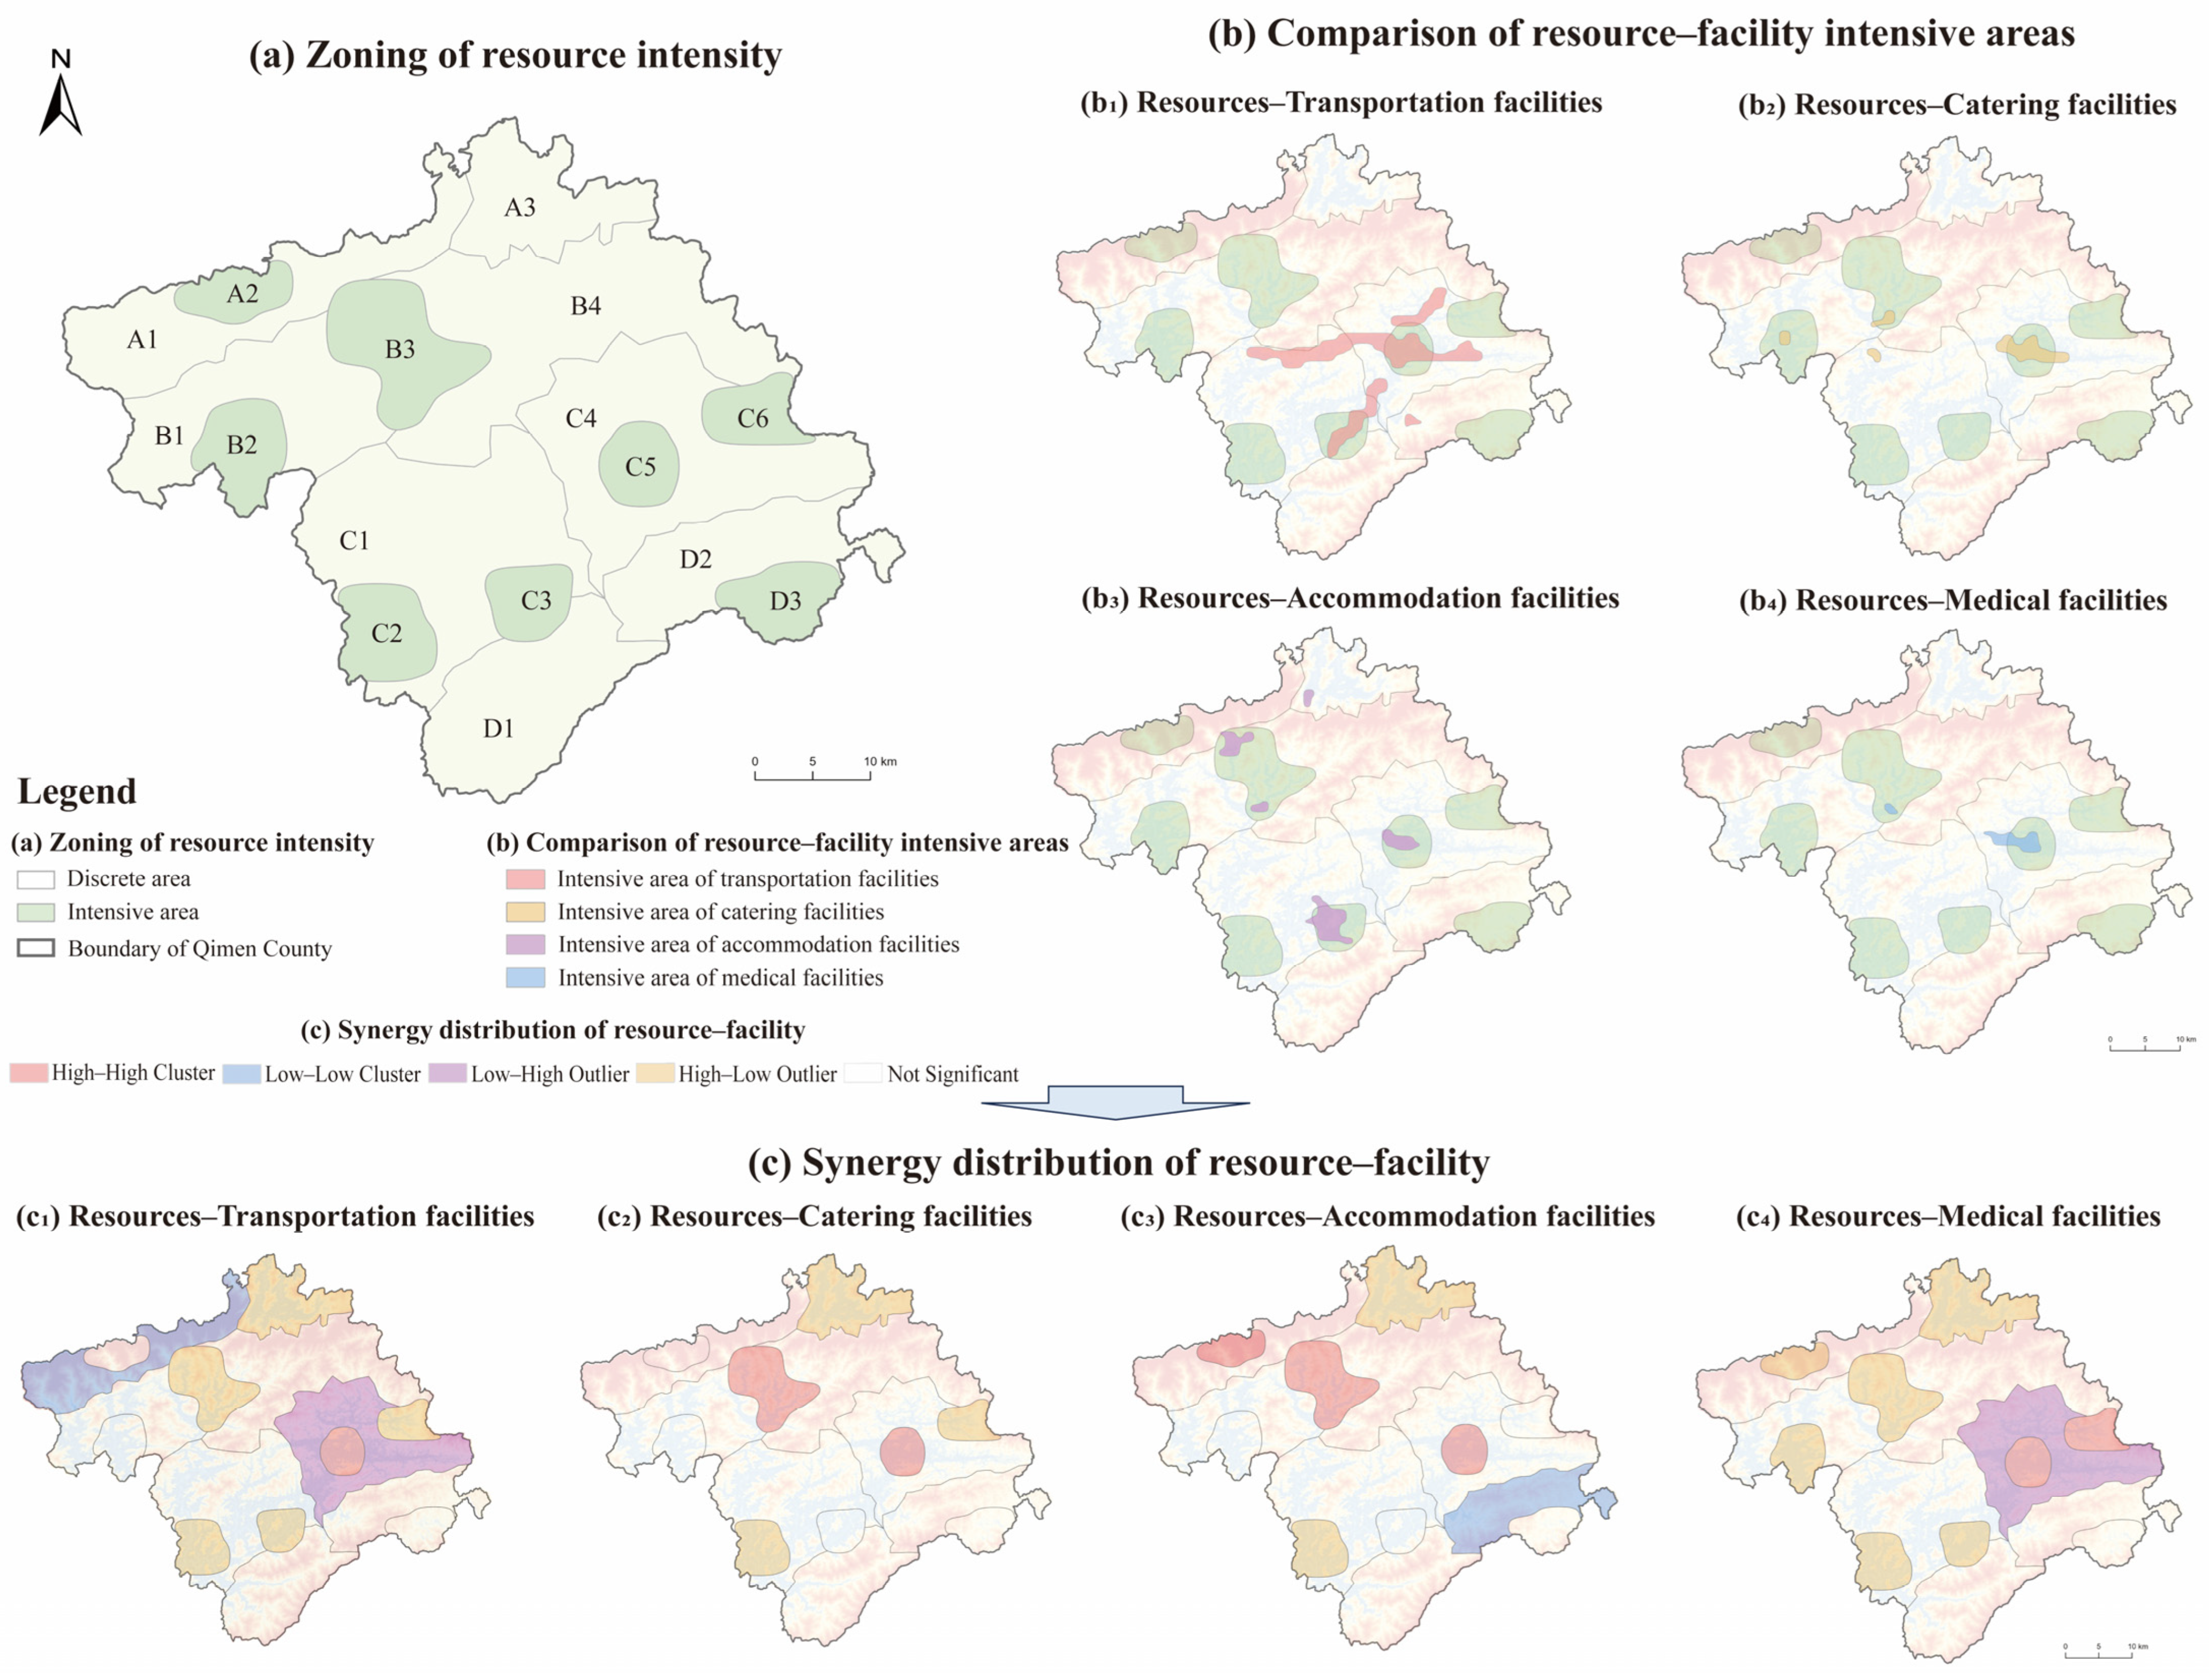
3.3.2. Spatial Synergistic Pattern of Tourism Resources and Tourism Service Facilities

Building upon Section 3.3.1, this section employs GeoDa 1.22 to conduct a LISA analysis at the level of resource partitions (Figure 6c), revealing localized spatial synergies between tourism resources and the four types of tourism service facilities: transportation, catering, accommodation, and medical services.
In Figure 6c, with the axis formed by Qishan–Likou (B3–C5), tourism resources and service facilities exhibit a symmetrical synergy pattern on both sides. Along the B3–C5 axis, C5 demonstrates characteristics of abundant tourism resources and comprehensive facilities, indicating that the county seat boasts rich tourism resources and well-developed service facilities, thus serving as the core of regional tourism development. B3 exhibits characteristics of abundant tourism resources and catering/accommodation facilities, indicating the need for further enhancement of transportation and medical provisions. A2 displays characteristics of abundant tourism resources but fewer medical facilities and more accommodation facilities, suggesting the necessity to strengthen medical facilities construction alongside the development of mountainous and tea-garden landscapes for the promotion of homestay establishments. C4 shows characteristics of fewer tourism resources but more transportation and medical facilities, indicating relatively well-equipped service facilities in the vicinity of the county seat, with a focus on tourism resources and activities radiating and diffusing from the county seat. On either side of the B3–C5 axis, A3 and C2 exhibit significant characteristics of abundant tourism resources but fewer facilities, reflecting insufficient tourism service facilities that cannot well meet the vigorous demand generated by abundant tourism resources. A1 and D2 respectively demonstrate conditions of fewer tourism resources and fewer transportation and accommodation facilities, with the former requiring enhanced transportation infrastructure alongside targeted ecological tourism development and the latter necessitating improved accommodation facilities alongside intensified resource development efforts.

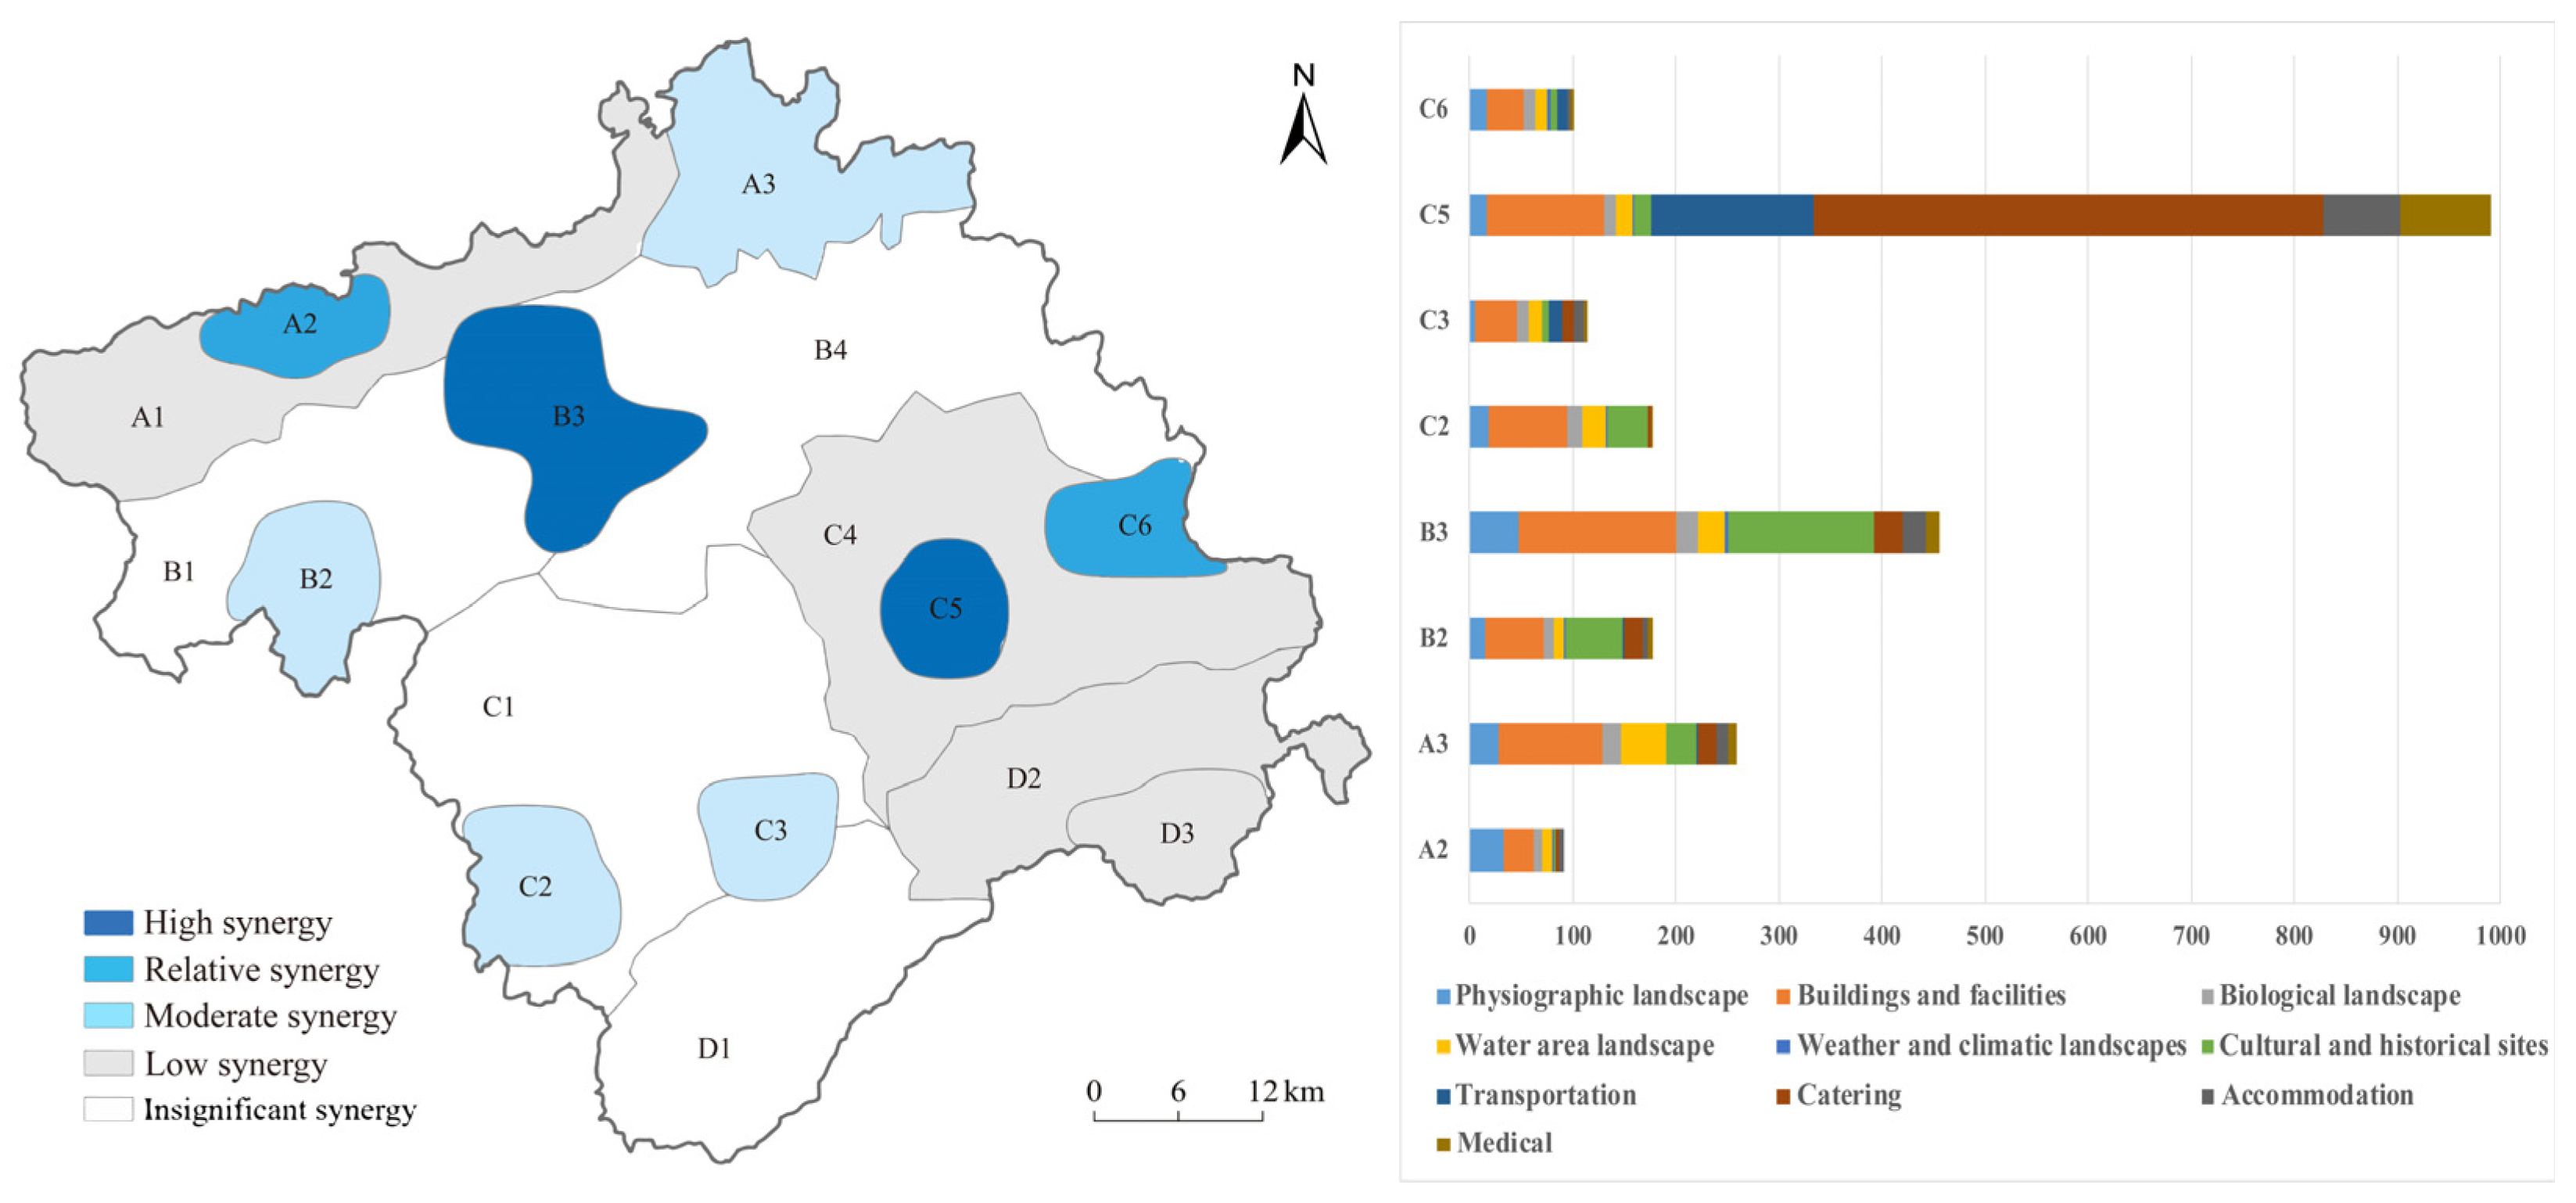
3.3.3. Spatial Synergistic Level between Tourism Resources and Tourism Service Facilities

Utilizing the G C L Q to calculate the spatial synergistic level between tourism resources and service facilities (Table 4), it was found that all results are less than 1. This indicates that the attractiveness of tourism resources in Qimen for the layout of tourism service facilities is generally weak, with a relatively low level of spatial synergy between the two.
Utilizing the LCLQ, the degree of attraction of tourism resources to the overall service facilities in different spatial contexts was calculated. Following established research, the synergistic levels between the two were classified into five categories: insignificant synergy [0, 20%], low synergy (20%, 40%], moderate synergy (40%, 60%], relatively high synergy (60%, 80%], and high synergy (80%, 100%] [46]. The synergistic levels in each partition are presented in Table 4 and Figure 7. They reveal a pattern of “dual-core outward diffusion attenuation” in the synergistic distribution of county-level tourism resources and tourism service facilities.
Among these, the dual cores (C5 and B3) exhibit a high synergy status. C5 boasts the best tourism resource endowment, with rich buildings and facilities resources, superior transportation, and catering facilities. B3 features abundant resources of buildings and facilities, and cultural and historical sites, while tourism service facility development requires enhancement. The aggregation effect can be achieved through tourism hubs, thus stimulating regional tourism growth.
C6 and A2 demonstrate a relatively high synergy status, with rich geological landscapes and a need for enhanced tourism service facilities. Targeted reinforcement of resource and facility coverage through a cost–benefit mechanism can promote regional tourism growth. C3, C2, B2, and A3 exhibit a moderate synergy status, while A1, D3, C4, and D2 demonstrate significantly low synergy status, indicating negligible synergy in peripheral areas.

4. Scenario-Based Comparative Analyses on Altitude and Population Density

4.1. Spatial Synergy Analysis Based on Different Altitude Zones

Based on the Chinese geomorphological zoning theory [47], the topography of Qimen was classified into plain (<200 m), hill (200–500 m), and mountain (>500 m). Subsequently, based on the topographical characteristics, it was further divided into regions, including the central-eastern, western, and northern plains, the northern and southern hills, and the northern and southern mountains (Figure 8a).
The synergistic levels between tourism resources and service facilities exhibit a pronounced pattern of “plain > mountain > hill” (Figure 8c and Table 5). Specifically, the first gradient synergy areas are predominantly plains (P–CE, P–W), the second is dominated by mountains (M–S, P–N, and M–N), and the third is mainly hills (H–N, H–S). This can be attributed to several factors: the plains have high population density, frequent economic activities, and comprehensive supporting facilities, resulting in a high level of synergy; mountainous areas boast distinctive tourism features and abundant resources, with facilities primarily catering to tourism demands, resulting in a slightly lower synergistic level; as transitional zones between plains and mountains, hills lack abundant resources, have less distinctive features and insufficient facility provisions, primarily relying on radiation out from the plains, resulting in the lowest synergistic level.
Focusing on the synergy combinations in different altitude zones (Figure 8b), within the first gradient synergy areas, P–CE exhibits significant characteristics of multiple resources and facilities, while P–W shows prominent characteristics of multiple resources but fewer transportation and medical facilities, requiring targeted reinforcement. In M–N, significant characteristics of multiple resources and multiple accommodation facilities are evident, suggesting the need for focused enhancement of transportation, catering, and medical facility construction.

4.2. Spatial Synergy Analysis Based on Different Population Density Zones

Based on the 7th National Population Census data, 100 m resolution population data for Qimen were obtained and processed. To match the grid resolution of tourism resources and service facilities, the population data were reclassified using raster data reclassification techniques, resulting in the conversion to 500 m resolution data. Subsequently, employing the Voronoi Diagram Model, the hierarchical distribution areas of population based on “high-intensive, moderate-intensive, and dispersed” were extracted (Figure 9a).
In Figure 9c and Table 5, based on the synergy between the two, there exists a highly positive correlation between population density and synergistic level, demonstrating a spatial synergy trend of “triple-core outward diffusion attenuation”. Among these trends, the three cores, ranked from high to low, are HIA, MIA 3, and MIA 4, characterized by high population density, abundant resource endowment, a vibrant tourism economy, and well-equipped service facilities, displaying relatively high synergistic levels. Expanding outward to MIA 2 and MIA 1, where population density is relatively high, resource density is lower but distinctive, and service facilities meet basic standards, moderate synergistic levels are observed. Finally, reaching the areas with the lowest synergistic levels, namely DA 3 and the peripheral regions with insignificant synergy (DA 1 and DA 2), characterized by poor resource endowment and inadequate facility coverage, overall synergistic levels are lower.
Focusing on the synergy combinations in different population density areas (Figure 9b), the population-intensive area HIA exhibits characteristics of high resource–facility aggregation, indicating a solid development foundation. The moderate population-intensive areas MIA 1–4 all display a certain degree of resource–facility misalignment. The sparsely populated area DA 3 represents a typical region with low levels of both resources and facilities, indicating a weaker development foundation.

5. Discussion

(1) Under the influence of vertical zonation, the synergy between tourism resources and tourism service facilities in a mountainous county exhibits a distribution characteristic of diffusion attenuation from low to high elevations. Specifically, with important low-altitude towns as the core, the higher the altitude, the lower the level of regional synergy. The reason may be that synergy effects typically first appear at certain growth points (extremes) with varying intensities and then spread outward through different channels [48,49]. Essentially, the spatial synergy in mountainous counties represents a balanced interaction of internal and external factors of tourist destinations, and the process of diffusion attenuation is an important representation of distance attenuation effects at the spatial level [50,51]. Due to constraints imposed by terrain conditions, social, economic, and comprehensive strength enhancement in mountainous areas is easily restricted [52,53]. Consequently, lagging economic development and uneven tourism effects are common challenges faced by mountainous counties [54]. Typically, this manifests as higher comprehensive development levels in low-altitude settlements compared to high-altitude mountain areas [55,56]. Many high-altitude mountain areas are often recognized as problematic regions due to difficulties in development and the sparse population [57]. The divergent synergy states at different elevations precisely reflect the significant spatial gradient effects in the synergy between resources and service facilities in mountainous counties. Thus, it is evident that there exists a notable spatial gradient effect in the synergy between tourism resources and service facilities in mountainous counties, which provides an important prerequisite for further understanding and solving the spatial dislocation problem between the two.
(2) The key reasons for the spatially uneven synergy between tourism resources and tourism service facilities in fine-scale mountainous counties lie in altitude, settlement, transportation, population distribution, etc. Given the pronounced spatial gradient effect in the synergy of a mountainous county, this study found that multidimensional objects do not exhibit homogenization in their synergy states within specific areas. The spatial unevenness of the synergy between the two is significant in fine-scale mountainous counties, and high synergy areas exhibit certain regional coupling characteristics. This observation aligns with existing research conducted at various scales, such as on the Qinghai–Tibet Plateau, in prefecture-level cities, and in villages [19,58]. The reason may be that vertical zonation of mountainous areas leads to the dispersion of settlements, populations, and tourism resources [59], and, as altitude increases, population density decreases. However, transportation, catering, accommodation, medical, etc. facilities have a strong dependence on human activities, resulting in the challenge to achieve spatial equilibrium in the construction of service facilities. It is evident that altitude, settlements, transportation, population distribution, etc. are crucial determinants of the unevenness of resources and service facilities in mountainous counties. Focusing on the synergy of service facilities, accommodation facilities exhibit a dual-core aggregation pattern, relying on key towns while also demonstrating a linear distribution consistent with the mountainous terrain. The former is influenced by factors such as settlements and population distribution, while the latter reflects the unique characteristics of ecologically sound tourism development in mountainous counties, wherein tourism development can simultaneously consider the synergistic effects of “economic–environment” under the premise of sustainability [60,61]. In contrast, studies on plain areas indicate a less significant regularity in the spatial synergy of tourism resources and accommodation facilities [1]. Thus, the effective matching of tourism resources and service facilities has a critical entry point, and further optimization strategies have a key focus. This is expected to contribute to the synergistic development of both elements and enhance the efficiency of the tourism industry in mountainous counties.
(3) Utilizing grid vectorization for overlay, analysis, and calculation, this study has developed a set of fine-scale multidimensional spatial synergy analysis methods, which possess significant application and generalization value in fine-scale spatial synergy analysis. Traditional synergy analysis models often focus on the similarity between attribute characteristics of research objects [62], yielding excessively detailed results [19] that are challenging to abstract into the characteristics and regularities of spatial development of the research objects. The multidimensional spatial synergy method proposed in this study integrates “multidimensional object gridding—multidimensional partition recognition and extraction—multidimensional zoning synergy study”. By overcoming the homogenization dilemma, accurately pinpointing multi-scenario regions, and enhancing the advantages of agglomeration effects, this method achieves differentiated and hierarchical development, thereby providing a systematic approach to achieving scientific synergy. With its high accuracy and strong operability, this method adequately addresses the challenge of complex attribute characteristics of research objects and the difficulty of obtaining reasonable synergy results using traditional methods. This method considers both the heterogeneity of mountainous counties and the adjacency between mountainous regions, holding important application and generalization value in fine-scale mountainous counties, which provides a solid technical foundation for the spatial synergistic analysis of tourism resources and service facilities.

6. Conclusions

In response to the uneven matching of tourism resources and service facilities in mountainous counties, this study investigates a multidimensional spatial synergy method, which is expected to provide important guidance for the enhancement and targeted development of multi-situation tourism resources and service facilities in tourist destinations. It holds significant application and dissemination value in fine-scale spatial synergy analysis. The research findings are summarized as follows:
(1) Under the influence of mountainous vertical zoning, higher altitudes correspond to lower resource density, resulting in a widespread, decentralized distribution of natural tourism resources in mid-to-high-altitude areas, while humanistic tourism resources in low-altitude urbanized areas exhibit a granular, clustered distribution. These contrasting scenarios manifest a polarization. However, tourism service facilities are primarily distributed along transportation lines in low-altitude areas, leading to spatial disparities that hinder the realization of tourism supply–demand matching. Specifically, transportation facilities and road network layouts exhibit high consistency, while catering and accommodation facilities form dense distributions around major towns, with notable dispersion characteristics of medical facilities. Overall, there is a certain degree of misalignment between tourism resources and service facilities, resulting in an unbalanced tourism supply situation in mountainous counties. This has led to a “double-edged sword” development scenario, which is a core reason for the differentiated development prospects of mountainous counties.
(2) The spatial gradient effect of synergy between tourism resources and tourism service facilities in mountainous counties is significant, with higher synergy levels observed in core urban areas and pronounced misalignment in peripheral regions. From the perspective of synergy patterns, centered on the Qishan–Likou axis, tourism resources and service facilities in Qimen exhibit a symmetrical distribution, showing a “dual-core outward diffusion attenuation” trend in synergy level. Based on spatial synergy, the foundation for differentiated development in mountainous counties can be established. In this context, enhancing the construction of tourism service facilities can be achieved by leveraging resource bases through economies of scale and cost-effectiveness mechanisms. This approach is beneficial for strengthening advantages and addressing gaps.
(3) Under different scenarios of altitude and population density, the synergy characteristics of tourism resources and service facilities vary, providing important guidance for focused development in mountainous counties. With increasing altitude, the synergy level of the two shows significant characteristics, with the highest synergy level in plain areas, followed by mountainous areas, and the lowest in hilly areas. Meanwhile, there is a strong positive correlation between population density and synergy level. Based on multiple altitude and population characteristics, future tourism resource development and spatial layout of tourism service facilities could consider the interactive scenarios of altitude and population density, implementing spatial optimization through classification and stratification.
Overall, grasping the differentiated development strategy of “strengthening core towns while emphasizing targeted areas in peripheral regions” is crucial for the coordinated development and optimization of tourism resources and service facilities in fine-scale mountainous counties. With the development of settlements, there is a high degree of spatial overlap among population, tourism resources, and service facilities in mountainous counties. On the one hand, the synergistic effect of tourism resources and service facilities in core towns is prominent, requiring the strengthening of resource advantages and facility configuration to enhance regional visibility, attractiveness, and security through economies of scale. On the other hand, the phenomenon of synergy misalignment is prominent in peripheral areas due to the differentiated positioning of regional tourism development. It is possible that the synergy composition of tourism resources and service facilities in similar regions may exhibit significant differences, such as disparities in synergy levels and differentiated combinations of different service facilities [21,63]. In response to this, focusing on the differences in tourism resource attributes, objectives, and demands, strengthening tourism service facilities can be guided through the scale effect and cost–benefit mechanisms, leading to targeted construction and improvement through classification, stratification, and hierarchical development.
The shortcomings of this study include primarily focusing on exploring tourism resources and service facilities data from a single year, thus lacking exploration of temporal changes in their synergy. Addressing how to obtain long-term data and conducting standardized processing for benchmarking is crucial for future research. Additionally, the multidimensional spatial synergy method proposed in this study holds significant value in destination tourism development. In the future, integrating multi-case population, land, commercial, and tourist survey data over time can facilitate a multidimensional analysis of destination goals and synergy relationships. This approach can validate the effectiveness of the method and explore path optimizations to address potential issues.

Author Contributions

Conceptualization, Y.W. and H.Y.; methodology, Y.H.; software, K.W.; validation, H.Y. and W.L.; formal analysis, H.Y. and Y.H.; investigation, Y.W., Y.H., W.L. and K.W.; resources, W.L.; data curation, W.L. and K.W.; writing—original draft preparation, Y.H.; writing—review and editing, Y.H., H.Y. and C.S.; visualization, W.L. and C.S.; supervision, Y.W. and H.Y.; project administration, Y.W.; funding acquisition, Y.W. All authors have read and agreed to the published version of the manuscript.

Funding

This research was funded by Key R&D Projects in Xinjiang Uygur Autonomous Region (2021B03002-2).

Data Availability Statement

The original contributions presented in the study are included in the article. Further inquiries can be directed to the corresponding authors.

Conflicts of Interest

The authors declare no conflicts of interest.

Note

1

References

  1. Liu, J.; Zhang, X.; Zhang, T.; Yang, Y. Spatial matching relationship between tourist attractions and supporting facilities in Qingdao from the perspective of convenience. J. Nat. Sci. Hum. Norm. Univ. 2023, 46, 28–39. [Google Scholar]
  2. Liu, J.; Ji, X.; Liu, J.; Zhang, T. Research on matching supply and demand of tourism resources in Jiaodong economic circle based on multi-source heterogeneous data. J. Geo-Inf. Sci. 2024, 26, 393–407. [Google Scholar] [CrossRef]
  3. Charati, M.K.; Gholian-Jouybari, F.; Hajiaghaei-Keshteli, M.; Paydar, M.M.; Sadeghi, F. Designing a sustainable dental tourism supply chain considering waste treatment. Ann. Oper. Res. 2024, 1–42. [Google Scholar] [CrossRef]
  4. Ren, Y.; Lu, L.; Han, Y. Research framework of tourism resources from a new perspective of tourism resources. J. Nat. Resour. 2022, 37, 551–567. [Google Scholar] [CrossRef]
  5. Meng, G.; Wang, K.; Wang, F.; Dong, Y. Analysis of the tourism-economy-ecology coupling coordination and high-quality development path in karst Guizhou Province, China. Ecol. Indic. 2023, 154, 110858. [Google Scholar] [CrossRef]
  6. Bao, J.; Chen, Y.; Ma, L. The process and mechanism of tourism resources evaluation: From technical evaluation to the social construction perspective. J. Nat. Resour. 2020, 35, 1556–1569. [Google Scholar] [CrossRef]
  7. Liu, J.; Li, Y.; Lin, C.; Wang, J.; Qiao, Z.; Ge, Q. Spatial pattern of the tourism resources of Yangtze River Tourism Belt. Resour. Environ. Yangtze Basin 2016, 25, 1009–1015. [Google Scholar] [CrossRef]
  8. Song, X.; Du, L.; Wang, Z. Correlation Analysis of Urban Road Network Structure and Spatial Distribution of Tourism Service Facilities at Multi-Scales Based on Tourists’ Travel Preferences. Buildings 2024, 14, 914. [Google Scholar] [CrossRef]
  9. Mandić, A.; Mrnjavac, Ž.; Kordić, L. Tourism infrastructure, recreational facilities and tourism development. Tour. Hosp. Manag. 2018, 24, 41–62. [Google Scholar] [CrossRef]
  10. Chen, W.; Wu, Z. The problems, strategy, and mechanism of integrating cultural and tourist public services. Stud. Cult. Art 2020, 13, 1–12. [Google Scholar]
  11. Bahar, A.M.; Maizaldi, M.; Putera, N.; Widiestuty, R.; Chaniago, S.; Eliza, Y. The effect of tourism facilities, service quality and promotion of tourist satisfaction in South Pesisir District. J-MAS (J. Manaj. Dan Sains) 2020, 5, 5–9. [Google Scholar] [CrossRef]
  12. Scotti, F.; Flori, A.; Secchi, P.; Arena, M.; Azzone, G. Exploring drivers of overnight stays and same-day visits in the tourism sector. Sci. Rep. 2024, 14, 9840. [Google Scholar] [CrossRef]
  13. Zhan, D.; Zhang, W.; Chen, L.; Yu, X.; Dang, X. Research progress and its enlightenment of urban public service facilities allocation. Prog. Geogr. 2019, 38, 506–519. [Google Scholar] [CrossRef]
  14. Tao, C.; Huang, S.; Wang, J.; Qiao, G. Accessible tourism: Tourists with physical disability-segmentation based on perceived travel barriers. Tour. Rev. 2024. [Google Scholar] [CrossRef]
  15. Yang, G. The Management of Visitor Attractions; Science Press: Beijing, China, 2006. [Google Scholar]
  16. Luo, Q.; Chen, S.; Wang, Y.; Li, M. Identification of rural development types and revitalization paths in poor mountainous areas: Taking Luanchuan County, Henan Province as an example. Prog. Geogr. 2022, 41, 1783–1794. [Google Scholar] [CrossRef]
  17. Sikorski, D.; Latocha-Wites, A.; Tomczak, P.; Szmytkie, R.; Miodońska, P.; Kajdanek, K. Changes in the services of general interest in mountainous areas in Poland over the period 1988–2020: Their types, dynamics and driving forces. Morav. Geogr. Rep. 2023, 31, 39–49. [Google Scholar] [CrossRef]
  18. Sun, L.; Ming, Q. Spatial distribution characteristics of tourism facilities and analysis of spatial dislocation with tourism resources. Resour. Dev. Mark. 2024, 40, 605–613. [Google Scholar] [CrossRef]
  19. Gao, Z.; Zhuo, M.; Zhang, Y.; Song, Z. Regional division of spatial synergy between ecological tourism resources and infrastructures on the Qinghai-Tibet Plateau. J. Arid Land Resour. Environ. 2024, 38, 172–181. [Google Scholar] [CrossRef]
  20. Wen, M.; Zhang, Y.; Chen, N.; Chen, Z. Geographic portrait of urban tourism attractions based on hybrid theme semantic feature extraction. Geogr. Geo-Inf. Sci. 2022, 38, 1–8+51. [Google Scholar] [CrossRef]
  21. Yao, S.; Wang, Z.; Diao, X.; Ma, X.; Huang, L.; Wang, Y. Study on the basic characteristics and tourism development strategy of traditional villages in Hebei Province. Constr. Econ. 2022, 43, 508–515. [Google Scholar] [CrossRef]
  22. Luo, Q.; Rong, J.; Zhou, J.; Ma, J. Assessing social values of ecosystem services and exploring the influencing factors for urban green spaces from the perspective of tourist perceptions. Chin. Landsc. Archit. 2024, 40, 50–56. [Google Scholar] [CrossRef]
  23. Quintal, V.; Sung, B.; Liu, M.T.; Van Duong, C. Hitting it out of the park with park personality: Scale development and validation. J. Destin. Mark. Manag. 2024, 31, 100869. [Google Scholar] [CrossRef]
  24. Fan, X.; Cheng, Y. Assessing a Tourism City from an Ecosystem Services Perspective: The Evaluation of Tourism Service in Liyang, China. Land 2023, 12, 2019. [Google Scholar] [CrossRef]
  25. González-Quiroz, P.; Gómez-Maury, O.D. Around the dialectic tourism and heritage. Manifestations and materializations of tourist practices (1960–2019) in the town of San Pedro de Atacama and its surroundings. Rev. De Geogr. Norte Gd. 2024, 87. [Google Scholar]
  26. Minhyeok, K. The Literary Museum as a Tourist Resource-Introducing the Tourism Programs of Dazai Museum, “Shoyokan” and Cooperation with Local Tourism in Aomori Prefecture. J. Jpn. Cult. 2022, 93, 175–192. [Google Scholar] [CrossRef]
  27. Campos, C.; Dias, A.C.; Quinteiro, P.; Gutiérrez, D.; Villanueva-Rey, P.; Gallego, M.; Oliveira, S.; Laso, J.; Albertí, J.; Bala, A.; et al. Assessing the environmental impacts of three different types of accommodations in Portugal and Spain by using an LCA approach. Sci. Total Environ. 2024, 927, 172230. [Google Scholar] [CrossRef] [PubMed]
  28. Hardianto, W.T.; Sumartono, M.M.; Muluk, K.; Wijaya, F. PentaHelix synergy on tourism development in Batu, East Java. Int. J. Innov. Creat. Chang. 2019, 10, 137–149. [Google Scholar]
  29. Zhang, J.; Xiong, K.; Liu, Z.; He, L.; Zhang, N.; Gu, X.; Chen, D. Exploring the synergy between Karst World Heritage site’s OUV conservation and buffer zone’s tourism industry development: A case study of the Libo-Huanjiang Karst. Herit. Sci. 2023, 11, 202. [Google Scholar] [CrossRef]
  30. Wang, H.; Yuan, J.; Meng, X. Spatial distribution and its influencing factors of level-A scenic spots in northeast China. Sci. Geogr. Sin. 2017, 37, 895–903. [Google Scholar] [CrossRef]
  31. Li, P.; Wang, Y.; Yu, H.; Wu, W.; Ma, N. Study on method of tourism spatial planning based on GIS Grid Analysis—An example of Qingdao. J. Nat. Resour. 2018, 33, 813–827. [Google Scholar] [CrossRef]
  32. Yang, L. Multicriteria Recommendation Method of Tourist Routes Based on Tourist Clustering. Mob. Inf. Syst. 2022, 9168899. [Google Scholar] [CrossRef]
  33. Li, P.; Yu, H.; Li, R.; Wang, Y.; Ma, N. Gridding framework and spatial analysis method of tourism resources: A case study of Qingdao city. Areal Res. Dev. 2022, 41, 104–109+121. [Google Scholar] [CrossRef]
  34. Zajadacz, A. Accessibility of tourism space from a geographical perspective. Turyzm 2014, 24, 45–50. [Google Scholar] [CrossRef]
  35. Pan, S.; Cong, Y. Spatial accessibility of scenic spot at 4A level and above in China. Sci. Geogr. Sin. 2012, 32, 1321–1327. [Google Scholar] [CrossRef]
  36. Zhang, T. The Construction of Multi-Scale Tourism Resources Knowledge Graph; University of Chinese Academy of Sciences (Institute of Geographic Sciences and Natural Resources Research): Beijing, China, 2021. [Google Scholar]
  37. Feng, X. Multiplant Location Involving Resource Allocation. Geogr. Anal. 2024, 56, 97–117. [Google Scholar] [CrossRef]
  38. Chen, J.; Zhu, W.; Wang, X.; Zhao, Z. A review of spatial index and its application in GIS. Geogr. Geo-Inf. Sci. 2024, 40, 1–10. [Google Scholar] [CrossRef]
  39. Albaladejo, I.P.; González-Martínez, M.I.; Martínez-García, M.P. A double life cycle in tourism arrivals to Spain: Unit root tests with gradual change analysis. J. Destin. Mark. Manag. 2020, 18, 100497. [Google Scholar] [CrossRef]
  40. Tan, T.; Chen, Z.; Zha, J.; He, L.; Li, X. Tourism productivity: Is there any spatial correlation among various regions? The case of China from a network analysis perspective. J. Hosp. Tour. Manag. 2024, 58, 256–268. [Google Scholar] [CrossRef]
  41. Anselin, L. Local indicators of spatial association—LISA. Geogr. Anal. 1995, 27, 93–115. [Google Scholar] [CrossRef]
  42. Xu, D.; Huang, Z.; Huang, R. The spatial effects of haze on tourism flows of Chinese cities: Empirical research based on the spatial panel econometric model. Acta Geogr. Sin. 2019, 74, 814–830. [Google Scholar] [CrossRef]
  43. Leslie, T.F.; Kronenfeld, B.J. The Colocation Quotient: A New Measure of Spatial Association Between Categorical Subsets of Points. Geogr. Anal. 2011, 43, 306–326. [Google Scholar] [CrossRef]
  44. Cromley, R.G.; Hanink, D.M.; Bentley, G.C. Geographically weighted colocation quotients: Specification and application. Prof. Geogr. 2014, 66, 138–148. [Google Scholar] [CrossRef]
  45. Chen, Y.; Xu, C.; Ge, Y.; Zhang, X.; Zhou, Y.N. A 100-m gridded population dataset of China’s seventh census using ensemble learning and geospatial big data. Earth Syst. Sci. Data Discuss. 2024, 2024, 1–19. [Google Scholar] [CrossRef]
  46. Zhang, T.; Wang, Y.; Zhang, S.; Wang, Y.; Yu, H.; Wang, K. Extracting the spatial boundary of tourism resource aggregation in Hainan Island based on the Voronoi model. Acta Geogr. Sin. 2021, 76, 1553–1569. [Google Scholar] [CrossRef]
  47. Cheng, W.; Zhou, C.; Li, B.; Shen, Y. Geomorphological regionalization theory system and division methodology of China. Acta Geogr. Sin. 2019, 74, 839–856. [Google Scholar] [CrossRef]
  48. Cui, G.; Wei, Q.; Liu, K.; Zhai, G. Regional Analysis and Regional Planning, 3rd ed.; Higher Education Press: Beijing, China, 2018. [Google Scholar]
  49. Lei, J.; Chen, Y.; Li, L.; Chen, Z.; Chen, X.; Wu, T.; Li, Y. Spatiotemporal change of habitat quality in Hainan Island of China based on changes in land use. Ecol. Indic. 2022, 145, 109707. [Google Scholar] [CrossRef]
  50. Su, J.; Rui, H.; Zhu, Q.; Zhang, W.; Zhang, W.; Wu, Q.; Li, S.; Liu, G.; Zhu, L. Temporal and spatial evolution of habitat quality and its topographic effect in Xinzhou City based on Invest Model from 1985 to 2020. J. Ecol. Rural Environ. 2023, 39, 1525–1533. [Google Scholar] [CrossRef]
  51. Zhang, P.; Zhang, L.; Han, D.; Wang, T.; Zhu, H.; Chen, Y. Coupled and coordinated development of the tourism industry and urbanization in marginal and less developed regions—Taking the mountainous border areas of Western Yunnan as a case study. Land 2023, 12, 640. [Google Scholar] [CrossRef]
  52. Río-Rama, M.; Maldonado-Erazo, C.; Durán-Sánchez, A.; Álvarez-García, J. Mountain tourism research. A review. Eur. J. Tour. Res. 2019, 22, 130–150. [Google Scholar] [CrossRef]
  53. Zhang, T.; Zhou, T.; Liao, H.; Zhu, L.; Li, D.; Cai, Z. Study on the Measurement and path of resilience of rural social ecosystems in Chongqing. J. Southwest Univ. (Nat. Sci. Ed.) 2022, 44, 2–12. [Google Scholar] [CrossRef]
  54. Jing, B. Research on Evolution Pattern and Spatial Management and Control of Man-Land System in Qinba Mountainous Area; Northwest University: Xi’an, China, 2022. [Google Scholar]
  55. Holz, C.A. Economic Development in West Sichuan: The Case of Daocheng County. China Q. 2024, 257, 119–135. [Google Scholar] [CrossRef]
  56. Zhao, W.; Li, Y.; Wang, Q. Evolutionary characteristics of sloping cultivated land under functional diversification in mountain areas: A case of Fengjie County, China. Glob. Ecol. Conserv. 2024, 50, e02854. [Google Scholar] [CrossRef]
  57. Sikorski, D.; Latocha, A.; Szmytkie, R.; Kajdanek, K.; Miodońska, P.; Tomczak, P. Functional changes in peripheral mountainous areas in east central Europe between 2004 and 2016 as an aspect of rural revival? Kłodzko County case study. Appl. Geogr. 2020, 122, 102223. [Google Scholar] [CrossRef]
  58. Yang, X.; Yu, H.; Yin, C.; Ji, S.; Zhu, Y. The conflict and coordination mechanism of stakeholder’s cognition on multifunctional spaces in rural tourism destinations: A case study of Shancha Village in Huangshan Scenic Area. Acta Geogr. Sin. 2023, 78, 1530–1552. [Google Scholar] [CrossRef]
  59. Sofield, T.; Bauer, J.; De Lacy, T.; Lipman, G.; Daugherty, S. Sustainable Tourism- Eliminating Poverty (ST-EP); CRC for Sustainable Tourism Pty Ltd.: Gold Coast, Australia, 2004; Volume 76, pp. 1–10. [Google Scholar]
  60. Rypl, J.; Havlíček, M.; Dostál, I. Geotourism potential assessment: A case study of the Czech-Austrian cross-border area. Geoheritage 2021, 13, 1. [Google Scholar] [CrossRef]
  61. Wu, Y.; He, F.; Wang, Y.; Shi, F. Analysis on the measurement and influencing factors of tourism eco-efficiency in five provinces (regions) of western China under the background of cryosphere environment. J. Glaciol. Geocryol. 2024, 46, 325–334. [Google Scholar] [CrossRef]
  62. Karshievna, U.D.; Khujakulovich, K.B. Assessment of the synergy effect in tourism. Am. J. Manag. Econ. Innov. 2022, 4, 19–25. [Google Scholar] [CrossRef]
  63. Jia, Y.; Hu, J.; Xie, S.; Qiao, H.; Liu, D. Vulnerability and influence mechanisms of social-ecological system in poor mountainous tourism destinations. Hum. Geogr. 2021, 36, 155–164. [Google Scholar] [CrossRef]
Figure 1. Framework of the study.
Land 13 00999 g001
Figure 2. Study site.
Land 13 00999 g002
Figure 3. Multidimensional spatial synergy methodology.
Land 13 00999 g003
Figure 4. Distribution pattern of tourism resources in Qimen.
Land 13 00999 g004
Figure 5. Gridding of tourism service facilities in Qimen.
Land 13 00999 g005
Figure 7. Spatial synergistic level between tourism resources and tourism service facilities.
Land 13 00999 g007
Figure 8. Spatial synergy of tourism resources and tourism service facilities in different altitude areas.
Land 13 00999 g008
Figure 9. Spatial synergy of tourism resources and tourism service facilities in densely populated areas.
Land 13 00999 g009
Table 1. The time cost of various grades of transportation routes.
Grade of RoadSpeed (km/h)ReferencesTime Cost (h)References
National Highway70[35]0.86Highway Engineering Technical Standards (JTGB01-2014)
Provincial Highway501.2
County Road302
Township Road203
Urban Road252.4
Water Area106
Table 2. The interpretation of the formulae.
FormulaElementInterpretationNotes
B M o r a n s I B M o r a n s I autocorrelation coefficient-
n total number of grid cells
w i j spatial weight matrix
x i and y i values of the variable x in grid cell i and the variable y in grid cell j , with S 2 denoting the variance of all samples
I i I i autocorrelation relationship of grid cell i Z-Score standardization is applied to eliminate the dimensional influence during LISA analysis
z i and z j variance-standardized values of grid cells i and j
G C L Q G C L Q I J degree to which type I points attract type J points G C L Q I J > 1, relatively strong spatial synergy between the two;
G C L Q I J < 1, poor synergy;
G C L Q I J = 1, a random distribution
N I number of tourism service facilities
N J number of tourism resources
N total number of the two
N I J number of tourism service facilities with tourism resources as their nearest neighbors
L C L Q L C L Q I m J degree to which point I m attracts point J -
N I m J weighted average of tourism service facility points closest to the m th tourism resource point-
f m n a binary variable indicating whether n is labeled as a tourism service facility point1 denotes yes, 0 denotes no
w m n weight of point n , elucidating its importance to the m th tourism resource point-
d m n distance between the m th tourism resource point and point n -
d m b bandwidth distance near the m th tourism resource pointbandwidths for catering, accommodation, medical, and transportation facilities are set at 1 km, 1.5 km, 1 km, and 1.5 km, respectively
Table 3. Density of resource distribution areas.
PartitionCRRDPartitionCRRDPartitionCRRD
A1Mountainous area of Guniujiang0.94B4Northeast mountainous area0.79C6Area of Yanshan2.35
A2North of Rongkou2.16C1Western plain area1.21D1Southern mountainous area0.50
A3Anling Township area1.73C2Area of Daohu2.77D2Southeast hilly area0.89
B1Northwest hilly area1.02C3Pingli Township area2.21D3Area of Xinan River2.04
B2Shanli Township area2.57C4Area surrounding the county seat0.87
B3Likou Township area3.71C5County seat of Qimen4.12
Note: CR and RD refer to the corresponding region and resource density/km2, respectively.
Table 4. Synergistic level of tourism resources and tourism service facilities.
Global SynergyLocal Synergy
TypeSDPartitionSDPartitionSDPartitionSD
Resources and Transportation facility0.639C591%B245%C122%
Resources and Catering facility0.675B382%A344%B119%
Resources and Accommodation facility0.653C674%A138%B418%
Resources and Medical facility0.451A270%D334%D118%
C358%C430%
C252%D227%
Note: SD refers to the synergistic degree.
Table 5. Synergistic level of tourism resources and tourism service facilities in different altitude areas and densely populated areas.
Altitude AreasDensely Populated Areas
PartitionSDPartitionSDPartitionSDPartitionSD
Central and Eastern Plain (P–CE)87%Northern Mountains (M–N)32%High-intensive area of the county seat (HIA)92%Moderate-intensive area of Anling (MIA 1)40%
Western Plains (P–W)71%Northern Hills (H–N)19%Moderate-intensive area of Likou (MIA 3)75%Southern dispersed area (DA 3)34%
Southern Mountains (M–S)52%Southern hills (H–S)12%Moderate-intensive area of Pingli (MIA 4)63%Central dispersed area (DA 2)15%
Northern Plains (P–N)35% Moderate-intensive area of Shanli (MIA 2)49%Northern dispersed area (DA 1)11%
Note: SD refers to the synergistic degree.
Disclaimer/Publisher’s Note: The statements, opinions and data contained in all publications are solely those of the individual author(s) and contributor(s) and not of MDPI and/or the editor(s). MDPI and/or the editor(s) disclaim responsibility for any injury to people or property resulting from any ideas, methods, instructions or products referred to in the content.

