Abstract
With continued sea level rise and over-exploitation, saline water extends farther inland, causing changes in soil salinity and water quality and leading to permanent land salinization and ecosystem damage. Saltwater intrusion (SWI), causing numerous ecosystem problems and disasters, brings risk to urban ecosystems in coastal cities. Ecological risk, in the Greater Bay Area in China, should be assessed based on the effect of SWI status on ecosystem health. In this study, we built a new ecological risk-assessment model based on the geographic information system (GIS) technique and spatial data. At the conceptual level, four main stressors were identified based on literature reading and fieldwork. Four stress factors (SFs) were thoroughly investigated, namely, SF1: the intensity gradient immersed in saltwater; SF2: the mountain phreatic water supply; SF3: the salinity tolerance of urban greenbelt vegetation; and SF4: the supply capacity of irrigation water to suppress saline water. After a comprehensive evaluation using GIS and the analytic hierarchy process (AHP), we mapped and assessed the ecological risk level of the urban greenbelt for the SWI. Our results showed that the area of urban green space affected by the SWI was approximately 49.31 km2, almost 12.05%. Ecological risk was sorted into five ranks: (1) very low risk 47.53%, (2) low risk 26.29%, (3) medium risk 22.92%, (4) high risk 2.45%, and (5) very high risk (0.8%). The ecological infrastructure of sponges should include freshwater conservation in coastal cities, and more attention should be paid to fresh groundwater discharge from coastal ecosystems in Shenzhen.
1. Introduction
Over the past decades, many coastal cities have experienced increased saltwater intrusion (SWI), which is a serious threat to resident life and the socioeconomic system. Saline water can have cascading implications on groundwater-dependent ecosystems [1], coastal farmlands [2], ecosystem services, human health, and well-being [3]. Therefore, urban greenbelt ecosystem in coastal cities is a typical fragile ecological area [4]. As an important urban green infrastructure, it is necessary to conduct a comprehensive assessment of the level of ecosystem risk caused by SWI and propose effective coping strategies to mitigate its impacts, which will be crucial for the sustainability of the city.
With the acceleration of urbanization, many studies have considered the stressor caused by territory development such as urban land expansion, which is not limited to the research on the toxic effects of chemical pollutants [5]. Some ecological risks for individual organisms, populations, and communities have been paid more attention. For example, Kang [6] developed an interdisciplinary methodology, that combined the assessments of ecosystem service and ecosystem health into ecological risk assessment. Chen [7] indicated that although sea level rise (SLR) is only one factor in the transfer of salt to land, the future impacts of SLR could be considerable and may not be limited to coastal locations.
To date, more than 500 cities worldwide have reported SWI-induced salinization of groundwater, which might significantly hinder the sustainable development of the local economy [8]. In the USA, almost 250,000 coastal wells, and the majority of groundwater levels are below sea level [9]. Moreover, land reclamation may have served as a useful barrier against the invasion of seawater into inland groundwater systems before SWI [10]. Fresh groundwater discharge is insignificant for oceans but important for coastal ecosystems. Luijendijk [11] presented a spatially resolved global model of coastal groundwater discharge, and found that local coastal groundwater discharge can in many cases pose an equally high risk for coastal water quality and coastal ecosystems. SWI is a serious environmental problem in the Pearl River Estuary (PRE) of China, threatening the social–economic–natural complex ecosystems [12]. Specific topography, spring tidal variations, localized wind stresses, and their interactions can significantly affect the SWI.
Urban ecological risk (UER) is defined as adverse effects and the possibility of impacts on urban ecosystem services resulting from urbanization [13]. UER caused by rapid urbanization could lead to potential threats to the structures, patterns and services of urban ecosystems [14]. Liu [15] completed the urban ecological risk assessment of Lijiang City by using the spatial interaction model and other methods, which provided in-depth and comprehensive technical support for identifying potential ecological risks, safeguarding the ecological security of the subregion, and realizing sustainable development. The SWI will become more severe owing to SLR and increased freshwater extraction [16]. The sea level along the coast of China has risen at an increasing rate, with an estimated acceleration of 0.07 mm/a2 [4].
The effect of the SWI on urban ecosystems under climate change conditions is an increasing concern. However, many studies have assessed the risk of SLR using physically based methods, and in this study, we aimed to elucidate the ecological risk of SWI in greenbelt and urban ecosystems on the west coast of Shenzhen under the influence of SLR and anthropogenic activities. We first mapped the SWI-affected zone along the coastlines through a digital elevation model (DEM), and conducted spatial analysis using the geographic information system (GIS). Second, we analyzed vegetation types in different patches, combined the data of remote sensing and water chemistry, and finally discussed the relationships between anthropogenic activities and SWI on the west coast of Shenzhen.
In this paper, the ecological risk of SWI was conducted for the urban greenbelt on the west coast of Shenzhen, utilizing rich spatial data and a risk-assessment model. These results provide effective reference and decision-making support for the cultivation and management of coastal greenbelts.
2. Methodology and Methods
2.1. Study Area
The study area is located in western Shenzhen City on the east bank of the Pearl River Delta (PRD). Over the past four decades, Shenzhen has transformed from a small fishing village to a modern and international metropolis with the highest degrees of openness and the strongest economic vitality in China. It also holds a crucial strategic position in national economic development [17]. Consequently, urban structures and land-use types have changed, and urban water consumption has significantly increased.
Owing to the rapid population growth, the demand for urban land and water has sharply increased [10]. However, as the drinking water of Shenzhen’s tap water intake is in the upper reaches of the Dongjiang River, salty tides generally do not affect the city’s water supply, and there is no drinking water risk for people. The water supply is stable, safe, and reliable, and can meet the water needs of people and the economic development of this city. However, the urban greenbelts are threatened by SWI.
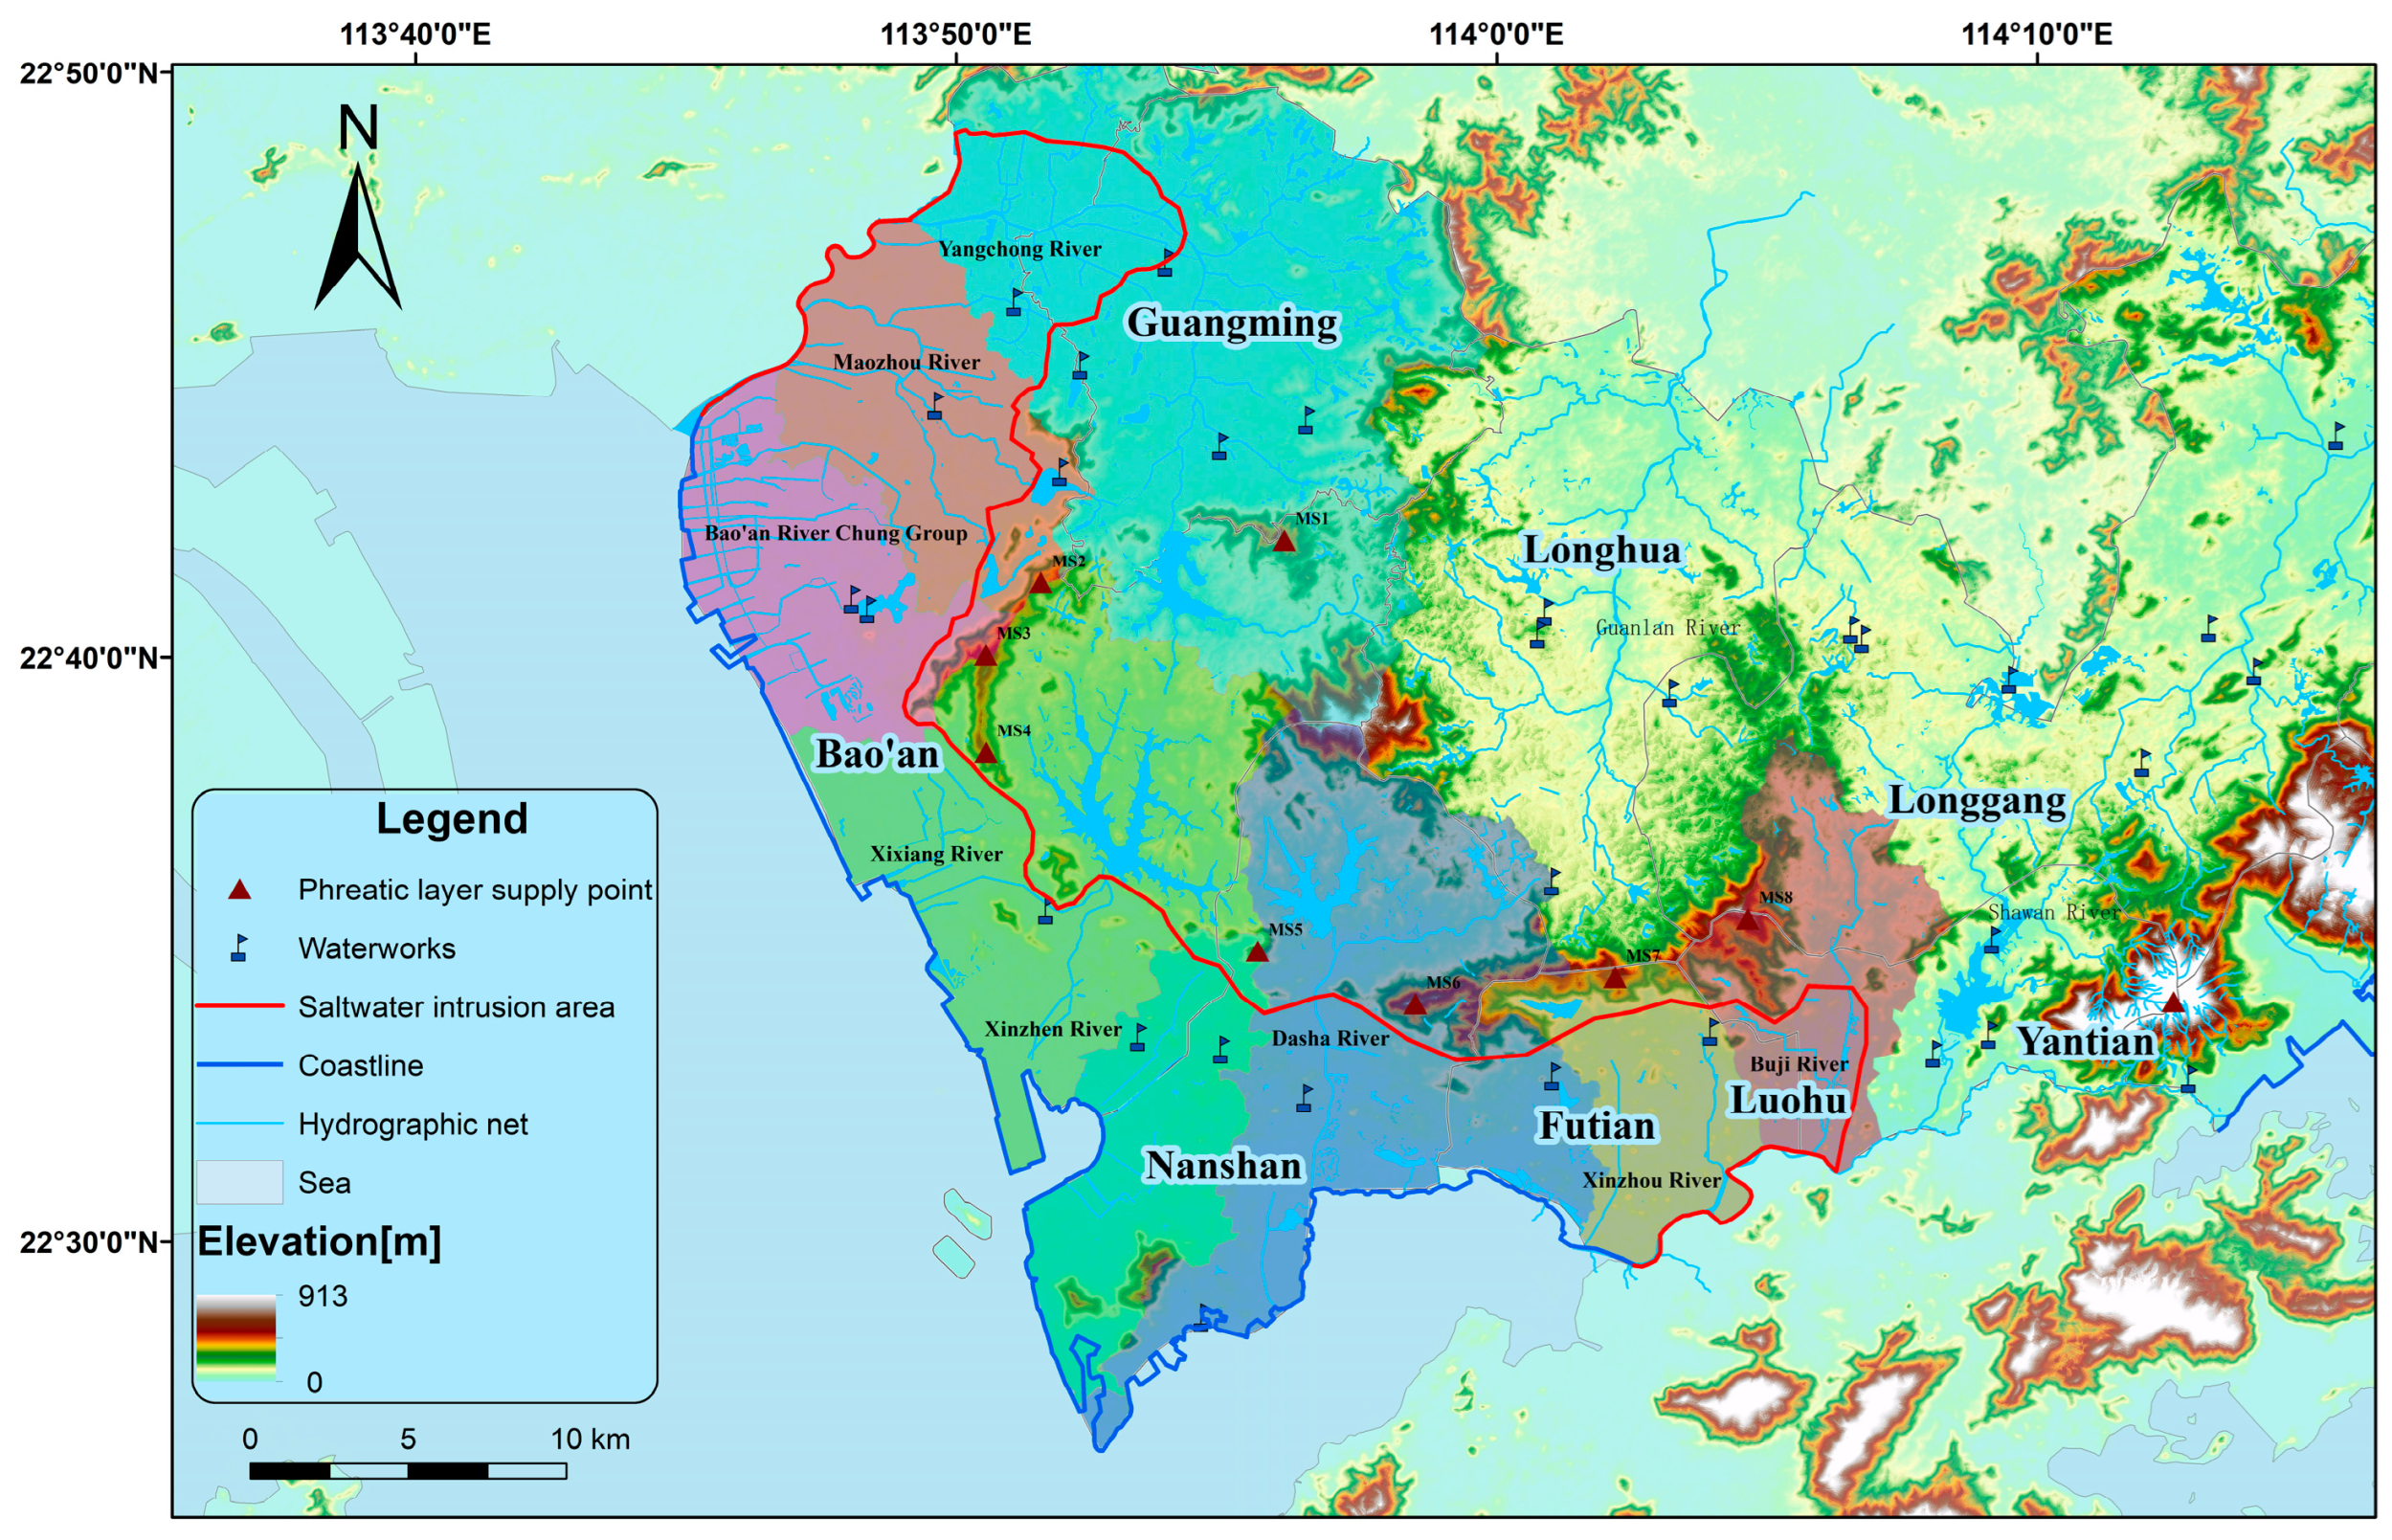
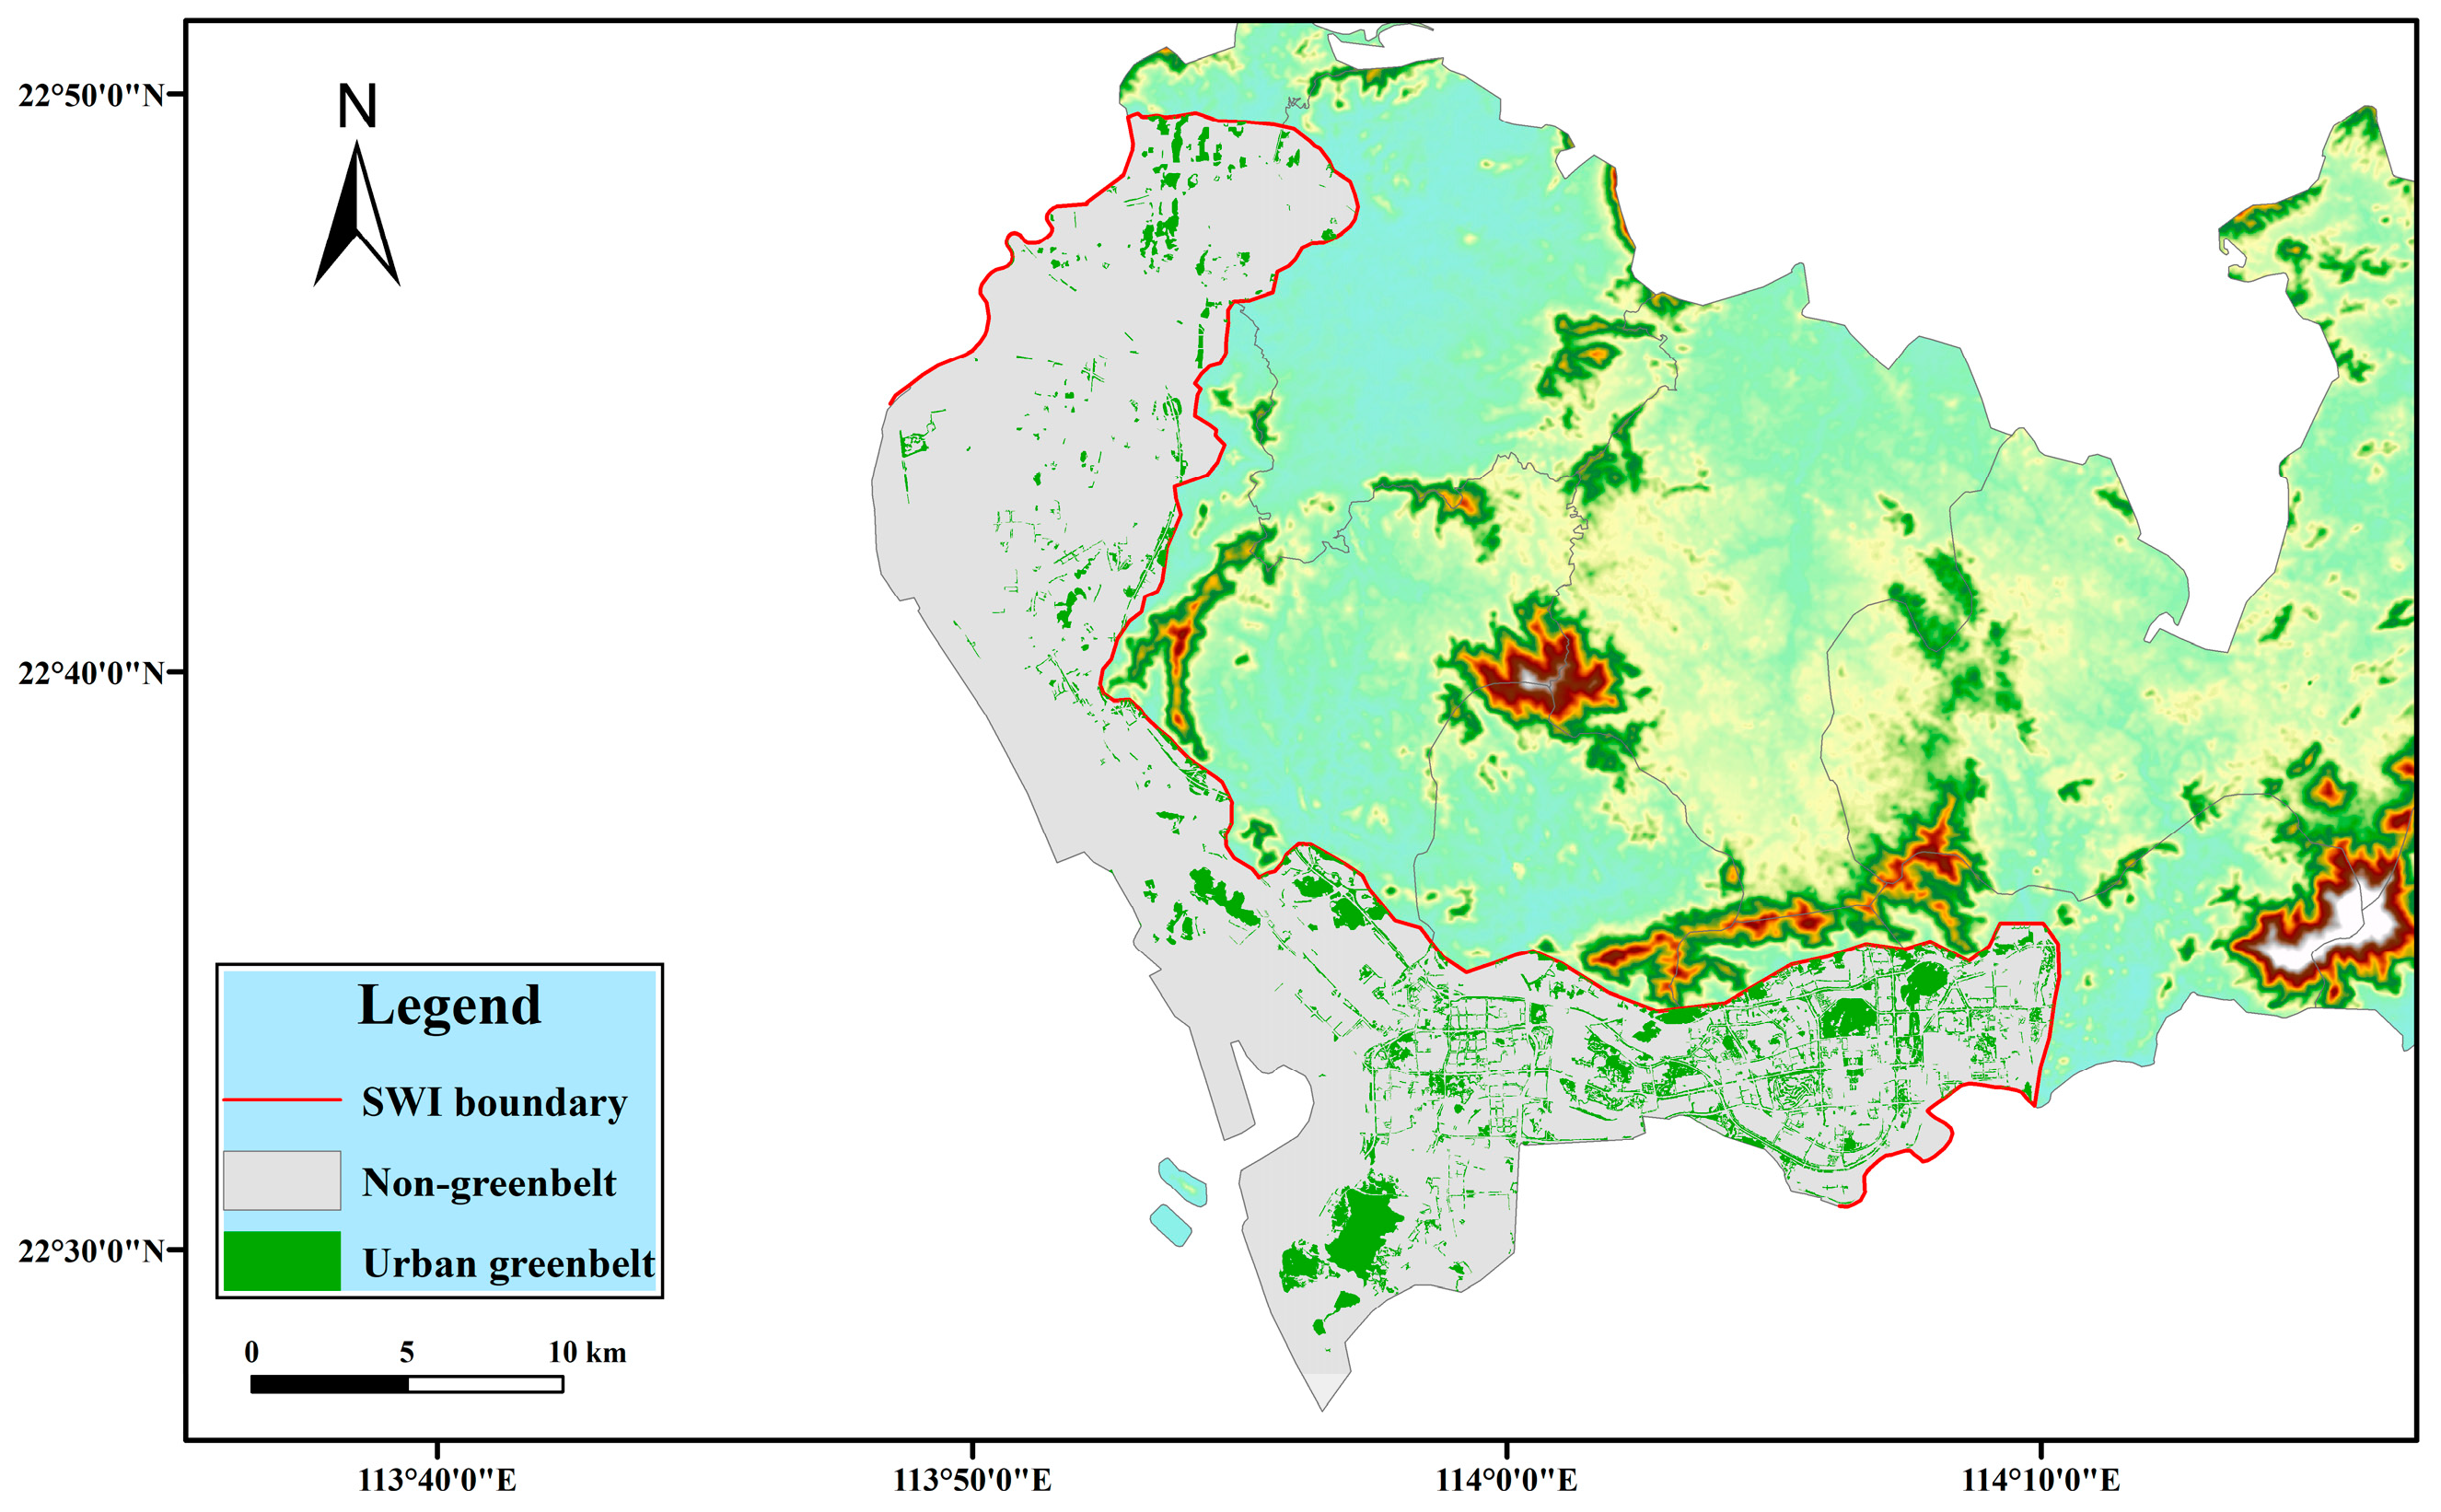
Local groundwater in the coastal aquifers of Shenzhen has been heavily pumped since the 1980s, coinciding with its rapid expansion from a fishing village to a modern city [18]. As a pilot demonstration zone, Shenzhen continues to be influenced by the progress of construction in the Greater Bay Area (GBA). The groundwater in this region has been overexploited but has since been effectively conserved. Therefore, the environmental protection and sustainable development of Shenzhen face severe challenges [19,20]. Using ASTER GDEM 30M digital elevation data, we delineated the western coastline (blue line) of Shenzhen as the starting point and extended the 20 m elevation contour inland to its termination (red line). Upon integrating the inland supply boundary of this region, we established the SWI-affected zone line [10]. Figure 1 shows the study area affected by the SWI in western Shenzhen. The different colored plots represent the eight watersheds involved in this study.
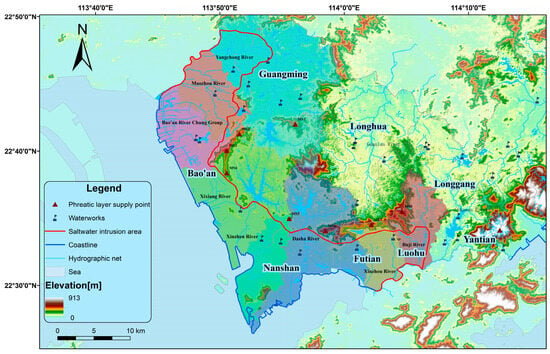
Figure 1.
Study area and SWI-affected regions in western Shenzhen City.
Among metropolitan cities with high population density, Shenzhen is affected by the typical shortages of green spaces and land resources [17]. Shenzhen has accelerated the construction of an innovation-demonstration zone under the national sustainable development agenda, implementing the strictest ecological environmental protection system, and creating a safe and efficient space for development, a comfortable and livable living space, an ecological space of clear waters, and a blue sky [20].
2.2. Processing Data Related to ERA
Ecological risk assessment (ERA) can be defined as the process that evaluates the likelihood that adverse ecological effects may occur or are occurring as a result of exposure to one or more stressors [21]. As one of the typical sources of ecological risk in seaside cities, SWI is an important reference value for its effective ERA. In this study, the data sources are shown in Table 1.

Table 1.
Data sources.
Through an analysis of the literature, we collected on-site data from the study area, mainly including urban greenbelt plant species in the study area and salt-tolerance evaluation. One source is the investigation conducted by Shenzhen Water Science and Technology Development Co., Ltd. (Shenzhen, China) in the Qianhai Shenzhen–Hong Kong Modern Service Industry Cooperation Zone [22]. Another source is a survey and salt damage analysis conducted by the Fairy Lake Botanical Garden of the Chinese Academy of Sciences in Shenzhen on coastal landscape plants in the city [23].
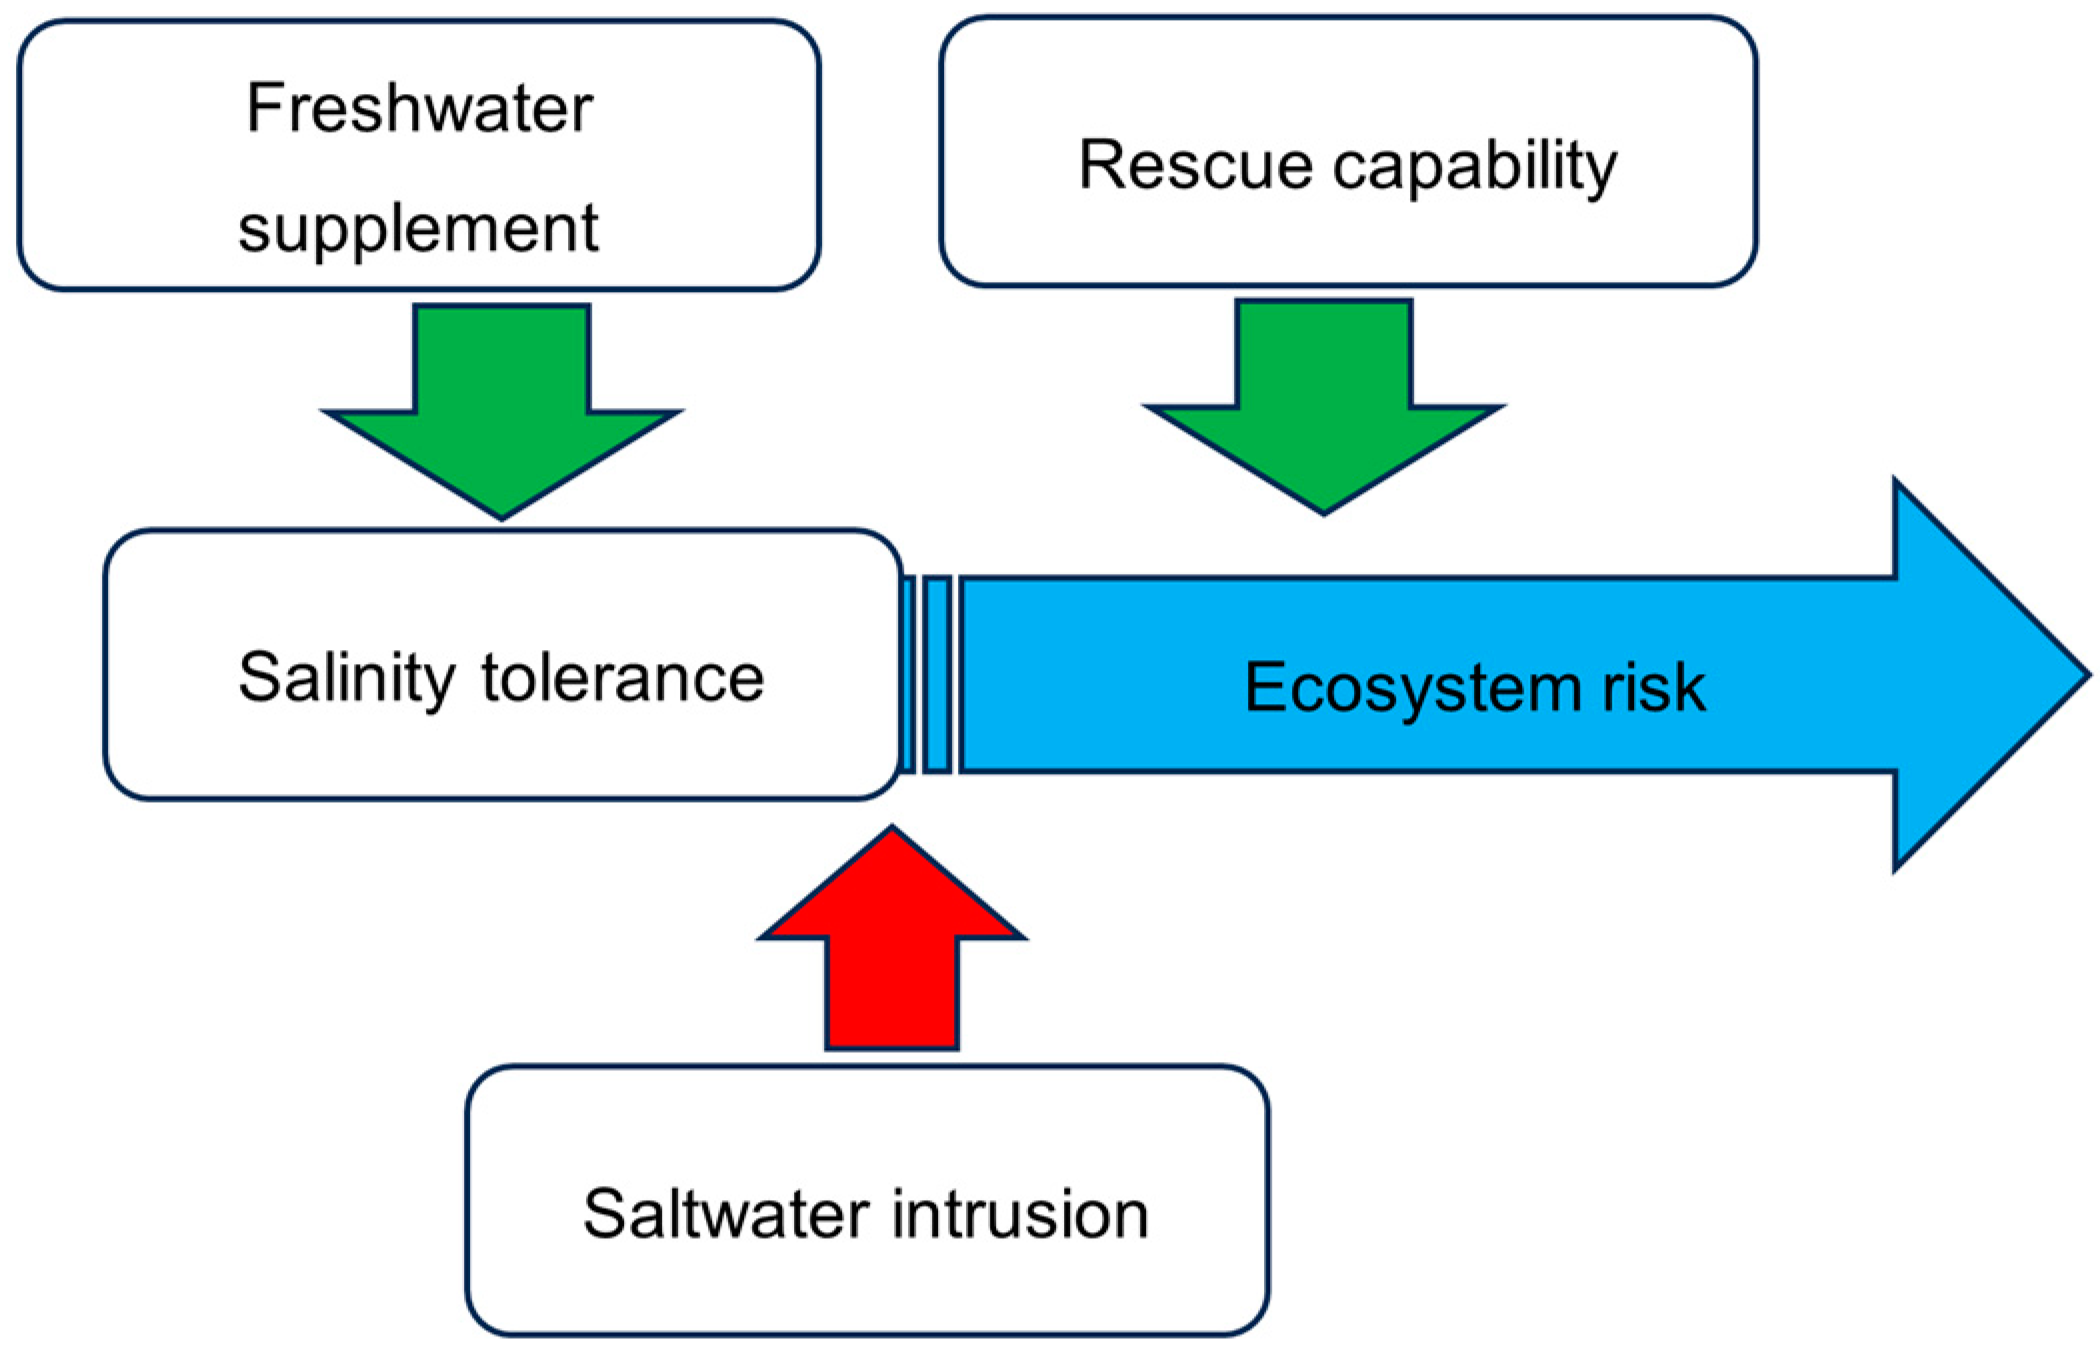
2.3. Concept Framework of Ecology Risk Assessment
After investigation, some stress factors were identified and selected. Finally, four stress factors (SFs) were thoroughly investigated. They are as follows: SF1: the intensity gradient immersed in saltwater; SF2: the mountain phreatic water supply; SF3: the salinity tolerance of urban greenbelt vegetation; and SF4: the supply capacity of irrigation water to suppress saline water. We created a new conceptual framework for assessing the urban greenbelt ecological risk from SWI. Within this framework, the salt tolerance of greenbelt vegetation is recognized as an intrinsic property. Furthermore, the freshwater supplement capacity from the mountain phreatic water supply and the emergency water supply capabilities for rescue operations in urban greenbelts are considered as positive regulatory factors. Conversely, the intrusion of saltwater upstream along rivers and onto both banks is identified as a negative influence. These elements together constitute a comprehensive conceptual model for evaluating the ecological risks assessment with SWI in urban greenbelts, as shown in Figure 2.

Figure 2.
The conceptual framework of the ecological risk of saltwater intrusion on an urban greenbelt.
Generally, it is formalized as follows:
The collapsing force is an important stress factor that results in saltwater pressure on urban ecosystems [24]. The extent and scope of SWI are represented by the index, which represents the intensity gradient immersed in saltwater, defined as SF1. The relieving force refers to hedging SF1 and relieving pressure from dangerous saltwater resources. Freshwater resources flow from the back mountain; therefore, the mountain phreatic water supply was the key factor, defined as SF2. The receptor accepts pressure from dangerous resources; plants, shrubs, and grasses should be salinity-tolerant; therefore, SF3 is the salinity tolerance of the urban greenbelt vegetation. Finally, disaster-prevention and -mitigation capabilities are crucial factors; therefore, SF4 is related to the reuse capacity, and the supplementation of freshwater to suppress saline water distance is a suitable parameter.
2.4. Analysis of the Geographical Mechanism of SWI
The seashore is the frontier line between land and sea; it mainly comprises intertidal and supratidal zones, and has unique land and sea properties. Synthesis studies and detailed simulations have predicted that SLR can harm coastal aquifers through SWI and/or inundation of coastal regions. As saline water migrates underground and enters fresh aquifers, groundwater is slowly and nearly irreversibly salinized [25,26]. As shown in Figure 3, seawater can intrude into fresh aquifers from the western and southern sea areas, whereas freshwater is recharged from the watershed, as represented by the red line on the eastern and northern boundaries of the study area. However, the rapid economic development of China’s coastal areas and the growth of industry and population have increasingly affected the environment of coastal waters through anthropogenic activities.
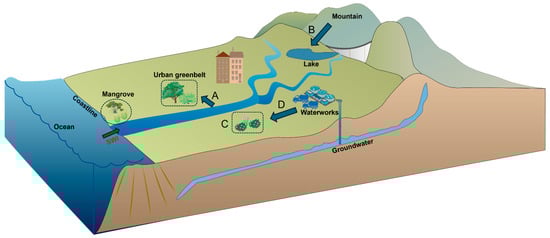
Figure 3.
The conceptual model used for simulating the impact on the greenbelt of SWI. A, B, C, and D represent the factors SF1, SF2, SF3, and SF4, respectively, affected on the urban greenbelt.
2.5. Mapping the SWI-Affected Zone
The low-elevation coastal zone comprises continental and island areas that are hydrologically connected to the sea, and are located no more than 10 m above the mean sea level. The buffer along the river extended 200 m offshore. More greenbelt patches were found within a distance of 200 m of the visible salt patch. Therefore, based on the results of Mondal et al., we divided the buffer zones as follows: 0–50 m, 50–100 m, 100–300 m, 300–500 m, and more than 500 m; subsequently, we conducted an ecological risk assessment of urban greenbelts for the buffer zones of the five different classes [2].
We used the “Multiple Ring Buffer” tool in ArcGIS 10.8 (version 10.8, ESRI, Redlands, CA, USA) to create multi-ring buffers of 50, 100, 300, and 500 m along the rivers’ estuaries within the study area, delineating the water system in the SWI-affected area on the west coast of Shenzhen. The Dongjiang River could not hold back the tide, and pollutants discharged from Dongguan were traced back to the Zhangcun area of Dongguan along with tidewater.
2.6. Exploring the Freshwater-Remediation Capacity from Mountain Phreatic Water
Fresh groundwater discharge is important for coastal ecosystems [27]. Scholars have explored how inland wetland-remediation techniques can be used to mitigate coastal wetland salinification by increasing freshwater delivery to targeted regions. The topographic gradient is an important factor in recharging freshwater as it sets a maximum for the hydraulic gradient in each watershed [11]. According to the different topographic gradients, we classified the ecological risk levels corresponding to them.
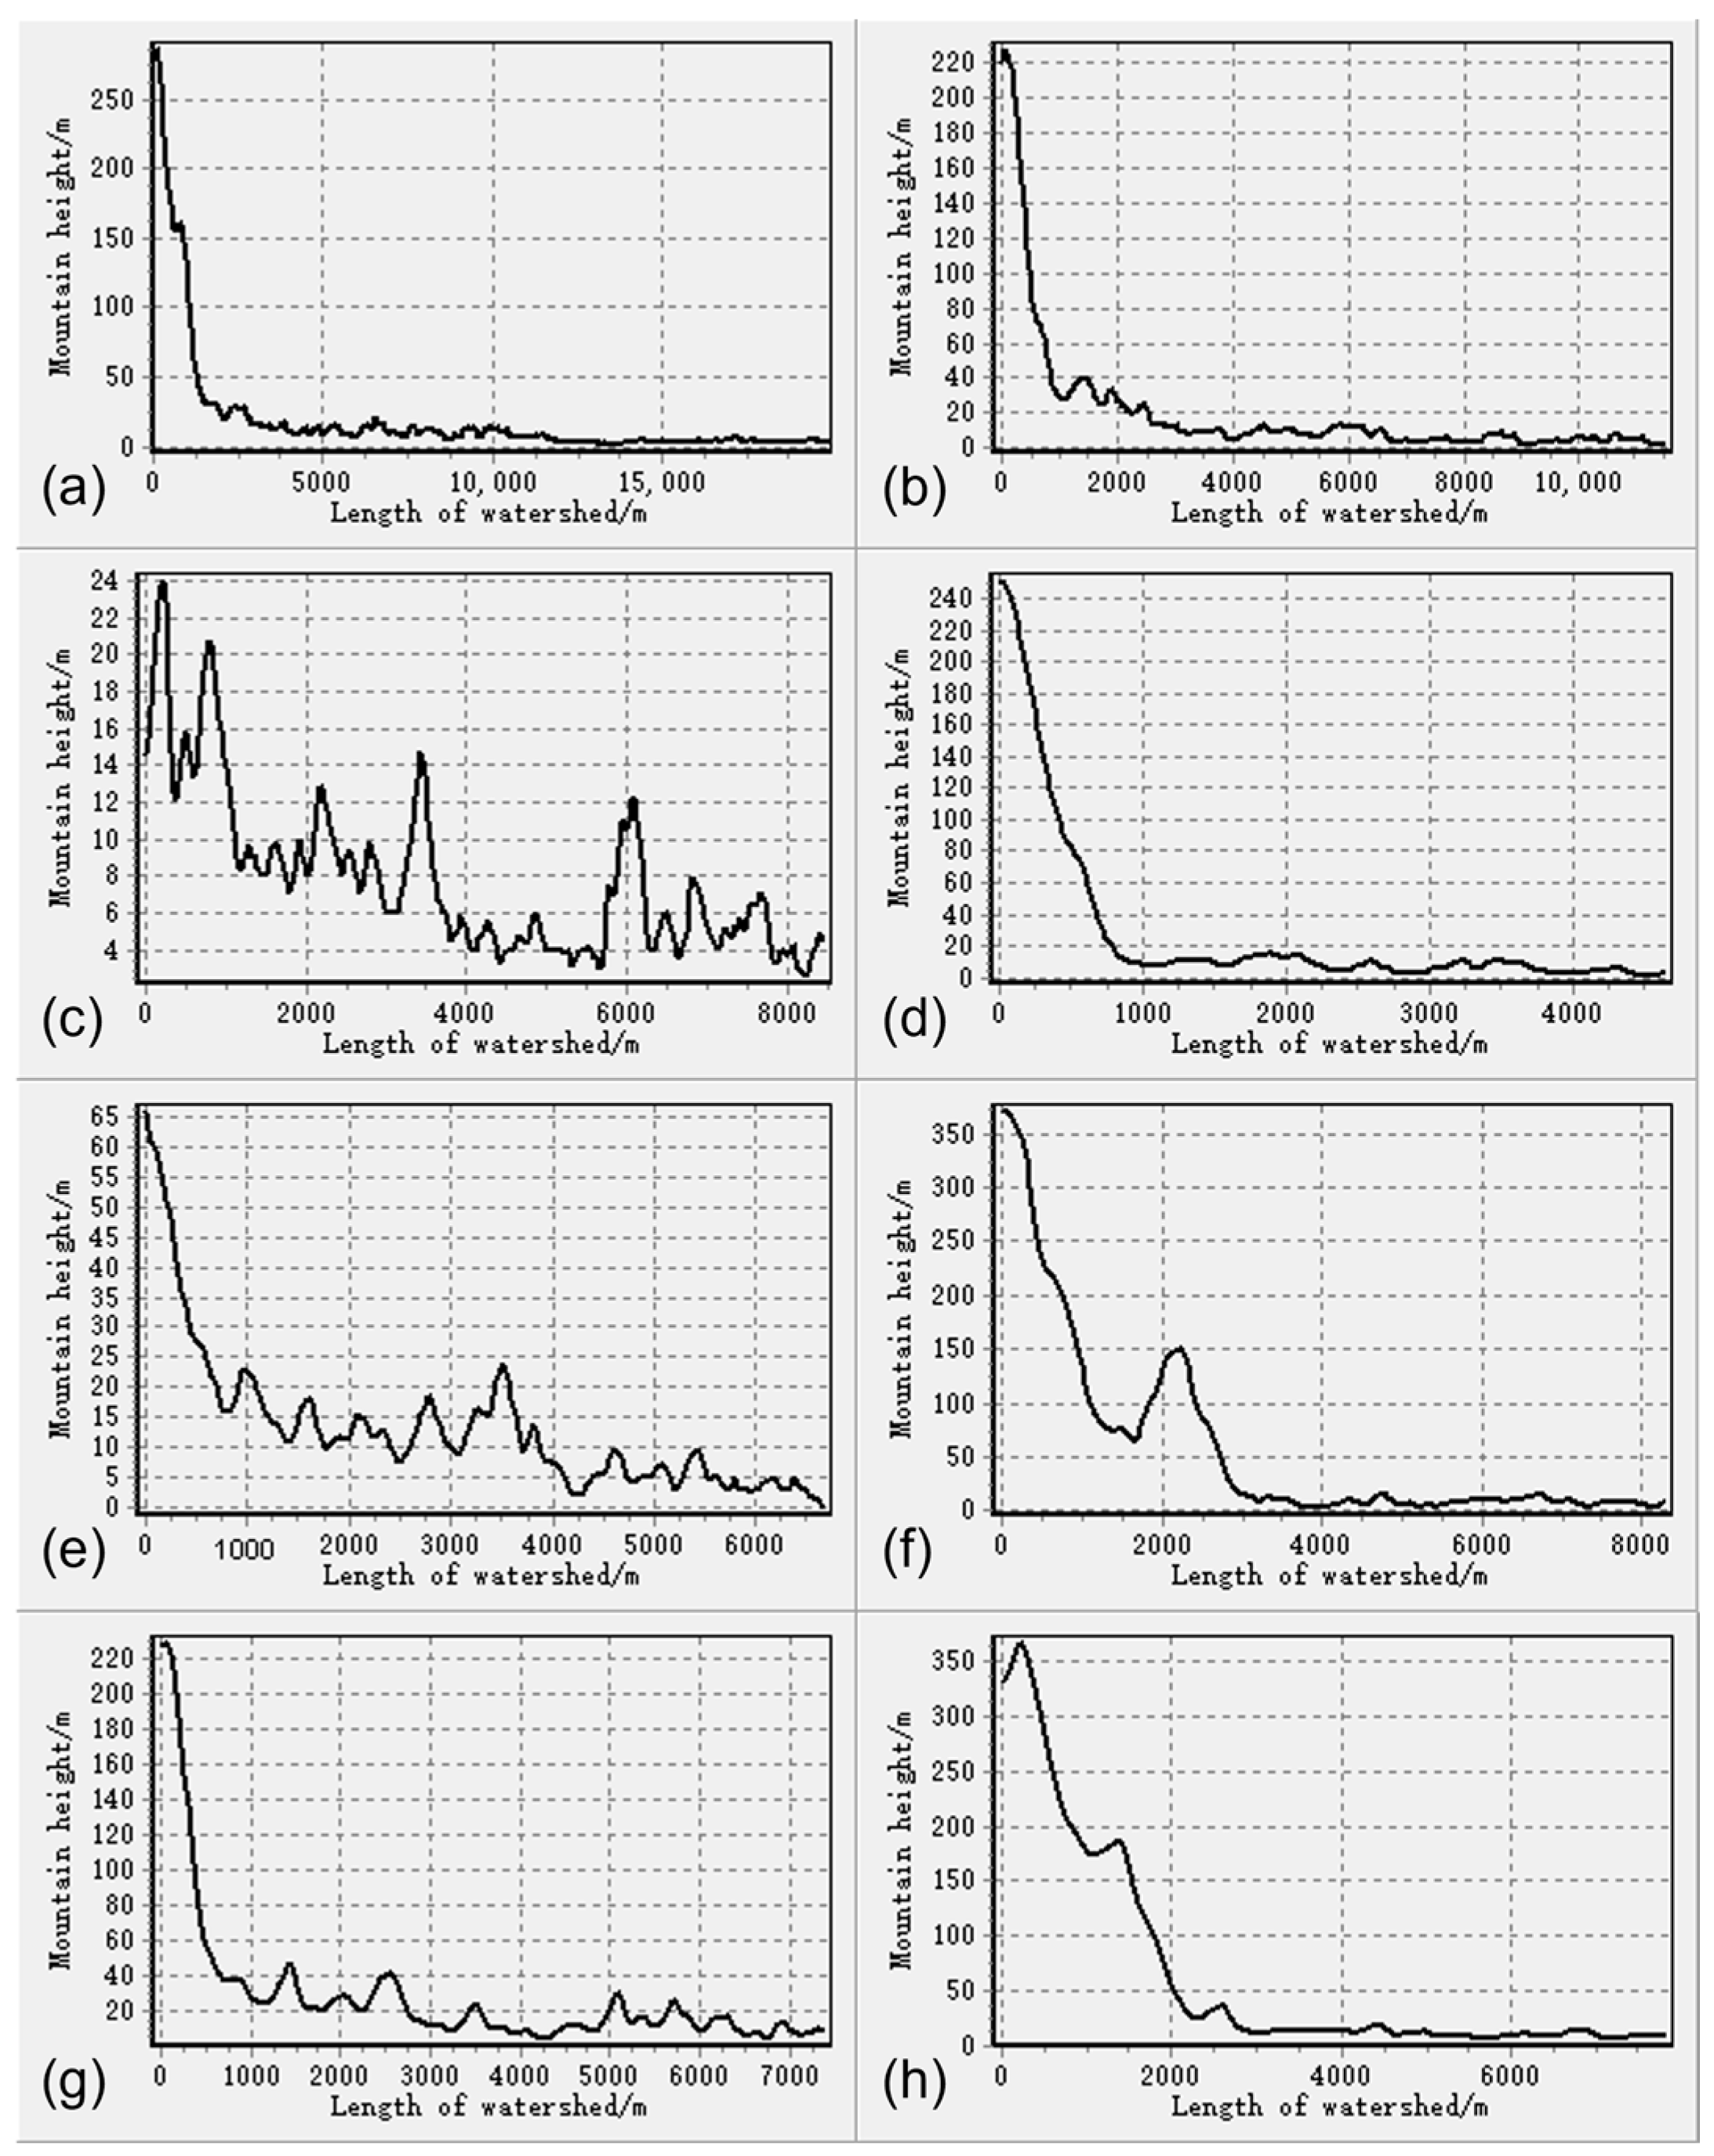
According to the DEM data, the “hydrological analysis” module was used to form the catchment area (watershed) in this region, and section-line analysis was conducted for each watershed to determine the replenishable gradient of different watersheds against the mountain, as can be seen in Figure 4, which shows in detail the basis for risk ranking for each watershed.
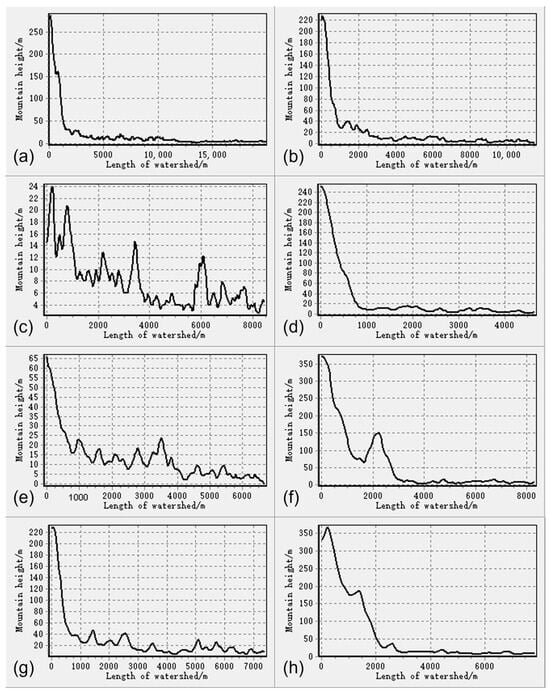
Figure 4.
Different watershed lengths and vertical heights of backed mountains. (a–h) The Yangchong River Basin, Maozhou River Basin, Bao’an River, Chung Group Basin, Xixiang River Basin, Xinzhen River Basin, Dasha River Basin, Xinzhou River Basin, and Buji River Basin.
Based on these results, we used the average topographic gradients in coastal watersheds as the best estimate in subsequent model experiments, and the average topographic gradient of streams as the lower bound for the uncertainty range of coastal groundwater discharge.
2.7. Rating the Salt Tolerance of Groundcover Plants
Dead trees underlain by wetland vegetation are a striking final indicator of uplands displaced by SLR and SWI. The species sensitivity distribution (SSD) is a statistical distribution model widely used for ecological risk assessments and water quality baselines. In China, the Research Center of Saline and Alkali Land of the State Forestry Administration contains a list of the salt tolerance of greening plants growing in saline-alkali areas in terms of the salt stress treatment mode and treatment time, plant salt-tolerance evaluation index, and data analysis [28]. The evaluation was plagued by a range of problems, including many indices, long periods, and diverse results. According to the salt-tolerance level, 343 species of common greening plants were classified, among which there were 80 species of especially strong salt-tolerant plants, 103 species of strong salt-tolerant plants, 93 species of moderate salt-tolerant plants, and 55 species of mild salt-tolerant plants. The number of salt-tolerant plants in the south was significantly higher than that in the north. In terms of the species and quantity of salt-tolerant plants, the quantity of shrubs was greater than that of trees, whereas salt-tolerant herbs were the least abundant.
In Table 2, the salt-tolerance classes of common greenfield plants in the study area are summarized. In this study, we summarized the application of saline-tolerant garden greening plants, discussed methods to solve the problems of salt-tolerance evaluation, identification, and practical application of garden plants in China, and discussed prospects for future research.
Table 2.
List of salt tolerance of groundcover plants.
According to the forest resource inventory data of forest subclasses, the saline-alkali tolerance grade was constructed by comparing the dominant tree species of different urban green spaces in the code table of forest subclasses. Their results showed the presence of 119 species and varieties of landscape plants in Shenzhen, accounting for 47 families and 98 genera. Among them, 36 species were injured, accounting for 30.3% of all landscape plants [23].
2.8. Estimating the Emergency-Response Capacity
Techniques primarily used to deliver freshwater to inland floodplains may reduce salinification in certain coastal wetlands. The coordinate-picker function provided by the AMAP® API was used to extract the geographic location information of the Shenzhen Waterworks; detailed geographic locations of the Shenzhen Water Treatment Works are shown in Table S1. The “Near Analysis” tool of ArcGIS was used to determine the distance value of the nearest waterworks of each urban green space.
Using the AMAP® AMAP-POI search, we identified 40 functioning waterworks in Shenzhen, China. Each urban greenbelt patch was assigned a risk rating to supplement freshwater and suppress saline water from the nearest waterworks.
2.9. Building the Comprehensive Evaluation Ecological Risk Model of SWI
The comprehensive evaluation method, namely, the analytic hierarchy process (AHP), was used to assess the ecological risk of urban greenbelts. The AHP is a comprehensive evaluation method, wherein qualitative and quantitative analyses are combined to obtain a scientific basis for selecting the best scheme through a multilevel analysis of a decomposed complex problem [29]. In this study, we constructed a comprehensive evaluation index system for the SWI using AHP. Four stressor factors were employed, in this study, to strengthen the state’s capacity for emergency rescue and relief work; all the factors were equally weighted.
To comprehensively analyze ecological sensitivity, the GIS spatial superposition analysis technique can be used to synthesize the spatial layers of each factor [30]. The specific equation is expressed as follows:
where ER is the ecological risk index, SFi is the ecological risk grade of factor i, and Wi is the ecological risk weight of factor i.
3. Results
3.1. Results of ERA from SWI
The results of the ecological risk assessment are presented in Table 3. We found that the mapping area of the SWI-affected zone was 409.2 km2, whereas the urban greenbelt area was 49.3 km2. Almost 16.4 km2 of urban greenbelt existed in the 300 m buffer zone of the salty tide invasion river, indicating that more than 30% of the urban greenbelt is at risk of saltwater immersion during the SWI period. Simultaneously, the key factor that can effectively counteract the risk of SWI—mountain phreatic water supply—exceeded 350 m in all basins, except in the Dasha River Basin and Buji River Basin. The other six basins were slightly less resilient to salt tide intrusion, although some of them did not have high mountains to provide effective water recharge.
Table 3.
Results of ecological risk assessment from SWI.
Based on the literature review and data collection, we found that in South China, coniferous mixed and mangrove forests have fairly high salt tolerance, followed by coniferous and broadleaved mixed forests and Casuarina equisetifolia [28]. However, in the study area, these species constituted only 1.4% of the total. In contrast, plants with a lower salt tolerance, such as broadleaved mixed forests and fruit trees, were widely distributed throughout the study area.
Using the AMAP® AMAP-POI search, we identified 40 functioning waterworks in Shenzhen, China. However, an urban greenbelt area of 12.2 km2 is present 3000 m away from the nearest waterworks. This implies that these green spaces are not only at greater risk during SWI but also incur higher transportation costs when irrigated.
3.2. Characteristics of the SWI-Affected Zone
The greenbelt area affected by SWI on the west coast of Shenzhen was 49.31 km2. As shown in Figure 5, the urban green spaces on the west coast of Shenzhen were primarily concentrated in the Nanshan and Futian districts, with fewer spaces in other areas. This indicates that these two districts have more abundant green spaces, provide better recreational areas, enhance residents’ quality of life, increase biodiversity, and alleviate air pollution. However, during SWI events, salt-tolerant plants can effectively absorb and resist the erosion caused by salt ions, preventing direct damage to the soil, buildings, and other structures. Therefore, to address SWI, the selection and spatial distribution of tree and forest species must be optimized to fully leverage the natural defense mechanisms of urban green spaces against ecological risks.
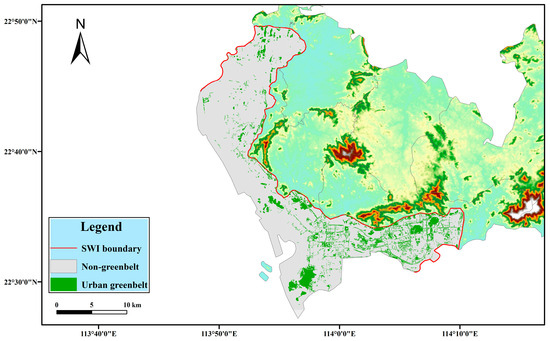
Figure 5.
Urban greenbelt distribution zone affected by SWI.
In areas affected by the SWI, degraded water quality directly affects recreational water use in cities. In this study, seashores with a high risk of SWI and greenbelt plant species with high ecological risk in Shenzhen were preliminarily identified and screened, respectively. These research findings can serve as a basis for formulating water quality standards for salinity gradients and protecting green spaces in the PRE. To mitigate SWI in the PRE and reduce ecological risks for greenbelt organisms, the oversight and control of wastewater sources in coastal rivers must be strengthened.
3.3. Difference between the Four Factors of SWI
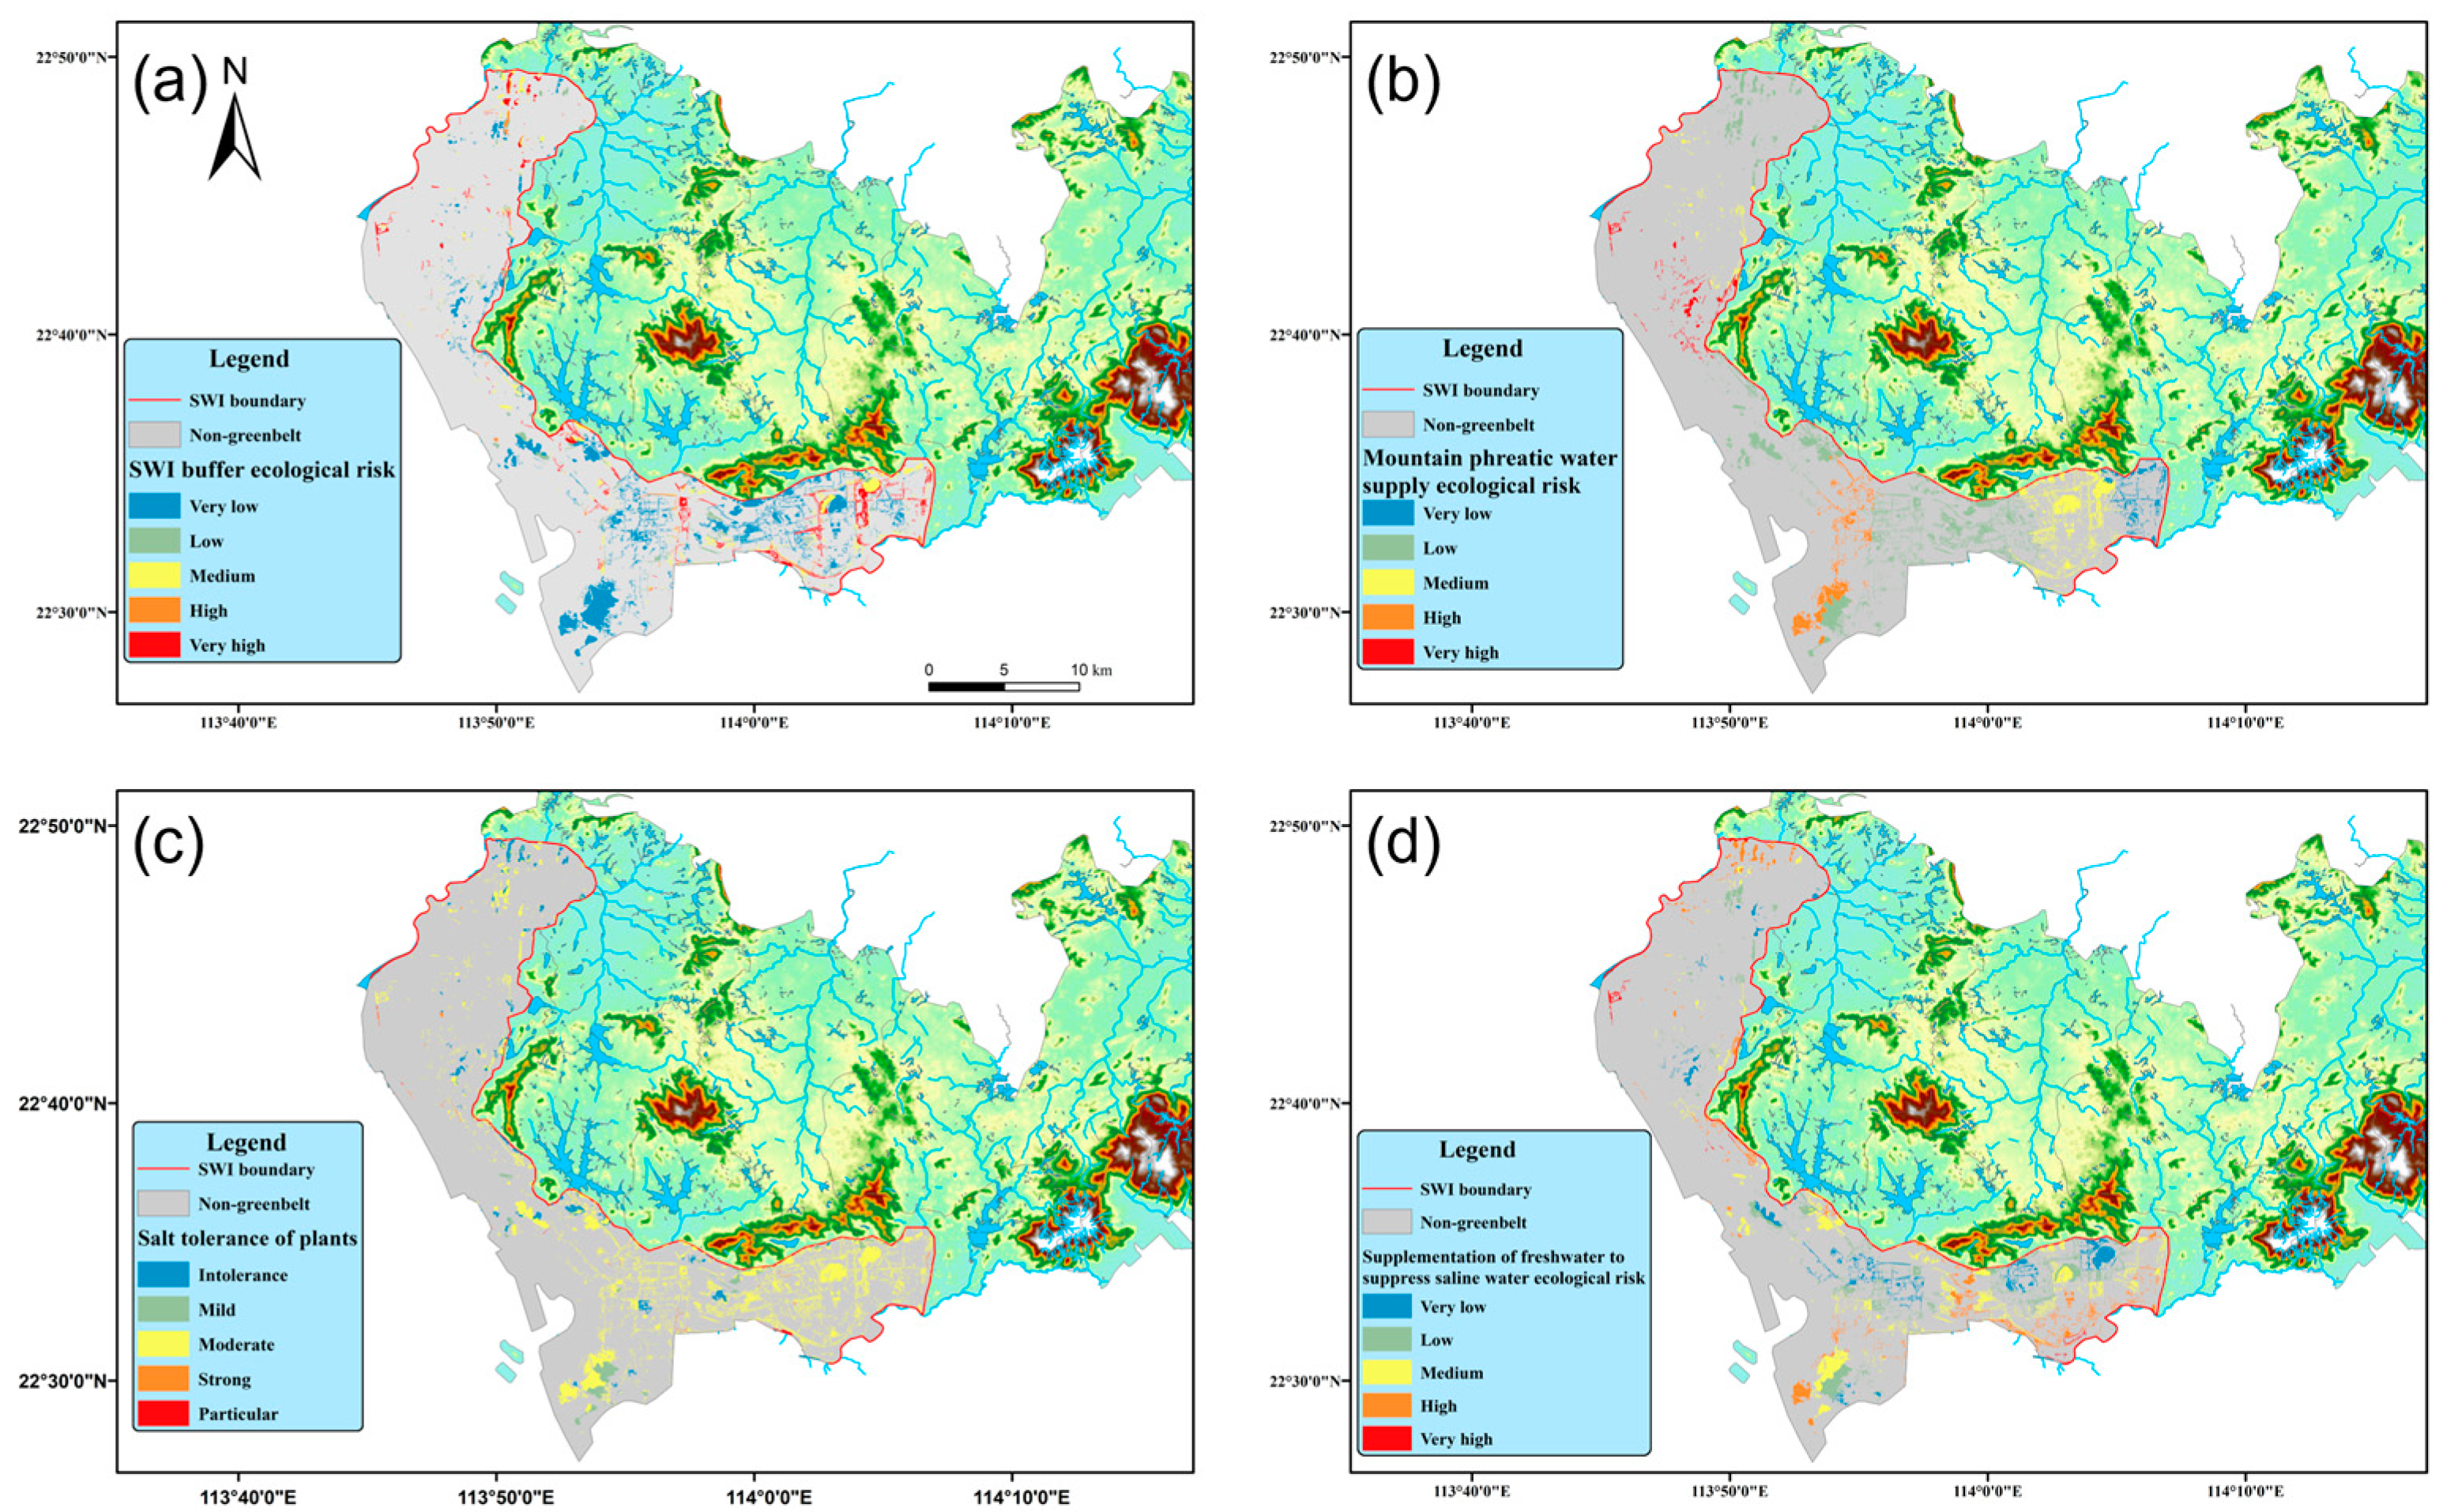
The results of the ERA for the four factors are shown in Figure 6. Figure 6a shows that in most areas of Futian and northern Bao’an districts, green areas are situated close to the river outlet and may be significantly and persistently affected by SWI. Figure 6b illustrates the differences in the recharge capacity of the phreatic zone in various watersheds backed by mountains. The Buji and Dasha River watersheds, backed by the Hongling and Tanglang Mountains, respectively, exhibit a greater vertical drop, providing abundant recharge to the submersible layers of the rivers.
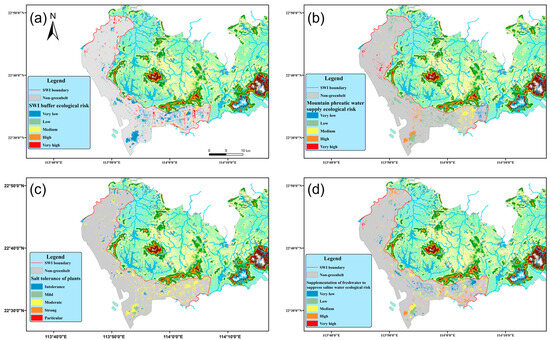
Figure 6.
Four factors of SWI. (a) SF1: SWI buffer ecological risk; (b) SF2: mountain phreatic water supply; (c) SF3: urban greenbelt vegetation salinity-tolerance level; (d) SF4: supplementation of freshwater to suppress saline water distance.
Figure 6c depicts the distribution map of salt tolerance among urban green vegetation within the study area. Among the major greenbelt types, the broadleaved mixed forest covers an area of 30.95 km2, indicating that the majority of greenbelts possess a moderate capacity to withstand ecological risks associated with SWI.
Figure 6d shows the capacity of the region to address the ecological issue of salt tide intrusion. Only a small portion of the area is more than 5000 m away from the waterworks, which is fortunate. However, irrigation of this part of the green space should be considered in future urban planning.
A group of plants can maintain normal growth in soil with salt patches, such as Nerium oleander, Acacia mangium, Ficus microcarpa, Hibiscus tiliaceus, Syngonium podophyllum ‘Albovirens’, Alpinia zerumbet ‘Variegata’, and Iris tectorum.
3.4. Evaluation Result of the Urban Greenbelt Regarding the Ecological Risk for SWI
The results of the comprehensive ecological risk assessment of the SWI for urban greenbelts are shown in Figure 7. The greenbelt located in the northwestern part of the Bao’an River Chung Group faces a high ecological risk from SWI owing to its proximity to the coastline, lack of tall mountains to provide submerged layer recharge, and the relatively distant spatial location of the water supply plant. Therefore, even plants exhibiting strong salt tolerance, such as mangroves and wood sorrels, remain vulnerable to SWI. The same applies to the Futian District, where the population is highly concentrated and the impacts of SWI tend to be more severe, potentially posing greater challenges to the city’s ecology and the livelihoods of its residents.
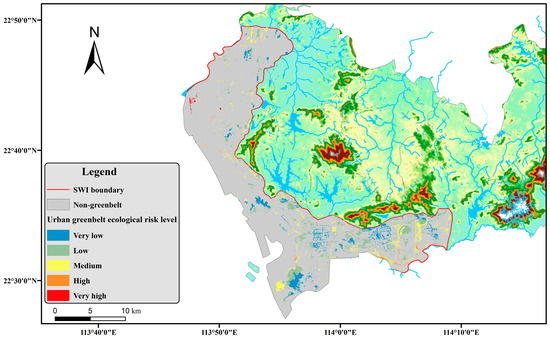
Figure 7.
The ecological risk map of the urban greenbelt affected by SWI.
By calculating the rate of the area of risk zones at different levels to the total area of urban greenbelts within the evaluation scope, we determined the size relationship between them. In the assessment results, the relationship between the size of each risk area is, respectively, low ecological risk > very low ecological risk > medium ecological risk > high ecological risk > very high ecological risk. Detailed results are shown in Table 4. The ecological vulnerability of high-risk areas and the potential loss of ecological functions owing to SWI, such as vegetation destruction, land salinization, and loss of biodiversity, should be further analyzed in subsequent studies. Simultaneously, the relevant departments should improve their strategies and measures to cope with SWI. These measures include strengthening the monitoring and early warning systems of SWI, optimizing tree species to enhance the resistance and recovery capacity of green areas, and implementing appropriate land-use-planning and -management measures to mitigate the impact of SWI on urban greenbelts.
Table 4.
Proportion of different SWI ecological risk levels.
4. Discussion
4.1. Enhancing Freshwater Ecosystem Services
SWI leads to a suite of ecological changes, including increased soil salinity. In the future, green infrastructure will represent the application of nature-based solutions that utilize a network of natural and semi-natural features to provide multiple benefits for both human and natural systems. Green infrastructure increases the demand for freshwater and associated ecosystem services.
As cities become larger and climate change threatens to cause more extreme weather, some scientists and politicians have proposed the development of “sponge cities” aimed at reshaping the urban environment to ensure that nearly every raindrop can be captured, controlled, and reused. During sponge city construction, urban planners and managers should solidify a city’s overall ecological security pattern (ESP), and take full advantage of the surrounding natural ecological elements for internal accumulation, natural infiltration, and purification. Large natural sponges, such as mountains, wetlands, and large green areas, should be prioritized for protection planning. For this study area, specific measures, roadside green swales, should be taken. These green swales play a crucial role in controlling stormwater pollution and conserving freshwater resources by effectively removing runoff pollutants, including suspended solids and saline contamination.
With the rapid economic development of China’s coastal areas and the growth of the industry and population, the impact of anthropogenic activities on the coastal environment has become increasingly significant, necessitating strengthened soil and water-conservation efforts along the coast. However, as illustrated by the outcomes of these projects, alternative water sources can potentially maintain and restore riparian ecosystems in water-stressed regions, particularly urban settings.
As cities develop in coastal environments, addressing the issue of freshwater supply is essential for continuous development [31]. To control soil and water loss, the ecosystem should be restored and a slope storage system should be developed. Shenzhen should comprehensively promote the construction of sponge cities; implement multi-pronged measures, such as non-point source treatment, dredging, ecological water replenishment, and ecological restoration; effectively ensure the safety of drinking water sources; and create waterfront leisure and recreation spaces where the water is clear and the banks are green and beautiful. They are important aquifers with pore water yields of 100–1000 m3/day [10].
4.2. Planting the Salt-Tolerant Vegetation Type
Plant growth is susceptible to the high concentrations of salt ions, particularly at beach fronts. Salinity is one of the most important environmental factors limiting the productivity of agricultural land worldwide [32]. Many low-lying coastal areas have low elevations, climate-sensitive physical and ecological characteristics, and high social exposure and vulnerability (e.g., flood-prone high population and asset density, marine-dependent small-scale economies), and are places where vegetation and the environment are often more susceptible to damage and less likely to recover [33]. Our results indicate that the resilience of landscape plants along the west coast of Shenzhen against SWI ecological risks needs to be enhanced. Perhaps, an appropriate increase in the proportion of salt-tolerant plants could be a viable solution to address this issue.
Salt tolerance of strand-halotolerant plants is of great significance to the structure and function of coastal ecosystems and the maintenance of the region’s overall biological resources. Some studies have shown that there are 119 species and varieties of landscape plants in Shenzhen, accounting for 47 families and 98 genera. There were 36 species with injuries, accounting for 30.3% of all landscape plants [23].
The smart selection of vegetation types was analyzed for the biomass accumulation, leaf, stem, and root anatomical structure, root architecture, carbohydrate allocation, nutrient utilization, antioxidant system-associated indicators, ontogenesis, molecular mechanisms related to salt tolerance of strand halotolerant plants, and symbiosis between the strand halotolerant plants and rhizosphere microorganisms.
4.3. Limiting High-Position Saltwater Aquaculture
Human intervention through defensive or adaptive planning can shift groundwater responses toward either topography-limited or flux-controlled modes; however, alternate modes may present new challenges. The construction and demolition of high-position saltwater aquaculture areas corresponded to increases and decreases in Cl− concentrations, respectively, in these areas. Municipal authorities should consider reducing large areas of grass and flowers and increasing the planting of native trees and shrubs to conserve water for landscaping.
This implies that greater variability is projected for river discharge and salt intrusion length in a warmer climate. The water quality and degree of wastewater treatment must be addressed to ensure public and environmental safety.
Monitoring shallow groundwater salinity is crucial for urban ecosystem management in low-lying coastal cities and has implications for park management, subsurface pipes, wastewater assets, and deeper aquifers. The release of wastewater from companies causing significant pollution, such as the printing and dyeing of textiles, metal processing, and electronics, must strictly be monitored. Firms should be encouraged to improve their production processes and reduce the use of dangerous metal salts. For this study, the need to accelerate the construction process of upgrading sewage-treatment plants to further reduce the salt stress.
For municipal parks and ecological landscapes utilizing rainwater, treated sewage, and reclaimed water, the use of rainwater, treated sewage, and reclaimed water must be prioritized. Therefore, efforts must be made to develop international monitoring programs and standards for assessing groundwater quality.
With the rapid economic growth of China’s coastal areas and the continuous concentration of industry and population, the problem of heavy metal pollution in estuarine waters has become more and more serious. This problem not only concerns the ecological balance but also directly affects the health and sustainable development of coastal residents [34]. In a previous study, the current knowledge on irrigation water quality, soil salinity, and smart fertigation systems (using differential GPS, GIS, sensors, biosensors, automatic guidance systems, etc.) was reviewed to manage global salt-affected soils through precision management [35]. High concentrations of heavy metals have been detected in aquatic organisms in the coastal areas of South China, with mollusks showing higher levels of heavy metals than other species.
4.4. Policy Implications for Garden Cities
Whether in the fields of socioeconomics, estuarine dynamics, or ecological engineering, comprehensive research is needed to find solutions to mitigate the salt intrusion problem [36]. To achieve the status of an “international garden city,” groundwater overexploitation should be limited, which reduces the hydraulic head of freshwater and directly exacerbates SWI [37,38].
In Shenzhen, mangroves are important wetland species. Mangroves are mainly found in the Futian Mangrove Nature Reserve and partly in Shajing, Fuyong, and Xixiang in Baoan District, Shahe in Nanshan District, and Baguang, Kuichong, and Nan’ao in Dapeng New Area. Our research found that although mangroves have high salt tolerance, they often face higher ecological risks during SWI due to their proximity to estuaries and the lack of tall mountains nearby to provide sufficient freshwater. This study will aid in the decision-making for plantation and conservation programs for mangrove forests. Future research should explore methods to deliver sufficient freshwater to support coastal wetlands, while also balancing the human needs for freshwater.
Dongguan discharges water pollutants into the PRE. Over the past four decades, the west coast of Shenzhen, Guangdong Province, China, has undergone urbanization. Consequently, urban structures and land-use types have changed, and urban water consumption has increased. Groundwater in this region was initially overexploited and subsequently well-conserved. Substantial measures must be taken to prevent further loss of this precious ecosystem, which serves many vital functions, and ensure its restoration.
Climate-adaptation studies of mega-deltas require a comprehensive integration of knowledge regarding natural systemic responses to upstream and downstream climatic and anthropogenic developments. The main mountain range runs through the middle from east to west and is the source and watershed of the main river. Owing to topographical influences, Shenzhen has many small river gullies with a wide distribution, short mainstream, and small river runoff.
Understanding the interactions and relative importance of freshwater–saltwater interface effects is critical for managing, mitigating, or adapting to the impacts of global climate change. In 2022, Shenzhen’s cumulative sponge city area reached 441 km2, accounting for 46.1% of Shenzhen’s total built-up area.
5. Conclusions
SWI has emerged as a paramount stress on urban ecosystems in the coastal areas of the PRD. Climate change has induced gradual changes in the physical and chemical characteristics of global coastal areas, including acidification, warming, and SLR. SLR will increase the adaptation needs along low-lying coasts worldwide, and Shenzhen is no exception. To ensure that Shenzhen adapts to climate change, the following measures must be implemented: considerable climate change impact and risk assessments, prediction and early warning, and disaster prevention and reduction; implementing the concept of climate change adaptation into the entire process of land and space planning, construction, and management; sustainable maintenance and renewal of the urban green infrastructure; and improving climate adaptation in the natural ecological and socioeconomic fields.
Stress factors of SWI, ranging from chemical to physical, biological, and natural events, are diverse and complex. However, the application of ERA to urban ecosystems is relatively new and rare. We built an ERA model that is effective for urban ecosystems. We believe that the average topographic gradients in coastal watersheds are the best estimates for further model experiments and that the average topographic gradient of streams is a lower bound for the uncertainty range of coastal groundwater discharge.
The flow of fresh groundwater can significantly contribute to rainwater, treated sewage, and reclaimed water for landscaping, environmental sanitation, and ecological landscapes. Units utilizing water should establish supporting facilities for collecting and utilizing rainwater and reclaimed water, gradually reducing water consumption over time. Groundwater is primarily recharged by the infiltration of atmospheric precipitation, generally flowing from north to south, and is finally discharged into the sea. Restoring freshwater delivery to wetlands may benefit the conservation of both inland and coastal wetlands under climate change.
Supplementary Materials
The following supporting information can be downloaded at: https://www.mdpi.com/article/10.3390/land13091338/s1, Table S1: List of Shenzhen Waterworks. Table S1 provides the geographical location information of the tap water plants in Shenzhen City. Its main function is to calculate the distance between each urban greenbelt affected by SWI and its nearest tap water plant, thus serving as an important basis for evaluating the ability of stress factor SF4 (irrigation water supply capacity) to inhibit saline-alkali water.
Author Contributions
R.D. conceived the idea and designed the experiments. Y.C. conducted the experiments. R.D. and Y.C. wrote the original draft. A.L. wrote—reviewed & edited the draft. X.C. and C.W. were involved in the funding acquisition. All authors have read and agreed to the published version of the manuscript.
Funding
The Project Supported by the Open Fund of Key Laboratory of Urban Land Resources Monitoring and Simulation, Ministry of Natural Resources [Grant No. KF-2022-07-013] and the National Key Research and Development Program of China (2022YFC3802903) and the Strategic Priority Research Program of the Chinese Academy of Sciences (XDA23030403).
Data Availability Statement
The availability of data used in this study is shown in Section 2.9. The relevant results produced are available from the authors on request.
Acknowledgments
We appreciate the anonymous reviewers for their insightful comments and suggestions.
Conflicts of Interest
The authors declare no conflicts of interest.
References
- Eamus, D.; Fu, B.; Springer, A.E.; Stevens, L.E. Groundwater Dependent Ecosystems: Classification, Identification Techniques and Threats. In Integrated Groundwater Management; Jakeman, A.J., Barreteau, O., Hunt, R.J., Rinaudo, J.-D., Ross, A., Eds.; Springer International Publishing: Cham, Switzerland, 2016; pp. 313–346. ISBN 978-3-319-23575-2. [Google Scholar]
- Mondal, P.; Walter, M.; Miller, J.; Epanchin-Niell, R.; Gedan, K.; Yawatkar, V.; Nguyen, E.; Tully, K.L. The Spread and Cost of Saltwater Intrusion in the US Mid-Atlantic. Nat. Sustain. 2023, 6, 1352–1362. [Google Scholar] [CrossRef]
- Tully, K.; Gedan, K.; Epanchin-Niell, R.; Strong, A.; Bernhardt, E.S.; BenDor, T.; Mitchell, M.; Kominoski, J.; Jordan, T.E.; Neubauer, S.C.; et al. The Invisible Flood: The Chemistry, Ecology, and Social Implications of Coastal Saltwater Intrusion. BioScience 2019, 69, 368–378. [Google Scholar] [CrossRef]
- Wang, H.; Li, W.; Xiang, W. Sea Level Rise along China Coast in the Last 60 Years. Acta Oceanol. Sin. 2022, 41, 18–26. [Google Scholar] [CrossRef]
- Qian, Y.; Dong, Z.; Yan, Y.; Tang, L. Ecological Risk Assessment Models for Simulating Impacts of Land Use and Landscape Pattern on Ecosystem Services. Sci. Total Environ. 2022, 833, 155218. [Google Scholar] [CrossRef] [PubMed]
- Kang, P.; Chen, W.; Hou, Y.; Li, Y. Linking Ecosystem Services and Ecosystem Health to Ecological Risk Assessment: A Case Study of the Beijing-Tianjin-Hebei Urban Agglomeration. Sci. Total Environ. 2018, 636, 1442–1454. [Google Scholar] [CrossRef]
- Chen, J.; Mueller, V.; Durand, F.; Lisco, E.; Zhong, Q.; Sherin, V.R.; Saiful Islam, A.K.M. Salinization of the Bangladesh Delta Worsens Economic Precarity. Popul. Environ. 2022, 44, 226–247. [Google Scholar] [CrossRef]
- Cao, T.; Han, D.; Song, X. Past, Present, and Future of Global Seawater Intrusion Research: A Bibliometric Analysis. J. Hydrol. 2021, 603, 126844. [Google Scholar] [CrossRef]
- Fu, T.; Fu, Y.; Li, C.; Dong, M.; Qi, C.; Wang, Z.; Chen, G.; Su, Q.; Xu, X.; Yu, H. Seawater Intrusion-Triggered High Fluoride Groundwater Development on the Eastern Coast of China. Environ. Sci. Pollut. Res. 2024, 31, 11307–11320. [Google Scholar] [CrossRef] [PubMed]
- Yu, Y.; Zhi, J.; Wei, B.; Cheng, J.; Hu, L.; Lu, W.; Gong, S. Seawater Intrusion on the West Coast of Shenzhen during 1980–2020 Due to the Influence of Anthropogenic Activities. Env. Monit. Assess 2023, 195, 545. [Google Scholar] [CrossRef]
- Luijendijk, E.; Gleeson, T.; Moosdorf, N. Fresh Groundwater Discharge Insignificant for the World’s Oceans but Important for Coastal Ecosystems. Nat. Commun. 2020, 11, 1260. [Google Scholar] [CrossRef]
- Zhou, W.; Wang, D.; Luo, L. Investigation of Saltwater Intrusion and Salinity Stratification in Winter of 2007/2008 in the Zhujiang River Estuary in China. Acta Oceanol. Sin. 2012, 31, 31–46. [Google Scholar] [CrossRef]
- Tang, L.; Wang, L.; Li, Q.; Zhao, J. A Framework Designation for the Assessment of Urban Ecological Risks. Int. J. Sustain. Dev. World Ecol. 2018, 25, 387–395. [Google Scholar] [CrossRef]
- Hua, L.; Shao, G.; Zhao, J. A Concise Review of Ecological Risk Assessment for Urban Ecosystem Application Associated with Rapid Urbanization Processes. Int. J. Sustain. Dev. World Ecol. 2017, 24, 248–261. [Google Scholar] [CrossRef]
- Liu, M.; Chen, L.; Gou, Y.; Dong, R. Assessment of Urban Ecological Risk from Spatial Interaction Models for Lijiang City. Int. J. Sustain. Dev. World Ecol. 2011, 18, 537–542. [Google Scholar] [CrossRef]
- Jasechko, S.; Perrone, D.; Seybold, H.; Fan, Y.; Kirchner, J.W. Groundwater Level Observations in 250,000 Coastal US Wells Reveal Scope of Potential Seawater Intrusion. Nat. Commun. 2020, 11, 3229. [Google Scholar] [CrossRef]
- Hong, W.; Guo, R.; Tang, H. Potential Assessment and Implementation Strategy for Roof Greening in Highly Urbanized Areas: A Case Study in Shenzhen, China. Cities 2019, 95, 102468. [Google Scholar] [CrossRef]
- Chen, K.; Jiao, J.J. Preliminary Study on Seawater Intrusion and Aquifer Freshening near Reclaimed Coastal Area of Shenzhen, China. Water Sci. Technol. Water Supply 2007, 7, 137–145. [Google Scholar] [CrossRef]
- Zhanwen, Q.; Islam, M.Z. Urban Equilibrium: Legal Imperatives for Sustainable Development and Habitat Preservation in Shenzhen, China. Urban. Ecosyst. 2024; Early access. [Google Scholar] [CrossRef]
- Research Institute for Eco-Civilization, CASS; UNDP. Shenzhen Sustainable Development Report 2021. 2021. Available online: https://www.undp.org/zh/china/publications/shenzhenkechixufazhanbaogao2021nian (accessed on 11 August 2024).
- Norton, S.B.; Rodier, D.J.; Van Der Schalie, W.H.; Wood, W.P.; Slimak, M.W.; Gentile, J.H. A Framework for Ecological Risk Assessment at the EPA. Enviro Toxic. Chem. 1992, 11, 1663–1672. [Google Scholar] [CrossRef]
- Liu, X.; Hu, R.; Huang, Y. Screening and application of waterfront salt-tolerant plants in Qianhai Cooperation Zone. China Rural. Water Hydropower 2017, 1, 66–68. [Google Scholar]
- Zou, C.; Dai, Y.; Shi, Z.; Xu, J. Application Survey and Salty Damage Analysis to Coastal Landscape Plants of Shenzhen City. Landsc. Plant Study Appl. 2013, 35, 62–68. [Google Scholar]
- Deng, Y.; Young, C.; Fu, X.; Song, J.; Peng, Z.-R. The Integrated Impacts of Human Activities and Rising Sea Level on the Saltwater Intrusion in the East Coast of the Yucatan Peninsula, Mexico. Nat. Hazards 2017, 85, 1063–1088. [Google Scholar] [CrossRef]
- Giordana, G.; Montginoul, M. Policy instruments to fight against seawater intrusion in coastal aquifers: An overview. Vie Milieu 2006, 56, 287–294. [Google Scholar]
- Han, D.; Post, V.E.A.; Song, X. Groundwater Salinization Processes and Reversibility of Seawater Intrusion in Coastal Carbonate Aquifers. J. Hydrol. 2015, 531, 1067–1080. [Google Scholar] [CrossRef]
- Middleton, B.A.; Boudell, J. Salinification of Coastal Wetlands and Freshwater Management to Support Resilience. Ecosyst. Health Sustain. 2023, 9, 0083. [Google Scholar] [CrossRef]
- Zhi, X.; Yang, X.; Ren, J.; Wu, H.; Zhu, J.; Zhang, H. Research Progress in Salt Tolerance Evaluation and Identification of Garden Plants in China. World For. Res. 2018, 31, 51–57. [Google Scholar] [CrossRef]
- Dong, R.; Zhang, X.; Li, H. Constructing the Ecological Security Pattern for Sponge City: A Case Study in Zhengzhou, China. Water 2019, 11, 284. [Google Scholar] [CrossRef]
- Dong, R.; Liu, X.; Liu, M.; Feng, Q.; Su, X.; Wu, G. Landsenses Ecological Planning for the Xianghe Segment of China’s Grand Canal. Int. J. Sustain. Dev. World Ecol. 2016, 23, 298–304. [Google Scholar] [CrossRef]
- Ngo, M.T.; Lee, J.M.; Lee, H.A.; Woo, N.C. The Sustainability Risk of Ho Chi Minh City, Vietnam, Due to Saltwater Intrusion. Geosci. J. 2015, 19, 547–560. [Google Scholar] [CrossRef]
- Akbaba, M.; Özden, E. Salt Tolerance of Endophytic Root Bacteria and Their Effects on Seed Germination and Viability on Tomato Plants. Braz. J. Microbiol. 2023, 54, 3147–3162. [Google Scholar] [CrossRef]
- Magnan, A.K.; Oppenheimer, M.; Garschagen, M.; Buchanan, M.K.; Duvat, V.K.E.; Forbes, D.L.; Ford, J.D.; Lambert, E.; Petzold, J.; Renaud, F.G.; et al. Sea Level Rise Risks and Societal Adaptation Benefits in Low-Lying Coastal Areas. Sci. Rep. 2022, 12, 10677. [Google Scholar] [CrossRef]
- Tang, Z.; Liu, X.; Niu, X.; Yin, H.; Liu, M.; Zhang, D.; Guo, H. Ecological Risk Assessment of Aquatic Organisms Induced by Heavy Metals in the Estuarine Waters of the Pearl River. Sci. Rep. 2023, 13, 9145. [Google Scholar] [CrossRef] [PubMed]
- Kumar, C.; Verma, S.B.; Singh, A.K. Sustainable Management of Soil Salinity with Special Reference to Smart Fertigation Systems. Proc. Natl. Acad. Sci. India Sect. B Biol. Sci. 2023. [Google Scholar] [CrossRef]
- Lee, J.; Biemond, B.; De Swart, H.; Dijkstra, H.A. Increasing Risks of Extreme Salt Intrusion Events across European Estuaries in a Warming Climate. Commun. Earth Environ. 2024, 5, 60. [Google Scholar] [CrossRef]
- Huang, F.; Wang, G.H.; Yang, Y.Y.; Wang, C.B. Overexploitation Status of Groundwater and Induced Geological Hazards in China. Nat. Hazards 2014, 73, 727–741. [Google Scholar] [CrossRef]
- Senthilkumar, S.; Vinodh, K.; Johnson Babu, G.; Gowtham, B.; Arulprakasam, V. Integrated Seawater Intrusion Study of Coastal Region of Thiruvallur District, Tamil Nadu, South India. Appl. Water Sci. 2019, 9, 124. [Google Scholar] [CrossRef]


Disclaimer/Publisher’s Note: The statements, opinions and data contained in all publications are solely those of the individual author(s) and contributor(s) and not of MDPI and/or the editor(s). MDPI and/or the editor(s) disclaim responsibility for any injury to people or property resulting from any ideas, methods, instructions or products referred to in the content. |
© 2024 by the authors. Licensee MDPI, Basel, Switzerland. This article is an open access article distributed under the terms and conditions of the Creative Commons Attribution (CC BY) license (https://creativecommons.org/licenses/by/4.0/).