1. Introduction
The recent advancements in Computed Tomography (CT), particularly in image reconstruction techniques, have introduced additional opportunities to enhance the benefit–risk ratio for patients undergoing this examination. A comprehensive benefit–risk analysis in medical diagnostic X-ray usage is a highly intricate task encompassing multiple facets [
1]. The primary risk component arises from the adverse effects of ionizing radiation on a patient’s health, which correlates with the dose delivered to patients during an examination. The secondary risk component is associated with potential misdiagnosis, largely stemming from inadequate image quality, consequently leading to inappropriate therapy for patients. The central objective of the ALARA principle (As Low as Reasonably Achievable) is to strike a balance between image quality and the radiation dose received by patients during an examination. This principle emphasizes the need to optimize the benefit–risk ratio and enhance radiological protection for patients against ionizing radiation.
The initial step in achieving the optimal benefit-to-risk ratio involves investigating the dosimetric impact of CT examination protocols. Paying particular attention to doses is crucial, considering that CT contributes to 41% of the total population’s radiation dose [
2]. Furthermore, the significance of this attention lies in the doses received by patients during CT examinations, which reach a level posing a genuine risk of radiation-induced cancer [
3]. It is crucial to acknowledge that younger patients are more susceptible to the effects of radiation compared to older individuals. This heightened sensitivity is due to their longer lifespan, allowing radiation effects more time to manifest. Among all age groups, children are particularly sensitive as their bodies are in the developmental phase. Epidemiological studies have assessed radiation exposure from childhood CT scans and the associated cancer risks [
4,
5]. Consequently, maintaining a balance between the utility of CT scans and safeguarding the health of younger patients, especially children, holds paramount importance.
The
European Commission Directive 2013/59/EURATOM [
6] and other documents from international advisory groups [
7,
8,
9] underscore the importance of establishing diagnostic referent levels (DRLs) for patients undergoing X-ray diagnostic and/or interventional procedures. The
European Commission Report 180 [
10] contains DRL values for adult X-ray examinations in 36 European countries and pediatric X-ray examinations in 14 European countries. Establishing DRLs at local, regional, and national levels serves as a strong foundation for standardizing practices and enhancing the radiological protection of patients. These DRLs are derived from dosimetric values obtained across various X-ray modalities, anatomical regions examined, clinical indications, and patient age groups, gathered through surveys involving standard-size patient groups at local or regional levels. They provide a basis for setting national DRLs. Moreover, DRLs are indispensable tools in the process of optimizing doses for X-ray examinations.
This paper focuses on analyzing the dose descriptors associated with Computed Tomography Urography (CTU), a form of abdominal multiphase CT scan utilized for imaging the kidneys, ureters, and bladder [
11]. Over the past two decades, CTU has emerged as a crucial imaging technique for evaluating the urinary tract, offering precise diagnostics for various pathologies like hematuria, urolithiasis, and bladder cancer. For more comprehensive information, readers can refer to the review article and its references [
12]. However, CTU exposes patients to higher levels of radiation. The scientific community has diligently worked to optimize different protocols within CTU imaging techniques [
13,
14]. Unfortunately, there is no consensus on a standard or suitable protocol for clinical indications [
15]. CTU commonly involves scanning in 2–6 different phases, both with and without intravenous contrast administration. Presently, the most frequently used and suggested protocols include a two-phase split bolus CTU, comprising a non-contrast phase and a combined nephrographic and excretory phase, as well as a three-phase protocol based on a single bolus, encompassing non-contrast, nephrographic, and excretory phases [
16]. The split bolus protocol has demonstrated a reduction in delivered patient doses. Obtaining a clear image can be challenging due to delayed excretion or suboptimal display of the channel system. At times, increasing doses becomes necessary for improved image quality. Balancing this, however, is the significance of limiting ionizing radiation exposure to patients while ensuring satisfactory CTU image quality. A higher-quality image facilitates early detection and more reliable diagnoses [
15].
A recent survey, conducted across various European countries by CTU, has revealed the use of diverse protocols and phases during CTU examinations [
17]. This variability stems from differences in countries, regions/hospitals within countries, and the types of scanners utilized for CTU imaging. However, a lack of collaboration among medical physicists, radiologists, and technologists in certain sites can result in an increased number of phases conducted during a single examination, consequently elevating the patient’s radiation exposure. Notably, the survey encompassed only one regional center in Bosnia and Herzegovina, emphasizing the necessity for further analysis of fundamental dose descriptors within CTU examinations across other regional centers in the country.
This study aims to assess the local clinical practices at the Clinical Hospital Zenica concerning CTU examinations.
This effort is in accordance with the goal of the EUCLID study [
18]. It intends to establish local diagnostic reference levels (LDRLs) and compare them with broader European Diagnostic Reference Levels (DRLs). Additionally, this research aims to provide insights into the gender and age demographics of patients and the clinical indications guiding referrals for CTU examinations. Utilizing the collected data and established LDRLs, we plan to develop assumptions for future dosimetric optimization of CTU imaging protocols. Moreover, the establishment of LDRLs holds the potential to drive the establishment of national Diagnostic Reference Levels (DRLs). Our primary motivation is to establish local diagnostic reference levels for CTU examinations at our hospital, aiming to inspire other regional centers across the country to adopt a similar approach, ultimately leading to the establishment of national diagnostic reference levels. Additionally, leveraging our findings, we intend to optimize our current protocols in line with the ALARA principle.
2. Materials and Methods
Data for CTU was sourced from Cantonal Hospital Zenica, one of Bosnia and Herzegovina’s prominent regional centers. The study encompassed 203 patients, comprising 91 females and 112 males. These patients were admitted to the regional hospital between mid-2019 and August 2023. CTU examinations were conducted using the SOMATOM Definition AS CT Scanner.
Patients underwent scans following a clinically adjusted CTU protocol known as the three-phase single-bolus protocol. Additional phases were occasionally included, particularly for older patients. The standard three-phase single-bolus protocol typically includes native, nephrographic, and excretory phases as part of the CTU examinations performed at our hospital [
16]. The conventional CTU technique involves acquiring non-contrast images, administering the full contrast bolus, and then obtaining images in the nephrographic phase (80 to 120 s) and delayed excretory phase (5 to 15 min). Optionally, in certain cases, additional image acquisition in the corticomedullary phase (30 to 40 s) and/or late arterial phase may be conducted. At our institution, the excretory phase may be repeated in cases of complications or when obtaining essential diagnostic information becomes challenging. For this investigation and the corresponding statistical analysis, protocols consisting of four, five, and six phases were considered. Data were manually collected by urologists and radiologists and subsequently verified by all authors. Exclusions were made for pediatric cases and examinations with diagnostic uncertainty. Ethics approval was obtained from the institution’s ethics committee (Ethics Code: 00-03-35-1151-14/23). Given the retrospective nature of this study, patient consent corresponding to the Institutional Review Board of our hospital was not required.
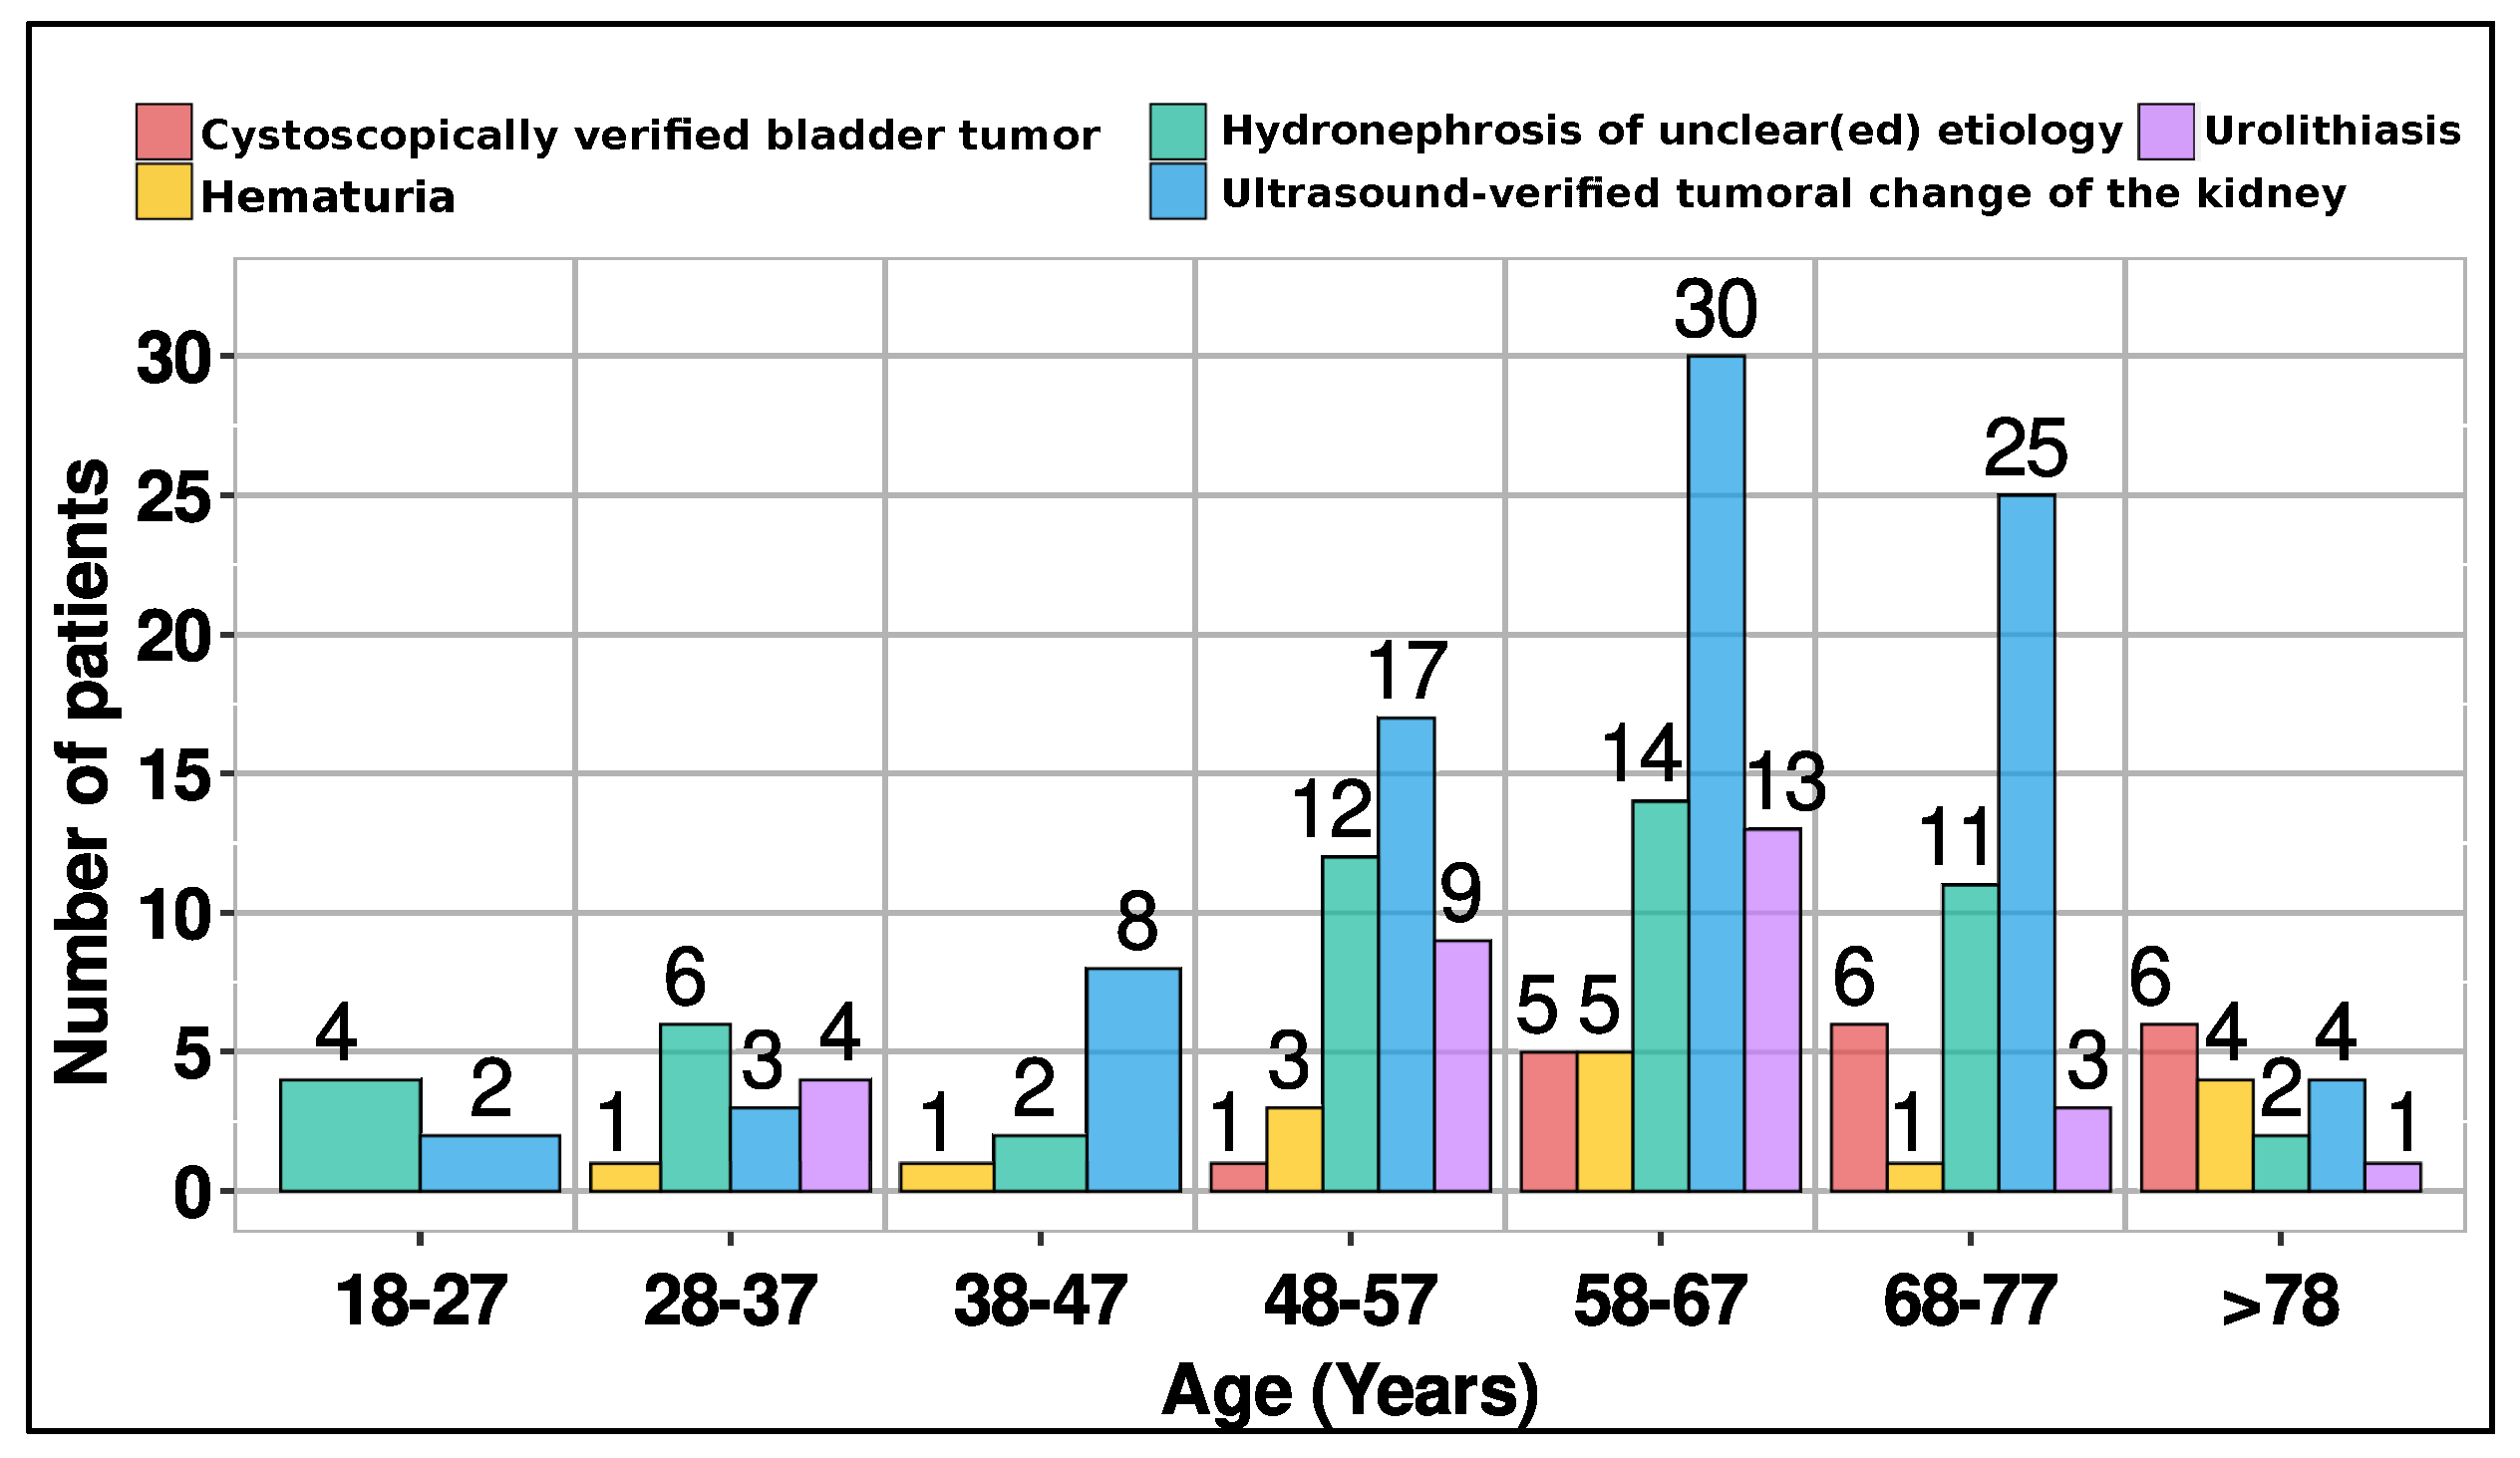
CTU scans were conducted for 5 clinical indications: cystoscopically verified bladder tumor (18 patients), hydronephrosis of unclear etiology (51 patients), urolithiasis (30 patients), hematuria (15 patients), and ultrasound-verified tumoral changes in the kidney (89 patients). This classification aligns with domestic and international guidelines.
The primary focus of this study is the collection and analysis of CT dosimetric parameters, namely, the volumetric CT dose index (CTDI
vol, measured in mGy) and the dose length product (DLP, measured in mGy·cm). The CTDI
vol refers to the CTDI32cm value and it is obtained as the weighted CTDI, CTDIw, normalized by the pitch value for helical scans [
19]. It represents an estimate of the average dose within a scanned section in a standard CT 32 cm diameter circular PMMA phantom. It serves as a valuable standardized metric for comparing scanner outputs and optimizing protocols. The DLP value is defined as the product of CTDI
vol and scan length. The collected data about patient examinations include age, sex, clinical indication, date of examination, and the number of phases. The collected CT acquisition parameters include mAs (tube current-exposure time product), kV (tube voltage), Pitch Factor, Nominal Single Collimation Thickness, Nominal Total Collimation Width, Exposure Time per Rotation, and scan length. The automatic tube-current modulation in the angular and longitudinal directions was used. The acquisition parameters are listed in
Table 1.
Although some parameters were changed during some phases within the same examination by CT technologists, such as the pitch factor, complete procedures are assumed to be part of one standardized protocol. We analyzed the dose descriptors in detail and found that there was no significant difference between the different protocols.
The analysis involved descriptive statistics such as arithmetic mean, median, interquartile range (IQR = 25th–75th percentile), and range values for CTDI
vol and DLP per phases and DLP
tot. DLP
tot represents the cumulative sum of individual DLP values from each phase within a single examination. The values of CTDI
vol, DLP, and DLP
tot were individually analyzed for examinations conducted with 3, 4, 5, and 6 phases, as well as their combinations (3 + 4, 3 + 4 + 5, and 3 + 4 + 5 + 6). Variations in radiation dose parameters were examined using box-and-whisker plots. The central line in the box represented the median value, while the edges of the box depicted the 25th–75th percentiles. The whiskers showcased the minimum and maximum values. The normality of the data was assessed using the Kolmogoro–Smirnov goodness-of-fit test. Additionally, the Kruskal–Wallis test was utilized to compare CTDI
vol, DLP, scan length, and DLP
tot across different phases of the protocol. All statistical analyses were conducted using the R programming language, and statistical significance was indicated by
p < 0.05.
Table 2 provides a summary of CTU scan phases and obtained results for dose descriptors (CTDI
vol, DLP, scan length and DLP
tot).
3. Results
A total of 203 patients participated in this retrospective study, comprising 91 females and 112 males. The difference in numbers between male and female patients was not statistically significant (
p = 0.140, Mann–Whitney test). Patient ages ranged from 20 to 87 years and were categorized into 7 age groups, as depicted in
Figure 1.
The mean age was 60.7 years (SD = 13.9), with a median age of 62 years. The 3- and 4-phase protocols were employed across a wider age range, spanning 20–87 and 21–85 years, respectively. These standardized protocols are widely utilized for various clinical indications (
Figure 2).
The 5- and 6-phase protocols were administered to older patients, aged 42–82 and 60–81, respectively.
Figure 3 presents the phase distribution for various clinical indications observed in CT urography.
Table 2 consolidates CTDI
vol, DLP, scan length, and DLP
tot values per examination, offering insights into the range, mean (SD), median, as well as first and third quartile values for clarity.
The median number of scan phases for CTU stood at 4 (IQR 3–4 phases). Notably, CTU examinations were conducted using 3-phase (40.4%, 82/203), 4-phase (47.3%, 96/203), 5-phase (8.4%, 17/203), and 6-phase protocols (3.9%, 8/203). The median values for CTDI
vol, DLP, scan length, and DLP
tot across the 3-phase, 4-phase, 5-phase, and 6-phase protocols are as follows: (12.44/12.07/12.28/12.67) in mGy, (584.5/549.3/555.0/584.5) in mGy·cm, (45.68/45.19/48.05/44.68) in cm, and (1755/2158/2779/3374) in mGy·cm, respectively. In
Figure 4, we present box-and-whisker plots depicting CTDI
vol, DLP, scan length, and DLP
tot per phase.
Additionally,
Figure 5 showcases CTDI
vol, DLP, scan length, and DLP
tot across combined phases (3 + 4; 3 + 4 + 5; 3 + 4 + 5 + 6).
These calculations encompassed all doses from individual CT examinations, detailed in the previous section. From
Figure 4, it is evident that there was no significant difference in CTDI
vol, DLP scan length and DLP
tot values per phases between different protocols.
Figure 6 displays the total DLP for 3, 4, 5, and 6 phases, revealing the 6-phase protocol’s DLP as 1.92 times higher than that of the 3-phase protocol.
In analyzing the distributions, mean values surpassing corresponding medians suggest skewed distributions for CTDIvol, DLP, and DLPtot. Conversely, the scan length distribution’s median and mean are closely aligned, indicating a relatively symmetric distribution. While the median of phase protocols for CTDIvol, DLP, and scan length showed no significant differences (p = 0.513, p = 0.503, p = 0.223, respectively), as expected, there was a significant disparity in the median of phase protocols for total DLP (p < 0.001).
4. Discussion
The research conducted at the Cantonal Hospital Zenica, followed by subsequent analysis, provided profound insights into CTU protocols, dose descriptors, patient demographics, and clinical indications. This enabled us to validate our clinical practices by establishing local diagnostic reference levels (LDRLs) for CTU examinations.
Data for 203 patients (91 females and 112 males) were gathered for this study. The study delves into the phases employed in CTU examinations, examining their correlation with clinical indications and patient age. The 3- and 4-phase protocols were employed across a wider age range, spanning 20–87 and 21–85 years, respectively. The primary reasons for undergoing this examination were ultrasound-verified tumoral changes in the kidney (43.8%, 89/203) and hydronephrosis of uncertain origin (25.1%, 51/203). Although ultrasound is commonly used for detecting kidney tumors, CT urography offers more precise information regarding tumor size, location, and features, aiding in staging and treatment planning. Hydronephrosis of unknown etiology can stem from diverse factors, including kidney stones, tumors, or congenital anomalies. Elderly individuals often present with multiple comorbidities, necessitating comprehensive examinations. Therefore, employing five- or six-phase protocols becomes crucial for providing accurate information vital in diagnosing and treating intricate medical conditions. In cases where the cause of hydronephrosis is unclear, CT urography is a preferred diagnostic tool due to its ability to offer detailed images of the urinary tract, aiding in identifying underlying issues. Other prevalent reasons for CT urography include urolithiasis (14.8%), cystoscopically verified bladder tumors (8.9%), and hematuria (7.4%). Urolithiasis, characterized by mineral and salt deposits in the urinary tract, is a global condition requiring imaging for diagnosis, follow-up, and management. CT urography provides crucial information for determining the stage of bladder tumors. Additionally, hematuria, indicating blood in the urine, could signify severe conditions such as bladder cancer, upper urinary tract urothelial cell carcinoma, renal cell cancer, or urinary tract stones. CT urography proves invaluable in diagnosing health issues related to hematuria.
The results indicate that there is no statistically significant variation in the numbers by gender. Due to men’s increased risk of urolithiasis and bladder cancer, an insignificant gender difference in favor of males was expected. The increased risk of urolithiasis in men is explained in part by the distinct chemical composition of urine and the presence of additional risk factors [
20]. Additionally, women have a lower chance of bladder cancer due to prevention; while men have a two- or even three-fold higher risk of developing bladder cancer. One reason for this is that women have more frequent urological checks due to the higher incidence of urinary infections [
21]. The number of patients undergoing CT examinations due to urinary tract issues (kidneys, ureters, and bladder) notably increased among individuals aged 48 years and older. The mean age was 60.7 years (SD = 13.9). According to the study [
22], the peak age at which renal cancer is diagnosed is 50 years or older, and the mean age at which bladder cancer is diagnosed is approximately 64 years old, with most patients being over 50 years old. The main indications in our study were renal masses verified with ultrasound, hydronephrosis of unclear etiology, urolithiasis, bladder cancer verified cystoscopically and hematuria. These indications for clinical application of CT urography are align with the results of several previous studies [
23,
24].
The analysis revealed that mean values for CTDI
vol, DLP, and scan length did not significantly differ between protocols. The existence of outliers may explain why mean values exceeded corresponding medians for CTDI
vol and DLP in the distributions. However, given the sample size, these outliers had minimal impact on the differences between mean and median values. As is common with LDRLs, our median values for CTDI
vol (12.44 mGy) and DLP (567 mGy·cm) across all protocols are selected as LDRLs for our hospital in CTU examinations. Comparatively, our study’s CTDI
vol median value of 12.44 mGy (with IQR 10.68–15.25) slightly exceeds the study [
17], where the median CTDI
vol was 10 mGy (IQR 7–15) across 20 countries. While the study [
17] didn’t list DLP per individual phases, our median DLP value (567 mGy·cm, IQR 460–701) aligns closely with the most common DLP (550 mGy·cm, range 450–650) for CT pelvis protocols in European countries [
10]. Given the significant disparity in median DLP
tot values across protocols and the median of 4 phases for CTU examinations in our hospital, the LDRL value chosen for DLP
tot (2158 mGy·cm, IQR 1774–2676) corresponds to the protocol with 4 scanning phases. This value, higher than the study [
17] median (1740 mGy·cm, IQR 869–2943), is because the study [
17] accounted for CT scanners with iterative reconstruction capabilities, which tend to yield lower DLP
tot values. These findings underscore the necessity for standardized CTU protocols, balancing diagnostic accuracy with minimized radiation exposure.
The substantial difference in median DLP
tot values across protocols emphasizes the need for cautious optimization when employing multiple phases, notably the increased radiation dose exposure with a six-phase compared to a three-phase protocol. Due to the retrospective nature of the study, the patient’s habitus, in terms of BMI, could not be included in the analysis. We acknowledge this limitation as one of the weaknesses of our study. Nonetheless, we followed the recommendation outlined in ICRP Report 135 [
19] suggesting that consideration of patient weight may not be necessary when a sufficiently large sample size (>100 patients) is obtained, as is the case in our study. In line with the primary objective of establishing local DRLs, we derived local DRL values from the analysis of collected data, adopting the median values of CTDI
vol and DLP as recommended practice [
19], with minimal influence from outliers on the median distribution. Future initiatives should focus on optimizing CTU protocols, particularly for elderly patients who often require more phases, aiming to enhance diagnostic accuracy while reducing ionizing radiation exposure. In the optimization process, it is crucial to consider the patient’s habitus alongside assessing the image quality, ensuring alignment with the clinical task at hand. By incorporating these factors, CTU protocols should be optimized to accommodate patient habitus while effectively addressing clinical inquiries.
Additionally, given urolithiasis accounting for nearly 15% of CTU examinations, a specific CT protocol tailored for these examinations, as showed in study [
17], is warranted. Collaboration among medical professionals across healthcare sites remains critical in standardizing CTU protocols, optimizing image quality, and reducing radiation doses, ultimately ensuring patient care and safety in diagnostic radiology.
We believe that established the local diagnostic reference levels (LDRLs) is a significant step towards optimizing the protocols used in different hospitals in our country. The establishment of national diagnostic reference levels (NDRLs) will benefit of this research.

 ,
, 


