
Validation and Implementation of OptiView and EnVision FLEX Detection Systems for Immunocytochemical Staining Protocols of the Ten Most Commonly Used Diagnostic Markers in Routine Cytopathological Practice

 ,
,
Abstract
1. Introduction
2. Materials and Methods
2.1. Patients
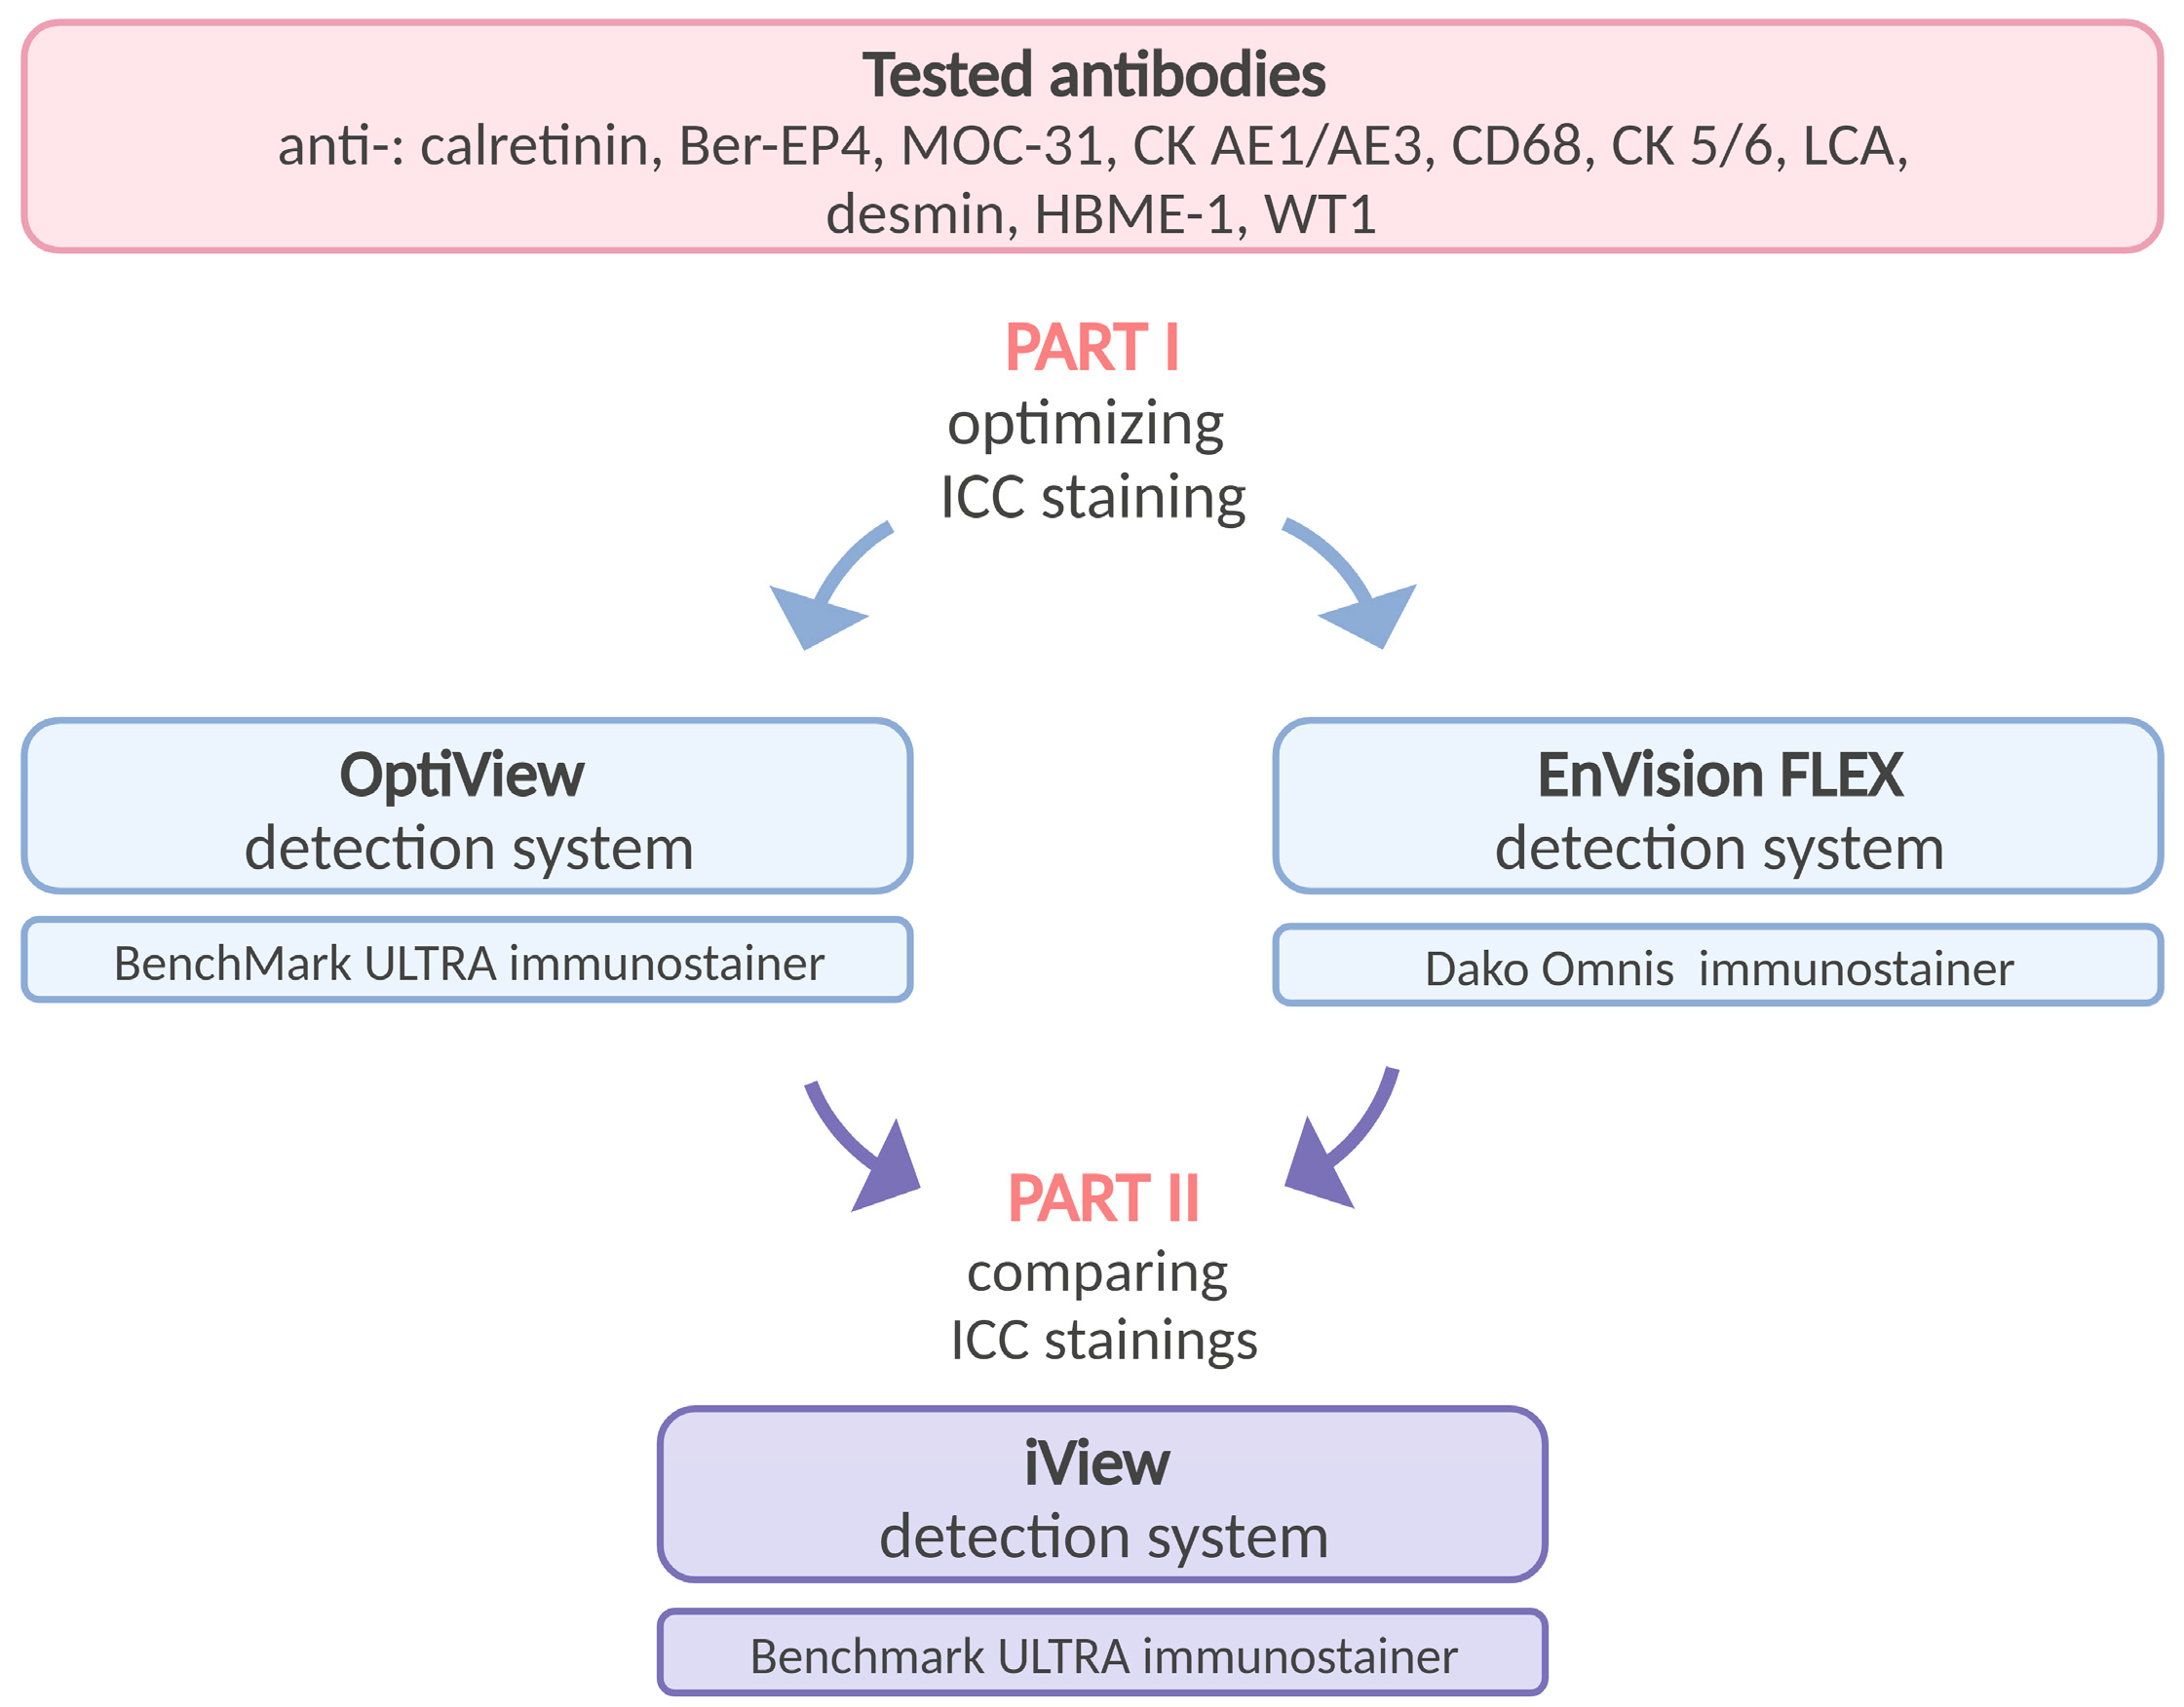
2.2. Study Design
2.3. Cytological Sample Preparation
2.4. Immunocytochemical Staining
2.5. Microscopic Evaluation
2.6. Scoring Criteria
2.7. Statistical Analysis
3. Results
3.1. Cytological Samples
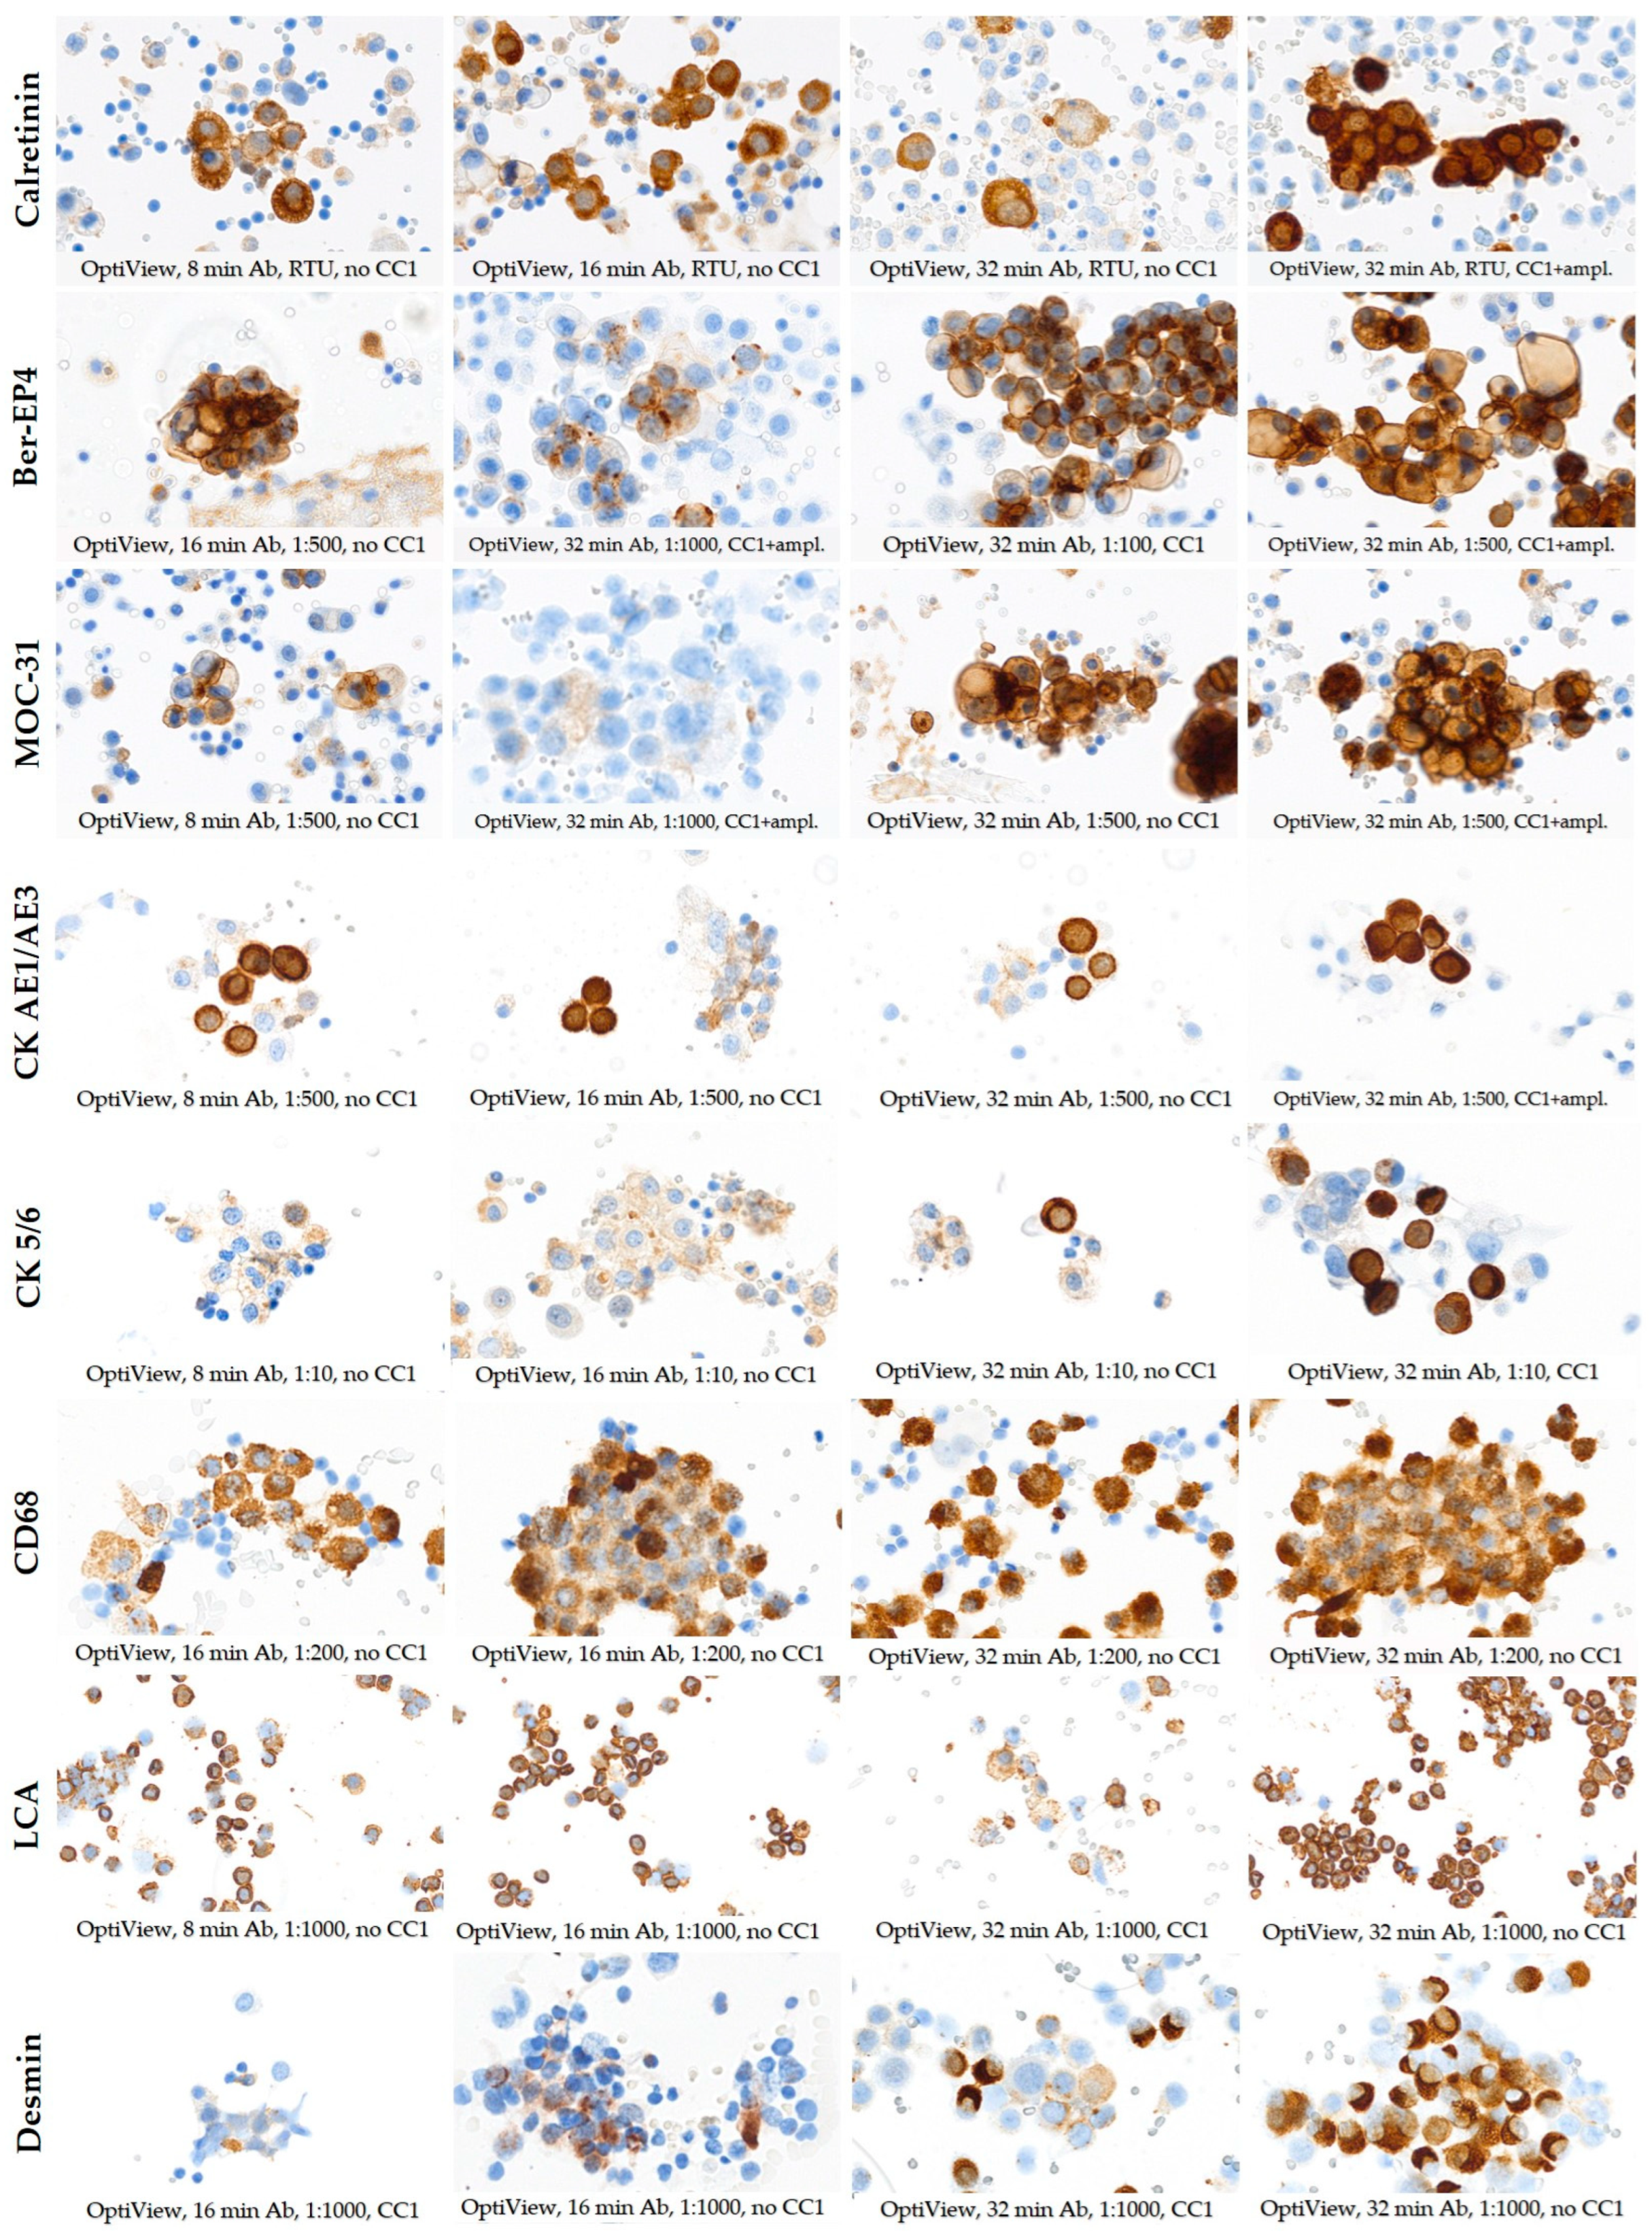
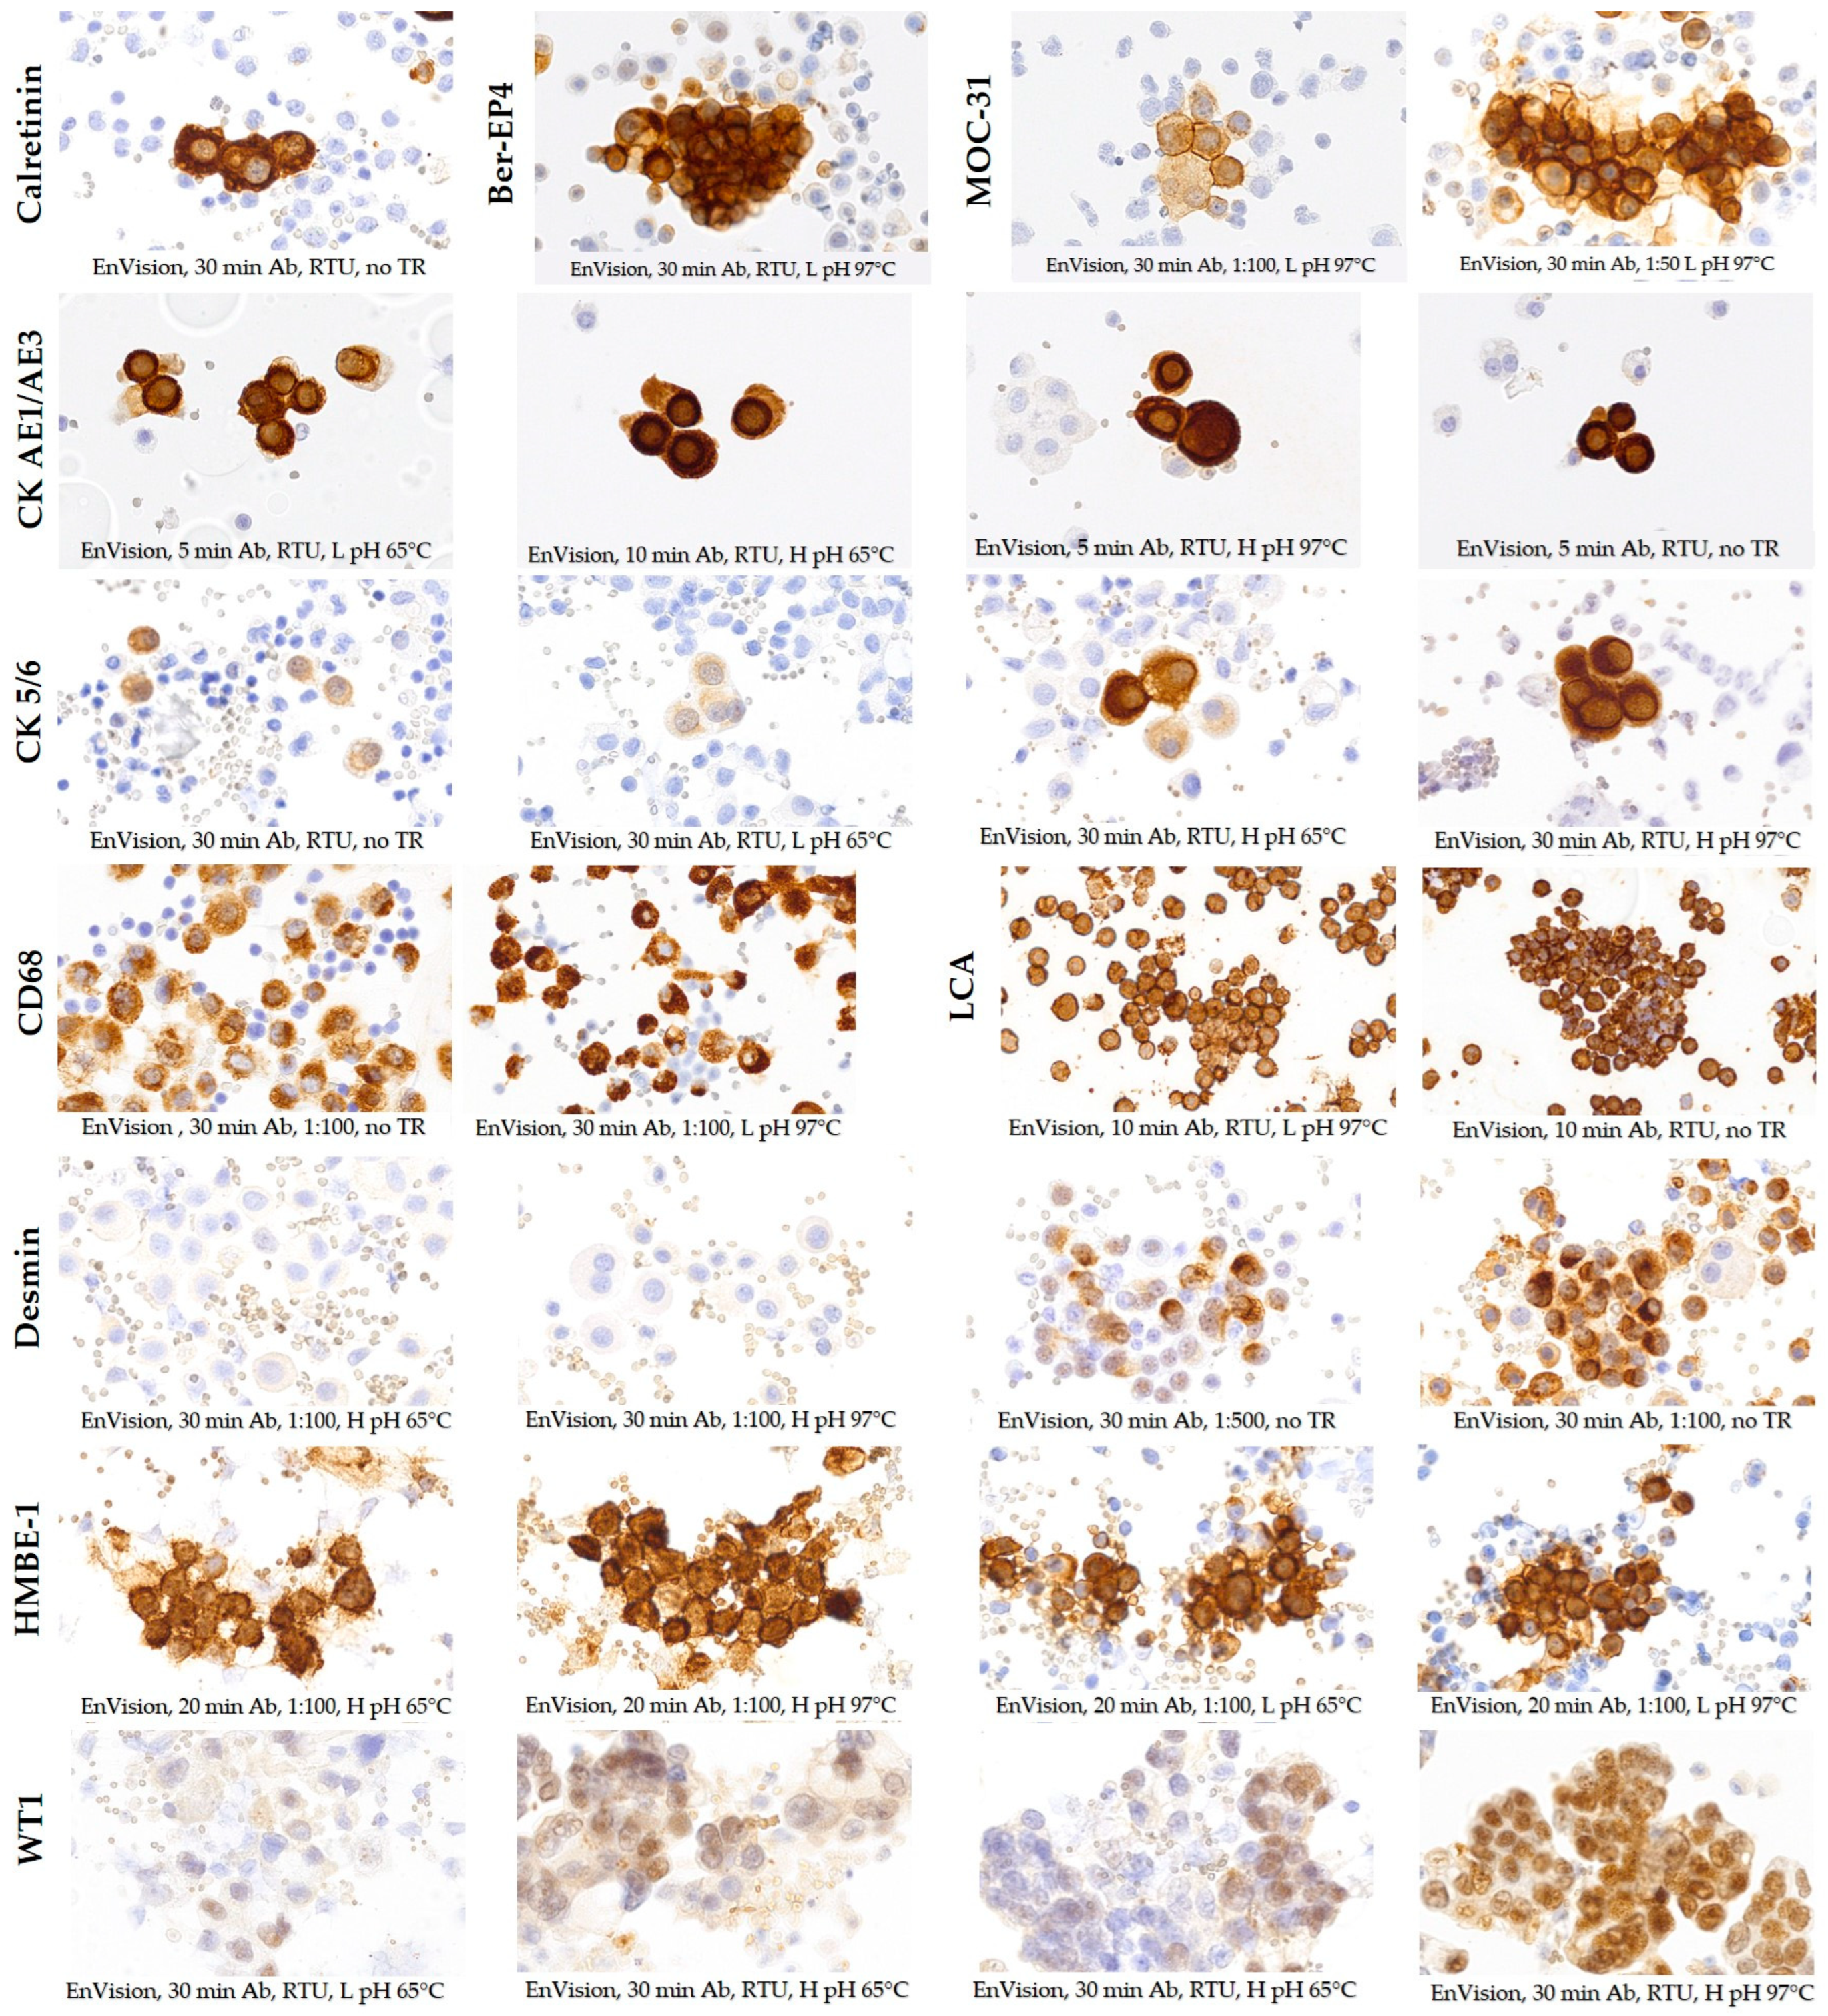
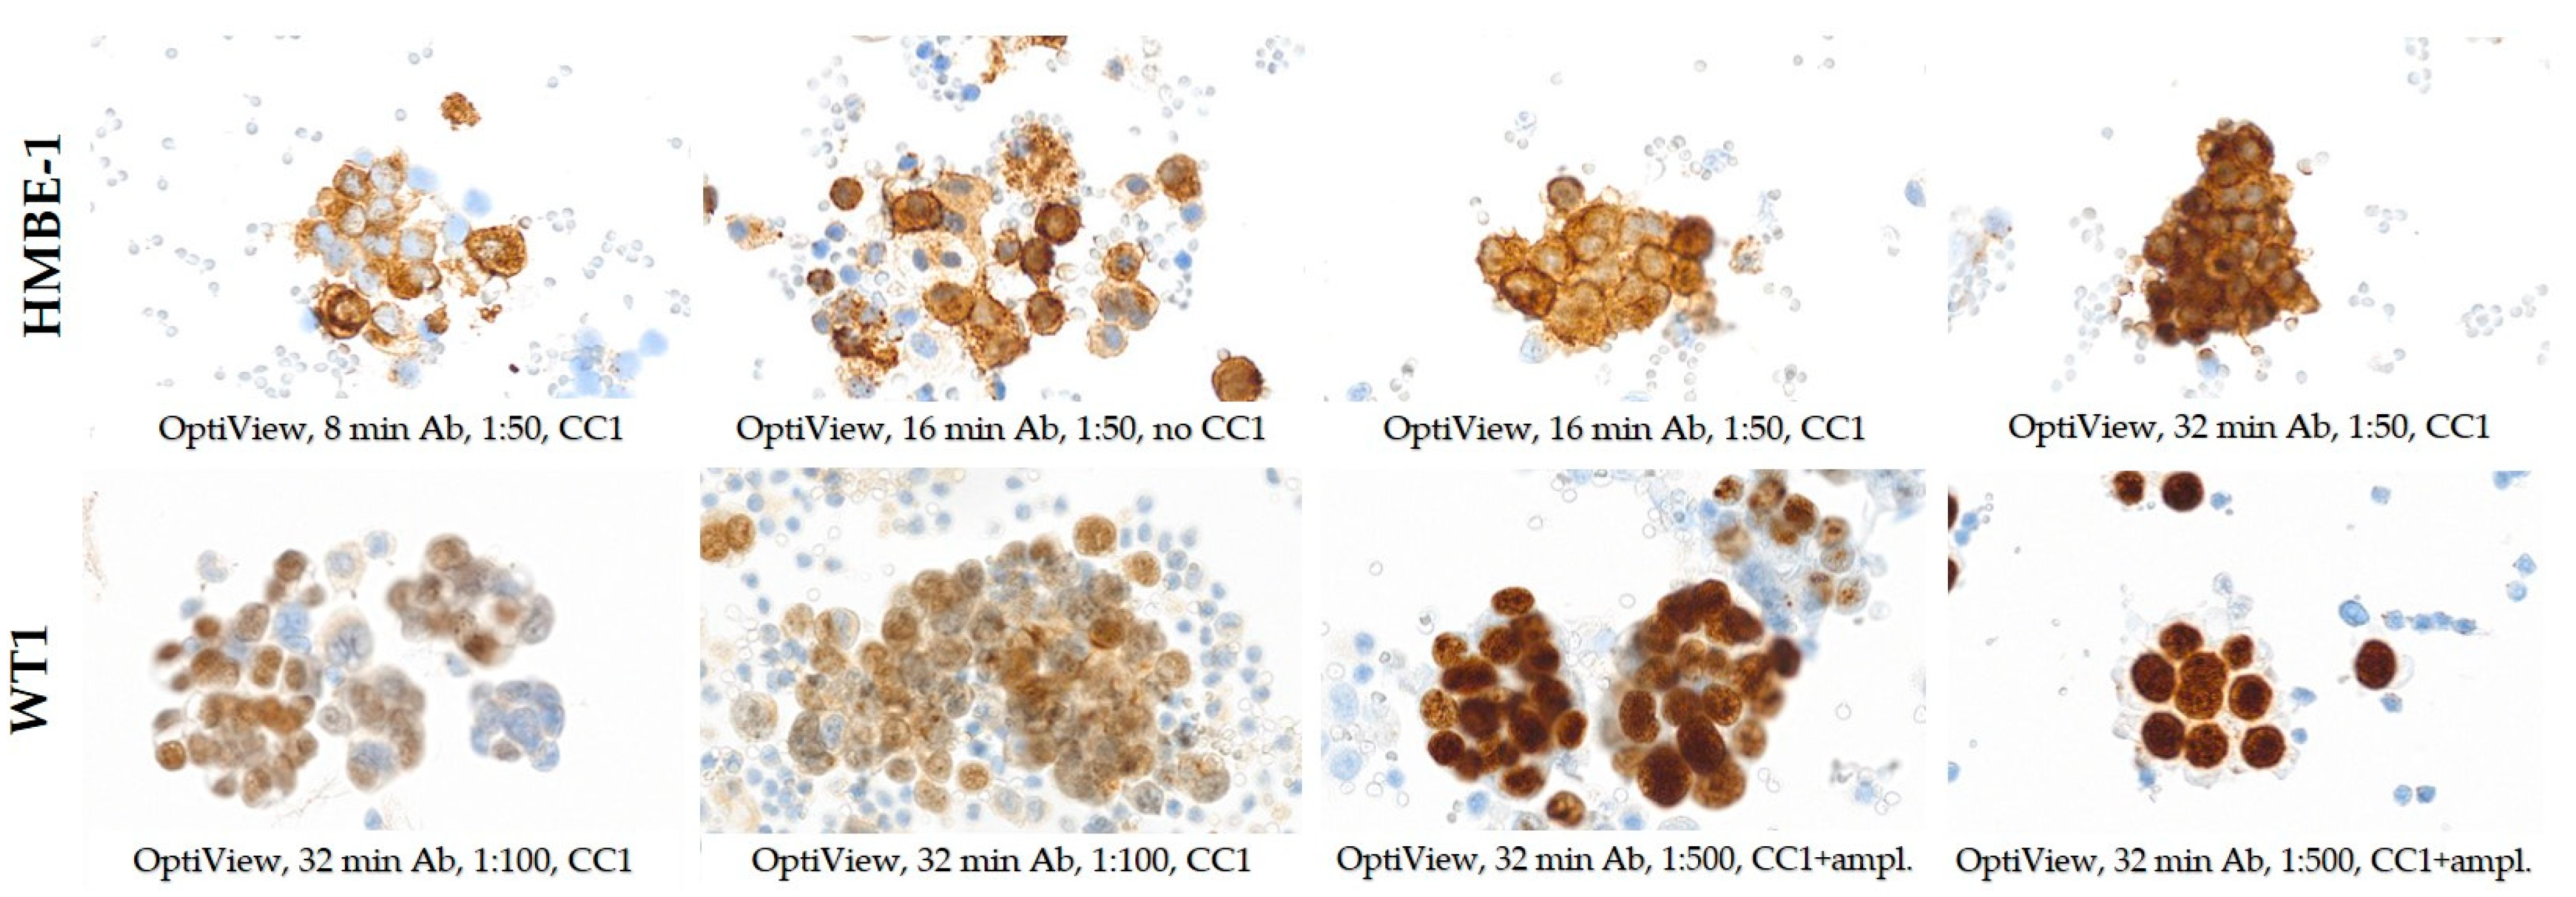
3.2. Selection of Optimal Staining Protocols with OptiView and EnVision FLEX Detection Systems
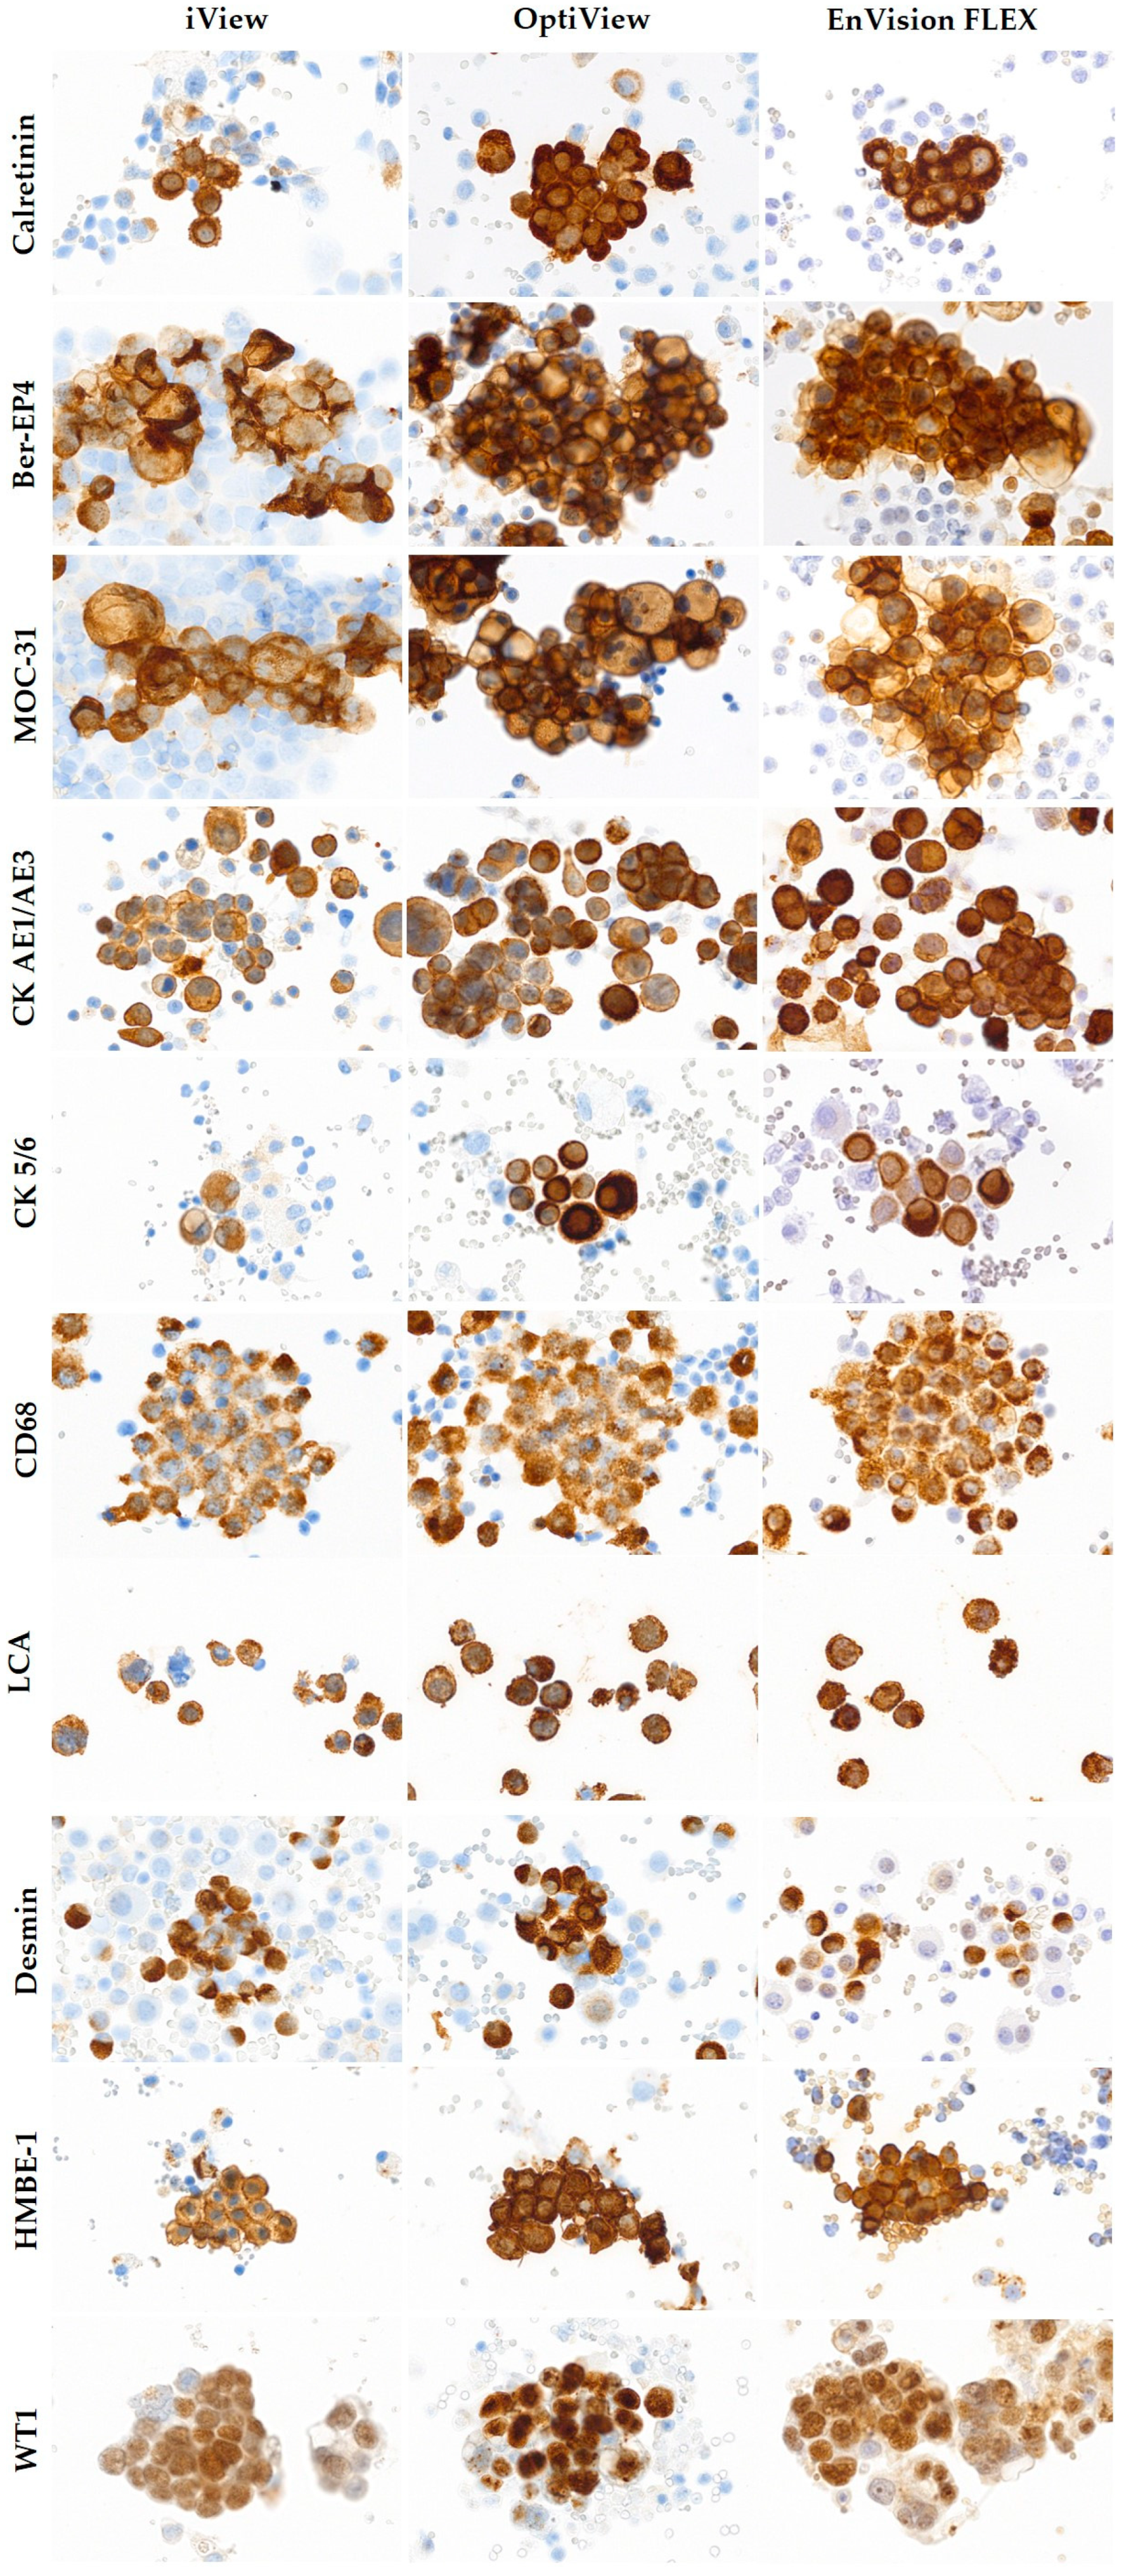
3.3. Comparison of OptiView and EnVision FLEX Optimal Staining Protocols with the Existing iView Protocol
4. Discussion
5. Conclusions
Author Contributions
Funding
Institutional Review Board Statement
Informed Consent Statement
Data Availability Statement
Conflicts of Interest
References
- Matos, L.L.; Trufelli, D.C.; de Matos, M.G.; da Silva Pinhal, M.A. Immunohistochemistry as an important tool in biomarkers detection and clinical practice. Biomark Insights 2010, 5, 9–20. [Google Scholar] [CrossRef] [PubMed]
- Dupré, M.P.; Courtade-Saidi, M. Immunocytochemistry as an adjunct to diagnostic cytology. Ann. Pathol. 2012, 32, e47–e51. [Google Scholar] [CrossRef] [PubMed]
- Lin, F.; Chen, Z. Standardization of diagnostic immunohistochemistry: Literature review and geisinger experience. Arch. Pathol. Lab. Med. 2014, 138, 1564–1577. [Google Scholar] [CrossRef] [PubMed]
- Roy-Chowdhuri, S. Immunocytochemistry of cytology specimens for predictive biomarkers in lung cancer. Translat. Lung Cancer Res. 2020, 9, 898–905. [Google Scholar] [CrossRef]
- Zhang, X.; Chen, L.; Liu, Y.; Xu, Y.; Zhang, X.; Shi, Y.; Wang, C.; Zhang, P.L.; Liu, Y. Improving the cytological diagnosis of high-grade serous carcinoma in ascites with a panel of complementary biomarkers in cell blocks. Cytopathology 2018, 29, 247–253. [Google Scholar] [CrossRef]
- Qamar, I.; Rehman, S.; Mehdi, G.; Maheshwari, V.; Ansari, H.A.; Chauhan, S. Utility of Cytospin and Cell Block Technology in Evaluation of Body Fluids and Urine Samples: A Comparative Study. J. Cytol. 2018, 35, 79–82. [Google Scholar]
- Miceska, S.; Škof, E.; Gašljević, G.; Kloboves-Prevodnik, V. Morphological and Immunocytochemical Characterization of Tumor Spheroids in Ascites from High-Grade Serous Carcinoma. Cells 2023, 12, 2390. [Google Scholar] [CrossRef]
- Shidham, V.B. CellBlockistry: Chemistry and art of cell-block making—A detailed review of various historical options with recent advances. Cytojournal 2019, 16, 12. [Google Scholar] [CrossRef]
- Marinšek, Z.P.; Nolde, N.; Kardum-Skelin, I.; Nizzoli, R.; Onal, B.; Rezanko, T.; Tani, E.; Ostović, K.T.; Vielh, P.; Schmitt, F.; et al. Multinational study of oestrogen and progesterone receptor immunocytochemistry on breast carcinoma fine needle aspirates. Cytopathology 2013, 24, 7–20. [Google Scholar] [CrossRef]
- Jesenko, T.; Modic, Z.; Kuhar, C.G.; Cemazar, M.; Matkovic, U.; Miceska, S.; Varl, J.; Kuhar, A.; Kloboves-Prevodnik, V. Morphological features of breast cancer circulating tumor cells in blood after physical and biological type of isolation. Radiol. Oncol. 2021, 55, 292–304. [Google Scholar] [CrossRef]
- Miceska, S.; Škof, E.; Novaković, S.; Stegel, V.; Jeričević, A.; Grčar Kuzmanov, B.; Smrkolj, Š.; Cvjetičanin, B.; Bebar, S.; Globočnik Kukovica, M.; et al. Cytopathological assessment is an accurate method for identifying immunophenotypic features and BRCA1/2 mutations of high-grade serous carcinoma from ascites. Cancer Cytopathol. 2023, 131, 188–197. [Google Scholar] [CrossRef]
- Srebotnik Kirbiš, I.; Us Krašovec, M.; Pogačnik, A.; Strojan Fležar, M. Optimization and validation of immunocytochemical detection of estrogen receptors on cytospins prepared from fine needle aspiration (FNA) samples of breast cancer. Cytopathology 2015, 26, 88–98. [Google Scholar] [CrossRef]
- Srebotnik Kirbiš, I.; Rodrigues Roque, R.; Bongiovanni, M.; Strojan Fležar, M.; Cochand-Priollet, B. Immunocytochemistry practices in European cytopathology laboratories—Review of European Federation of Cytology Societies (EFCS) online survey results with best practice recommendations. Cancer Cytopathol. 2020, 128, 757–766. [Google Scholar] [CrossRef]
- Wechtersbach, K. Immunocytochemical Assessment of Apoptosis in Cytology Samples of Conjunctival Epithelium. Master’s Thesis, Laboratory Biomedicine, University of Ljubljana, Ljubljana, Slovenia, 2016. [Google Scholar]
- Nishimura, R.; Okamoto, N.; Satou, M.; Kojima, K.; Tanaka, S. HER 2 immunohistochemistry for breast cancer cell blocks can be used in the same way as that used for histological specimens. Diagn. Cytopathol. 2016, 44, 274–279. [Google Scholar] [CrossRef] [PubMed]
- Kuhar, A. Immunocytochemical Stability of Antigens In-House Liquid-Based Medium. Master’s Thesis, Faculty of Farmacy, University of Ljubljana, Ljubljana, Slovenia, 2018. [Google Scholar]
- Diouf, D.; Diop, G.; Fall, C.; Sarr, S.; Diarra, C.A.T.; Ngom, A.I.; Ka, S.; Lo, S.; Faye, O.; Dem, A. The Association of Molecular Biomarkers in the Diagnosis of Cervical Pre-Cancer and Cancer and Risk Factors in Senegalese. Asian Pac. J. Cancer Prev. 2020, 21, 3221–3227. [Google Scholar] [CrossRef] [PubMed]
- Dodson, A. UK NEQAS for Immunocytochemistry & In-Situ Hybridisation, Participants’ Manual 2022–2023. Available online: https://ukneqashandi.org.uk/app/uploads/2022/06/Participant-Manual-2022-23-v19.0.pdf (accessed on 11 December 2023).
- Stevens, T.M.; Caughron, S.K.; Dunn, S.T.; Knezetic, J.; Gatalica, Z. Detection of high-risk HPV in head and neck squamous cell carcinomas: Comparison of chromogenic in situ hybridization and a reverse line blot method. Appl. Immunohistochem. Mol. Morphol. 2011, 19, 574–578. [Google Scholar] [CrossRef] [PubMed]
- Velasco-Vales, V.; Soria-Céspedes, D.; Cuesta-Mejías, T.C.; Padrón-Pérez, N.C. Immunohistochemistry, Quality Control, and Principles of Validation in the Central Nervous System. In Immunohistochemistry and Immunocytochemistry. Methods in Molecular Biology, 1st ed.; Del Valle, L., Ed.; Humana: New York, NY, USA, 2022; pp. 203–216. [Google Scholar]
- Koo, T.K.; Li, M.Y. A Guideline of Selecting and Reporting Intraclass Correlation Coefficients for Reliability Research. J. Chiropr. Med. 2016, 15, 155–163. [Google Scholar] [CrossRef] [PubMed]
- Hallgren, K.A. Computing inter-rater reliability for observational data: An overview and tutorial. Tutor. Quant. Methods Psychol. 2012, 8, 23–34. [Google Scholar] [CrossRef] [PubMed]
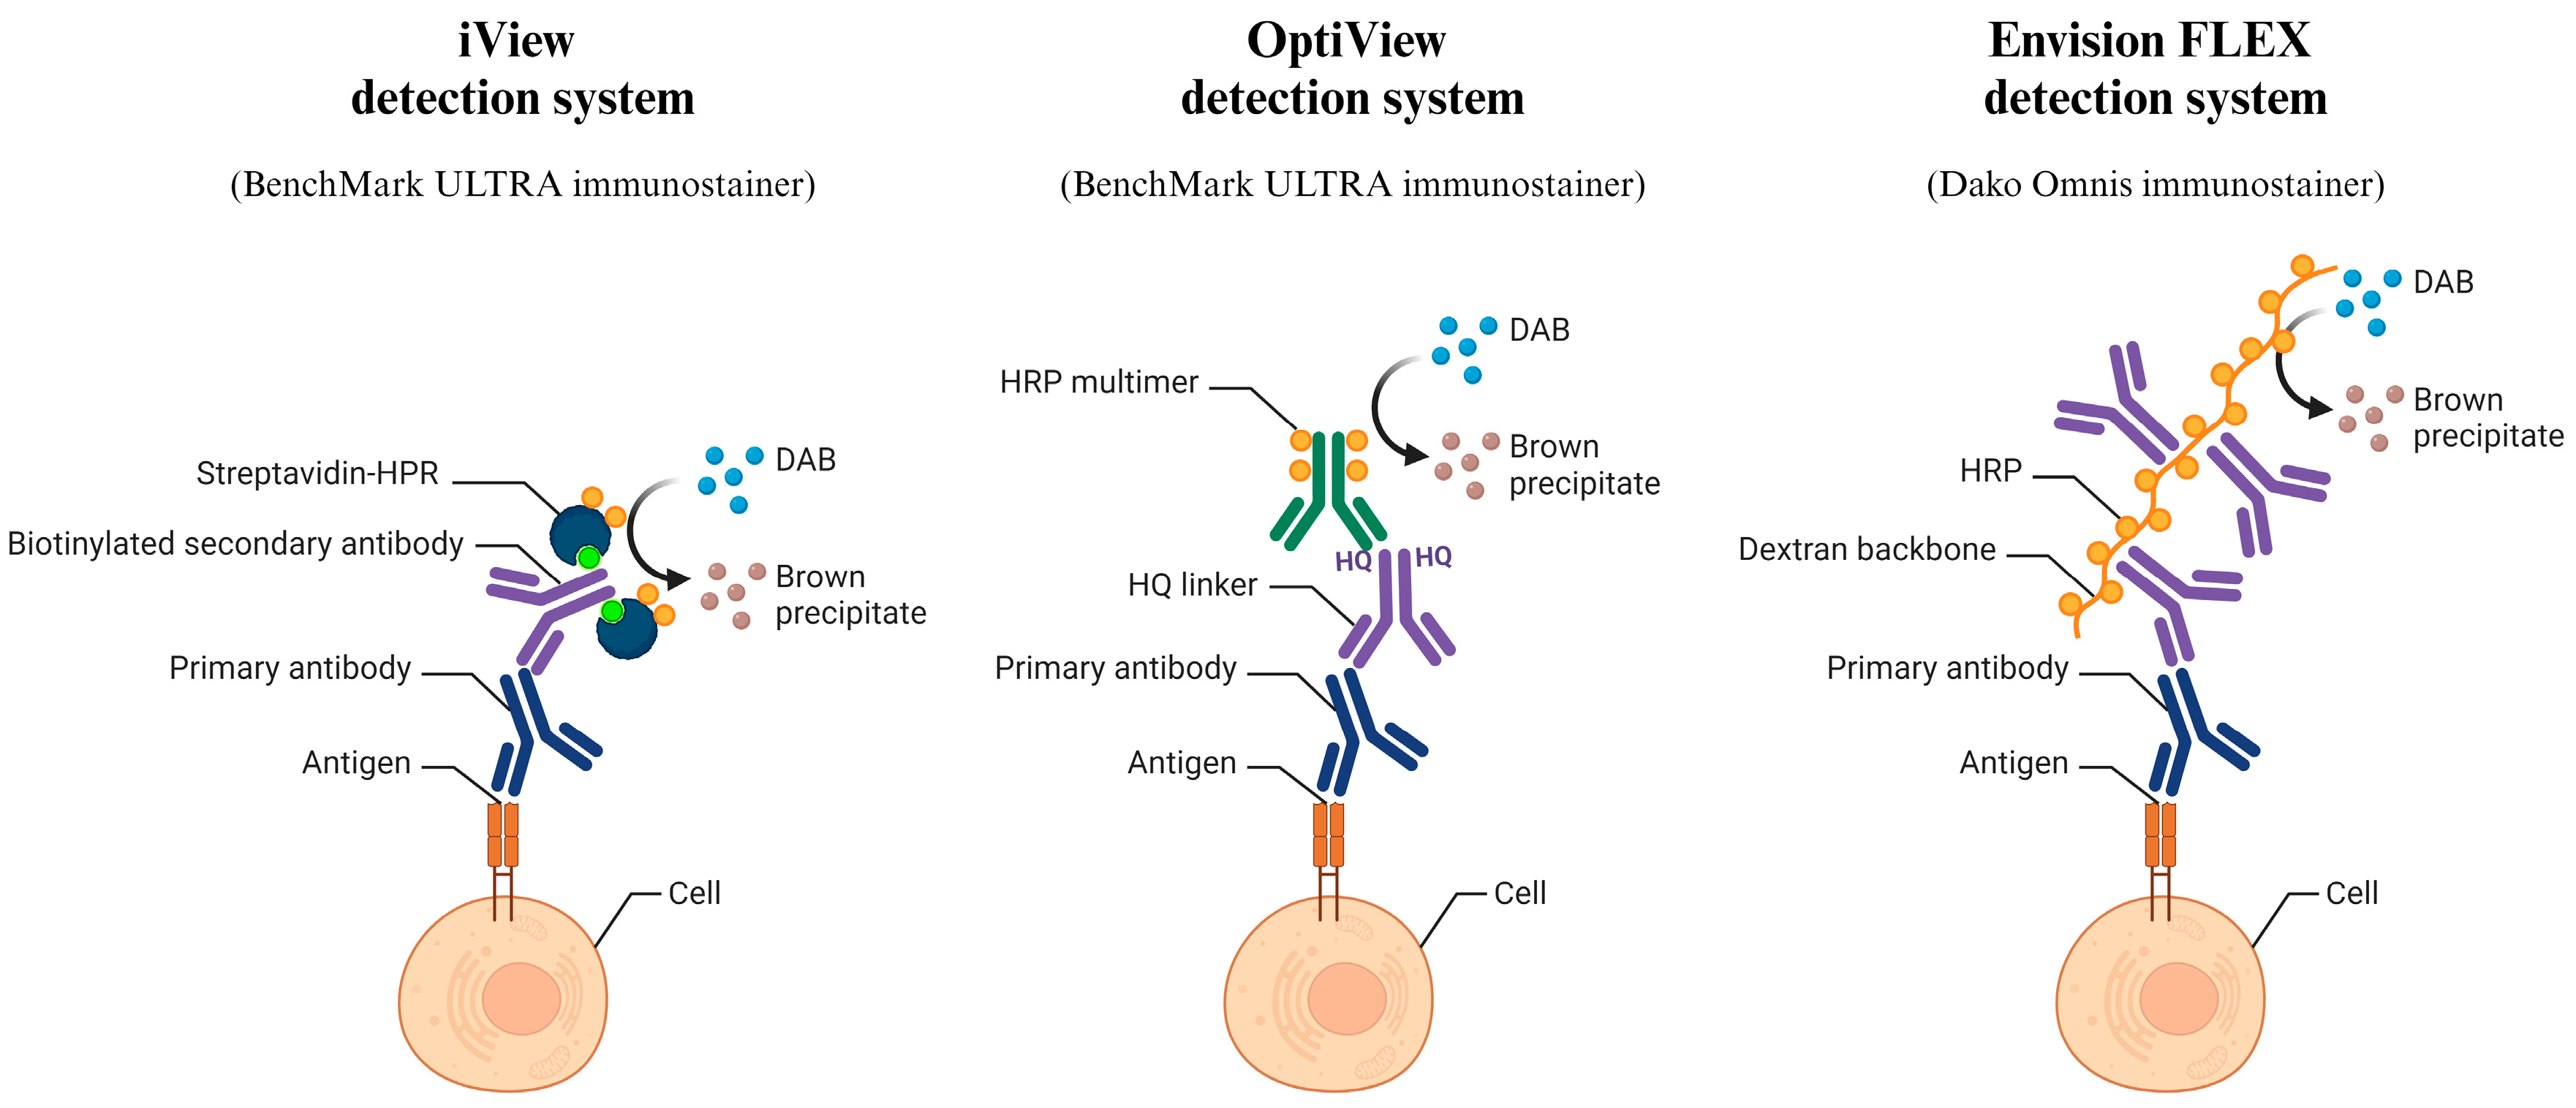
- Shojaeian, S.; Maslehat Lay, N.; Zarnani, A.H. Detection Systems in Immunohistochemistry; IntechOpen: London, UK, 2018. [Google Scholar] [CrossRef]
- Cerar, Š. Optimization of Immunocytochemistry Protocols for Samples Stored in Different Fixation Media and Processed by BD Totalys SlidePrep. Master’s Thesis, Biotehnical Faculty, University of Ljubljana, Ljubljana, Slovenia, 2021. [Google Scholar]
- Skaland, I.; Nordhus, M.; Gudlaugsson, E.; Klos, J.; Kjellevold, K.H.; Janssen, E.A.; Baak, J.P. Evaluation of 5 different labeled polymer immunohistochemical detection systems. Appl. Immunohistochem. Mol. Morphol. 2010, 18, 90–96. [Google Scholar] [CrossRef]
- Pohar Marinsek, Z. 60 Years of the Department of Cytopathology at the Institute of Oncology Ljubljana. Advances in Cythopathology: Bridge between Clinics and Diagnostic Pathology. 2012. Available online: https://plus.cobiss.net/cobiss/si/sl/bib/1402235 (accessed on 18 March 2024).
- Pinheiro, C.; Roque, R.; Adriano, A.; Mendes, P.; Praça, M.; Reis, I.; Pereira, T.; Srebotnik Kirbis, I.; André, S. Optimization of immunocytochemistry in cytology: Comparison of two protocols for fixation and preservation on cytospin and smear preparations. Cytopathology 2015, 26, 38–43. [Google Scholar] [CrossRef] [PubMed]
- Koomen, B.M.; de Boer, M.; van Dooijeweert, C.; van Lindert, A.S.R.; Deckers, I.A.G.; Voorham, Q.J.M.; Willems, S.M. Nationwide differences in cytology fixation and processing methods and their impact on interlaboratory variation in PD-L1 positivity. Virchows Arch. 2023, 482, 707–720. [Google Scholar] [CrossRef]
- Dunkenberger, L.; Del Valle, L. Antigen Retrieval and Signal Amplification. In Immunohistochemistry and Immunocytochemistry. Methods in Molecular Biology, 1st ed.; Del Valle, L., Ed.; Humana: New York, NY, USA, 2022; pp. 154–196. [Google Scholar]
- Ying, J.; Guo, L.; Qiu, T.; Shan, L.; Ling, Y.; Liu, X.; Lu, N. Diagnostic value of a novel fully automated immunochemistry assay for detection of ALK rearrangement in primary lung adenocarcinoma. Ann. Oncol. 2013, 24, 2589–2593. [Google Scholar] [CrossRef]
- Hutarew, G.; Hauser-Kronberger, C.; Strasser, F.; Llenos, I.C.; Dietze, O. Immunohistochemistry as a screening tool for ALK rearrangement in NSCLC: Evaluation of five different ALK antibody clones and ALK FISH. Histopathology 2014, 65, 398–407. [Google Scholar] [CrossRef]
- Wynes, M.W.; Sholl, L.M.; Dietel, M.; Schuuring, E.; Tsao, M.S.; Yatabe, Y.; Tubbs, R.R.; Hirsch, F.R. An international interpretation study using the ALK IHC antibody D5F3 and a sensitive detection kit demonstrates high concordance between ALK IHC and ALK FISH and between evaluators. J. Thorac. Oncol. 2014, 9, 631–638. [Google Scholar] [CrossRef] [PubMed]
- Krimer, P.M.; Haley, A.C.; Harvey, S.B.; Schatzberg, S.J. Evaluation of cytospin precision in low cellularity canine cerebrospinal fluid. Vet. Diagn. Investig. 2016, 28, 158–164. [Google Scholar] [CrossRef] [PubMed]
- Gupta, B.; Yang, G.; Petrauskene, O.; Key, M. Recent Advances in Chromogens for Immunohistochemistry. Methods Mol. Biol. 2023, 2593, 35–50. [Google Scholar] [PubMed]
- Davey, R.X. Codes of Ethics for Laboratory Medicine: Definition, Structure and Procedures—A Narrative Review Based on Existing National Codes. EJIFCC 2020, 31, 262–273. [Google Scholar]
- Pinto, D.; Schmitt, F.C. Immunohistochemistry Applied to Breast Cytological Material. Pathobiology 2022, 89, 343–358. [Google Scholar] [CrossRef]
- Brozic, A.; Pohar Marinsek, Z.; Bucek, S.; Cemazar, M.; Kloboves Prevodnik, V. Usefulness of Bcl-2 Expression and the Expression of Cytoplasmic Immunoglobulin Light Chains in the Differentiation between B-Cell Lymphoma and Reactive Lymphocytic Proliferations in FNA. Int. J. Mol. Sci. 2019, 20, 2648. [Google Scholar] [CrossRef]
- Burry, R.W. Controls for immunocytochemistry: An update. J. Histochem. Cytochem. 2011, 59, 6–12. [Google Scholar] [CrossRef]
- Pagliuca, F.; Ronchi, A.; Cozzolino, I.; Montella, M.; Zito Marino, F.; Franco, R. Mesenchymal neoplasms: Is it time for cytology? New perspectives for the pre-operative diagnosis of soft tissue tumors in the molecular era. Pathol. Res. Pract. 2020, 216, 152923. [Google Scholar] [CrossRef] [PubMed]


| Diagnostic Marker | Immunostainer | Clone | Manufacturer | Localization | Target Cell for Positive Reaction |
|---|---|---|---|---|---|
| Calretinin | BenchMark ULTRA | SP4 | Roche Diagnostics | cytoplasm, nucleus | mesothelial cells, mesothelioma cells |
| Dako Omnis | DAK-Calret1 | Agilent Technologies | cytoplasm | ||
| Epithelial cellular adhesion molecule (EpCAM) | BenchMark ULTRA, Dako Omnis | Ber-EP4 | Agilent Technologies | cytoplasm | epithelial malignant cells |
| EpCAM | BenchMark ULTRA, Dako Omnis | MOC-31 | Dako | cytoplasm | epithelial malignant cells |
| Cytokeratin AE1/AE3 (CKAE1/AE3) | BenchMark ULTRA, Dako Omnis | CK AE1/AE3 | Dako, Agilent Technologies | cytoplasm | epithelial cells, including normal and malignant cells |
| Cytokeratin CK 5/6 (CK5/6) | BenchMark ULTRA, Dako Omnis | D5/16 B4 | Dako, Agilent Technologies | cytoplasm | epithelial cells, including normal and malignant cells |
| CD68 | BenchMark ULTRA, Dako Omnis immunostainer | PG-M1 | Dako | cytoplasm | macrophages |
| Leukocyte common antigen (LCA (CD45)) | BenchMark ULTRA, Dako Omnis | 2B11 + PD7/26 | Dako, Agilent Technologies | membrane | immune cells |
| Desmin | BenchMark ULTRA, Dako Omnis | D33 | Dako | cytoplasm | malignant cells with myogenic differentiation |
| Human bone marrow endothelium marker-1 (HBME-1) | BenchMark ULTRA, Dako Omnis | HBME-1 | Dako | cytoplasm, membrane | mesothelial cells, mesothelioma cells |
| Wilms’ tumor protein 1 (WT1) | BenchMark ULTRA, Dako Omnis | 6F-H2 | Cell Marque, Dako | nucleus | epithelial cells, including normal and malignant cells |
| Detection System | iView * | OptiView | EnVision FLEX | ||||||
|---|---|---|---|---|---|---|---|---|---|
| Diagnostic marker | Ab dilution | Ab dilution | Ab incubation time (min) | TR | Amplification | Ab dilution | Ab incubation time (min) | Ag retrieval | Mouse Linker |
| Calretinin | RTU | RTU | 8 16 32 | none CC1 CC2 | Yes | RTU | 30 | none | No |
| Ber-EP4 | 1:500 | 1:25 1:50 1:100 1:500 1:1000 | 8 16 32 | none CC1 | Yes | RTU | 30 | L pH, 97 °C, 10 min | No |
| MOC-31 | 1:500 | 1:50 1:100 1:500 1:1000 | 8 16 32 | none CC1 | Yes | 1:50 1:100 | 30 | L pH, 97 °C, 10 min | No |
| CK AE1/AE3 | 1:500 | 1:500 | 8 16 32 | none CC1 | No | RTU | 5 10 | none L pH, 65 °C, 10 min L pH, 97 °C, 10 min H pH, 65 °C, 10 min H pH, 97 °C, 10 min | No |
| CK 5/6 | 1:10 | 1:10 | 8 16 32 | none CC1 | No | RTU | 30 | none L pH, 65 °C, 10 min L pH, 97 °C, 10 min H pH, 65 °C, 10 min H pH, 97 °C, 10 min | No |
| CD68 | 1:200 | 1:200 | 16 32 | none | No | 1:100 1:200 | 20 30 | none L pH, 97 °C, 10 min | No |
| LCA | 1:1000 | 1:1000 | 8 16 32 | none CC1 | No | RTU | 10 20 | none L pH, 97 °C, 10 min | No |
| Desmin | 1:1000 | 1:1000 | 16 32 | none CC1 | No | 1:100 1:500 1:1000 | 30 | none L pH, 97 °C, 10 min H pH, 65 °C, 10 min H pH, 97 °C, 10 min | No |
| HBME-1 | 1:50 | 1:50 | 8 16 32 | none CC1 CC2 | No | 1:50 1:100 | 20 | none L pH, 65 °C, 10 min L pH, 97 °C, 10 min H pH, 65 °C, 10 min H pH, 97 °C, 10 min | No |
| WT1 | 1:200 | 1:100 1:500 | 32 | CC1 | Yes | RTU | 30 | L pH, 65 °C, 10 min L pH, 97 °C, 10 min H pH, 65 °C, 10 min H pH, 97 °C, 10 min | Yes |
| Diagnostic Marker | Sample Type Used for the Staining * | Patient Diagnoses |
|---|---|---|
| Calretinin | abdominal effusions, pleural effusions, washings from the abdomen | atypical mesothelial proliferation, adenocarcinomas |
| Ber-EP4 | abdominal effusions, pleural effusions, washings from the pouch of Douglas | lung-, breast-, ovarian adenocarcinoma |
| MOC-31 | abdominal effusions, pleural effusions, washings from the pouch of Douglas | lung-, breast-, ovarian adenocarcinoma |
| CK AE1/AE3 | abdominal and pleural effusions | lung-, breast-, ovarian adenocarcinoma |
| CK 5/6 | abdominal and pleural effusions | atypical mesothelial proliferation, lung-, breast-, ovarian adenocarcinoma |
| CD68 | abdominal effusions, pleural effusions, washings from the pouch of Douglas | atypical mesothelial proliferation |
| LCA | abdominal effusions, pleural effusions, effusions in the pouch of Douglas, FNABs | inflammation, ovarian adenocarcinoma, non-Hodgkin’s lymphoma |
| Desmin | pleural effusions | atypical mesothelial proliferation |
| HBME-1 | abdominal effusions, pleural effusions, abdomen washings, effusions in the pouch of Douglas | atypical mesothelial proliferation |
| WT1 | abdominal effusions, pleural effusions, effusions in the pouch of Douglas, FNABs | atypical mesothelial proliferation, ovarian adenocarcinoma |
| iV | OV | EnV | iV | OV | EnV | ||||
|---|---|---|---|---|---|---|---|---|---|
| Median (Range) | Median (Range) | ||||||||
| Calretinin | NEQAS | 14.5 (11–15) | 20.0 (16–20) | 16.0 (15–19) | CD68 | NEQAS | 17.0 (11–19) | 18.5 (14–20) | 17.0 (16–20) |
| Staining | 22 (4–50) | 24 (5–50) | 23 (5–50) | Staining | 64 (28–89) | 70.5 (33–89) | 65.5 (14–89) | ||
| Intensity | 2 (1–2) | 3 (2–3) | 2.25 (2–3) | Intensity | 2 (1.5–3) | 3 (2–3) | 2.25 (2–3) | ||
| Background | 1 (0.5–1) | 0 (0–1) | 1 (0–1) | Background | 0 (0–1) | 0 (0–1) | 0 (0–0.5) | ||
| Counterstain | 0 (0–0) | 0 (0–0) | 0 (0–0) | Counterstain | 0.1 (0–1) | 0 (0–0) | 0.1 (0–1) | ||
| Morphology | 0 (0–0) | 0 (0–0) | 0 (0–0) | Morphology | 0 (0–0) | 0.1 (0–1) | 0 (0–0) | ||
| Ber–EP4 | NEQAS | 15.5 (13–19) | 19.0 (15–20) | 16.5 (15–19) | LCA | NEQAS | 15.0 (13–17) | 17.0 (13–20) | 16.5 (13–19) |
| Staining | 39 (10–99) | 36.5 (10–99) | 34 (10–99) | Staining | 79 (15–99) | 85.5 (23–100) | 89.5 (23–100) | ||
| Intensity | 2.25 (2–3) | 3 (3–3) | 2 (2–2.5) | Intensity | 2 (2–2.5) | 3 (2.5–3) | 3 (2–3) | ||
| Background | 0.5 (0–1) | 0 (0–1) | 0 (0–1) | Background | 0.25 (0–1) | 0.25 (0–1.5) | 1 (0–1) | ||
| Counterstain | 0.2 (0–1) | 0 (0–0) | 0 (0–0) | Counterstain | 0 (0–0) | 0 (0–0) | 0.1 (0–1) | ||
| Morphology | 0.1 (0–1) | 0 (0–0) | 0 (0–0) | Morphology | 0.3 (0–1) | 0.3 (0–1) | 0 (0–0) | ||
| MOC–31 | NEQAS | 16.0 (12–18) | 18.5 (15–20) | 17.0 (15–18) | Desmin | NEQAS | 15.5 (12–19) | 16.0 (15–20) | 13.0 (4–16) |
| Staining | 45 (10–100) | 34 (10–99) | 35.5 (10–99) | Staining | 2 (1–30) | 7.5 (1–35) | 1.5 (1–93) | ||
| Intensity | 2 (2–3) | 3 (3–3) | 2 (2–3) | Intensity | 2 (1–3) | 3 (2.5–3) | 2 (0–3) | ||
| Background | 0.5 (0–1) | 0 (0–1) | 0.25 (0–1) | Background | 0 (0–1) | 1 (0–1) | 1 (1–1.5) | ||
| Counterstain | 0.2 (0–1) | 0 (0–0) | 0 (0–0) | Counterstain | 0.2 (0–1) | 0.2 (0–1) | 0 (0–0) | ||
| Morphology | 0.1 (0–1) | 0 (0–0) | 0 (0–0) | Morphology | 0.1 (0–1) | 0 (0–0) | 0 (0–0) | ||
| CK AE1/AE3 | NEQAS | 14.5 (10–18) | 18.0 (16–20) | 16.0 (13–18) | HBME–1 | NEQAS | 12.0 (11–14) | 13.5 (11–16) | 13.8 (13–16) |
| Staining | 33 (3–99) | 33 (3–99) | 36.5 (3–99) | Staining | 20.5 (3–43) | 21.5 (4–43) | 13 (2–33) | ||
| Intensity | 2 (2–2.5) | 3 (2.5–3) | 2.5 (2–3) | Intensity | 2 (2–2) | 3 (2–3) | 2 (1–2) | ||
| Background | 1 (0–1) | 0.25 (0–1) | 0.5 (0–1) | Background | 1.75 (1–2) | 2 (1–2) | 1 (0–2) | ||
| Counterstain | 0.3 (0–1) | 0 (0–0) | 0.5 (0–1) | Counterstain | 0 (0–0) | 0.2 (0–1) | 0 (0–0) | ||
| Morphology | 0.2 (0–1) | 0 (0–0) | 0 (0–0) | Morphology | 0 (0–0) | 0.2 (0–1) | 0 (0–0) | ||
| CK 5/6 | NEQAS | 14.5 (9–20) | 18.5 (17–20) | 14.5 (11–18) | WT1 | NEQAS | 15.5 (11–17) | 18.5 (13–20) | 13.0 (11–16) |
| Staining | 4.5 (1–93) | 5.5 (2–43) | 5.5. (2–40) | Staining | 41 (3–82) | 46.5 (6–82) | 49 (6–82) | ||
| Intensity | 2 (1–2) | 3 (3–3) | 3 (2–3) | Intensity | 2 (1.5–2) | 3 (3–3) | 2 (2–2.5) | ||
| Background | 1 (0–1) | 0 (0–1) | 1 (0–2) | Background | 0.5 (0–1) | 0.25 (0–1) | 1 (1–2) | ||
| Counterstain | 0.1 (0–1) | 0 (0–0) | 0.2 (0–1) | Counterstain | 0.3 (0–1) | 0.2 (0–1) | 0.3 (0–1) | ||
| Morphology | 0.1 (0–1) | 0.1 (0–1) | 0.2 (0–1) | Morphology | 0.1 (0–1) | 0.3 (0–1) | 0.1 (0–1) | ||
| iV/OV | iV/EnV | Ov/EnV | iV/OV | iV/EnV | Ov/EnV | ||||
|---|---|---|---|---|---|---|---|---|---|
| p Value | p Value | ||||||||
| Calretinin | NEQAS | <0.001 | 0.002 | 0.002 | CD68 | NEQAS | NS | NS | NS |
| Staining | NS | NS | NS | Staining | NS | NS | NS | ||
| Intensity | 0.003 | 0.031 | 0.019 | Intensity | 0.012 | NS | NS | ||
| Background | 0.010 | NS | NS | Background | NS | NS | NS | ||
| Counterstain | NS | NS | NS | Counterstain | NS | NS | NS | ||
| Morphology | NS | NS | NS | Morphology | NS | NS | NS | ||
| Ber–EP4 | NEQAS | 0.001 | NS | 0.004 | LCA | NEQAS | NS | NS | NS |
| Staining | NS | NS | NS | Staining | 0.014 | 0.011 | 0.017 | ||
| Intensity | 0.012 | NS | 0.004 | Intensity | 0.005 | 0.007 | NS | ||
| Background | NS | NS | NS | Background | NS | NS | NS | ||
| Counterstain | NS | NS | NS | Counterstain | NS | NS | NS | ||
| Morphology | NS | NS | NS | Morphology | NS | NS | NS | ||
| MOC–31 | NEQAS | 0.017 | NS | NS | Desmin | NEQAS | NS | 0.036 | 0.005 |
| Staining | NS | NS | NS | Staining | 0.029 | NS | 0.029 | ||
| Intensity | 0.007 | NS | 0.020 | Intensity | 0.013 | NS | 0.009 | ||
| Background | NS | NS | NS | Background | NS | 0.007 | NS | ||
| Counterstain | NS | NS | NS | Counterstain | NS | NS | NS | ||
| Morphology | NS | NS | NS | Morphology | NS | NS | NS | ||
| CK AE1/AE3 | NEQAS | 0.004 | 0.005 | 0.004 | HBME–1 | NEQAS | NS | 0.019 | NS |
| Staining | NS | NS | NS | Staining | NS | NS | 0.028 | ||
| Intensity | 0.004 | 0.012 | 0.045 | Intensity | 0.006 | NS | 0.006 | ||
| Background | NS | NS | NS | Background | NS | NS | NS | ||
| Counterstain | NS | NS | 0.044 | Counterstain | NS | NS | NS | ||
| Morphology | NS | NS | NS | Morphology | NS | NS | NS | ||
| CK 5/6 | NEQAS | 0.002 | NS | 0.003 | WT1 | NEQAS | 0.007 | 0.030 | 0.002 |
| Staining | NS | NS | NS | Staining | NS | NS | NS | ||
| Intensity | 0.006 | 0.012 | NS | Intensity | 0.003 | NS | 0.004 | ||
| Background | NS | NS | NS | Background | NS | 0.012 | 0.013 | ||
| Counterstain | NS | NS | NS | Counterstain | NS | NS | NS | ||
| Morphology | NS | NS | NS | Morphology | NS | NS | NS | ||
Disclaimer/Publisher’s Note: The statements, opinions and data contained in all publications are solely those of the individual author(s) and contributor(s) and not of MDPI and/or the editor(s). MDPI and/or the editor(s) disclaim responsibility for any injury to people or property resulting from any ideas, methods, instructions or products referred to in the content. |
© 2024 by the authors. Licensee MDPI, Basel, Switzerland. This article is an open access article distributed under the terms and conditions of the Creative Commons Attribution (CC BY) license (https://creativecommons.org/licenses/by/4.0/).
Share and Cite
Dremelj, A.; Miceska, S.; Kuhar, A.; Nolde, N.; Kloboves-Prevodnik, V. Validation and Implementation of OptiView and EnVision FLEX Detection Systems for Immunocytochemical Staining Protocols of the Ten Most Commonly Used Diagnostic Markers in Routine Cytopathological Practice. Diagnostics 2024, 14, 657. https://doi.org/10.3390/diagnostics14060657
Dremelj A, Miceska S, Kuhar A, Nolde N, Kloboves-Prevodnik V. Validation and Implementation of OptiView and EnVision FLEX Detection Systems for Immunocytochemical Staining Protocols of the Ten Most Commonly Used Diagnostic Markers in Routine Cytopathological Practice. Diagnostics. 2024; 14(6):657. https://doi.org/10.3390/diagnostics14060657
Chicago/Turabian StyleDremelj, Anja, Simona Miceska, Anamarija Kuhar, Natasa Nolde, and Veronika Kloboves-Prevodnik. 2024. "Validation and Implementation of OptiView and EnVision FLEX Detection Systems for Immunocytochemical Staining Protocols of the Ten Most Commonly Used Diagnostic Markers in Routine Cytopathological Practice" Diagnostics 14, no. 6: 657. https://doi.org/10.3390/diagnostics14060657
APA StyleDremelj, A., Miceska, S., Kuhar, A., Nolde, N., & Kloboves-Prevodnik, V. (2024). Validation and Implementation of OptiView and EnVision FLEX Detection Systems for Immunocytochemical Staining Protocols of the Ten Most Commonly Used Diagnostic Markers in Routine Cytopathological Practice. Diagnostics, 14(6), 657. https://doi.org/10.3390/diagnostics14060657