1. Introduction
In the context of an aging and labor-short construction industry [
1], overage workers (OWs) are commonly employed at construction sites when a huge demand for workers is present. Considering the extra safety threats posed by OWs [
2,
3], governments and scholars have paid close attention to this group. Overage workers generally have poorer physical capabilities [
4,
5] and are more vulnerable to serious injuries [
6,
7] than younger workers. Hence, regulatory authorities in Shanghai [
8] and Jiangsu [
9] have issued policies to prohibit workers above the retirement age from engaging in construction positions. And the adverse impact of hiring OWs on the contractor’s credit is also highlighted.
Despite the growing focus on OWs, current research exhibits significant deficiencies. Primarily, the supervision of OWs is rarely emphasized. Currently, there is no unified definition of OWs [
10], and studies mainly concentrate on the physical [
11,
12] and mental health [
13] of “elderly construction workers”. Due to the poor performance in health and safety, the presence of OWs is perceived as an important risk factor at construction sites [
2]. However, the existing literature lacks in-depth discussions on supervisory measures for this group. Secondly, variances in the contractor’s risk perception (RP) are frequently overlooked. Contractors are concerned about the risk associated with the overaged, thus implementing management based on project conditions and supervision status. It is found that the contractor’s behavior is affected not only by risk, but also by their attitude towards risk (i.e., risk perception [
14]) [
15,
16]. Differences in risk perception [
14] resulting in varied responses: contractors with more intense RP tend to avoid risk, while those with weaker RP may disregard it [
17]. Hence, clarifying the contractor’s RP is essential for stakeholders to make proper decisions [
18]. On account of the limited measurement methods, targeted strategies that consider risk perception difference are rarely proposed, leading to supervisory effects deviating from the ideal state [
19].
To address the deficiencies, this study aims to develop an approach for measuring the contractor’s RP. With this method, supervisory parties are allowed to select factors for identifying the bias in the contractor’s RP, and to propose proper strategies for overseeing OWs, thereby reducing their supervision costs.
2. Research Framework
Evolutionary Game Theory has been widely utilized to analyze practical issues within the construction safety supervision field [
20,
21], which is also suitable for this study. Contractors diligently manage workers in general, but may secretly employ the overaged when encountering labor shortage. Supervisors carry out inspections to address this issue, but may relax inspection on accounting of the extra costs. The Construction Project Quality and Safety Supervision and Management Station [
22] (denoted as “regulator” in short) is delegated by the government to perform spot inspections on contractors and supervisors. For regulators, their supervision frequency is decided by the contractor’s and supervisor’s historical performance. With the mutual constraints among three parties, a tripartite evolutionary game is formed [
23]. In this study, Evolutionary Game Theory is adopted as the foundation for analyzing supervisory strategies.
To observe impacts of the contractor’s RP on their strategic choice, the methodology for examining their RP should be clarified initially. The scale-based method has been universally used for risk perception measurement. By comparing participants’ risk evaluations for themselves and others, their RP can be quantified [
24]. When people believe they have a lower probability of loss (or higher probability of gains) than others, optimistic biases are demonstrated; conversely, pessimistic biases can be seen [
25]. However, later studies discovered flaws in the traditional method. Wolff, Larsen, and Ogaard [
26] indicated that people’s inherent risk perception biases can affect their judgements. Ng and Rayner [
27] noticed the limited interpretability of scale-based measurements, and underscored the contributions of the individual’s historical behavior to identify their RP, which has gained wide support. In the construction management field, Liu, Lin, and Feng [
28] demonstrated the correlation between contractors’ insurance purchasing behavior and their RP. Lu and Yan [
29] selected insurance purchasing, worker training, and safety management measures to investigate contractors’ perceived risk. Studies in other fields (e.g., transportation [
30]) also stand by the stated view. Liu et al. [
31] conducted a literature review and found that certain indicators—derived from driving behaviors and vehicle trajectories—could reflect the driver’s RP. Hence, this study summarizes potential indicators by investigating the process of worker safety management and related normative documents, and screens qualified indicators based on multiple criteria. With the quantification method, the contractor’s RP can be quantified.
Generally, the contractor’s perceived risk can be measured by multiplying probabilities with losses [
14,
32], or by directly inquiring their estimates [
33,
34]. However, both methods require questionnaire surveys, making them cumbersome and unsuitable for this research. Moreover, results from the former method have limited capability to predict the contractor’s future behavior [
29], and those from the latter method face difficulties in directly reflecting the risk perception. To better observe the influence of the contractor’s RP, this study defines the coefficient of risk perception to calculate the perceived risk.
Moreover, considering the linkage between OWs and risk, this study analyzes the number of remaining OWs. With the definition of the players’ cognition and inspection capabilities concerning OWs, it determines risk utilities across eight game situations.
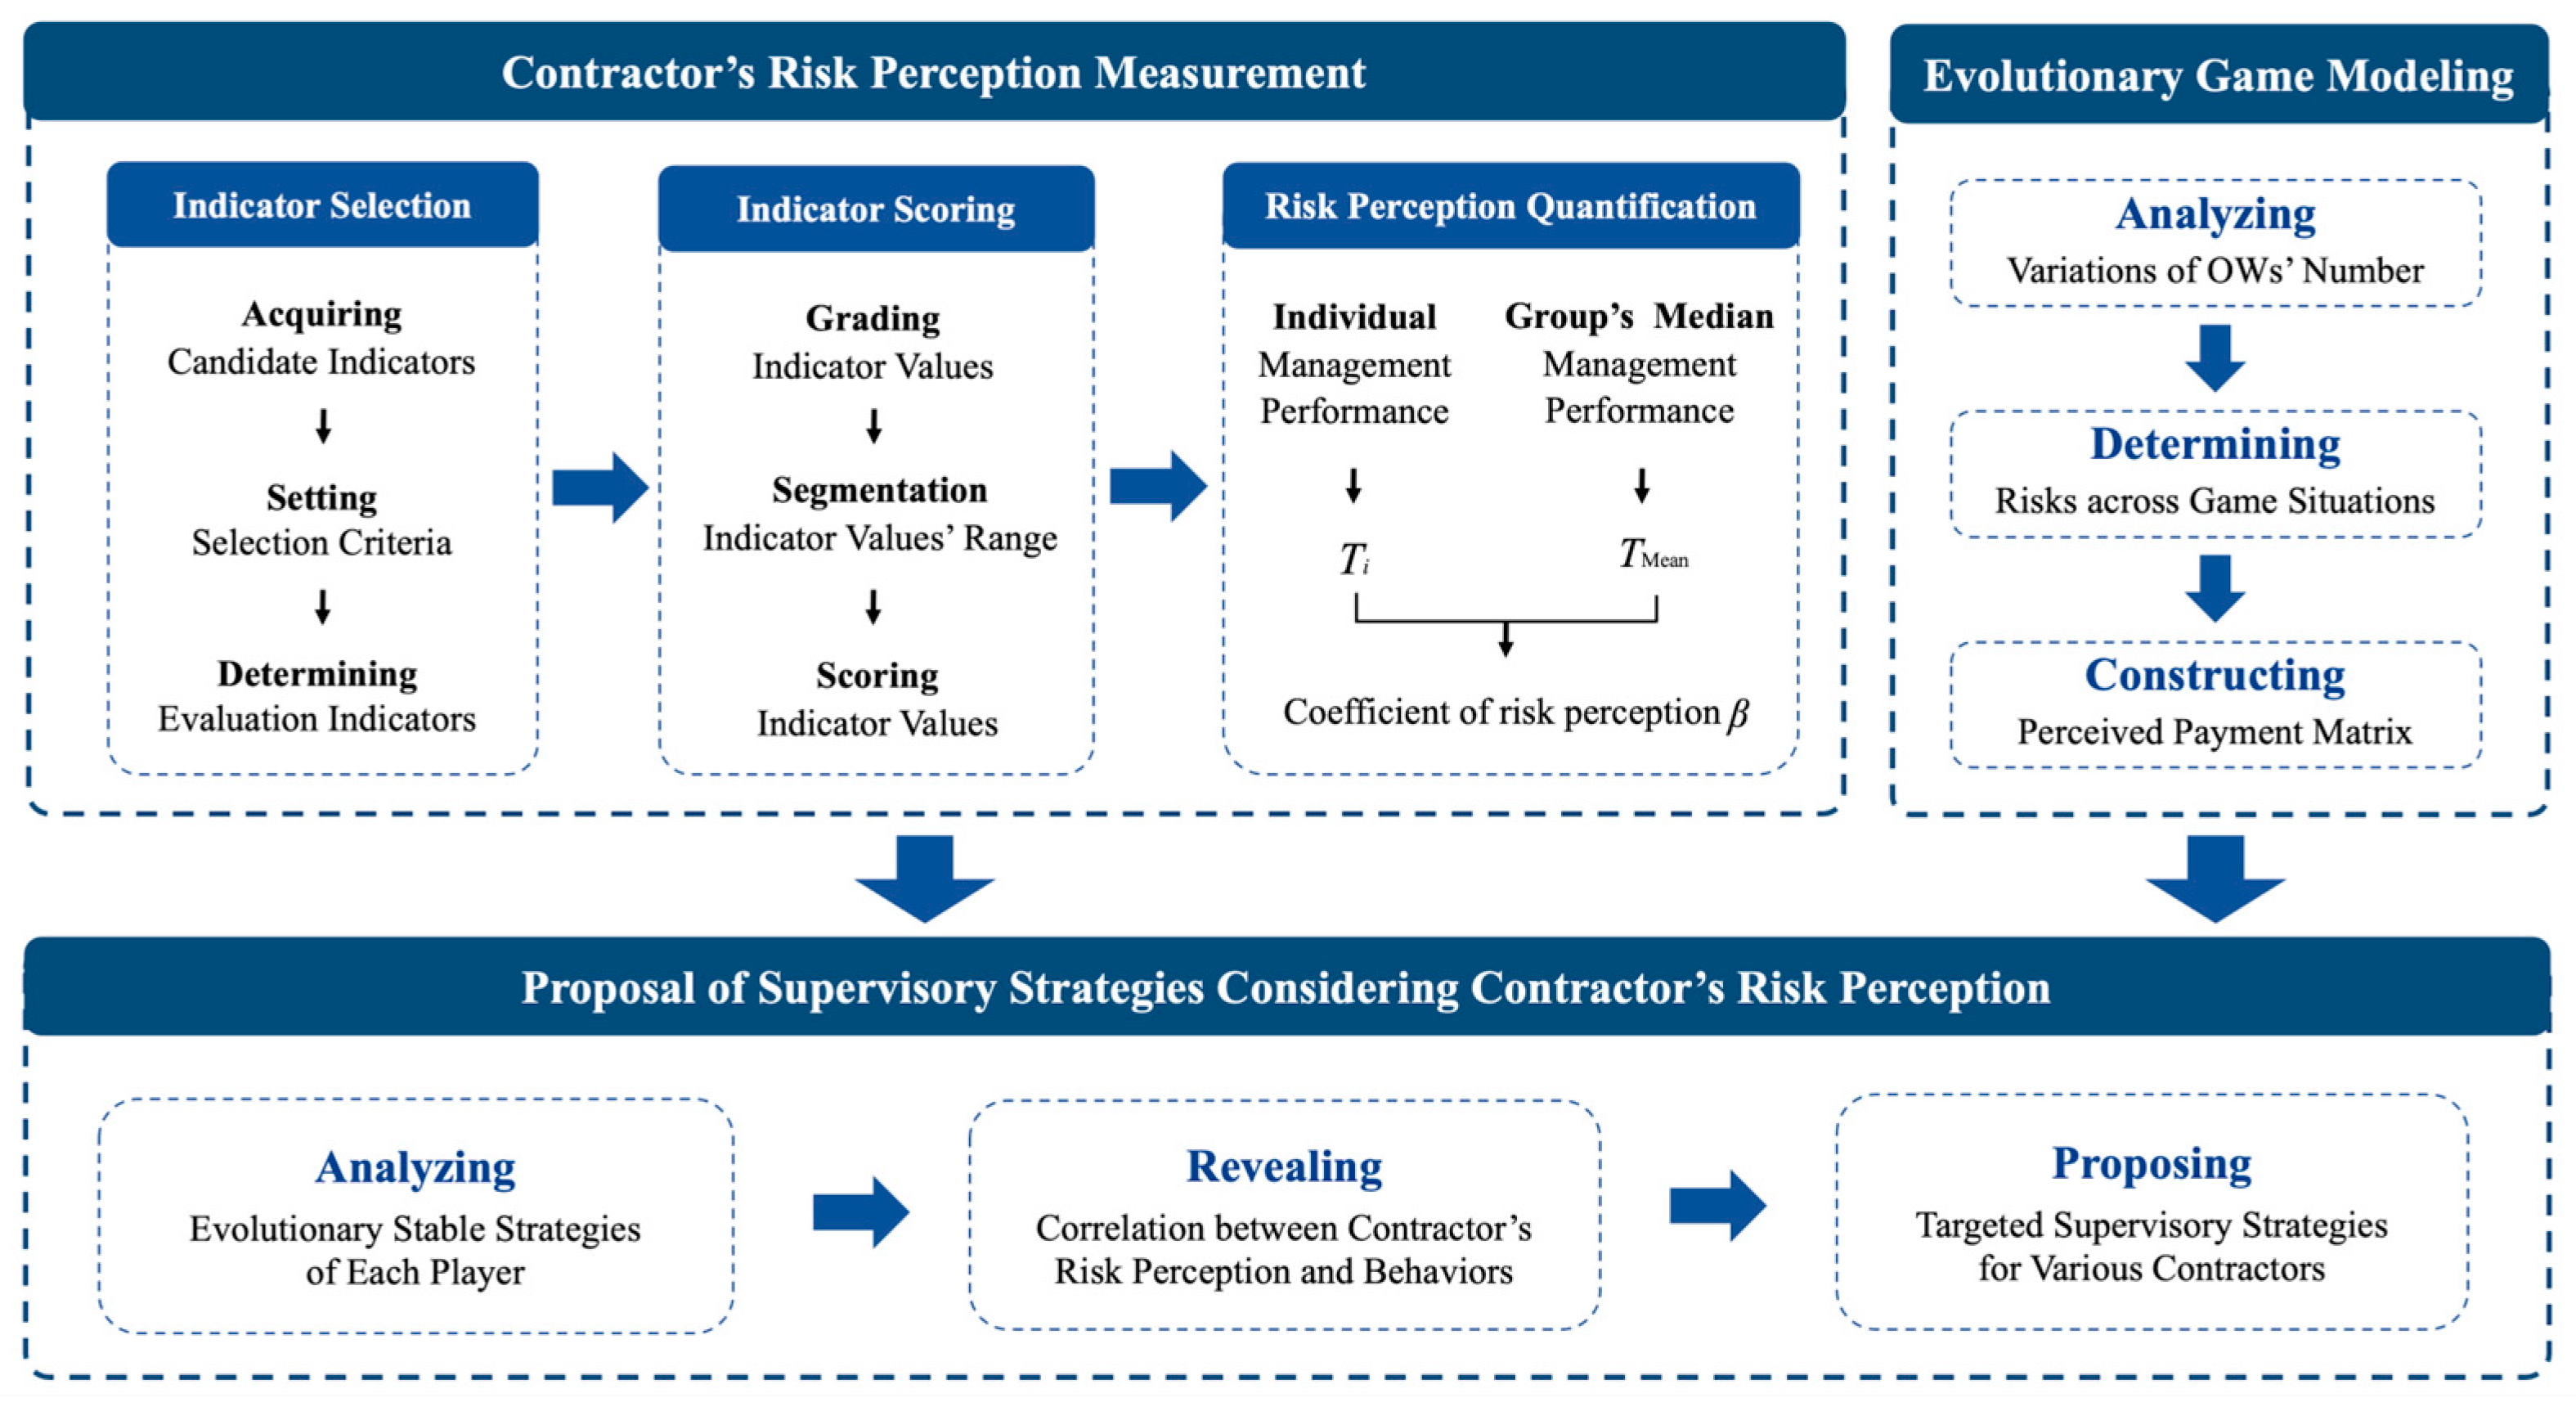
The technical roadmap of this study is shown in
Figure 1. Initially, indicators for the contractor’s RP measurement are given by management practices and normative documents, and screened by certain standards. By scoring the values of indicators, the contractor’s RP is quantified by comparing the individual’s behavior and that of the group’s median (
Section 3). Secondly, the risk utilities of players across situations are determined according to variations in the OWs’ proportion, thereby building the tripartite evolutionary game (
Section 4.1 and
Section 4.2). Finally, by analyzing the players’ evolutionarily stable strategies, the correlation between the contractor’s RP and behavior is revealed, and differentiated supervision strategies are proposed (
Section 4.3 and
Section 5).
3. Measuring the Contractor’s Risk Perception
To clarify the definition of associated parties, the contractor is considered as a construction company that is aware of existing regulations and the consequences of noncompliance, but still employs OWs. The observer is determined as a relevant party performing direct inspections on the contractor (e.g., the supervisor, the regulator, etc.). Meanwhile, the observation scenario is taken as the period during the project’s rush.
3.1. Identification and Screening of Indicators
During project rush periods, the overaged may blend in with temporary workers. Consequently, the contractor implements measures to administer workers in the following phases: before, during, and after workers enter the construction site. Before entry, the contractor may organize physical examinations [
35] to exclude diseased workers, sign contracts [
36] with workers, and enhance training [
37,
38] and real-name registration [
39] for the recruited. Upon entry, the contractor is likely to ensure all workers passing through the real-name verification channel [
39]. After entry, the contractor may conduct safety patrols on the site [
40,
41]. In addition, to comply with regulations, contractors may verify the alignment of the worker and bank account owner [
36]. By investigating laws, regulations, and policies, this study summarizes the contractor’s worker management behavior, and analyzes the corresponding exposure pathways for overage workers. If a contractor perceives higher risk, their inspection measures are more stringent, leading to a greater proportion of overage workers exposed and lower accident risks. With these exposure pathways, nine factors that can reflect the contractor’s efforts are identified as candidate indicators for measuring RP (
Table 1).
By assessing the correlation, validity, availability, and measurability of candidate indicators, qualified indicators can be determined.
Correlation: Whether values of the indicator are associated with the risk perception of contractors [
42]. In
Table 1, there is a notable correlation between the contractor’s perceived risk and the observed values of indicators a and c-h. For example, the higher proportion of physically examined workers displays the contractor’s stronger awareness of worker-related accident prevention, revealing the higher risk the contractor perceives concerning accidents. For indicators b and i, the correlation is slightly weaker than the others, since direct inspections of workers are not included among these indicators.
Validity: Whether the indicator observation results are precise [
43] and contribute to illustrate the contractor’s willingness concerning management. According to interviews with managers from construction enterprises, it is easy for contractors to manipulate the process of contracting construction workers. This indicates that the proportion of workers who have signed a contract (i.e., indicator b) may not accurately reflect the contractor’s true intentions of managing workers.
Availability: Whether the values of the indicator can be easily acquired and observed by the external observer [
44]. Typically, both physical examination and wages payment for construction workers are executed by the contractor internally, making it challenging to observe externally. As a result, it is hard to obtain the values of indicators a, h, and i.
Measurability: Whether the indicator can be measured by observers without effort [
42,
45]. For indicator h, it is nearly impossible to count the number of bank accounts verified by the contractor. On the contrary, the values of indicators a-g and i can be collected by record examination, on-site investigation, and accessing data from the real-name system.
To ensure the reliability of measurement, qualified indicators are required to be (1) highly associated with the contractor’s risk perception [
46]; (2) able to grasp accurate and reliable results through observations [
47]; and (3) measurable and easy to acquire [
48]. Based on the previous analysis, the assessment of all candidate indicators is summarized in
Table 2. Eventually, indicators c–g are determined.
3.2. Quantification of Risk Perception
For a contractor’s individual management performance, observers can acquire the values of indicators using the collection methods listed in
Table 3.
However, for the average performance of all contractors, observers can only provide rough estimates based on their experience, rather than precise values. To score these indicators, this research categorizes all potential values of each indicator into seven grades (A–G), with setting values at Grade A complying with regulations and standards. Given that there may not be a linear relationship between the contractor’s RP and the values of each indicator [
49], the values’ ranges are divided under practical considerations (
Table 4). By assigning a score to each grade (e.g., A = 7, B = 6, …, G = 1), observers can value the contractor’s performance and the group’s median performance.
Hence, the coefficient of risk perception
for the
th contractor (
) can be defined as Equation (1):
where
refers to the total scores of the
th contractor according to
Table 4, i.e.,
(
);
refers to the total scores of the median management behavior of the entire group for indicators c–g, that is,
. The values of
are determined by the observers’ assessment of the contractor’s management regarding OWs, and the values of
by that of the median performance of the entire group.
If , the contractor exhibits optimism bias, where the smaller the value, the more obvious the underestimation of perceived risk. Conversely, if , the contractor demonstrates pessimism bias, where the greater the value, the more significant the overestimation. If , the contractor’s risk perception type is regarded as unbiased.
4. Modeling of Tripartite Evolutionary Game Considering the Contractor’s Risk Perception
4.1. Settings in the Tripartite Evolutionary Game
4.1.1. Players and Strategies
The contractor, as the direct manager of OWs [
50], benefits from the employment of OWs, thus being inherently motivated to conceal their presence in both Positive Management (P) and Negative Management (N). Meanwhile, the contractor is also aware that hiring OWs increases accident risk, penalties and potential losses related to credits, thus eliminating more OWs in Positive Management and fewer in Negative Management.
The supervisor, as the contractor’s inspector [
19], is consistently motivated to eliminate OWs and aware of the contractor’s tendency towards concealment. There are two strategies for the supervisor—Rigorous Inspection (R) and Lax Inspection (L). Under Rigorous Inspection, the supervisor is able to eliminate all OWs, which means the reduction of accident risk, and also the avoidance of punishments and the joint liability for accidents. On the other hand, under Lax Inspection, only a part of OWs can be eliminated.
The regulator, as the neutral inspector of both contractors and supervisors [
22], recognizes the existence of oversights in management and has an incentive to reduce the number of OWs. There are two strategies for the regulator, i.e., Strong Supervision (S) and Weak Supervision (W). By adopting the Strong Supervision strategy, all remaining OWs can be found out due to the regulator’s detailed inspections. Otherwise, no OWs will be discovered because of the regulator’s unfamiliarity with the construction site.
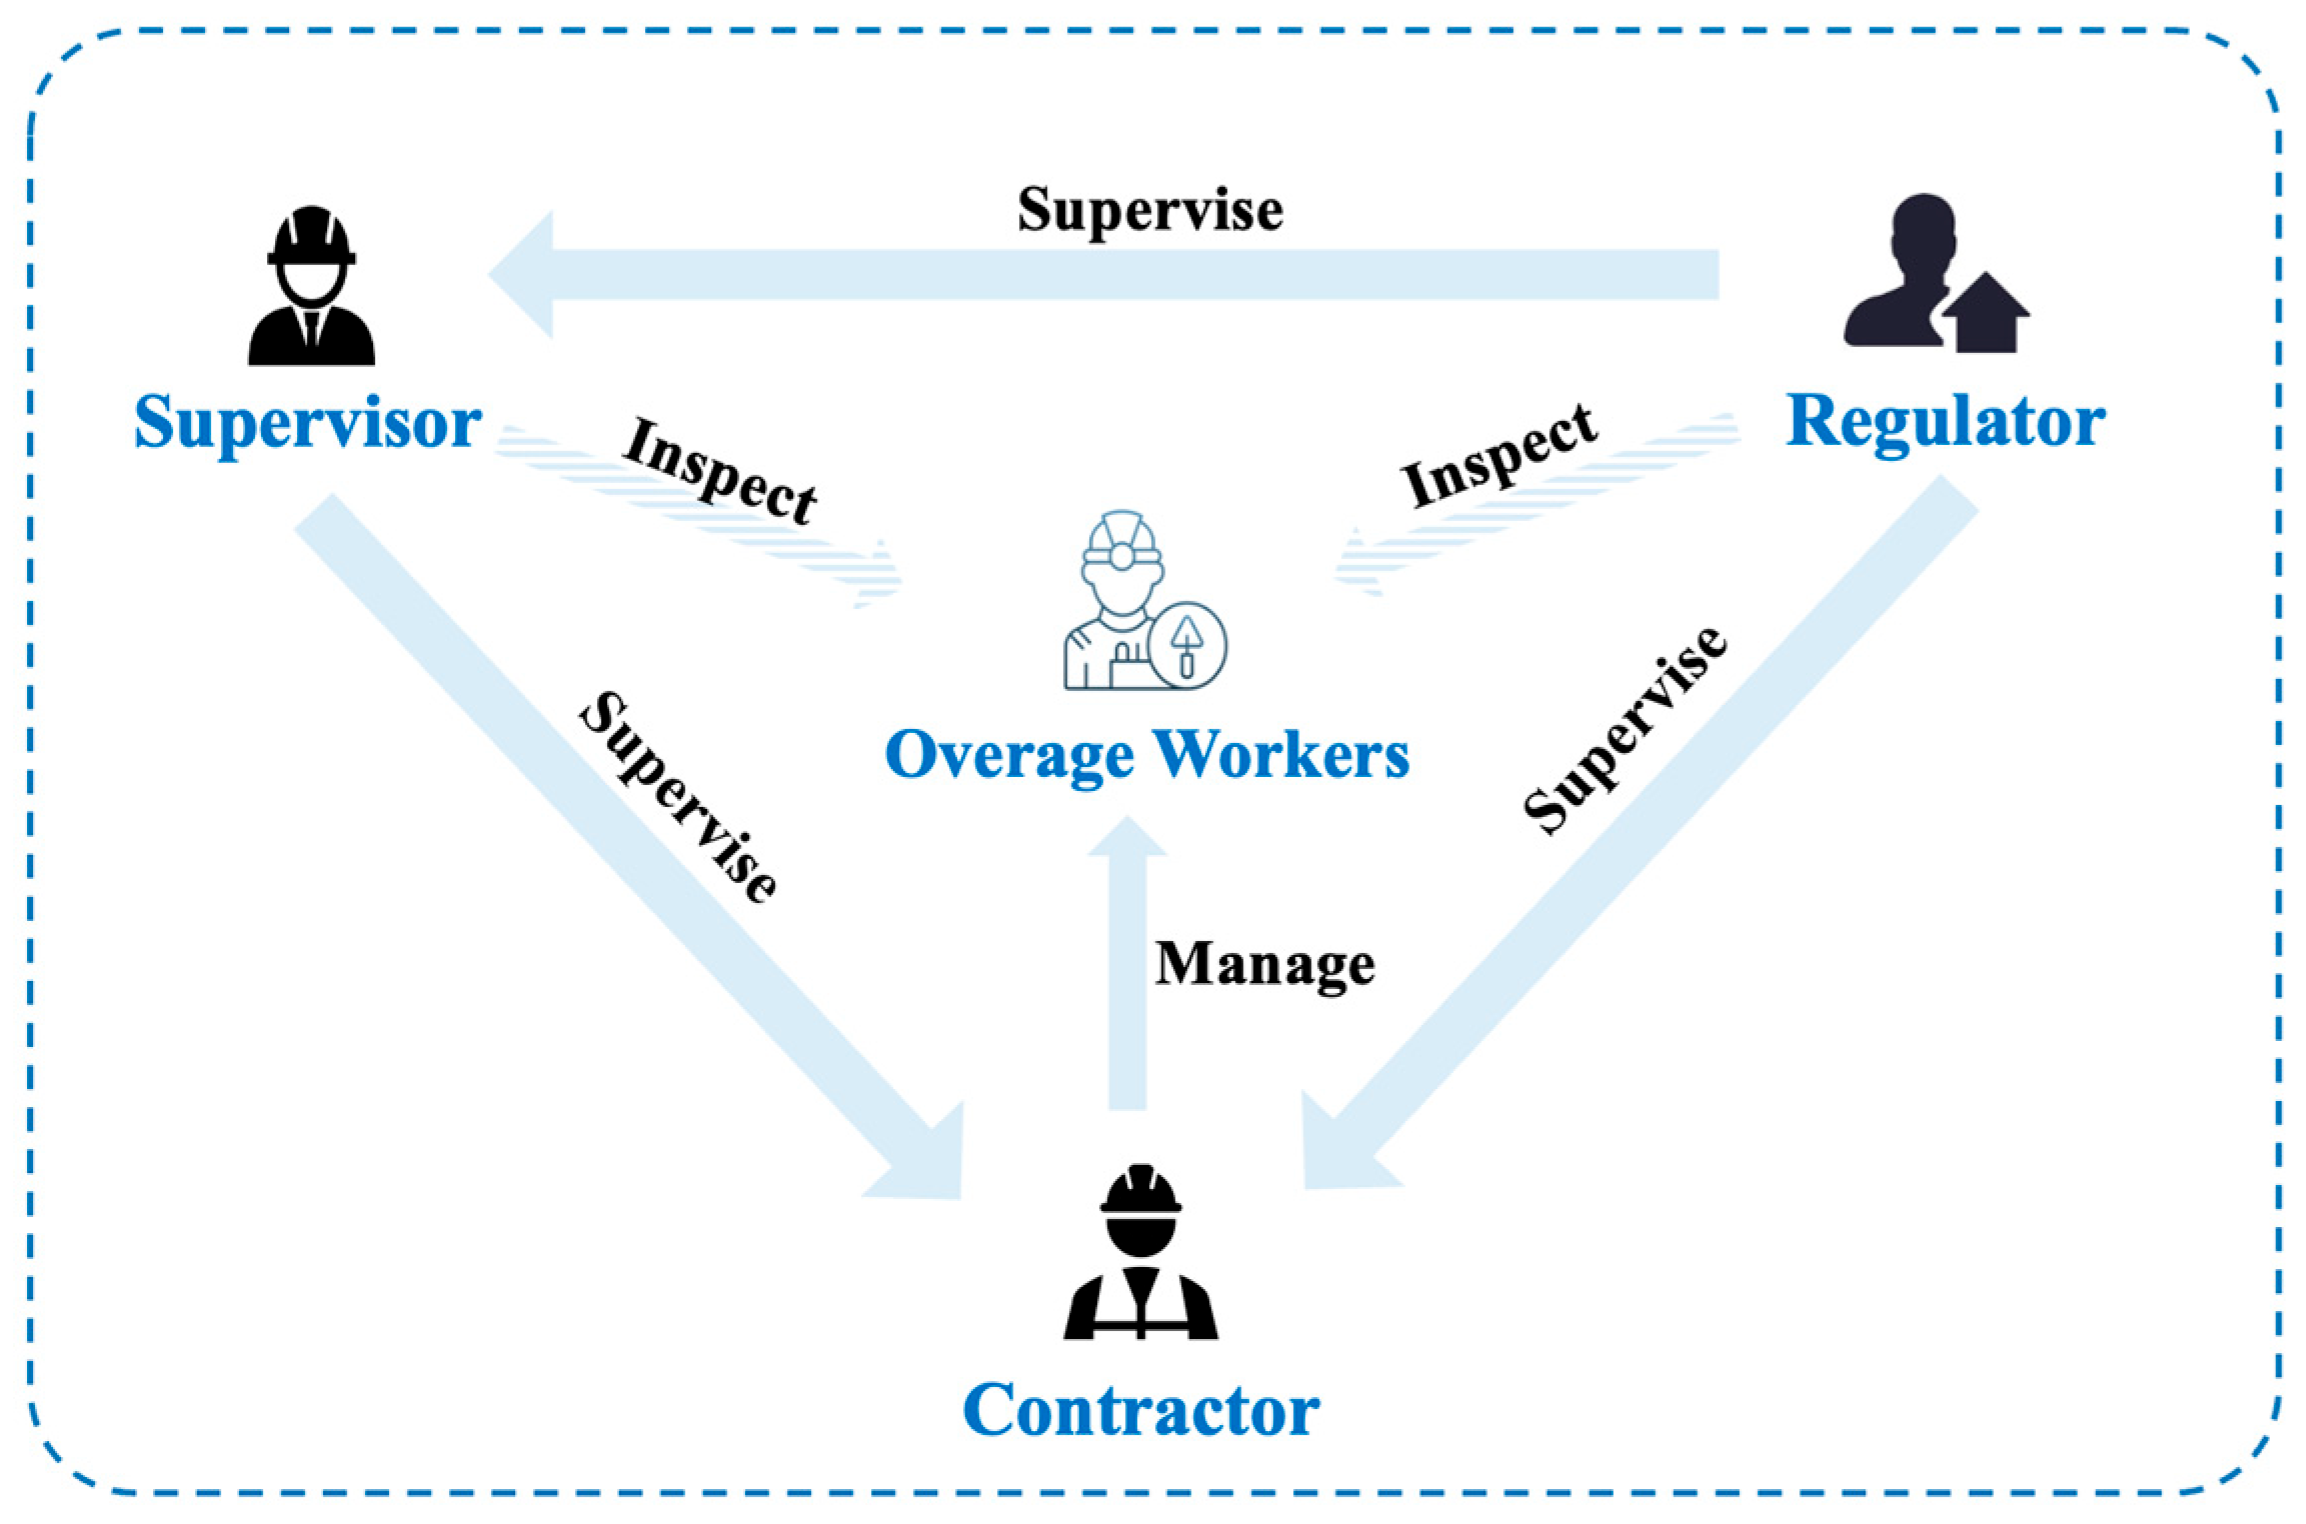
The three players’ responsibilities are depicted in
Figure 2. In this paper, it is supposed that the contractor, supervisor, and regulator are decision-makers with limited rationality, adopting strategies with the goal of maximizing expected perceived earnings. For simplification, this study only focuses on differences in risk perception among contractors and ignores those among supervisors and regulators.
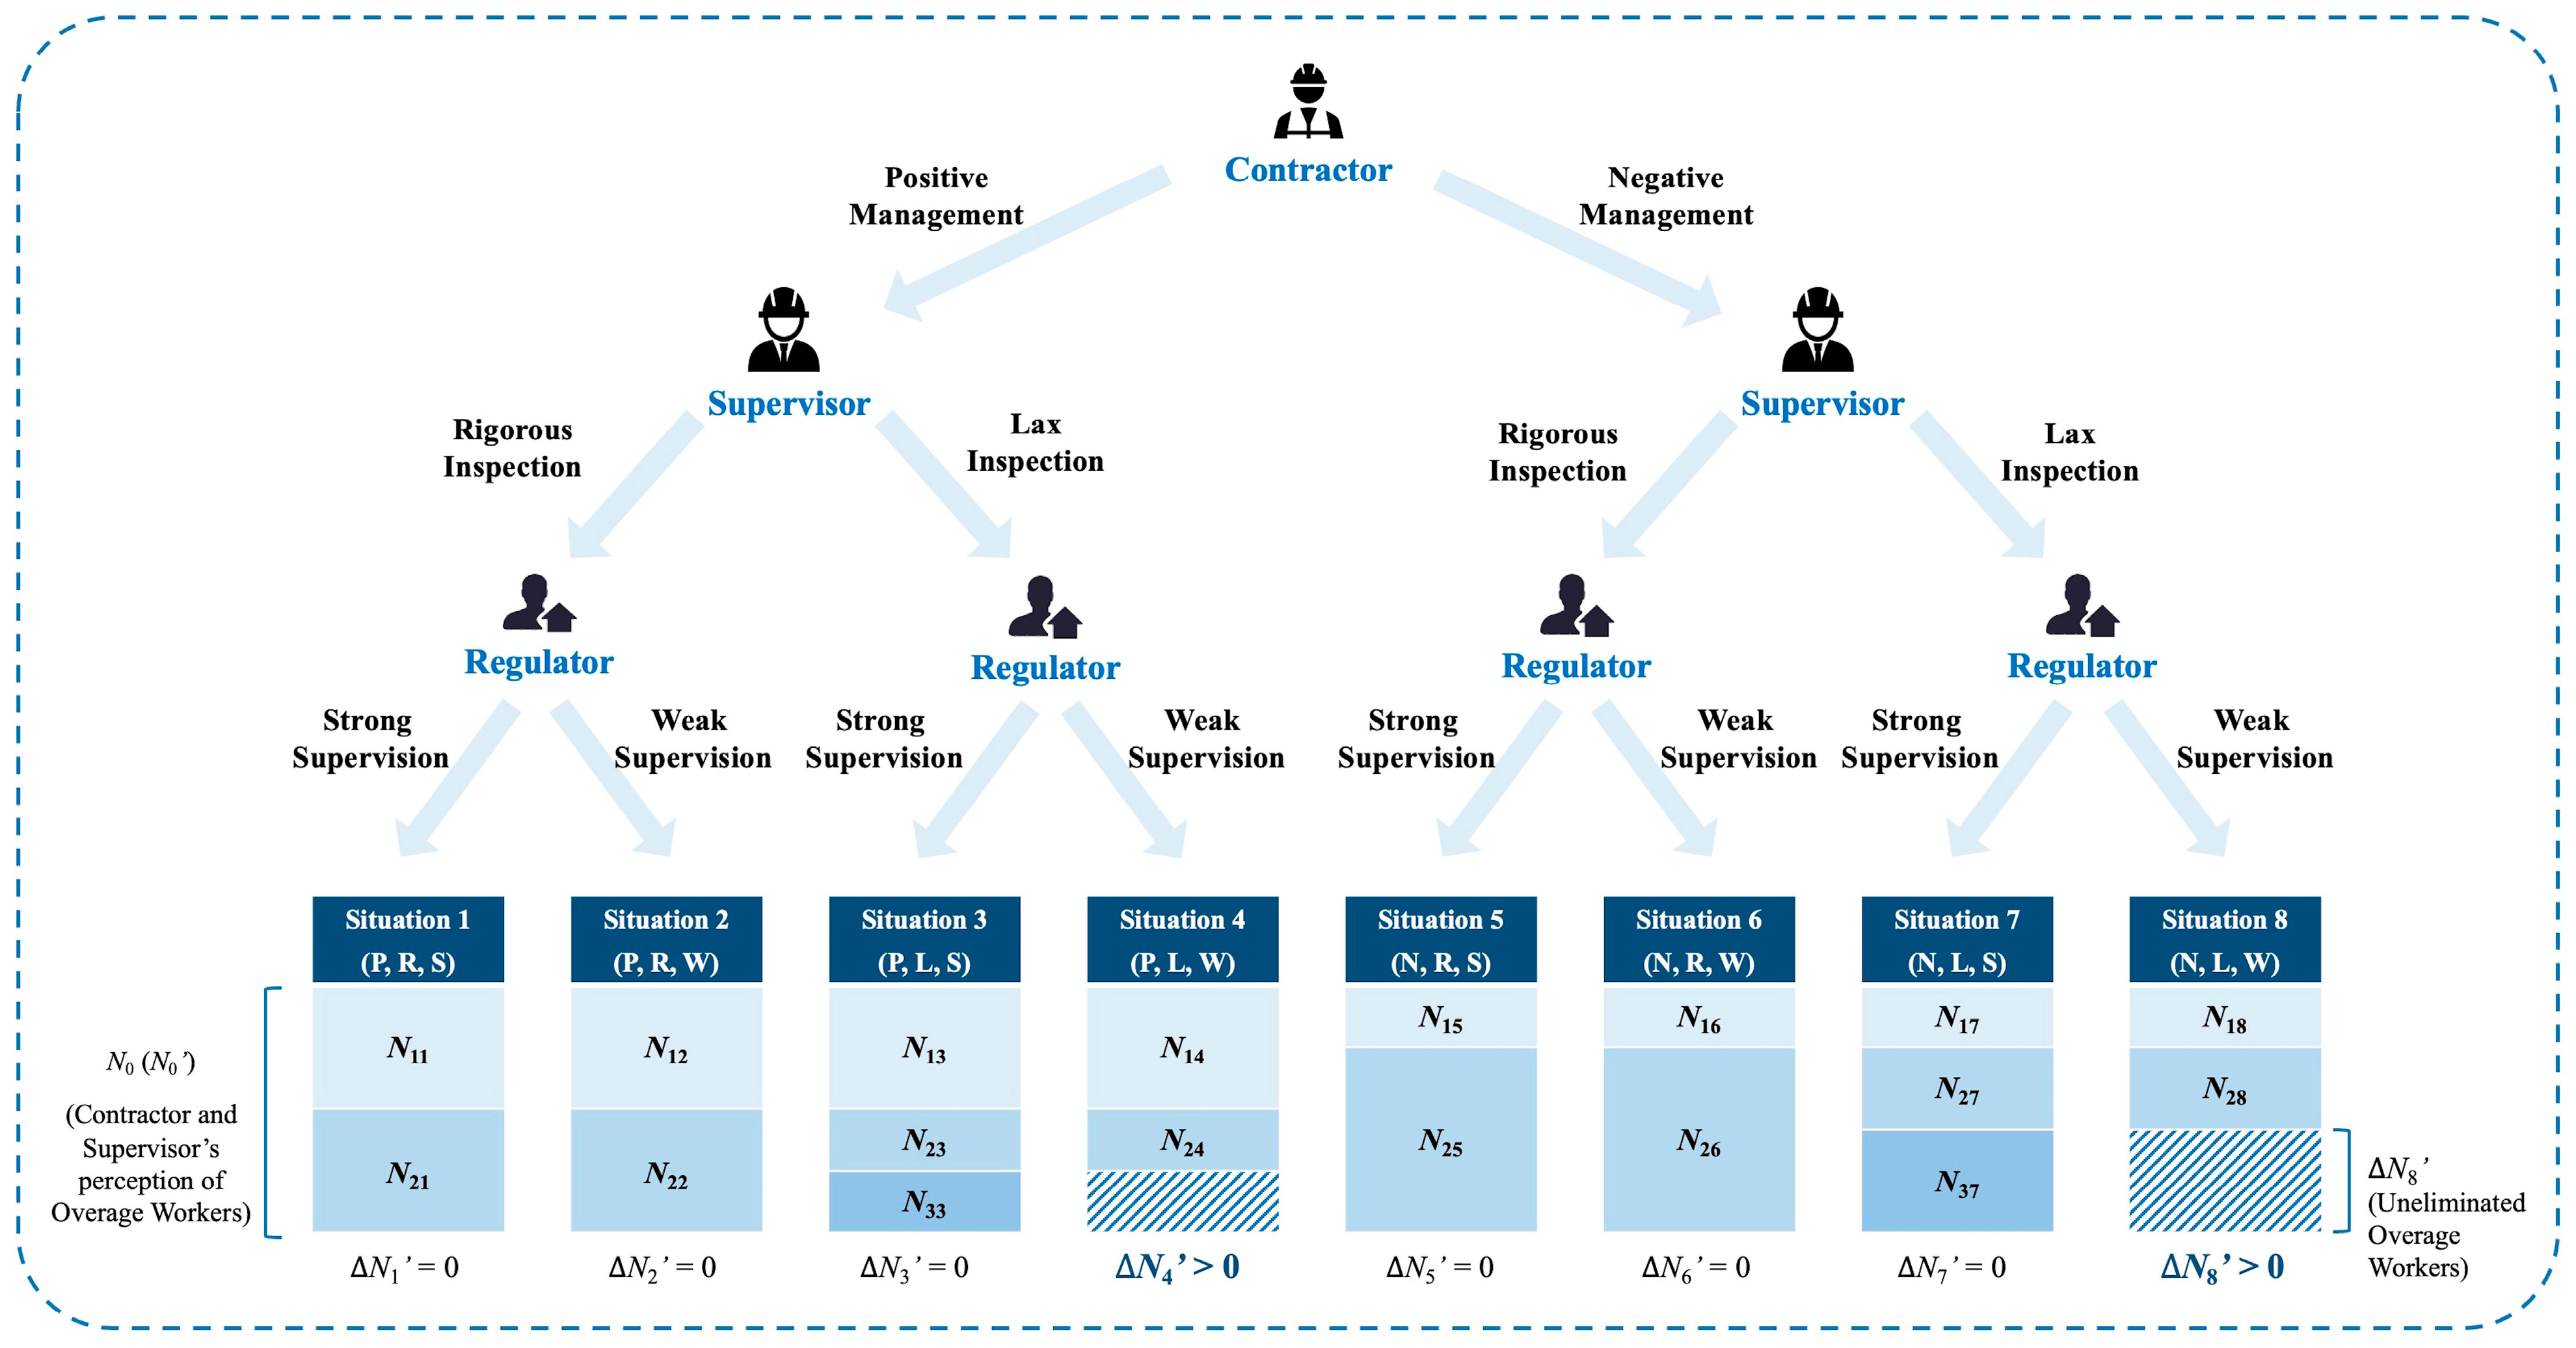
4.1.2. Number of Overage Workers in Each Game Situation
The tripartite evolutionary game forms eight situations: (P, R, S), (P, R, W), (P, L, S), (P, L, W), (N, R, S), (N, R, W), (N, L, S), and (N, L, W), numbered from 1 to 8. Let us take the following sequence of inspection: The contractor (1st)—The supervisor (2nd)—The regulator (3rd). The symbols related to the number of OWs can be seen in
Table 5.
Considering the impacts of cognition and capability on the contractor’s and the supervisor’s inspections, it is of necessity to suppose that:
The contractor and supervisor are aware of the total number of OWs. Due to the information asymmetry, the number of OWs recognized may be less than or equal to the actual number. For convenience, it is assumed that there is no bias in the perception of this number by the contractor and supervisor, i.e., .
The contractor and supervisor have the same capability to find and clear OWs. As they are in the same construction site, the contractor and supervisor have similar knowledge and expertise.
The numbers of OWs eliminated by the contractor shall be equal, that is,
under Positive Management and
under Negative Management. The numbers of OWs cleared by the supervisor are jointly influenced by the contractor’s and the supervisor’s strategies, i.e.,
,
,
and
. For the regulator, the eliminated number is equal to zero if no OWs remain, or under Weak Supervision. Otherwise, it shall be
in the 3rd situation (P, L, S), and
in the 7th situation (N, L, S), where
and their values may differ. For the regulator, who is far less familiar with the construction site than the contractor and supervisor, there is
under Strong Supervision and
under Weak Supervision, according to
Section 4.1.1. The variations in OW numbers across situations can be seen in
Figure 3.
4.2. Construction of Replicator Dynamics Equations
4.2.1. Analysis of Utilities
Players shall bear higher costs to strengthen inspections of overage workers. Relaxing management measures may lead to OWs remaining, thus resulting in accident-related losses, penalties for dereliction of duty, and the diminishment of expected profits. According to the enterprise credit evaluation policy [
51], the contractor’s and supervisor’s credit points may be deducted due to the uneliminated illegal workers, or added for excellent management performance. Then, their likelihood of winning bids in future is decreased and increased accordingly. Under the regulator’s Strong Supervision, the contractor and supervisor will incur the risk of expected profit reductions when credit points are deducted (termed as ‘future losses’) and receive potential profits when added (termed as ‘future returns’). Therefore, the players’ utilities are set as follows:
The contractor will bear the additional management cost when actively managing, and the additional hiring cost when the concealed OWs cannot satisfy the labor demand.
For the supervisor, the extra cost will be paid for Rigorous Inspection.
The regulator needs to pay the additional management cost under Strong Supervision, and the law enforcement cost after identifying OWs.
For the contractor, employing OWs will introduce extra safety risk. The number of OWs varies across game situations, leading to different risks—
and
in the 4th and 8th situation (i.e., (P, L, W) and (N, L, W)). According to
Section 4.1.2, there is
.
The supervisor will shoulder the supervisory responsibility of accidents when failing to perform their duty, with the joint liability ratio of .
The regulator will bear the liability for incident regulation—the loss of credibility and reputation, denoted as .
The contractor may receive future returns from increments of credit points and future losses from decrements. Similar to accident risk, also varies across the game situations. and represent future losses in the 3rd situation (P, L, S) and 7th situation (N, L, S), where there is . The supervisor may also obtain future returns and future losses and () from their credit.
When the regulator supervises strictly, the contractor and supervisor may receive awards for the safe and civilized running of the construction site on account of their outstanding behavior, and their credit points will be simultaneously added. Otherwise, they will be penalized with credit points deducted when OWs are detected by the regulator. Under the Weak Supervision strategy, they will receive neither credit rewards nor penalties.
When adopting Negative Management, if subjected to the supervisor’s Rigorous Inspection, the contractor will face penalties for dereliction of duty . The supervisor will get punished for dereliction of duty (denoted as ) by the employer under Lax Inspection. The regulator will receive punishment from the government for insufficient supervision.
The parameters of utilities are specified in
Table 6.
4.2.2. Construction of Replicator Dynamics Equations
Based on the settings in the OWs’ numbers across situations (
Section 4.1.2) and players’ utilities (
Section 4.2.1), the payment matrix of the evolutionary game can be formulated as shown in
Table 7.
,
, and
mean the perceived earnings under the
th situation for the contractor, supervisor, and regulator, respectively.
Let us assume that the contractor adopts “Positive Management” with a probability of , and “Negative Management” with . The supervisor takes “Rigorous Inspection” with a probability of , and “Lax Inspection” with . The regulator chooses “Strong Supervision” with a probability of , and “Weak Supervision” with .
From
Table 7, the contractor’s perceived earnings from adopting Positive Management and Negative Management are denoted as
and
(Equations (2) and (3)). Then, the replicator dynamics equation of the contractor can be established as shown in Equation (4).
Let us set the supervisor’s perceived earnings of Rigorous Inspection and Lax Inspection as
and
, respectively (Equations (5) and (6)). Then, the replicator dynamics equation of the supervisor can be expressed as Equation (7).
Taking the regulator’s perceived earnings of Strong Supervision and Weak Supervision strategies as
and
(Equations (8) and (9)), the replicator dynamics equation of the regulator can be acquired (Equation (10)).
4.3. Analysis of Evolutionary Mechanism
4.3.1. Contractors
When is satisfied, it follows that . This indicates that there is a mixed evolutionarily stable strategy (ESS) for the contractor.
According to Equation (4),
can be derived as follows (Equation (11)):
If
, then
and
. This means that
is the pure ESS of the contractor. If
, then
,
, where
is the other ESS. Hence, when the sum of penalties and perceived risk associated with Negative Management exceeds the sum of the net costs (with future returns deducted) and perceived risk under Positive Management, Positive Management emerges as the contractor’s ESS. Otherwise, Negative Management is the unilateral ESS. Obviously, the contractor’s evolutionarily stable strategies are affected by the supervisor and regulator.
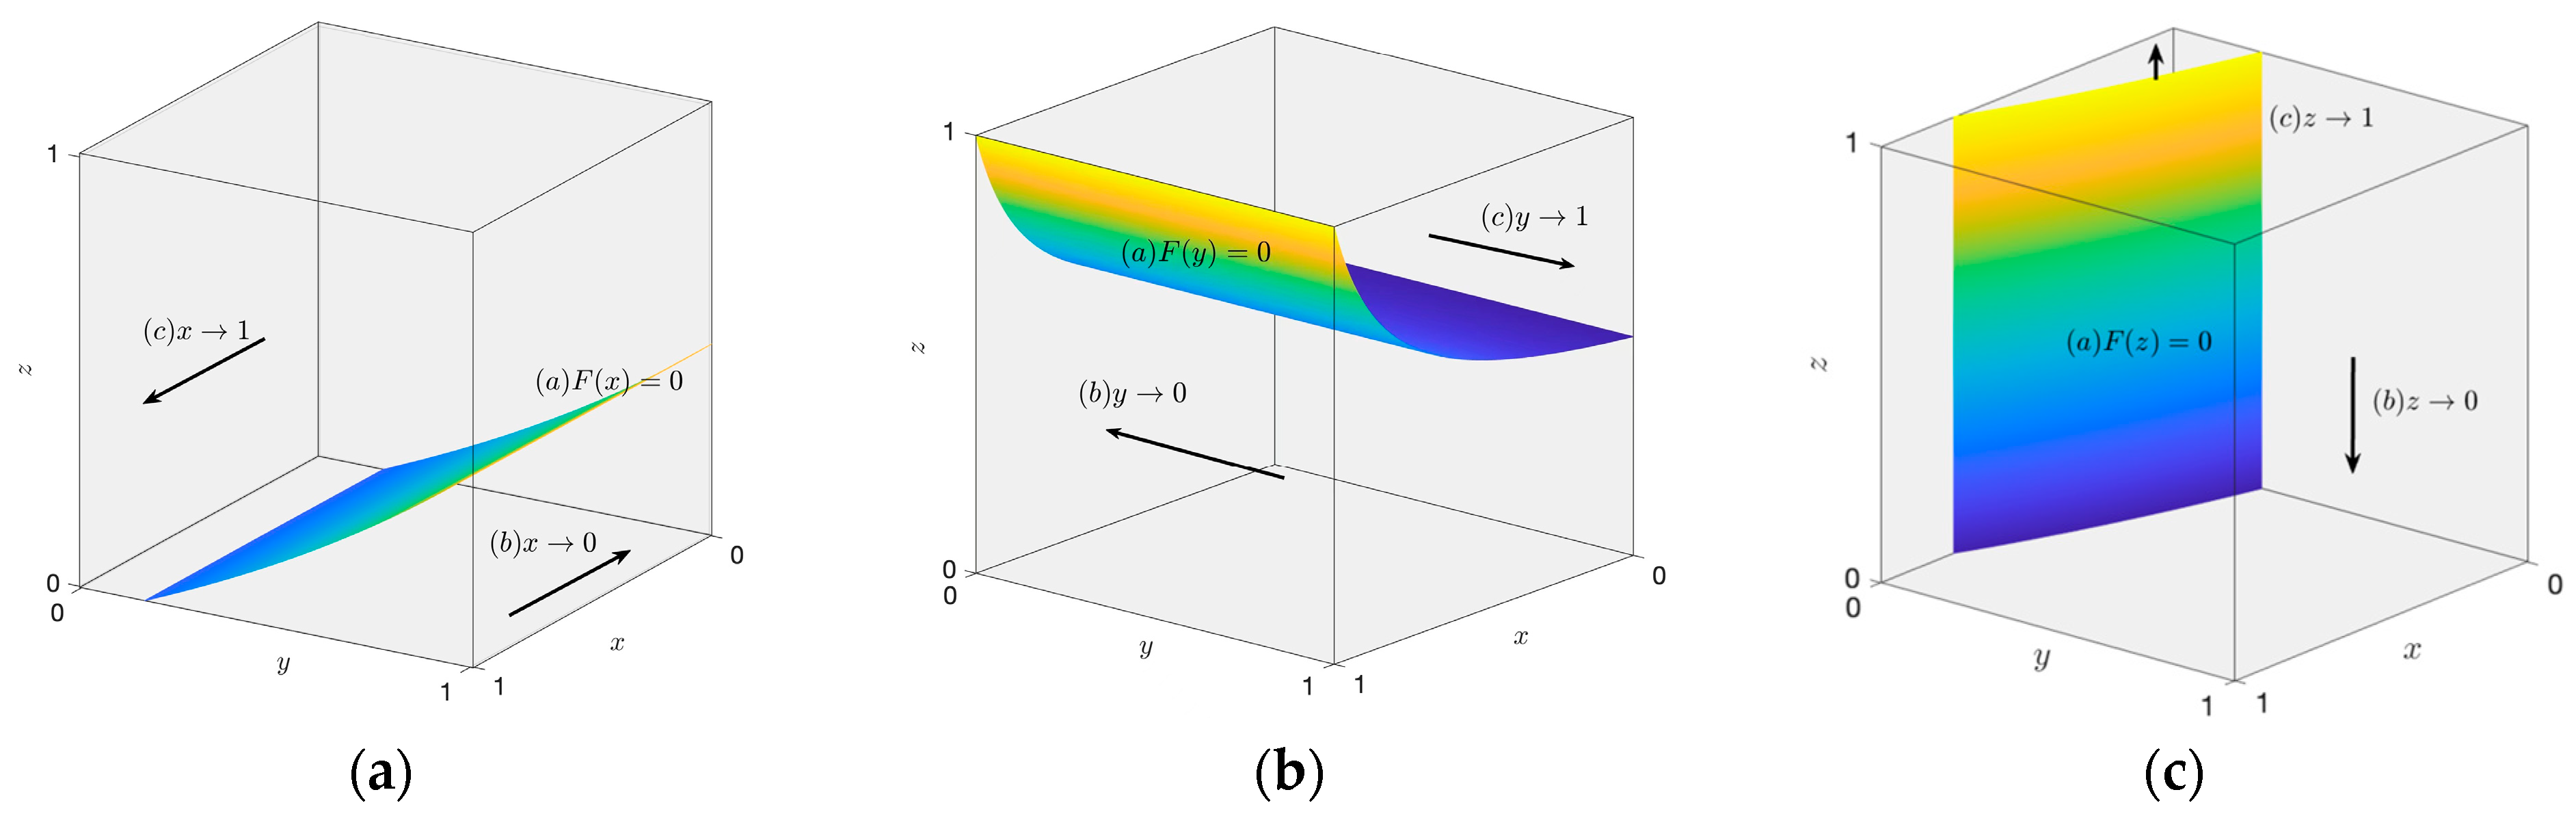
Figure 4a is the evolutionary phase diagram of the contractor’s strategy, where the arrows represent its evolutionary trends, and colored surface divides contractor’s strategic space into two parts.
4.3.2. Supervisors
When , there is , indicating the supervisor’s mixed ESS remains constant over time.
Similarly,
(Equation (12)) can be derived from Equation (7):
If
is satisfied, then
,
. In this case,
is one of the supervisor’s pure ESS. If
is satisfied, then
,
, then
is the other ESS. Therefore, if the cost of adopting the Rigorous Inspection strategy is less than the potential losses incurred from Lax Inspection, the former is the supervisor’s unilateral ESS. Otherwise, Lax Inspection serves as the supervisor’s unilateral ESS. It is clear that the supervisor’s evolutionarily stable strategies are also influenced by the strategic choice of both the contractor and the regulator.
Figure 4b illustrates the supervisor’s evolutionary phase diagram.
4.3.3. Regulators
If , then , which indicates a constant mixed ESS for the regulator.
With Equation (10),
can be obtained, as shown in Equation (13):
If
, there are
and
, that is, the cost of extra supervision and law enforcement surpasses the risk under Weak Supervision, and thus
is the regulator’s unilateral ESS. If
, then
,
, which means that the extra cost of Strong Supervision is lower than that of Weak Supervision, and
is the unilateral ESS of the regulator. It is clear that the regulator’s ESS is also influenced by the contractor and supervisor.
Figure 4c is the phase diagram of the regulator’s strategy.
5. Discussion on Supervisory Strategies Considering the Contractor’s Risk Perception
According to the method in
Section 3, supervisors and regulators are equipped to quantify the contractor’s risk perception with observable indicators, to predict their behavior, and to put forward tailored strategies for varying contractors. Let us take
: the contractor will be classified as the optimistically biased type when
, the pessimistically biased type when
, and the unbiased type when
.
5.1. Simulation of the Contractor’s Risk Perception
Based on the status quo of China’s construction industry, there is a strong determination for the government to eliminate overage construction workers, whereas there is a weaker willingness on the part of the contractor to spend more on recruitment, and on that of the supervisor to perform additional inspections. Hence, let us take the initial probability of adopting Positive Management, Rigorous Inspection, and Strong Supervision as , , and , and the initial value of each parameter as follows: , , , , , , , , , , , , , , , , , , and .
With these values, computer simulation tools can assist in predicting the contractor’s future performance. Matlab, known for its robust and exceptional simulation capability, is widely applied to construction management studies for simulating game trajectories and player behavior [
50,
52].
5.1.1. Optimistically Biased Contractors
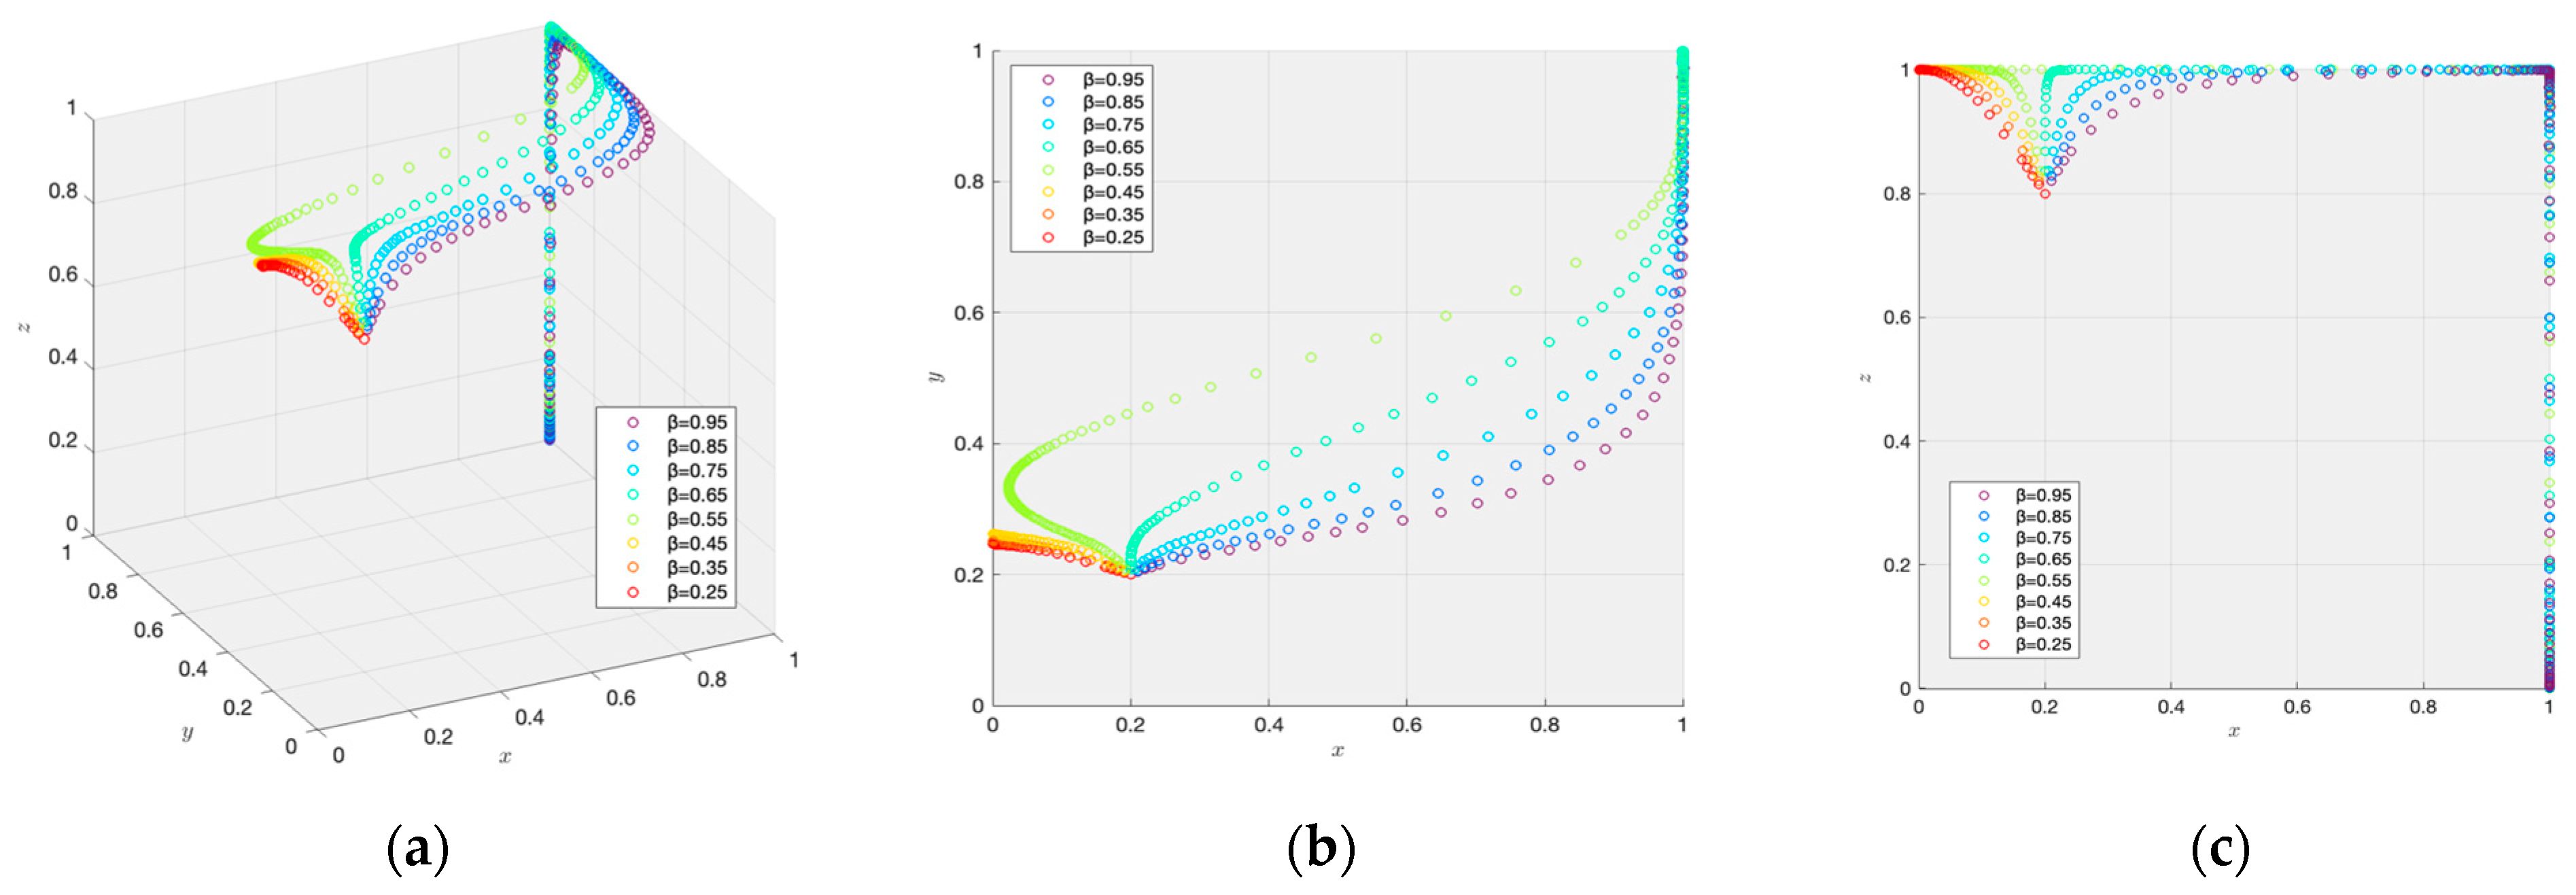
By investigating the game trajectories of participating contractors with various types of optimism bias (
Figure 5), a significant difference is seen in the overall gaming trends. As shown in
Figure 5a, contractors with optimism bias can be further categorized into Type I and Type II. The Type I optimistically biased contractor shows minor bias (e.g.,
), with the game converging to the point
. This means that Positive Management is adopted by the contractor, Rigorous Inspection by the supervisor, and Weak Supervision by the regulator. The Type II exhibits more apparent optimism bias (e.g.,
), leading to the game’s convergence to the equilibrium point
. This reveals that Negative Management is adopted by the contractor, the mixed strategy of Rigorous Inspection and Lax Inspection by the supervisor, and Strong Supervision by the regulator.
According to
Figure 5b, for the Type I optimistically biased contractor, the frequency of Positive Management keeps rising as the supervisor tightens supervision measures, with the exception of the contractor with
. For Type II, its probability of adopting Positive Management persistently decreases. In
Figure 5c, for Type I, a sudden decline appears in the probability of Strong Supervision when
and
nearly reach 1. For Type II, a determined motivation to Positive Management is shown, despite the frequency for Strong Supervision being close to
.
In summary, Type I optimistically biased contractors, with a heightened perception of objective risk, demonstrate a continued tendency towards proactive management practices despite the relaxation of supervision. Conversely, with respect to Type II optimistically biased contractors, there appears to be an increasing difficulty for regulators to correct negative management behavior accompanied by the weakening of risk perception.
5.1.2. Pessimistically Biased Contractors
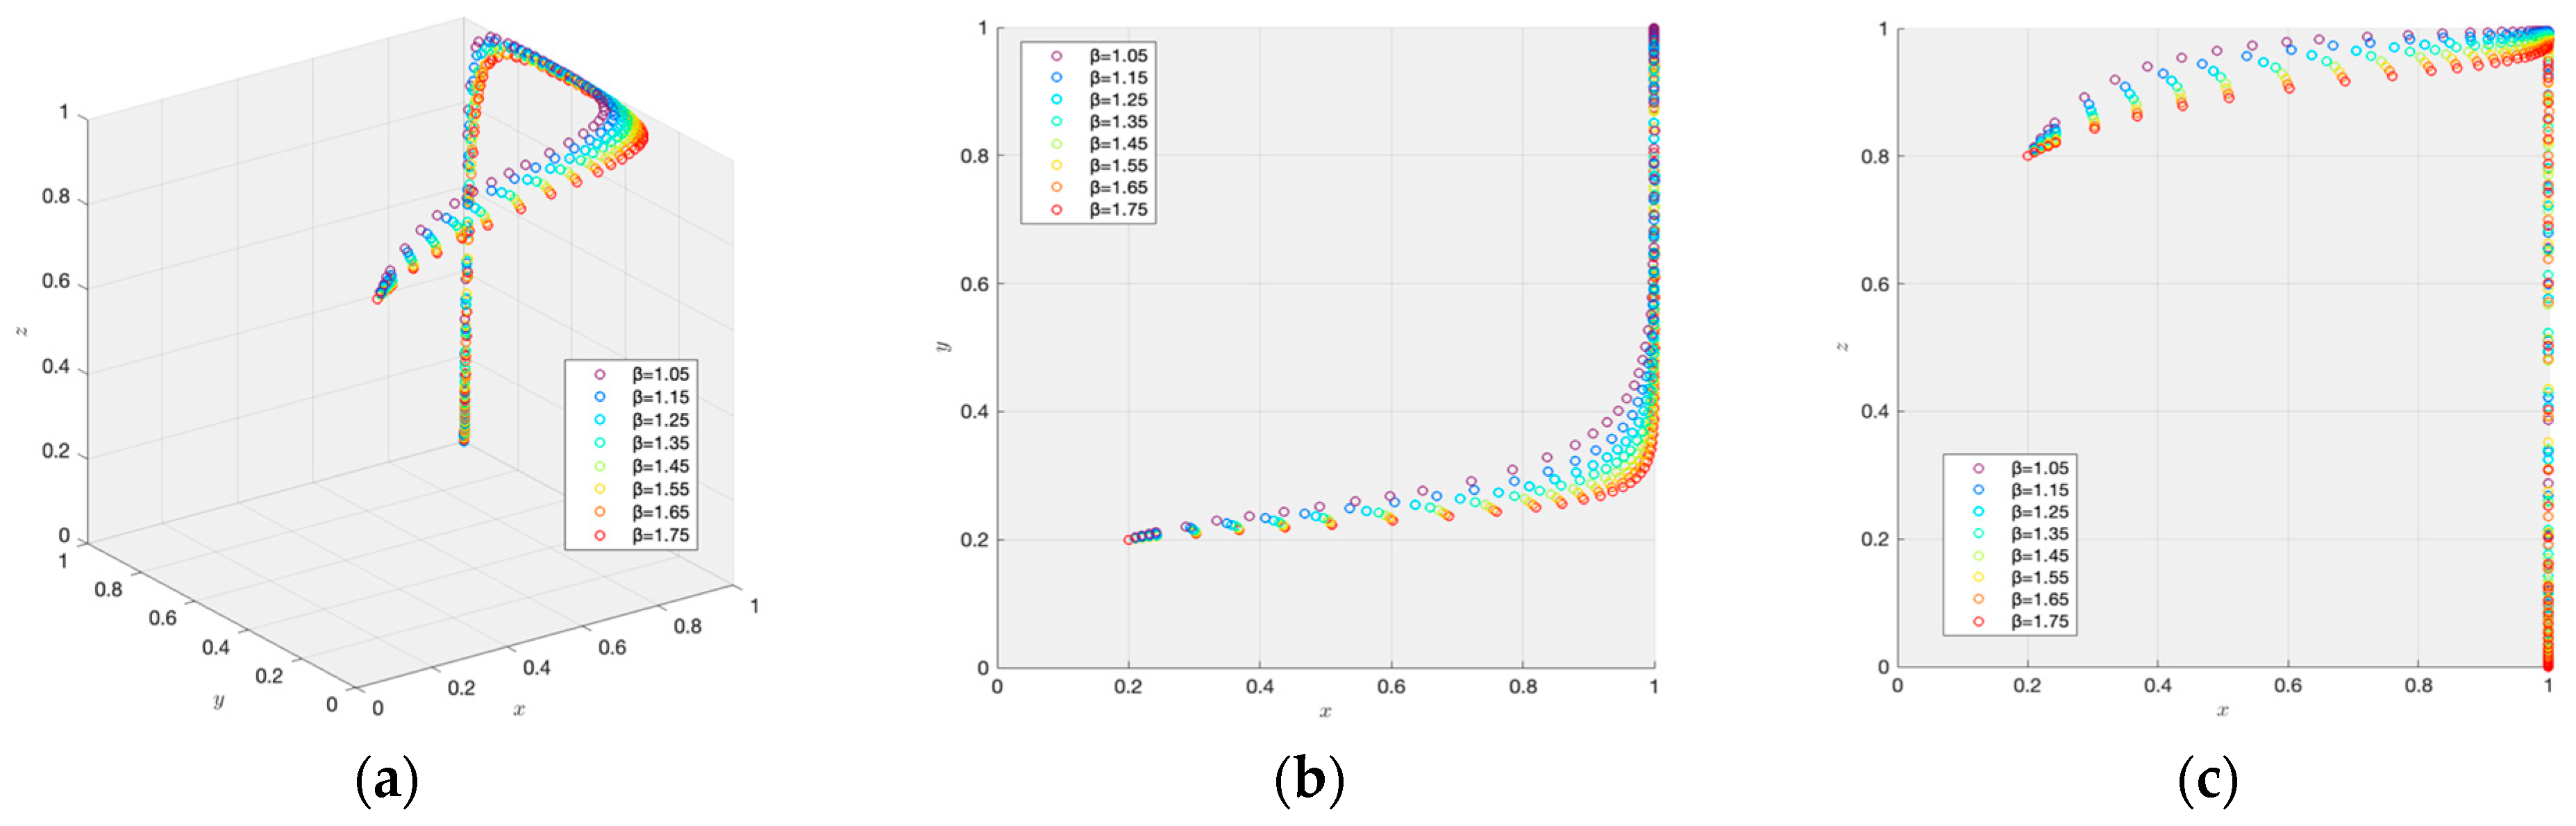
Unlike optimistically biased contractors, the evolutionary trajectories of the pessimistically biased contractor remain consistent across different risk perception coefficients (
Figure 6). In
Figure 6a, the game eventually evolves to the equilibrium point
, when contractors with pessimism biases participate. This means that the contractor is inclined to move towards ongoing and proactive management practices, and the supervisor is devoted to eliminating all OWs on the site. Then, the regulator’s human resources can be conserved and used for other purposes, making contributions to improve the welfare of the whole society. Moreover, the gaming dynamics in the contractor–supervisor and contractor–regulator interactions are similar to those of Type I optimistically biased contractors with
(
Figure 6b,c). Contractors with more intense risk perception exhibit swifter improvements in Positive Management frequency.
Combined
Figure 5 and
Figure 6, it can be concluded that contractors with intense risk perception, including all pessimistically biased contractors and a part of the optimistically biased contractors (
), have a strong self-driving force and an inclination towards managing positively. However, the changing speed of the strategy varies. In contrast, optimistically biased contractors with faint risk perception (
) prefer to manage passively, requiring more attention from relevant supervisory parties. It is evident that the supervisor and regulator shall customize supervisory strategies based on the contractor’s RP, to enhance their motivation to conduct effective inspections.
5.2. Proposal of Supervisory Strategies
5.2.1. Supervisors
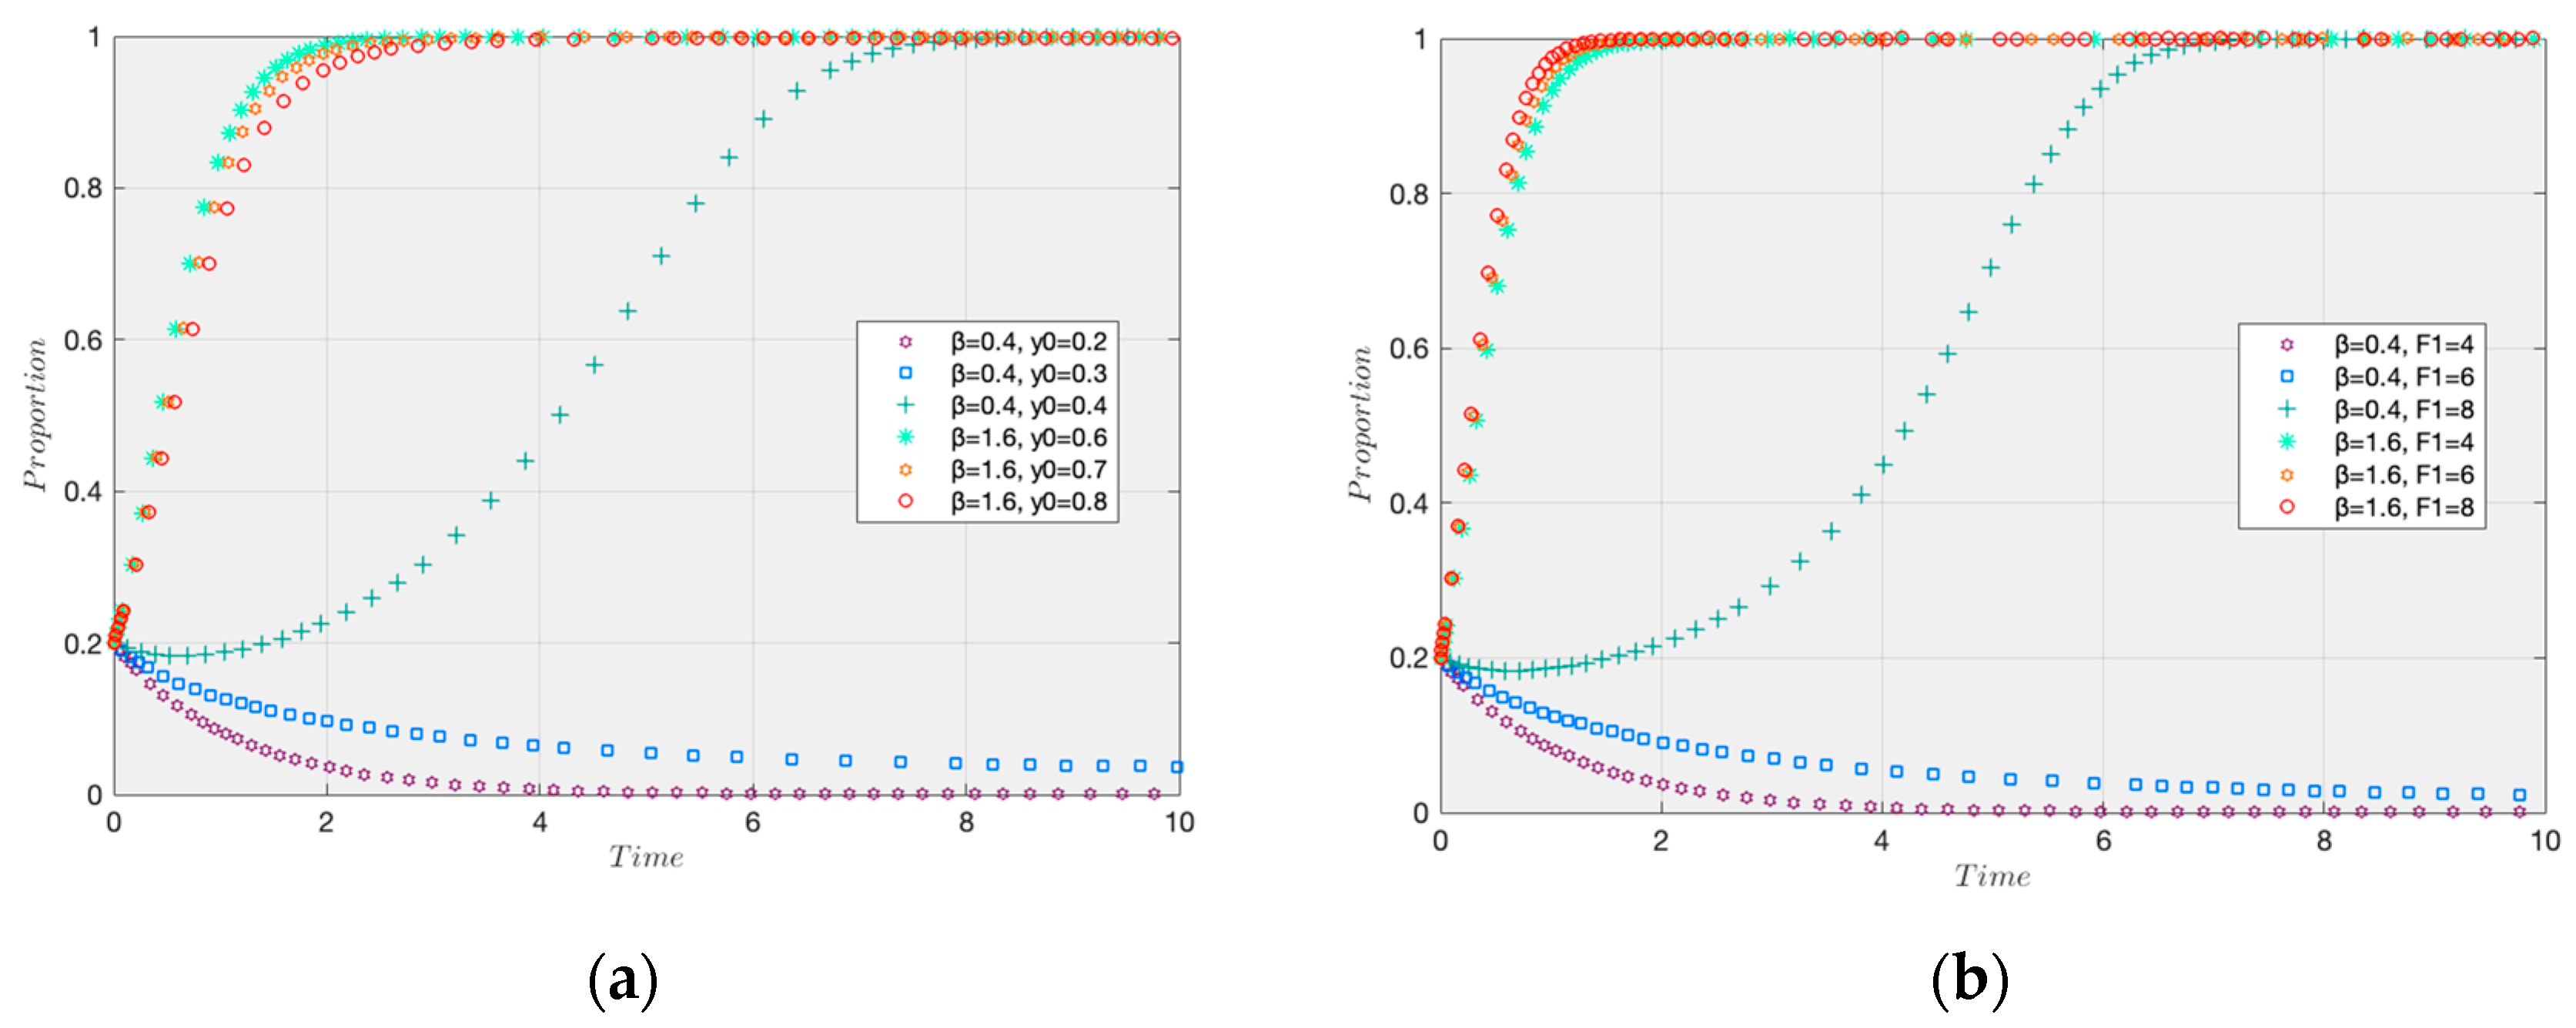
Supervisors can cultivate an image of strict inspections by increasing the frequency of routine inspections and intensifying penalties, thereby stimulating the contractor’s proactive engagement. To evaluate the effectiveness of this strategy, this study examines the strategic choice of the Type II optimistically biased contractor (
) and the pessimistically biased contractor (
) under varying initial probabilities of Rigorous Inspection
(
Figure 7a) and penalties of dereliction of duty
(
Figure 7b).
Comparing
Figure 7a,b, it is apparent that raising penalties to a proper level works effectively in improving the contractor’s behavior, which performs well among all contractors. Nevertheless, increasing the initial probability of Rigorous Inspection is only applicable to the optimistically biased type.
5.2.2. Regulators
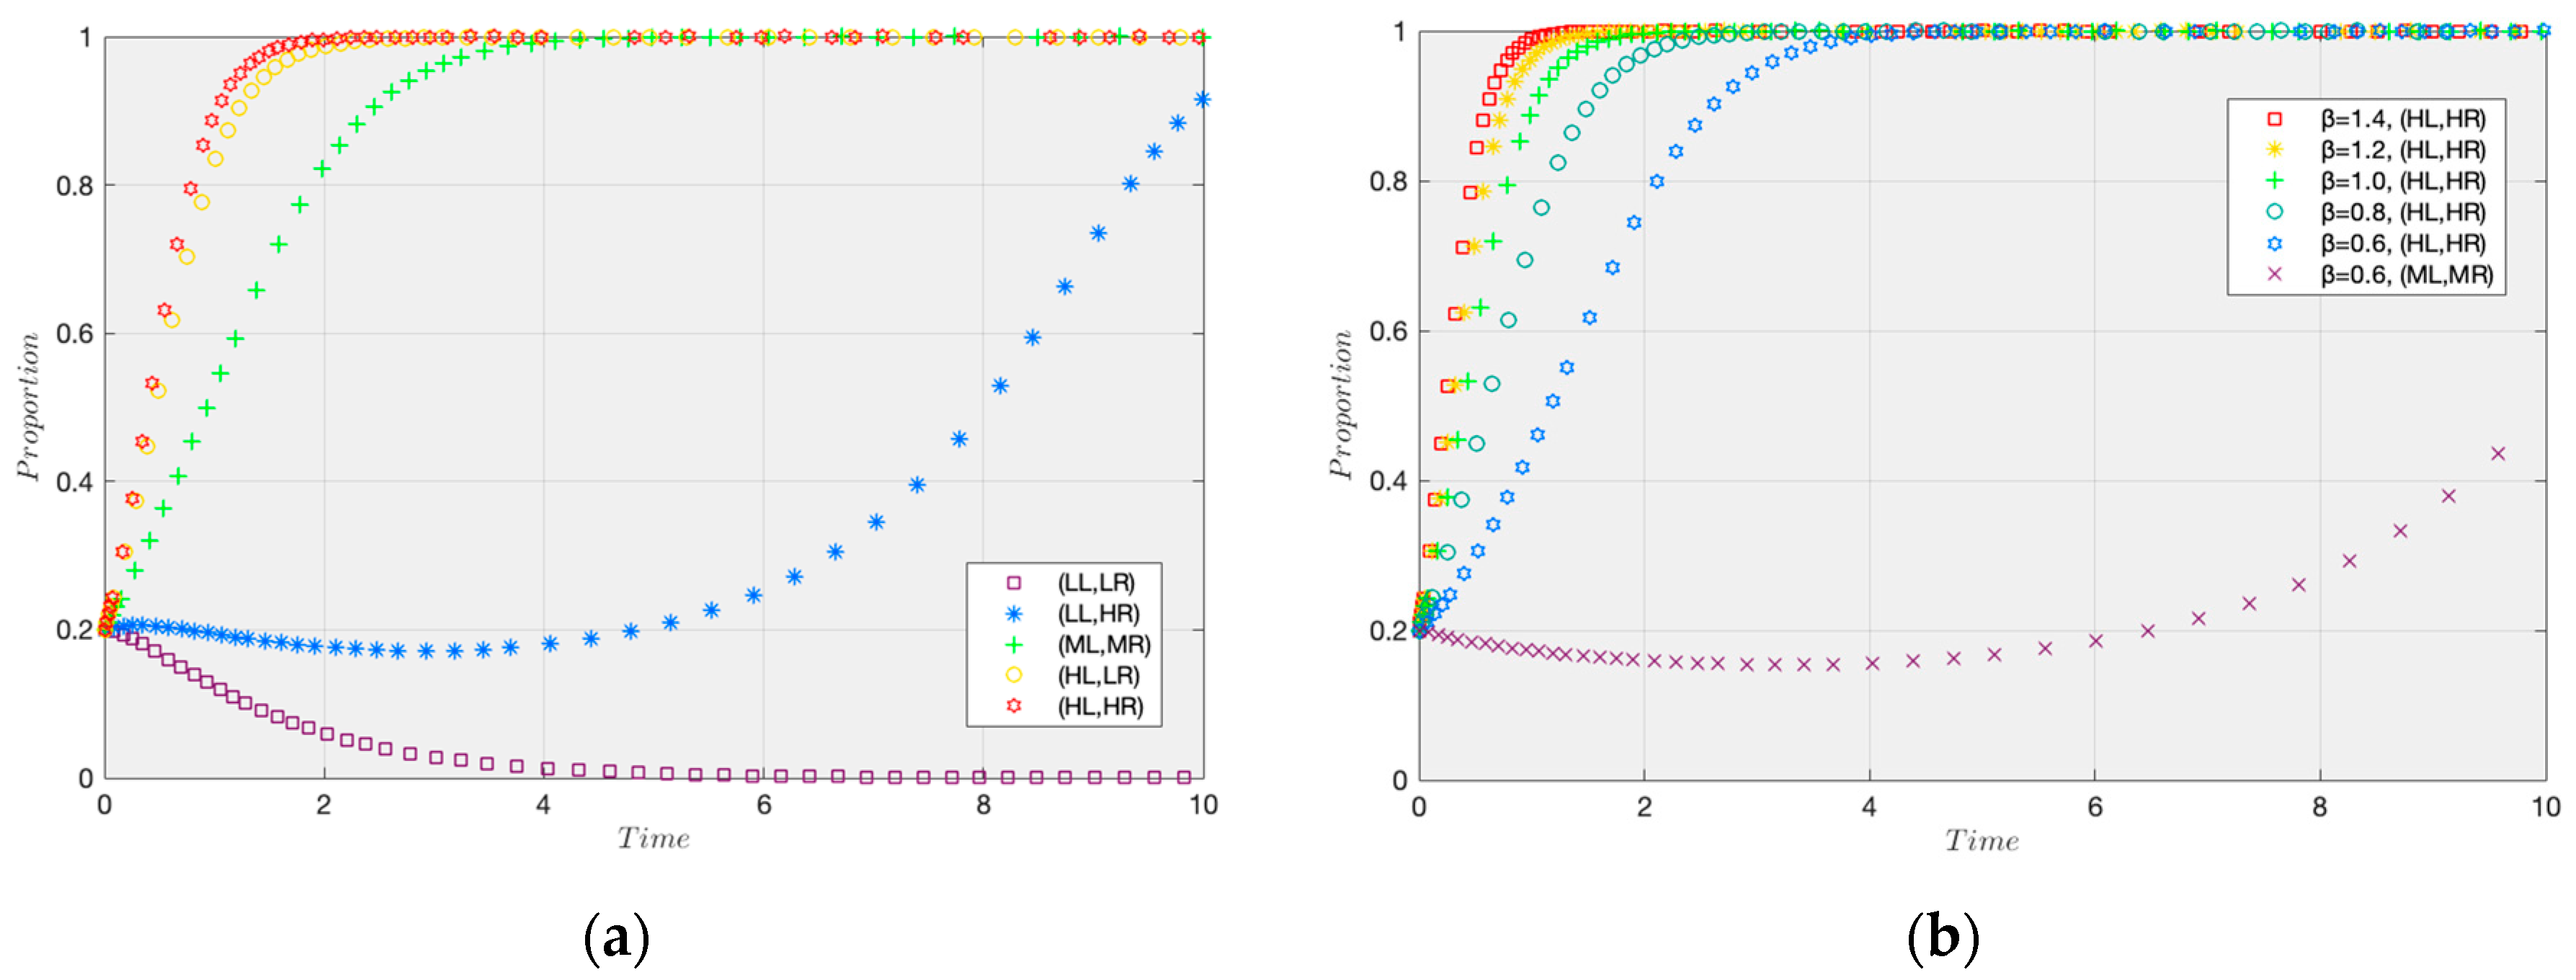
In the light of the construction enterprise credit evaluation policy in China, regulators can simultaneously utilize both punishments and incentives as means of supervision over contractors. To explore the impact of future losses and future returns on the contractor, this study sorts future losses and future returns into two qualitative levels: High and Low. Let us take the value of under high future losses (HL) as and , that under low future losses (LL) as and ; and the value of under high future returns (HR) as , and that under low future returns (LR) is . Consequently, four combinations are obtained: (HL, HR), (HL, LR), (LL, HR), and (LL, LR).
Comparing four combinations with the baseline (ML, MR), both increased future losses and future returns simultaneously incentivize contractors towards adopting positive management practices (
Figure 8a). When future losses and returns are improved at the same time, the contractors’ motivation to manage OWs can be maximally boosted. The simulation results among contractors with varying RP indicate: integrating high future losses and high future returns is efficient for both optimistically and pessimistically biased contractors (
Figure 8b). It enables contractors to shift more swiftly from Negative Management to Positive Management, and yields more evident improvements in the management tendency of the optimistically biased than the pessimistically biased contractors, as shown in
Figure 8a.
6. Conclusions
In the light of risk perception, this study explains the reason for variances in contractors’ behaviors on managing overage workers. Given the proposed methodology for risk perception measurement, customized suggestions are provided for supervisors and regulators. This study’s main conclusions are as follows.
Firstly, supervisors and regulators can measure the contractor’s risk perception by evaluating indicators and comparing the evaluations with the group median. With the contractor’s workers management process and policies, nine candidate indicators are summarized. By assessing the correlation, validity, availability, and measurability, five indicators are selected: the hours of three-level training, the proportion of real-name registered workers, the frequency of applying the real-name channel, the number of the full-time safety personnel hired by the contractor, and the frequency of the contractor’s inspections.
Secondly, the contractor’s behavior is highly corelated with their risk perception. Each player has two pure ESSs (i.e., 1 and 0) and one mixed ESS in the tripartite evolutionary game. The optimistically biased contractor with tends to manage negatively, where the game converges to . This equilibrium point means that Negative Management is adopted by contractors, the mixed strategy of Rigorous Inspection and Lax Inspection by supervisors, and Strong Supervision by regulators. However, for the pessimistically biased contractor and for the optimistically biased contractor with , the game evolves to . This means that Positive Management is adopted by contractors, Rigorous Inspection by supervisors, and Weak Supervision by regulators.
Thirdly, tailored supervisory strategies are proposed. Supervisors can elevate the initial probability of Rigorous Inspection and penalties for dereliction of duty for optimistically biased contractors, whereas only the latter applies to the pessimistically biased ones. Regulators can adopt credit-based incentives and penalties. By comparing four combinations, the contractors’ willingness to positively manage can be maximized under high future returns and losses.
This study’s principal contributions include, on the one hand, developing a universal approach for risk perception measurement, which assists supervisors and regulators in enhancing supervision efficiency, thereby improving safety performance in the construction industry. Notably, it can also be applied in other high-risk sectors. The regulator’s capability to examine the enterprise manager’s risk perception can be enhanced by observing related factors (e.g., safety inspection frequency); hence, strategies can be formulated to reduce the risk of accidents. Another contribution consists in linking players’ utilities to the number of overage workers. Hence, the correlation between game situations and players’ payoff functions is further strengthened, thereby making the game and its analysis more consistent with reality.
However, there are still limitations in this study. For instance, due to the inherent ambiguity in the boundaries of risk perception, contractors are roughly categorized in this study, instead of being precisely classified. Additionally, when measuring the contractor’s risk perception, establishing the accurate relationship between the values of indicators and the coefficient of risk perception is hindered by data constraints. Further research can adopt existing indicators to establish a precise correlation between values and risk perception, assisted by machine learning models and available data.
Author Contributions
Conceptualization, Z.Q. and Z.Z.; Data curation, Z.Q. and Z.Z.; Formal analysis, Z.Q. and Z.Z.; Investigation, Z.Q. and Z.Z.; Methodology, Z.Q. and Z.Z.; Resources, Z.Q. and Z.Z.; Software, Z.Z.; Supervision, Z.Q.; Validation, Z.Q. and Z.Z.; Visualization, Z.Q. and Z.Z.; Writing—original draft, Z.Z.; Writing—review and editing, Z.Q. and Z.Z. All authors have read and agreed to the published version of the manuscript.
Funding
This research received no external funding.
Data Availability Statement
Data are contained within the article.
Acknowledgments
We are grateful to all editors and reviewers.
Conflicts of Interest
The authors declare no conflicts of interest.
References
- Ling, Y.T.; Song, Z.; Yu, Y.; Jiang, T.Y. Dealing with an Aging China-Delaying Retirement or the Second-child Policy? PLoS ONE 2021, 16, e0242252. [Google Scholar] [CrossRef] [PubMed]
- Chan, A.P.C.; Yang, Y.; Choi, T.N.Y.; Nwaogu, J.M. Characteristics and Causes of Construction Accidents in a Large-Scale Development Project. Sustainability 2022, 14, 4449. [Google Scholar] [CrossRef]
- Lee, K.-E.; Kim, J.; Lee, J. Comparison of the Characteristics of Work-related Injuries between Older Workers and the Workers of the Conventional Working-age in the Republic of Korea, 2010–2014. Inj. Prev. 2021, 27, 227–231. [Google Scholar] [CrossRef] [PubMed]
- Merkus, S.L.; Lunde, L.-K.; Koch, M.; Waersted, M.; Knardahl, S.; Veiersted, K.B. Physical capacity, Occupational Physical Demands, and Relative Physical Strain of Older Employees in Construction and Healthcare. Int. Arch. Occup. Environ. Health 2019, 92, 295–307. [Google Scholar] [CrossRef] [PubMed]
- Anwer, S.; Li, H.; Antwi-Afari, M.F.; Umer, W.; Wong, A.Y.L. Evaluation of physiological metrics as real-time measurement of physical fatigue in construction workers: State-of-the-art review. J. Constr. Eng. Manag. 2021, 147, 03121001. [Google Scholar] [CrossRef]
- Fan, X.; Wang, D.; Tong, Z.; Wang, X. Investigation and Analysis of the Safety Risk Factors of Aging Construction Workers. Saf. Sci. 2023, 167, 106281. [Google Scholar] [CrossRef]
- Bravo, G.; Castellucci, H.I.; Lavalliere, M.; Arezes, P.M.; Martinez, M.; Duarte, G. The Influence of Age on Fatal Work Accidents and Lost Days in Chile between 2015 and 2019. Saf. Sci. 2022, 147, 105599. [Google Scholar] [CrossRef]
- Notice on Further Standardizing the Employment Age Management of Construction Enterprises. Available online: https://zjw.sh.gov.cn/xcsc2020-gfxwj/20200430/4a2ea3a5699f44e4abaabdafeea87e66.html (accessed on 11 March 2024).
- Notice on Further Pilot Application of “Jian’an Code” System for Construction Practitioners. Available online: http://jsszfhcxjst.jiangsu.gov.cn/art/2023/5/25/art_49384_10903427.html?eqid=cf90d610000adfa50000000564744aae (accessed on 12 April 2024).
- Peng, L.; Chan, A.H.S. A Meta-analysis of the Relationship between Ageing and Occupational Safety and Health. Saf. Sci. 2019, 112, 162–172. [Google Scholar] [CrossRef]
- Kamardeen, I.; Hasan, A. Occupational Health and Safety Implications of an Aging Workforce in the Australian Construction Industry. J. Constr. Eng. Manag. 2022, 148, 04022112. [Google Scholar] [CrossRef]
- Yi, K.H. The High-risk Groups According to the Trends and Characteristics of Fatal Occupational Injuries in Korean Workers Aged 50 Years and Above. Saf. Health Work 2018, 9, 184–191. [Google Scholar] [CrossRef]
- Peng, L.; Chan, A.H.S. Adjusting Work Conditions to Meet the Declined Health and Functional Capacity of Older Construction Workers in Hong Kong. Saf. Sci. 2020, 127, 11. [Google Scholar] [CrossRef]
- Al Nahyan, M.T.; Hawas, Y.E.; Raza, M. An exploratory study of relationships between stakeholders’ risk perceptions and their roles and experience in construction industry. Int. J. Constr. Manag. 2019, 21, 738–754. [Google Scholar] [CrossRef]
- Zhang, L.Y.; Qian, Q.Z. How Mediated Power Affects Opportunism in Owner-contractor Relationships: The Role of Risk Perceptions. Int. J. Proj. Manag. 2017, 35, 516–529. [Google Scholar] [CrossRef]
- Jia, L.; Qian, Q.K.; Meijer, F.; Visscher, H. Stakeholders’ Risk Perception: A Perspective for Proactive Risk Management in Residential Building Energy Retrofits in China. Sustainability 2020, 12, 2832. [Google Scholar] [CrossRef]
- Liu, J.Y.; Wang, Z.X.; Tang, J.S.; Song, J.C. The impact of the institutional environment of the host country on the perception of compliance risk of the international engineering contractor: The moderating effect of absorptive capacity. Eng. Constr. Archit. Manag. 2024, 31, 716–736. [Google Scholar] [CrossRef]
- Karmarkar, O.D.; Krishnan, S.G.; Delhi, V.S.K.; Velaga, N.R.R. Risk assessment of underground and elevated metro projects from clients’ and contractors’ perspective. Built Environ. Proj. Asset Manag. 2022, 12, 887–905. [Google Scholar] [CrossRef]
- Lv, L.L.; Li, H.M.; Wang, Z.F.; Zhang, C.Y.; Qiao, R. Evolutionary Game Analysis for Rent-seeking Behavior Supervision of Major Infrastructure Projects Based on Prospect Theory. J. Civ. Eng. Manag. 2022, 28, 6–24. [Google Scholar] [CrossRef]
- Zhang, Y.; Yi, X.; Li, S.; Qiu, H. Evolutionary game of government safety supervision for prefabricated building construction using system dynamics. Eng. Constr. Archit. Manag. 2023, 30, 2947–2968. [Google Scholar] [CrossRef]
- Liu, J.; Wang, X.; Liu, T. Behavior Choice Mechanisms and Tax Incentive Mechanisms in the Game of Construction Safety. Buildings 2022, 12, 1078. [Google Scholar] [CrossRef]
- Feng, Q.; Shi, X.; Zhang, J. Influence of rent-seeking on safety supervision in Chinese construction: Based on a simulation technology. Technol. Forecast. Soc. Change 2019, 138, 1–9. [Google Scholar] [CrossRef]
- Gong, S.T.; Gao, X.; Li, Z.; Chen, L.Y. Developing a Dynamic Supervision Mechanism to Improve Construction Safety Investment Supervision Efficiency in China: Theoretical Simulation of Evolutionary Game Process. Int. J. Environ. Res. Public Health 2021, 18, 3594. [Google Scholar] [CrossRef]
- Man, S.S.; Yu, R.; Zhang, T.; Chan, A.H.S. How optimism bias and safety climate influence the risk-taking behavior of construction workers. Int. J. Environ. Res. Public Health 2022, 19, 1243. [Google Scholar] [CrossRef] [PubMed]
- Kim, Y.J.; Skibniewski, M.J. Optimism Bias in Bidding: Contractors’ Horizontally Biased Estimating Behavior. J. Leg. Aff. Disput. Resolut. Eng. Constr. 2023, 15, 04523004. [Google Scholar] [CrossRef]
- Wolff, K.; Larsen, S.; Ogaard, T. How to define and measure risk perceptions. Ann. Tour. Res. 2019, 79, 102759. [Google Scholar] [CrossRef]
- Ng, R.; Rayner, S. Integrating psychometric and cultural theory approaches to formulate an alternative measure of risk perception. Innov. Eur. J. Soc. Sci. Res. 2010, 23, 85–100. [Google Scholar] [CrossRef]
- Liu, J.Y.; Lin, S.; Feng, Y.B. Understanding why Chinese contractors are not willing to purchase construction insurance. Eng. Constr. Archit. Manag. 2018, 25, 257–272. [Google Scholar] [CrossRef]
- Lu, S.K.; Yan, H. A comparative study of the measurements of perceived risk among contractors in China. Int. J. Proj. Manag. 2013, 31, 307–312. [Google Scholar] [CrossRef]
- Eboli, L.; Mazzulla, G.; Pungillo, G. Measuring the Driver’s Perception error in the Traffic Accident Risk Evaluation. IET Intell. Transp. Syst. 2017, 11, 659–666. [Google Scholar] [CrossRef]
- Liu, C.; Wang, Z.; Nacpil, E.J.C.; Hou, W.; Zheng, R. Analysis of visual risk perception model for braking control behaviour of human drivers: A literature review. IET Intell. Transp. Syst. 2022, 16, 711–724. [Google Scholar] [CrossRef]
- Trillo-Cabello, A.F.; Carrillo-Castrillo, J.A.; Rubio-Romero, J.C. Perception of risk in construction. Exploring the factors that influence experts in occupational health and safety. Saf. Sci. 2021, 133, 104990. [Google Scholar] [CrossRef]
- Szemere, T.P.; Garai-Fodor, M.; Csiszárik-Kocsir, A. Risk Approach-Risk Hierarchy or Construction Investment Risks in the Light of Interim Empiric Primary Research Conclusions. Risks 2021, 9, 84. [Google Scholar] [CrossRef]
- Chaswa, E.N.; Kosamu, I.B.M.; Kumwenda, S.; Utembe, W. Risk Perception and Its Influencing Factors among Construction Workers in Malawi. Safety 2020, 6, 33. [Google Scholar] [CrossRef]
- Law of the People’s Republic of China on the Prevention and Control of Occupational Diseases. Available online: http://www.npc.gov.cn/zgrdw/npc/xinwen/2017-11/28/content_2032715.htm (accessed on 12 April 2024).
- Regulations on Guaranteeing the Payment of Wages for Rural Migrant Workers. Available online: https://flk.npc.gov.cn/detail2.html?ZmY4MDgwODE3NzRjN2EzZDAxNzc2YzQxNjc0MzE1YjI (accessed on 12 April 2024).
- State Council Work Safety Commission Decision on Further Strengthening Safety Training. Available online: https://www.mohurd.gov.cn/gongkai/zhengce/zhengcefilelib/202304/20230427_771328.html (accessed on 12 April 2024).
- Construction Law of the People’s Republic of China. Available online: http://www.npc.gov.cn/zgrdw/npc/xinwen/2019-05/07/content_2086833.htm (accessed on 12 April 2024).
- Measures for the Administration of the Real-Name System for Construction Workers (Trial). Available online: https://www.mohurd.gov.cn/file/2023/20230508/2b2ff64a-a98d-41e9-b1ba-3b2b68a32f58.pdf (accessed on 12 April 2024).
- Measures for the Establishment of Safety Production Management Institutions and Full-time Safety Production Management Personnel in Construction Enterprises. Available online: http://www.gd.gov.cn/zwgk/wjk/zcfgk/content/post_2938449.html?eqid=8dfad7d400001cf40000000364269316 (accessed on 12 April 2024).
- Construction Enterprise Safety Production Management Standards. Available online: http://jncc.jinan.gov.cn/attach/0/815bf34bda7341cd97f0ecc4eba9614d.pdf (accessed on 12 April 2024).
- Spielman, S.E.; Tuccillo, J.; Folch, D.C.; Schweikert, A.; Davies, R.; Wood, N.; Tate, E. Evaluating social vulnerability indicators: Criteria and their application to the Social Vulnerability Index. Nat. Hazards 2020, 100, 417–436. [Google Scholar] [CrossRef]
- Smith, M.; Lix, L.M.; Azimaee, M.; Enns, J.E.; Orr, J.; Hong, S.; Roos, L.L. Assessing the quality of administrative data for research: A framework from the Manitoba Centre for Health Policy. J. Am. Med. Inform. Assoc. 2018, 25, 224–229. [Google Scholar] [CrossRef] [PubMed]
- Costa, C.; Freitas, Â.; Stefanik, I.; Krafft, T.; Pilot, E.; Morrison, J.; Santana, P. Evaluation of data availability on population health indicators at the regional level across the European Union. Popul. Health Metrics 2019, 17, 11. [Google Scholar] [CrossRef]
- Rediske, G.; Michels, L.; Siluk, J.C.M.; Rigo, P.D.; Rosa, C.B.; Lima, A.C. A proposed set of indicators for evaluating the performance of the operation and maintenance of photovoltaic plants. Appl. Energy 2024, 354, 122158. [Google Scholar] [CrossRef]
- Sánchez-Ortiz, J.; Rodríguez-Cornejo, V.; Del Rio-Sanchez, R.; García-Valderrama, T. Indicators to measure efficiency in circular economies. Sustainability 2020, 12, 4483. [Google Scholar] [CrossRef]
- Wu, X.; Zheng, W.; Xia, X.; Lo, D. Data quality matters: A case study on data label correctness for security bug report prediction. IEEE Trans. Softw. Eng. 2021, 48, 2541–2556. [Google Scholar] [CrossRef]
- Cappiello, C.; Comuzzi, M.; Plebani, P.; Fim, M. Assessing and improving measurability of process performance indicators based on quality of logs. Inf. Syst. 2022, 103, 101874. [Google Scholar] [CrossRef]
- Zhang, L.M.; Ding, L.Y.; Wu, X.G.; Skibniewski, M.J. An Improved Dempster-Shafer Approach to Construction Safety Risk Perception. Knowl.-Based Syst. 2017, 132, 30–46. [Google Scholar] [CrossRef]
- Chen, Z.Y.; Xia, L.; Su, Y.Y.; Chen, G.R.; Zhang, Z.Y. Research on the evolutionary game of safety behavior of EPC consortium members based on prospect theory. J. Asian Archit. Build. Eng. 2024, 1–19. [Google Scholar] [CrossRef]
- Interim Measures for Credit Management in the Construction Market. Available online: https://www.mohurd.gov.cn/gongkai/zhengce/zhengcefilelib/201712/20171215_234394.html (accessed on 12 April 2024).
- Wang, D.; Jia, Q.; Zhang, R. Evolutionary Game and Simulation of Subject Risk Management Behavior in Construction Stage of Engineering Project Based on Strong Reciprocity and Prospect Theory. IEEE Access 2021, 9, 74789–74801. [Google Scholar] [CrossRef]
Figure 1.
Research technical roadmap.
Figure 1.
Research technical roadmap.
Figure 2.
Stakeholders directly involved in the management of overage workers.
Figure 2.
Stakeholders directly involved in the management of overage workers.
Figure 3.
Variations in the number of overage workers across game situations.
Figure 3.
Variations in the number of overage workers across game situations.
Figure 4.
Evolutionary phase diagrams. (a) Contractor; (b) supervisor; (c) regulator.
Figure 4.
Evolutionary phase diagrams. (a) Contractor; (b) supervisor; (c) regulator.
Figure 5.
The game trajectories with the participation of various optimistically biased contractors. (a) Trajectories among optimistically biased contractor, supervisor, and regulator. (b) Trajectories between optimistically biased contractor and supervisor. (c) Trajectories between optimistically biased contractor and regulator.
Figure 6.
The game trajectories with the participation of a pessimistically biased contractor. (a) Trajectories among pessimistically biased contractor, supervisor, and regulator. (b) Trajectories between pessimistically biased contractor and supervisor. (c) Trajectories between pessimistically biased contractor and regulator.
Figure 7.
Simulation of supervisor’s supervisory strategies. (a) Increasing the initial probability of Rigorous Inspection. (b) Enhancing penalties for the contractor’s dereliction of duty.
Figure 7.
Simulation of supervisor’s supervisory strategies. (a) Increasing the initial probability of Rigorous Inspection. (b) Enhancing penalties for the contractor’s dereliction of duty.
Figure 8.
Simulation of the regulator’s supervisory strategy. (a) Contractor’s performance under five combinations of future returns and future losses (taking the contractor with as the example). (b) Performance of contractors with varying risk perception under (HL, HR) and (ML, MR).
Figure 8.
Simulation of the regulator’s supervisory strategy. (a) Contractor’s performance under five combinations of future returns and future losses (taking the contractor with as the example). (b) Performance of contractors with varying risk perception under (HL, HR) and (ML, MR).
Table 1.
Identification of candidate indicators for contractor’s risk perception measurement.
Table 1.
Identification of candidate indicators for contractor’s risk perception measurement.
| Phase | Management Behavior | Exposure Pathway for OWs | Candidate Indicator | Basis |
|---|
| Before | Organizing
Physical Examinations | Unqualified physical examination index | a. Proportion of physically examined workers | [35] |
Signing
Contracts | Exposure of the actual age during contract signing | b. Proportion of workers who have signed a contract | [36] |
Conducting
Training | Slower response during training | c. Hours of three-level training | [37,38] |
Registering
Identification | Exposure of the actual age during the registration | d. Proportion of real-name-
registered workers | [39] |
| During | Verifying
Identities | Failure of real-name verification | e. Frequency of applying the real-name channel | [39] |
| After | Inspecting
Construction Sites | Poorer physical fitness and agility performance at work | f. Number of the full-time safety personnel hired by the contractor | [40] |
g. Frequency of the
contractor’s inspections | [41] |
Verifying
Worker–Account
Alignment | Inconsistency between bank account owner and worker’s registered identification | h. Proportion of verified bank accounts | [36] |
| i. Proportion of workers paid by the contractor | [36] |
Table 2.
Assessment of candidate indicators for the contractor’s risk perception.
Table 2.
Assessment of candidate indicators for the contractor’s risk perception.
| Criteria | Assessments * |
|---|
| a | b | c | d | e | f | g | h | i |
|---|
| Correlation | H | L | H | H | H | H | H | H | L |
| Validity | Y | N | Y | Y | Y | Y | Y | Y | Y |
| Availability | N | Y | Y | Y | Y | Y | Y | N | N |
| Measurability | Y | Y | Y | Y | Y | Y | Y | N | Y |
| Decision | Out | Out | In | In | In | In | In | Out | Out |
Table 3.
Meaning and data collection method of each indicator.
Table 3.
Meaning and data collection method of each indicator.
| Evaluation Indicator | Meaning | Data Collection Method |
|---|
| c. Hours of three-level training | Total training hours workers received from the working team, project, and company. | Inspecting workers’ training records [41]. |
| d. Proportion of real-name registered workers | Proportion of workers with identification registered. | On-site investigation, and compared to the data from the real-name management system [39]. |
| e. Frequency of applying the real-name channel | Proportion of real-name-channel-activated days. | Accessing data from the real-name management system [39]. |
| f. Number of the full-time safety personnel hired by the contractor | Number of the full-time safety personnel employed by the contractor and in charge of checking the workers’ identity. | On-site investigation. |
g. Frequency of the
contractor’s inspections | Ratio of inspection times (by safety personnel) to the days during the project’s rush period. | Examining safety inspection records [41]. |
Table 4.
Grades and scores of values.
Table 4.
Grades and scores of values.
| Indicators (Unit) | Grades and Scores |
|---|
A
(7 Points) | B
(6 Points) | C
(5 Points) | D
(4 Points) | E
(3 Points) | F
(2 Points) | G
(1 Point) |
|---|
| c. Hours of three-level training (Hours) | [32, +∞) | [28, 32) | [24, 28) | (16, 24) | (8, 16] | (0, 8] | 0 |
| d. Proportion of real-name registered workers | 1 | [0.9, 1) | [0.8, 0.9) | (0.6, 0.8) | (0.3, 0.6] | (0, 0.3] | 0 |
| e. Frequency of applying the real-name channel (Average times per day) | 1 | [0.9, 1) | [0.8, 0.9) | (0.6, 0.8) | (0.3, 0.6] | (0, 0.3] | 0 |
| f. Number of the full-time safety personnel hired by the contractor (Persons) | [6, +∞) | 5 | 4 | 3 | 2 | 1 | 0 |
| g. Frequency of the contractor’s inspections (Average times per week) | [7, +∞) | [6, 7) | [5, 6) | (3, 5) | (1, 3] | (0, 1] | 0 |
Table 5.
Symbols related to the number of overage workers.
Table 5.
Symbols related to the number of overage workers.
| Symbol | Meaning | Note |
|---|
| Initial number of on-site OWs existing objectively. | |
| Number of OWs identified by contractor and supervisor. | |
| Number of OWs identified by regulator. | |
| * | Number of OWs eliminated by contractor in each situation. | |
| Number of OWs eliminated by supervisor in each situation. | |
| Number of OWs eliminated by regulator in each situation. | |
| Number of OWs after contractor’s and supervisor’s elimination. | |
| Number of OWs uneliminated. | |
Table 6.
Parameters and meanings of utilities.
Table 6.
Parameters and meanings of utilities.
| Parameter | Meaning | Note |
|---|
| Contractor’s Additional Management Costs. | |
| Contractor’s Penalties for Dereliction of Duty. | |
| Contractor’s Additional Recruitment Costs. | |
| Contractor’s Future Losses in the 3rd situation (P, L, S). | |
| Contractor’s Future Losses in the 7th situation (N, L, S). | |
| Contractor’s Future Returns. | |
| Contractor’s Risk Perception Coefficient. | |
| Supervisor’s Additional Inspection Costs. | |
| Supervisor’s Penalties for Dereliction of Duty. | |
| Coefficient of Supervisor’s Joint Liability for Accidents. | |
| Supervisor’s Future Losses in the 3rd situation (P, L, S). | |
| Supervisor’s Future Losses in the 7th situation (N, L, S). | |
| Supervisor’s Future Returns. | |
| Probability of Accidents in the 4th situation (P, L, W). | |
| Probability of Accidents in the 8th situation (N, L, W). | |
| Direct Loss of Accidents. | |
| Regulator’s Extra Supervision Costs. | |
| Regulator’s Penalties for Dereliction of Duty. | |
| Regulator’s Regulatory Responsibility of Accidents. | |
| Regulator’s Enforcement Costs. | |
Table 7.
Payment matrix.
| Regulator | Contractor | Supervisor |
|---|
| Rigorous Inspection | Lax Inspection |
|---|
Strong
Supervision | Positive
Management | | |
| |
| |
Negative
Management | | |
| |
| |
Weak
Supervision | Positive
Management | | |
| |
| |
Negative
Management | | |
| |
| |
| Disclaimer/Publisher’s Note: The statements, opinions and data contained in all publications are solely those of the individual author(s) and contributor(s) and not of MDPI and/or the editor(s). MDPI and/or the editor(s) disclaim responsibility for any injury to people or property resulting from any ideas, methods, instructions or products referred to in the content. |
© 2024 by the authors. Licensee MDPI, Basel, Switzerland. This article is an open access article distributed under the terms and conditions of the Creative Commons Attribution (CC BY) license (https://creativecommons.org/licenses/by/4.0/).


