Article

Influence of Specimen Size on the Compressive Strength of Wood

1
Shock and Vibration of Engineering Materials and Structures Key Laboratory of Sichuan Province, Mianyang 621010, China
2
School of Civil Engineering and Architecture, Southwest University of Science and Technology, Mianyang 621010, China
*
Author to whom correspondence should be addressed.
Buildings 2024, 14(4), 1156; https://doi.org/10.3390/buildings14041156
Submission received: 28 February 2024 / Revised: 11 April 2024 / Accepted: 13 April 2024 / Published: 19 April 2024
(This article belongs to the Special Issue Research on Seismic Performance of Timber/Bamboo Buildings)

Abstract

:
This study aimed to discuss the influence of specimen sizes on the compressive strength parameters of wood, specifically focusing on their compression strength, elastic modulus, and Poisson’s ratio. Therefore, three different-sized specimens (20 mm × 20 mm × 30 mm, 40 mm × 40 mm × 60 mm, 60 mm × 90 mm × 90 mm) were manufactured and tested in the longitudinal, radial, and tangential directions, following the standard testing method for acquiring the compressive strength of wood. Subsequently, based on the experimental results, compressive parameters, failure mechanisms, load–displacement curves, and stress–strain relationships were systematically analyzed for the three different-sized specimens. Meanwhile, the influence of specimen size on the compressive strength parameters of wood was also evaluated through finite element numerical simulations, utilizing the obtained mechanical parameters. The results revealed a significant correlation between compressive strength and specimen size, indicating a decrease in compressive strength with an increasing specimen size. Conversely, the elastic modulus and Poisson’s ratio exhibited less sensitivity to specimen size changes. Notably, the compressive strength parameters derived from small-sized specimens (20 mm × 20 mm × 30 mm) exhibited a lack of rationality, while those obtained from medium-sized (40 mm × 40 mm × 60 mm), and large-sized specimens (60 mm × 90 mm × 90 mm) demonstrated greater reliability, providing precise results in finite element numerical simulations.

1. Introduction

In recent years, escalating concerns about environmental sustainability have spurred an increased interest in sustainable materials for structural applications. The choice of structural materials significantly influences the global environment, particularly in terms of the greenhouse effect. Wood, with its ability to absorb carbon dioxide from the atmosphere, is increasingly recognized as a natural and eco-friendly building material within the construction industry [1]. However, unlike isotropic materials, such as steel, wood exhibits anisotropic properties in the longitudinal (L), radial (R), and tangential (T) directions [2]. This characteristic necessitates the consideration of a greater number of physical and mechanical parameters during numerical simulations, calculations, and analysis. Consequently, the exploration of wood’s mechanical properties, the development of strength criteria, and the establishment of constitutive models have garnered attention from numerous researchers [3,4]. Despite extensive research on the mechanical behavior of wood, the fundamental step of acquiring basic physical and mechanical properties remains crucial [5]. Wood, influenced by its growth patterns, is inherently porous and non-uniform. The various physical and mechanical properties of wood are susceptible to change due to factors such as tree species, age, distance from the heartwood, and the direction of applied force [6]. Therefore, obtaining accurate physical and mechanical parameters for wood is of significant importance for a deeper understanding and rational utilization of this versatile material.
According to Chinese standards, the acquisition of compressive strength and physical-mechanical parameters of wood predominantly adheres to established technical regulations [7,8,9]. These regulations prescribe the use of test specimens with dimensions of 30 mm × 20 mm × 20 mm. It is noteworthy that researchers, both in China and internationally, have employed varying specimen sizes in their studies on wood structures. For instance, Mascia N. T. et al. [10] utilized 5 mm × 5 mm × 5 mm specimens to investigate the influence of the elastic modulus on the mechanical properties of wood. Li L. et al. [11] employed specimens measuring 21 mm × 14 mm × 14 mm to determine the radial and tangential elastic modulus of pine wood. In an examination of the bending performance of glued laminated timber beams reinforced with FRP, specimens sized at 100 mm × 35 mm × 35 mm were utilized to obtain the compressive performance parameters of wood. Yang Na et al. [12] conducted axial compressive tests on red pine wood using prism specimens measuring 40 mm × 20 mm × 20 mm to determine the elastic constants of red pine wood while exploring non-linear constitutive models for wood under compression. Additionally, Yue Kong et al. [13] investigated the influence of temperature on wood compressive strength using specimens sized at 60 mm × 20 mm × 20 mm. While researchers domestically and internationally have employed diverse specimen sizes in their experiments and research, the current standard specimen size of 30 mm × 20 mm × 20 mm, as specified by testing methods and technical regulations, may not adequately consider the influence of growth patterns and annual ring variations. It is known that the compressive strength of concrete changes based on specimen sizes and shapes [14], and the influence of specimen size on the compressive strength of concrete has been extensively studied [15,16,17,18,19]. Mechanical parameters, such as the compressive strength of wood influenced by specimen sizes, have not been thoroughly investigated. In recent years, Schlotzhauer P., etc., have given significant attention to this issue [20]. Studies of the size effect on defect-free compression, bending, and tensile specimens were conducted for six European hardwood species: maple (Acer spp.); birch (Betula pendula); beech (Fagus sylvatica); ash (Fraxinus excelsior); oak (Quercus spp.); and lime (Tilia spp.). However, a consistent experimental conclusion was not obtained, and only tests on the longitudinal compressive strength of wood were carried out. Meanwhile, issues related to strength in different directions concerning the growth ring in the cross-section have garnered attention [21,22,23,24,25]. The compressive properties of FRP [26,27] confined wood have also been studied. Figure 1 illustrates that the dimensions of the specimen’s cross-sectional side, when sawn along the lag, are approximately the same as the width of one annual ring, as shown in Figure 1a. Conversely, if the specimens are sawn in this manner, the dimension of the cross-sectional side is approximately the same as the width of 2–3 annual rings, as shown in Figure 1b. The size of the compression specimens will also impact the compressive strength parameter values of the wood.
To address these concerns, this experiment aims to investigate the impact of specimen size on the experiment results of compressive strength parameters for wood. The objective of this study is to discern variations in the mechanical properties of wood obtained from different-size specimens to understand how specimen size influences the mechanical parameter experiment results of wood. To establish a comprehensive understanding of the relationship between the specimen size and wood mechanical properties experiment results, a constitutive model expressing the stress–strain relationship was developed based on the experimental data. Subsequently, finite element numerical simulations were employed to further explore the influence of specimen size on the get the rational compressive strength parameter of wood. The outcomes of these experiments and simulations provide insights into the significance of considering specimen size when evaluating the physical and mechanical parameters of wood. The results suggest that specimen size indeed impacts obtaining the rational compressive strength parameters of wood, indicating the potential presence of a size effect.
The conclusions of this article can provide a strong reference for proposing a unified size of wood compressive strength specimens. This is also important for the computational analysis and finite numerical simulation of the axial compressive bearing capacity of wooden column components, based on the rational compressive strength parameters obtained according to the suggestion.

2. Test Program

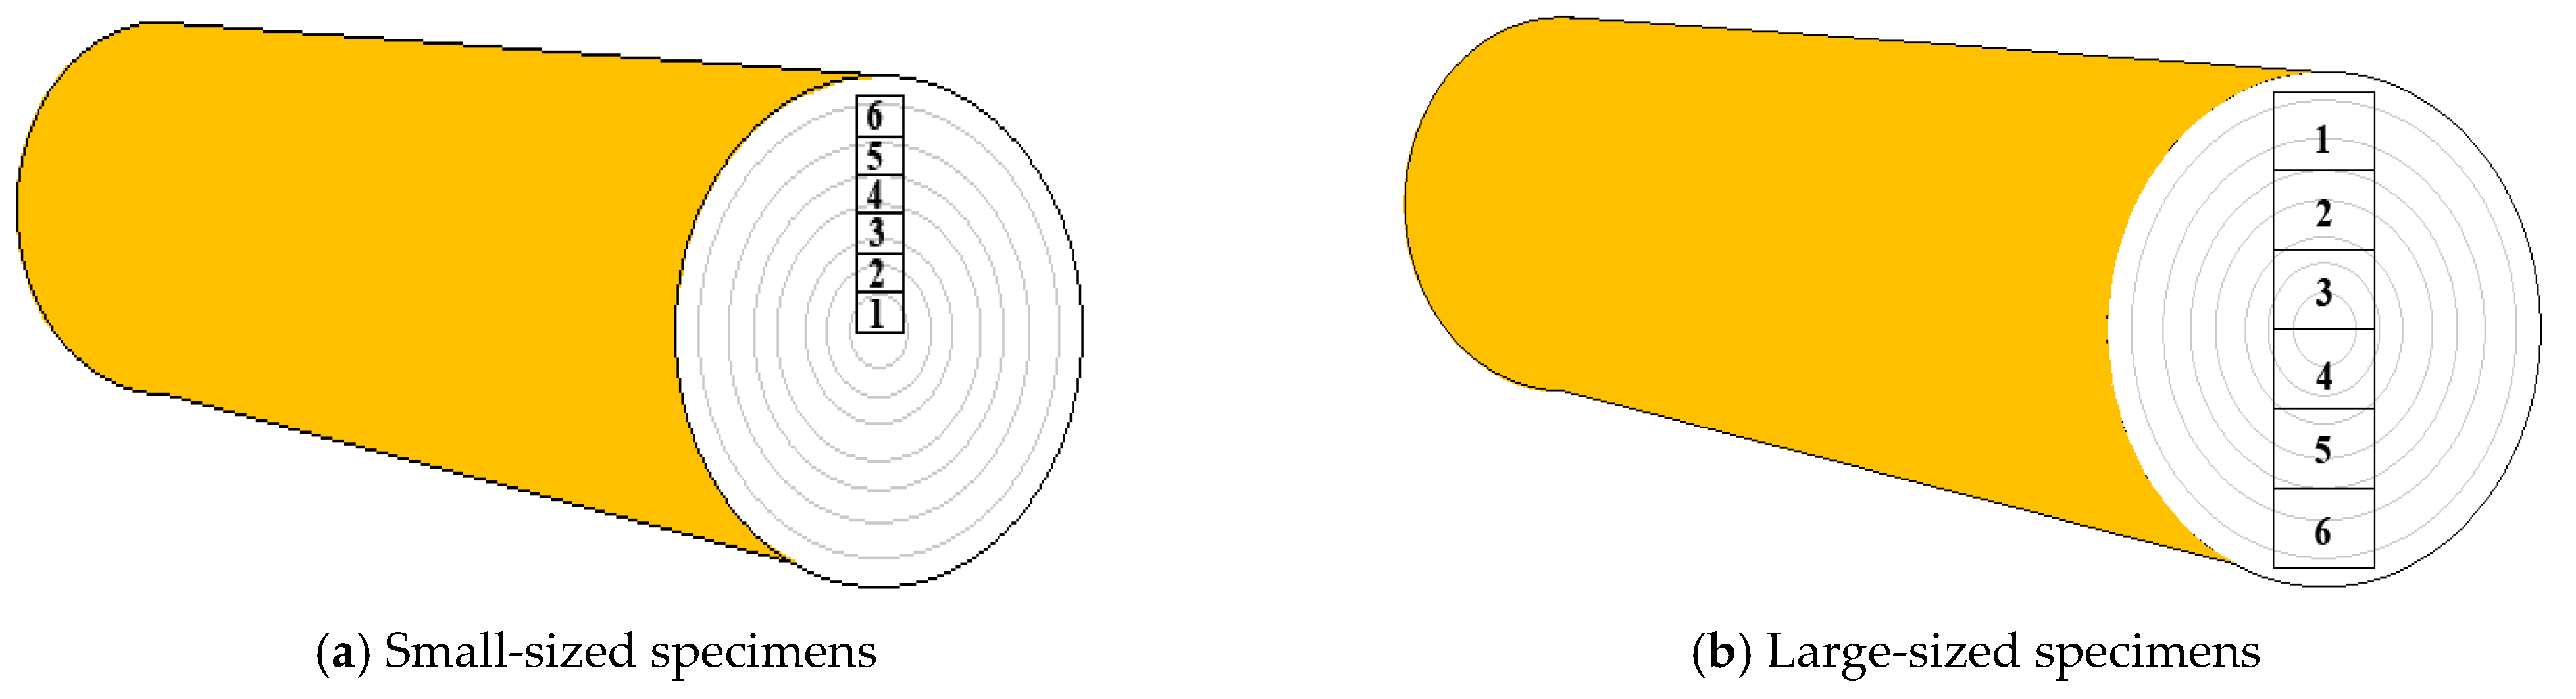
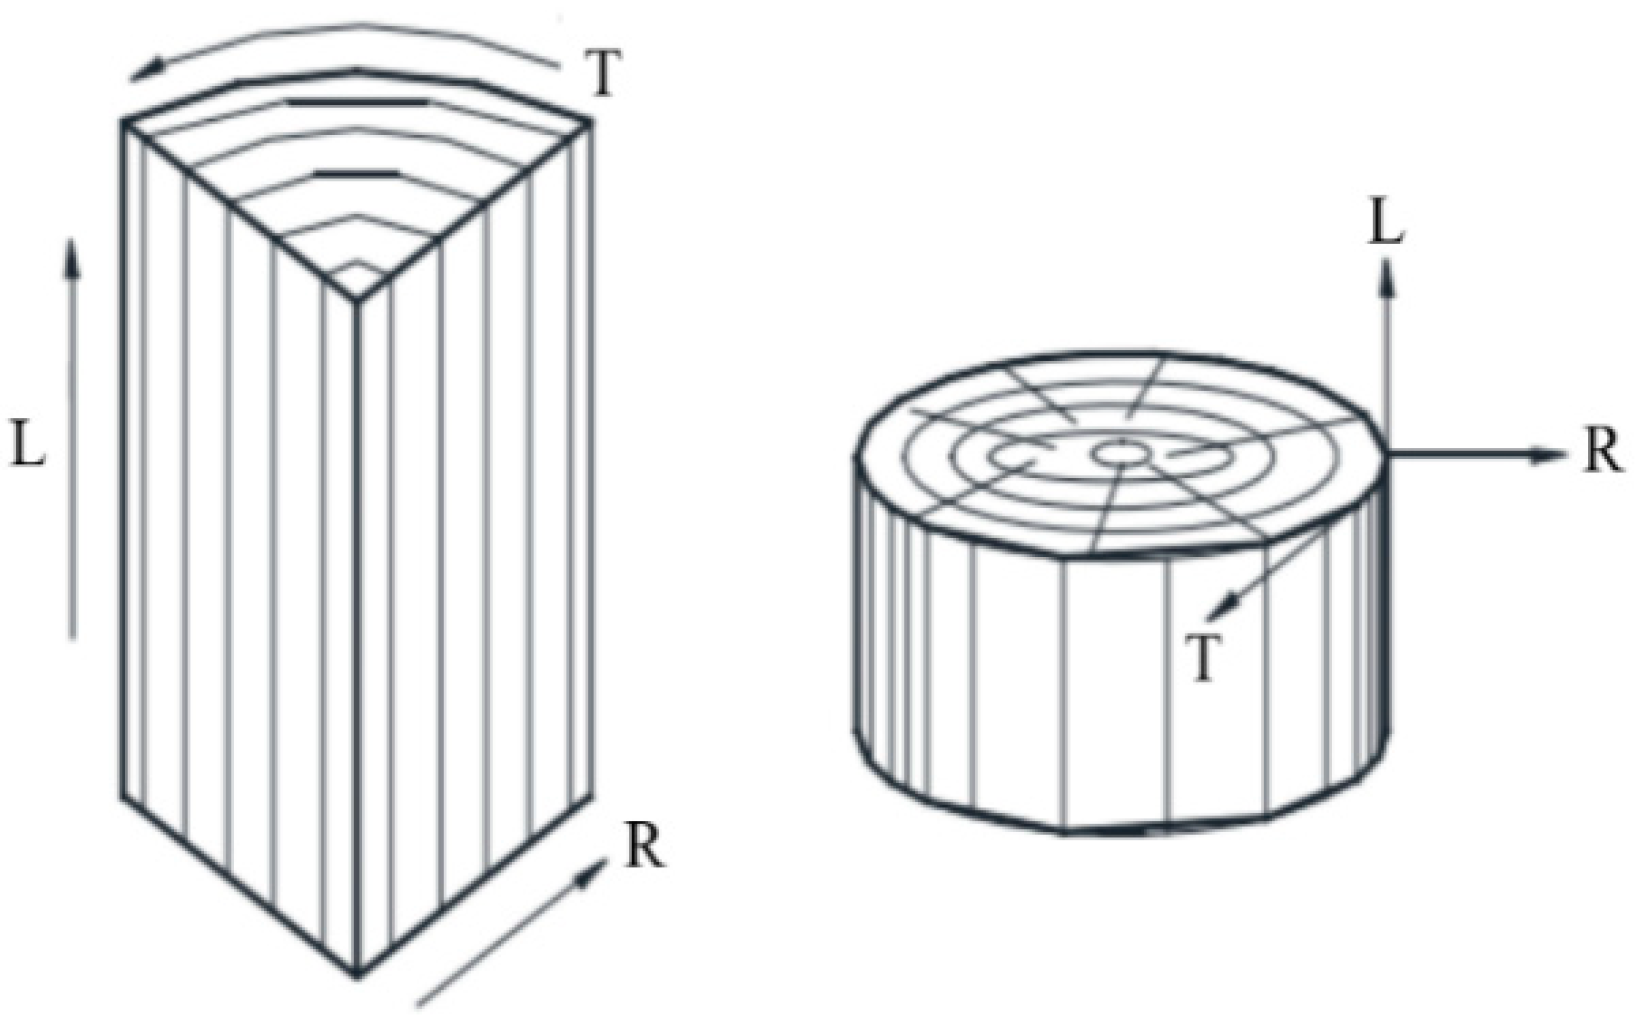
2.1. Experimental Design

To investigate the influence of specimen size on the compressive strength of wood, three sets of experiments were meticulously planned. Each set focused on assessing the impact of specimen size on the longitudinal, radial, and tangential compressive strength of Cinnamomum camphora wood, with all specimens sourced from the same origin. The smaller annual width of the Cinnamomum camphora wood is 10–20 cm, and the bigger annual width of the Cinnamomum camphora wood is 25–40 cm. The Cinnamomum camphora wood was precisely sawn following the diagram in Figure 2 and was subsequently subjected to oven drying to achieve the required moisture content for testing, set at 12%, which was designed according to GB/T 1935-2009 [7] and GB/T 1939-2009 [8].
According to GB/T 1939-2009 [8] and GB/T 50005-2017 [9], the basic specimens (small-sized specimens) measuring 20 mm × 20 mm × 30 mm were obtained in the longitudinal, radial, and tangential directions. Subsequently, medium-sized specimens (specimen size 40 mm × 40 mm × 60 mm) and large-sized specimens (specimen size 60 mm × 90 mm × 90 mm) were produced with a proportional ratio of 1:2:3, relative to the basic specimens in dimensions. A total of 6 specimens were prepared as one group for each direction and size, resulting in a total of 54 specimens.

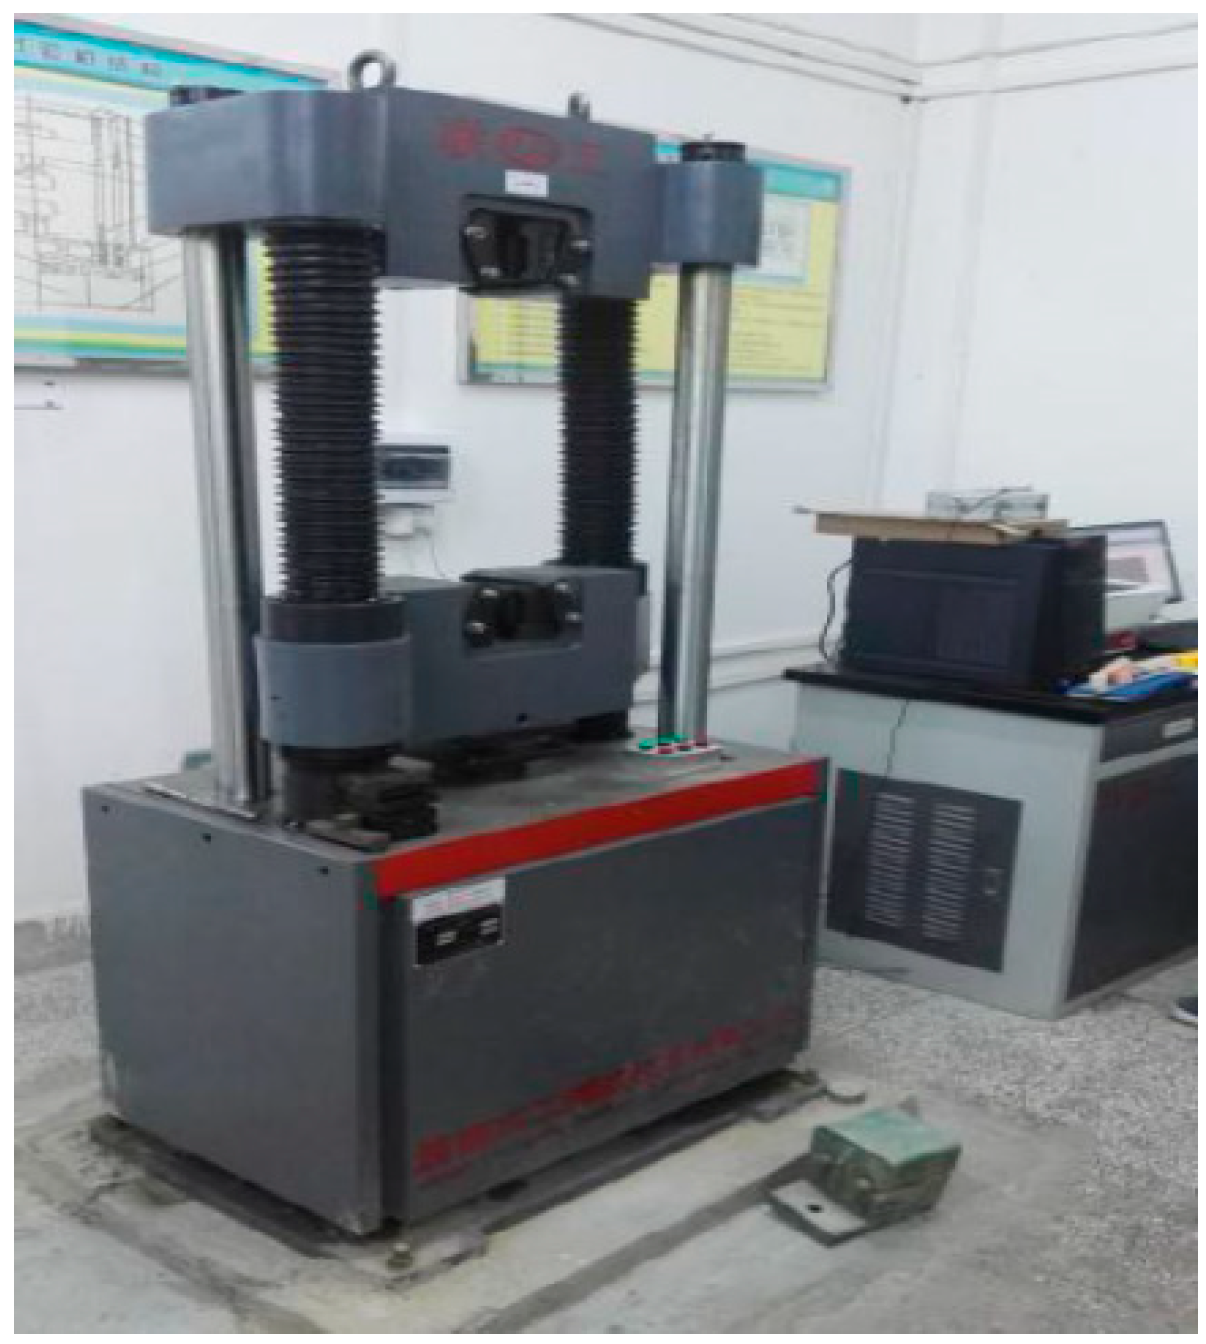
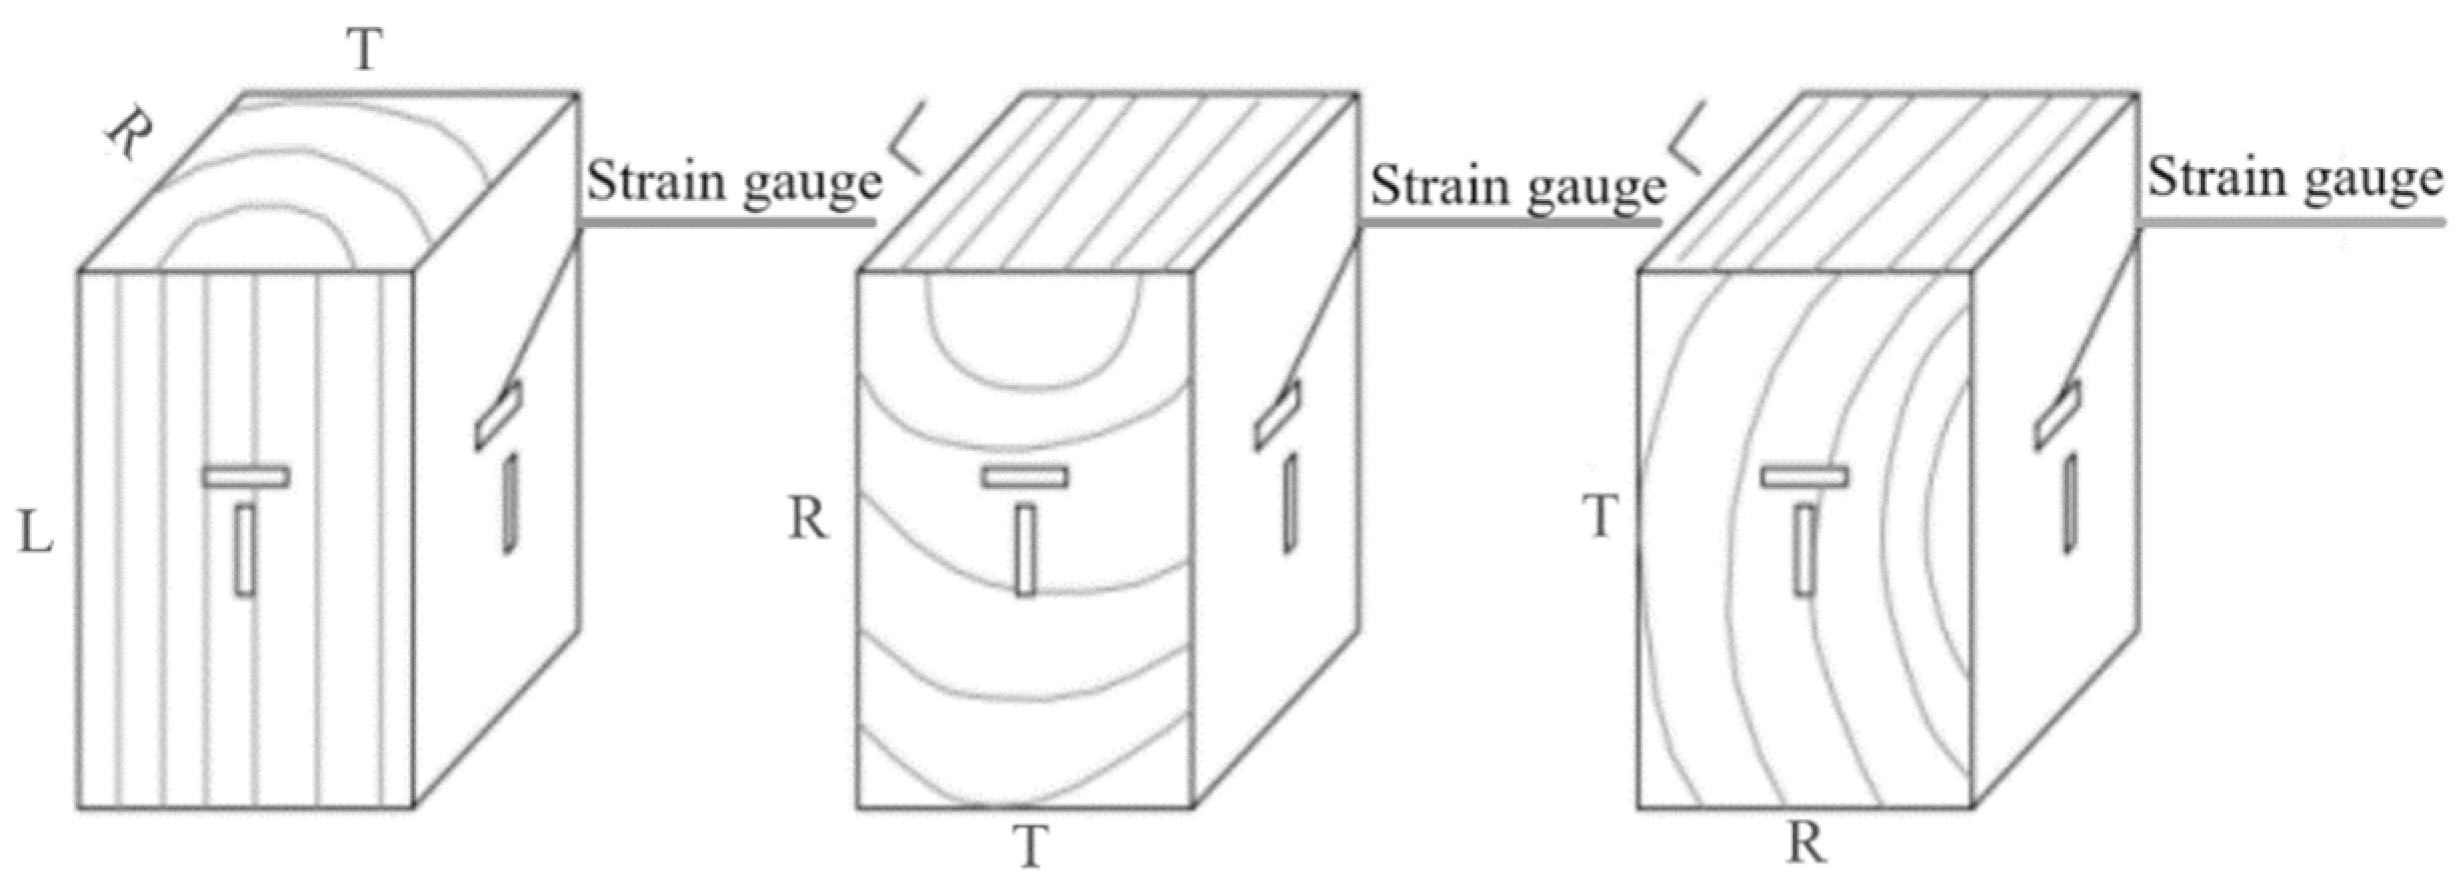
2.2. Loading and Measurement Plan

The compressive tests were carried out utilizing a material mechanics universal testing machine with an ultimate capacity of 300 kN, as shown in Figure 3. The load, strain, and axial deformation were monitored using an electronic data acquisition system. Two axial strain gauges and transverse strain gauges were mounted at the center of the specimens to record strain during testing, as shown in Figure 4. Loading was applied using continuous uniform displacement loading and the displacement loading rate of 2 mm/min was used. The test was terminated when the specimen incurred large cracking damage, or a distinct unloading phenomenon was observed. These data were collected to explore how specimen size influences parameters, such as wood elastic modulus and Poisson’s ratio.

3. Experimental Results

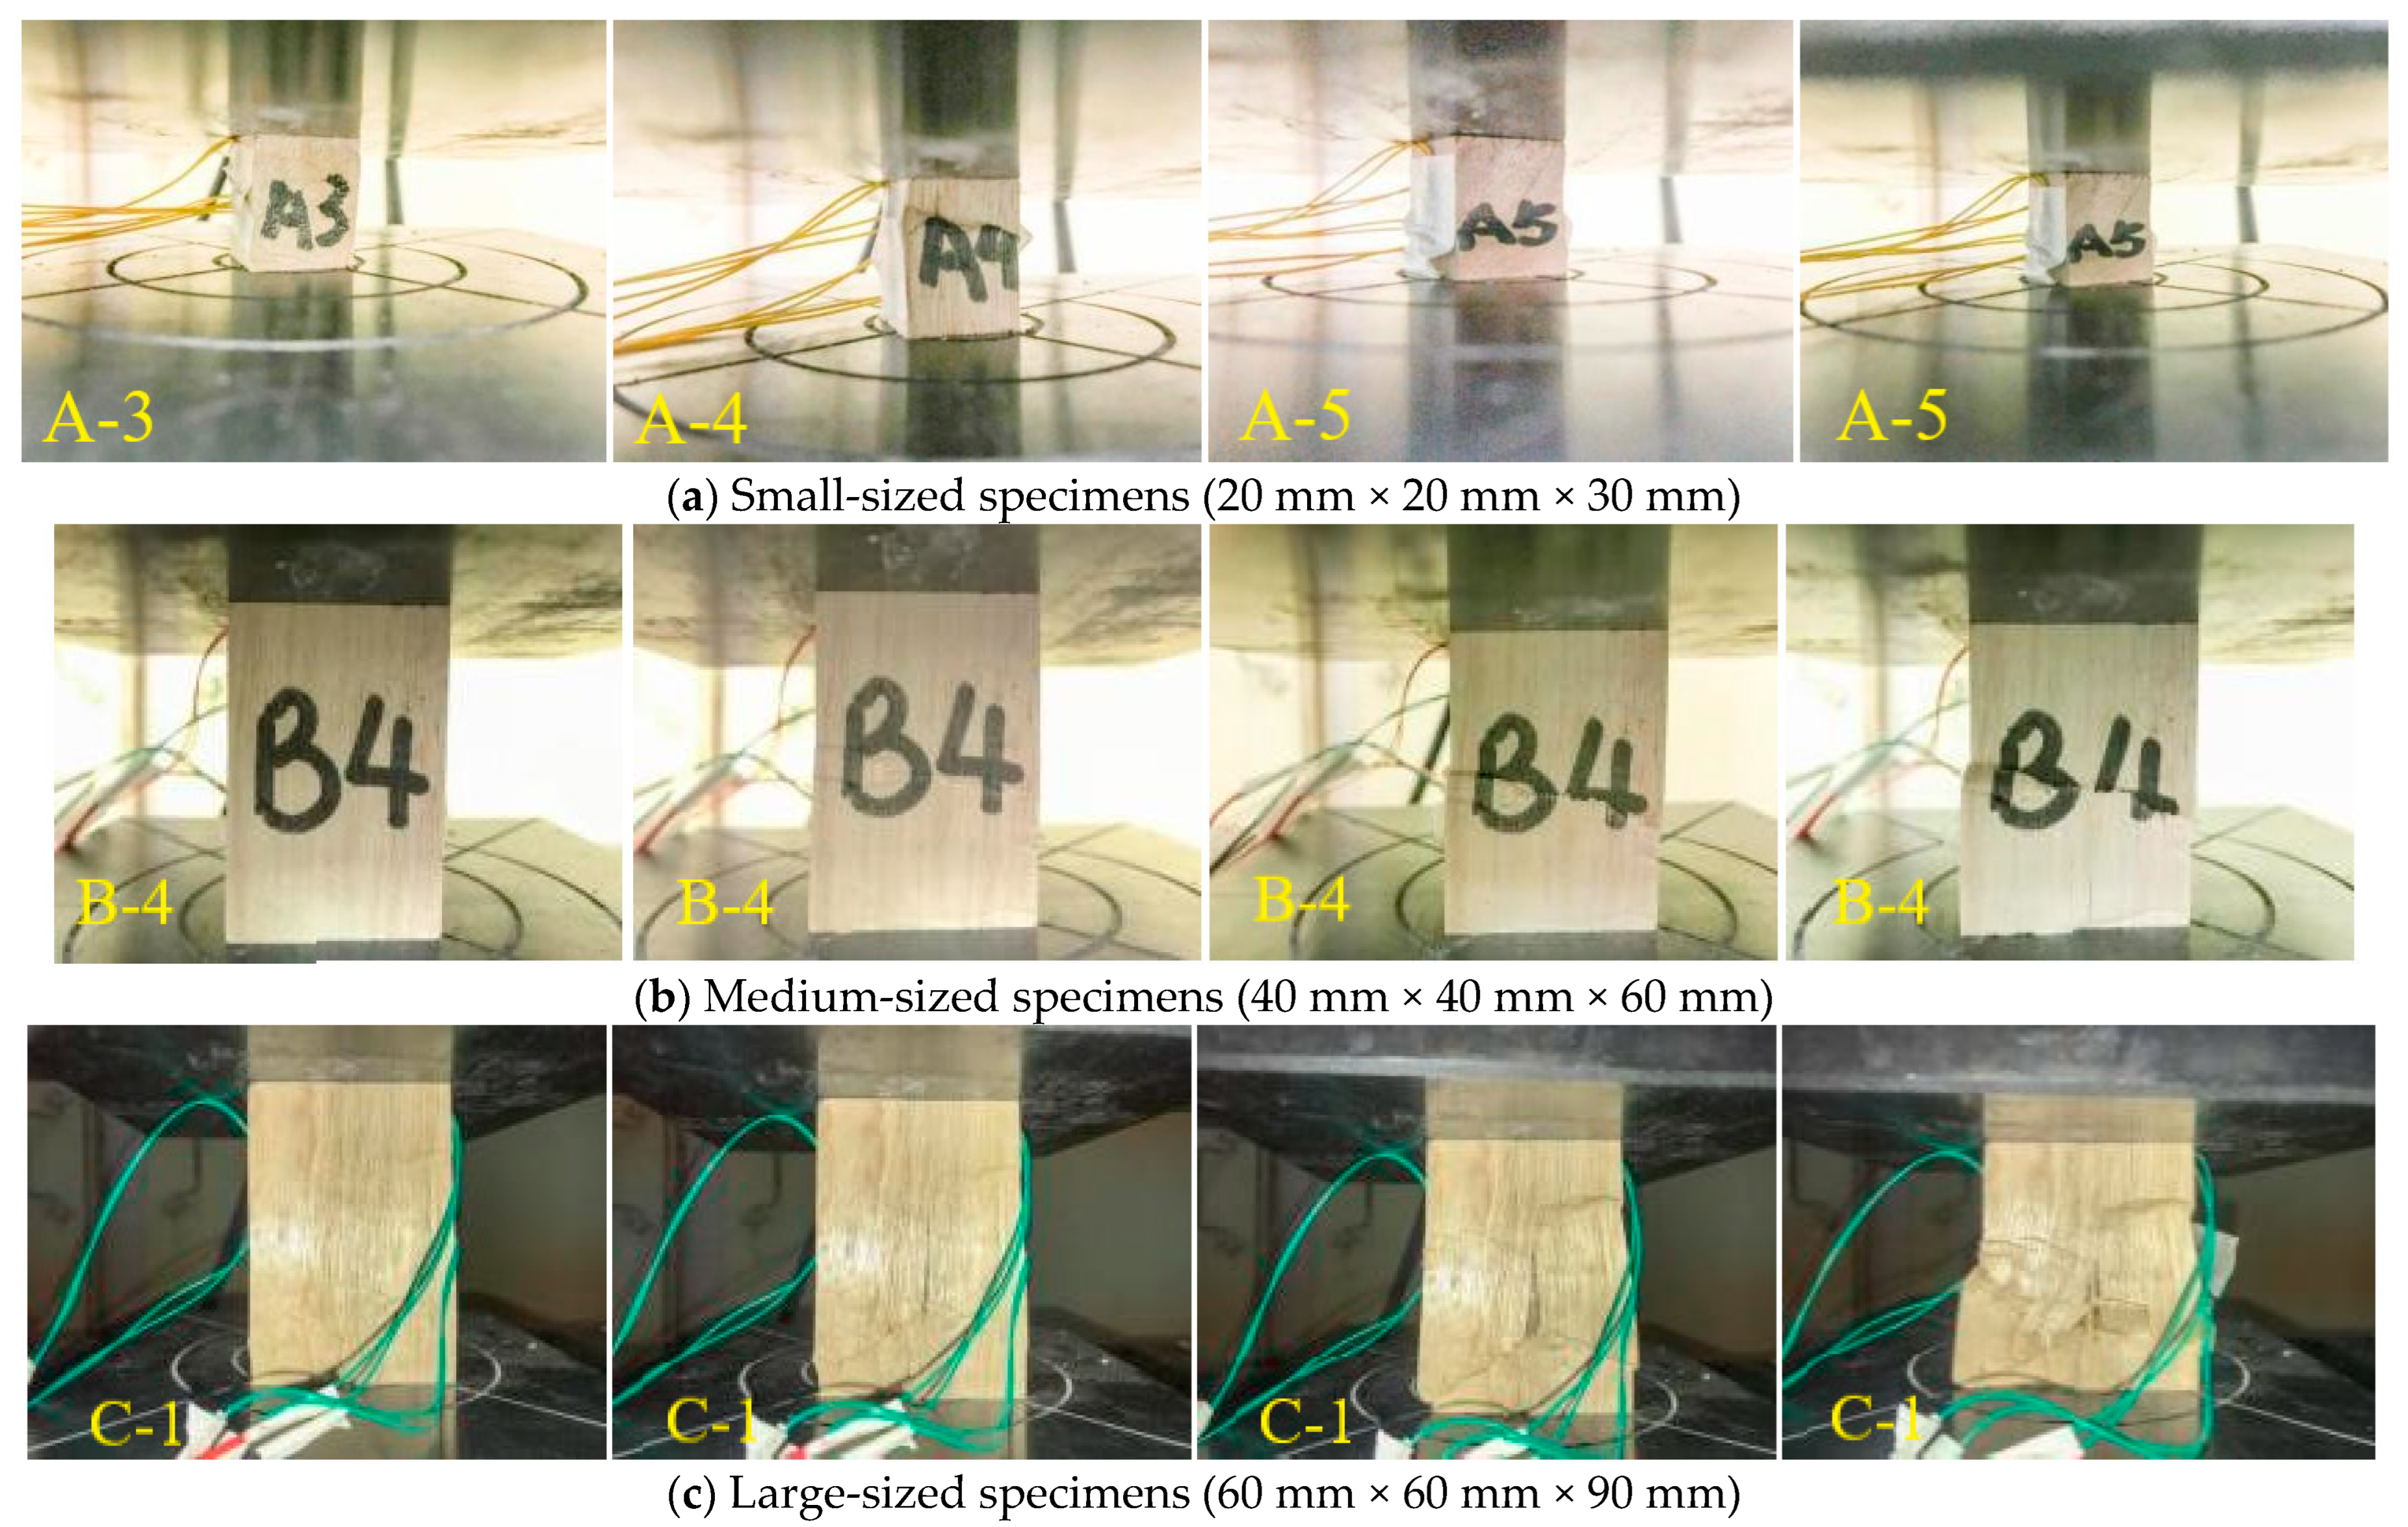
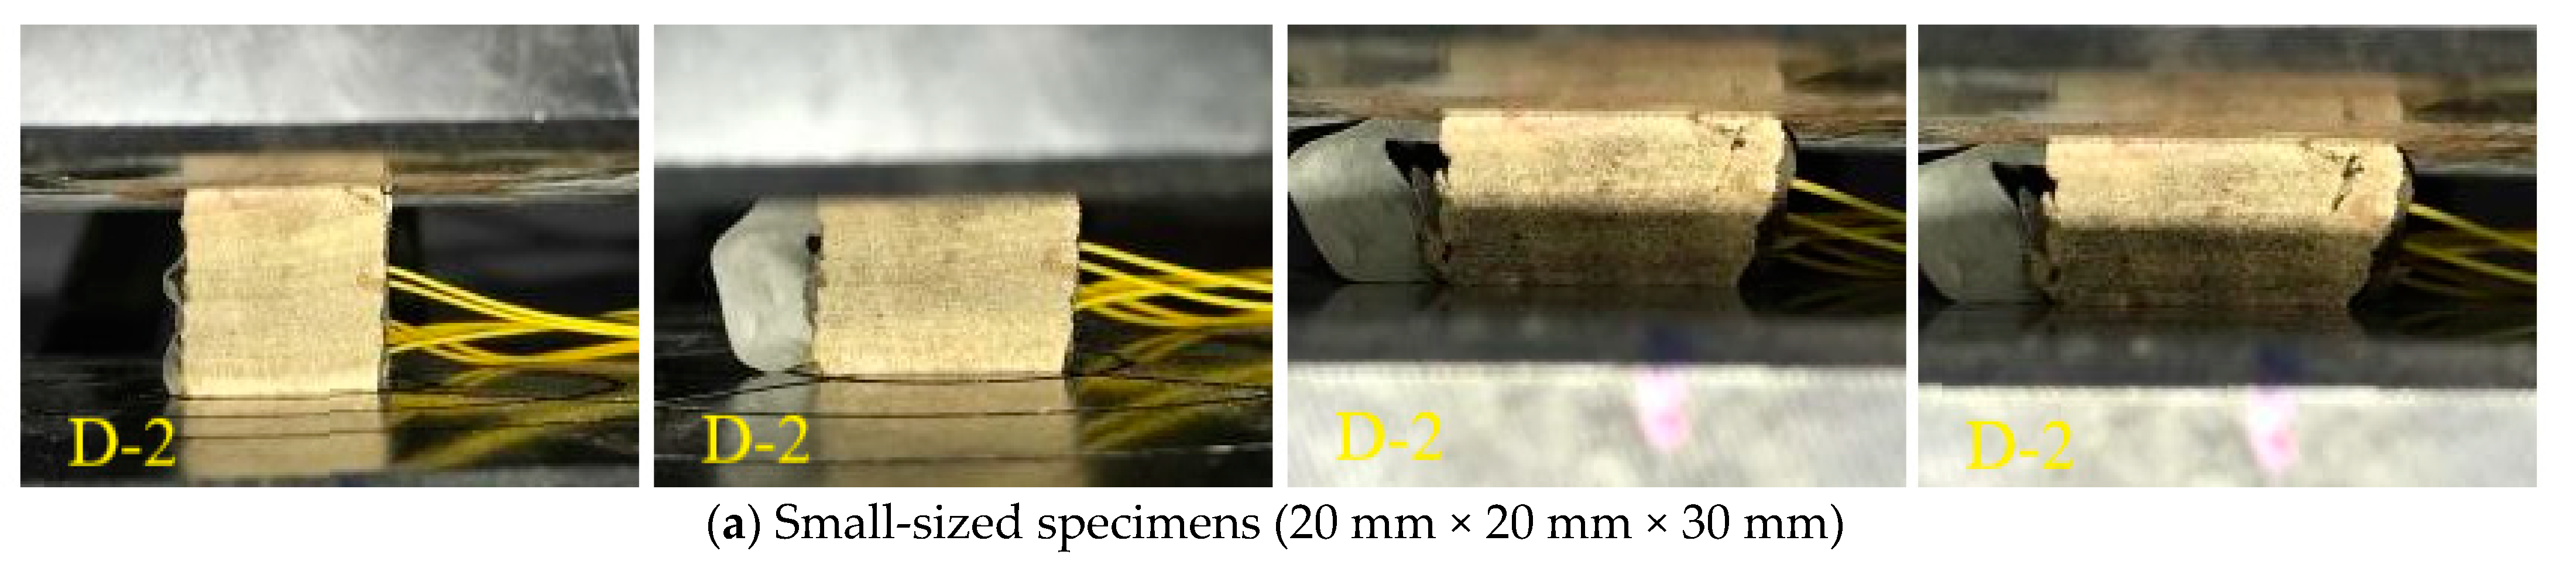
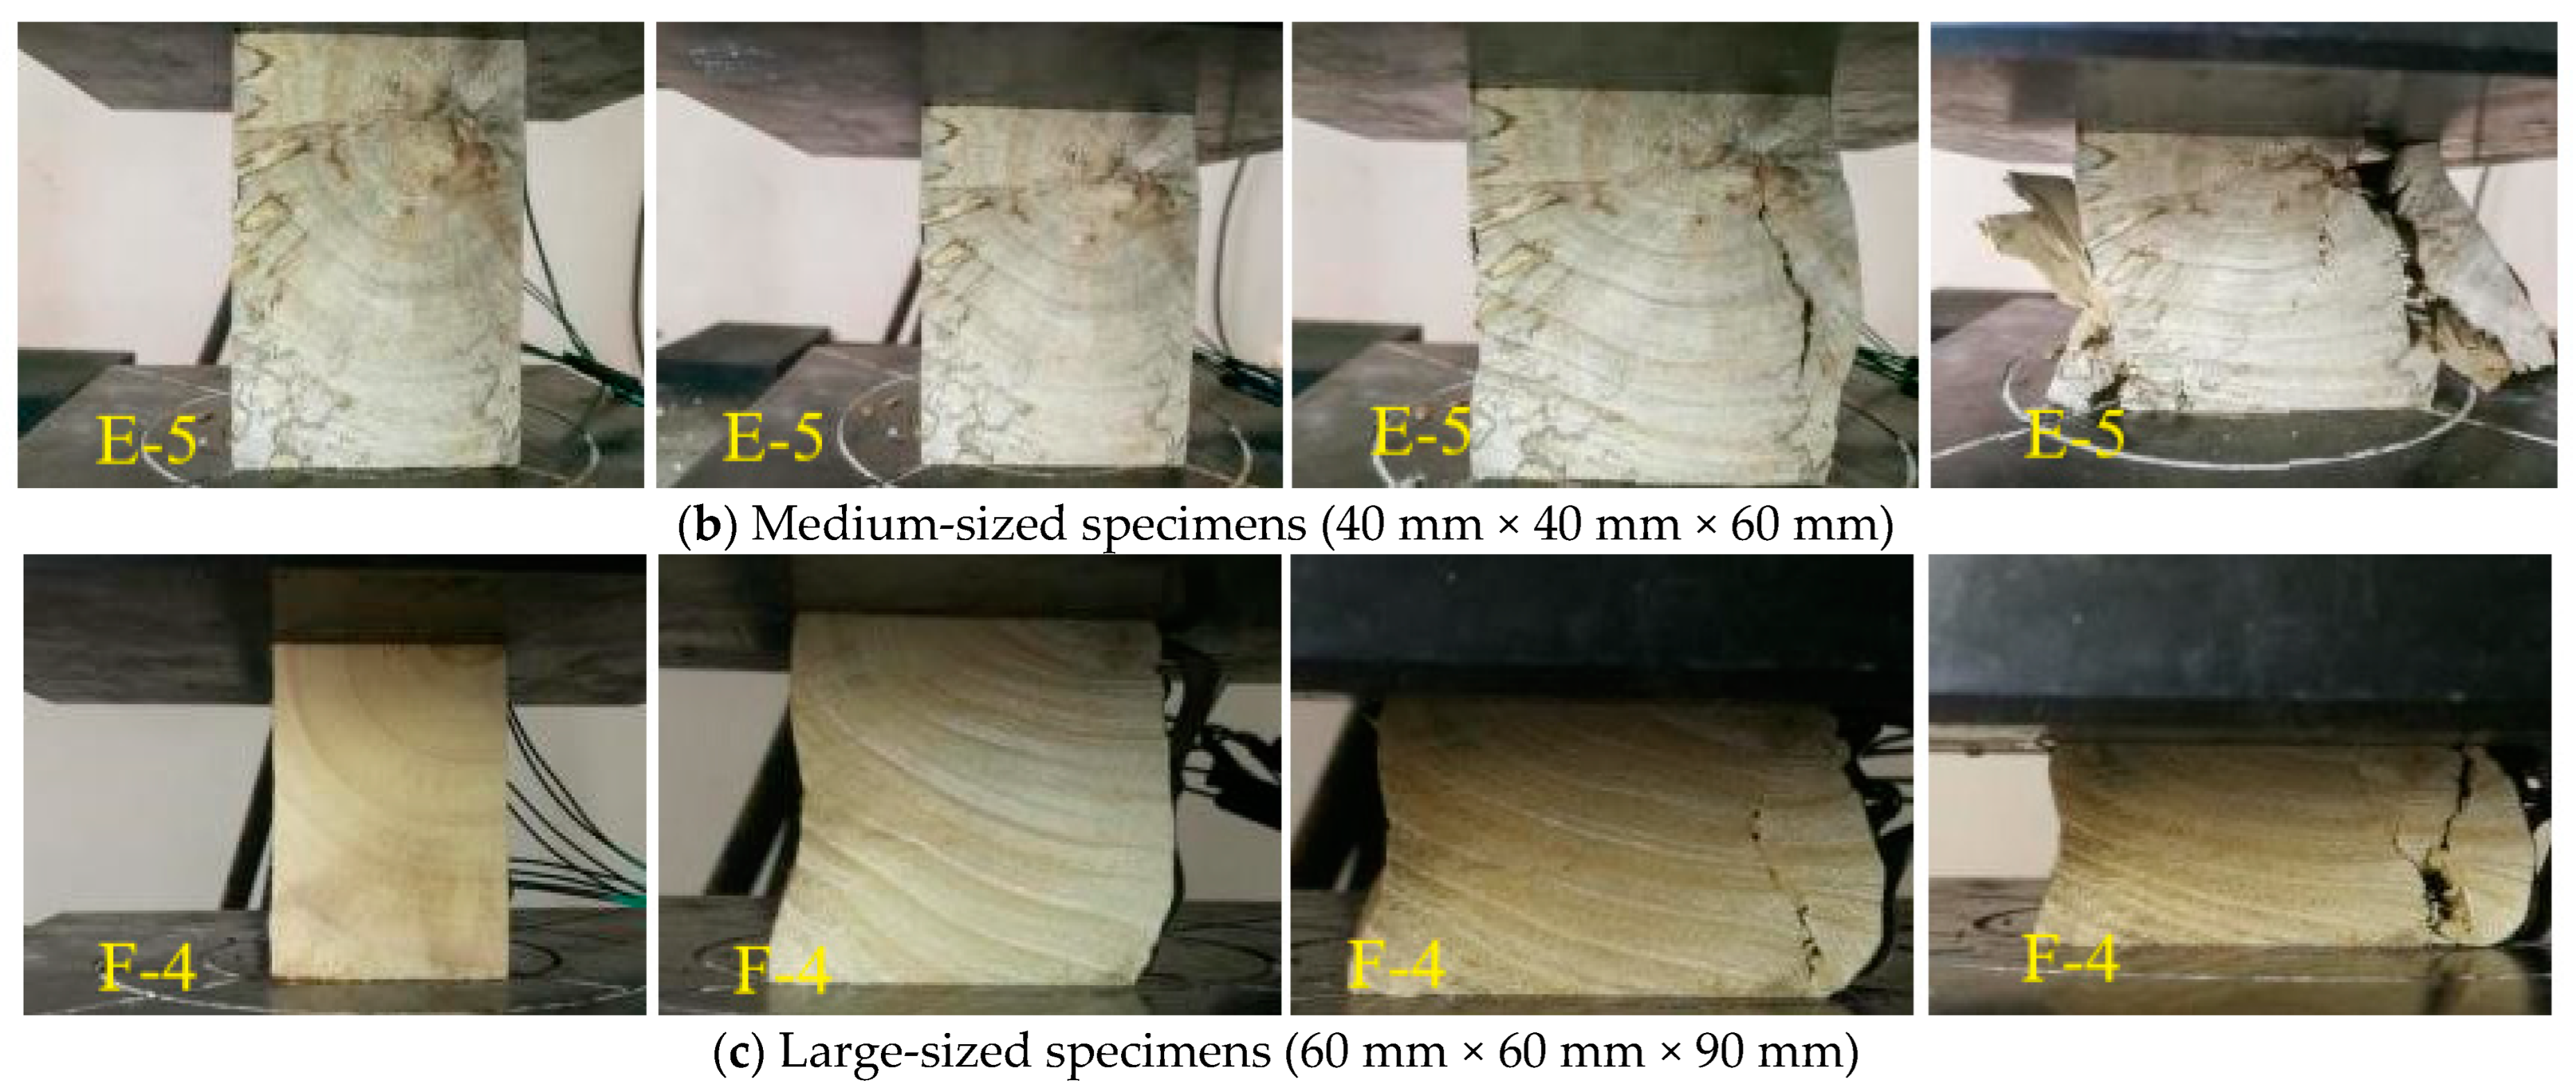
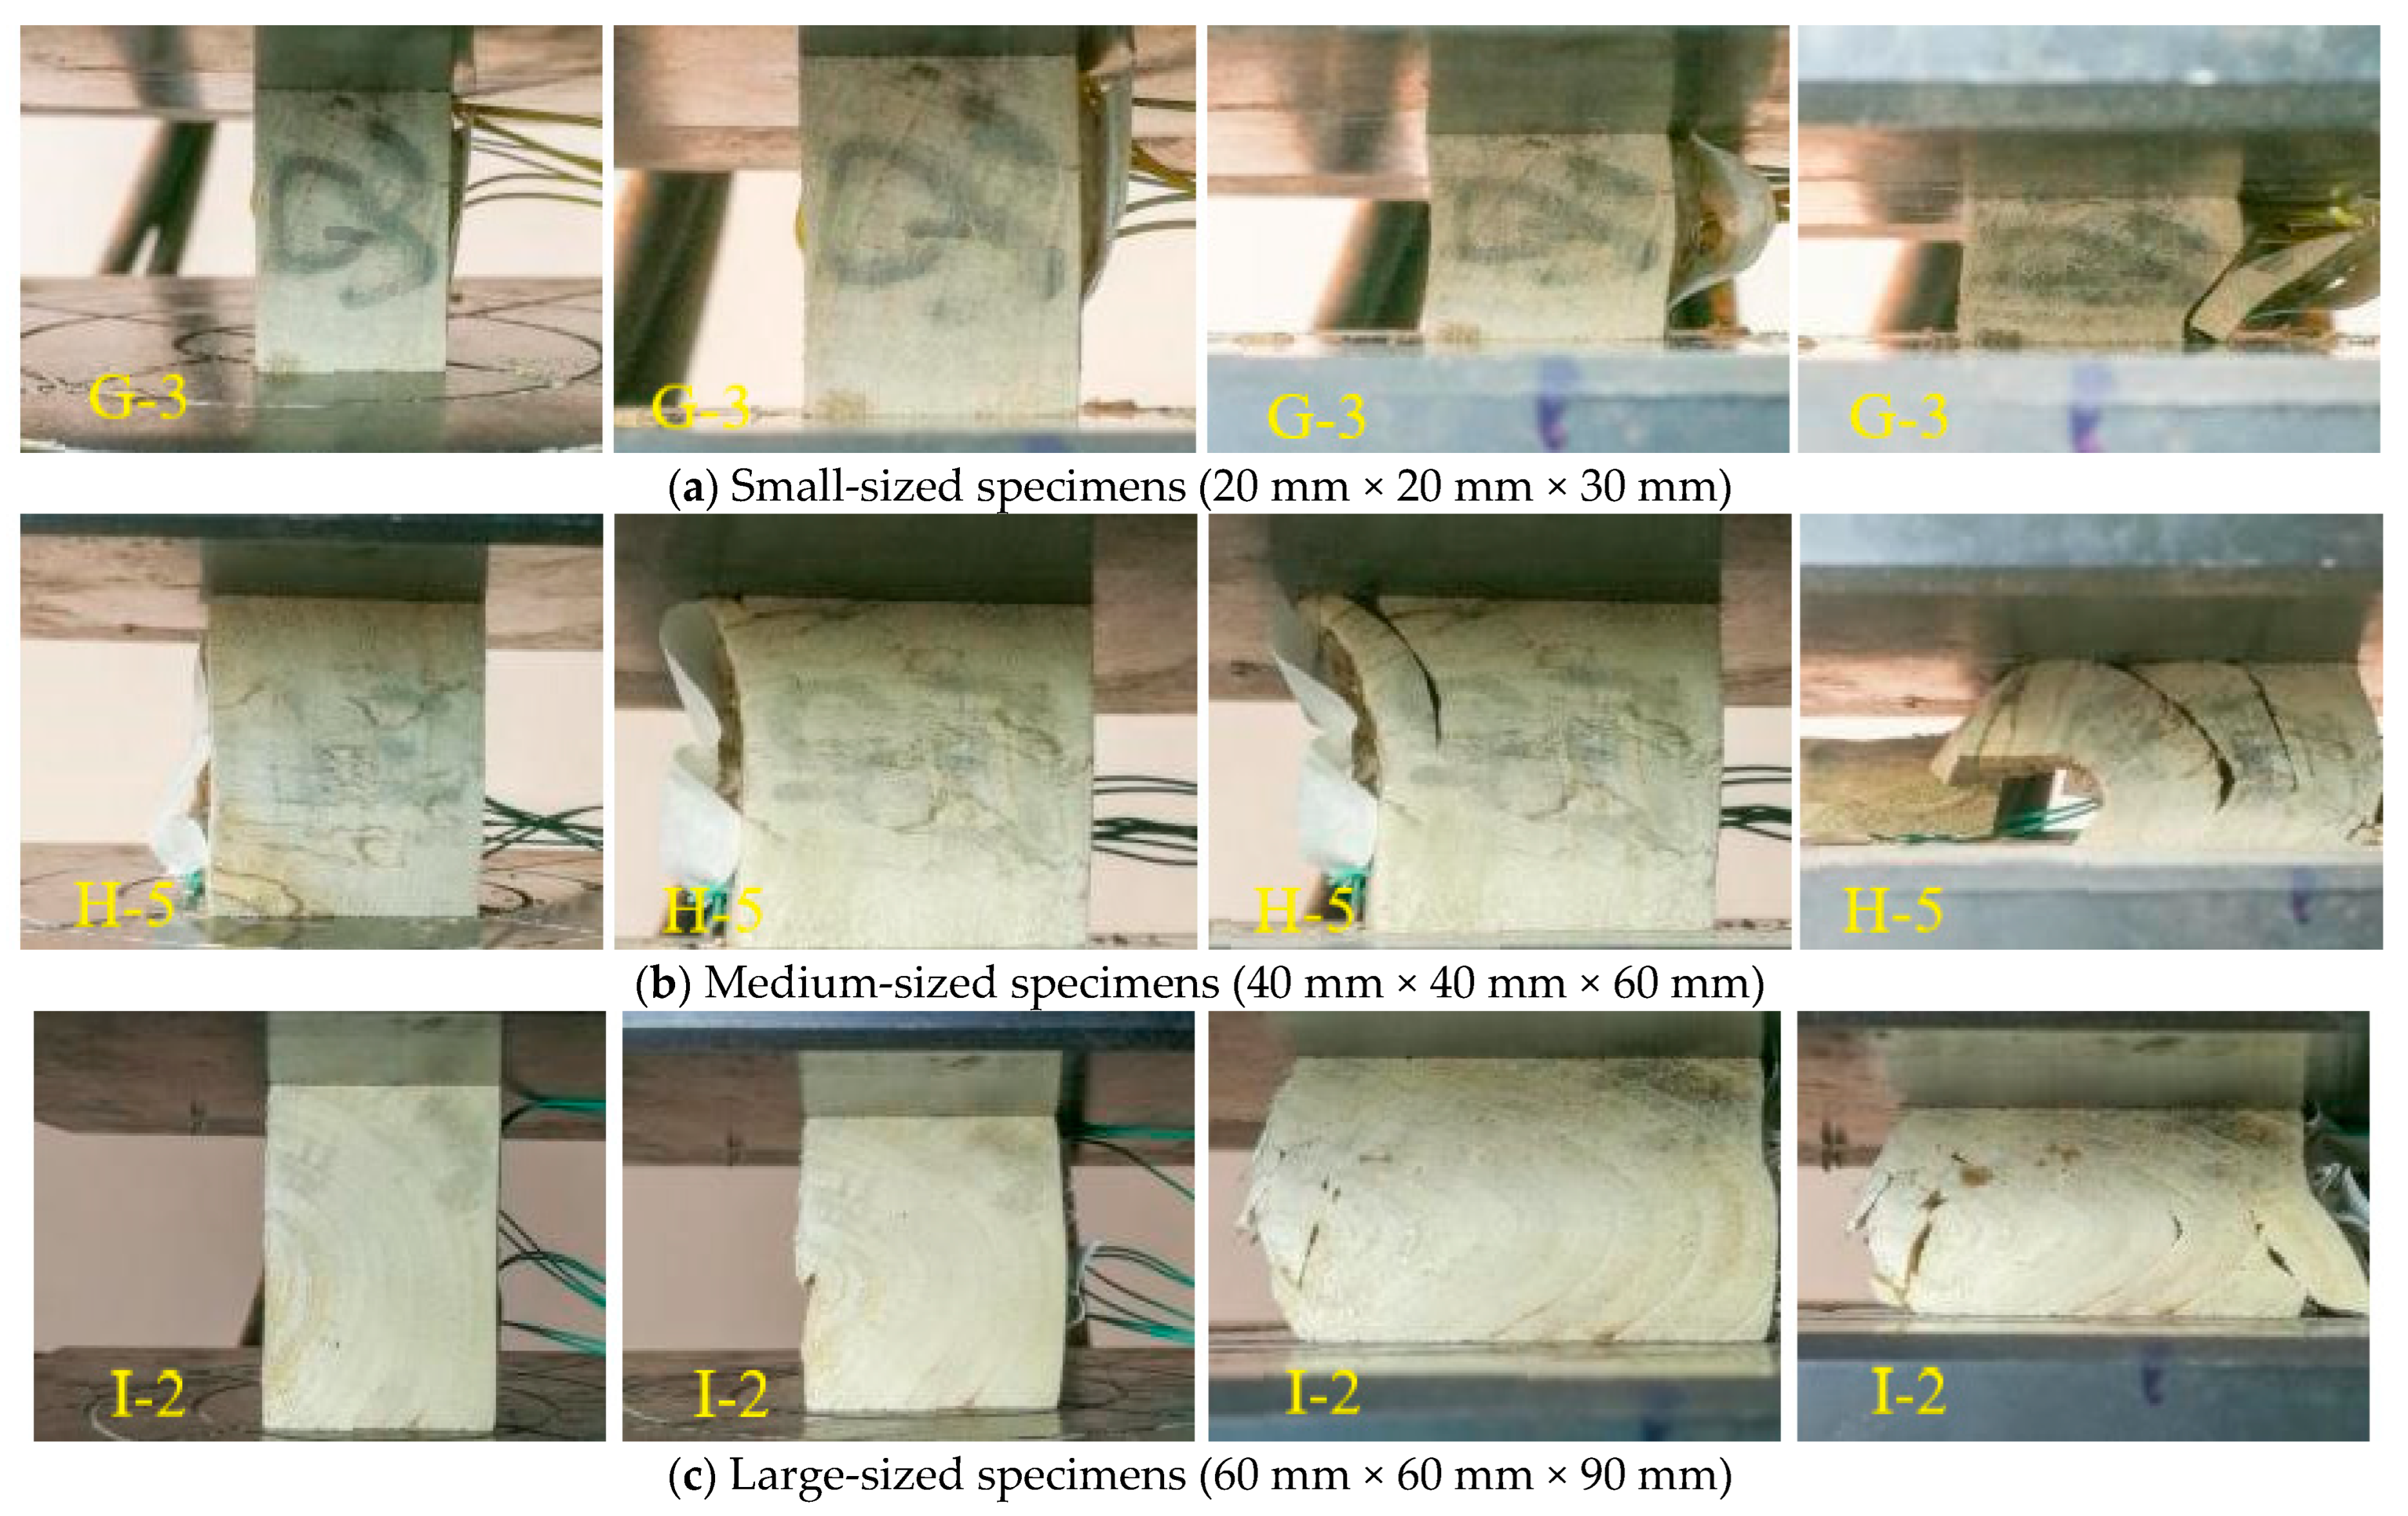
3.1. Experimental Phenomenon

The compressive strength experiments unveiled the influence of specimen size on failure patterns in the longitudinal, radial, and tangential directions. In longitudinal tests, both small-sized (20 mm × 20 mm × 30 mm) and medium-sized (40 mm × 40 mm × 60 mm) specimens displayed transverse cracks in the central part under increasing load, followed by lateral movement before ultimate failure. Large-sized specimens (60 mm × 90 mm × 90 mm) exhibited the formation of two diagonal cracks that intersected, resulting in vertical cracks at the intersection point, leading to ultimate failure.
In radial compressive strength experiments, small-sized specimens showed failure due to fiber misalignment, resulting in cracks perpendicular to the radial direction and shear failure. Medium-sized and large-sized specimens primarily developed cracks perpendicular to the growth rings, leading to a typical compression failure mode.
In the tangential compressive strength tests, all three specimen sizes encountered failure at the growth ring boundary in the specimen center. Initially, small cracks emerged, and as the load increased, these cracks propagated along the growth rings, causing the specimen to break into blocks. Larger specimens exhibited a more pronounced block formation, with an increased number of blocks displaying a buckling state. Moreover, significant variations in failure modes were observed based on the specimen direction. In longitudinal specimens, fine transverse cracks initially formed perpendicular to the grain direction. These cracks gradually expanded as the load increased, spanning the entire surface and leading to failure, as shown in Figure 5. Conversely, the radial compressive strength experimental specimens exhibited an initial formation of small cracks perpendicular to the growth rings, which expanded into larger cracks spanning the entire surface with increased displacement, resulting in specimen separation and failure, as shown in Figure 6. The tangential compressive strength experimental specimens demonstrated a distinct failure mode compared to the other two directions. The first crack formed along the growth rings, followed by the gradual formation of the second and third cracks along the growth rings. These cracks progressively separated into individual blocks, and ultimately, failure occurred as each block buckled, as shown in Figure 7.

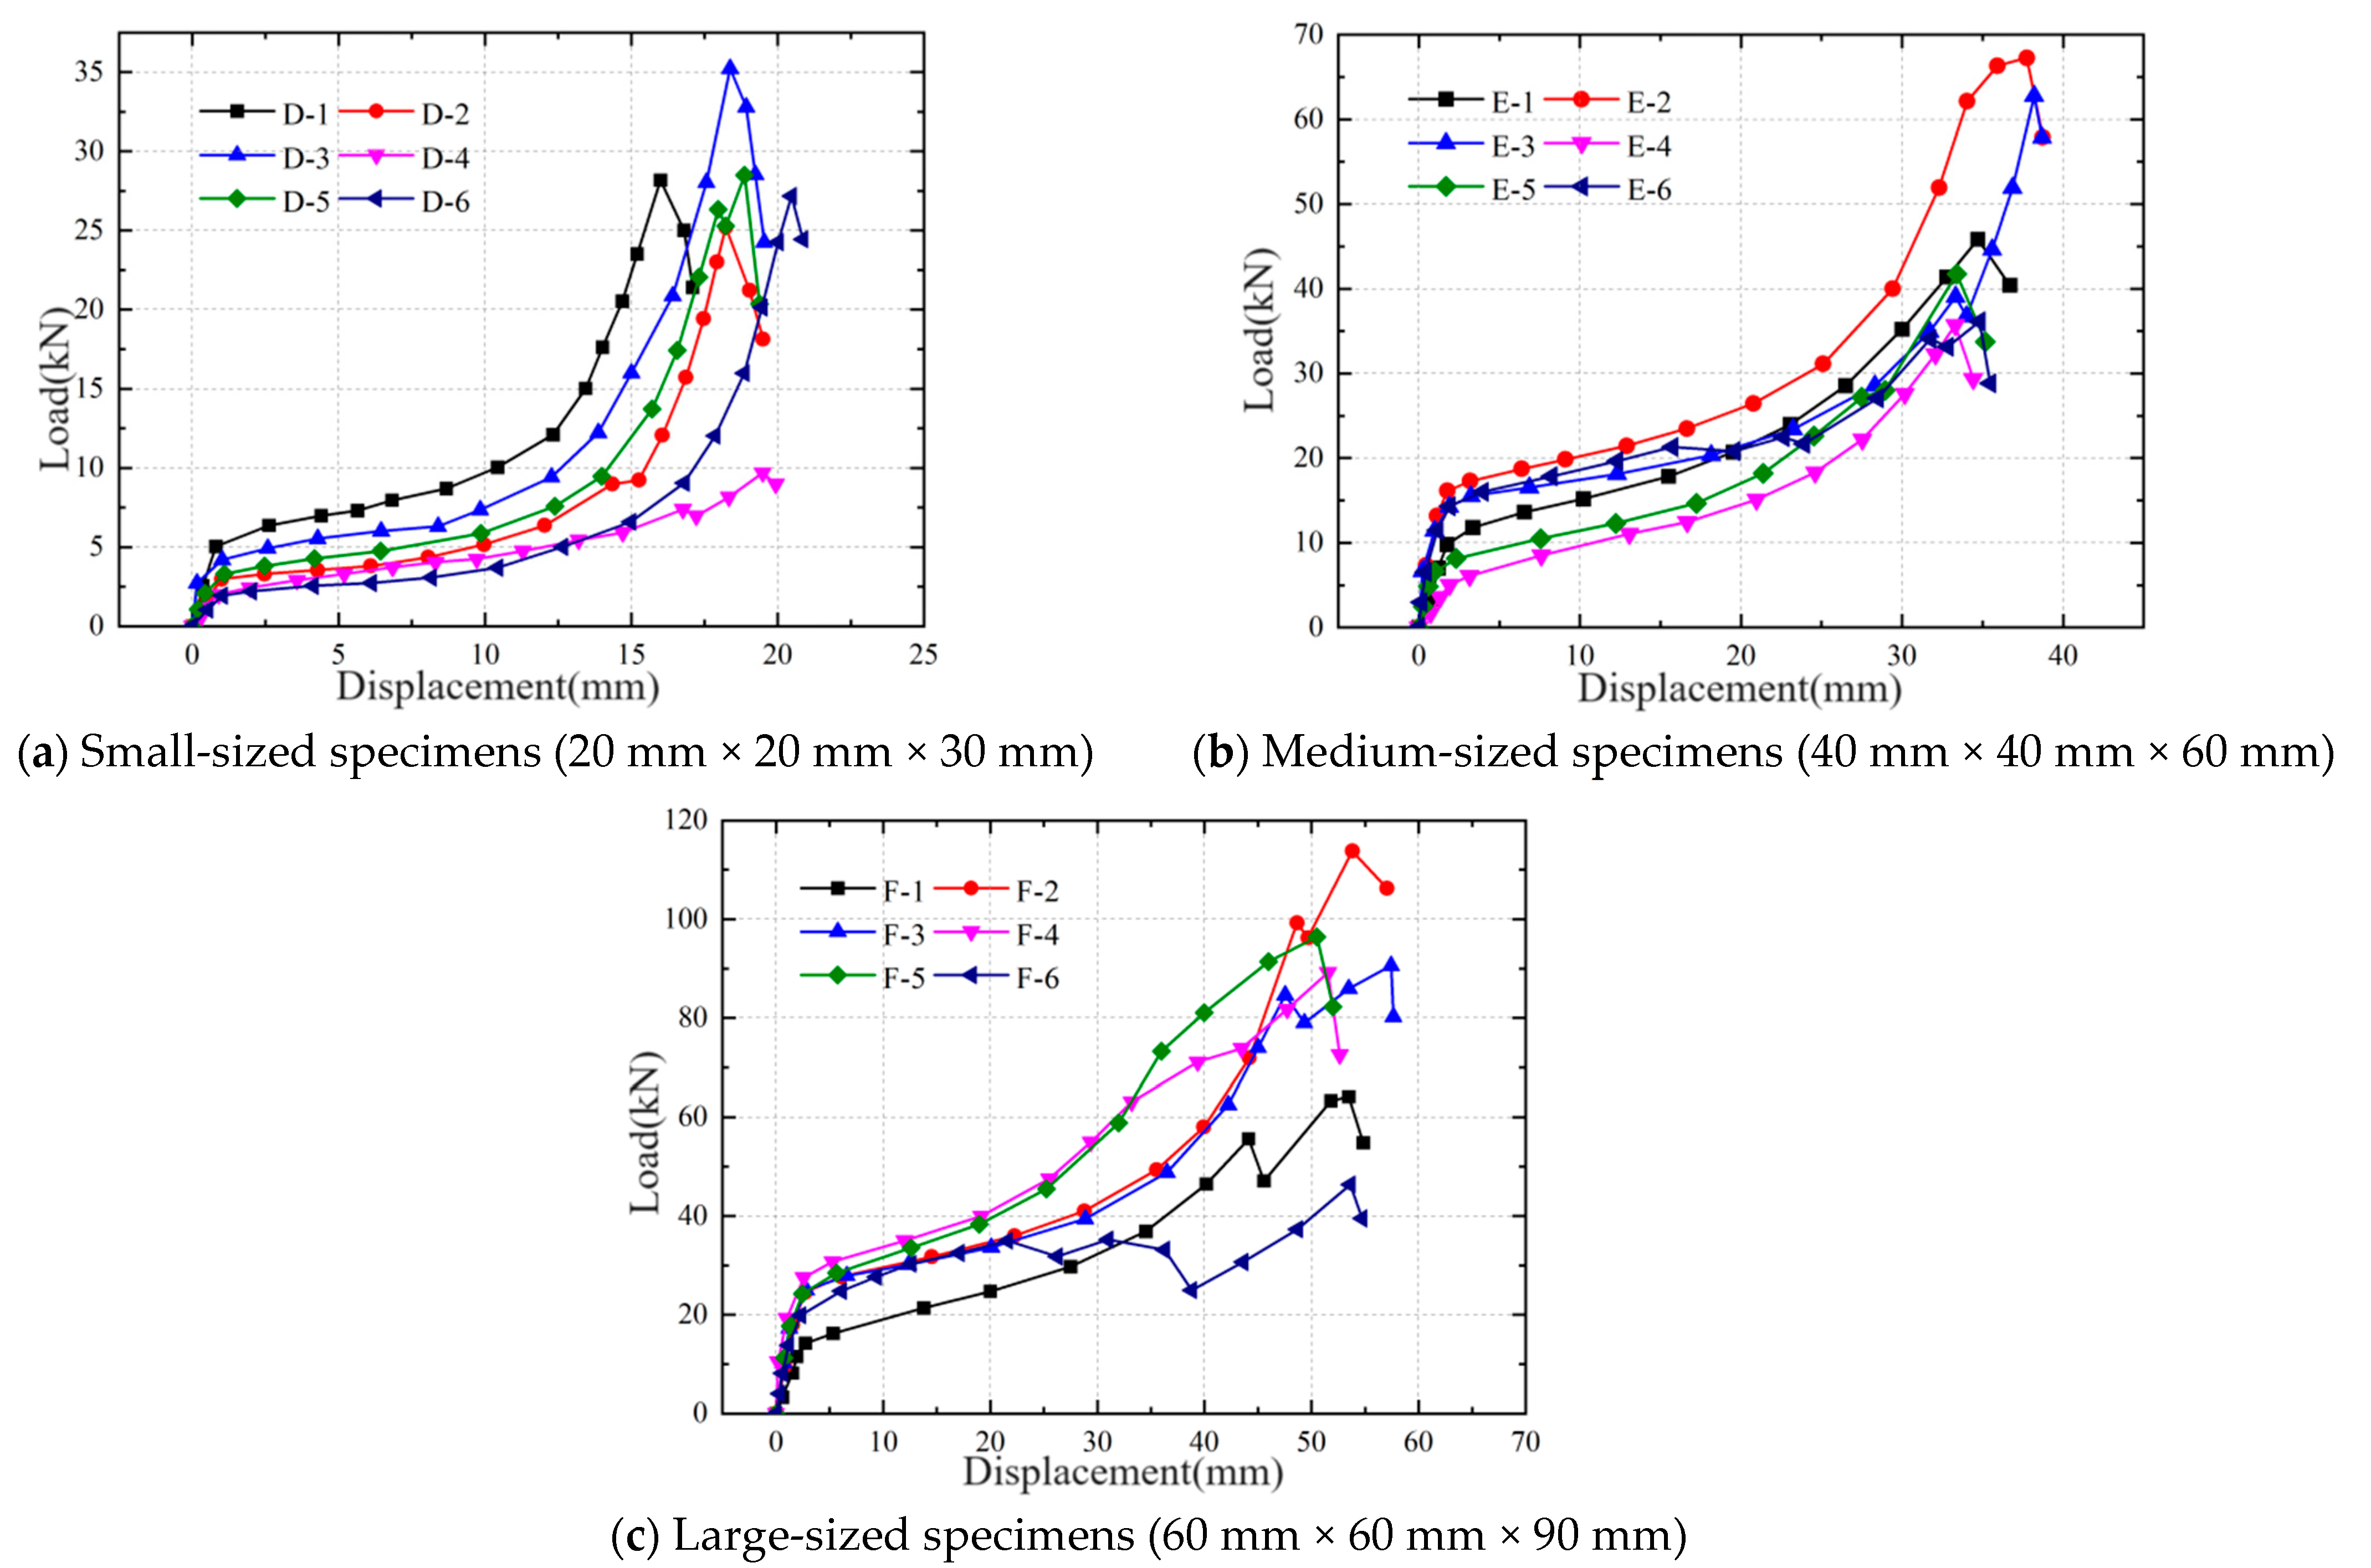
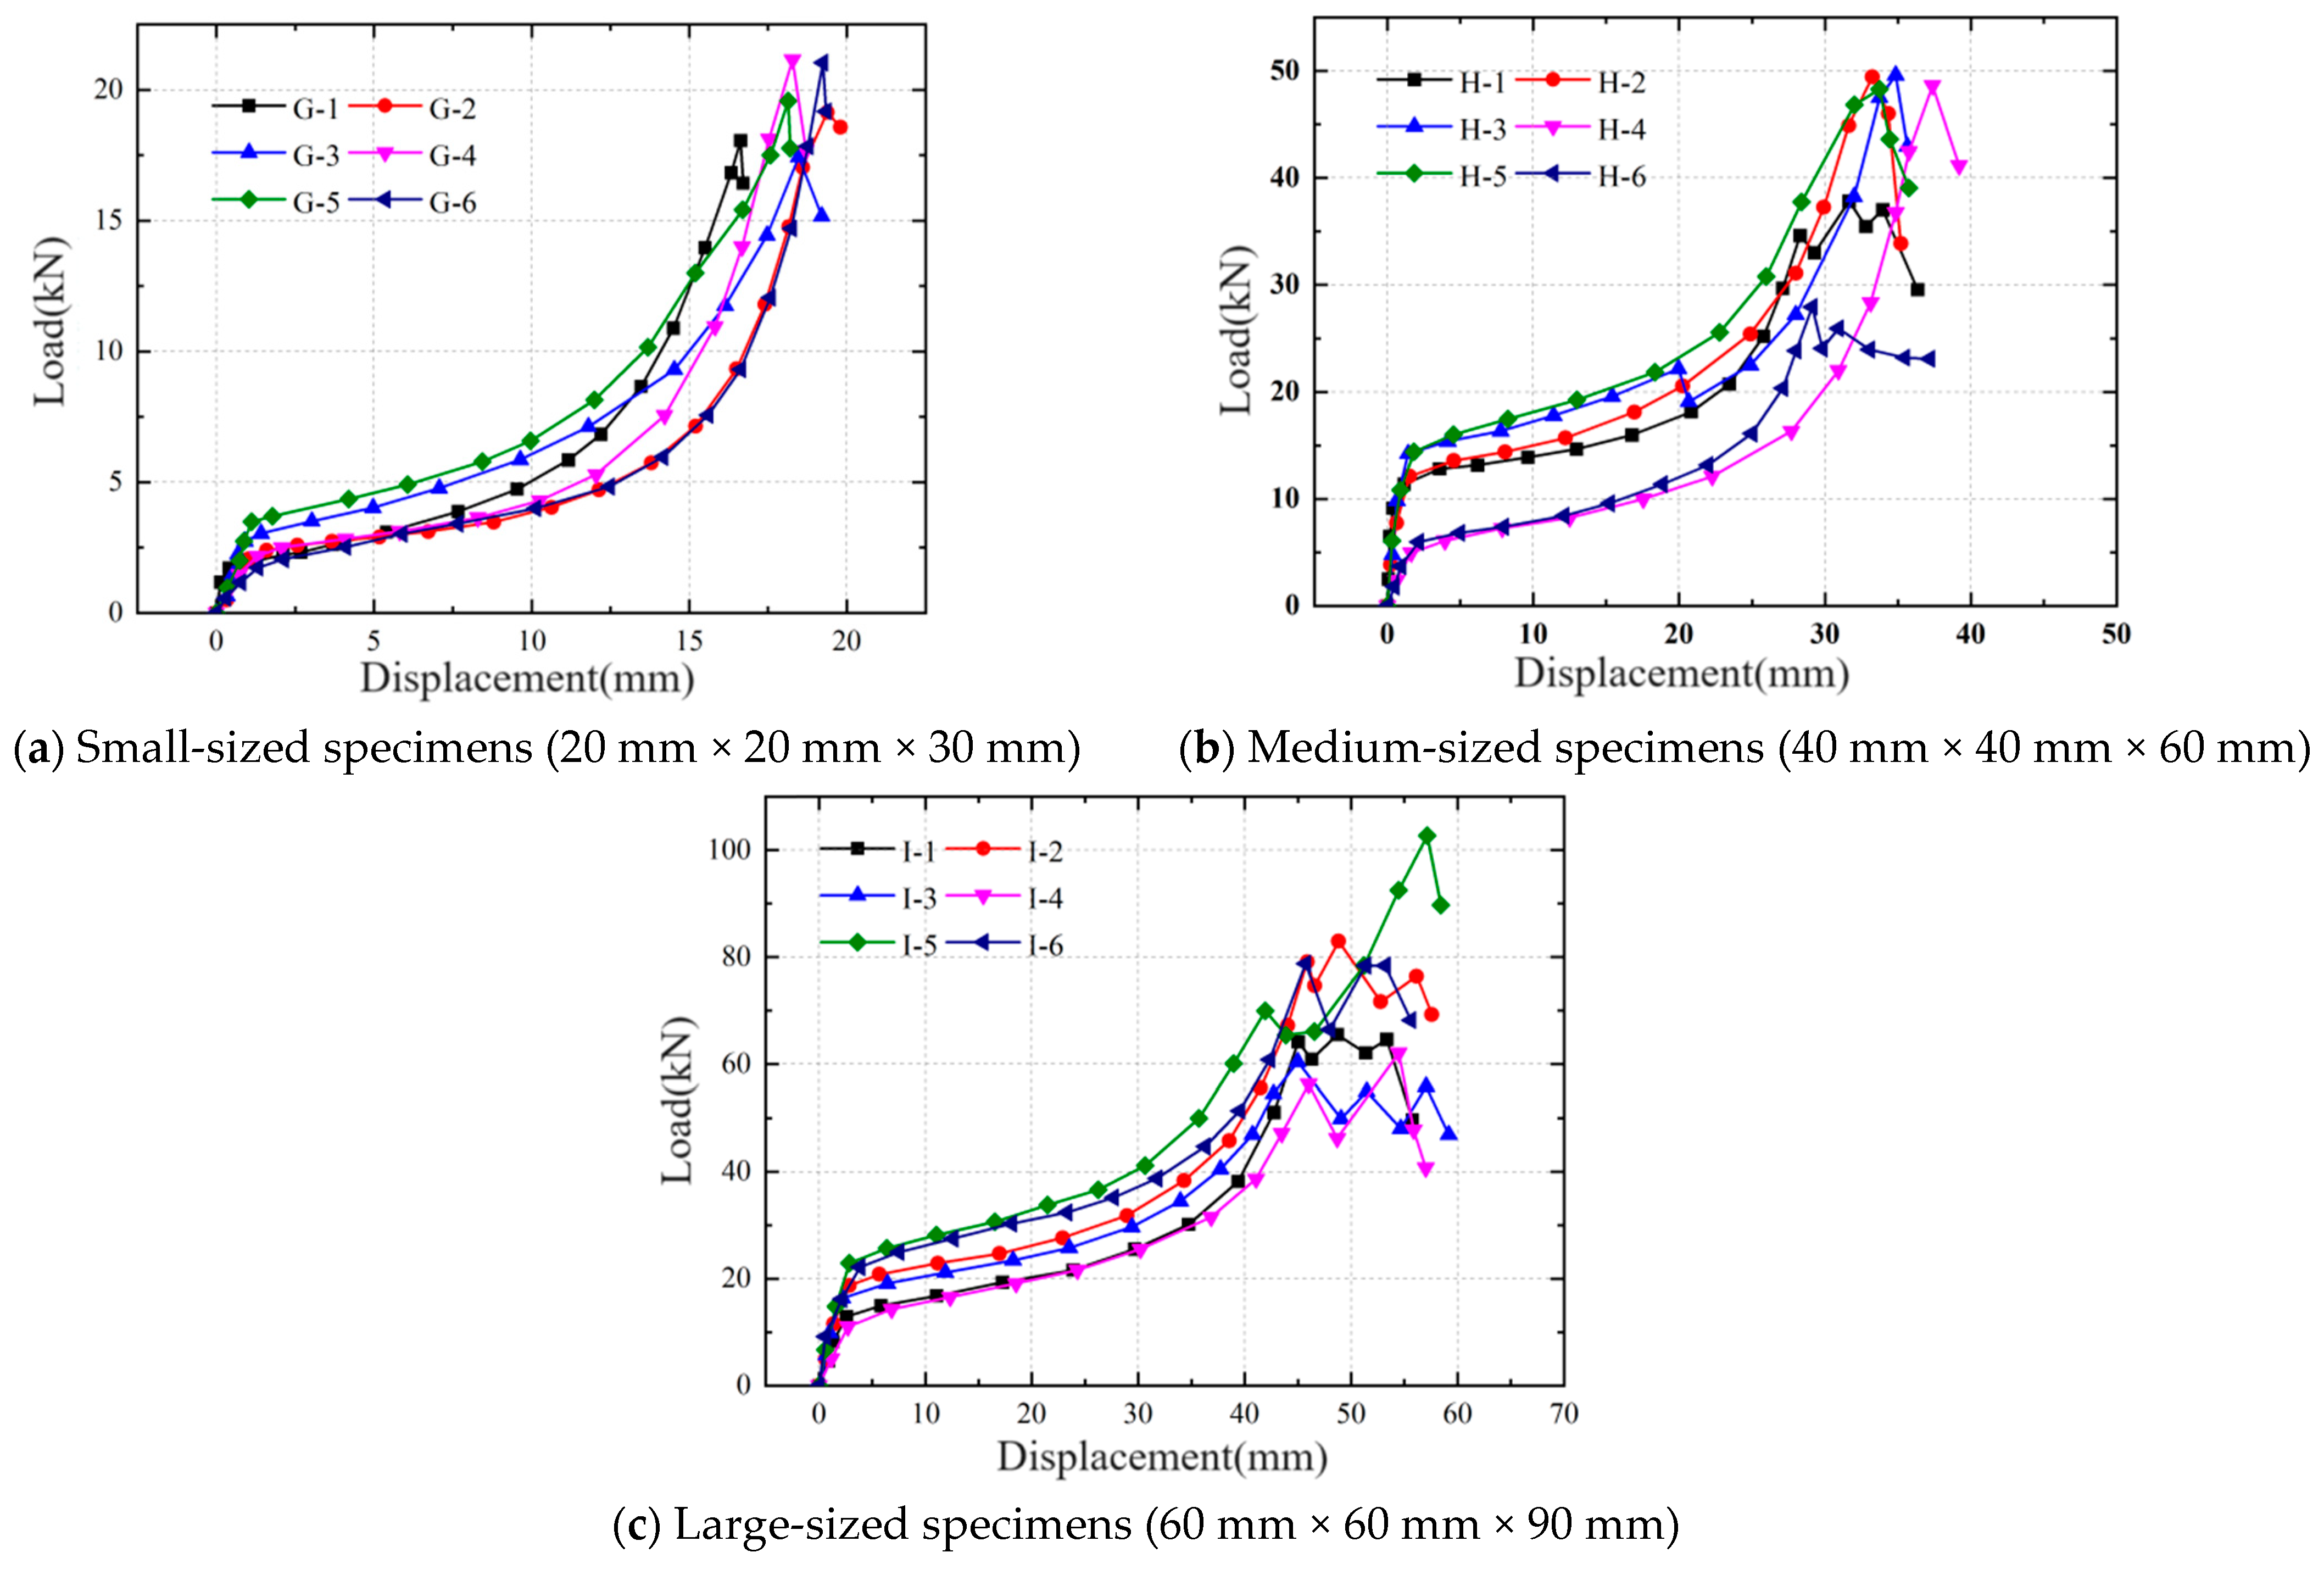
3.2. Load–Displacement Curve

The load–displacement curves for wood specimens in the longitudinal, radial, and tangential directions have been obtained and are presented in Figure 8 (load–displacement curve for longitudinal compressive strength experiment), Figure 9 (radial load–displacement curve for radial compressive strength experiment), and Figure 10 (load–displacement for tangential strength experiment).
Distinct characteristics are evident in the load–displacement relationship curves obtained for the longitudinal compressive strength specimens, radial compressive strength specimens, and tangential compressive strength specimens. Notably, the load–displacement curve of the longitudinal compression specimen deviates significantly from those of the radial and tangential specimens. The load–displacement relationship curve obtained for the longitudinal compression specimen can be roughly divided into three stages. In the initial loading stage, it demonstrates linear elastic behavior with a steep slope, indicating a substantial linear increase in load with displacement. As the load continues to rise, a degree of nonlinearity becomes apparent, accompanied with the development of small cracks in the specimen, and the curve’s slope gradually decreases. Subsequently, the ultimate load is reached, initiating a descending stage. Due to wood’s relatively high residual strength, the curve can still maintain a horizontal or slowly decreasing trend.
For the tangential and radial compression specimens, the load–displacement curves also exhibit three distinct stages. Initially, there is an initial linear elastic stage characterized by a steep slope, indicating a significant increase in load with displacement. Following the elastic stage, a plastic development stage is observed, where the load increases at a slower rate with displacement, and the curve slope during this stage is smaller compared to the initial elastic stage. Finally, a strengthening stage follows, where the slope of the curve increases compared to the plastic stage, suggesting that the material is becoming stronger as the load is applied. However, beyond a certain point, the load suddenly decreases after reaching the peak load.
However, the load–displacement curves exhibited different distribution characteristics, as observed in the longitudinal compressive strength specimens, radial compressive strength specimens, and tangential compressive strength specimens of different sizes in Figure 8, Figure 9 and Figure 10. It becomes apparent that conducting compressive strength tests using small-sized and large-sized specimens results in more scattered load–displacement curves for longitudinal compressive strength specimens and radial compressive strength specimens, compared to tests with medium-sized specimens. The load–displacement curves for tangential compression tests of different sizes show that the curves tend to be consistent for small, medium, and large specimens, with medium-sized specimens showing a slight degree of variability, although not very pronounced. This variation may be attributed to individual differences in the specimens. However, considering the load–displacement curve characteristics in Figure 8, Figure 9 and Figure 10, it could be concluded that the specimen size has an apparent impact on the load–displacement relationship curves in compression strength tests, with the load–displacement curves obtained from medium-sized specimens being relatively reasonable.

3.3. Compressive Strength

Based on the experimental tests, data regarding the longitudinal, radial, and tangential compression strength parameters of wood specimens with varying sizes have been compiled. These data encompass measurements of compressive strength, elastic modulus, and Poisson’s ratio. The organized data is presented in Table 1, Table 2 and Table 3, respectively.
Table 1 provides information on the average compressive strength values of wood for longitudinal, revealing a noticeable decrease as the specimen size increases. Furthermore, the data variability suggests that larger specimens exhibit smaller coefficients of variation, indicating that the longitudinal compressive strength values obtained from larger specimens are more stable and reliable than those from smaller specimens. The elastic modulus also shows a trend in decreasing values with an increasing specimen size. However, the impact of specimen size on Poisson’s ratios μLT and μRT are not very pronounced.
Table 2 provides data on the radial mechanical parameters of wood, revealing that the higher average radial compressive strength was obtained from the medium-sized specimens, which exhibited larger coefficients of variation. In comparison, a lower average radial compressive strength with close values was obtained from the small-sized and large-sized specimens. However, the largest-sized specimens have smaller coefficients of variation. The elastic modulus also exhibited the same pattern, with a higher elastic modulus obtained from the medium-sized specimens. However, the impact of specimen sizes on obtaining Poisson’s ratios μ R T and μ R L are not very pronounced, similar to the effect on the longitudinal mechanical parameters of wood.
Table 3 provides the tangential compressive strength parameters of wood, revealing that the highest average tangential compressive strength was obtained from the medium-sized specimens, which exhibited larger coefficients of variation. The small-sized specimens had lower values for tangential compressive strength, while the large-sized specimens had the lowest tangential compressive strength values with the smallest coefficients of variation. Similarly, the highest elastic modulus was obtained from the medium-sized specimens. The impact of specimen size on obtaining Poisson’s ratio is not very pronounced, similar to the effect on the longitudinal and radial mechanical parameters of wood.
Table 3 provides data on the tangential compressive strength parameters of wood, revealing that the highest average tangential compressive strength was obtained from the medium-sized specimens, which exhibited larger coefficients of variation. The small-sized specimens had lower values for tangential compressive strength, while the large-sized specimens had the lowest tangential compressive strength values with the smallest coefficients of variation. Similarly, the highest elastic modulus was obtained from the medium-sized specimens. The impact of specimen size on obtaining Poisson’s ratio is not very pronounced, similar to the effect on the longitudinal and radial mechanical parameters of wood.
Based on the above analysis, it could be concluded that the longitudinal compression strength and the longitudinal elastic modulus decreases as the specimen size increases. This is consistent with Weibull’s (1939) theory [24], which states that with increasing volume, the strength decreases. To some extent, this validates the rationality of the experimental results in this paper. The radial and tangential compressive strength and Poisson’s ratio did not show a clear pattern with the increase in specimen size. However, the longitudinal, radial, and tangential compressive strength of wood obtained from the large-sized specimens exhibited the least variability. The highest radial and tangential elastic modulus was obtained from the medium-sized specimens. Considering the comparison of specimen sizes with the size of growth rings as shown in Figure 1, this may be attributed to the fact that larger-sized specimens cover 2–3 growth ring sizes, resulting in less variability in the test results, which can eliminate the issue of smaller-sized specimens only representing the strength values of wood within a single growth ring. Therefore, it is advisable to use larger-sized specimens to obtain the compressive strength for wood. However, further confirmation is needed, such as finite element analysis based on the experimental data.

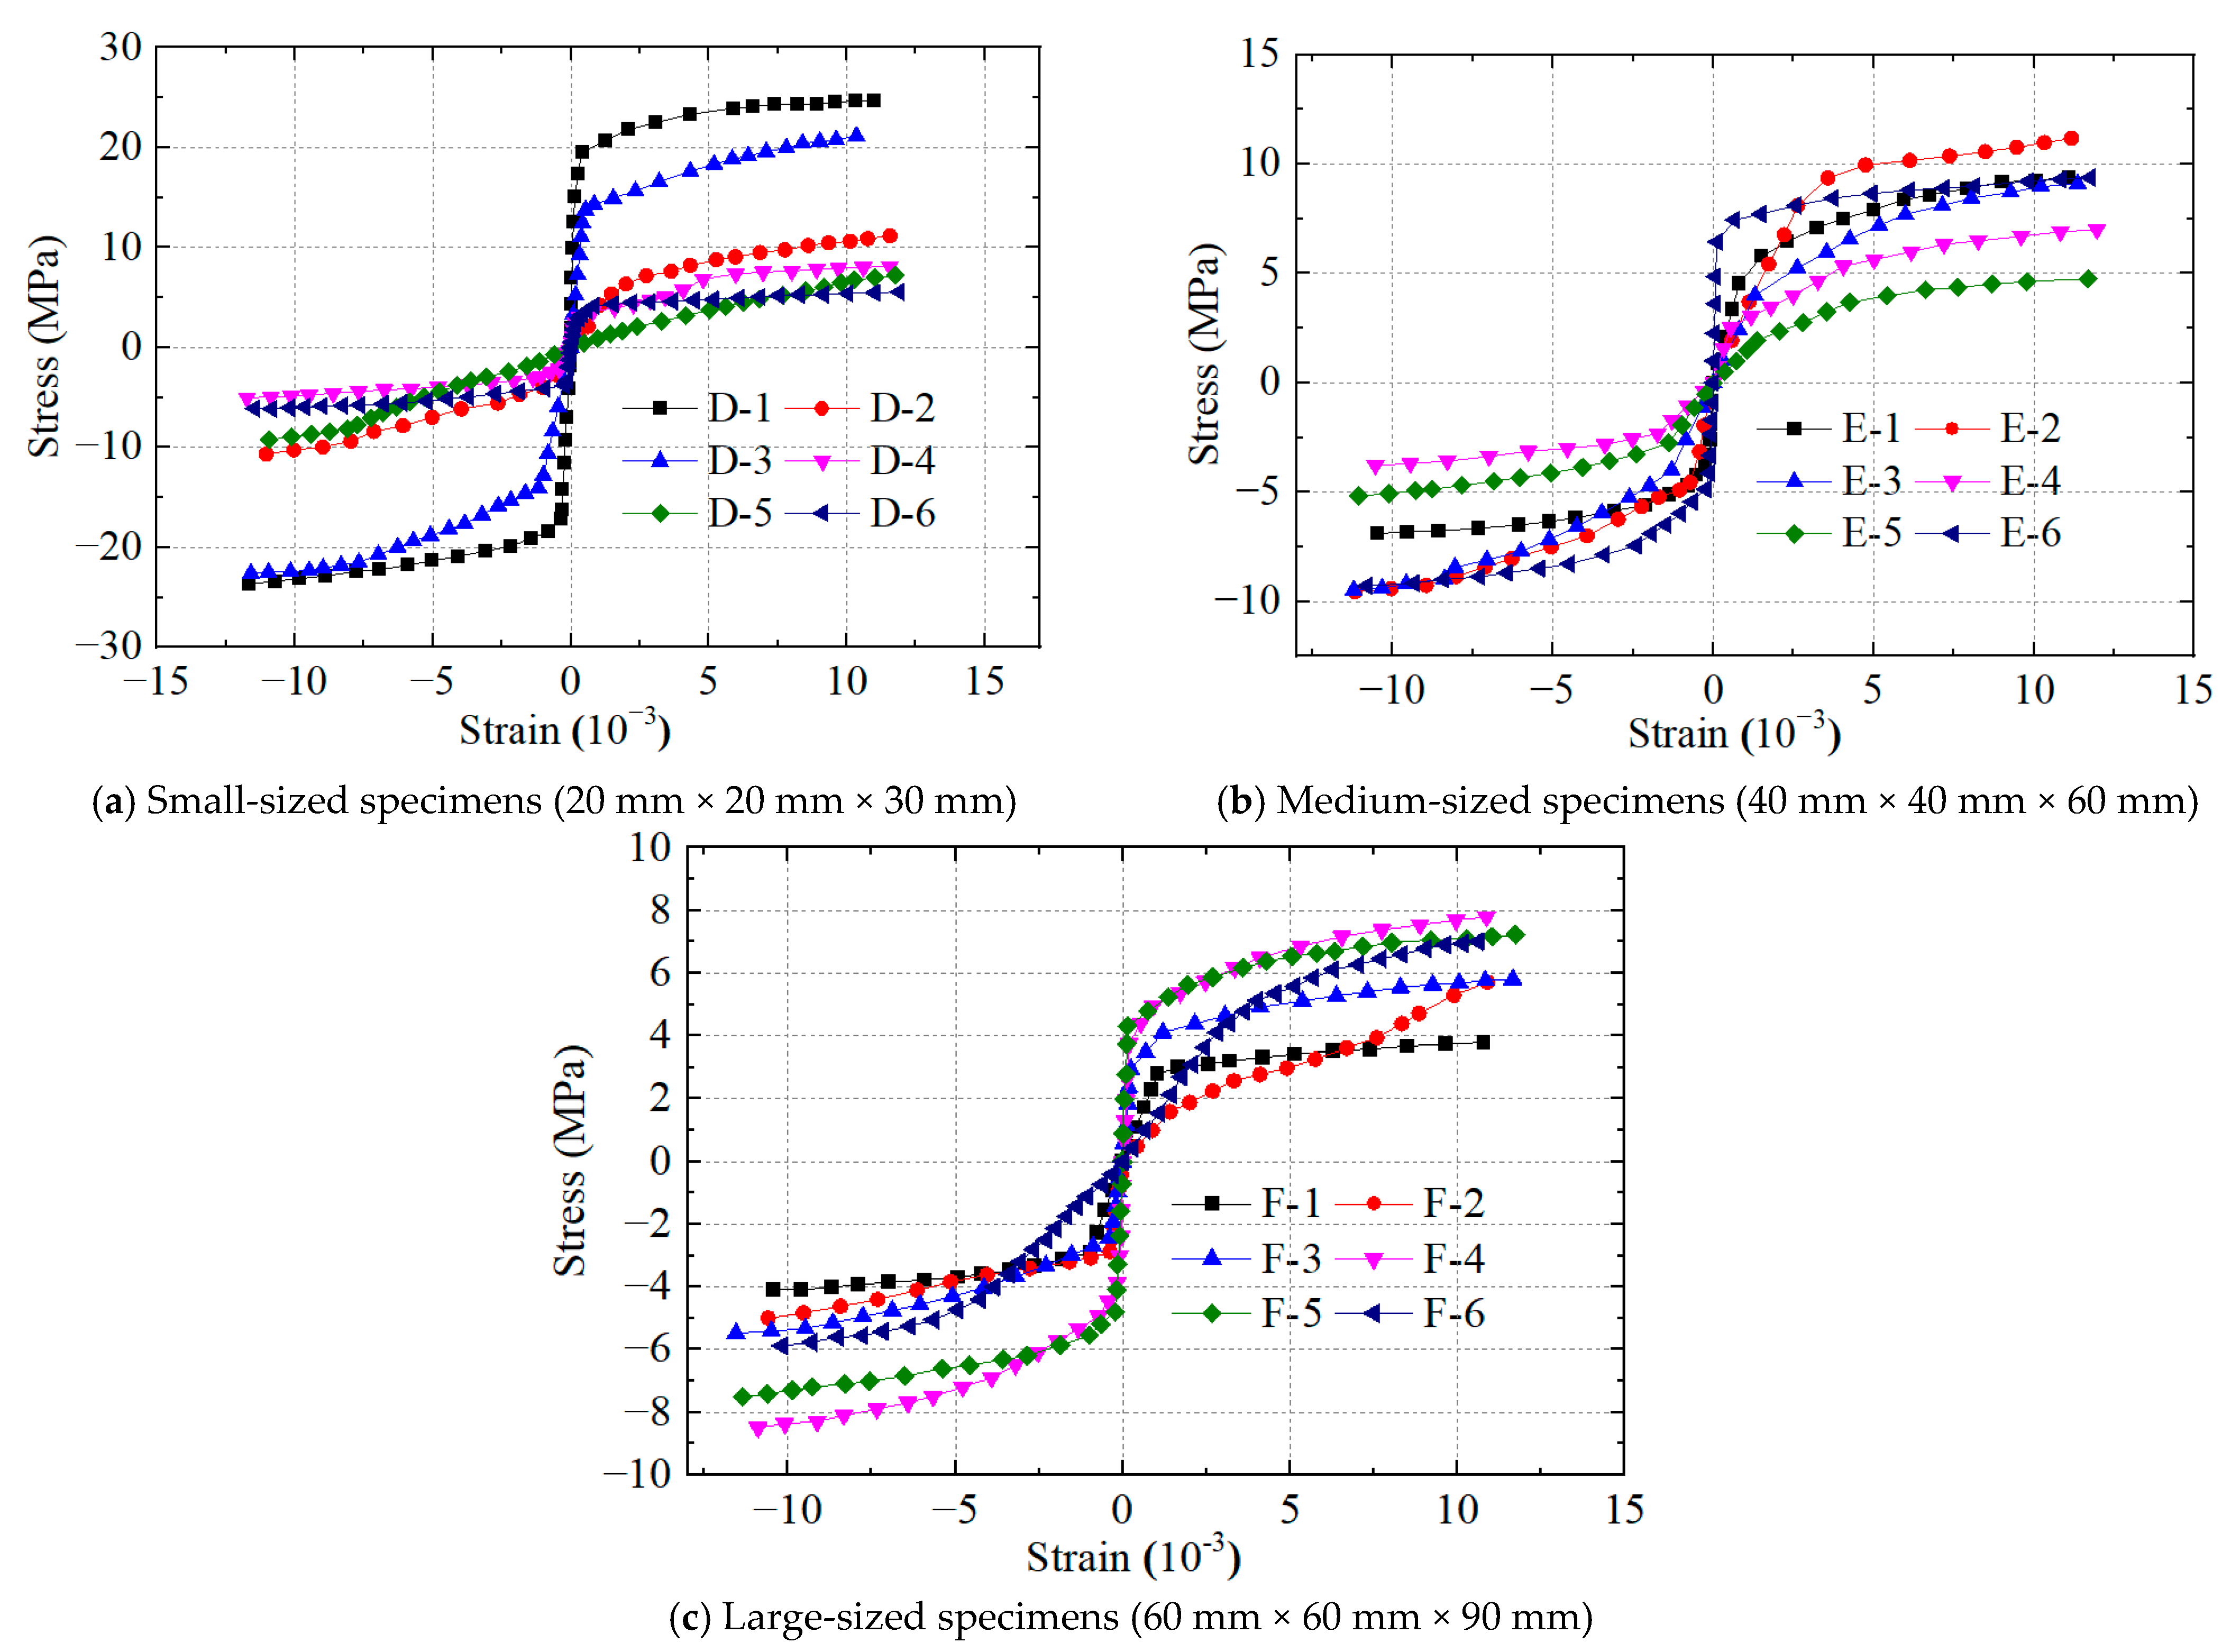
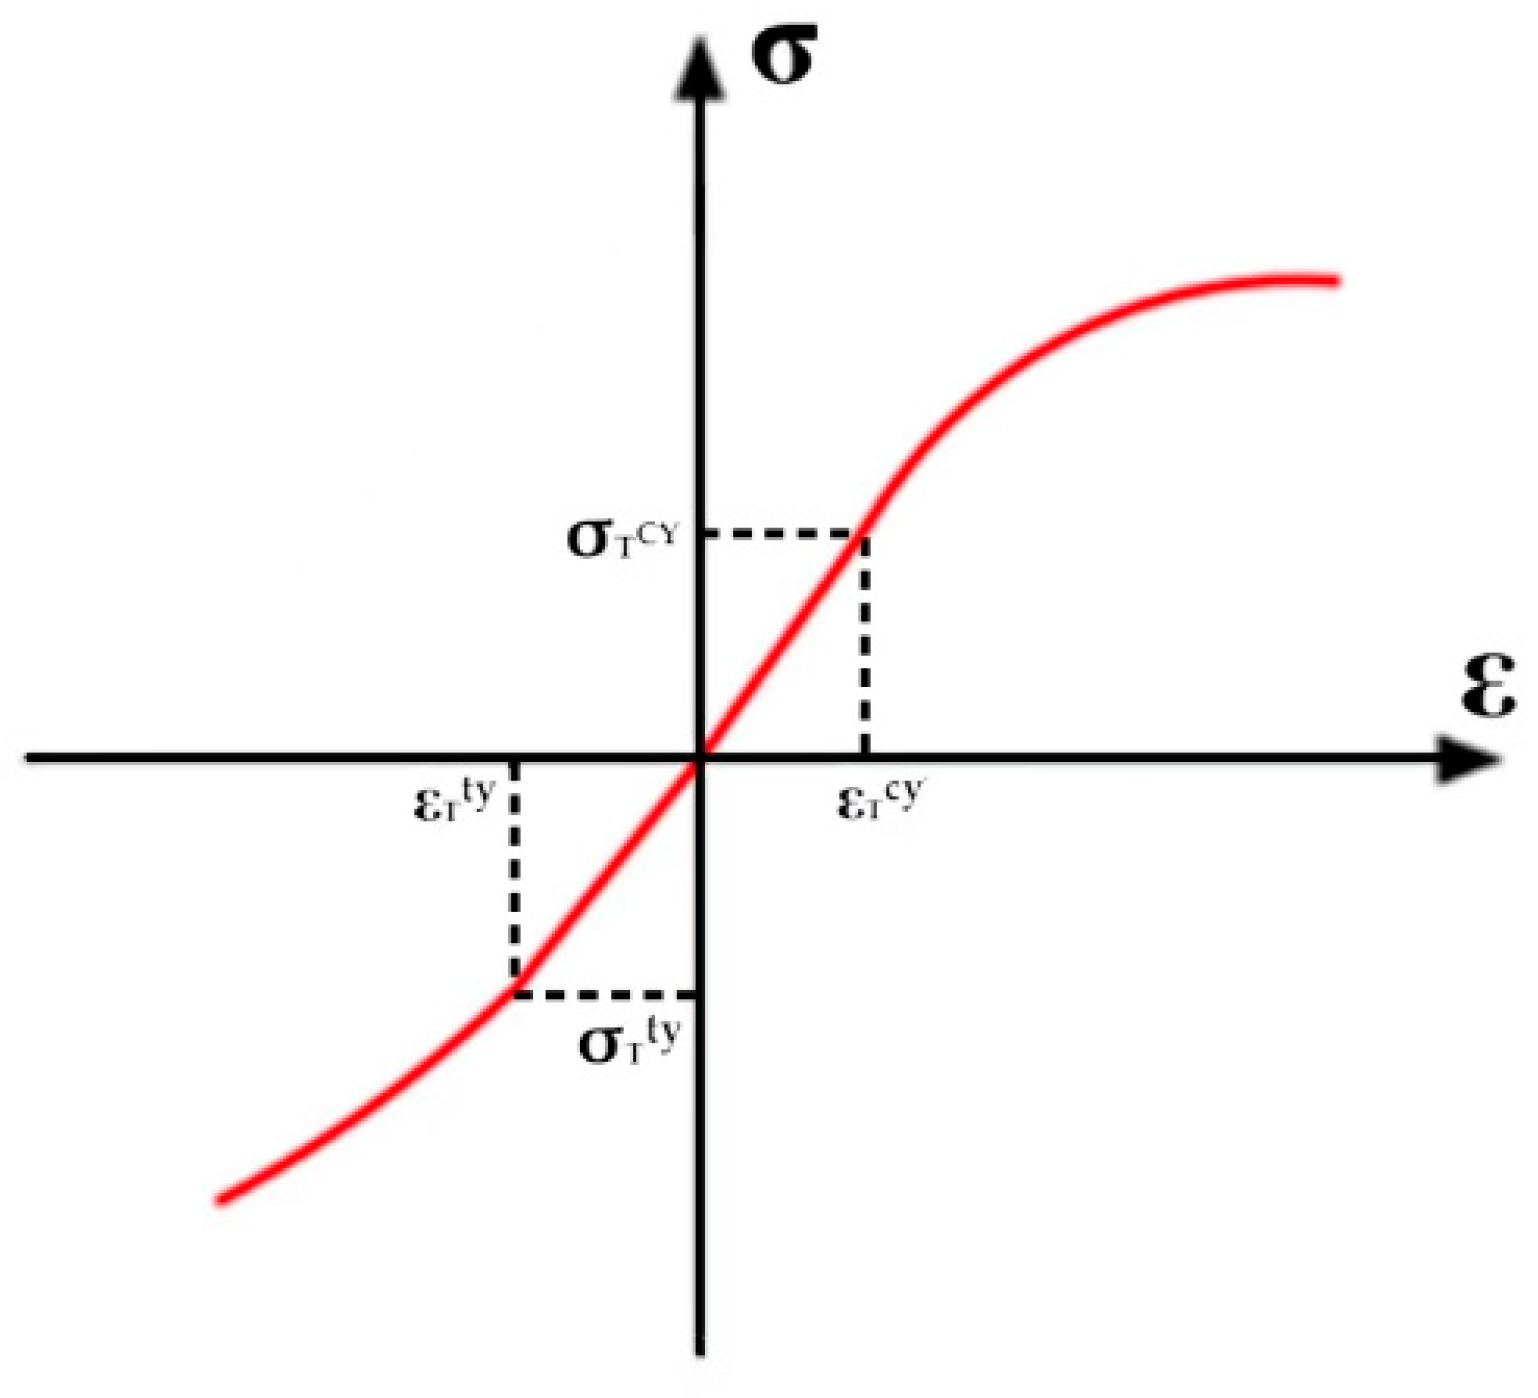
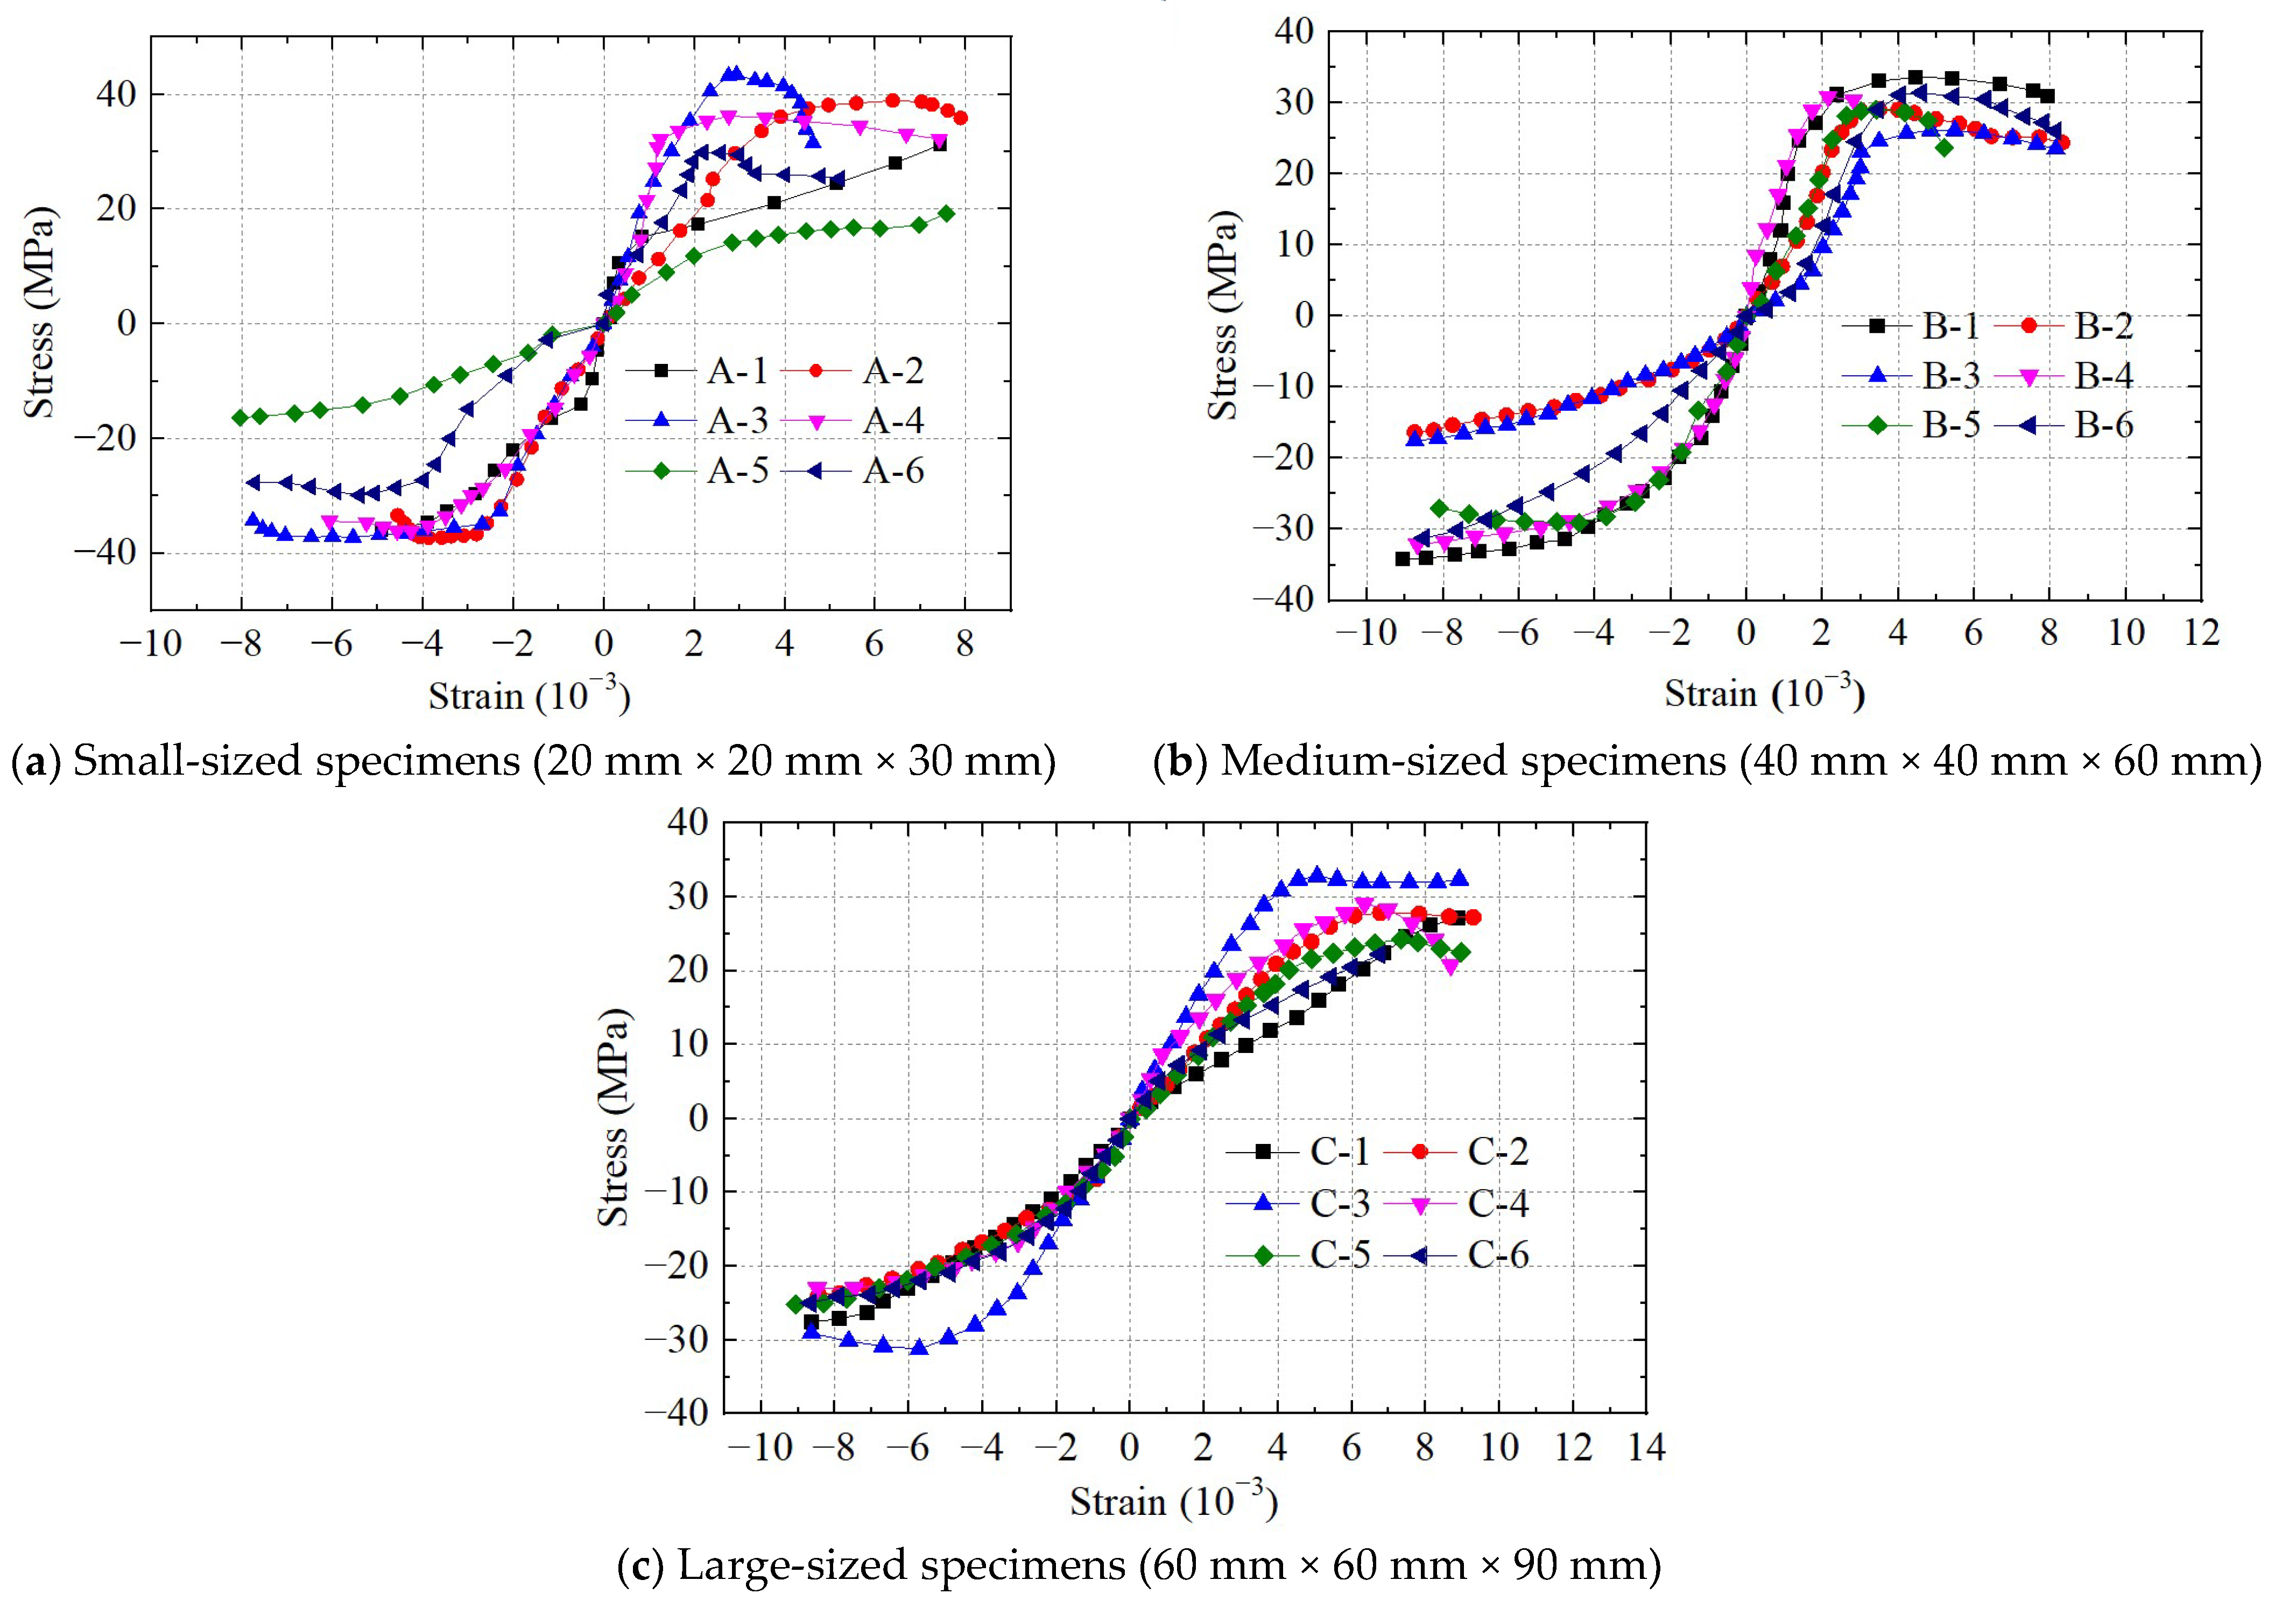
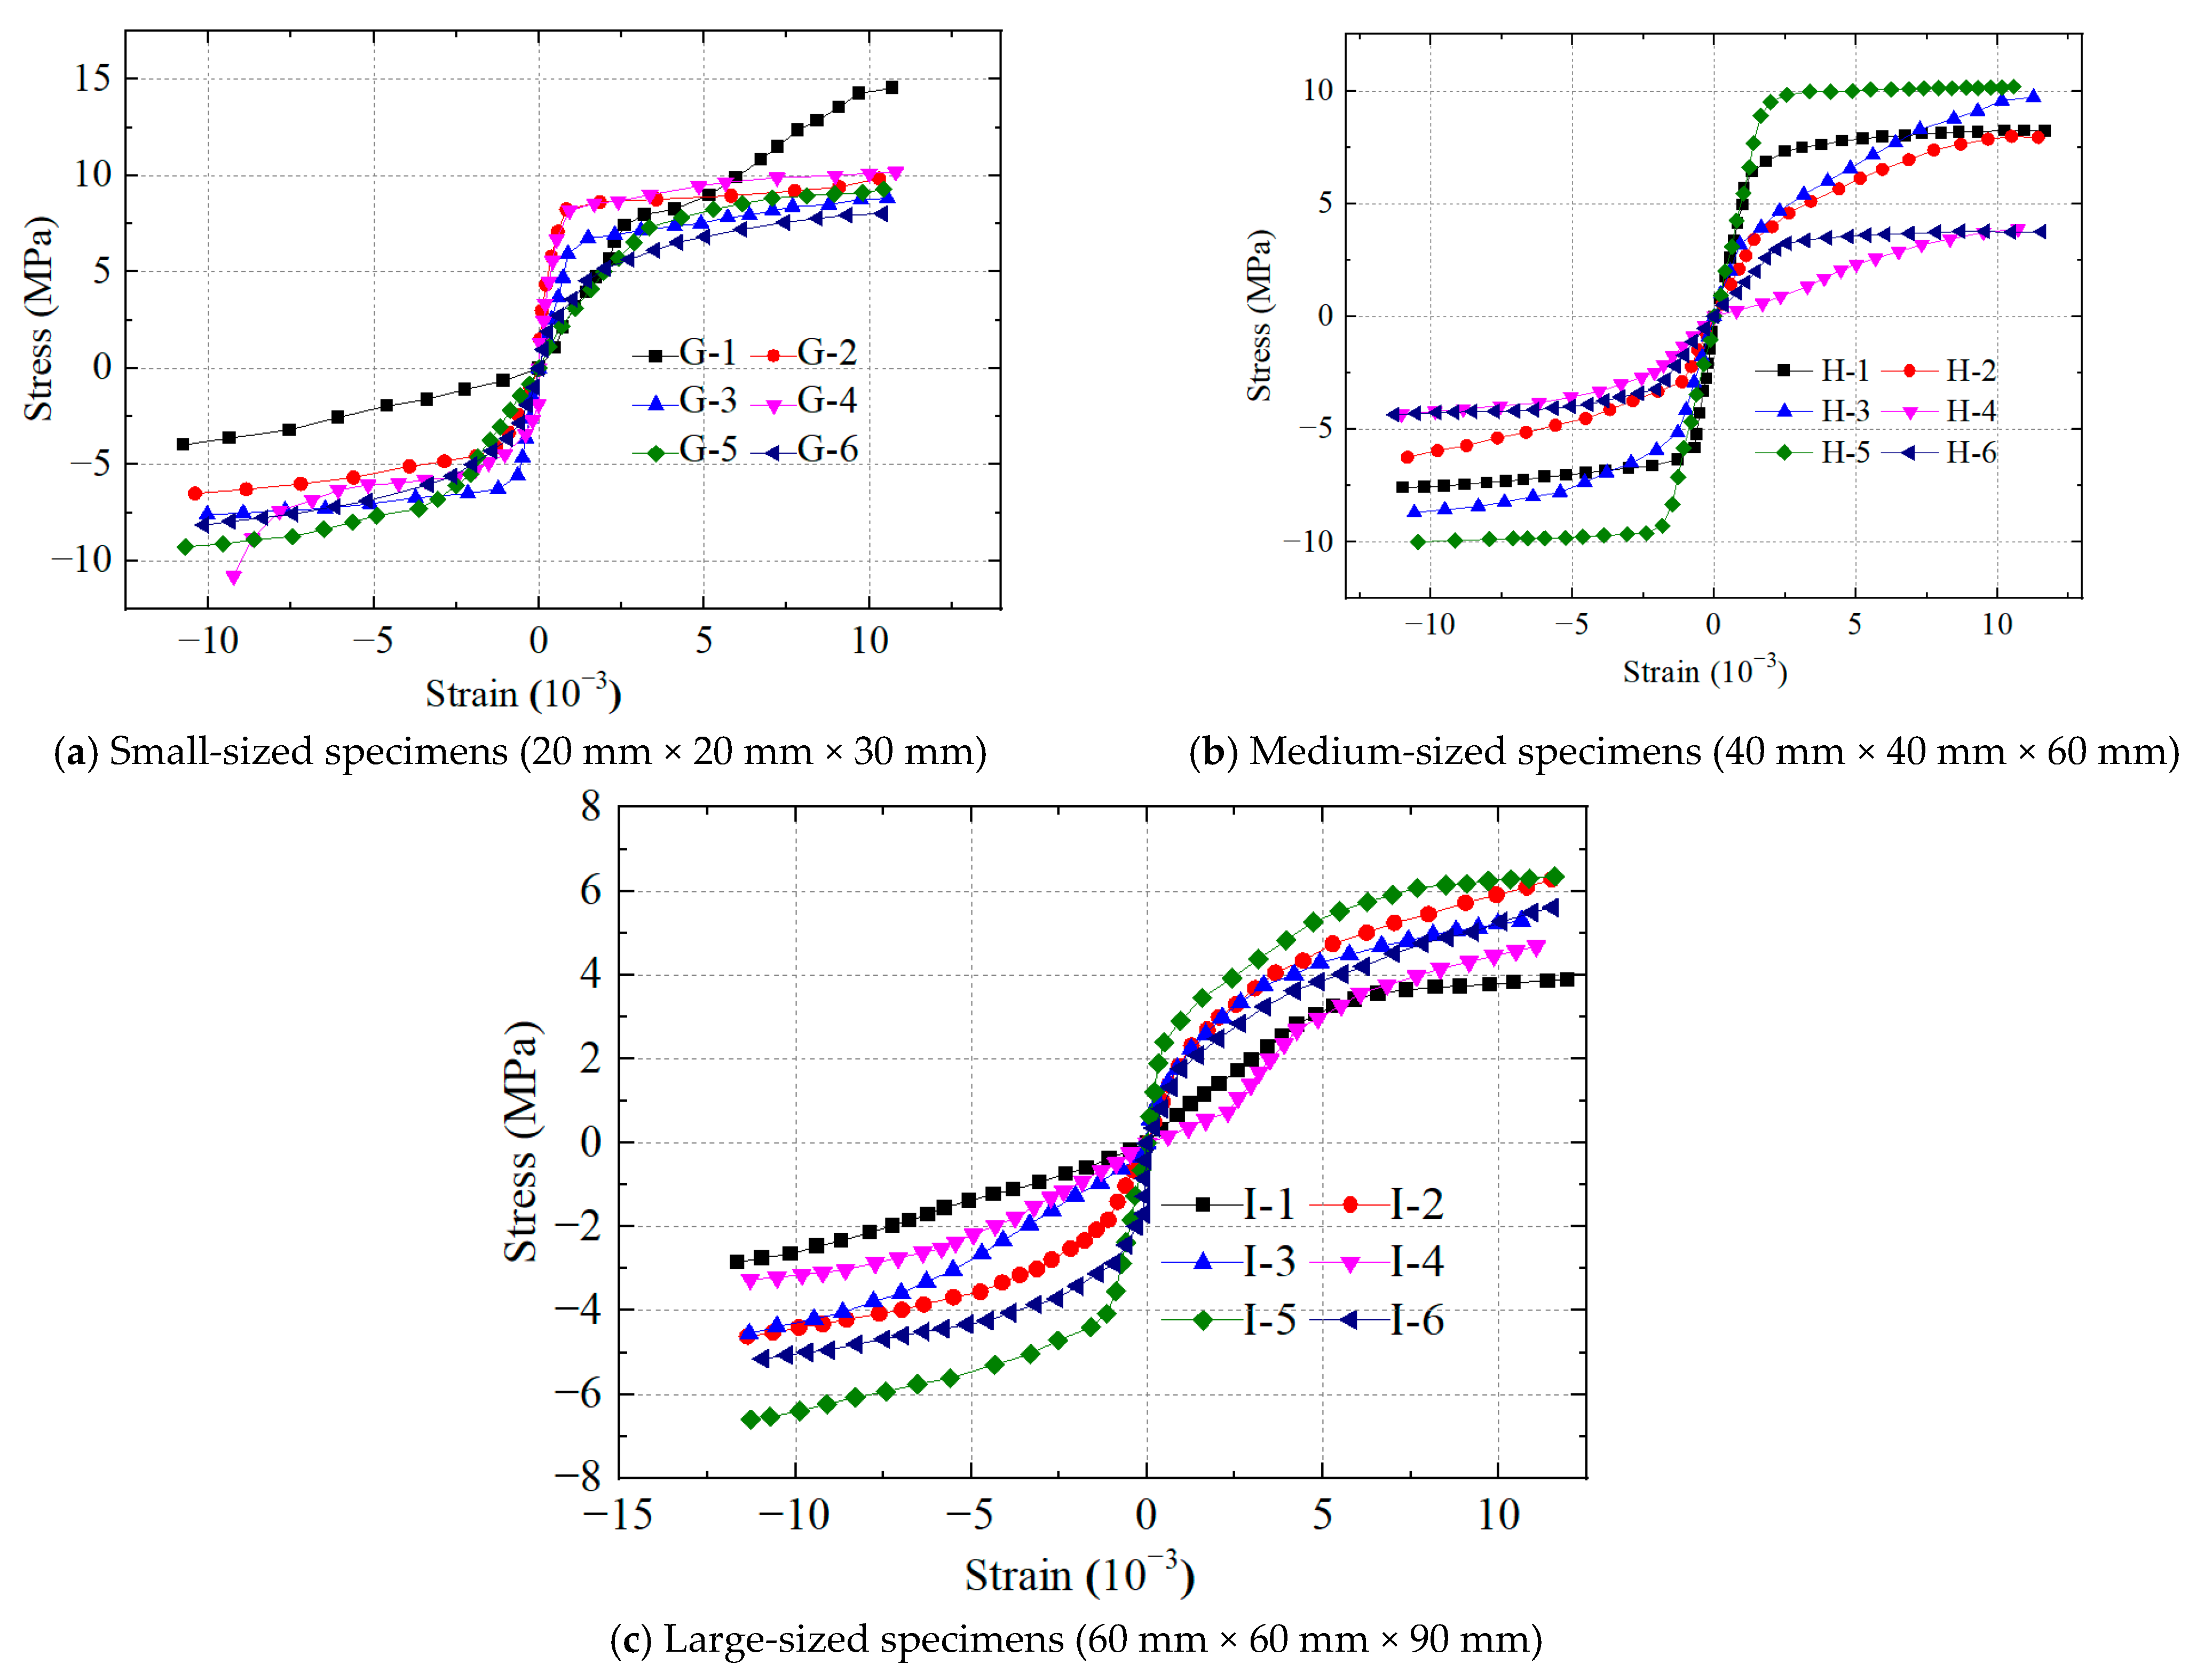
3.4. Stress–Strain Curve

Figure 11, Figure 12 and Figure 13 depict stress–strain curves for different-size specimens in the longitudinal, radial, and tangential directions. The stress–strain curves for longitudinal compression, as shown in Figure 11, indicate that as the specimen size increases, the stress–strain curves of all six specimens gradually converge. This convergence suggests that smaller specimens yield more variable experimental results. Similarly, the stress–strain relationships for radial and tangential compression, as presented in Figure 12 and Figure 13, demonstrate comparable trends. This observation emphasizes that the specimen size plays a role in influencing the establishment of stress–strain relationships (constitutive models) for wood under compression.
Figure 11, Figure 12 and Figure 13 show that all the stress–strain curves highlighted similar trends in the stress–strain behavior of wood specimens in these three directions. Initially, in the elastic phase, all curves exhibit a linear increase in stress with strain. However, as the specimen undergoes a phase transition into the plastic phase, the stress–strain relationship becomes nonlinear. Therefore, based on the experimental data and using MATLAB (R2019a), the stress–strain curves can be fitted into a four-stage stress–strain curve, as shown in Figure 14, and the stress–strain curve equation can be expressed as follows:
σ = a 1 ε 2 + b 1 ε + c 1 ε < ε T t y σ = a 2 ε + b 2 ε T t y < σ < 0 σ = a 3 ε + b 3 0 < σ < ε T c y σ = a 4 ε 2 + b 4 ε + c 2 ε > ε T c y
where, σ T t y is the tensile yield stress, ε T t y is the tensile yield strain, σ T c y is the compressive yield stress, and ε T c y is compressive yield strain. a i , b i and c i are the coefficients for the stress–strain equation, The specific values are expressed in Table 4, Table 5 and Table 6.

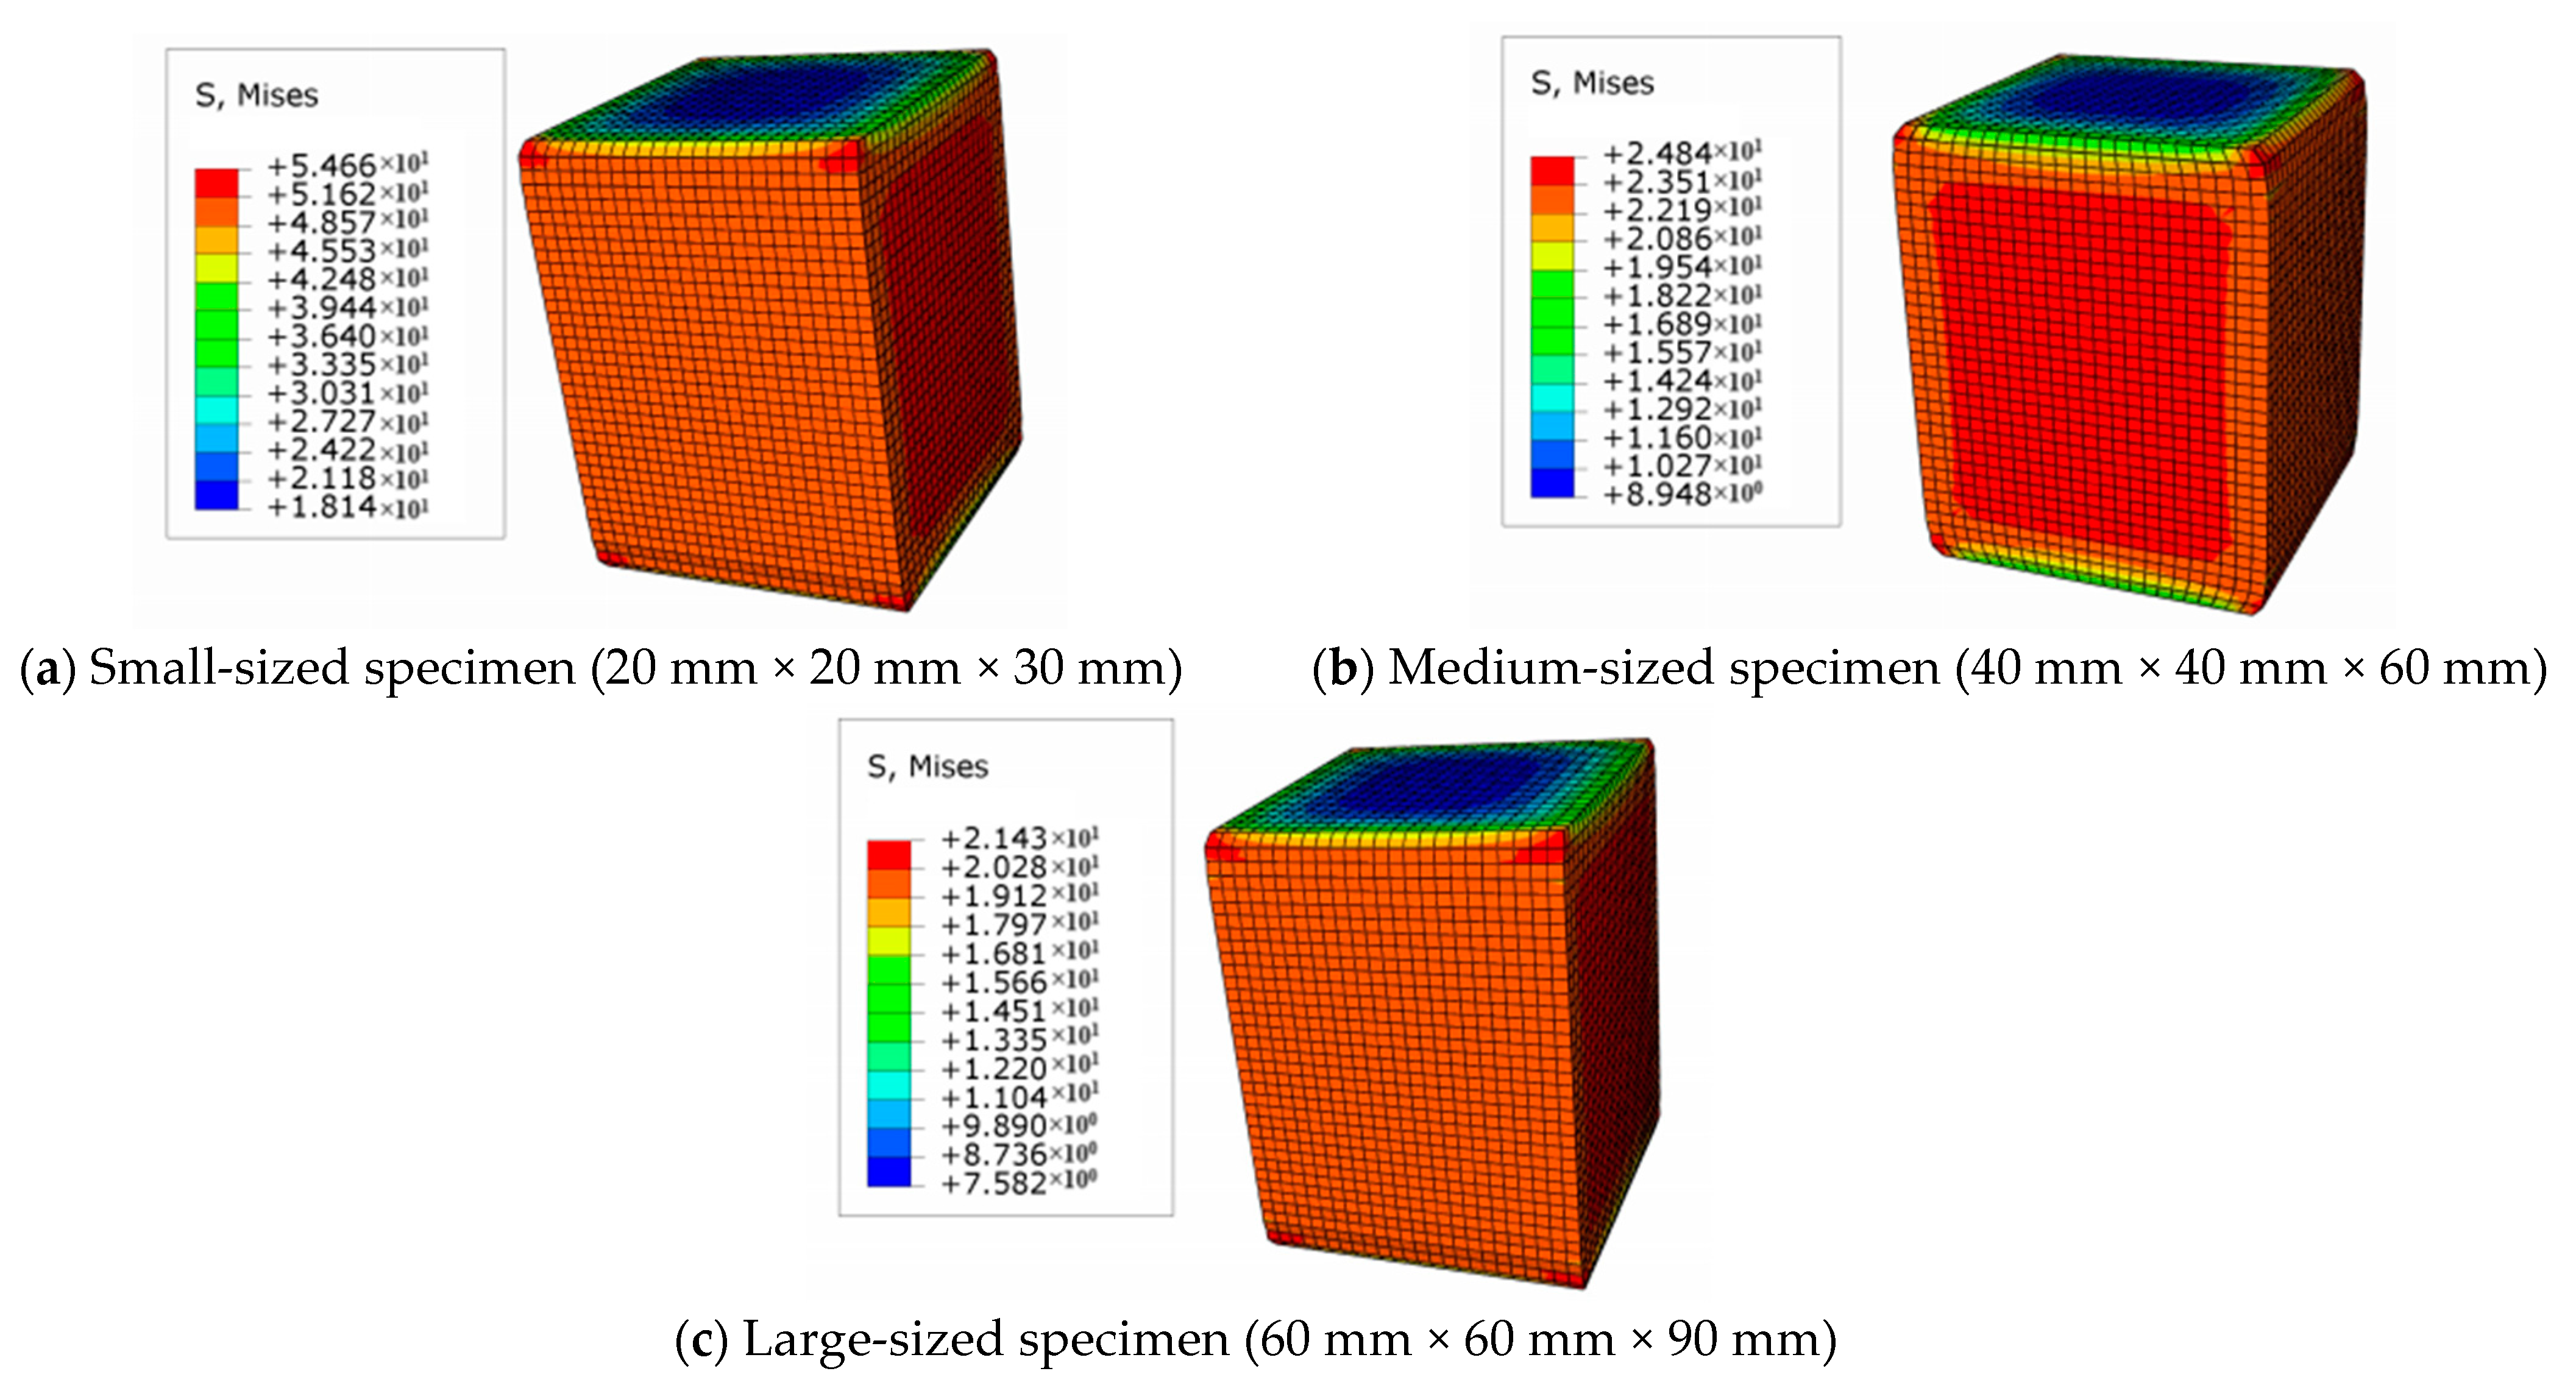
4. Finite Element Analysis

4.1. Finite Element Model

To illustrate the impact of specimen size on obtaining effective compression strength parameters, finite element numerical simulations were conducted using ABAQUS software (V6.14.3). Longitudinal, radial, and tangential specimens of three different sizes were modeled in these simulations. The finite element models employed 8-node solid C3D8R elements for meshing and isotropic elastic constitutive models were applied in the elastic phase. The boundary conditions of the model were designed as follows: a rigid loading plate was used to apply displacement loading to the specimen model, and the loading plate was connected to the specimen surface using surface-to-surface contact. A friction coefficient of 0.3 was set for tangential contact between the loading plate and the specimen, while a “hard” contact was used to describe the normal contact relationship between them. The input physical properties from experiments and established stress–strain relationships (constitutive models) were used to define the material behavior. In the plastic phase, Hill’s yield criterion was utilized to simulate anisotropic mechanical behavior once the internal stresses exceeded material strength [25]. Furthermore, to ensure consistent results with the experiments, the displacement in the finite element models was simulated to match the experimental displacements.

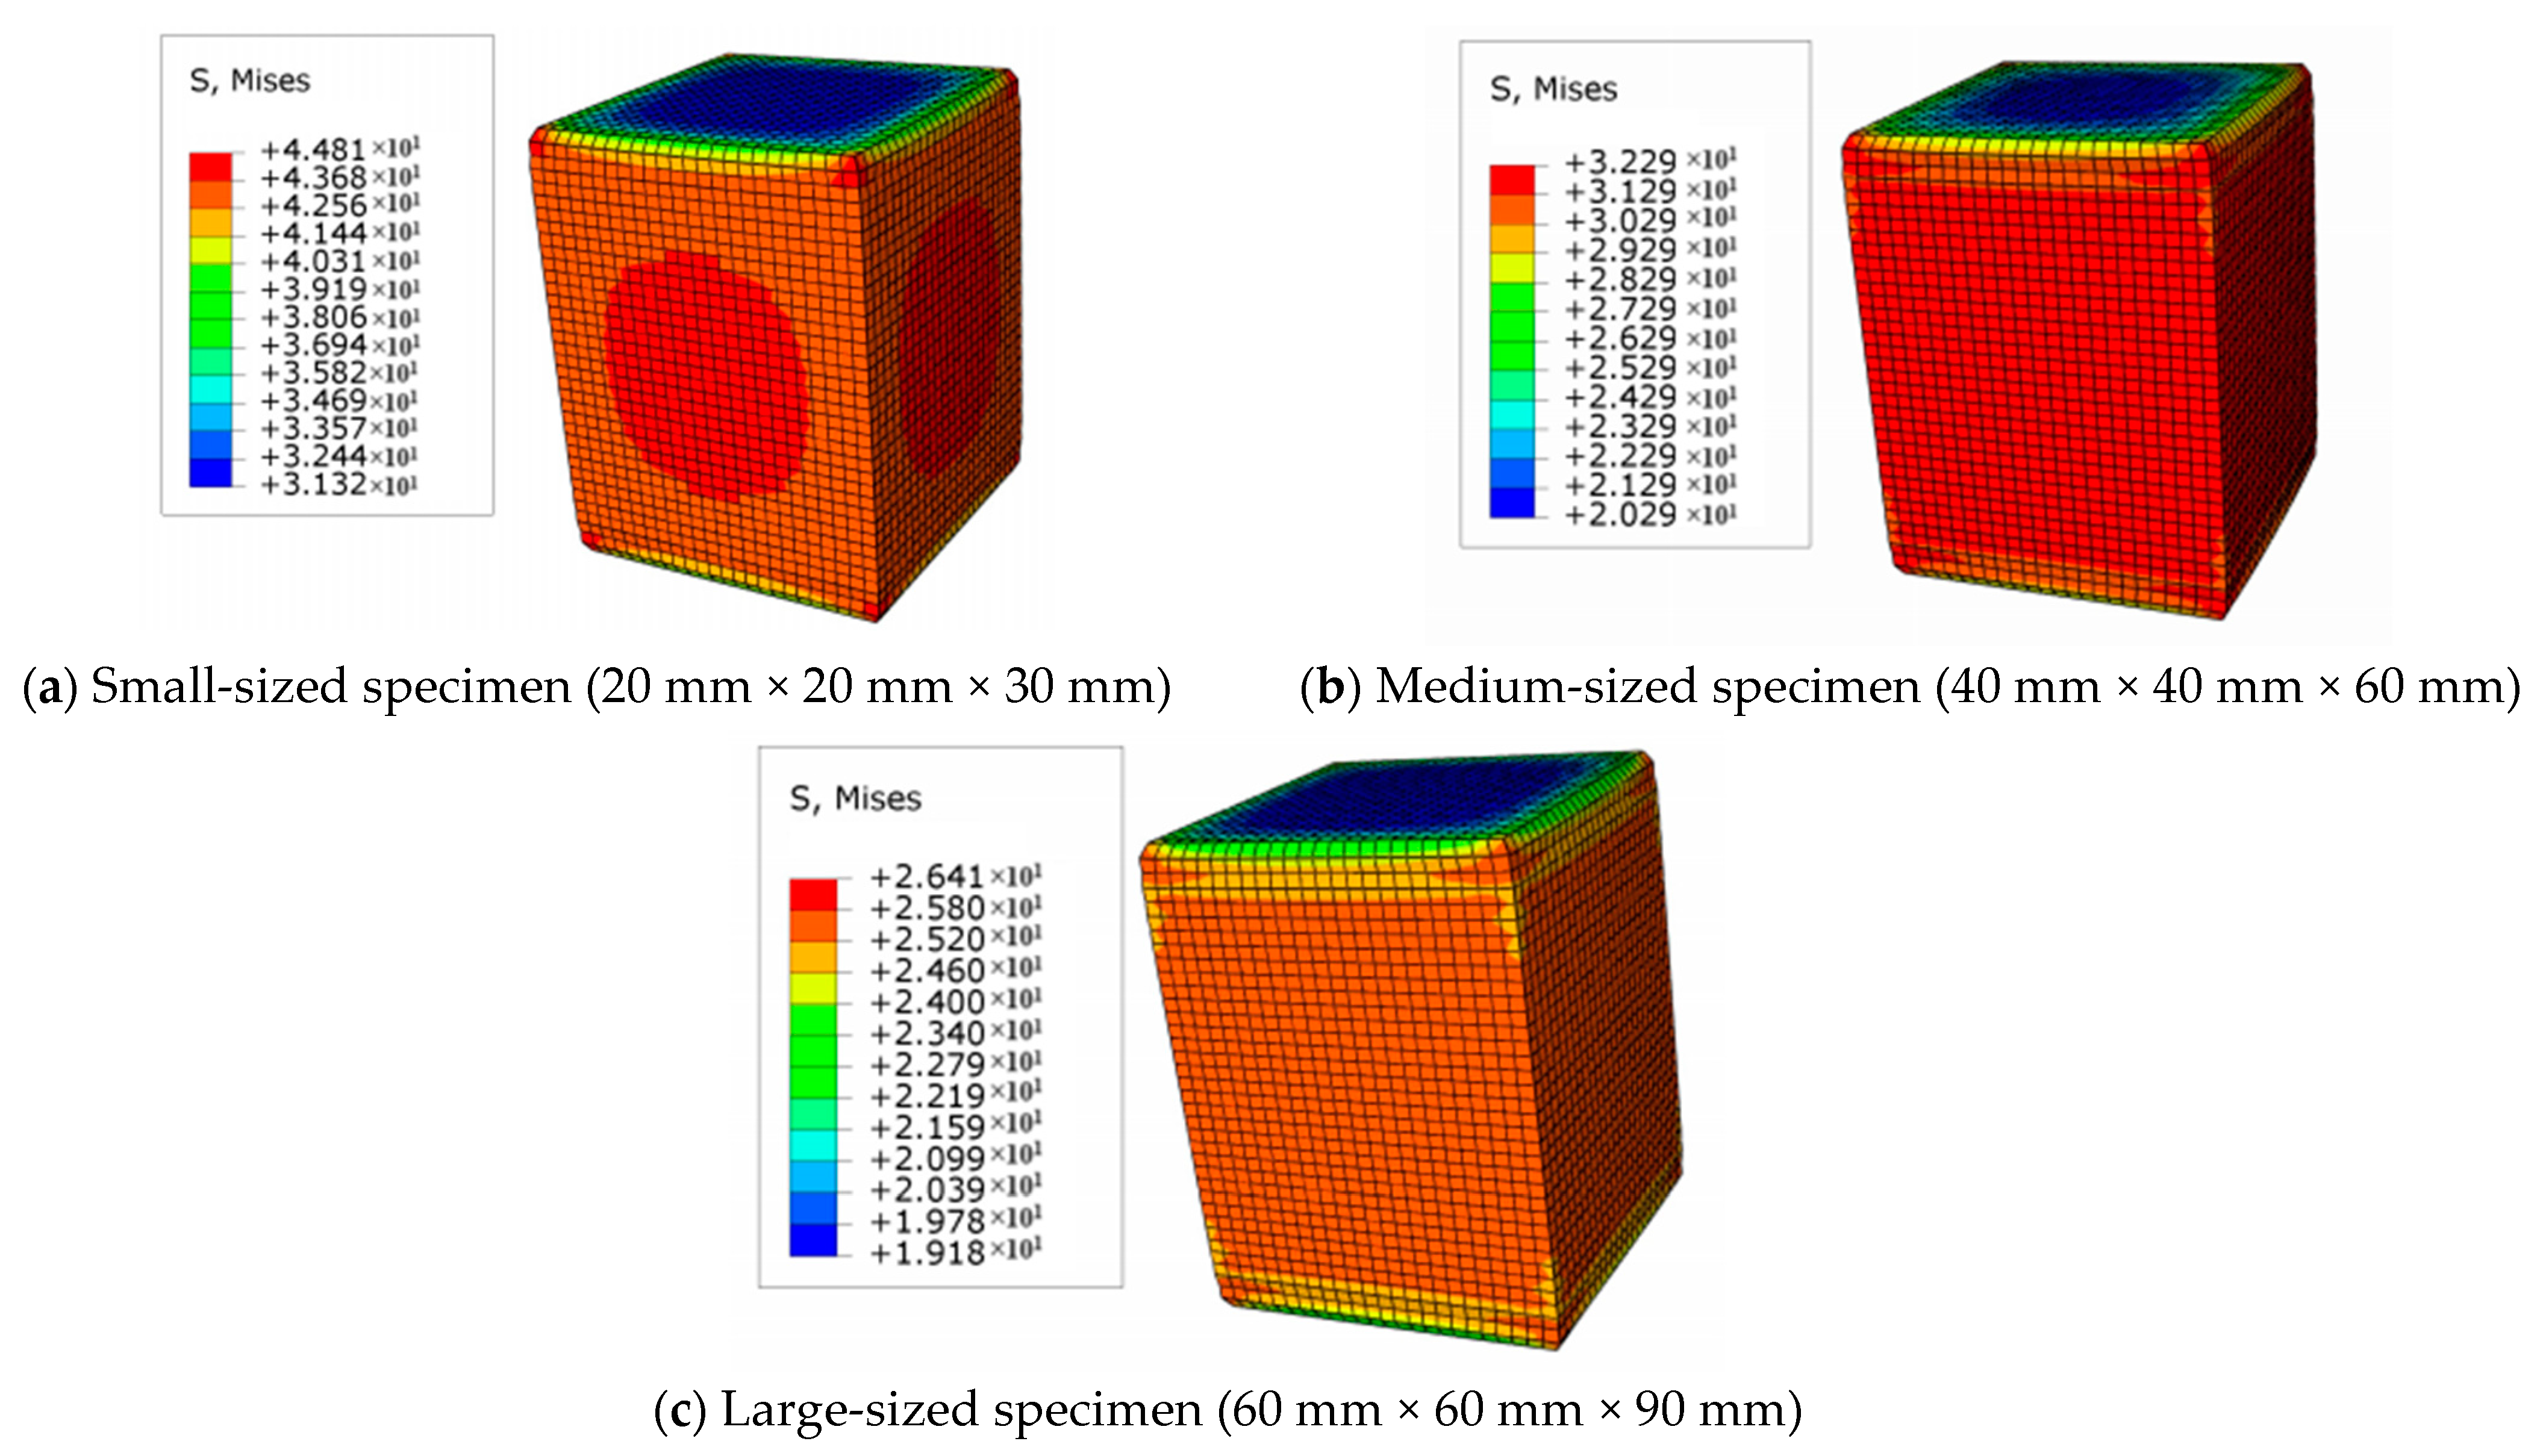
4.2. Finite Element Analysis of Results

The finite element numerical simulations utilized a computational approach to derive the stress results for specimens of varying sizes in the longitudinal, radial, and tangential directions. The computational results, closely aligned with the experimental findings, were significant in understanding the stress behavior of the wood specimens. Stress distribution maps for these specimens are shown in Figure 15 and Figure 16.
Table 7 indicates the stress of the numerical simulation compared to the stress of tests. As shown in Table 7, the discrepancy between stress values obtained through numerical simulations and experimental measurements increases as the specimen size decreases, with errors exceeding 15%, and tangential errors reaching 22.7%. Moderate-sized specimens and large-sized specimens exhibit good agreement between numerical simulation results and experimental data, with errors below 10%. In the case of moderate-sized specimens, the error is 9.1% for longitudinal specimens and less than 3% for radial and tangential specimens. The numerical simulation analysis also demonstrates that specimen size influences the accuracy of obtaining accurate mechanical properties for wood under compression. Small specimen sizes can result in significant errors.
In conclusion, the comparison between numerical simulations and experimental results underscores the significance of specimen size in compression strength testing for wood. These data strongly supports the recommendation of utilizing moderate-sized (40 mm × 40 mm × 60 mm) and large-sized specimens (60 mm × 60 mm × 90 mm) to achieve more accurate physical properties and constitutive models.

5. Conclusions

This study aimed to clarify the influence of specimen size on the compressive strength of wood. Through a series of compression tests on wood, specimens in the longitudinal, radial, and tangential directions, following the experiments, finite element numerical simulations were employed to complement the experimental findings. The main conclusions are as follows:
  • The size of the wood specimens has a significant impact on obtaining reasonable and effective compression strength parameters, with the longitudinal specimens being the most affected. The use of the moderate-sized specimens proposed in this paper (40 mm × 40 mm × 60 mm) and large-sized specimens (60 mm × 60 mm × 90 mm) provides more reasonable compression strength parameters.
  • It is suggested that the specimen size could be the moderate-sized specimens proposed in this paper (40 mm × 40 mm × 60 mm). Current test methods and technical specifications use small-sized specimens (20 mm × 20 mm × 30 mm) which only reflect the compressive strength parameters of wood within a single growth ring, leading to significant variability.
  • Using the moderate-sized (40 mm × 40 mm × 60 mm) camphorwood specimens, mechanical properties for longitudinal, radial, and tangential compression strength, stress–strain relationships (constitutive models) can be used in numerical simulations for camphorwood components and structures, providing more accurate computational results.

Author Contributions

Investigation, Writing—Data curation, C.Z. (Chuan Zhao); Conceptualization, Investigation, Methodology & Writing D.L.; Conceptualization, Investigation, Writing—reviewing & editing, C.Z. (Chuntao Zhang); Experiment, Data curation, Y.W.; Investigation, Writing—reviewing & editing Y.L. All authors have read and agreed to the published version of the manuscript.

Funding

This research was funded by the Sichuan Science and Technology Program (Grant No. 2019YJ0437), and the National Natural Science Foundation of China (Grant No. 51868013, 51508482).

Data Availability Statement

The data presented in this study are available on request from the corresponding author. The data are not publicly available due to Fund Requirements.

Conflicts of Interest

The authors declare no conflicts of interest.

References

  1. Li, Z.; He, M.; Wang, X.; Li, M. Seismic Performance Assessment of Steel Frame Infilled with Prefabricated Wood Shear Walls. J. Constr. Steel Res. 2018, 140, 62–73. [Google Scholar] [CrossRef]
  2. Thamboo, J.; Navaratnam, S.; Poologanathan, K.; Corradi, M. Experimental Investigation of Timber Samples under Triaxial Compression Conditions. J. Build. Eng. 2022, 57, 104891. [Google Scholar] [CrossRef]
  3. Gharib, M.; Hassanieh, A.; Valipour, H.; Bradford, M.A. Three-Dimensional Constitutive Modelling of Arbitrarily Orientated Timber Based on Continuum Damage Mechanics. Finite Elem. Anal. Des. 2017, 135, 79–90. [Google Scholar] [CrossRef]
  4. Valipour, H.; Khorsandnia, N.; Crews, K.; Foster, S. A Simple Strategy for Constitutive Modelling of Timber. Constr. Build. Mater. 2014, 53, 138–148. [Google Scholar] [CrossRef]
  5. Oudjene, M.; Khelifa, M. Finite Element Modelling of Wooden Structures at Large Deformations and Brittle Failure Prediction. Mater. Des. 2009, 30, 4081–4087. [Google Scholar] [CrossRef]
  6. Andre, A.; Kliger, R.; Asp, L.E. Compression Failure Mechanism in Small Scale Timber Specimens. Constr. Build. Mater. 2014, 50, 130–139. [Google Scholar] [CrossRef]
  7. GB/T 1935-2009; Method of Testing in Compressive Strength Parallel to Grain of Wood. Ministry of Construction of the People’s Republic of China: Beijing, China, 2009.
  8. GB/T 1939-2009; Method of Testing in Compressive Strength Perpendicular to Grain of Wood. Ministry of Construction of the People’s Republic of China: Beijing, China, 2009.
  9. GB/T 50005-2017; Standard for Design of Timber Structure. Ministry of Housing and Urban-Rural Development of the People’s Republic of China: Beijing, China, 2017.
  10. Mascia, N.T.; Vanalli, L. Evaluation of the Coefficients of Mutual Influence of Wood through Off-Axis Compression Tests. Constr. Build. Mater. 2012, 30, 522–528. [Google Scholar] [CrossRef]
  11. Li, L.; Gong, M.; Chui, Y.H.; Schneider, M.; Li, D. Measurement of the Elastic Parameters of Densified Balsam Fir Wood in the Radial-Tangential Plane Using a Digital Image Correlation (DIC) Method. J. Mater. Sci. 2013, 48, 7728–7735. [Google Scholar] [CrossRef]
  12. Yang, N.; Zhang, L.; Qin, S.J. A Nonlinear Constitutive Model for Characterizing Wood under Compressive Load and Its Test Verification. China Civ. Eng. J. 2017, 50, 80–88. [Google Scholar]
  13. Kong, Y.; Liu, W.; Cheng, X.; Lu, W. Experimental Study on Parallel-to-Grain Compressive Strength of Structural Douglas Fir Wood Exposed to Elevated Temperatures. J. Huazhong Univ. Sci. Technol. 2019, 47, 44–49. [Google Scholar] [CrossRef]
  14. Gonnerman, H.F. Effect of Size and Shape of Test Specimen on Compressive Strength of Concrete; Structural Materials Research Laboratory, 1925; Available online: https://api.semanticscholar.org/CorpusID:210755492 (accessed on 27 February 2024).
  15. Issa, M.A.; Issa, M.A.; Islam, M.S.; Chudnovsky, A. Size Effects in Concrete Fracture–Part II: Analysis of Test Results. Int. J. Fract. 2000, 102, 25–42. [Google Scholar] [CrossRef]
  16. Yi, S.-T.; Yang, E.-I.; Choi, J.-C. Effect of Specimen Sizes, Specimen Shapes, and Placement Directions on Compressive Strength of Concrete. Nucl. Eng. Des. 2006, 236, 115–127. [Google Scholar] [CrossRef]
  17. Che, Y.; Ban, S.L.; Cui, J.Y.; Chen, G.; Song, Y.P. Effect of Specimen Shape and Size on Compressive Strength of Concrete. Adv. Mater. Res. 2011, 163, 1375–1379. [Google Scholar] [CrossRef]
  18. Saridemir, M. Effect of Specimen Size and Shape on Compressive Strength of Concrete Containing Fly Ash: Application of Genetic Programming for Design. Mater. Des. 2014, 56, 297–304. [Google Scholar] [CrossRef]
  19. Abdullah, A. Effects of Specimen Sizes and Loading Rates on Compressive Strength of Concrete. Mater. Today Proc. 2021, 46, 1783–1786. [Google Scholar] [CrossRef]
  20. Schlotzhauer, P.; Nelis, P.A.; Bollmus, S.; Gellerich, A.; Militz, H.; Seim, W. Effect of Size and Geometry on Strength Values and Moe of Selected Hardwood Species. Wood Mater. Sci. Eng. 2017, 12, 149–157. [Google Scholar] [CrossRef]
  21. Akter, S.T.; Serrano, E.; Bader, T.K. Numerical Modelling of Wood under Combined Loading of Compression Perpendicular to the Grain and Rolling Shear. Eng. Struct. 2021, 244, 112800. [Google Scholar] [CrossRef]
  22. Rodrigues, E.F.C.; De Araujo, V.A.; Cavalheiro, R.S.; Marini, L.J.; Almeida, J.P.B.; Azevedo, A.R.G.; Oliveira, L.B.; Lahr, F.A.R.; dos Santos, H.F.; Christoforo, A.L. Influence of Growth Rings Position of Wood on the Determination of Its Shear Strength Parallel to Grain. J. Mater. Res. Technol. 2023, 24, 9765–9779. [Google Scholar] [CrossRef]
  23. Yue, K.; Li, X.; Jiao, X.; Wu, P.; Song, X. Strength Grading of Chinese Poplar Wood for Structural Use Following Thermal Modification. Polym. Test. 2023, 123, 108032. [Google Scholar] [CrossRef]
  24. Weibull, W.A. Statistical Theory of the Strength of Materials. Proc. R. Swed. Inst. Eng. Res. 1939, 151, 1–45. Available online: https://searchworks.stanford.edu/view/1150953 (accessed on 27 February 2024).
  25. Shekarchia, M.; Vatani Oskoueib, A.; Raftery, G.M. Flexural Behavior of Timber Beams Strengthened with Pultruded Glass Fiber Reinforced Polymer Profiles. Compos. Struct. 2020, 241, 112062. [Google Scholar] [CrossRef]
  26. Chen, Y.; Zhang, C. Stability Analysis of Pultruded Basalt Fiber-Reinforced Polymer (BFRP) Tube under Axial Compression. Compos. Struct. 2024, 327, 117660. [Google Scholar] [CrossRef]
  27. Zhang, C.; Chen, Y.; Dou, M. Axial Compression Behaviour and Modelling of Pultruded Basalt-Fibre-Reinforced Polymer (BFRP) Tubes. Buildings 2023, 13, 1397. [Google Scholar] [CrossRef]
Figure 1. Different compressive strength specimens. The numbers 1, 2, …, 6 are the specimen number in the figure.
Buildings 14 01156 g001
Figure 2. Wood diagram.
Buildings 14 01156 g002
Figure 3. Material mechanics universal testing machine.
Buildings 14 01156 g003
Figure 4. The arrangement of the strain gauges.
Buildings 14 01156 g004
Figure 5. Failure process of the longitudinal compressive specimens. The A-N,B-N and C-N(N = 1, 2, …, 6) are the specimen number for small-sized specimens, medium-sized specimens and large-sized specimens respectively for the longitudinal compressive specimens.
Buildings 14 01156 g005
Figure 6. Failure process of the radial compressive specimens. The D-N,E-N and F-N(N = 1, 2, …, 6) are the specimen number for small-sized specimens, medium-sized specimens and large-sized specimens respectively for the radial compressive specimens.
Buildings 14 01156 g006aBuildings 14 01156 g006b
Figure 7. Failure process of the tangential compressive specimens. The G-N,H-N and I-N(N = 1, 2, …, 6) are the specimen number for small-sized specimens, medium-sized specimens and large-sized specimens respectively for the radial compressive specimens.
Buildings 14 01156 g007
Figure 8. Load–displacement curves of the longitudinal specimens.
Buildings 14 01156 g008
Figure 9. Load–displacement curves of the radial specimens.
Buildings 14 01156 g009
Figure 10. Load–displacement curves of the tangential specimens.
Buildings 14 01156 g010
Figure 11. Stress–strain curves of the longitudinal compressive specimens.
Buildings 14 01156 g011
Figure 12. Stress–strain curves of the radial compressive specimens.
Buildings 14 01156 g012
Figure 13. Stress–strain curves of the tangential compressive specimens.
Buildings 14 01156 g013
Figure 14. The simplified stress–strain curve.
Buildings 14 01156 g014
Figure 15. Stress of the radial compressive specimens (MPa).
Buildings 14 01156 g015
Figure 16. The stress of the longitudinal compressive specimens (MPa).
Buildings 14 01156 g016
Table 1. Longitudinal compressive strength parameters.
Specimen SizeCompressive Strength (MPa)Average Compressive Strength (MPa)
(Coefficient of Variation)
Elastic Modulus
Small-sized16.4329.9333.40
(0.281)
E (MPa)11,600
35.8036.08 μ L T 0.48
38.6843.45 μ L R 0.44
Medium-sized23.8829.0529.59
(0.109)
E (MPa)11,010
29.8631.39 μ L T 0.49
29.7633.61 μ L R 0.48
Large-sized24.1925.6627.48
(0.085)
E (MPa)10,040
27.4827.94 μ L T 0.48
28.7230.89 μ L R 0.42
Table 2. Radial compressive strength parameters.
Specimen Size Compressive Strength (MPa)Average Compressive Strength (MPa) (Coefficient of Variation)Elastic Modulus
Small-sized4.885.186.03
(0.376)
E (MPa)2390
6.855.43 μ R T 0.65
8.735.13 μ R L 0.11
Medium-sized3.145.097.05
(0.382)
E (MPa)2470
6.138.93 μ R T 0.63
8.9510.08 μ R L 0.11
Large-sized3.955.526.27
(0.212)
E (MPa)2110
6.746.82 μ R T 0.67
6.947.65 μ R L 0.13
Table 3. Tangential compressive strength parameters.
Specimen SizeCompressive Strength (MPa)Average Compressive Strength (MPa)
(Coefficient of Variation)
Elastic Modulus
Small-sized4.284.335.80
(0.296)
E (MPa)1200
5.185.43 μ T L 0.08
6.858.75 μ T R 0.34
Medium-sized3.113.736.57
(0.389)
E (MPa)1380
7.117.57 μ T L 0.06
8.898.99 μ T R 0.37
Large-sized3.063.584.81
(0.279)
E (MPa)1220
4.545.19 μ T L 0.06
6.166.35 μ T R 0.35
Table 4. Coefficients for the stress–strain curves of the longitudinal compression specimens.
CoefficientSpecimen Size
Small-SizedMedium-SizedLarge-Sized
a 1 8168.21478.73572.6
b 1 1578.1395.2566.4
c 1 4.0−7.1−2.5
a 2 1197.7913.9791.3
b 2 −1.4−0.9−0.3
a 3 1745.21017.1630.5
b 3 0.30.40.1
a 4 −3065.2−3354.7−4363.7
b 4 424.5666.3686.6
c 2 15.88.8−0.1
εTty (×10−6)−1020−1160−870
εTcy (×10−6)114020101120
Table 5. Coefficients for the stress–strain curves of the radial compression specimens.
CoefficientSpecimen Size
Small-SizedMedium-SizedLarge-Sized
a 1 401.2491.2195.9
b 1 158.477.151.3
c 1 −5.1−3.2−2.9
a 2 906.3494.2303.9
b 2 −0.9−0.6−1.0
a 3 529.3233.3213.6
b 3 3.10.61.1
a 4 −1475.3−4590.2−418.6
b 4 −1598.4−1709.1−928.0
c 2 170.1190.4110.7
εTty (×10−6)6.63.31.9
εTcy (×10−6)−560−630−730
Table 6. Coefficients for the stress–strain curve of the tangential compression specimens.
CoefficientSpecimen Size
Small-SizedMedium-SizedLarge-Sized
a 1 310.4376.8289.9
b 1 77.364.456.9
c 1 −3.0−3.8−1.2
a 2 373.6254.8159.1
b 2 −0.6−0.4−0.3
a 3 600.6184.1158.6
b 3 0.80.6−0.3
a 4 −1475.3−4590.2−418.6
b 4 166.1202.580.3
c 2 3.83.31.0
εTty (×10−6)3.83.31.0
εTcy (×10−6)−800−720−850
Table 7. The stress of the numerical simulation and experiment.
SpecimenSpecimen DirectionMaximum Stress of Simulation (MPa)Maximum Stress of Experiments (MPa)Error
Small sizelongitudinal44.8138.6016.1%
radial54.6665.8017.0%
tangential34.4644.6022.7%
Medium sizelongitudinal32.2929.609.1%
radial24.8425.362.1%
tangential24.2523.632.6%
Large sizelongitudinal26.4127.905.3%
radial21.4323.508.8%
tangential22.8021.784.7%
Disclaimer/Publisher’s Note: The statements, opinions and data contained in all publications are solely those of the individual author(s) and contributor(s) and not of MDPI and/or the editor(s). MDPI and/or the editor(s) disclaim responsibility for any injury to people or property resulting from any ideas, methods, instructions or products referred to in the content.

