
Analysis of Train-Induced Vibration Transmission and Distribution Characteristics in Double-Layer Metro Depot

Abstract
1. Introduction
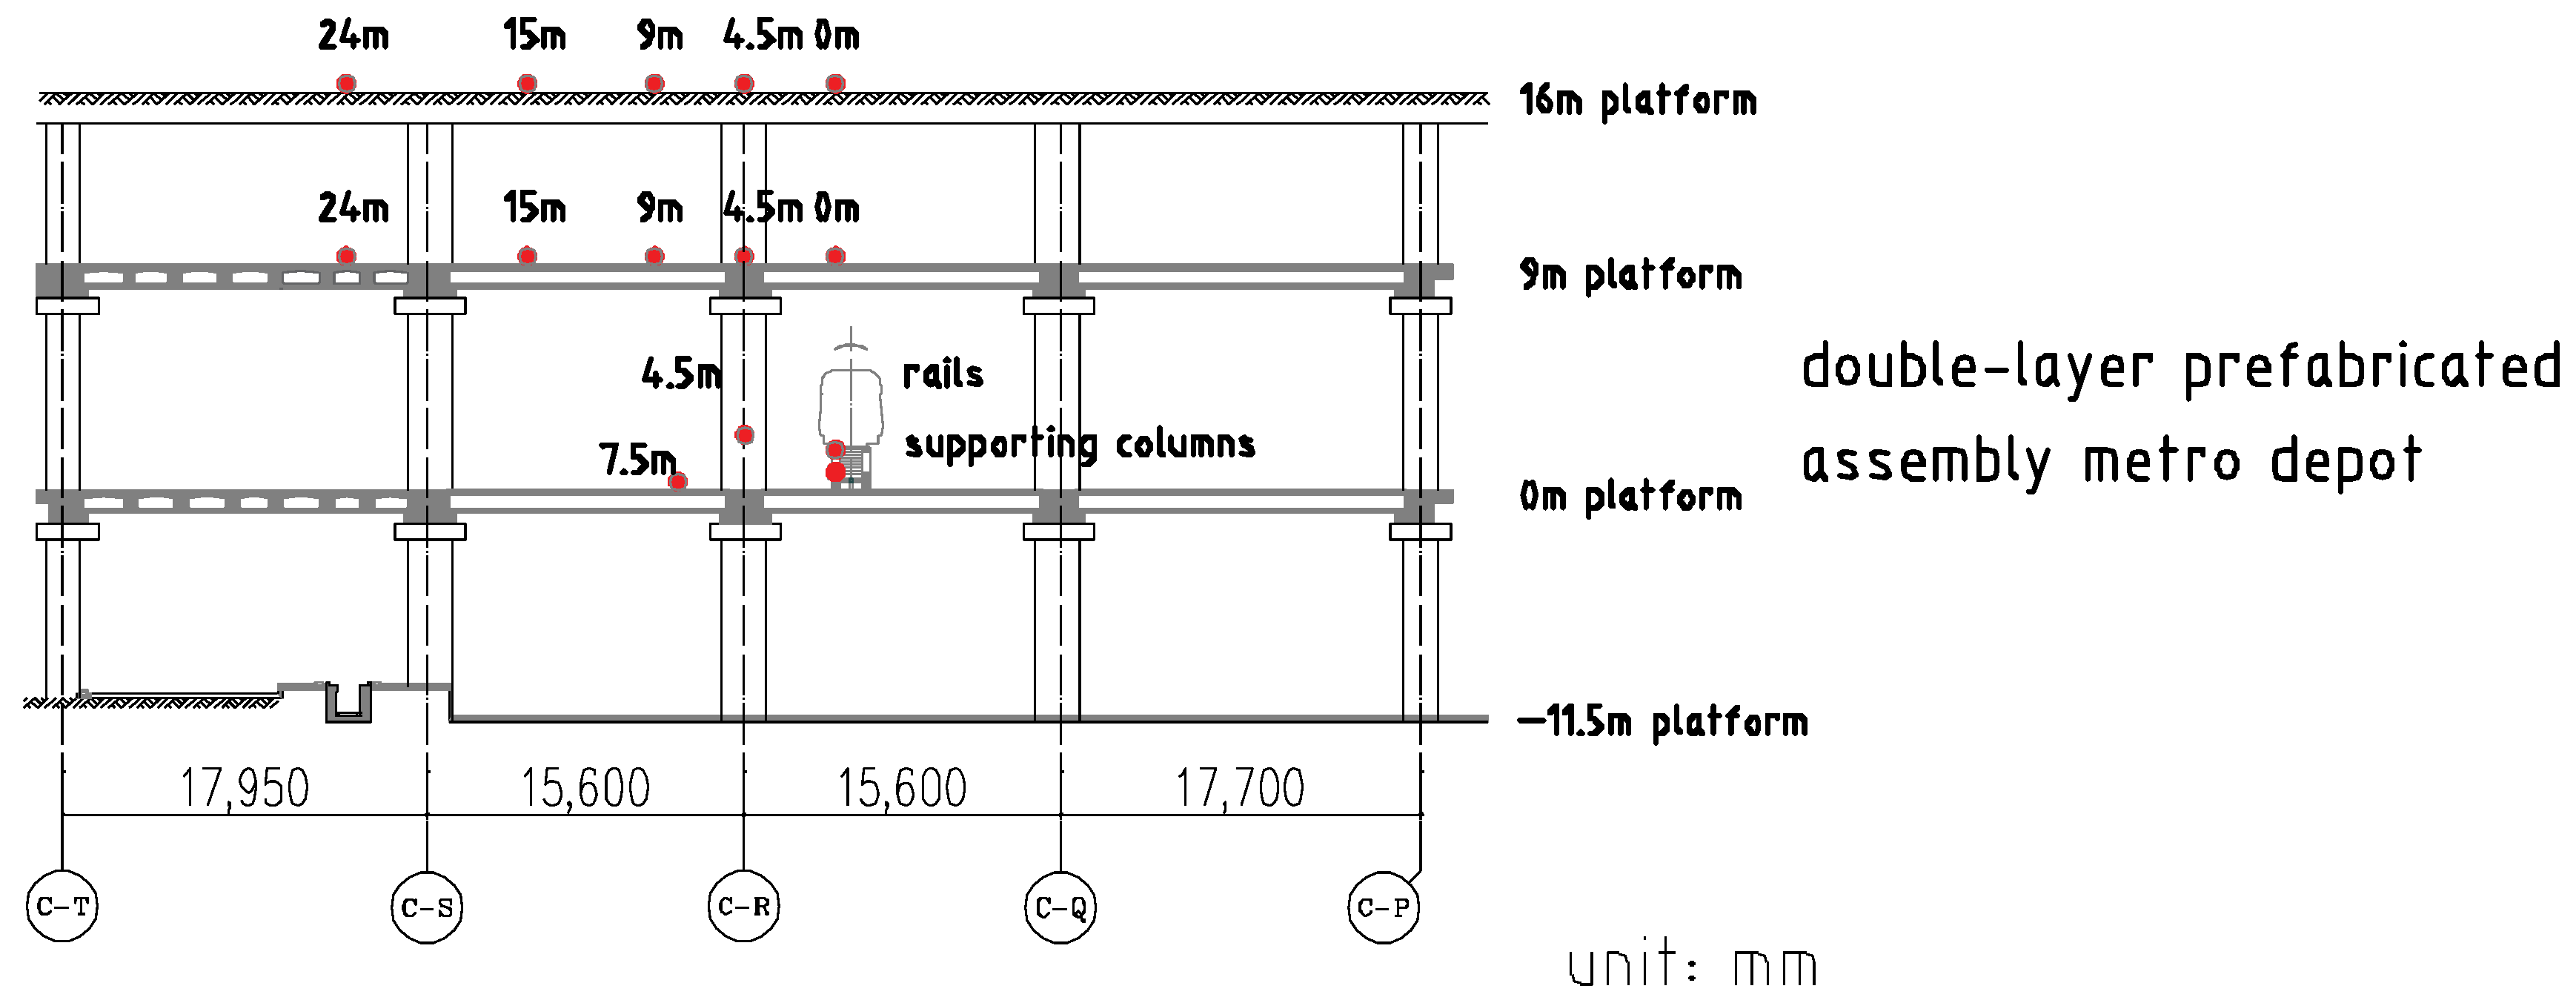
2. Project Profile
3. Modeling
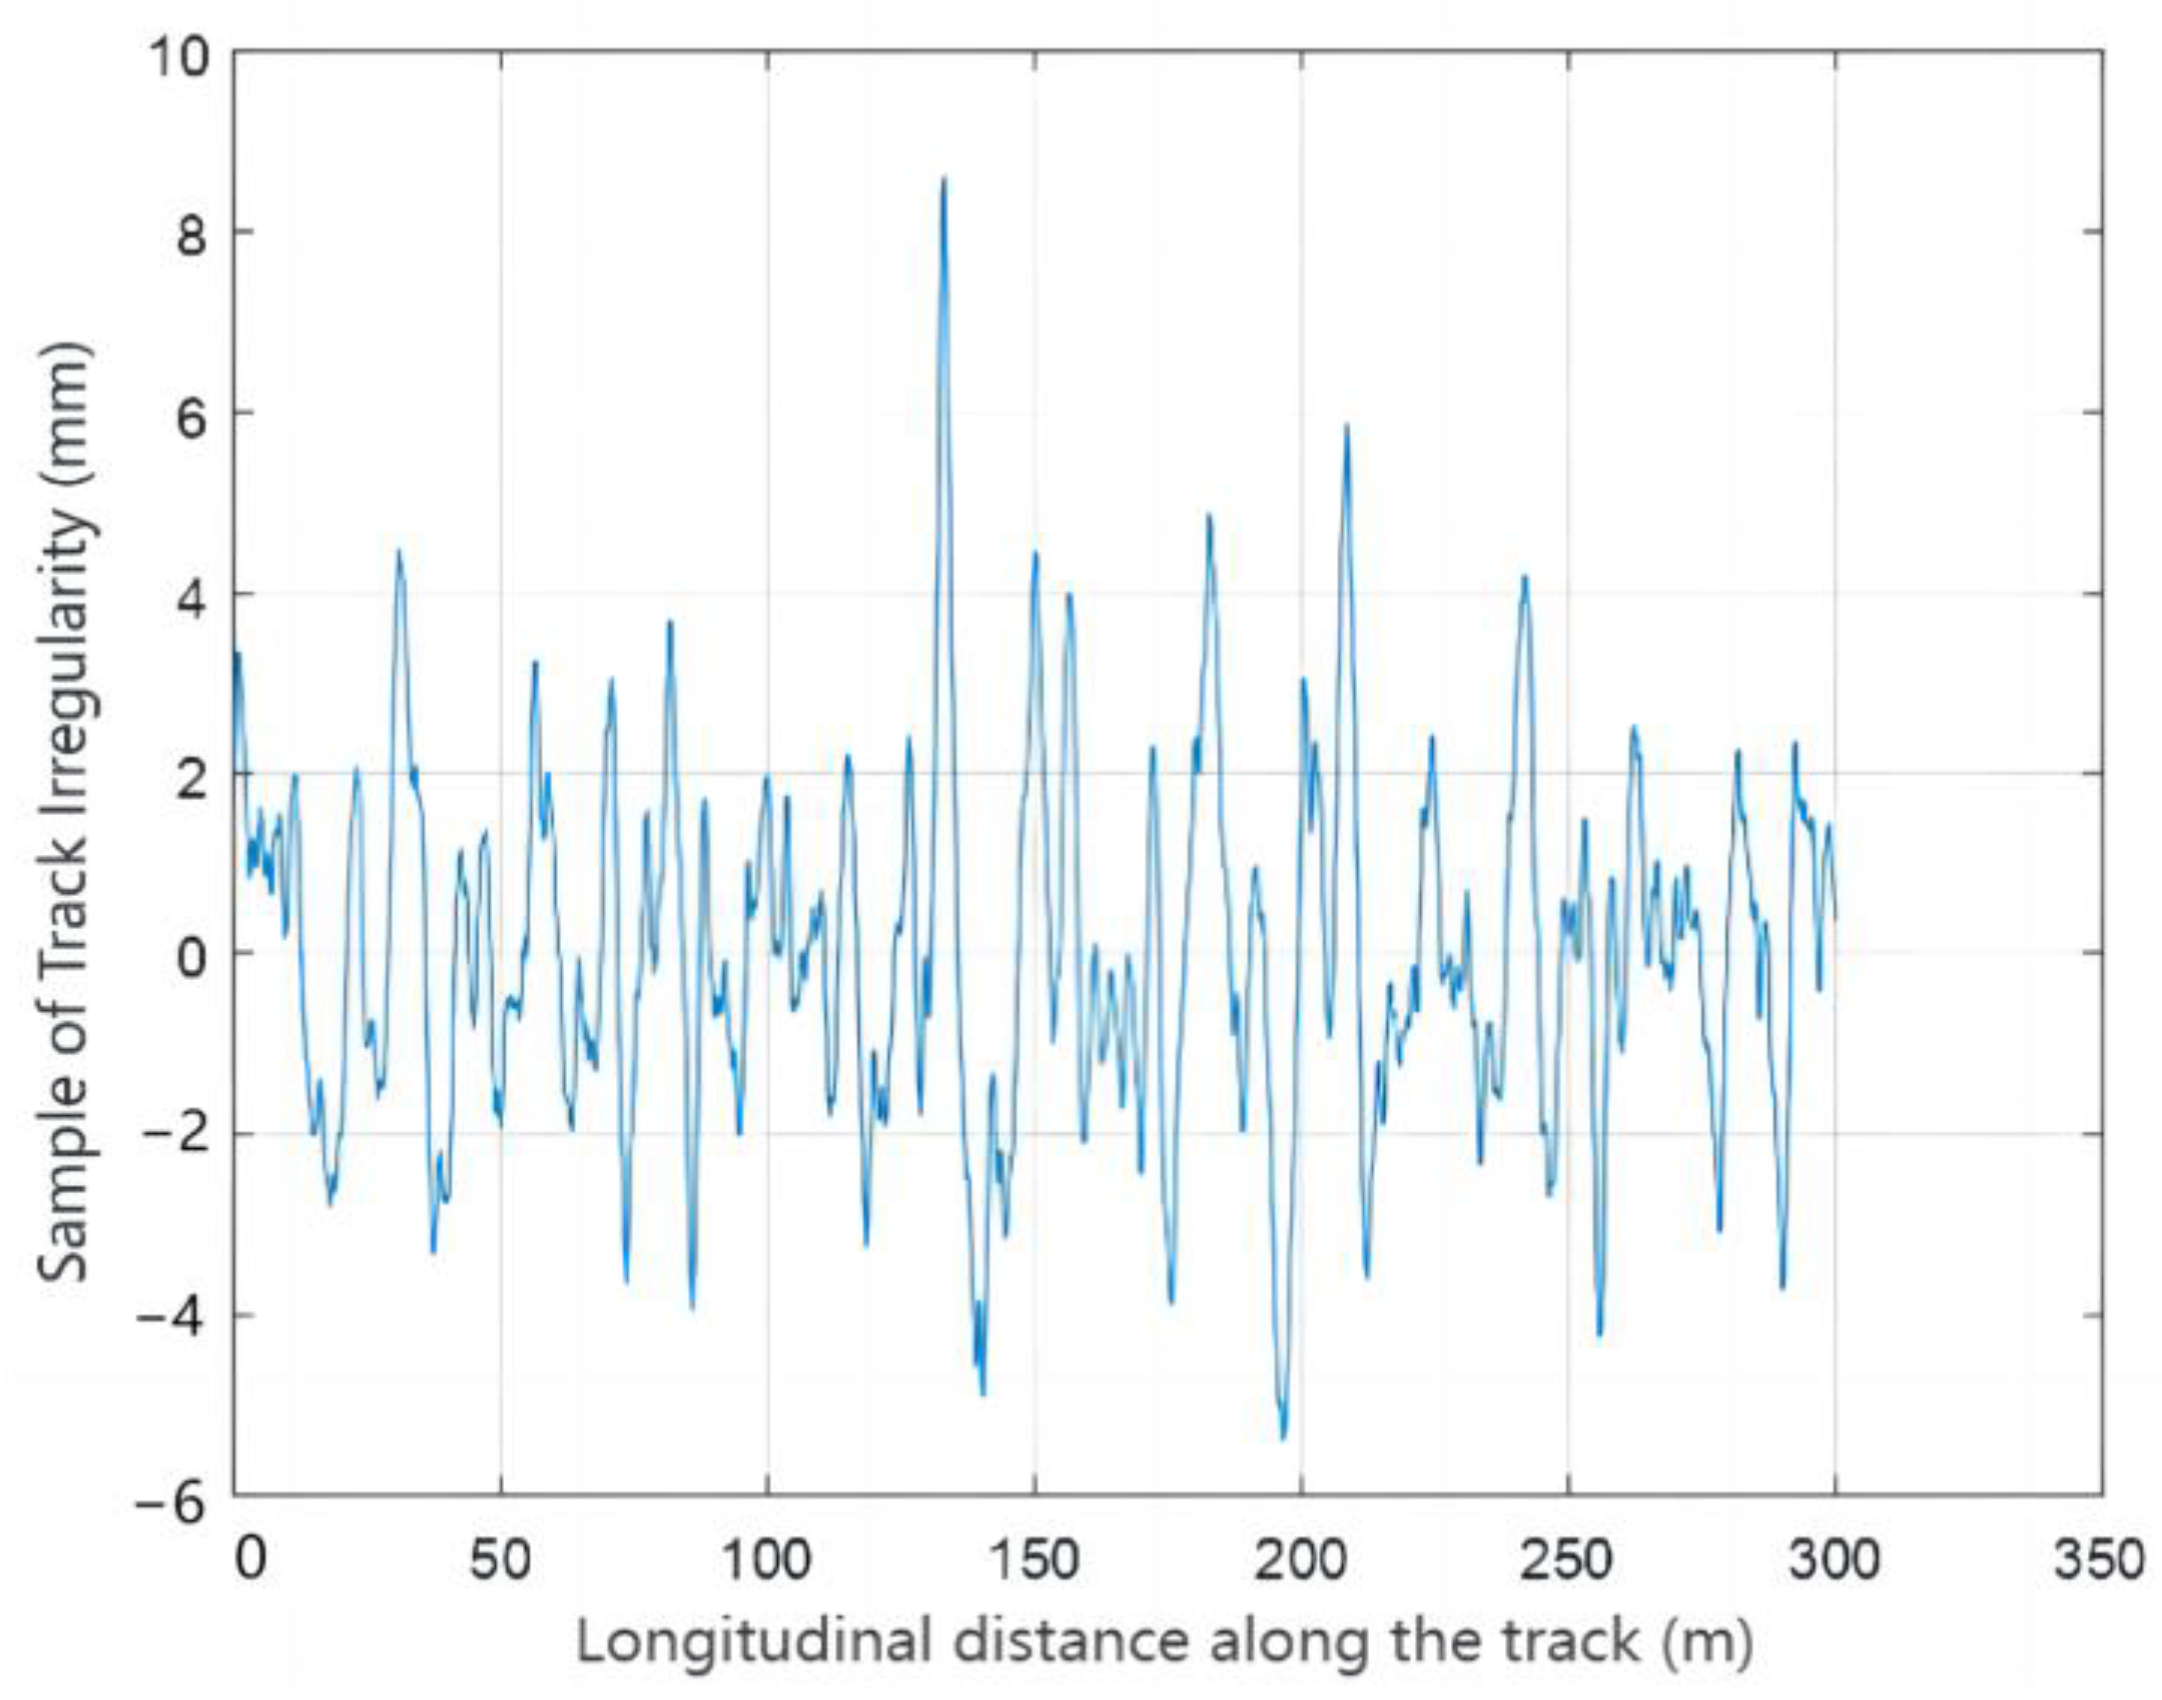
3.1. The Vehicle–Track Coupling Model
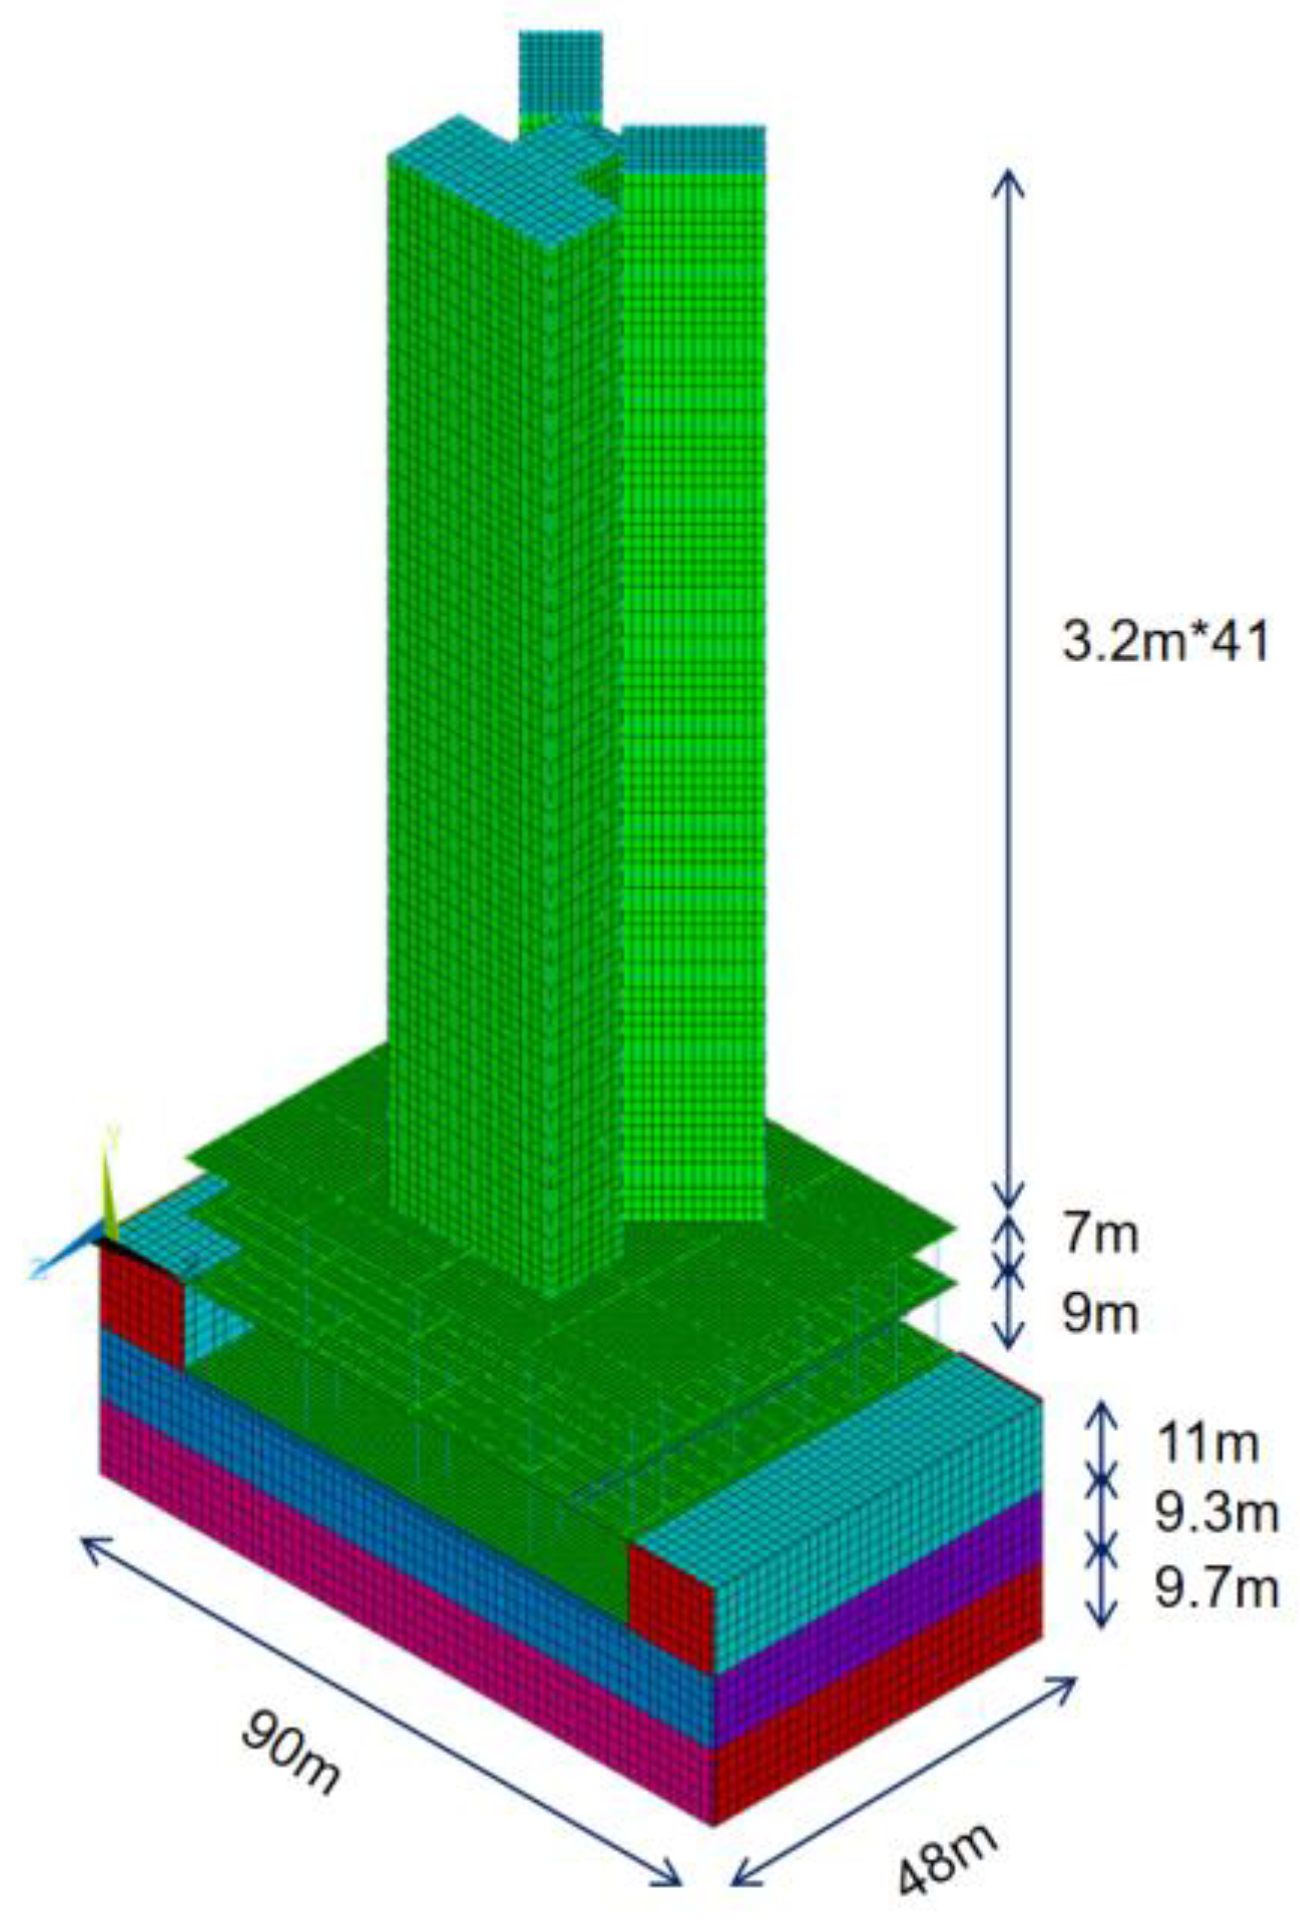
3.2. The FEM Model of “Track–Metro Depot–Over-Track Building”
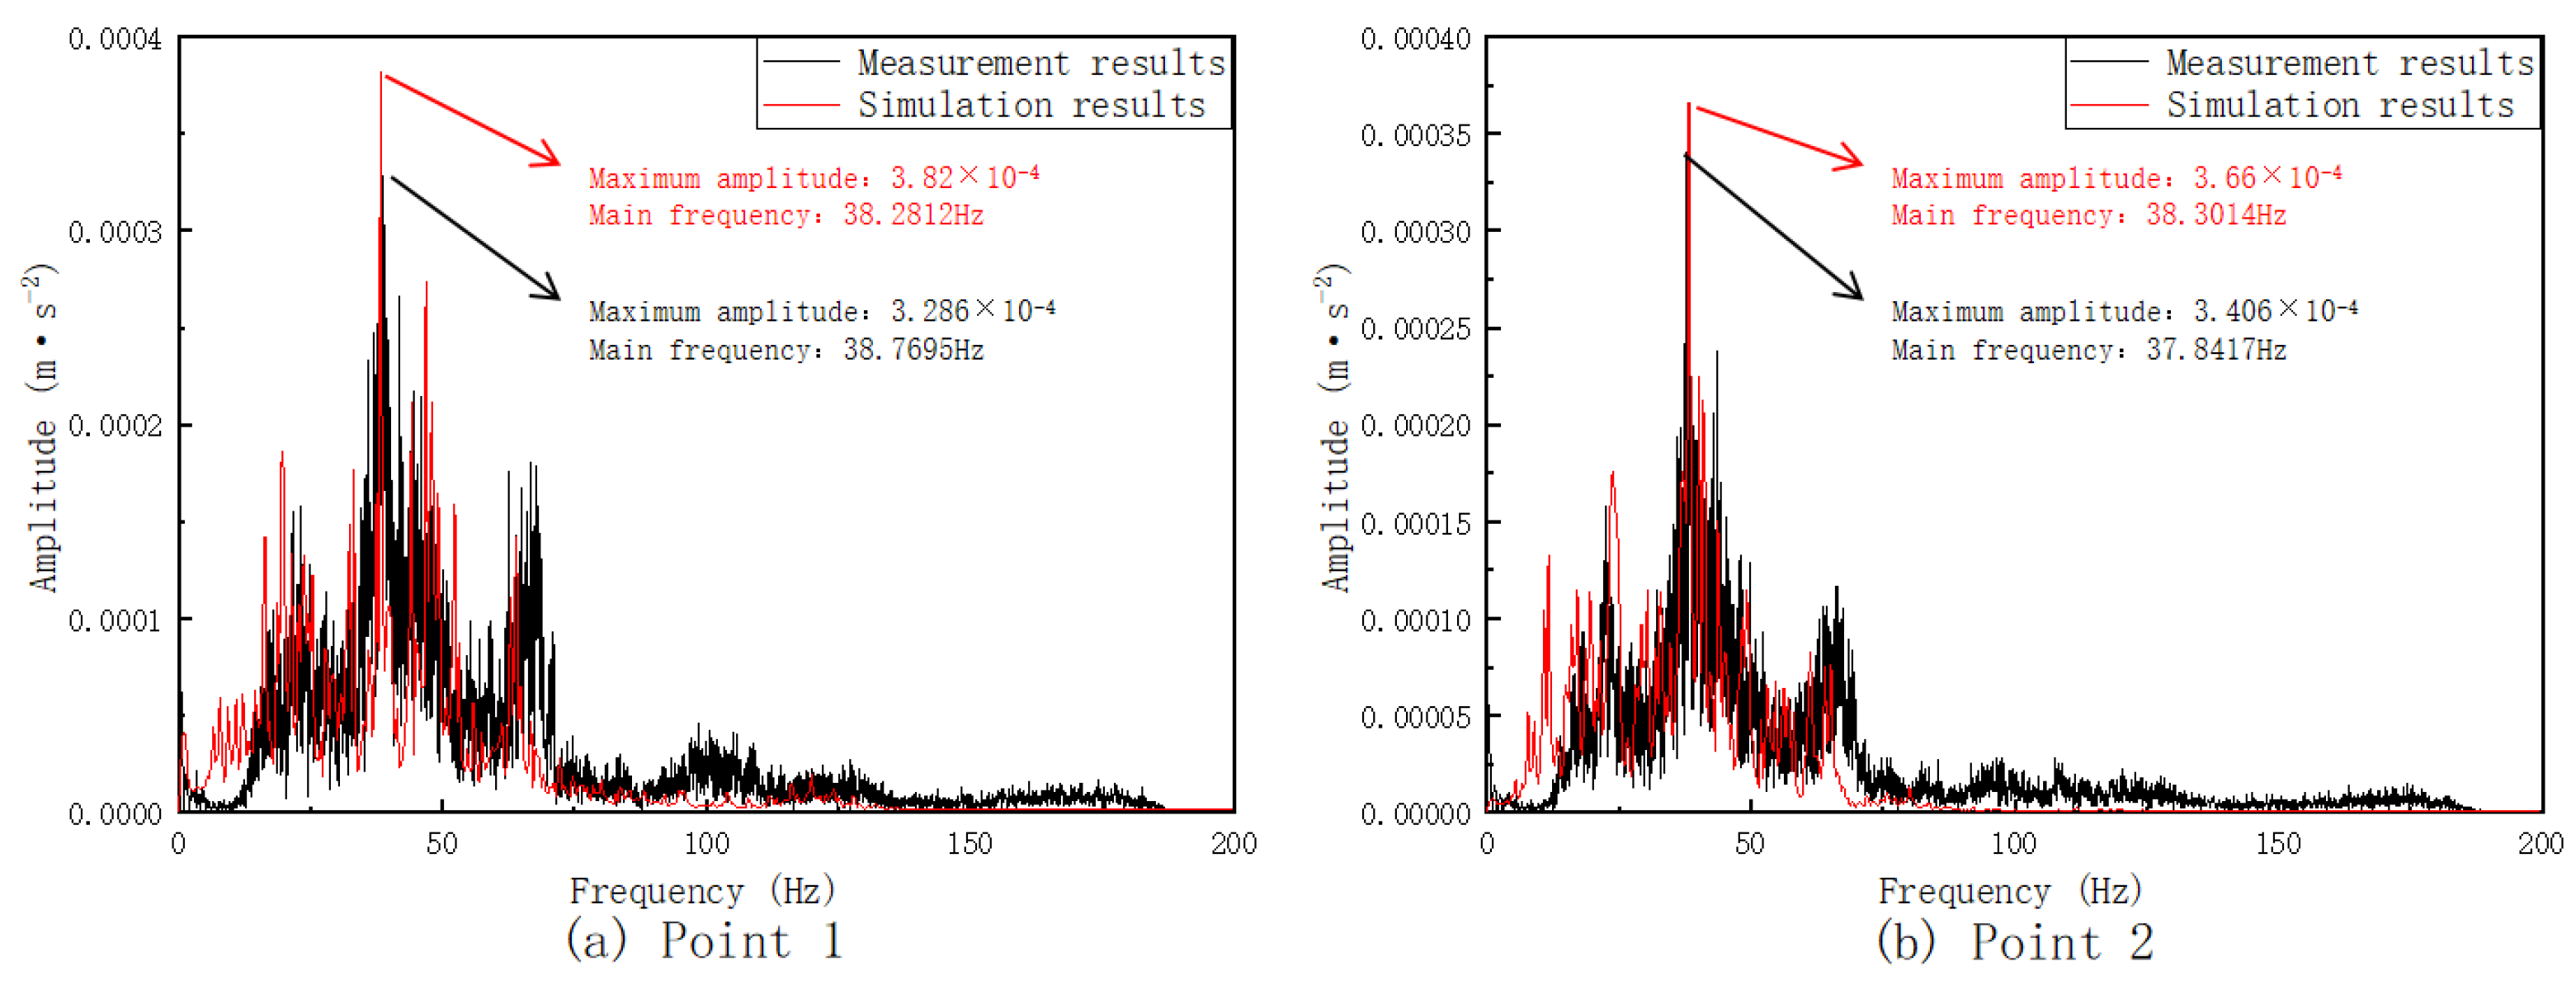
3.3. Model Validation
4. Analysis of Vibration Transmission and Distribution Characteristics
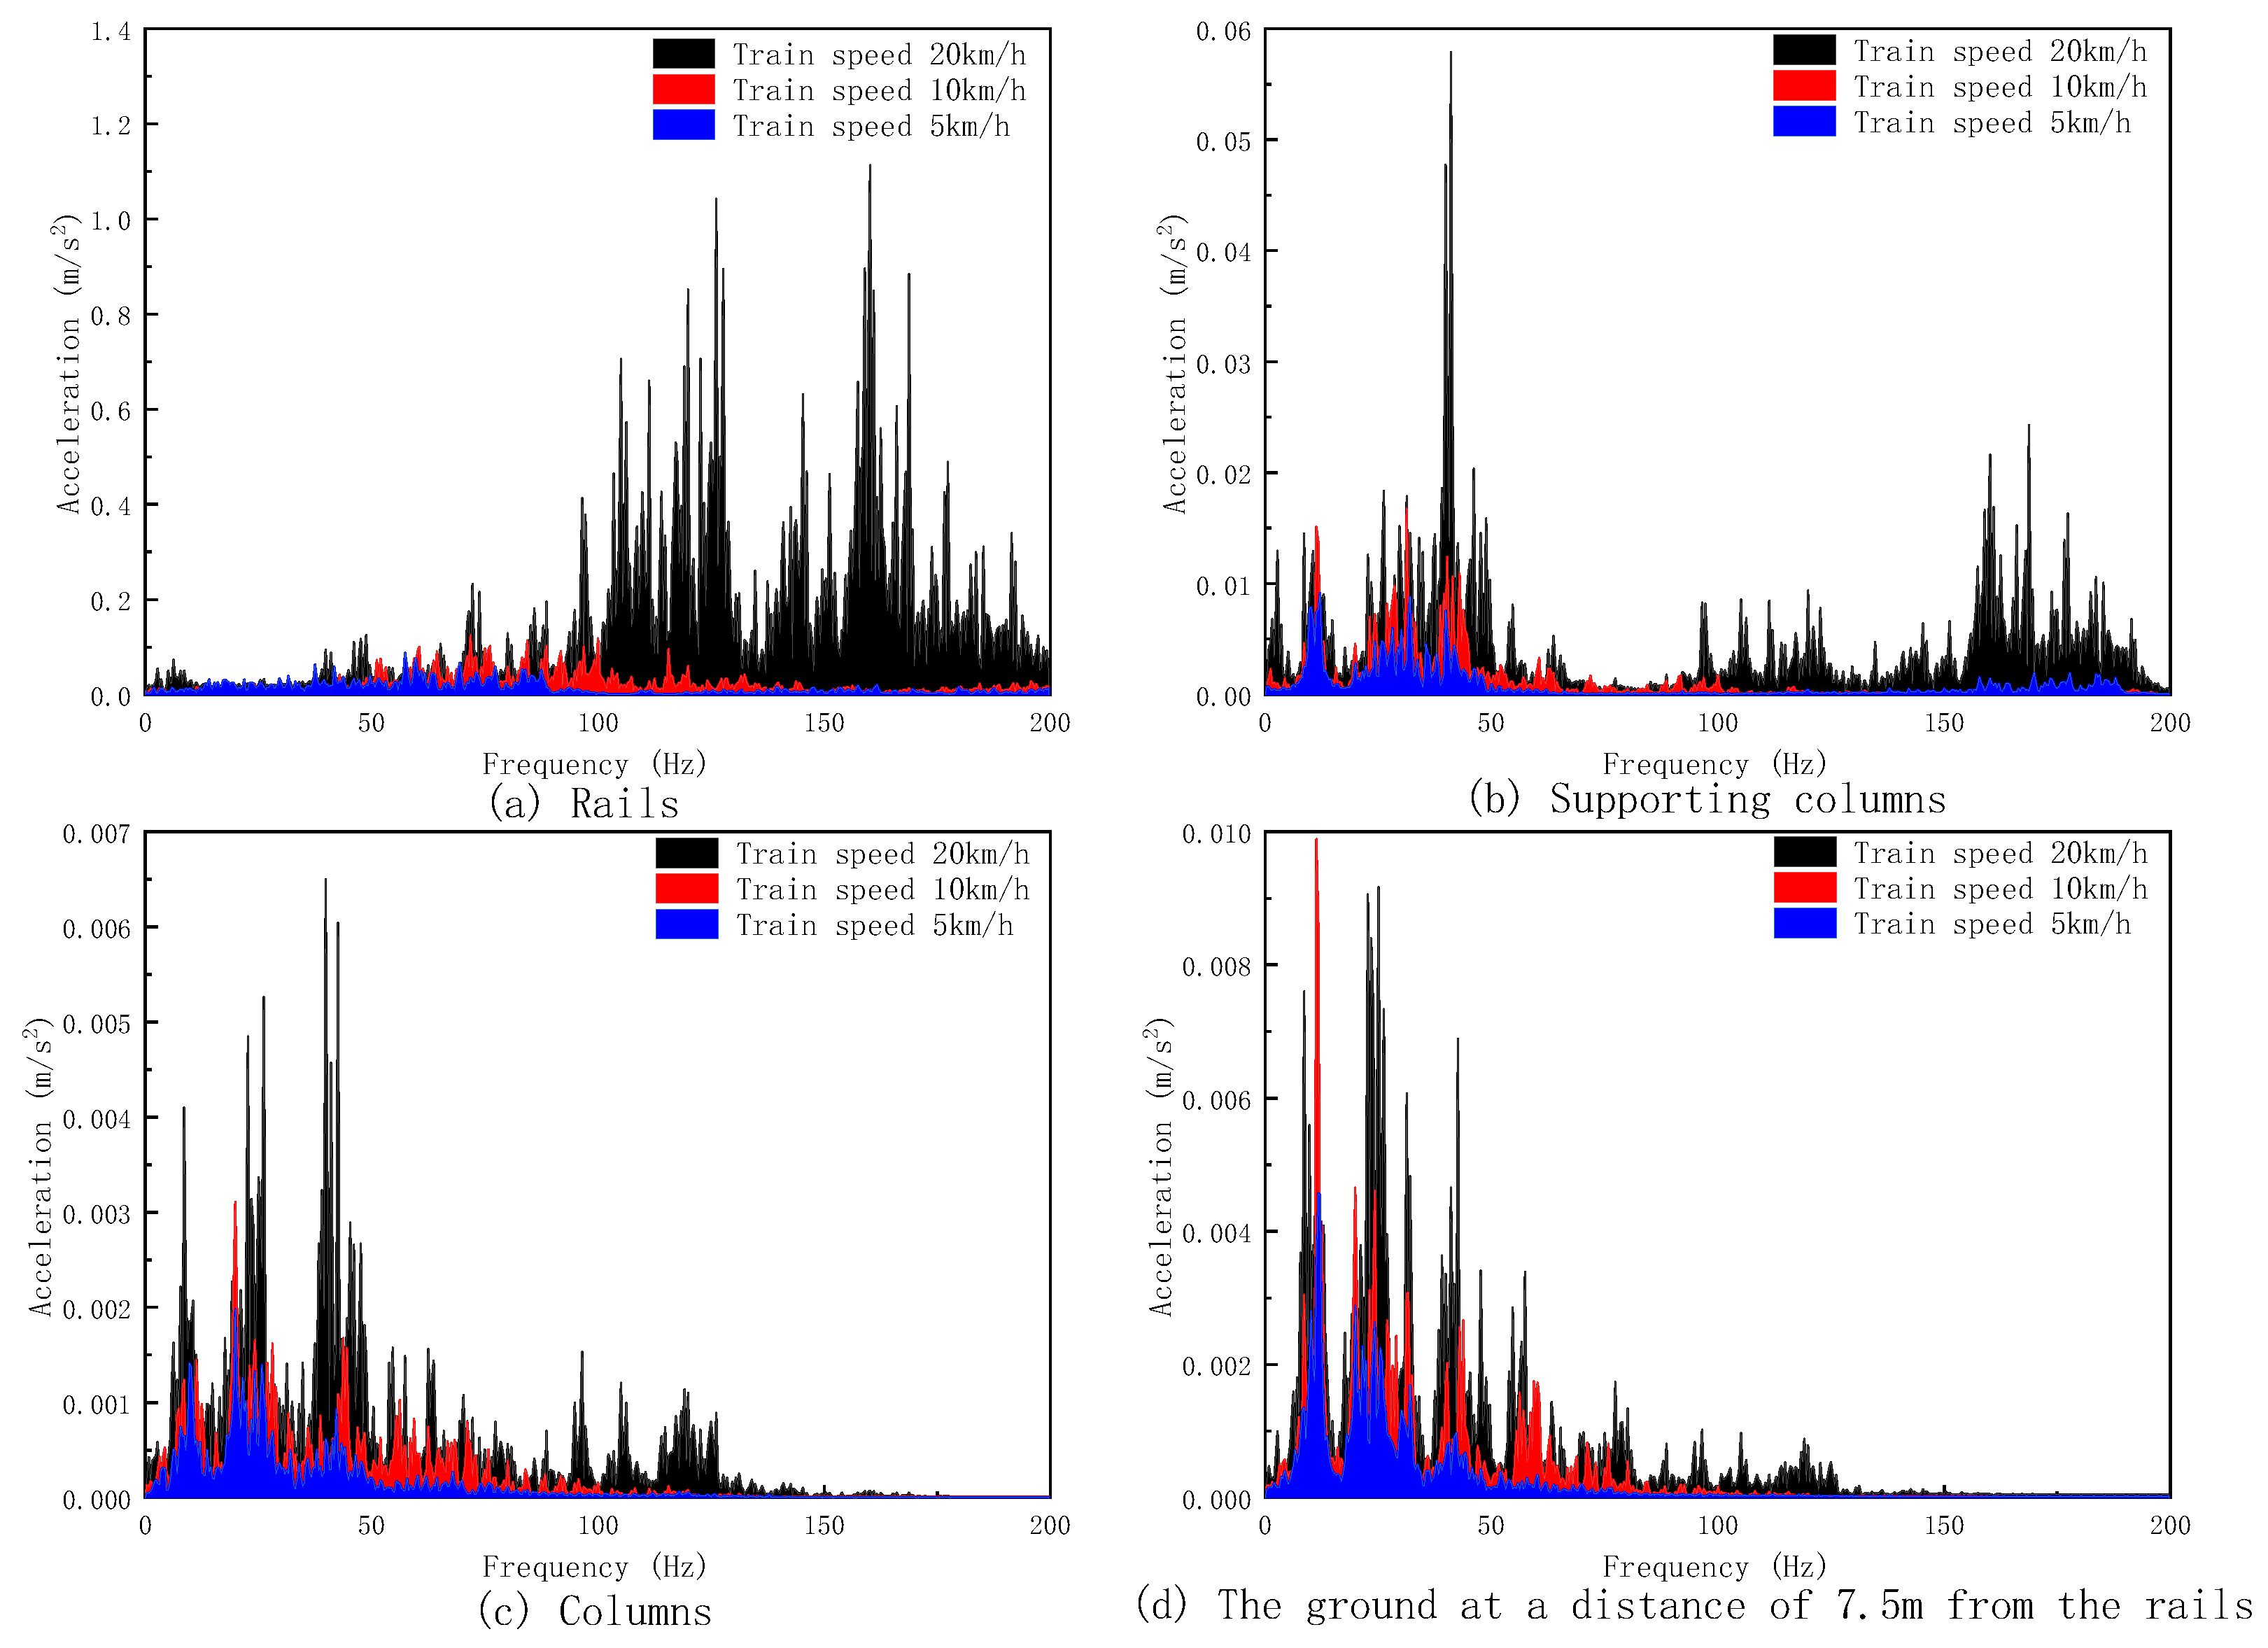
4.1. Analysis of Vibration Response at Vibration Source
4.2. Analysis of Vibration Transmission on the Platforms
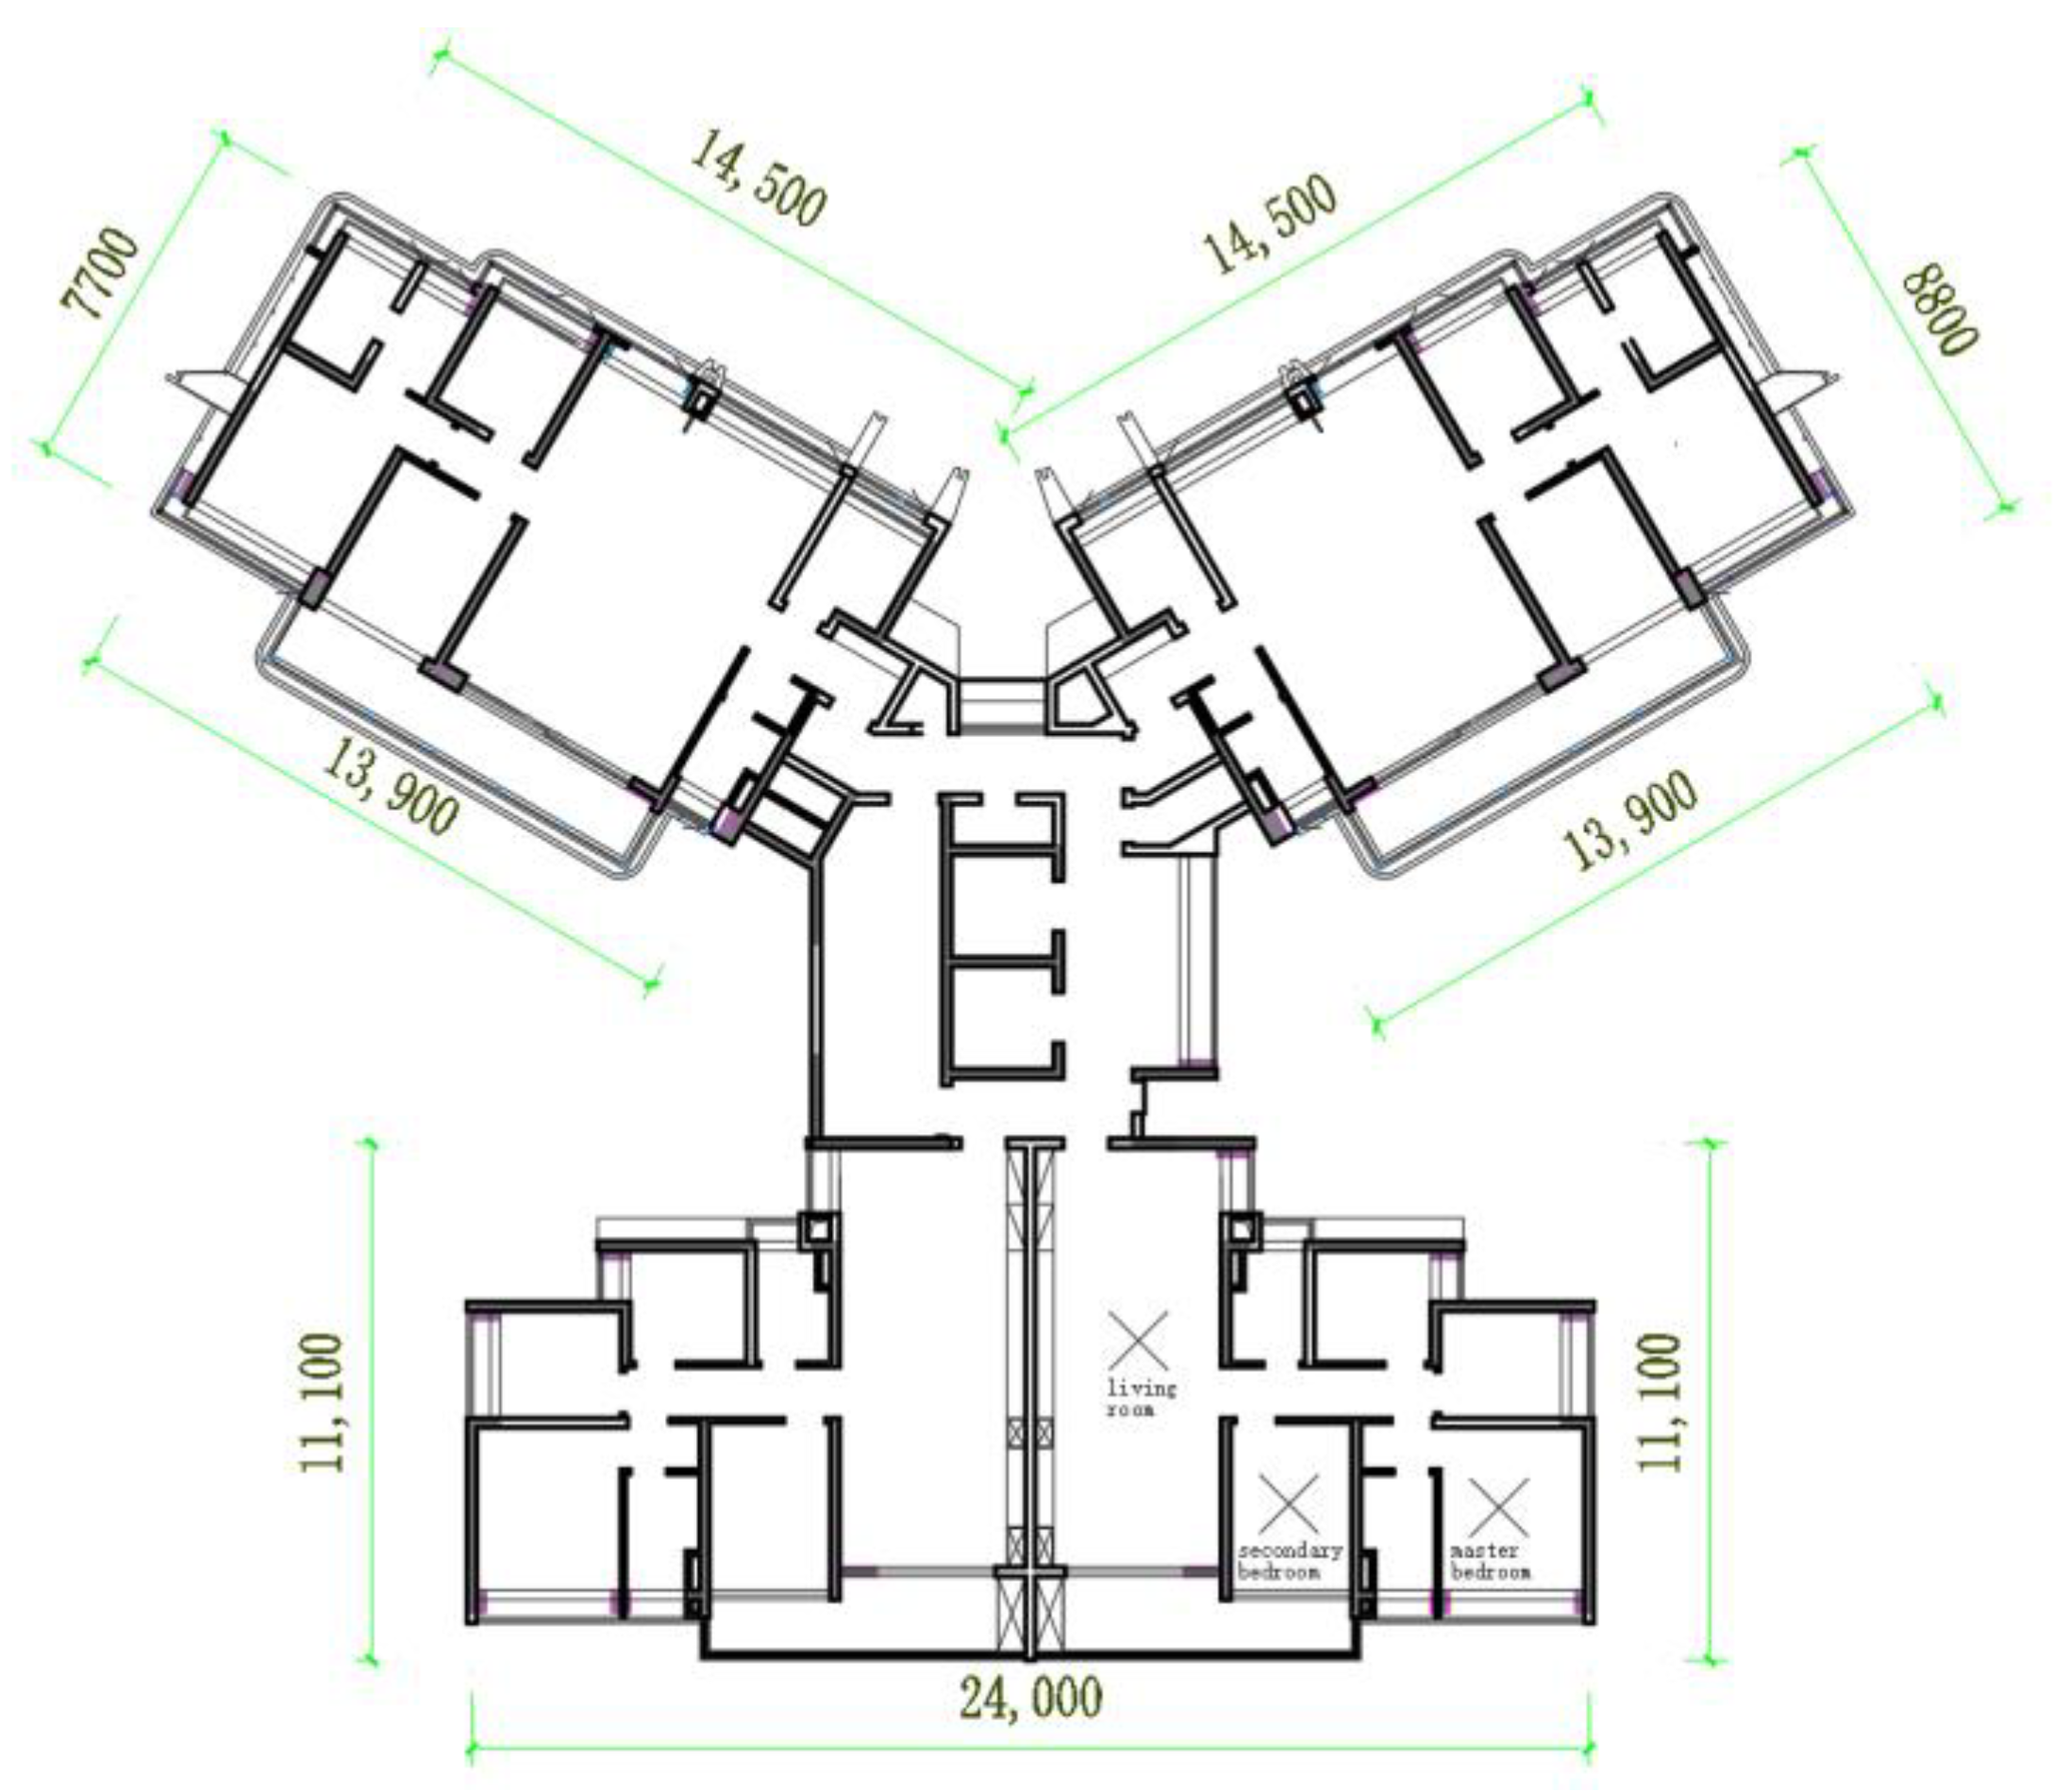
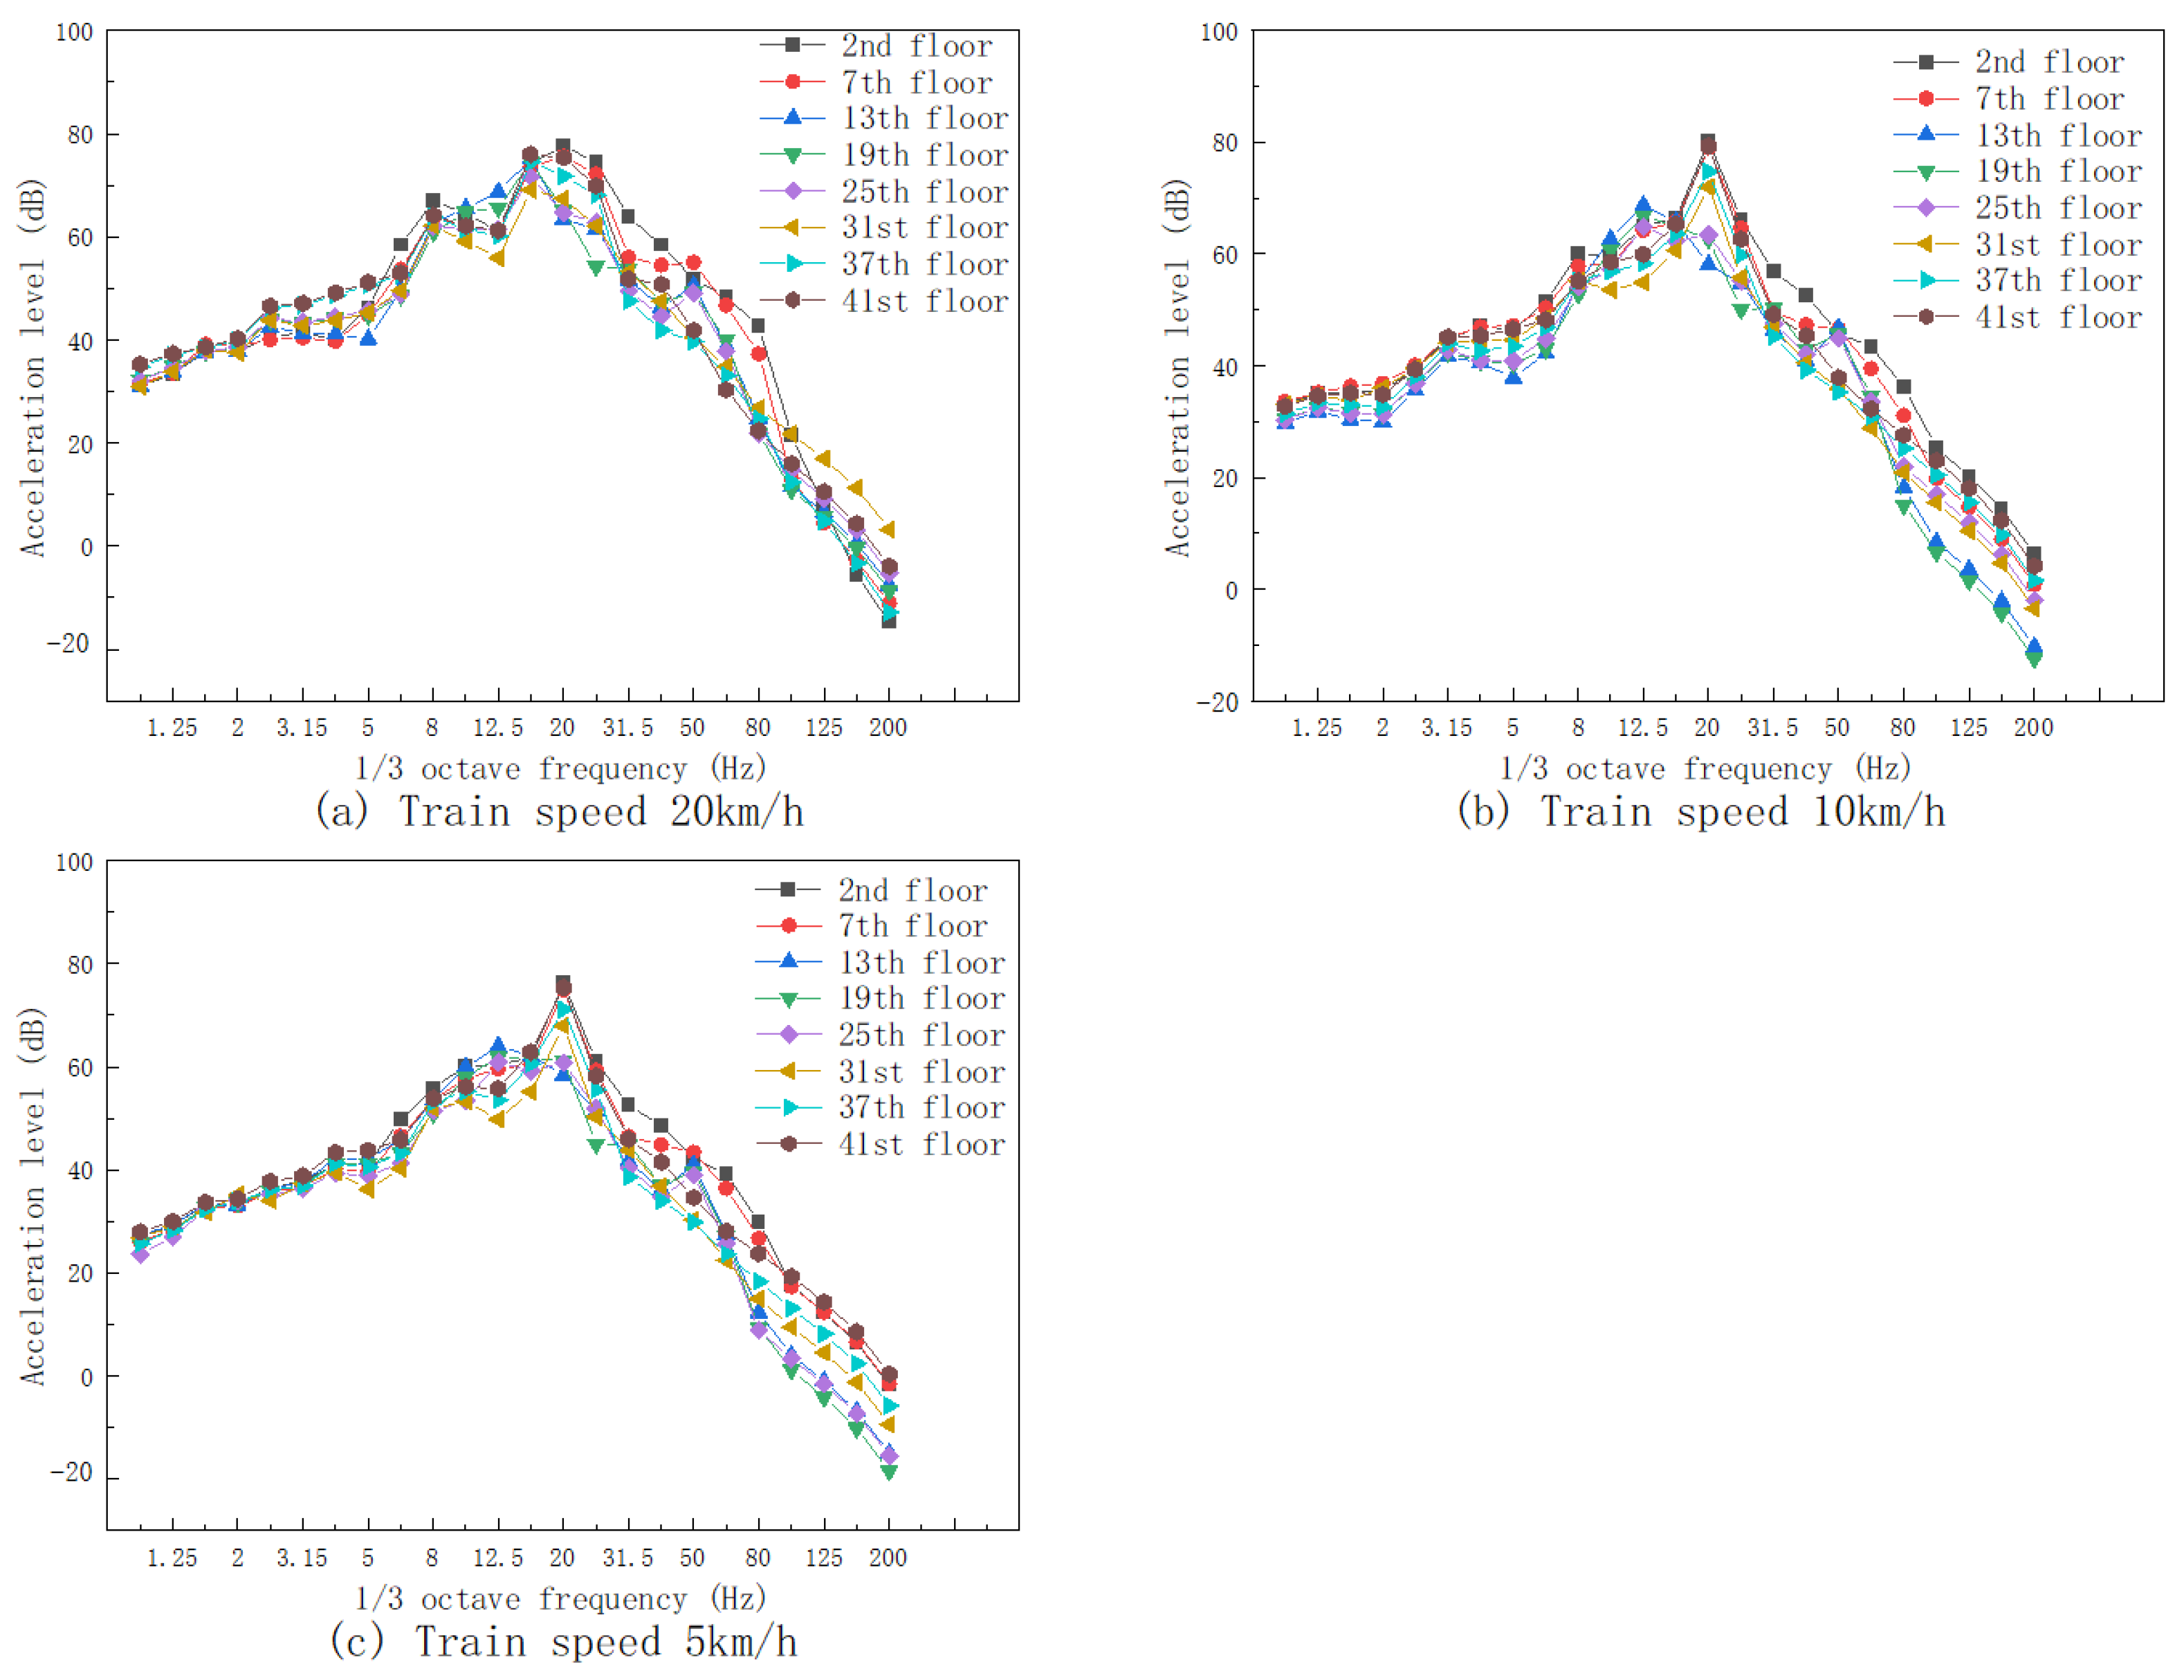
4.3. Analysis of Vibration Response in the Over-Track Building
4.4. Spatial Distribution of Vibration Energy
5. Conclusions
- (1)
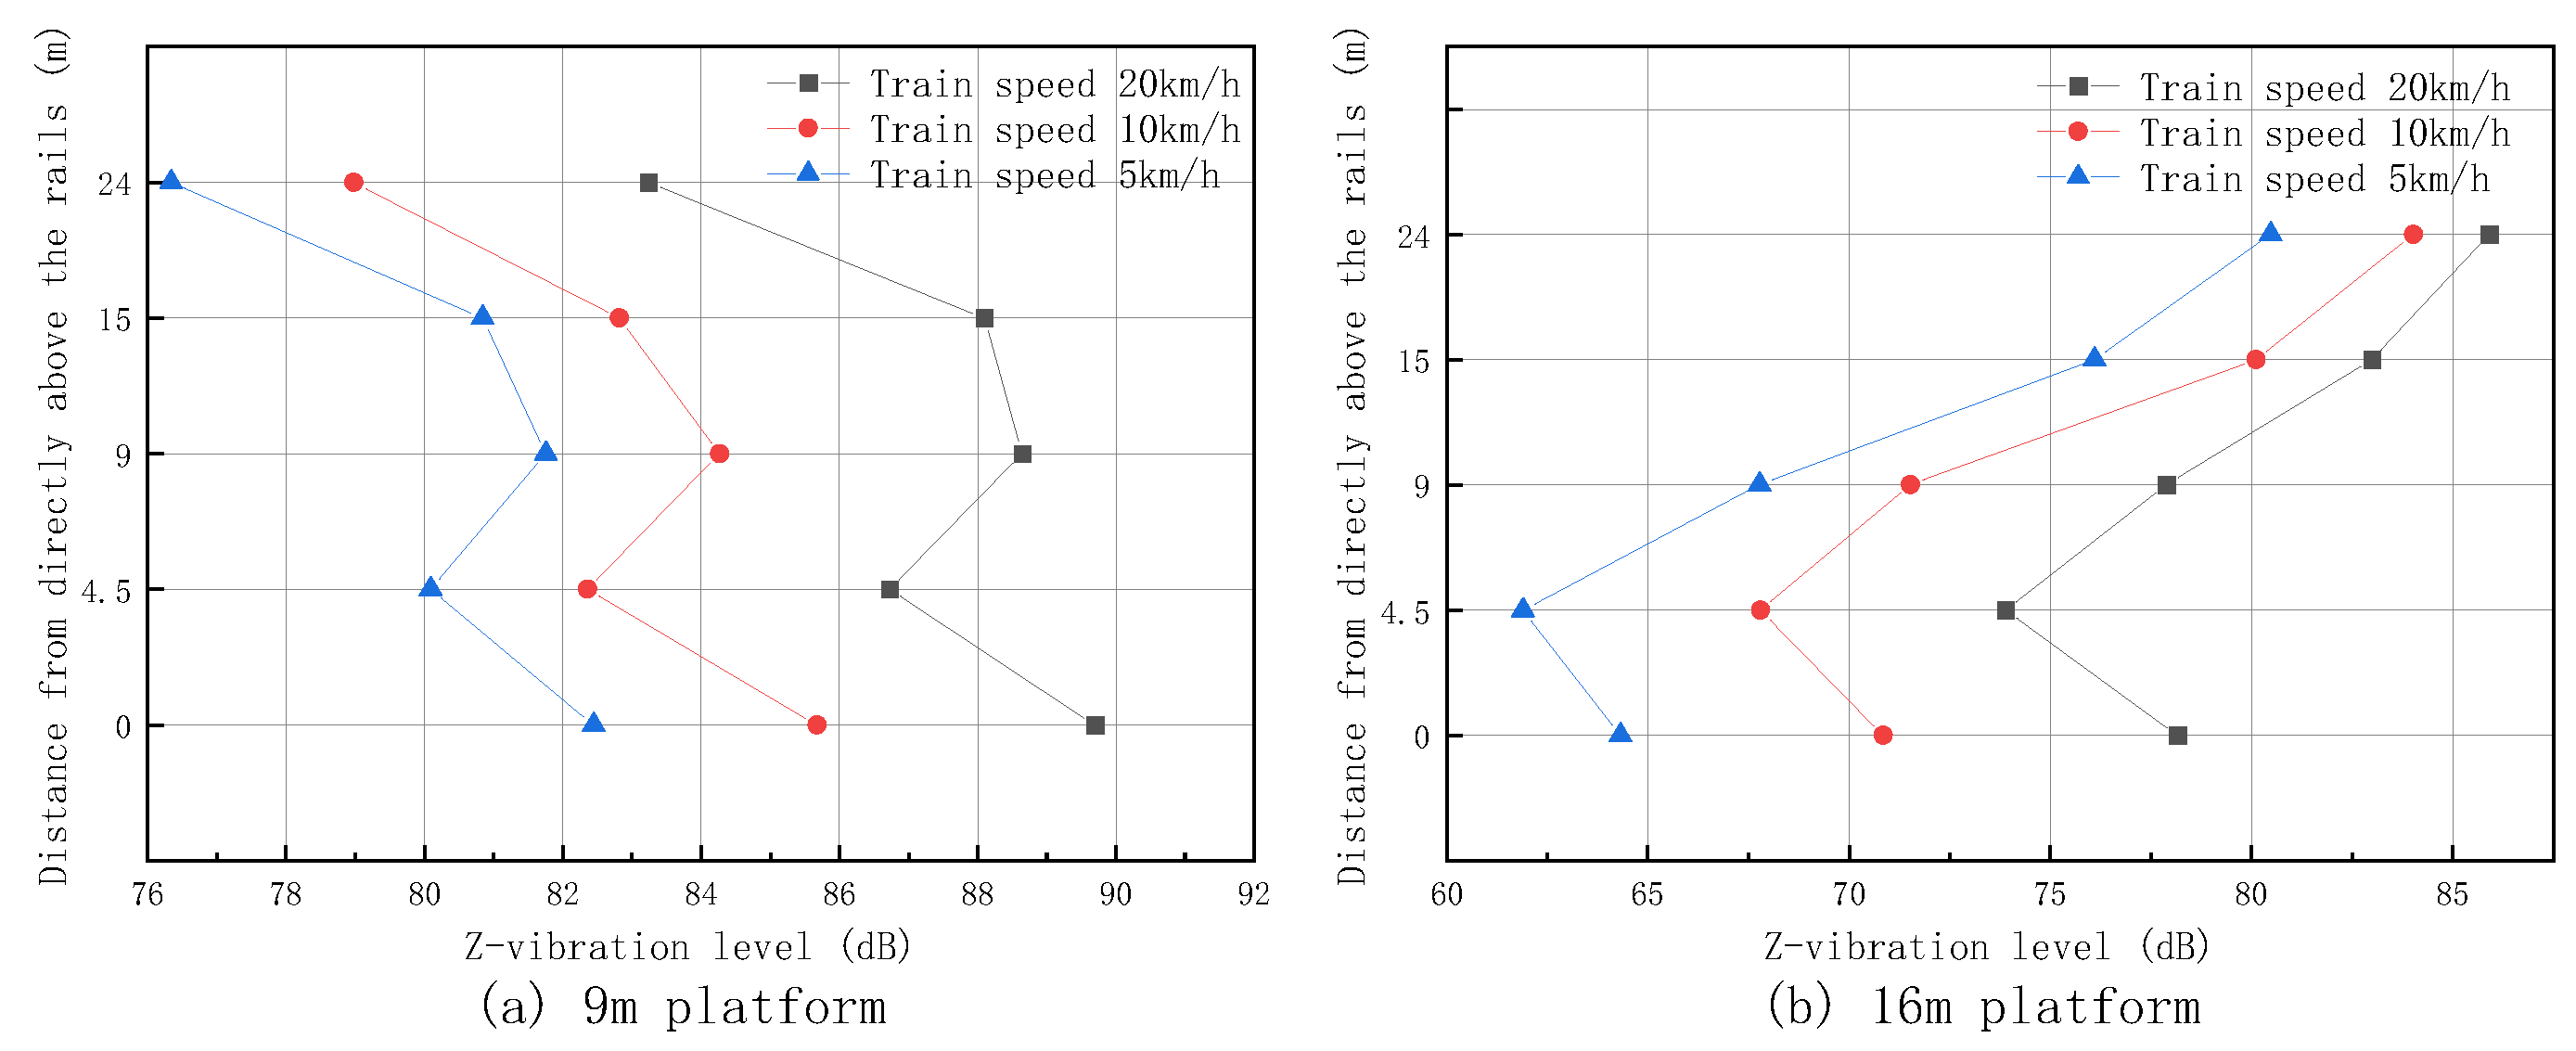
- With the decrease in the speed, the vibration response of the vibration source, platforms, and the over-track building decreases significantly. The Z-vibration level difference at the rail is the most significant. At train speeds of 20 km/h and 5 km/h, the difference between the two is nearly 20 dB, and the vibration at the rail can be reduced by 17.9% at most. The peak frequency of vibration decreases significantly. The difference between the two on the 9 m platform is 6–8 dB, and the difference between the two on the 16 m platform is 5–14 dB. The vibration on the platforms can be reduced by 17.7% at most. The difference between the two in the over-track building is 3–11 dB, and the vibration can be reduced by 13.0% at most. Therefore, the scheme of the trains running at low speeds in the operation zone can be adopted to reduce the vibration response.
- (2)
- When the vibration is transmitted laterally from 0 m to the left above the rails on the platform to 24 m above it, the vibration response generally decreases with the increasing distance. During the vertical transmission of vibration response from the 9 m platform to the 16 m platform, there is a trend of an initial decrease and then an increase.
- (3)
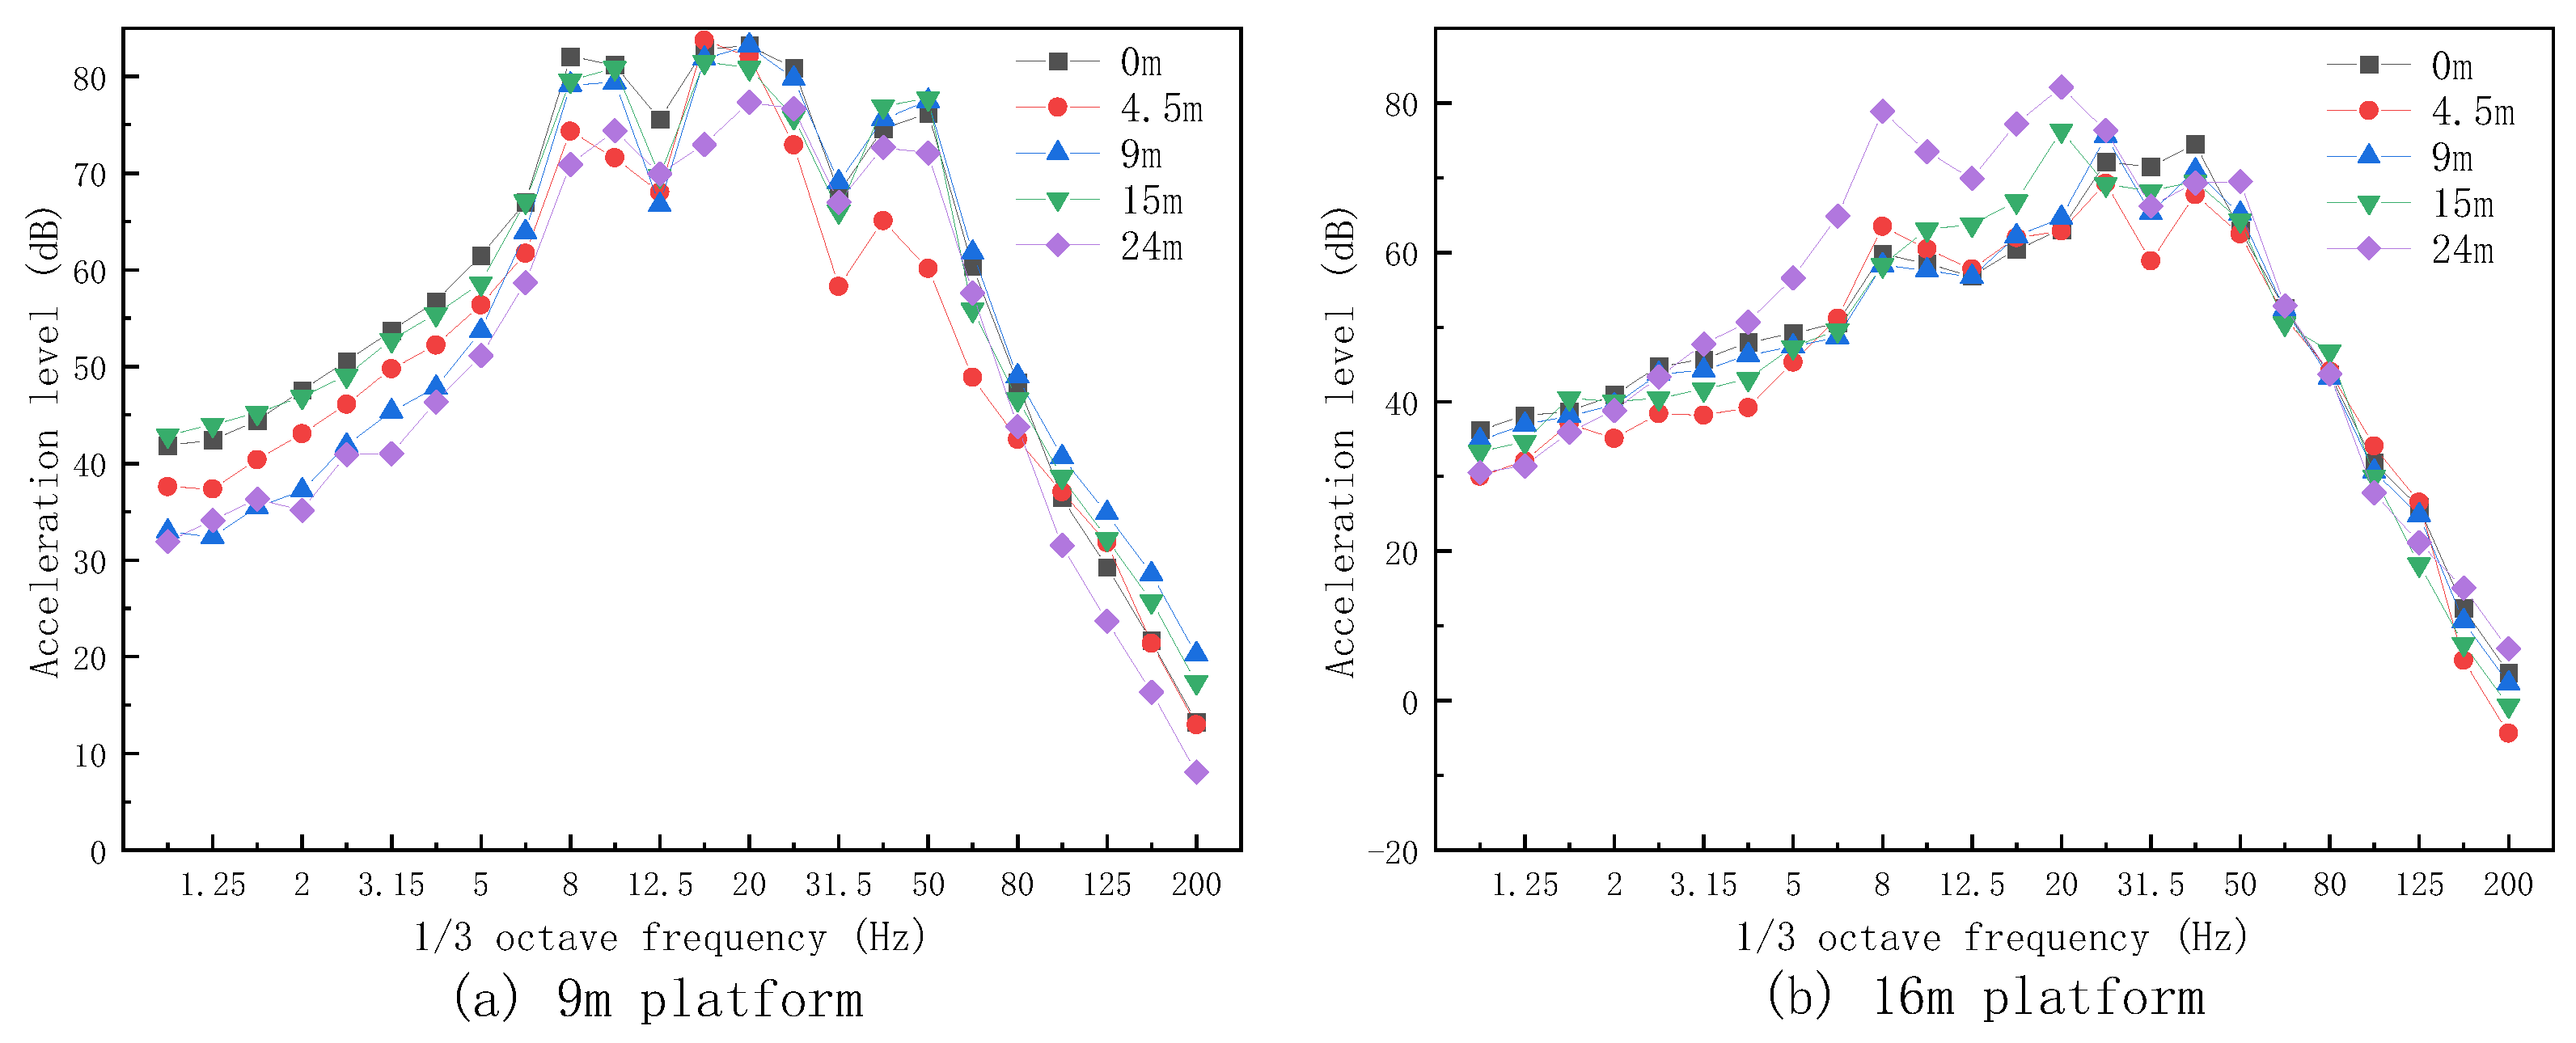
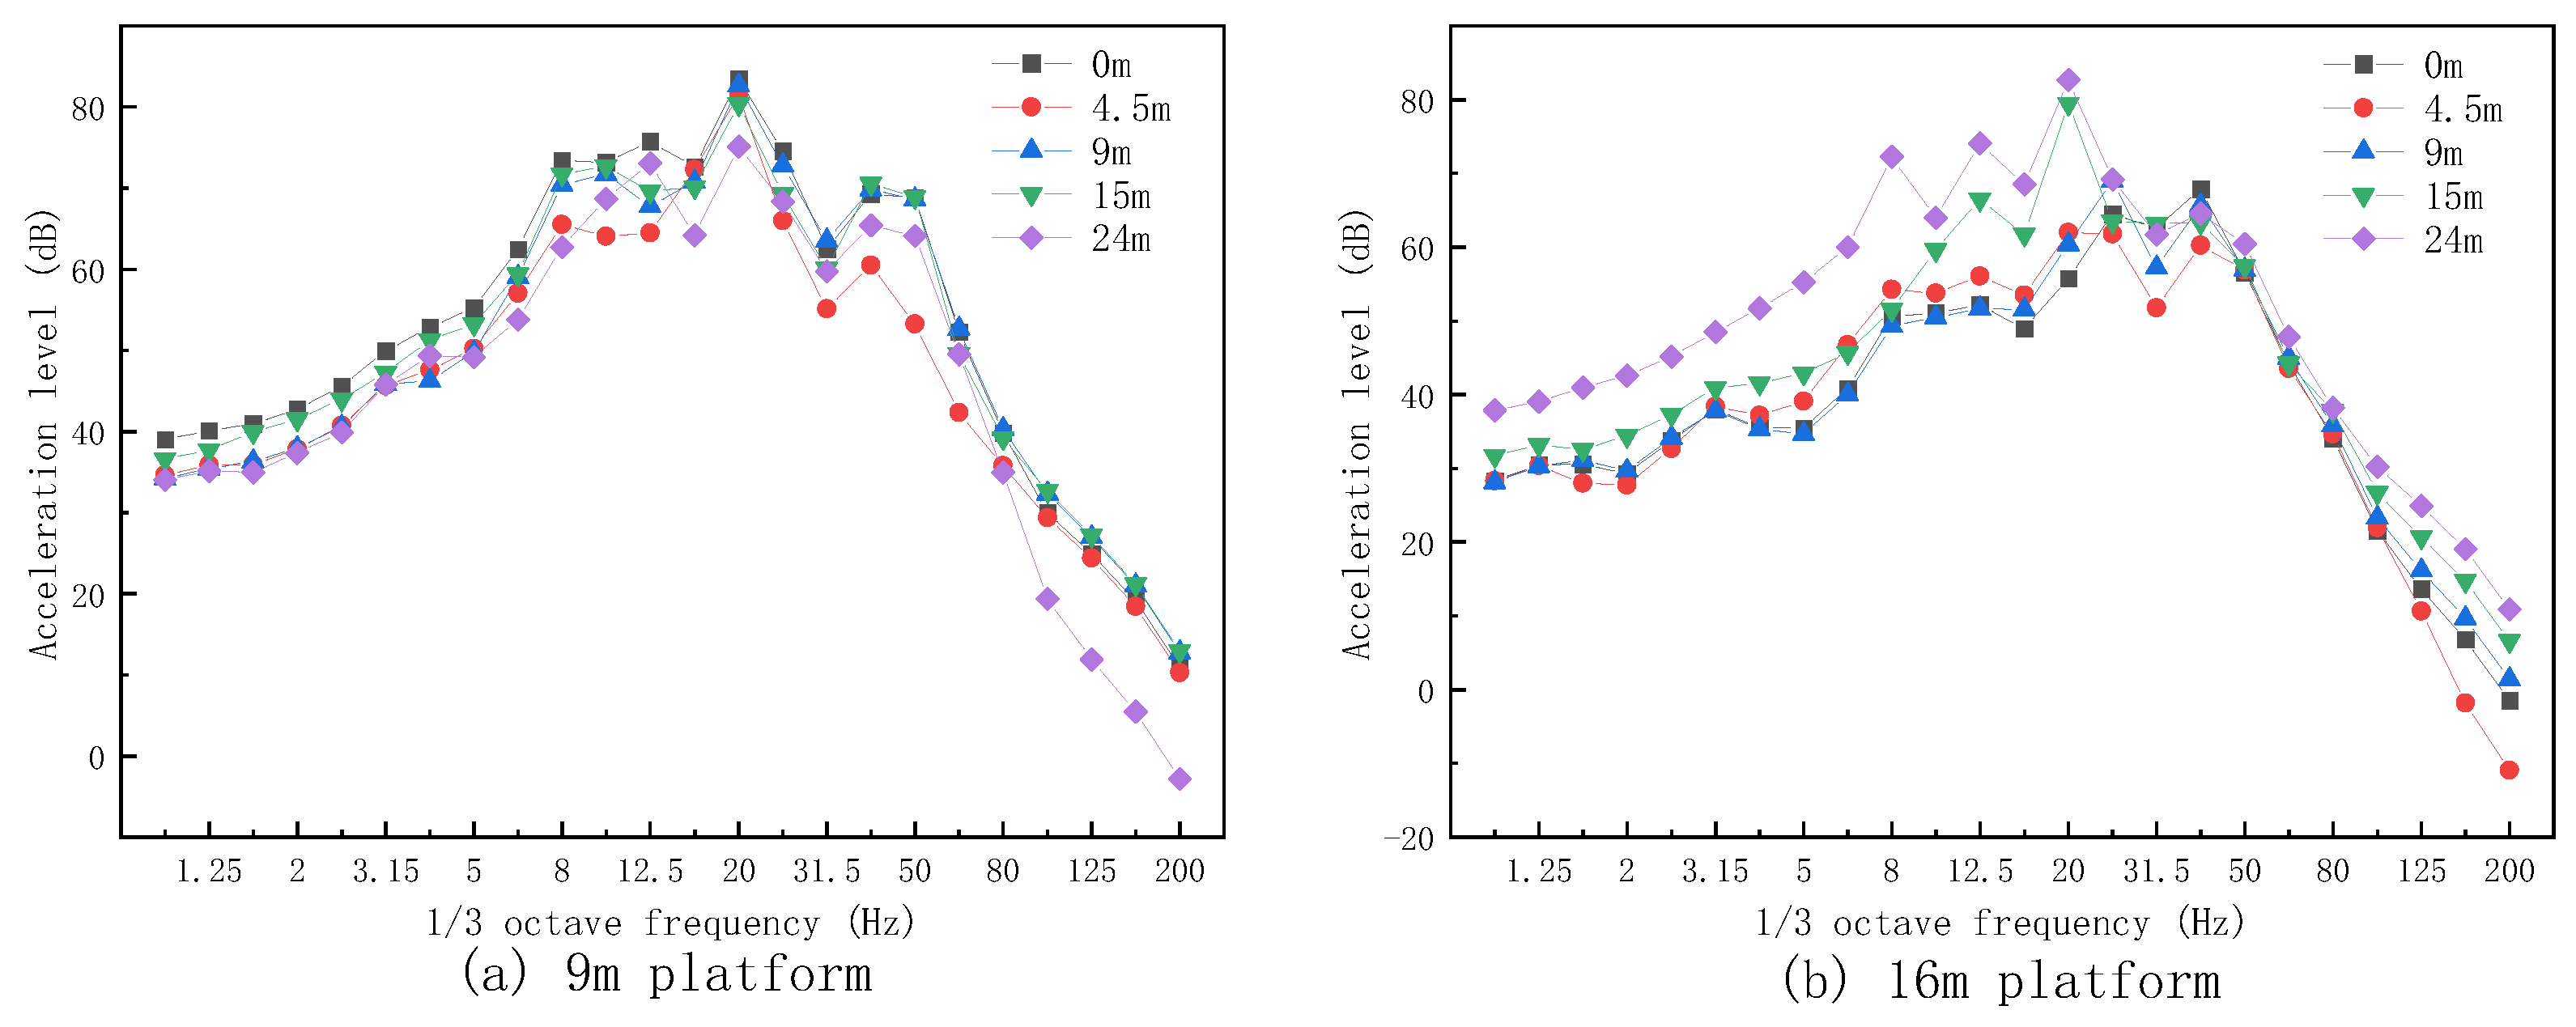
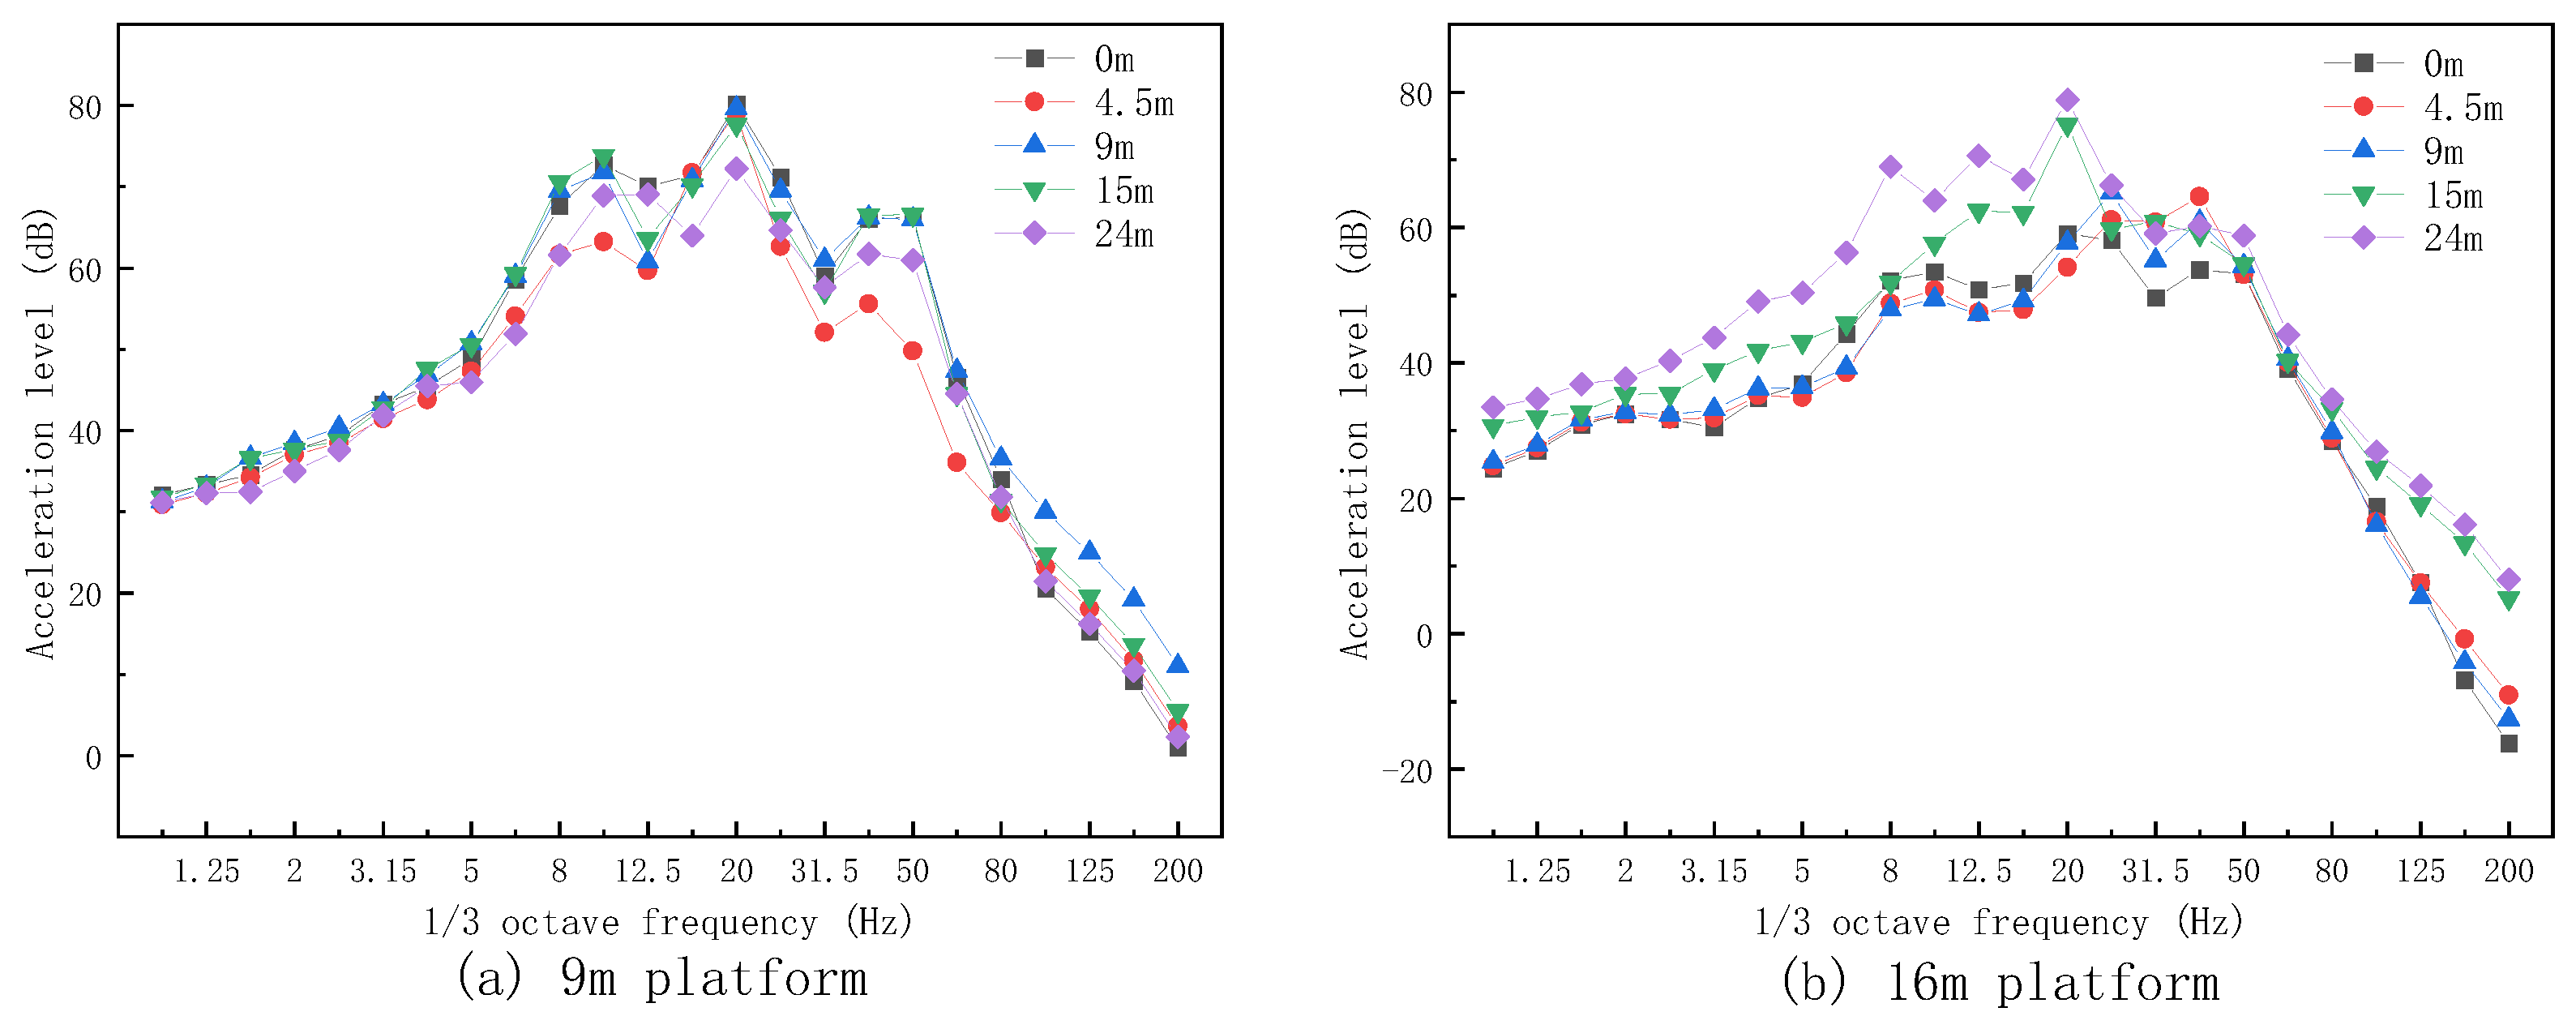
- The vibration energy of each analysis point on the platforms attenuates the vast majority in the frequency band above 50 Hz. Therefore, when conducting vibration reduction design, engineers should focus on vibrations in the frequency band below 50 Hz. During the vertical transmission of vibration response from the 9 m platform to the 16 m platform, the analysis points within the range of 0–15 m to the left above the rails exhibit a certain range of attenuation in the entire frequency band. The analysis points within the range of 15–24 m to the left above the rails have a certain amplification in the frequency band of 0–20 Hz and 100–200 Hz.
- (4)
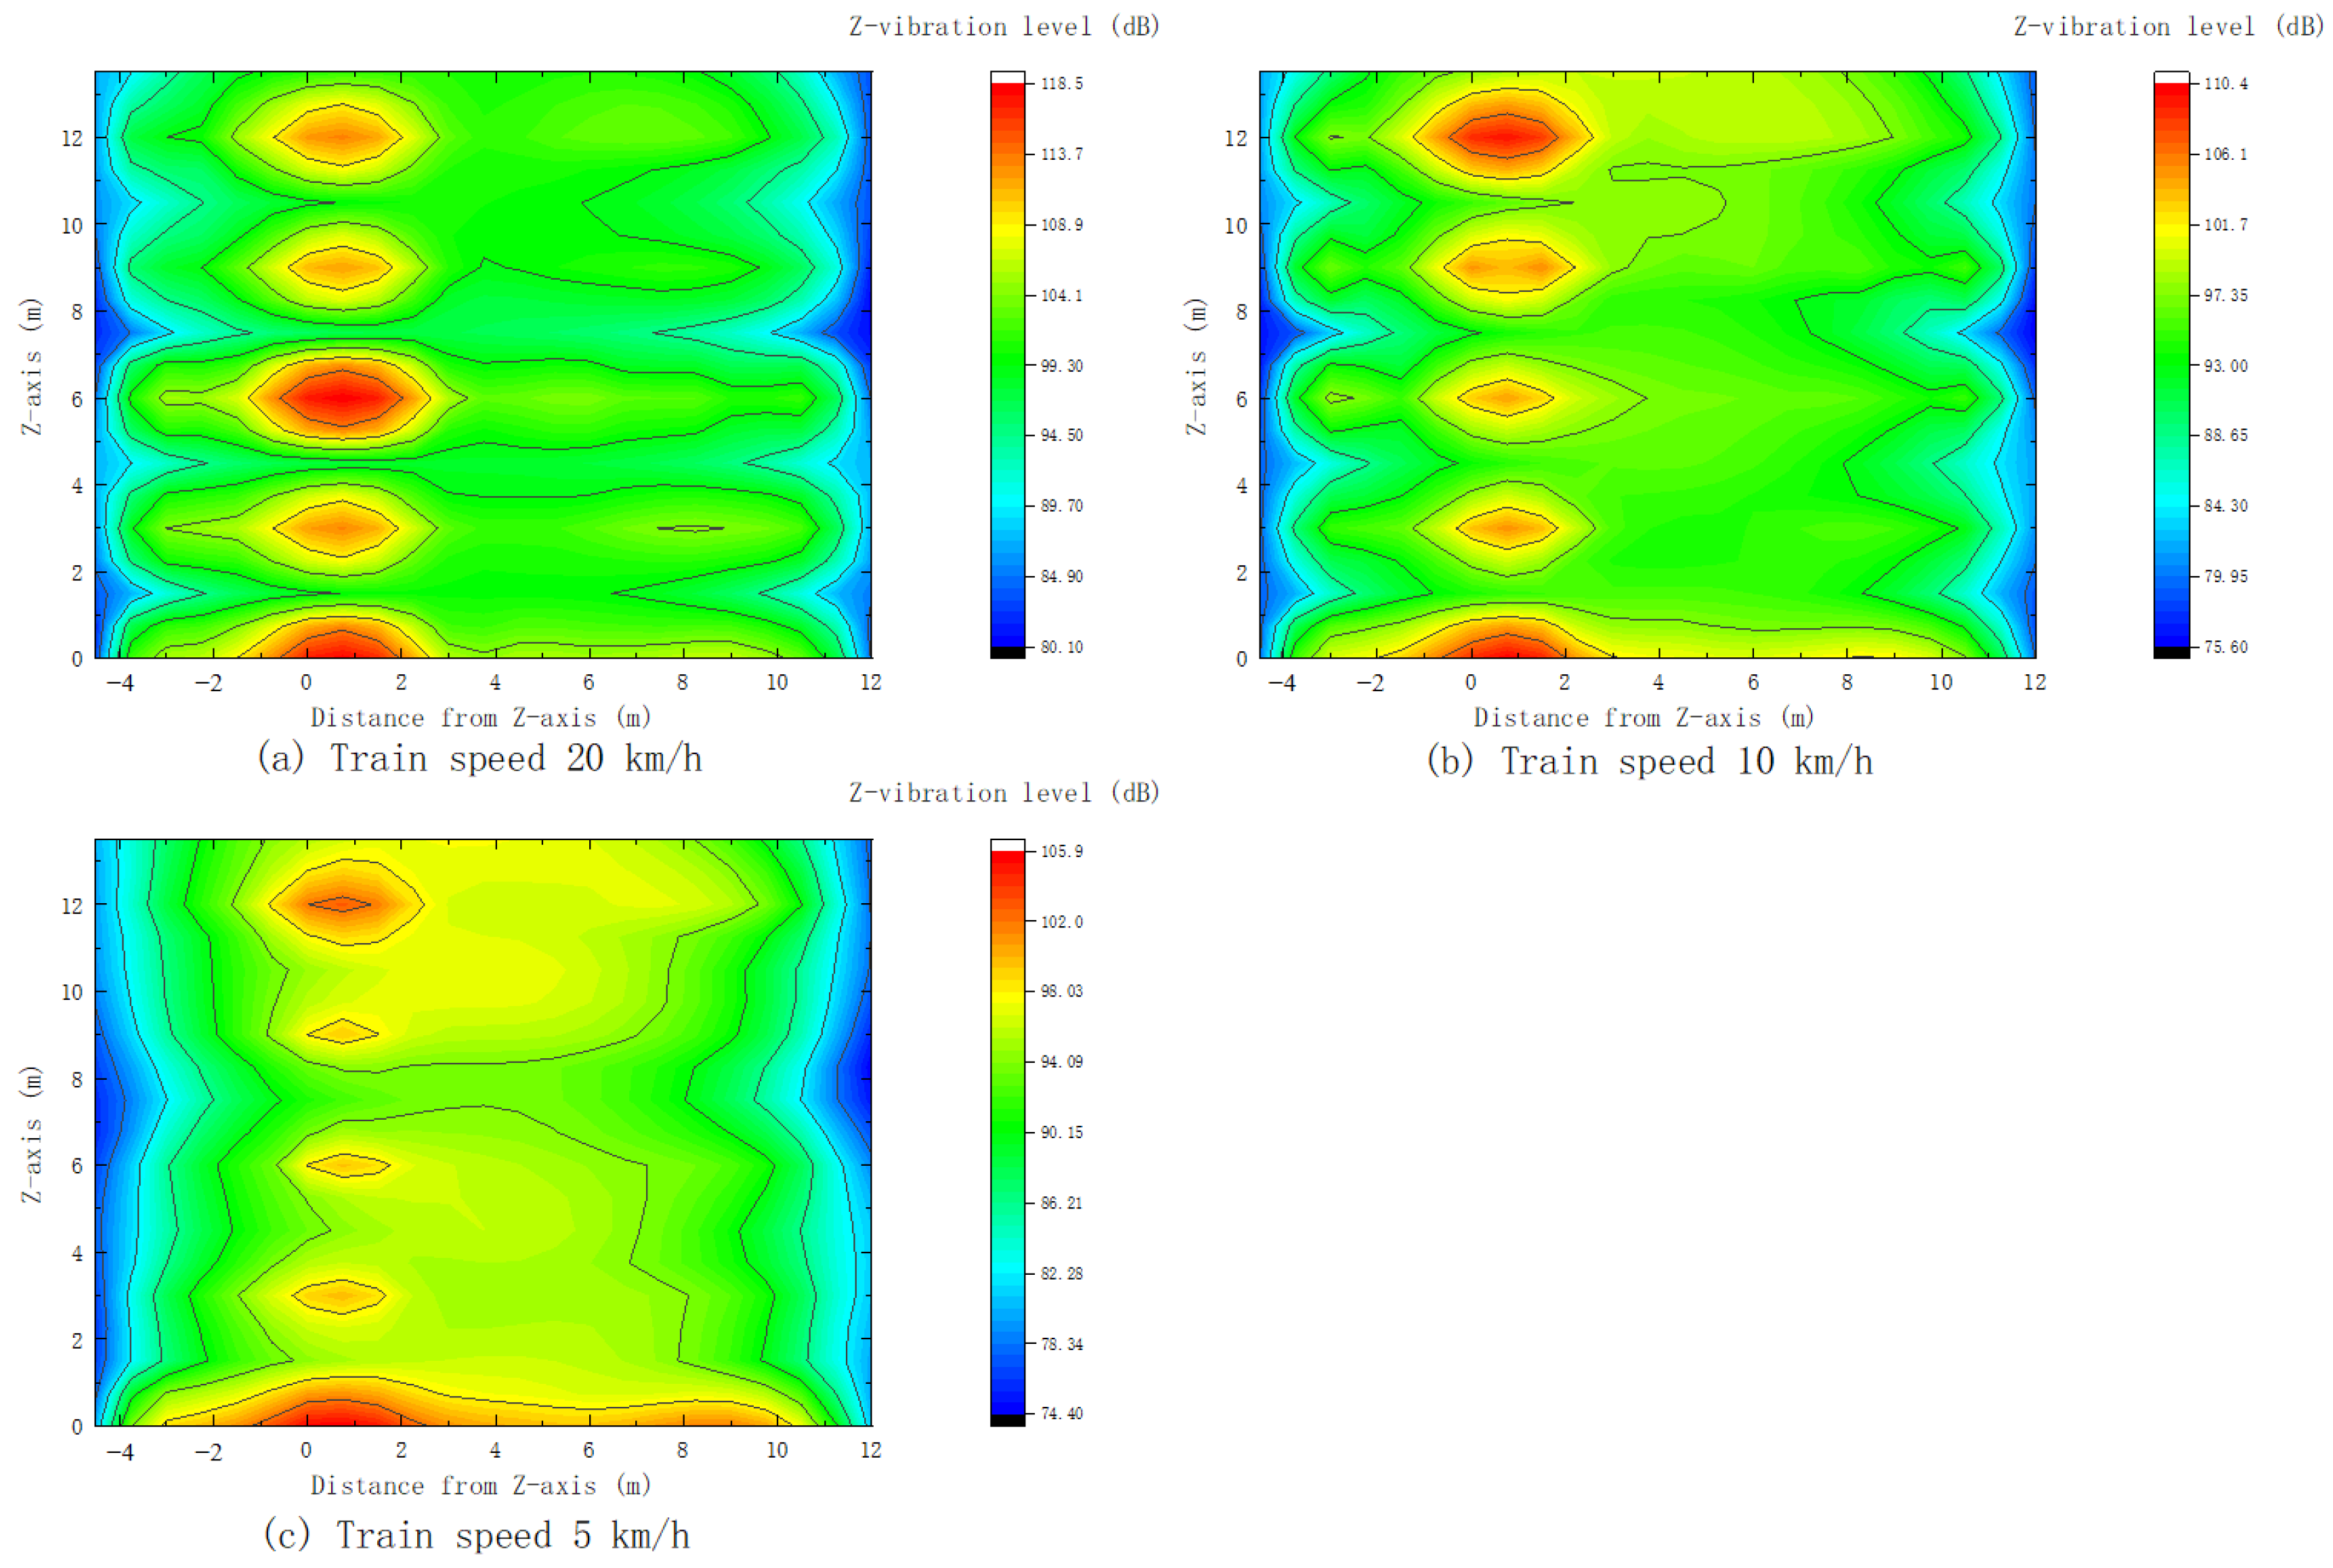
- The maximum vibration energy of vibration source in the operation zone is within a radius of 2 m centered on the line, showing a ring-shaped distribution, and the ring-shaped distribution is more pronounced as the train speed increases. In the horizontal direction of the track line, the vibration energy distribution is within a range of −4 m to 11.5 m from the track line. The vibration at the edge of plate is significantly smaller than that in the middle of the plate. In the longitudinal direction of the track line, the ring-shaped distribution of vibration energy exhibits a periodic pattern.
Author Contributions
Funding
Data Availability Statement
Conflicts of Interest
References
- Zou, C.; Wang, Y.M.; Moore, J.A.; Sanayei, M. Train-induced field vibration measurements of ground and over-track buildings. Sci. Total Environ. 2017, 575, 1339–1351. [Google Scholar] [CrossRef] [PubMed]
- Xia, H.; Wu, X.; Yu, D.M. Environmental vibration induced by urban rail transit system. J. Beijing Jiaotong Univ. 1999, 23, 7–13. [Google Scholar]
- Triepaischajonsak, N.; Thompson, D.J. A hybrid modelling approach for predicting ground vibration from trains. J. Sound. Vib. 2015, 335, 147–173. [Google Scholar] [CrossRef]
- Gupta, S.; Liu, W.F.; Degrande, G.; Lombaert, G.; Liu, W.N. Prediction of vibrations induced by underground railway traffic in Beijing. J. Sound. Vib. 2008, 310, 608–630. [Google Scholar] [CrossRef]
- Lombaert, G.; Degrande, G.; Vanhauwere, B.; Vandeborght, B.; François, S. The control of ground-borne vibrations from railway traffic by means of continuous floating slabs. J. Sound. Vib. 2006, 297, 946–961. [Google Scholar] [CrossRef]
- Sanayei, M.; Maurya, P.; Moore, J.A. Measurement of building foundation and ground-borne vibrations due to surface trains and subways. Eng. Struct. 2013, 53, 102–111. [Google Scholar] [CrossRef]
- Yang, J.J.; Zhu, S.Y.; Zhai, W.M.; Kouroussis, G.; Wang, Y.; Wang, K.Y.; Lan, K.; Xu, F.Z. Prediction and mitigation of train-induced vibrations of large-scale building constructed on subway tunnel. Sci. Total Environ. 2019, 668, 485–499. [Google Scholar] [CrossRef] [PubMed]
- Feng, Q.S.; Liao, C.M.; Zhang, L. Evaluation of subway vibration influence on human exposure comfort of whole-body vibration. Noise Vib. Control. 2021, 41, 237–243. [Google Scholar]
- Qiu, Y.T.; Zou, C.; Wu, J.H.; Shen, Z.X.; Zhong, Z.X. Building vibration measurements induced by train operation on concrete floor. Constr. Build. Mater. 2023, 394, 132283. [Google Scholar] [CrossRef]
- Kouroussis, G.; Conti, C.; Verlinden, O. Experimental study of ground vibrations induced by Brussels IC/IR trains in their neighborhood. Mech. Ind. 2013, 14, 99–105. [Google Scholar] [CrossRef]
- Liang, R.H.; Ding, D.Y.; Liu, W.F.; Sun, F.Q.; Cheng, Y.L. Experimental study of the source and transmission characteristics of train-induced vibration in the over-track building in a metro depot. J. Sound. Vib. 2023, 29, 1738–1751. [Google Scholar] [CrossRef]
- Chen, Y.M.; Feng, Q.S.; Liu, Q.J.; Jiang, J. Experimental study on the characteristics of train-induced vibration in a new structure of metro depot. Environ. Sci. Pollut. Res. 2021, 28, 41407–41422. [Google Scholar] [CrossRef] [PubMed]
- Chen, Y.M.; Feng, Q.S.; Liu, Q.J.; Liu, W.W.; Luo, X.W. Test and Analysis of Vibration Induced by Train Operation in Sinking Metro Depot Service Shop. J. Vib. Meas. Diagn. 2021, 41, 532–538+623. [Google Scholar]
- Feng, Q.S.; Zhang, Y.L.; Jiang, J.; Wang, Z.Y.; Lei, X.Y.; Zhang, L. Field measurement and evaluation of vibration in different areas of a metro depot. Earthq. Eng. Eng. Vibr. 2022, 21, 529–542. [Google Scholar]
- Feng, Q.S.; Wang, Z.Y.; Liu, Q.M.; Luo, X.W.; Li, J.Y. Vibration characteristics of metro depot upper building under double vibration source excitation. J. Traffic Transp. Eng. 2019, 19, 59–69. [Google Scholar]
- Feng, Q.S.; Wang, Z.Y.; Liu, Q.M.; Luo, X.W.; Luo, K.; Li, J.Y. Comparative analysis of environmental vibration characteristics in different regions of a metro depot. J. Vib. Shock. 2020, 39, 179–185+200. [Google Scholar]
- Sanayei, M.; Kayiparambil, P.A.; Moore, J.A.; Brett, C.R. Measurement and prediction of train-induced vibrations in a full-scale building. Eng. Struct. 2014, 77, 119–128. [Google Scholar] [CrossRef]
- Sanayei, M.; Zhao, N.Y.; Maurya, P.; Moore, J.A.; Zapfe, J.A.; Hines, E.M. Prediction and mitigation of building floor vibrations using a blocking floor. J. Struct. 2012, 138, 1181–1192. [Google Scholar] [CrossRef]
- Zou, C.; Wang, Y.M.; Wang, P.; Guo, J.X. Measurement of ground and nearby building vibration and noise induced by trains in a metro depot. Sci. Total Environ. 2015, 536, 761–773. [Google Scholar] [CrossRef] [PubMed]
- Zou, C.; Wang, Y.M.; Zhang, X.; Tao, Z.Y. Vibration isolation of over-track buildings in a metro depot by using trackside wave barriers. J. Build. 2020, 30, 101270. [Google Scholar] [CrossRef]
- Zou, C.; Moore, J.A.; Sanayei, M.; Wang, Y.M. Impedance model for estimating train-induced building vibrations. Eng. Struct. 2018, 172, 739–750. [Google Scholar] [CrossRef]
- Zou, C.; Moore, J.A.; Sanayei, M.; Wang, Y.M.; Tao, Z.Y. Efficient impedance model for the estimation of train-induced vibrations in over-track buildings. J. Vib. Control. 2020, 27, 924–942. [Google Scholar] [CrossRef]
- Tao, Z.Y.; Wang, Y.M.; Zou, C. Prediction model of vehicle-induced vibration of metro depot superstructure based on impedance and power conservation method. Zhendong Yu Chongji 2022, 41, 62–67+73. [Google Scholar]
- Tao, Z.Y.; Zou, C.; Yang, G.R.; Wang, Y.M. A semi-analytical method for predicting train-induced vibrations considering train-track-soil and soil-pile-building dynamic interactions. Soil. Dyn. Earthq. Eng. 2023, 167, 107822. [Google Scholar] [CrossRef]
- Tao, Z.Y.; Wang, Y.M.; Sanayei, M.; Moore, J.A.; Zou, C. Experimental study of train-induced vibration in over-track buildings in a metro depot. Eng. Struct. 2019, 198, 109473. [Google Scholar] [CrossRef]
- Tao, Z.Y.; Wang, Y.M.; Zou, C.; Li, Q.; Luo, Y. Assessment of ventilation noise impact from metro depot with over-track platform structure on workers and nearby inhabitants. Environ. Sci. Pollut. Res. 2019, 26, 9203–9218. [Google Scholar] [CrossRef]
- Liu, W.F.; Liang, R.H.; Zhang, H.G.; Wu, Z.Z.; Jiang, B.L. Deep learning based identification and uncertainty analysis of metro train induced ground-borne vibration. Mech. Syst. Signal. Process. 2023, 189, 110062. [Google Scholar] [CrossRef]
- Liang, R.H.; Liu, W.F.; Ma, M.; Liu, W.N. An efficient model for predicting the train-induced ground-borne vibration and uncertainty quantification based on Bayesian neural network. J. Sound. Vib. 2021, 495, 115908. [Google Scholar] [CrossRef]
- Liang, R.H.; Liu, W.F.; Li, C.Y.; Li, W.B.; Wu, Z.Z. A novel efficient probabilistic prediction approach for train-induced ground vibrations based on transfer learning. J. Vib. Control. 2024, 30, 576–587. [Google Scholar] [CrossRef]
- Liang, R.H.; Liu, W.F.; Kaewunruen, S.; Zhang, H.G.; Wu, Z.Z. Classification of External Vibration Sources through Data-Driven Models Using Hybrid CNNs and LSTMs. Struct. Control. Health Monit. 2023, 2023, 1900447. [Google Scholar] [CrossRef]
- Zhou, Y.; Pei, Y.L.; Zhou, S.; Zhao, Y.; Hu, J.X.; Yi, W.J. Novel methodology for identifying the weight of moving vehicles on bridges using structural response pattern extraction and deep learning algorithms. Measurement 2021, 168, 108384. [Google Scholar] [CrossRef]
- He, Y.P.; Zhang, Y.; Yao, Y.Y.; He, Y.L.; Sheng, X.Z. Review on the Prediction and Control of Structural Vibration and Noise in Buildings Caused by Rail Transit. Buildings 2023, 13, 2310. [Google Scholar] [CrossRef]
- He, C.; Zhou, S.H.; Guo, P.J.; Di, H.G.; Zhang, X.H. Analytical model for vibration prediction of two parallel tunnels in a full-space. J. Sound. Vib. 2018, 423, 306–321. [Google Scholar] [CrossRef]
- He, C.; Zhou, S.H.; Guo, P.J. Mitigation of railway-induced vibrations by using periodic wave impeding barriers. Appl. Acoust. 2022, 105, 496–514. [Google Scholar] [CrossRef]
- Li, X.M.; Chen, Y.K.; Zou, C.; Wang, H.; Zheng, B.K.; Chen, J.L. Building structure-borne noise measurements and estimation due to train operations in tunnel. Sci. Total Environ. 2024, 926, 172080. [Google Scholar] [CrossRef]
- Qiu, Y.T.; Zou, C.; Hu, J.H.; Chen, J.L. Prediction and mitigation of building vibrations caused by train operations on concrete floors. Appl. Acoust. 2024, 219, 109941. [Google Scholar] [CrossRef]
- Hu, J.H.; Zou, C.; Liu, Q.M.; Li, X.M.; Tao, Z.Y. Floor vibration predictions based on train-track-building coupling model. J. Build. Eng. 2024, 89, 109340. [Google Scholar] [CrossRef]
- Gu, Y.; Liu, J.B.; Du, Y.X. 3D consistent viscous-spring artificial boundary and viscous-spring boundary element. Eng. Mech. 2007, 12, 31–37. [Google Scholar]
- GB/T 50355-2018; Standard for Limits and Measurement Methods of Vibration in the Room of Residential Building. Architecture & Building Press: Beijing, China, 2018.


| City | Mileage (km) |
|---|---|
| Shanghai | 831 |
| Beijing | 783 |
| Guangzhou | 621.05 |
| Chengdu | 518 |
| Moscow | 466.8 |
| Hangzhou | 450 |
| Wuhan | 435 |
| Chongqing | 432.8 |
| Nanjing | 427 |
| Shenzhen | 419 |
| Name | Poisson’s Ratio | Elastic Modulus (MPa) | Density (kg/m3) | Element Selection |
|---|---|---|---|---|
| Plain fill (the first layer) | 0.470 | 206.63 | 1760 | solid 45 |
| Mucky soil (the second layer) | 0.483 | 85.4 | 1700 | solid 45 |
| Fine sand (the third layer) | 0.471 | 206.4 | 1950 | solid 45 |
| Bearing platform | 0.2 | 3300 | 2500 | solid 45 |
| Pile foundation | 0.2 | 3450 | 2400 | beam 188 |
| Rails | 0.3 | 210,000 | 7830 | beam 188 |
| Supporting columns | 0.2 | 34,500 | 2400 | beam 188 |
| Concrete masonry | 0.2 | 34,500 | 2400 | beam 188 |
| Exterior wall | 0.2 | 33,000 | 2500 | shell 63 |
| Working Condition | Analysis Point | Peak Acceleration (m/s2) | Z-Vibration Level (dB) |
|---|---|---|---|
| Train speed of 20 km/h (working condition 1) | Rails | 4.01 | 107.57 |
| Supporting columns | 0.54 | 91.63 | |
| Columns | 0.08 | 77.82 | |
| The ground at a distance of 7.5 m from the rails | 0.12 | 83.63 | |
| Train speed of 10 km/h (working condition 2) | Rails | 1.99 | 97.51 |
| Supporting columns | 0.16 | 86.51 | |
| Columns | 0.03 | 71.84 | |
| The ground at a distance of 7.5 m from the rails | 0.07 | 81.08 | |
| Train speed of 5 km/h (working condition 3) | Rails | 2.11 | 88.36 |
| Supporting columns | 0.14 | 84.37 | |
| Columns | 0.04 | 69.78 | |
| The ground at a distance of 7.5 m from the rails | 0.05 | 77.31 |
Disclaimer/Publisher’s Note: The statements, opinions and data contained in all publications are solely those of the individual author(s) and contributor(s) and not of MDPI and/or the editor(s). MDPI and/or the editor(s) disclaim responsibility for any injury to people or property resulting from any ideas, methods, instructions or products referred to in the content. |
© 2024 by the authors. Licensee MDPI, Basel, Switzerland. This article is an open access article distributed under the terms and conditions of the Creative Commons Attribution (CC BY) license (https://creativecommons.org/licenses/by/4.0/).
Share and Cite
Luo, X.; Jiang, X.; Feng, Q.; Hu, W.; Tu, Q.; Chen, Y. Analysis of Train-Induced Vibration Transmission and Distribution Characteristics in Double-Layer Metro Depot. Buildings 2024, 14, 1702. https://doi.org/10.3390/buildings14061702
Luo X, Jiang X, Feng Q, Hu W, Tu Q, Chen Y. Analysis of Train-Induced Vibration Transmission and Distribution Characteristics in Double-Layer Metro Depot. Buildings. 2024; 14(6):1702. https://doi.org/10.3390/buildings14061702
Chicago/Turabian StyleLuo, Xinwei, Xuan Jiang, Qingsong Feng, Wenlin Hu, Qinming Tu, and Yanming Chen. 2024. "Analysis of Train-Induced Vibration Transmission and Distribution Characteristics in Double-Layer Metro Depot" Buildings 14, no. 6: 1702. https://doi.org/10.3390/buildings14061702
APA StyleLuo, X., Jiang, X., Feng, Q., Hu, W., Tu, Q., & Chen, Y. (2024). Analysis of Train-Induced Vibration Transmission and Distribution Characteristics in Double-Layer Metro Depot. Buildings, 14(6), 1702. https://doi.org/10.3390/buildings14061702