Article

Anchor Shear Strength Damage under Varying Sand Content, Freeze-Thaw Cycles, and Axial Pressure Conditions

1
College of Civil Engineering, Hebei University of Architecture, Zhangjiakou 075000, China
2
No. 3 Geological Brigade, Hebei Provincial Geological Prospec Ting Bureau, Zhangjiakou 075000, China
*
Author to whom correspondence should be addressed.
Buildings 2024, 14(6), 1772; https://doi.org/10.3390/buildings14061772
Submission received: 18 April 2024 / Revised: 31 May 2024 / Accepted: 9 June 2024 / Published: 12 June 2024
(This article belongs to the Special Issue Building Foundation Analysis: Soil–Structure Interaction)

Abstract

:
Sandy soil in the north of Hebei region of China is widely distributed, the temperature difference between day and night is large, the phenomenon of freezing and thawing is obvious, and the soil body before and after the freezing and thawing cycle of sandy soil slopes is affected by the changes. This paper takes the stability of a sandy soil anchorage interface under a freeze-thaw cycle as the research background and, based on the self-developed anchor-soil interface shear device, analyses the influence of changing sand rate, confining pressure, and the number of freeze-thaw cycles on the shear characteristics of an anchor-soil interface in anchorage specimens. The research findings indicate that, at 50–60% sand contents, the shear strength increases with a higher sand content and is positively correlated with confining pressure within a higher range. A higher sand content stabilises the anchoring body, but an excessively high sand content can lead to failure. Increasing the sand content, confining pressure, and freeze-thaw cycle number all result in a reduction in the shear displacement at the peak strength. After 11 freeze-thaw cycles, the shear strength of the anchoring body stabilises, with a reduction in strength of approximately 32%, and a higher sand content effectively reduces the reduction in strength.

1. Introduction

Anchor support is widely used in foundation pit engineering, slope engineering, and underground engineering, and the anchoring performance of anchors affects the stability and safety of engineering construction and the completed structures. Therefore, the shear deformation characteristics of an anchor-soil interface have remained a topic of study. Experts and scholars have carried out many experimental and theoretical studies. Zhuo Yang and Siu Chun Michael Ho et al. [1,2] directly monitored the internal force of anchors through intelligent monitoring to describe the stress distribution of anchors. Chase Barnard and Cherdsak Suksiripattanapong et al. [3,4] evaluated the mechanical properties of an anchor-soil interface in detail through on-site anchor pull-out testing. Aoxue Chen et al. [5,6,7,8] explored the anchor support system of a deep foundation pit and obtained the force and deformation characteristics of the anchors in the foundation pit, pointing out that strengthening the shallow support of the foundation pit can effectively improve the safety reserve. Weizhi Su [9] conducted anchor pull-out tests with two different model boxes and proposed an exponential anchor-soil interface model. Laura Blanco Martín [10] established a trilinear bond−slip prediction model from measured curves. M. Ghadimi [11] proposed a new analytical solution for predicting the displacement of fully grouted anchors, and the analytical method results agreed well with the numerical method results. Xiao Hua Xi [12] derived a shear stress model and an axial force model of full-length bonded anchors based on the Boussinesq formula, starting from the surrounding rock of the tunnel. Zhu Zheng-de et al. [13] analysed the distribution of shear stresses in full-length grouted paving rods by considering the shear characteristics of the interface between the slurry and the contact interface. Chen et al. [14] proposed a full-process shear displacement curve by independently developing an anchor-soil interface friction tester.
In addition to theoretical studies of the anchor-soil interface, many researchers have explored this interface using indoor modelling tests. Since the anchor-soil contact surface properties closely depend on the soil state, it is possible to extend the study of the freeze-thaw cycling of soil to the anchor-soil interface. Numerous studies have pointed out that freezing and thawing change the original structure of the soil, as well as the composition of the particles, thus changing the mechanical properties of the soil, leading to changes in the engineering properties of the soil [15,16,17]. Edwin J et al. [18,19,20,21] studied the changes in pore size and pore water in the soil in the process of freezing and thawing from a microscopic point of view. Leuther Frederic Eskisar [22] found that the compressive strength of both natural and saturated soils decreased after freeze-thaw cycles. In freeze-thaw-related studies, many experts and scholars have used cohesion and the internal friction angle as indicators of soil changes and investigated the freeze-thaw damage mechanism [23,24,25]. Jilin Qi et al. [26,27] carried out direct shear tests on soils and found that changes in the dry density affected the cohesion, and the cohesion decreased when the dry density exceeded the critical density. Jiankun Liu et al. [28] suggested that the cohesion and internal friction angle of fly ash decreased most in the first cycle and reached their minimum values after seven–nine cycles. Naji N. Khoury et al. [29] suggested that 12 freeze-thaw cycles can generally reflect the complete effect of freezing and thawing on fly ash parameters. Zhoufei Yao suggested that the cohesion of Shanghai clay gradually decreased and its internal friction angle increased after experiencing very-low-temperature freezing and thawing [30]. Jianqiao Mu et al. [31] noted that cohesion is more sensitive to freezing and thawing than the internal friction angle, establishing an exponential decay model to predict the trend of rock strength degradation in cold regions due to freeze-thaw cycling.
Moreover, some scholars have also carried out research on the shear characteristics of soil–structure interfaces through direct shear tests. Pengfei He et al. [32] studied the change in the shear strength of frozen soil and structure surfaces subjected to freeze-thaw cycles and found that the freeze-thaw cycles had little influence on the shear displacement curve. Rongkai Pan [33] carried out straight shear tests on sand structures after experiencing different freeze-thaw cycles and combined the results with fine-scale analysis to explain the reasons for the change in the shear strength of the sand body. Jie Dong et al. [34] pointed out that the shear strength of the interface gradually stabilised after a significant decrease in the shear strength of the interface in the first three freeze-thaw cycles, whereas the friction angle increased slightly and the soil particle structure changed. Jingjing Pan et al. [35] found that, in a clay–concrete interface, the changes in the clay particles and pore content were most obvious after the first three freeze-thaw cycles and that the directionality of particles in the shear zone was the main reason for the changes in the shear zone.
In summary, previous research has mostly focused on the influence of freeze-thaw cycles on the shear performance of soil–structure interfaces, mainly using direct shear testing methods. However, direct shear testing faces issues such as an unstable shear area, an unrealistic shear interface geometry, and difficulty in accurately controlling the anchorage force state. Although previous research has mainly focused on various types of soil, insufficient attention has been given to the influence of sand content within the soil, and the application in the relevant engineering practice is also low. For sandy soil, the particle size distribution curves vary widely, leading to different soil stabilities. The stability of the soil can be simplified by evaluating the ratio of sand content to clay content. This study optimised the testing method and developed a self-designed shear device for testing under confining pressure to more accurately reflect the actual stress state of anchor rods in engineering. This study analysed the influence of sand content and anchoring material on the soil−anchor interface under freeze-thaw cycles, controlling factors such as confining pressure, sand content, and freeze-thaw cycle frequency. This work examined the shear-stress−displacement relationship, including the peak shear strength and soil freeze-thaw damage patterns at the soil−anchor interface.
Research has revealed the impact of different sand contents in sandy soil layers on the anchoring performance, further enriching the methods for evaluating soil stability and providing an important parameter basis for the design of anchor rods in engineering projects, such as foundation pits and slopes. By determining the optimal sand content, the stability and bearing capacity of the anchoring system can be improved while meeting engineering safety requirements, optimising material usage, and enhancing economic benefits. In addition, this study conducted a detailed analysis on the influence of freeze-thaw cycles on the shear strength of the soil−anchor interface under different sand contents, which is helpful for the adaptive design of engineering projects in freeze-thaw environments and extending the service life of the projects.

2. Materials and Methods

2.1. Materials

This experiment analyses the content of sandy soil in the north Hebei region and uses powdery clay from the Zhangjiakou region for configuration. After air-drying and crushing, the fine-grained clay with less than 0.075 mm was taken and placed in a cool and dry place for storage. Standard sand was mixed with the fine clay to create three soil mixtures with sand contents of 50%, 55%, and 60%. After mixing the sand and clay uniformly, the resulting soil was dried and then subjected to compaction and direct shear tests. The experimental data pertaining to the fundamental physical characteristics of sandy soil are presented in Figure 1 and Table 1. For anchoring, M8 ribbed steel bars and cement mortar were used, with ordinary Portland cement of strength grade 42.5. The cement mortar mix ratio of standard sand−ordinary Portland cement−water was 1:1:0.45, and the uniaxial compressive strength of the cement mortar was measured to be 21 MPa.

2.2. Testing Instruments

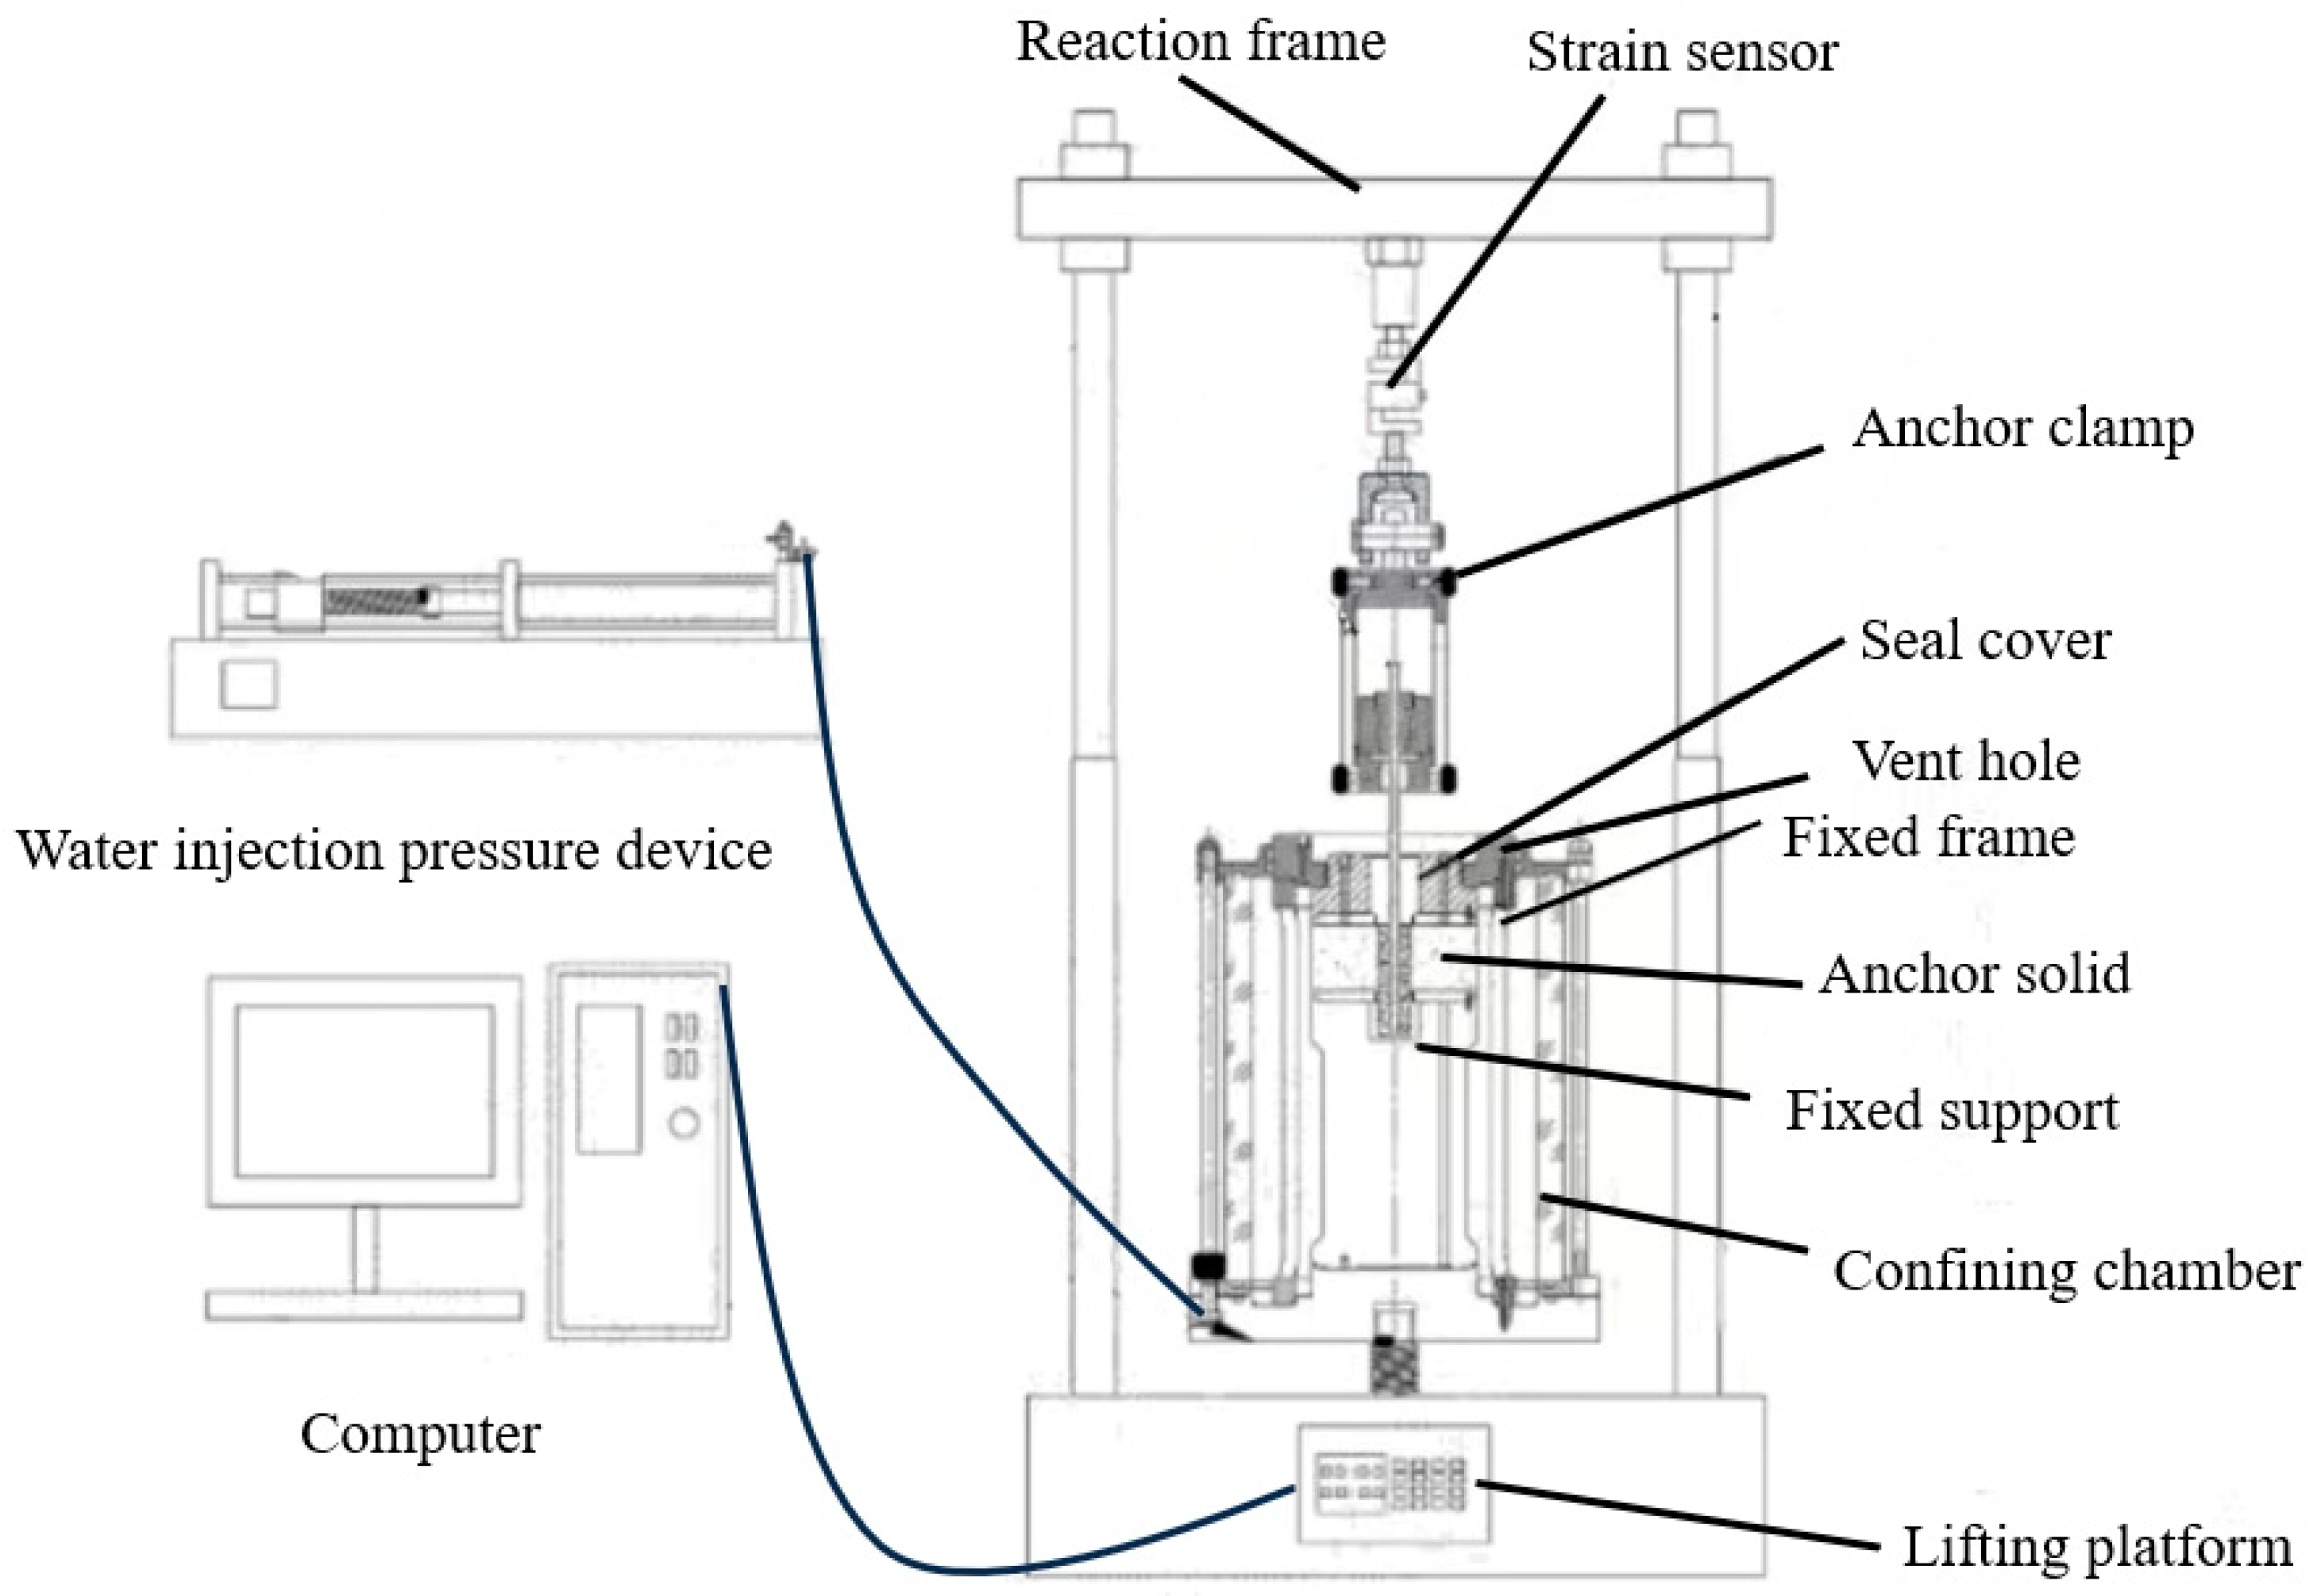
This test apparatus is based on a permafrost triaxial apparatus, which contains a confining pressure system, a fixing system, a control system, and an acquisition system. The shear test system for anchors is shown in Figure 2. The whole instrumentation unit consists of a lifting platform, a steel base, a fixed support, a pumping cylinder wall, a confining pressure chamber, a fixed frame, an anchor centring device, an anchor fixture, a force transducer, and a counterforce frame beam. First, the solid anchor is maintained on the upper end of the fixed support through holes, and then a rubber film is installed on the wall of the pumping cylinder. The pumping machine is used to tightly attach the rubber film to the cylinder wall. The smooth cylinder wall is set on the solid anchor, the pumping machine is turned off so that the rubber film is tightly adhered to the solid anchor, and then rubber bands are placed around the rubber film to prevent water seepage. Afterwards, the fixed frame is installed and surrounded by the pressure chamber, and the different components are connected with a sealing ring to ensure that the device is sealed and airtight. During the pulling process, the bars are kept in the centre by means of an anchor centring device and clamps to ensure vertical pulling. After the specimen is installed, it is pressurised with liquid with a water-filled pressurising device. When the confining pressure reaches the target value, a pressure balancing device is activated to stabilise the confining pressure at the set value. Subsequently, the lifting device is activated, the steel base drives the solid anchor to move downwards at a rate of 1 mm/min, the force between the anchor and soil are transmitted to the acquisition system through the force sensor, and the force and displacement data are collected through the data acquisition instrument. Throughout the anchor pulling process, the shear of the anchor-soil contact surface is always kept constant to ensure the accuracy of the test.

2.3. Test Method

Considering the research purpose of this paper, through the optimisation of the relevant testing method, a self-developed anchor-soil interface triaxial shear test device is used to collect more accurate shear stress and shear displacement data, and the influence of different confining pressures, freeze-thaw cycle numbers, and sand contents is investigated to elucidate the behaviour of sandy soil slope anchors in various slope conditions in a cold region. The analysis focuses on the shear stress-shear displacement at the anchor-soil interface, the peak shear strength and displacement, and the freeze-thaw damage to the soil body. The main test conditions are shown in Table 2.
(1)
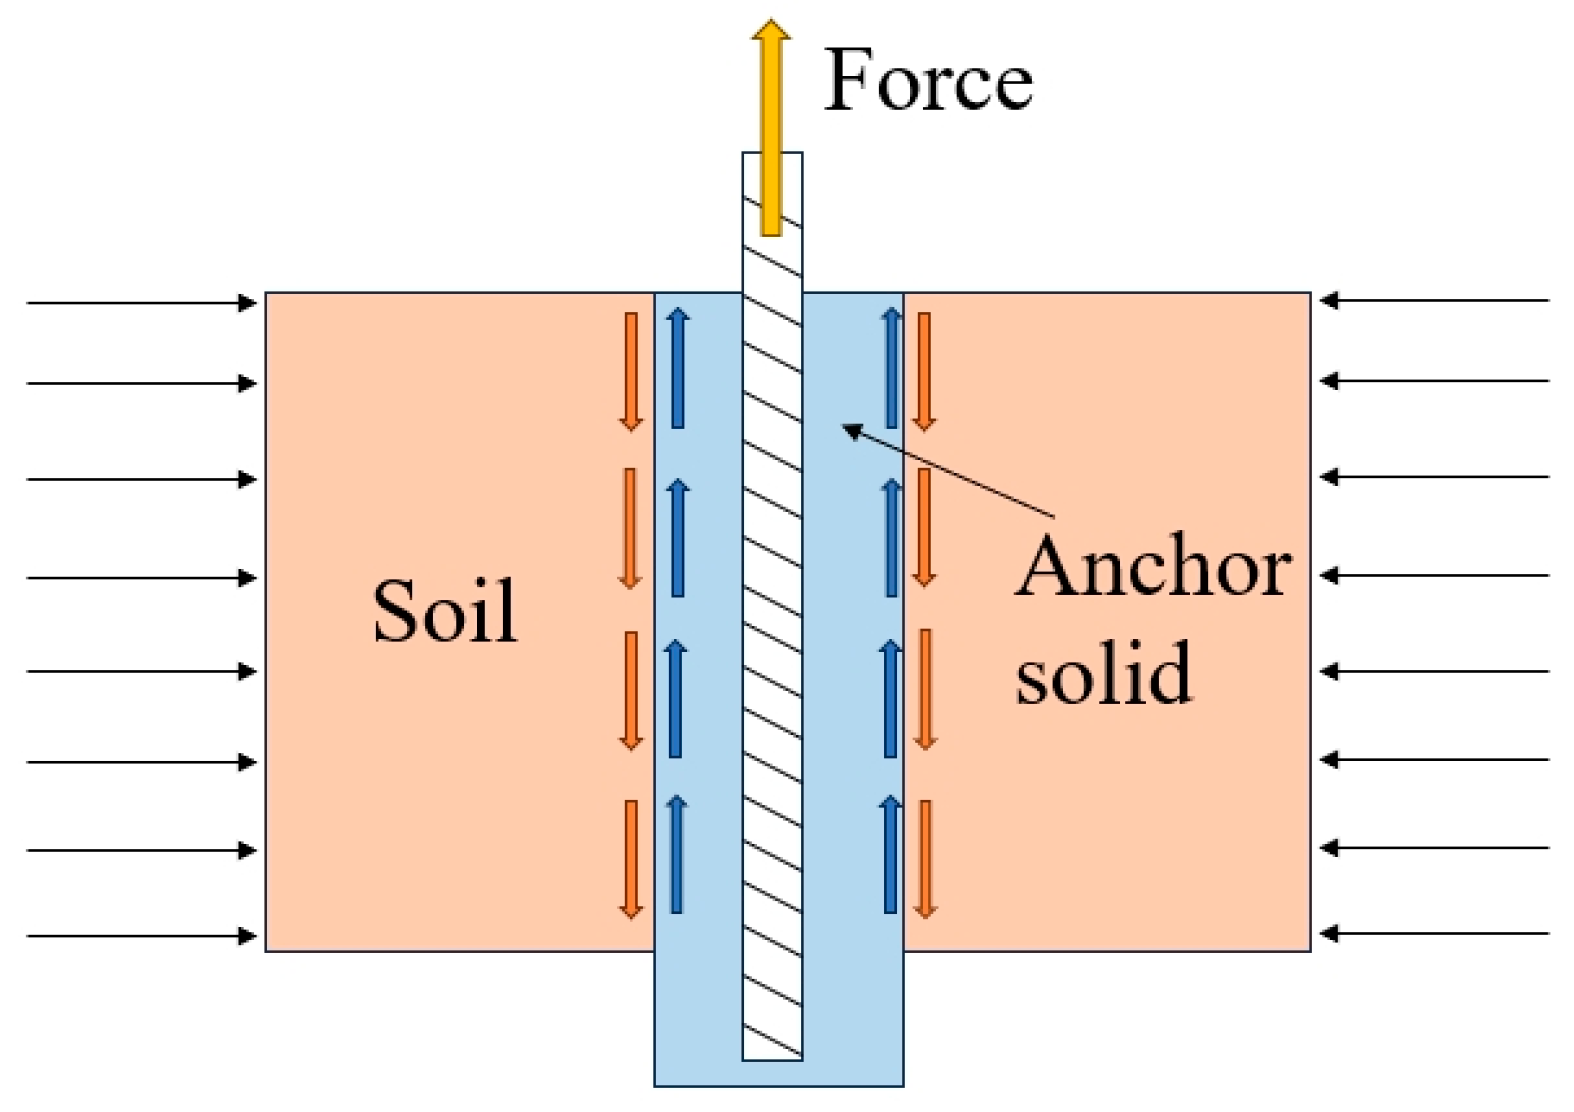
Specimen production. The retrieved powdery clay is dried, crushed, and sieved again. A 0.075 mm sieve is used for sieving, and the sieved fine-grained soil is set aside for later use. The fine-grained soil is mixed uniformly with standard sand according to the different sand contents adopted for this work. Initial compaction experiments on soils with three different sand contents showed that the optimal moisture content varied, but all were concentrated at approximately 8%. The moisture content of the test specimens in this study is controlled at 8%. The soil mixture is prepared with an 8% moisture content to ensure even moisture distribution and minimal large clay particles. First, the compaction mould is assembled by fixing a hollow steel pipe to the base plate and connecting the cylinder wall to the bottom using bolts. Vaseline is applied to the surface of the hollow steel pipe to reduce friction with the compacted soil and facilitate smooth extraction, minimising interference with the soil. Once the compaction container is assembled, the soil is filled in five layers of a set amount of soil and compacted; compaction is stopped when the soil reaches the desired height. The compacted soil is scraped to make the layers more tightly bound. When the separation height is reached, filter paper and aluminium sheets are placed to separate the soil for later grouting and cutting, ensuring that the shear area of the anchor rod remains constant during the pull-out phase. Additional soil is poured in, and the compaction and scraping process is repeated until the soil sample is complete. The forces on the specimen are shown in Figure 3.
(2)
Bolt shear test system production. The demoulding process is carried out using an electric hydraulic demoulding device. After demoulding, the sample is sealed with plastic wrap and tightly wrapped with two hollow cylindrical acrylic plates around the anchor body. Rubber bands are then applied to the outer acrylic plate to provide circumferential restraint and prevent disturbance to the anchor body. The cement mortar mix ratio of standard sand−ordinary Portland cement−water is 1:1:0.45. The anchor positioning device is used to vertically place an M8 steel bar in the middle of the hole, and grouting material is made according to the mix ratio for soil anchor grouting. After thorough mixing, the grouting material is poured into the hollow soil body and compacted to prevent the formation of air bubbles in the mortar, which could affect the grouting strength. After the initial setting of the cement mortar, the specimens are cured at room temperature for 14 days. To minimise the boundary effect on the anchorage, the ratio of the soil body to the anchor body diameter and the steel bar diameter is greater than 5. The soil body has a diameter of 15 cm, the anchor body has a diameter of 3 cm, and the steel bar has a diameter of 8 mm. During the pull-out process, the soil body is subjected to circumferential confinement, which reduces the boundary effect on the anchor rod and ensures the accuracy of the test.
(3)
Freeze-thaw cycling. First, a cured specimen is cut, and the soil is separated along the filter paper to ensure that the bottom of the soil is smooth. The surface of the specimen is wrapped with plastic wrap and fixed in a fixed container, which was placed in a freeze-thaw cycle box. The temperature is designed to be −20° to 20°. Previous freeze-thaw cycle tests have shown that soil reaches a new stable state after 10 freeze-thaw cycles [35]. Therefore, the number of freeze-thaw cycles is set to 0, 1, 3, 8, and 11 for a total of 5 different freeze-thaw cycles. The freeze-thaw test adopts a large freeze-thaw cycle box with a temperature control range of −40° to 120° and an accuracy of ±0.1°, which can meet the test requirements. Temperature control adopts the 11 + 1 mode, which involves freezing for 11 h and stepped temperature adjustment for 1 h. The freezing and thawing stages are both 12 h to ensure that the sample can be fully frozen and thawed. Every cycle takes 24 h to complete, and after reaching the designed number of cycles is performed, the sample is removed from the box and rested for 3 h before shear testing.
(4)
Confining pressure setting. At the end of the freezing and thawing treatment, the solid anchor is placed into the anchor support with a hollow groove in the centre and the fixing device and confining pressure chamber are installed. The confining pressure chamber is filled when ready. The pump is used to quickly inject water, and the upper part of the confining pressure chamber has holes to remove air during the water injection stage. The bolts are tightened to close the holes when the water is about to overflow the chamber so that the entire confining pressure chamber is kept in a sealed environment. Afterwards, a pressurising device is used to pressurise the injected water. After the confining pressure reaches the set value, the confining pressure is kept stable for a period. The control and acquisition software is opened in the data acquisition terminal, and the corresponding parameters are input to pull the bolt at a steady rate of displacement. The shear displacement and shear stress in the drawing process are transmitted to the computer terminal through the acquisition system in real time for subsequent data storage and processing.

3. Results and Analysis

3.1. Shear Characteristics Tests of Anchor Rods under Static Loading

This test is completed in the laboratory of the Hebei University of Architecture and Engineering with a frozen soil triaxial testing system manufactured by Nanjing Tekao, Co. (Nanjing, China). After the independent modification of this test device, the base is replaced to achieve different sizes of anchor-soil interface shear characteristics and the effect of static pull-out. The test is carried out in a sealed environment in the confining pressure chamber, where the solid anchor is pressurised by water injection, the base is controlled to lower at a rate of 1 mm/min, and the force transmission between the anchor-soil interface is collected and transmitted to the computer for display and reprocessing through the force transducer fixed on the counterforce frame.

3.1.1. Ultimate Pull-Out Force of an Anchor Rod under Static Loading

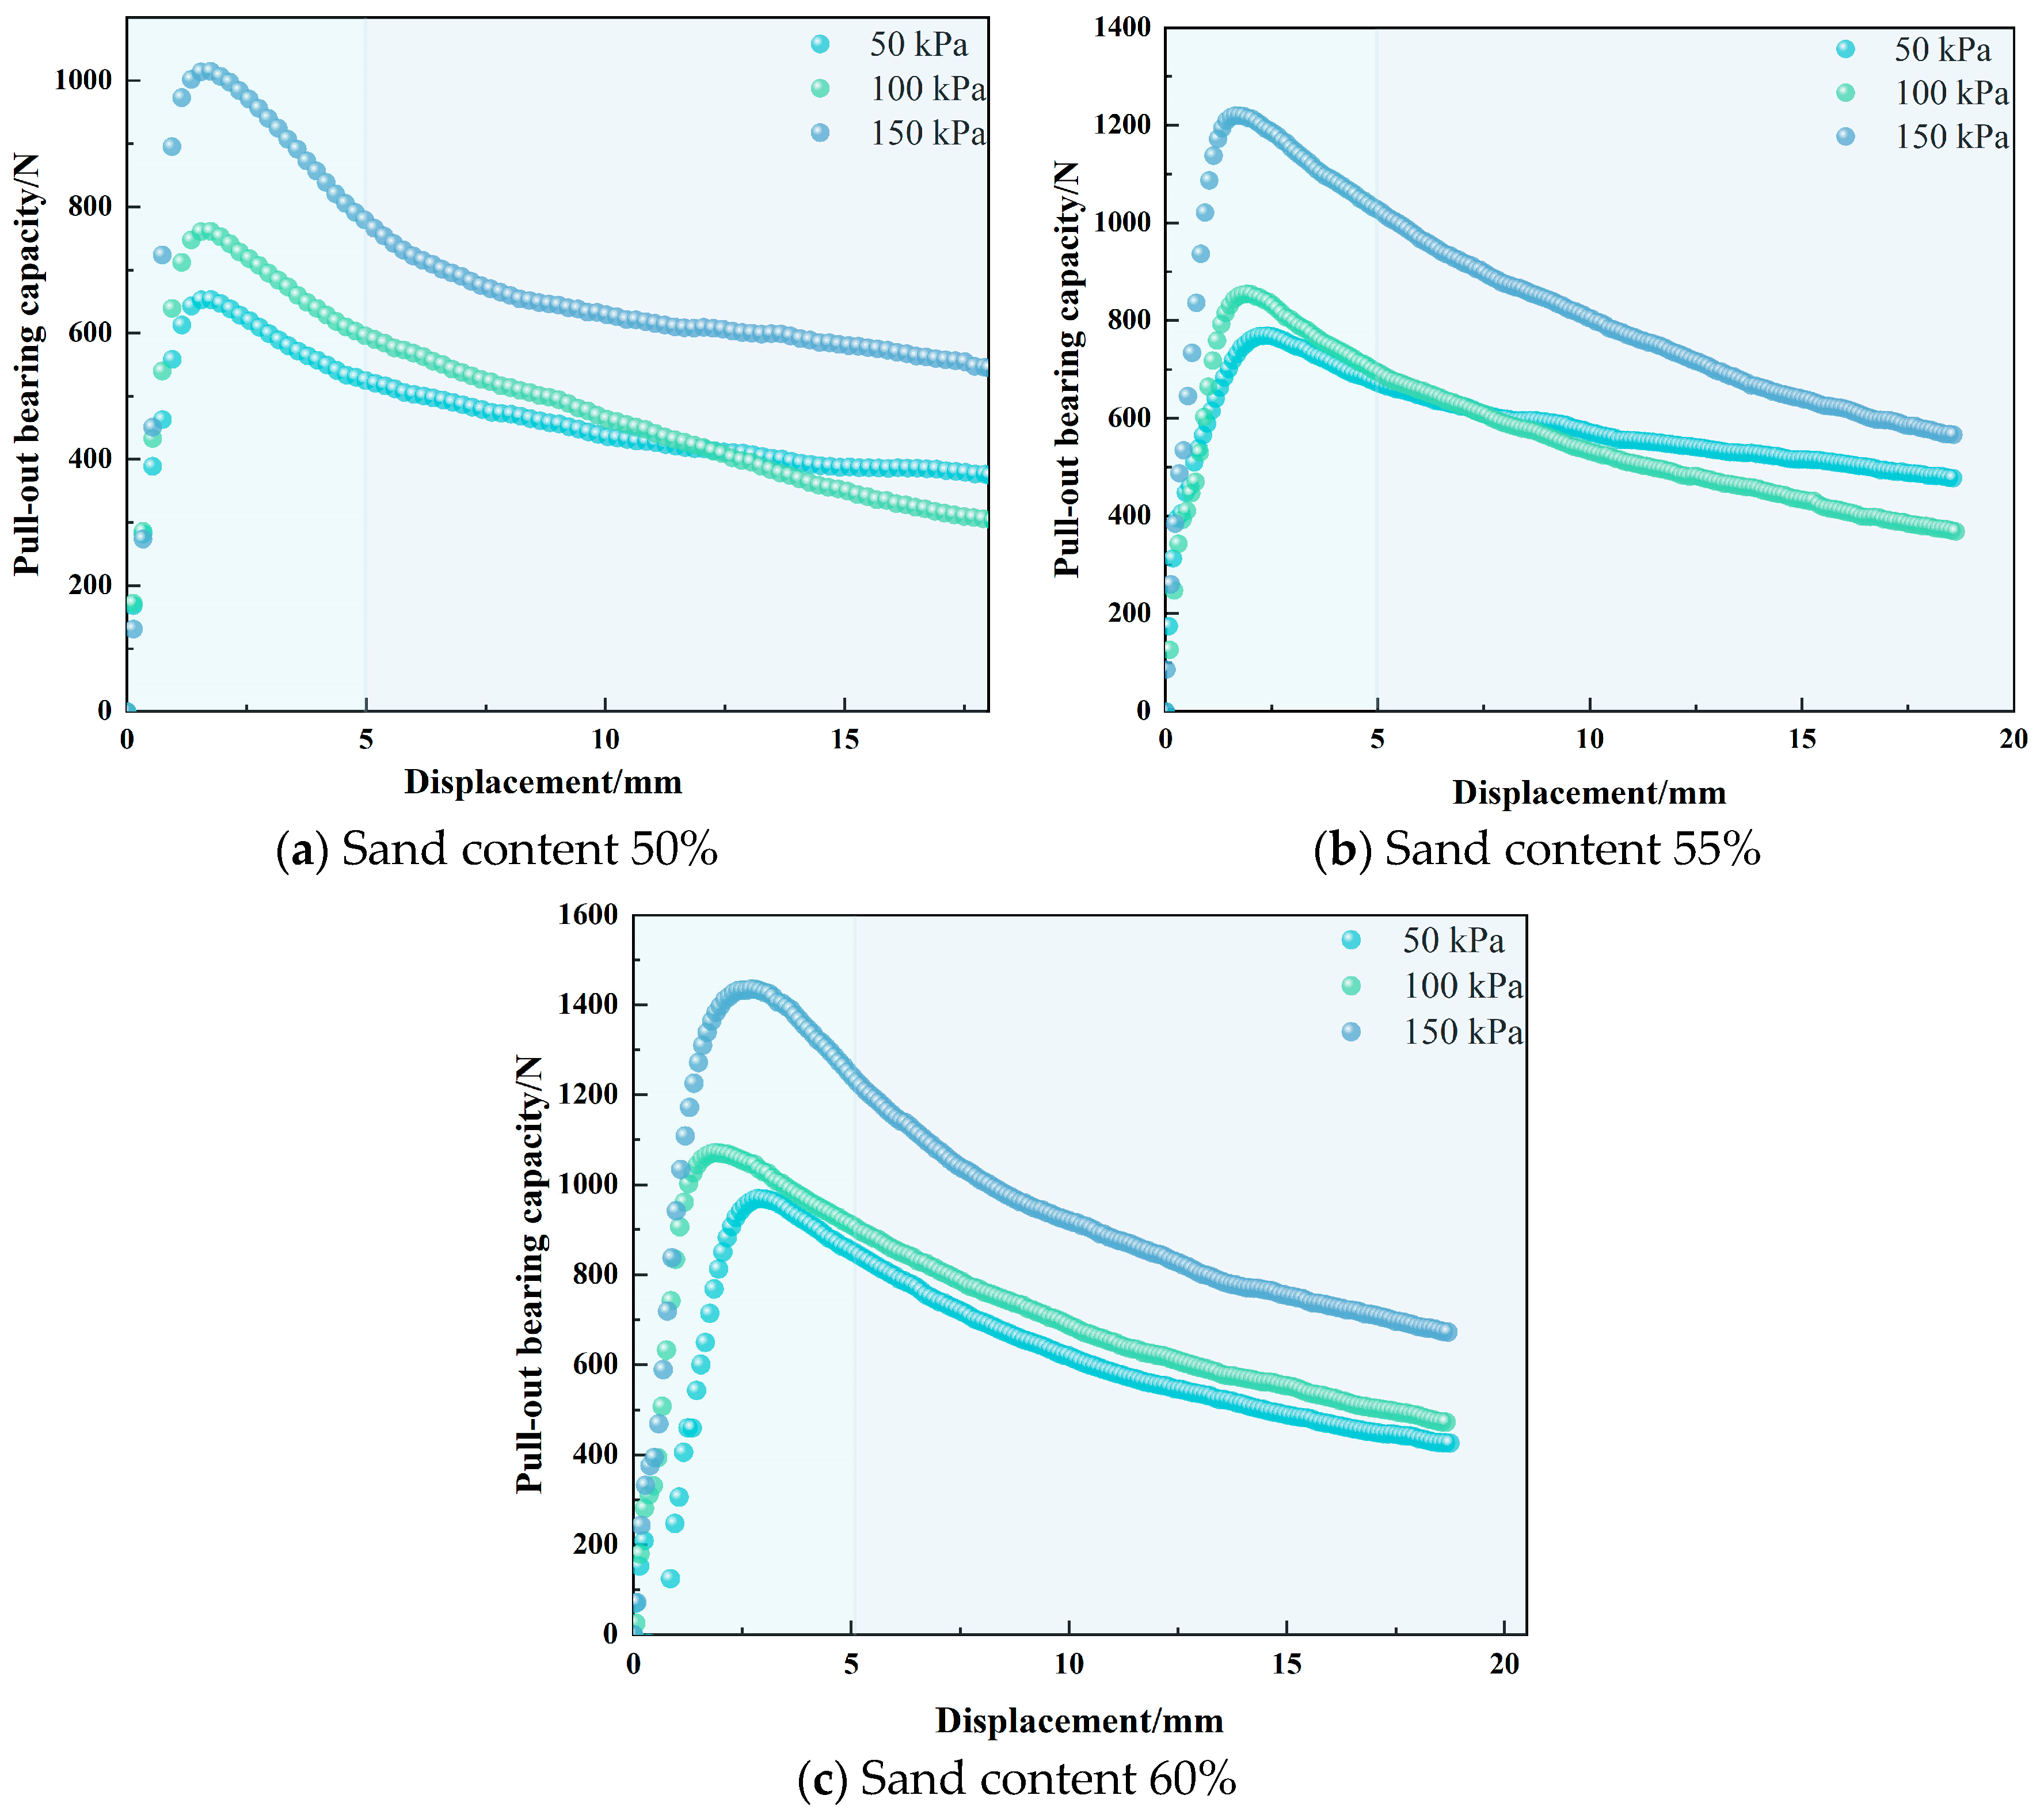
The pull-out test differs from the shear test in that it achieves pulling out for different specimens and installation bases. In the process of making the parts, the step of cutting the soil is eliminated to keep the soil sample intact. During installation, solid fixed supports are removed to gradually reduce the contact area between the anchor and the soil during the pulling process, consistent with the actual working conditions of pulled anchor rods. This work includes pull-out tests on nine samples with three different sand contents and three different confining pressures as variables, resulting in the pull-out curves shown in Figure 4.
The pull-out curve initially rapidly increases to its peak value with a linear slope but then decreases at a faster rate of change. During the decreasing process, the slope of the curve gradually decreases while the pull-out load continues to decrease.
For the sample with a sand content of 50%, the peak load increases from 653.45 N to 1015.91 N; for the sample with a sand content of 55%, the peak load increases from 769.58 N to 1220.04 N; for the sample with a sand content of 60%, the peak load increases from 969.85 N to 1435.97 N. The confining pressure is positively correlated with the peak load, and appropriately increasing the radial stress of the anchoring body can increase the friction and particle interlocking force at the anchor-soil interface, thereby improving the bearing stability of the anchor rod. By controlling the constant confining pressure and observing the effect of increasing the sand content on the peak load, which is under 50 kPa, when the sand content of the specimen increases from 50% to 60%, the peak load increases by 316.39 N; under 100 kPa, the peak load increases by 308.71 N; and under 150 kPa, the peak load increases by 420.07 N. It can be seen that appropriately increasing the sand content also helps to increase the stability of the soil and improve the pull-out resistance of the anchor rod.
This paper concentrates on the static load-bearing characteristics of anchors, but we also acknowledge the significant impact of dynamic loads on the stability of anchor support systems in practical engineering. During construction, anchors are subjected to prestress as well as complex influences from the surrounding rock and soil. Throughout their service life, dynamic loads, such as earthquakes, traffic vibrations, and blasting, can cause damage or even failure to the rock, soil and support structures, posing a serious threat to project safety and leading to significant economic losses. Therefore, an in-depth study of the changes in the pull-out capacity of anchors under cyclic alternating loads and an accurate assessment of the actual pull-out capacity of in-service anchor bodies with prestress applied are crucial for ensuring the long-term stability of anchor support systems.

3.1.2. Constitutive Relationship of the Anchor-Soil Interface throughout the Test Process

This paper adopts a normalisation approach to fit the load-displacement curve of the anchor rod and the shear stress-shear displacement curve [14].
The load-displacement curve shown in the figure above is processed as follows: the load and displacement at different times are divided by the peak load p m and peak displacement s m , respectively, to obtain the load ratio y and displacement ratio x . That is,
y = p / p m
x = s / s m
By analysing the normalised curve, the shape of the curve can be fitted using the following equation:
y = ( a x + ( b 1 ) x 2 ) 1 + ( b 2 ) x + a x 2
In this equation, there is an undetermined parameter. By substituting Equations (1) and (2) into Equation (3), the expression for the constitutive relationship of the entire process of anchor rod pull-out is obtained.
p = p m [ a s s m + ( b 1 ) s 2 ] / [ s 2 + ( b 2 ) s s m + a s 2 ]
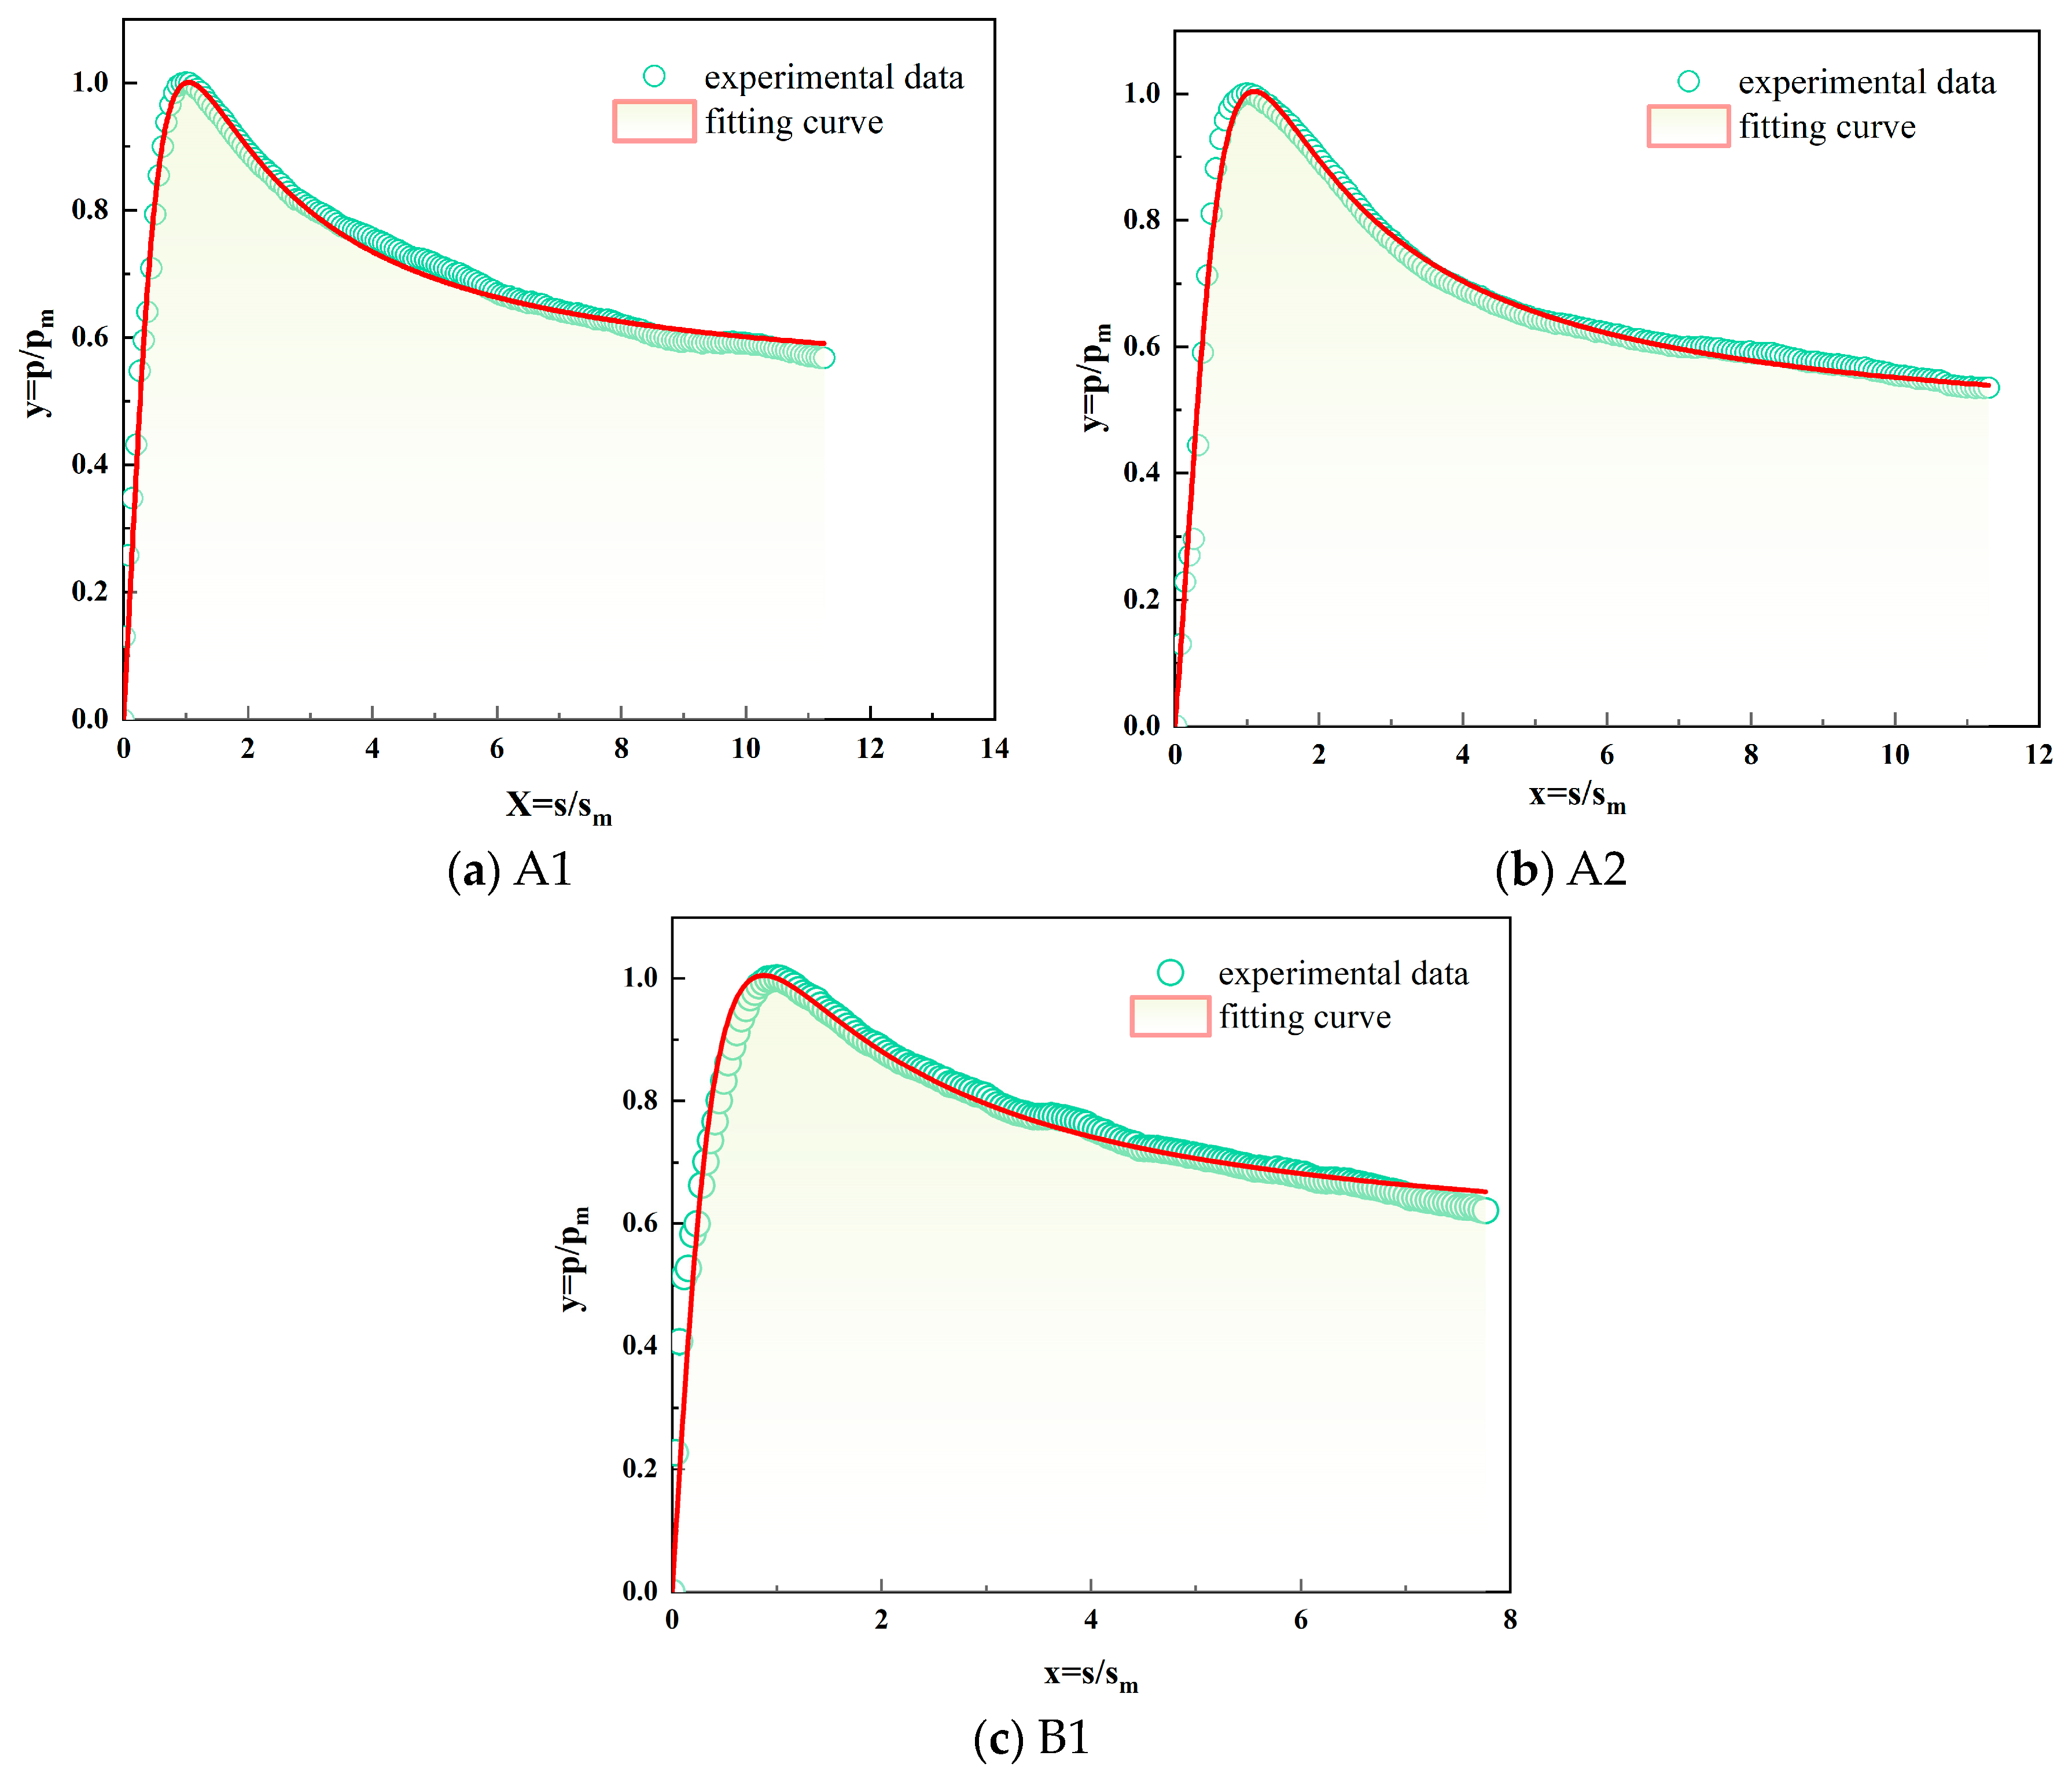
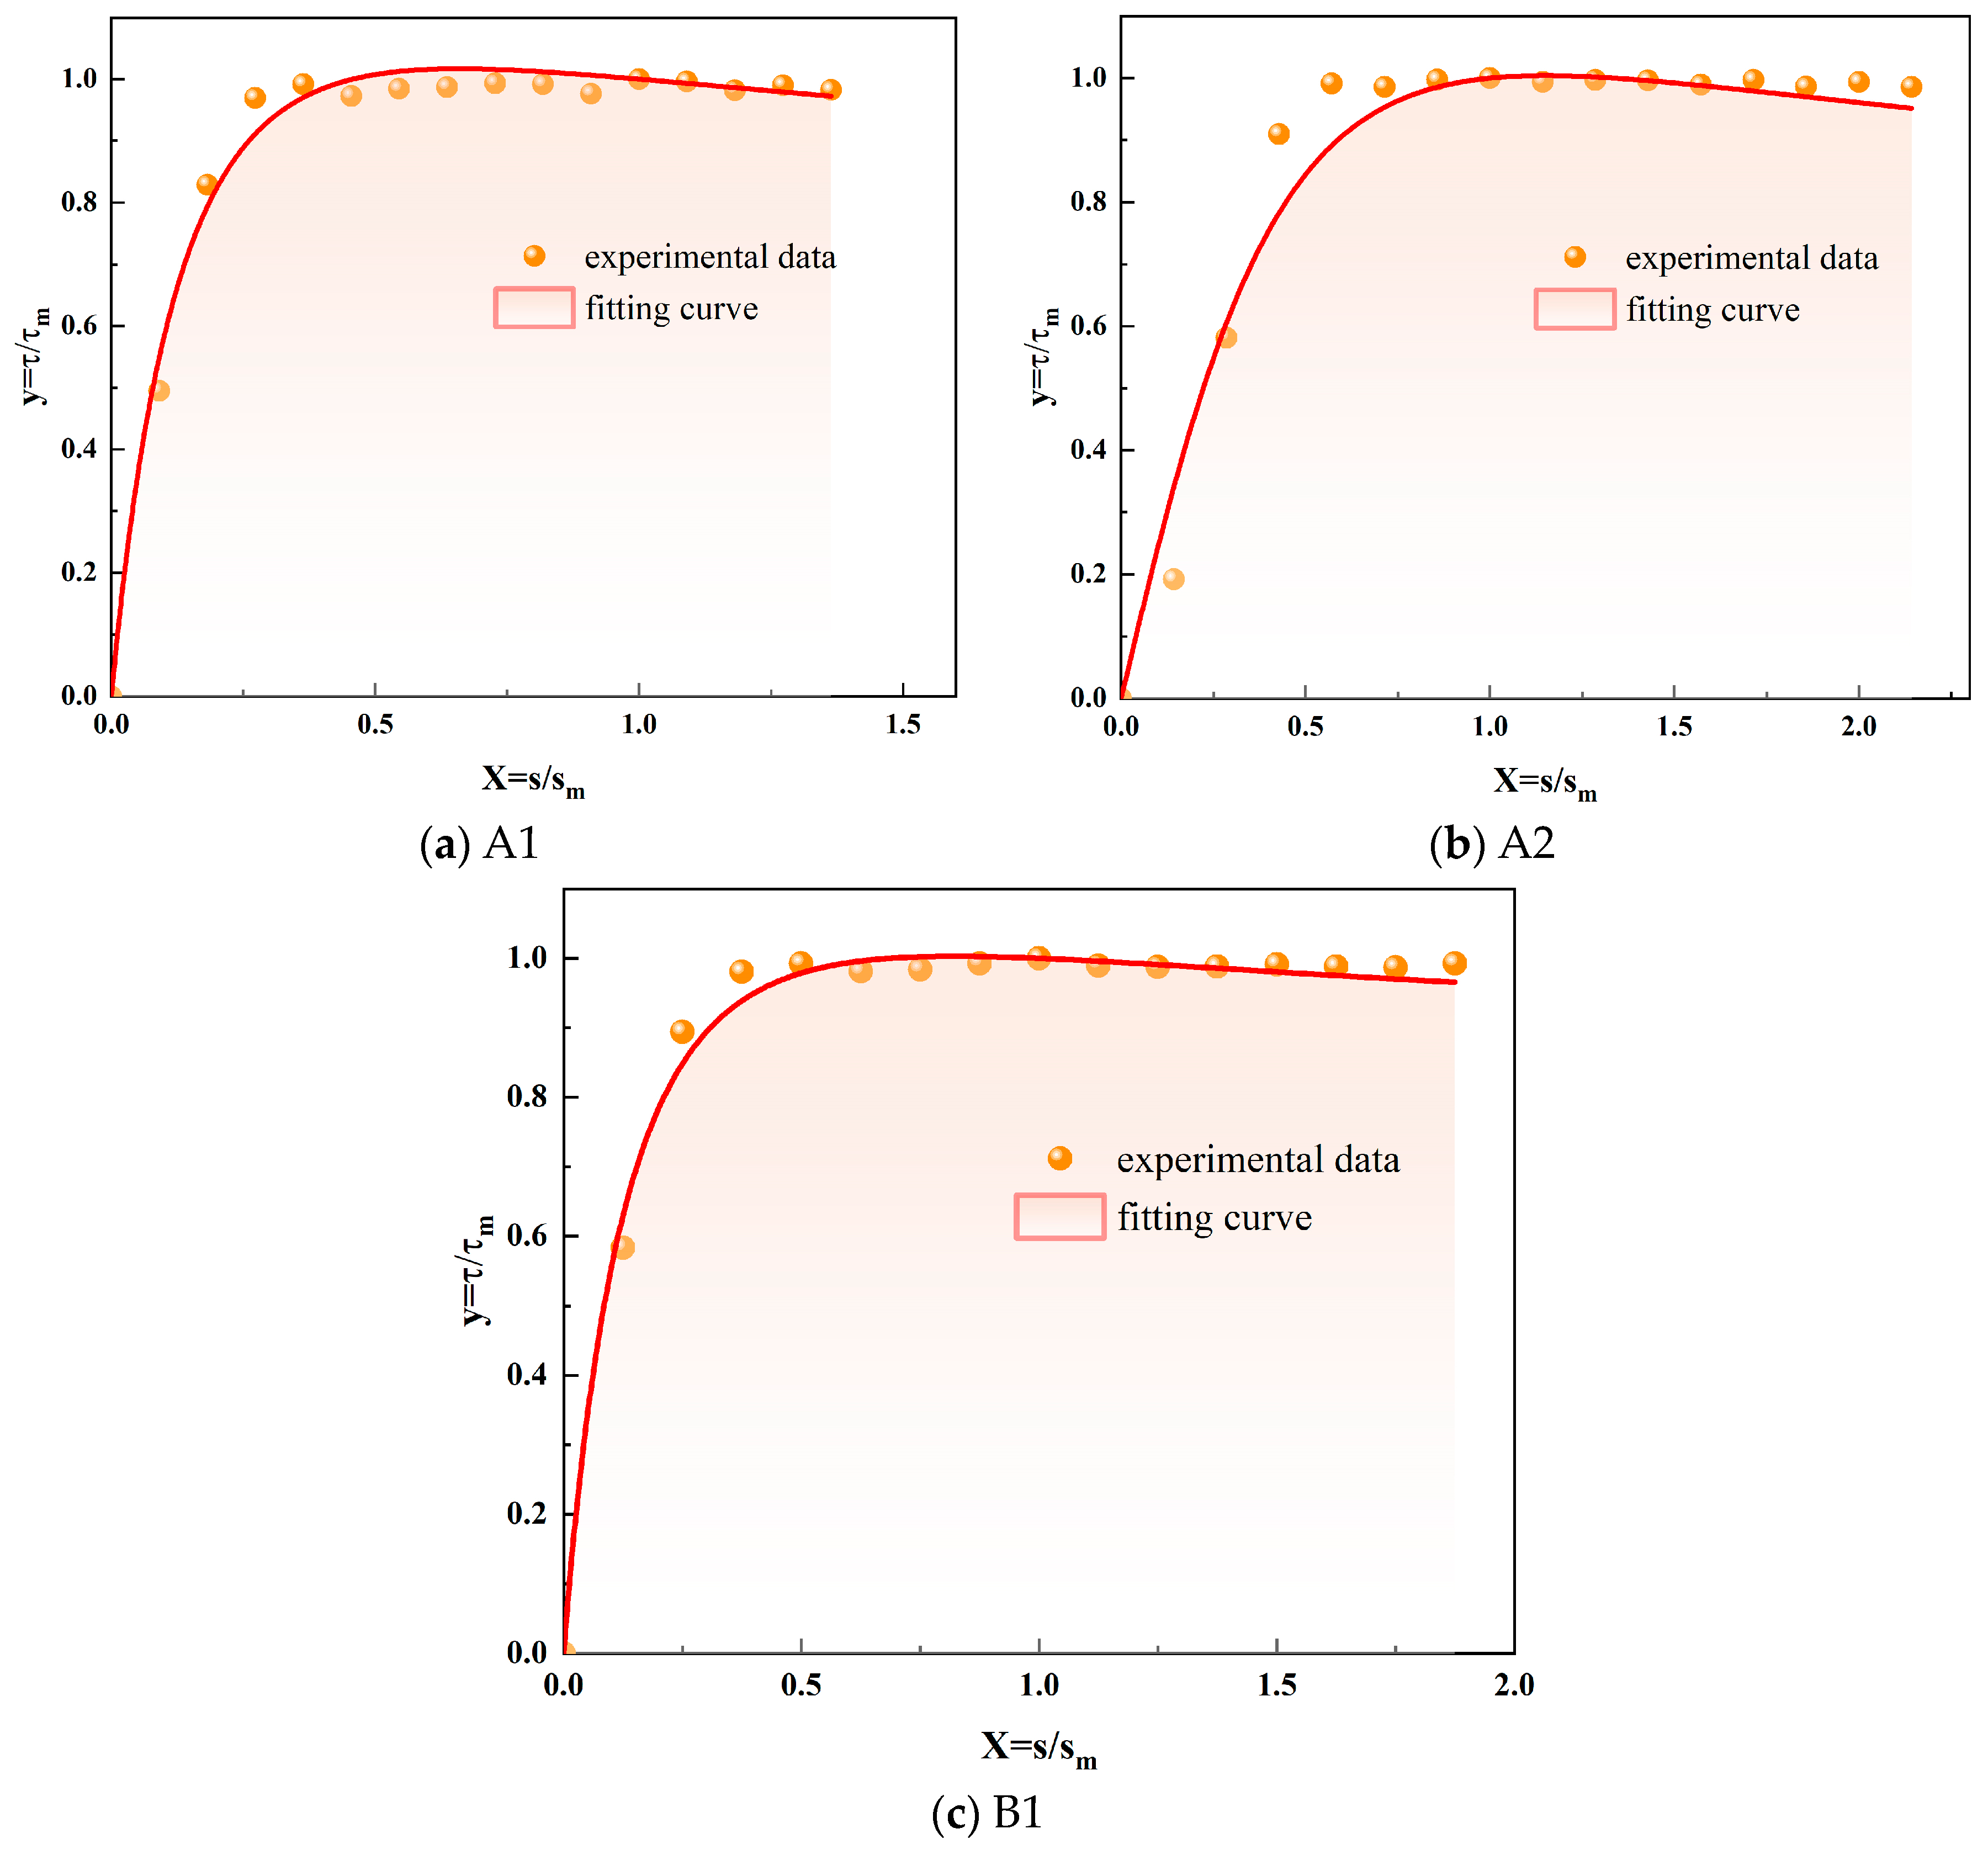
This gives the normalised fitting curve for the load-displacement relationship; the shear stress-shear displacement relationship described below is also processed with this approach. The experimental results and the normalised fitting results are shown in Table 3 and Table 4. Some fitting curves and measured results are shown in Figure 5 and Figure 6. The tests were conducted on unfrozen samples, where A, B, and C represent sand content rates of 50%, 55%, and 60% and 1, 2, and 3 represent the confining pressures of 50 kPa, 100 kPa, and 150 kPa, respectively. Clearly, Equation (4) can fit the pull-out curve and shear displacement curve well and has a high fitting accuracy for all sample curves.

3.2. Feature Analysis of the Shear Stress-Displacement Curve of the Anchor-Soil Contact Surface

3.2.1. Analysis of the Influence of Confining Pressure on the Shear Stress-Displacement Curve of an Anchor-Soil Contact Surface

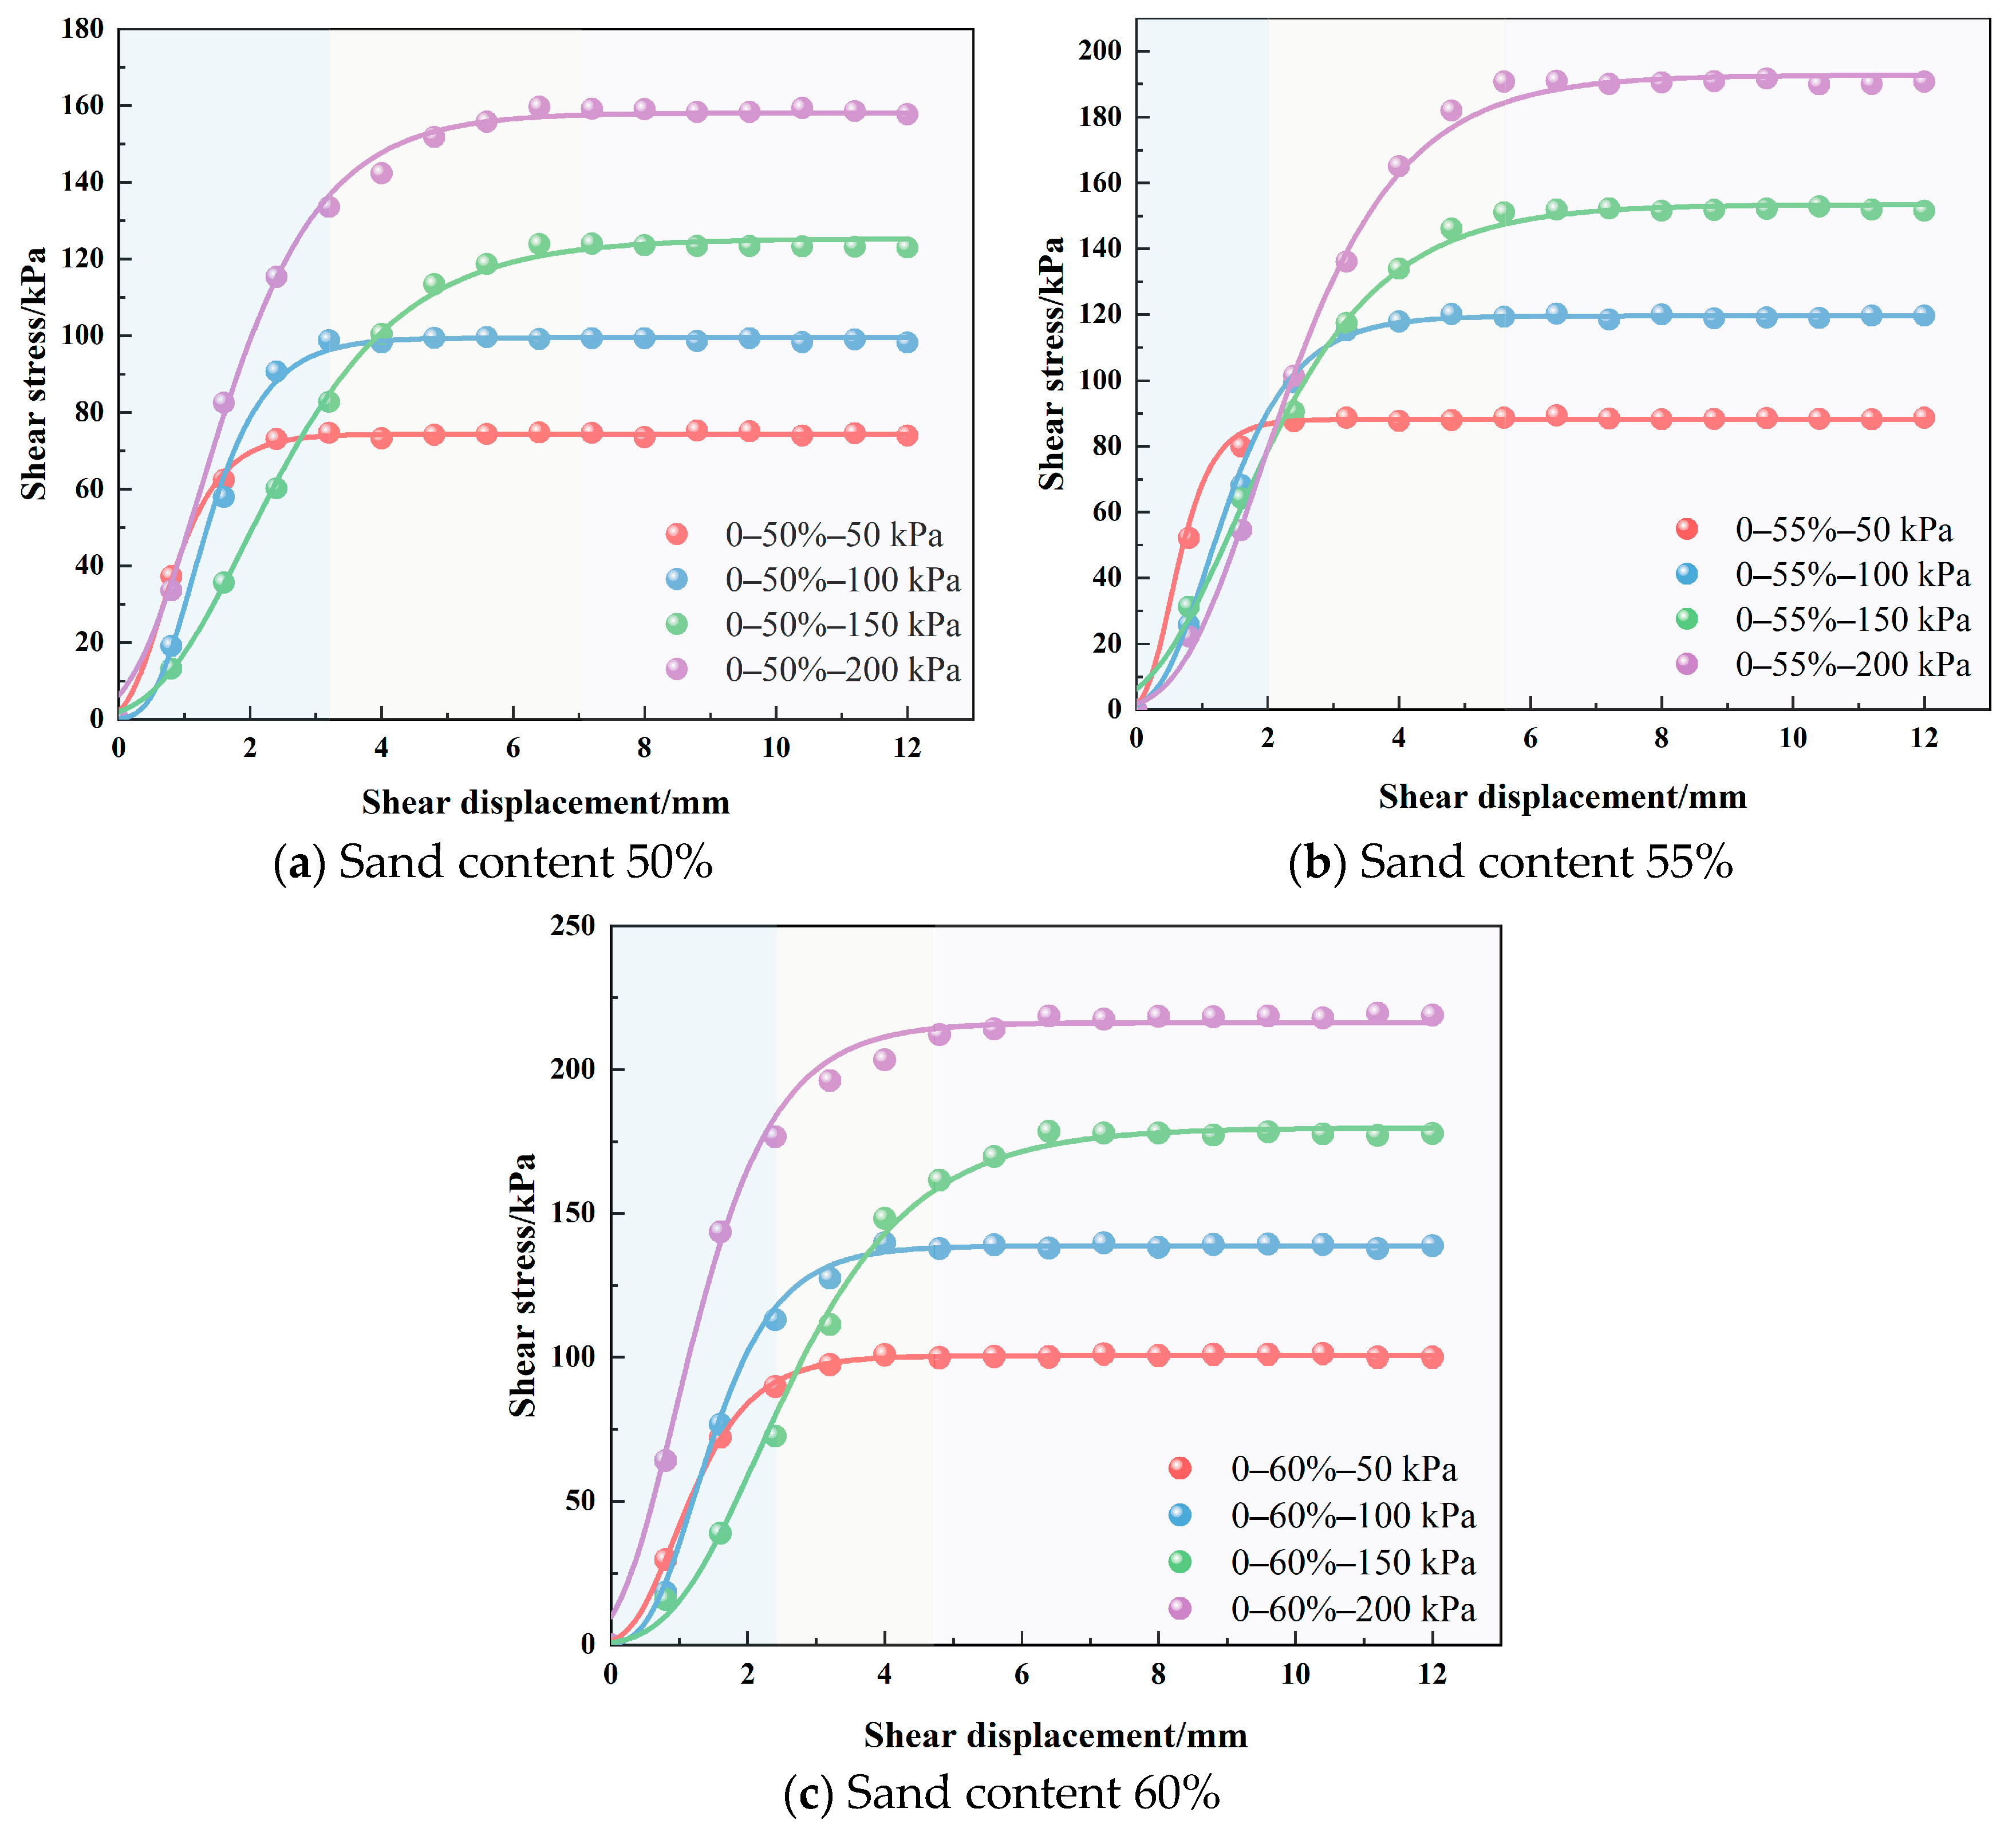
To study the effect of confining pressure on the shear characteristics of the anchor-soil interface, Figure 7 shows the shear stress-displacement curves of soils with sand contents of 50%, 55% and 60%. In the corresponding legends, the value in the first column represents the number of freeze-thaw cycles, the value in the second column is the sand content, the value in the third column is the size of the applied confining pressure, and the curves in the figures are fitted curves.
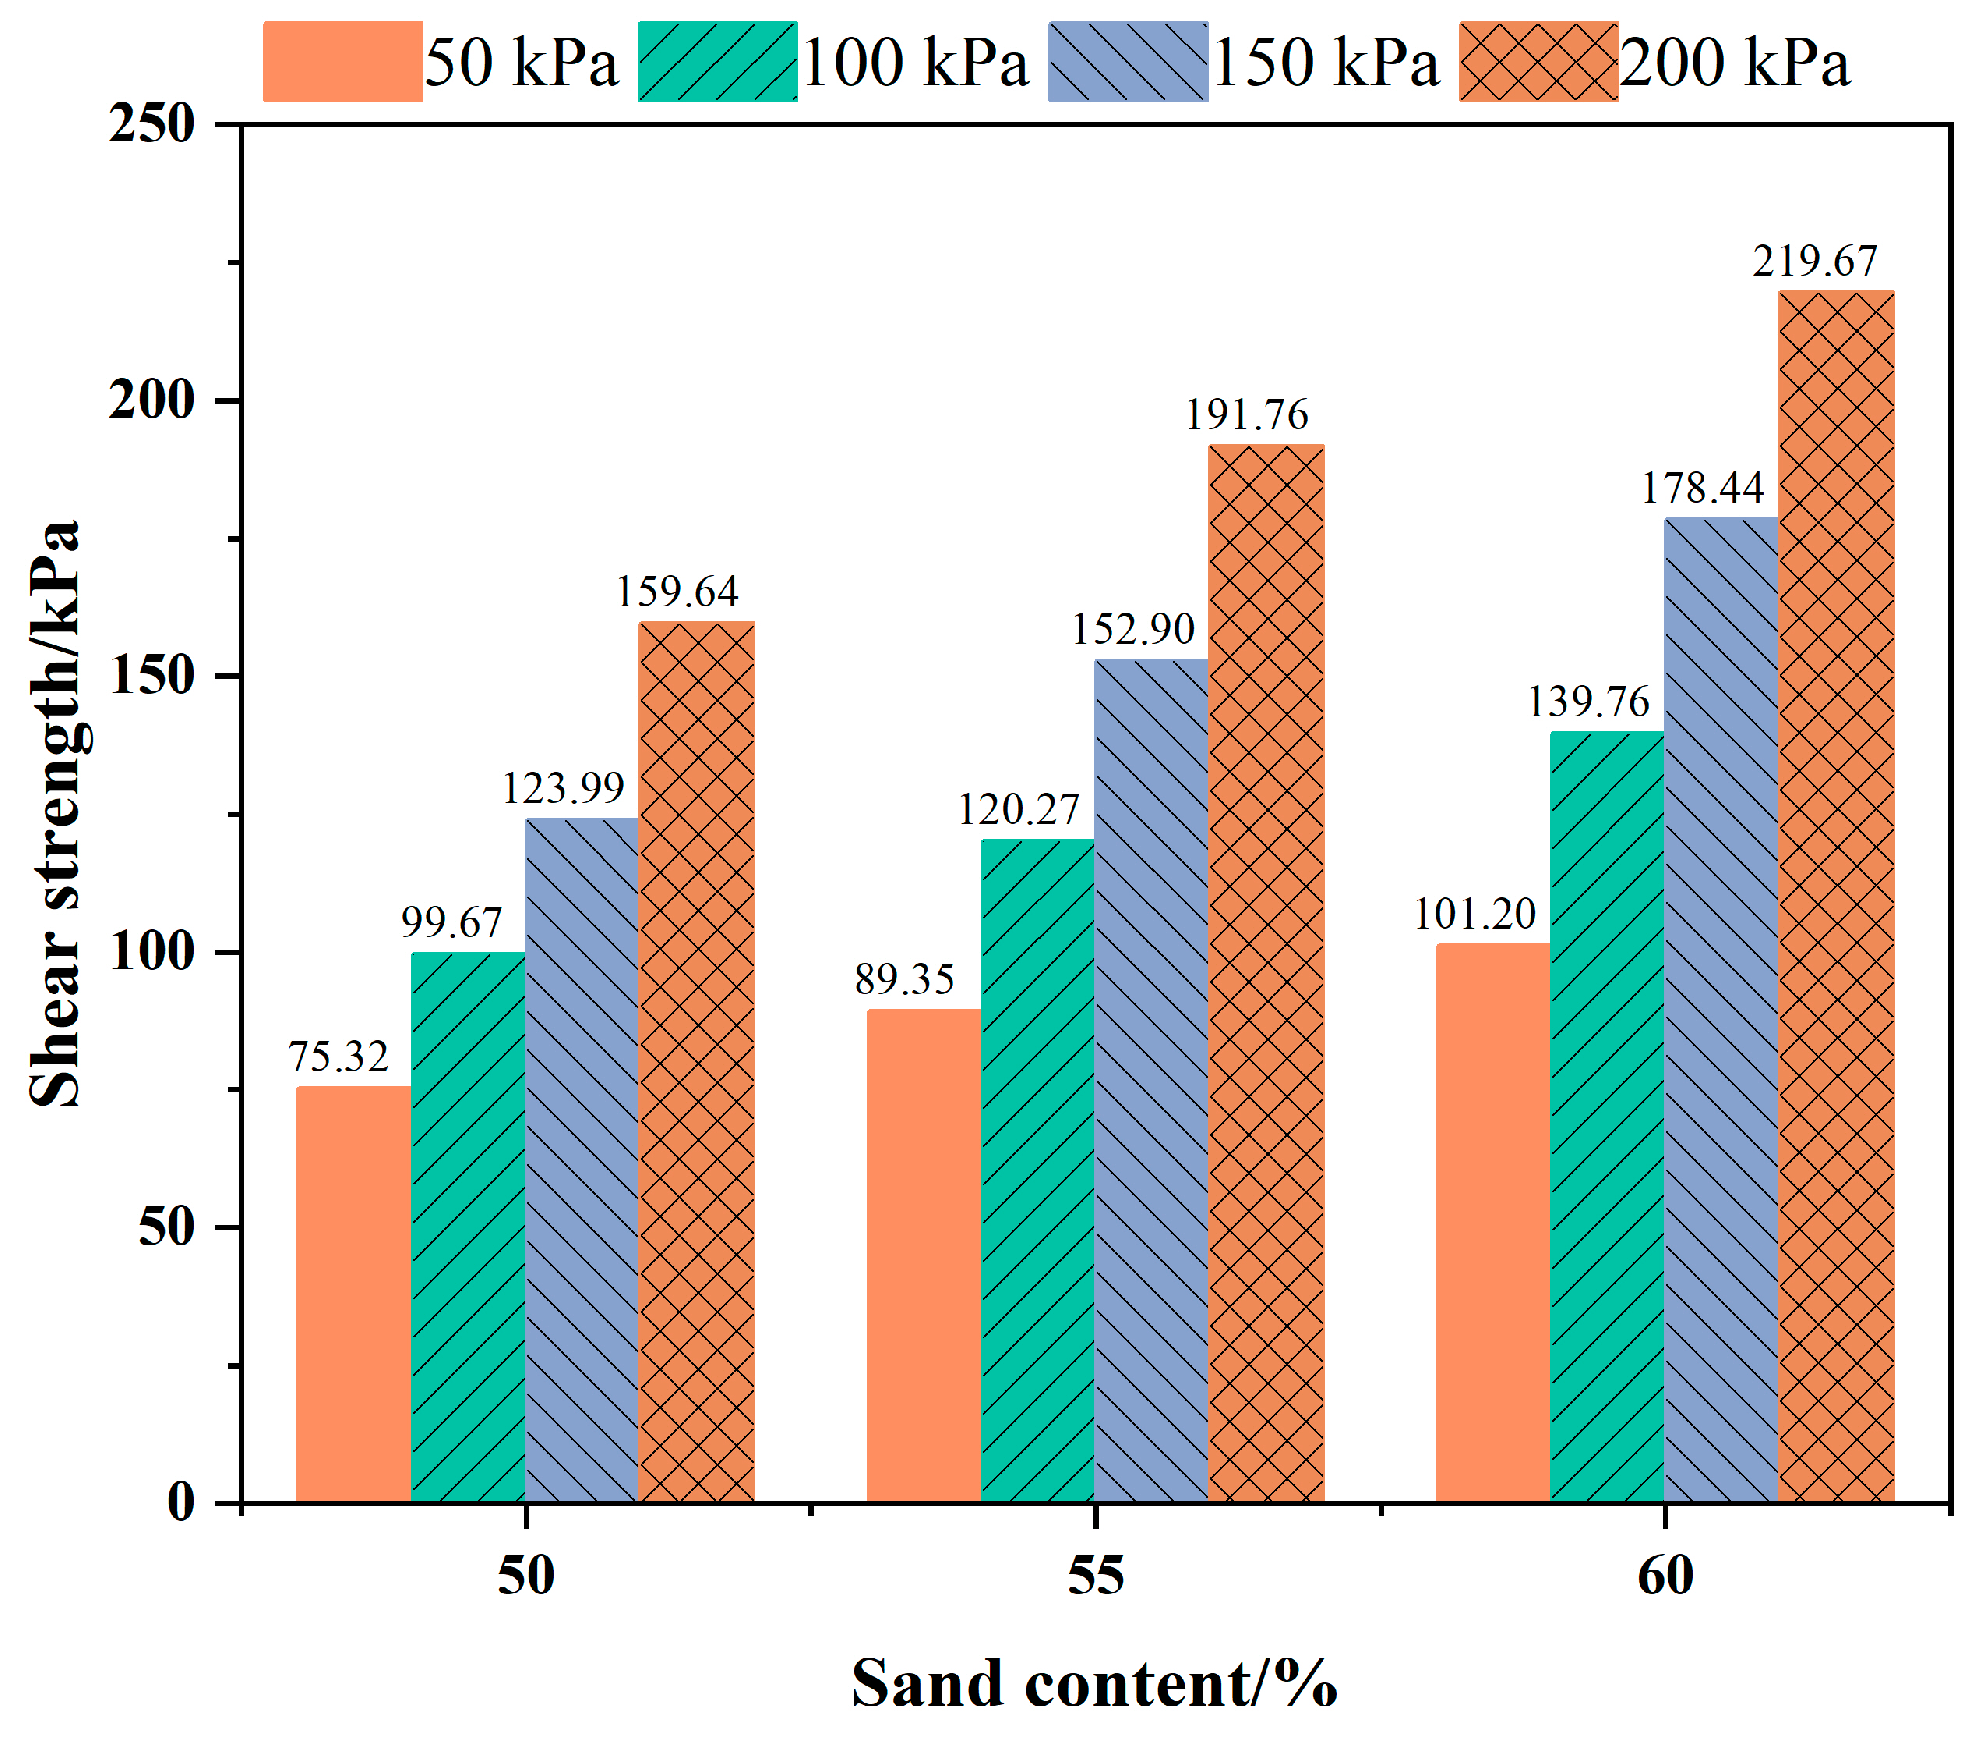
For the specimens that did not undergo freezing and thawing, it can be seen from Figure 7 that even with different sand contents, the shear stress at the anchor-soil contact surface increases with increasing confining pressure, and the peak displacement also increases gradually, which shows that the anchor is subjected to the stress of the soil, which has a great influence on the shear stress at the interface. The maximum value of the curve into the residual strength stage is taken as the shear strength, which is 75.32 kPa, 99.67 kPa, 123.99 kPa, and 159.64 kPa for the specimens with 50 percent sand content with peripheral pressures of 50 kPa, 100 kPa, 150 kPa, and 200 kPa, respectively. The shear strengths at 100 kPa, 150 kPa, and 200 kPa are approximately 1.32, 1.64, and 2.12 times that of the shear strength at 50 kPa, respectively. For the 55% sand content specimen, the shear strength at 200 kPa is 2.14 times the shear strength at 50 kPa, and for the 60% sand content specimen, the shear strength at 200 kPa is 2.17 times the shear strength at 50 kPa. This shows that the shear strength is linearly correlated with the confining pressure, and the greater the confining pressure is, the greater the shear strength. The reason for this phenomenon is as follows: anchor-soil shear action will form a shear zone at the interface; in the pulling process, the solid anchor is not easy to deform due to its rigid body, so the soil particles within a certain distance around the anchor will rotate. With increasing confining pressure, the area and thickness of the shear zone increases, and the shear strength also increases.
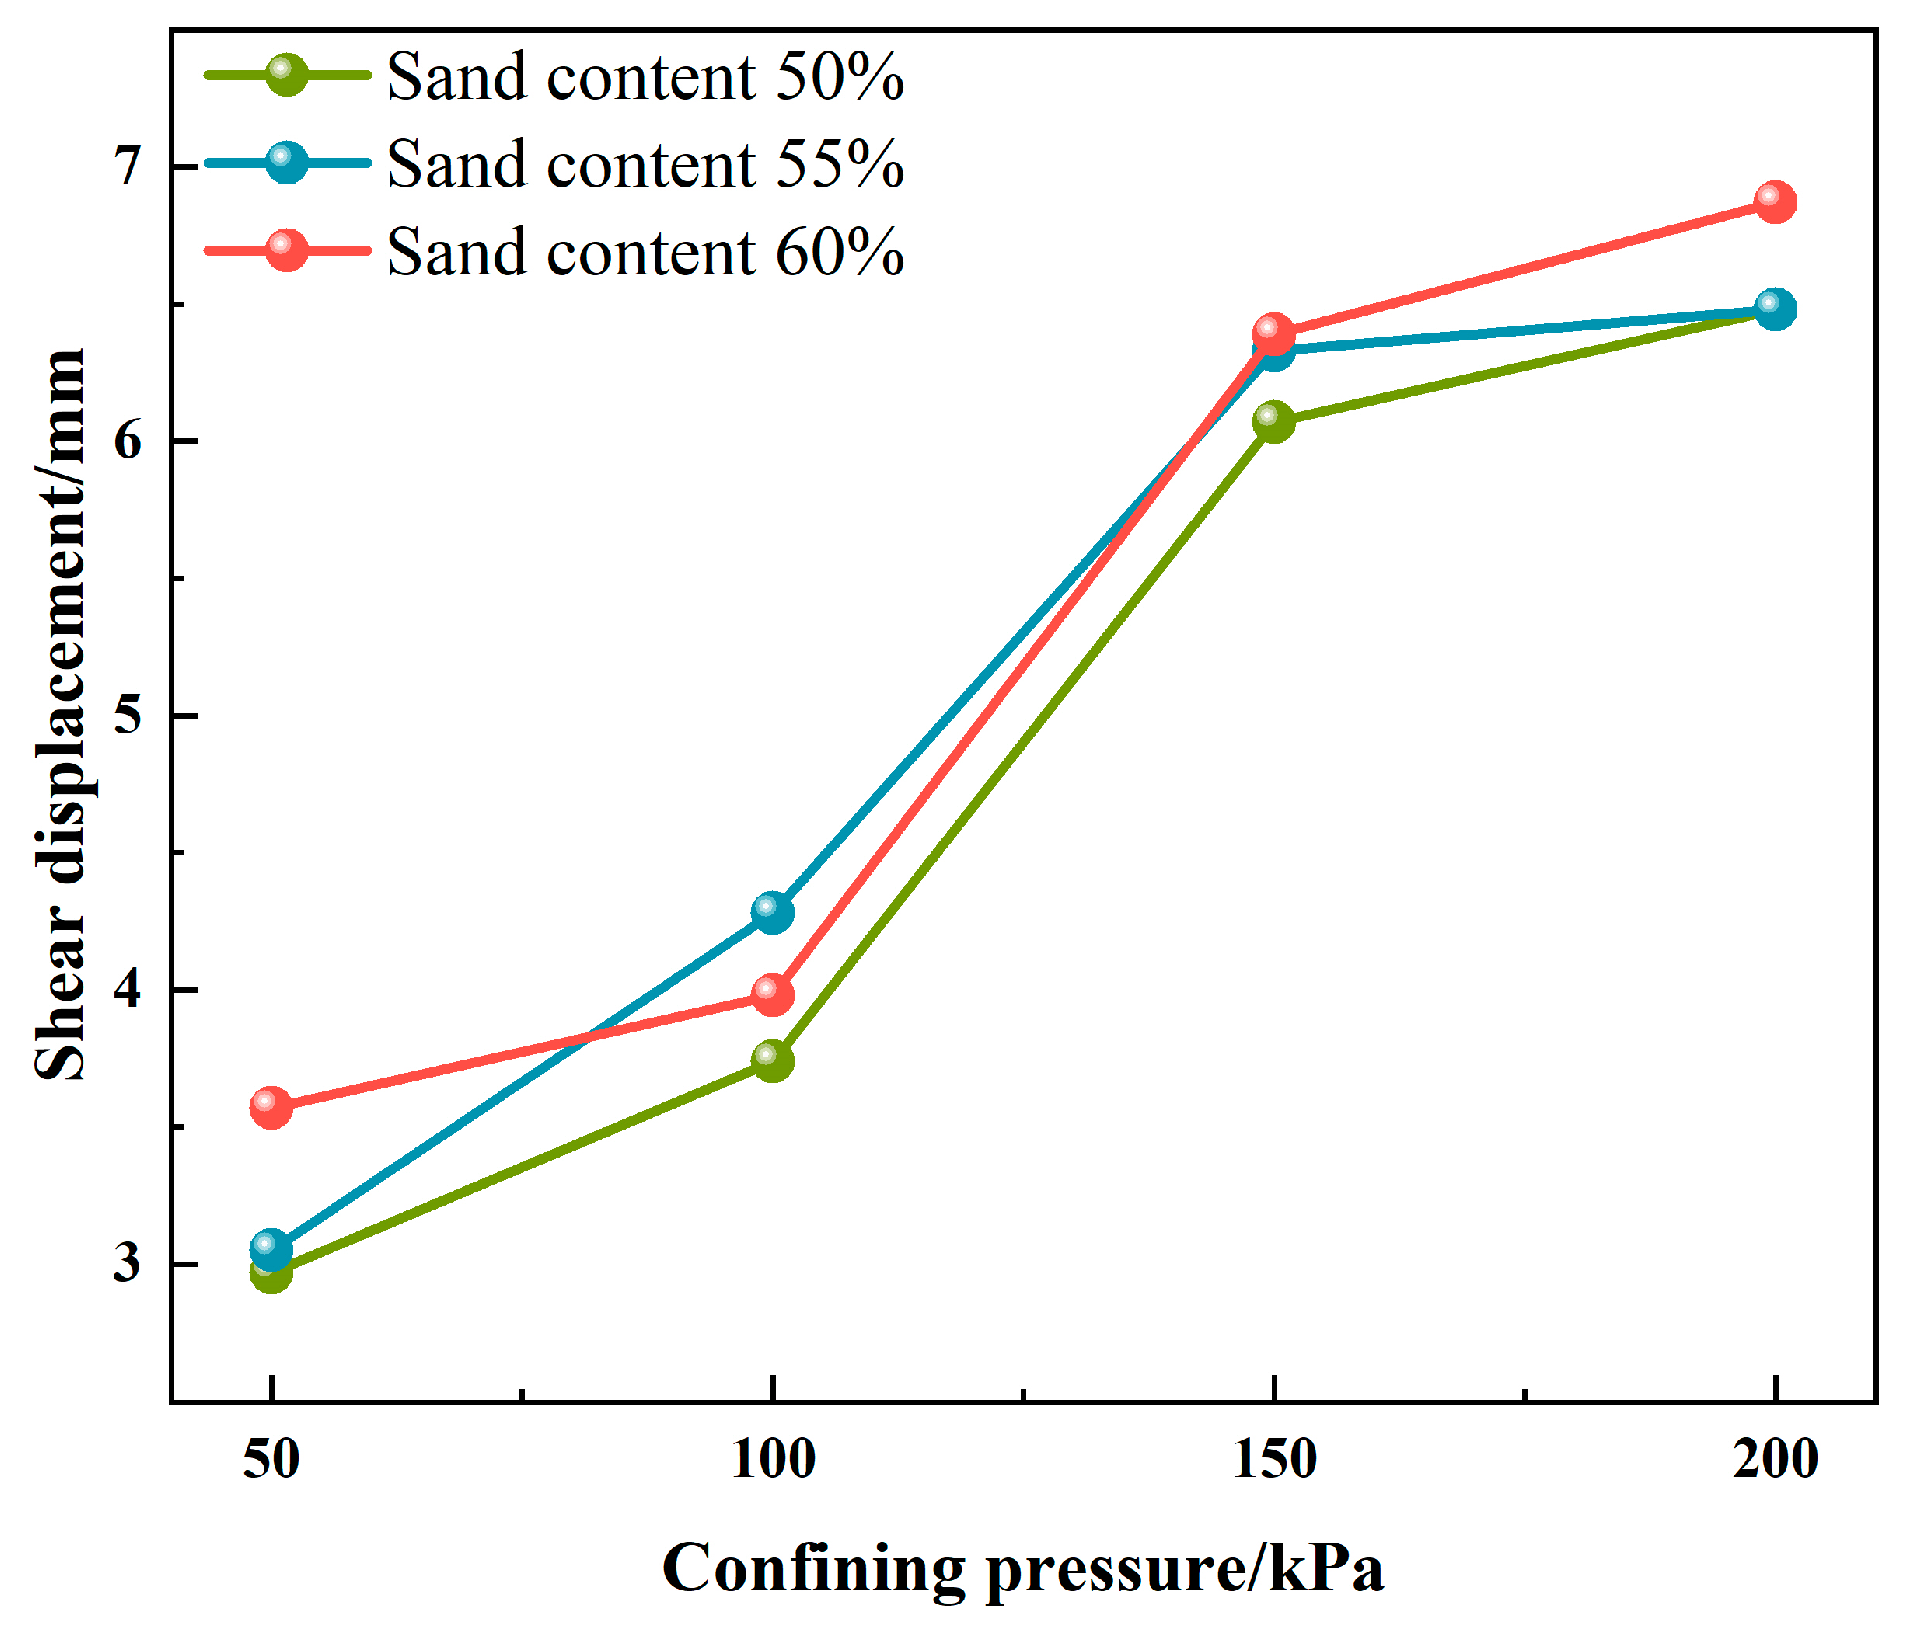
The variation in the displacements corresponding to the peak shear strength is shown in Figure 8. The shear displacements associated with different confining pressures (50 kPa, 100 kPa, 150 kPa, and 200 kPa) for varying sand content percentages (50%, 55%, and 60%) were measured. For a 50% sand content, the shear displacements were found to be 2.97 mm, 3.74 mm, 6.07 mm, and 6.48 mm, respectively. Similarly, for a 55% sand content, the corresponding shear displacements were 3.05 mm, 4.28 mm, 6.33 mm, and 6.49 mm. Finally, for a 60% sand content, the shear displacements at peak shear strengths were recorded as 3.57 mm, 3.98 mm, 6.39 mm, and 6.87 mm at the same confining pressures. It can be concluded that, the greater the applied confining pressure, the greater the displacement of the anchor-soil interface at the peak stress. The smaller circumferential constraints on the anchor and surrounding soil at low confining pressures result in smaller bonding and friction forces at the anchor-soil interface, making it easier for the anchor to reach the stage of plastic deformation and undergo a smaller displacement at the peak strength. At the same confining pressure, the displacement corresponding to the peak strength increases from 2.97 mm to 3.57 mm at 50 kPa when the sand content of the soil body increases from 50% to 60%; it increases from 3.74 mm to 3.98 mm at 100 kPa, from 6.07 mm to 6.39 mm at 150 kPa, and from 6.48 mm to 6.87 mm at 200 kPa. Under the same confining pressure, as the sand content increases, the peak value also slightly increases.

3.2.2. Numerical Simulation

This paper employs the FLAC3D 6.0 finite difference software for numerical simulation. The numerical simulation matches the size of the indoor test specimens, and the ratio of the diameter of the test samples to the anchor body should be no less than five, which can effectively reduce the impact of boundary constraint effects. The model consists of two parts: the anchor body and the soil. The soil layer is silty sand, and the soil constitutive model uses an elastic−plastic model, with the elastic part described by a linear elastic model and the plastic part replaced by the Mohr−Coulomb model. The soil has a diameter of 15 cm and a height of 12 cm. The anchor body is simulated using an elastic model, and the effect of density on the gravitational field is neglected, as shown in Figure 9. The simulation is validated by shear tests on specimens with a 50% sand content, and the material parameter assignments are listed in Table 5. The soil is constrained vertically on all sides and the bottom. To prevent model oscillation due to the initial application of force, given the small size of the specimen model, the simulation process uses velocity loading. During the velocity loading process, the velocity does not remain constant; it starts from zero and increases with a constant slope to prevent excessive displacement at the beginning that could damage the model before then maintaining a predetermined value.
The contact surface employs a statistical damage model, assuming that the micro-element failure follows a two-parameter Weibull distribution with the contact surface shear strain (γ > 0) as the random variable [36], and its probability density function is:
P ( γ ) = m n ( γ η ) m 1 exp [ ( γ η ) m ]
In the formula, m and η represent the shape parameter and the scale parameter, respectively. Integrating the probability density function yields the cumulative distribution function P(γ). Since the total number of micro-elements on the contact surface is N, the number of damaged micro-elements on the contact surface at shear strain γ is:
N ( γ ) = N 0 γ P ( γ ) d γ
Substituting Equation (5) into Equation (6) yields the evolution equation of the damage variable. That is,
D = 1 exp [ ( γ η ) m ]
For the anchor-soil interface, the contact surface strength is jointly provided by the damaged and undamaged parts, and the shear stress relationship on the contact surface satisfies the following formula:
τ = τ ( 1 D ) + τ D
In the formula, τ, τ′, and τ″ represent the apparent shear stress on the contact surface, the shear stress of the undamaged part, and the shear stress of the damaged part, respectively. For the undamaged micro-elements, it is assumed that their constitutive relationship is a nonlinear elastic relationship, which is hyperbolic. For the damaged micro-elements, it is assumed that they can still provide a constant shear strength through the frictional resistance between the anchor and the soil under the action of normal stress.
Substituting Equation (7) into Equation (8) yields the statistical damage constitutive model for the anchor-soil contact surface.
τ = γ a + b γ exp [ ( γ η ) m ] + τ 1 exp [ ( γ η ) m ]
In numerical simulation, the contact surface employs the statistical damage model from the aforementioned formula. The FISH language is utilized for secondary development of the contact elements inherent in FLAC3D, and the developed model is applied to numerically simulate shear tests of the anchor-soil contact surface, analysing the relationship between shear stress and shear displacement.
Figure 10 shows the variation in shear stress for the anchor under four different confining pressures of 50, 100, 150, and 200 kPa, both in simulation and actual measurement. It can be observed from the figure that the simulated curves match well with the actual measured data points. Both simulation analysis and field measurement data consistently show that there is a positive correlation between the pull-out resistance of the anchor.

3.2.3. The Influence of Sand Content on the Shear Strength of an Anchor-Soil Contact Surface

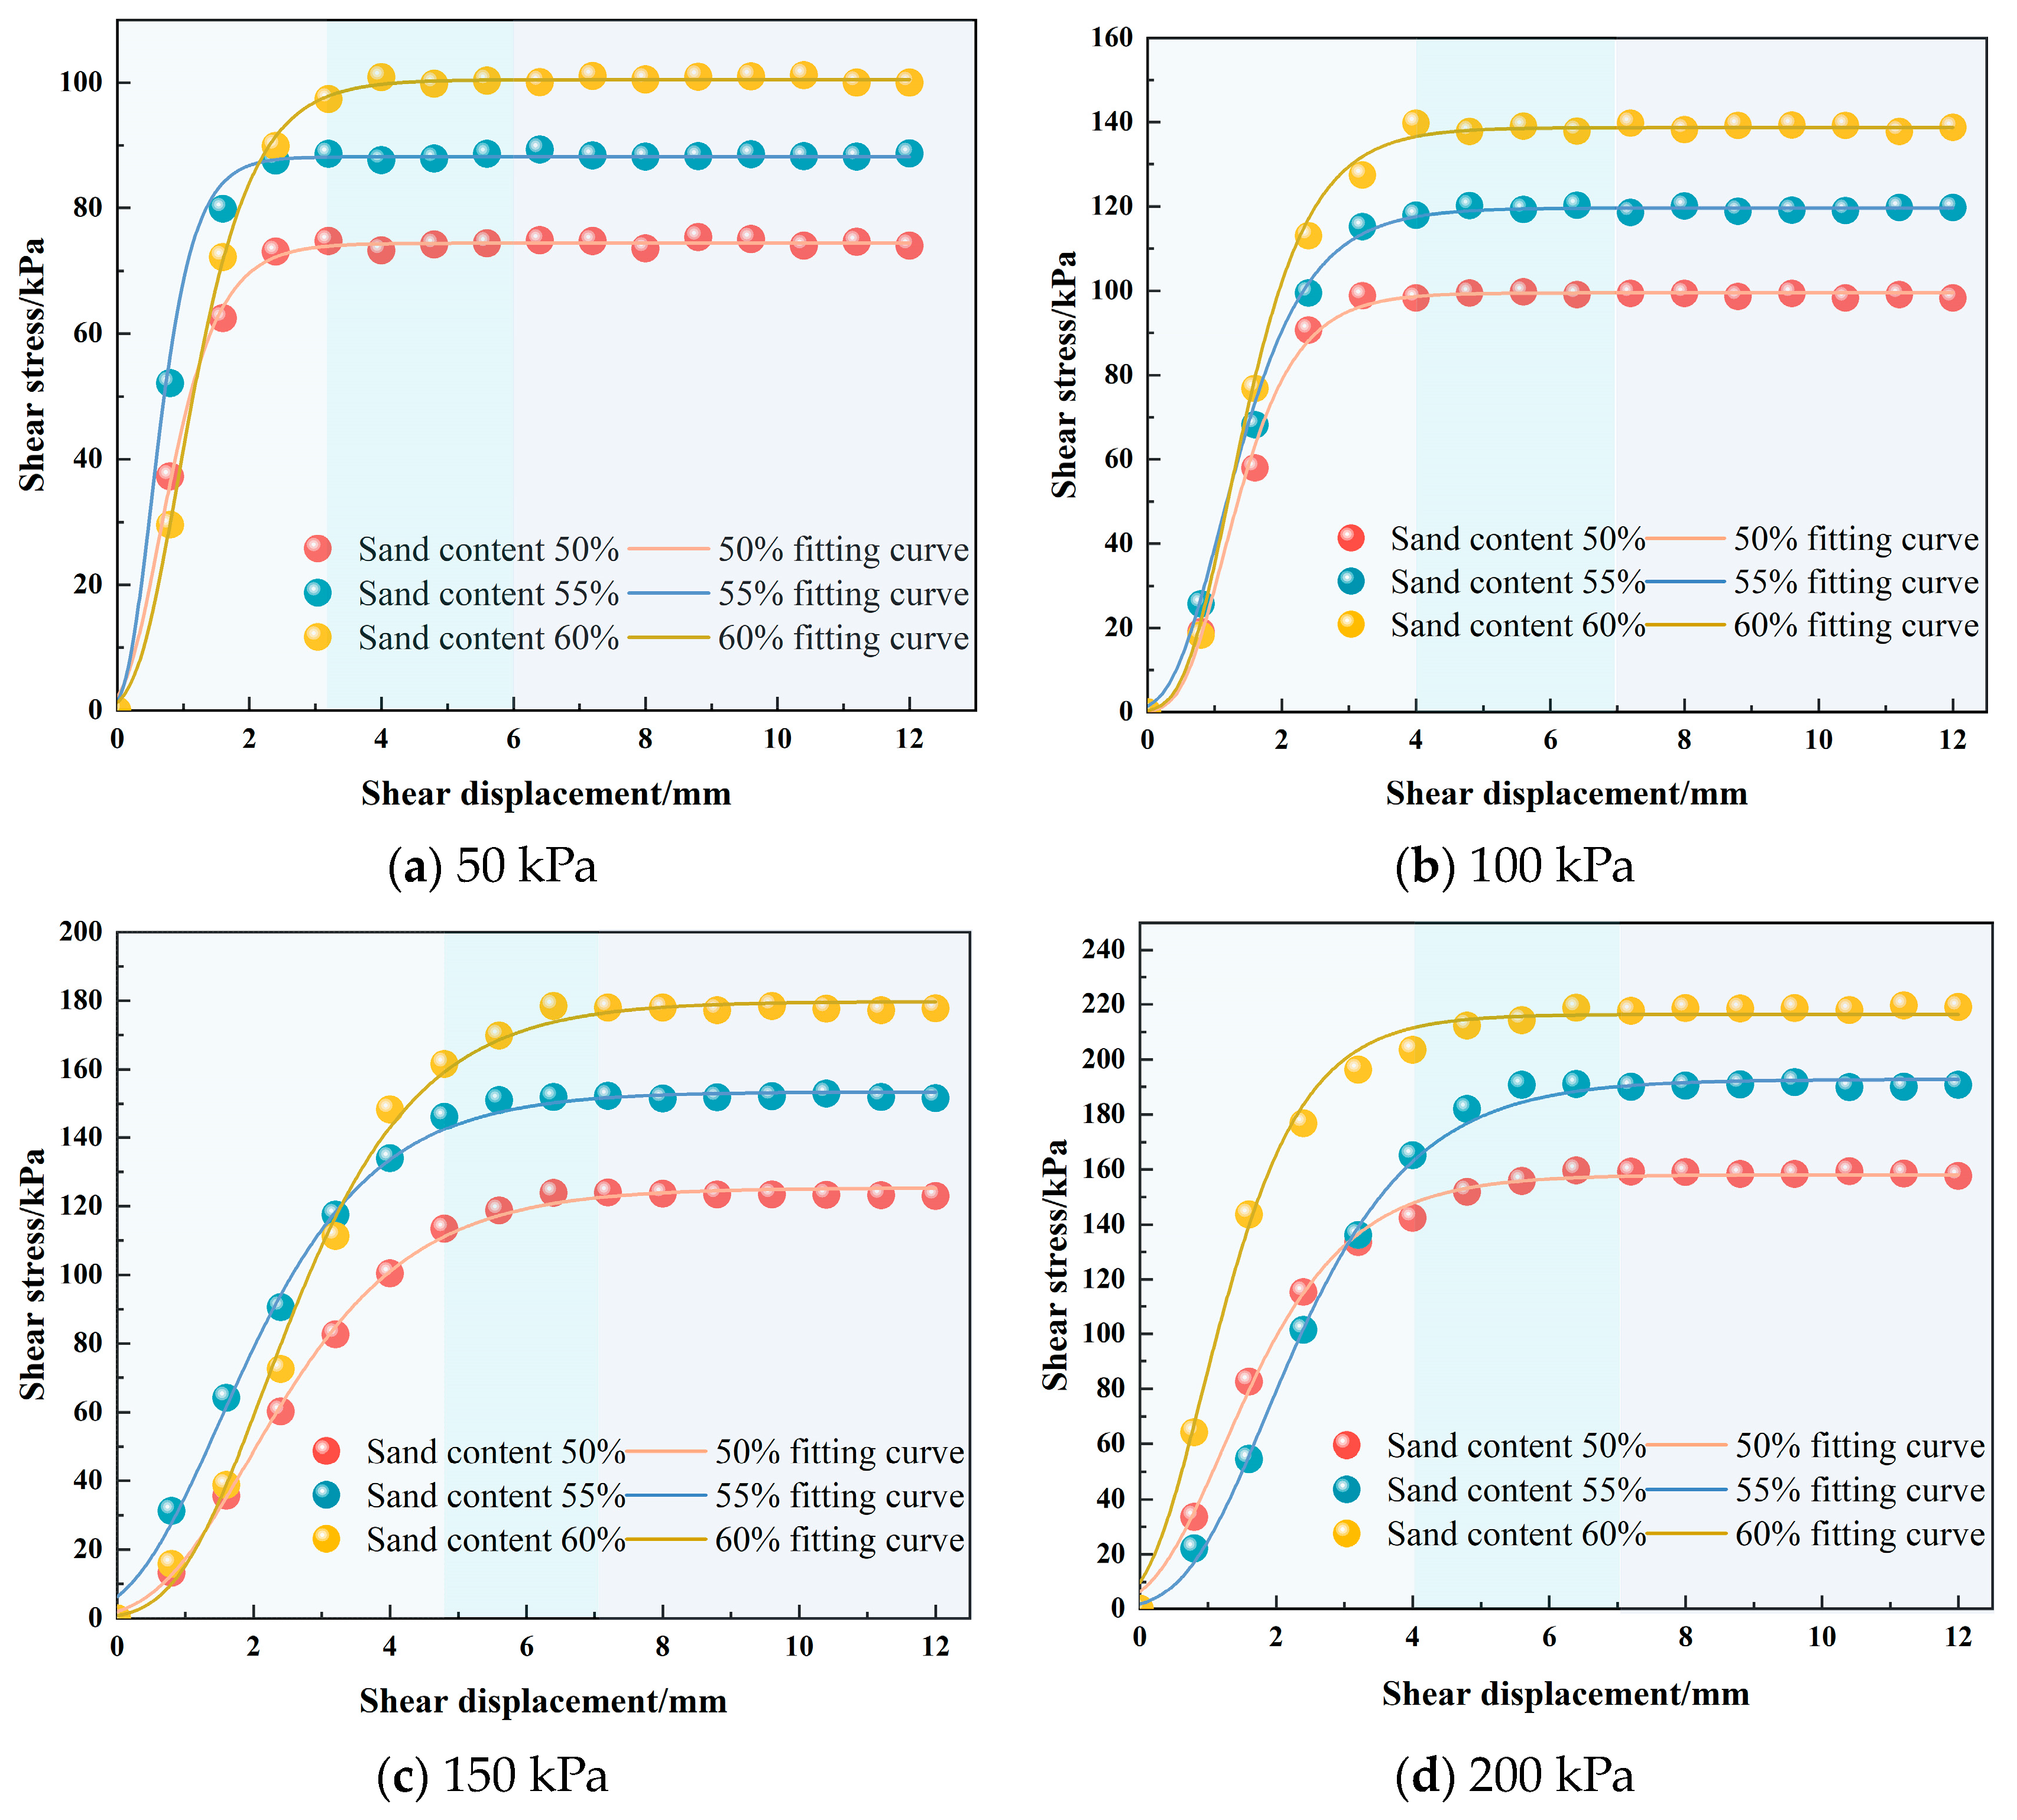
As can be seen from the shear displacement curves in Figure 11, under the same confining pressure, an increase in sand content drives the increase in the shear strength of the anchor-soil interface and slightly increases the corresponding peak displacement, and the shear strength is positively correlated with the confining pressure. As shown in Figure 12, under the condition of 50 kPa, the shear strengths of the anchor-soil interfaces for specimens with a 50% sand content, 55% sand content, and 60% sand content are 75.32 kPa, 89.35 kPa, and 101.20 kPa, which are 1.19 times and 1.35 times higher than that for a specimen with a 50% sand content, respectively. The anchor-soil interface shear strength of a specimen with a 55% sand content increases by 14.02 kPa compared with that with a 50% sand content, and those with a 60% sand content increase by 11.84 kPa compared with those with a 55% sand content. The increase in sand content leads to a gradually diminishing increment in shear strength.

3.2.4. Influence of Freeze-Thaw Cycling on the Strength of a Contact Surface

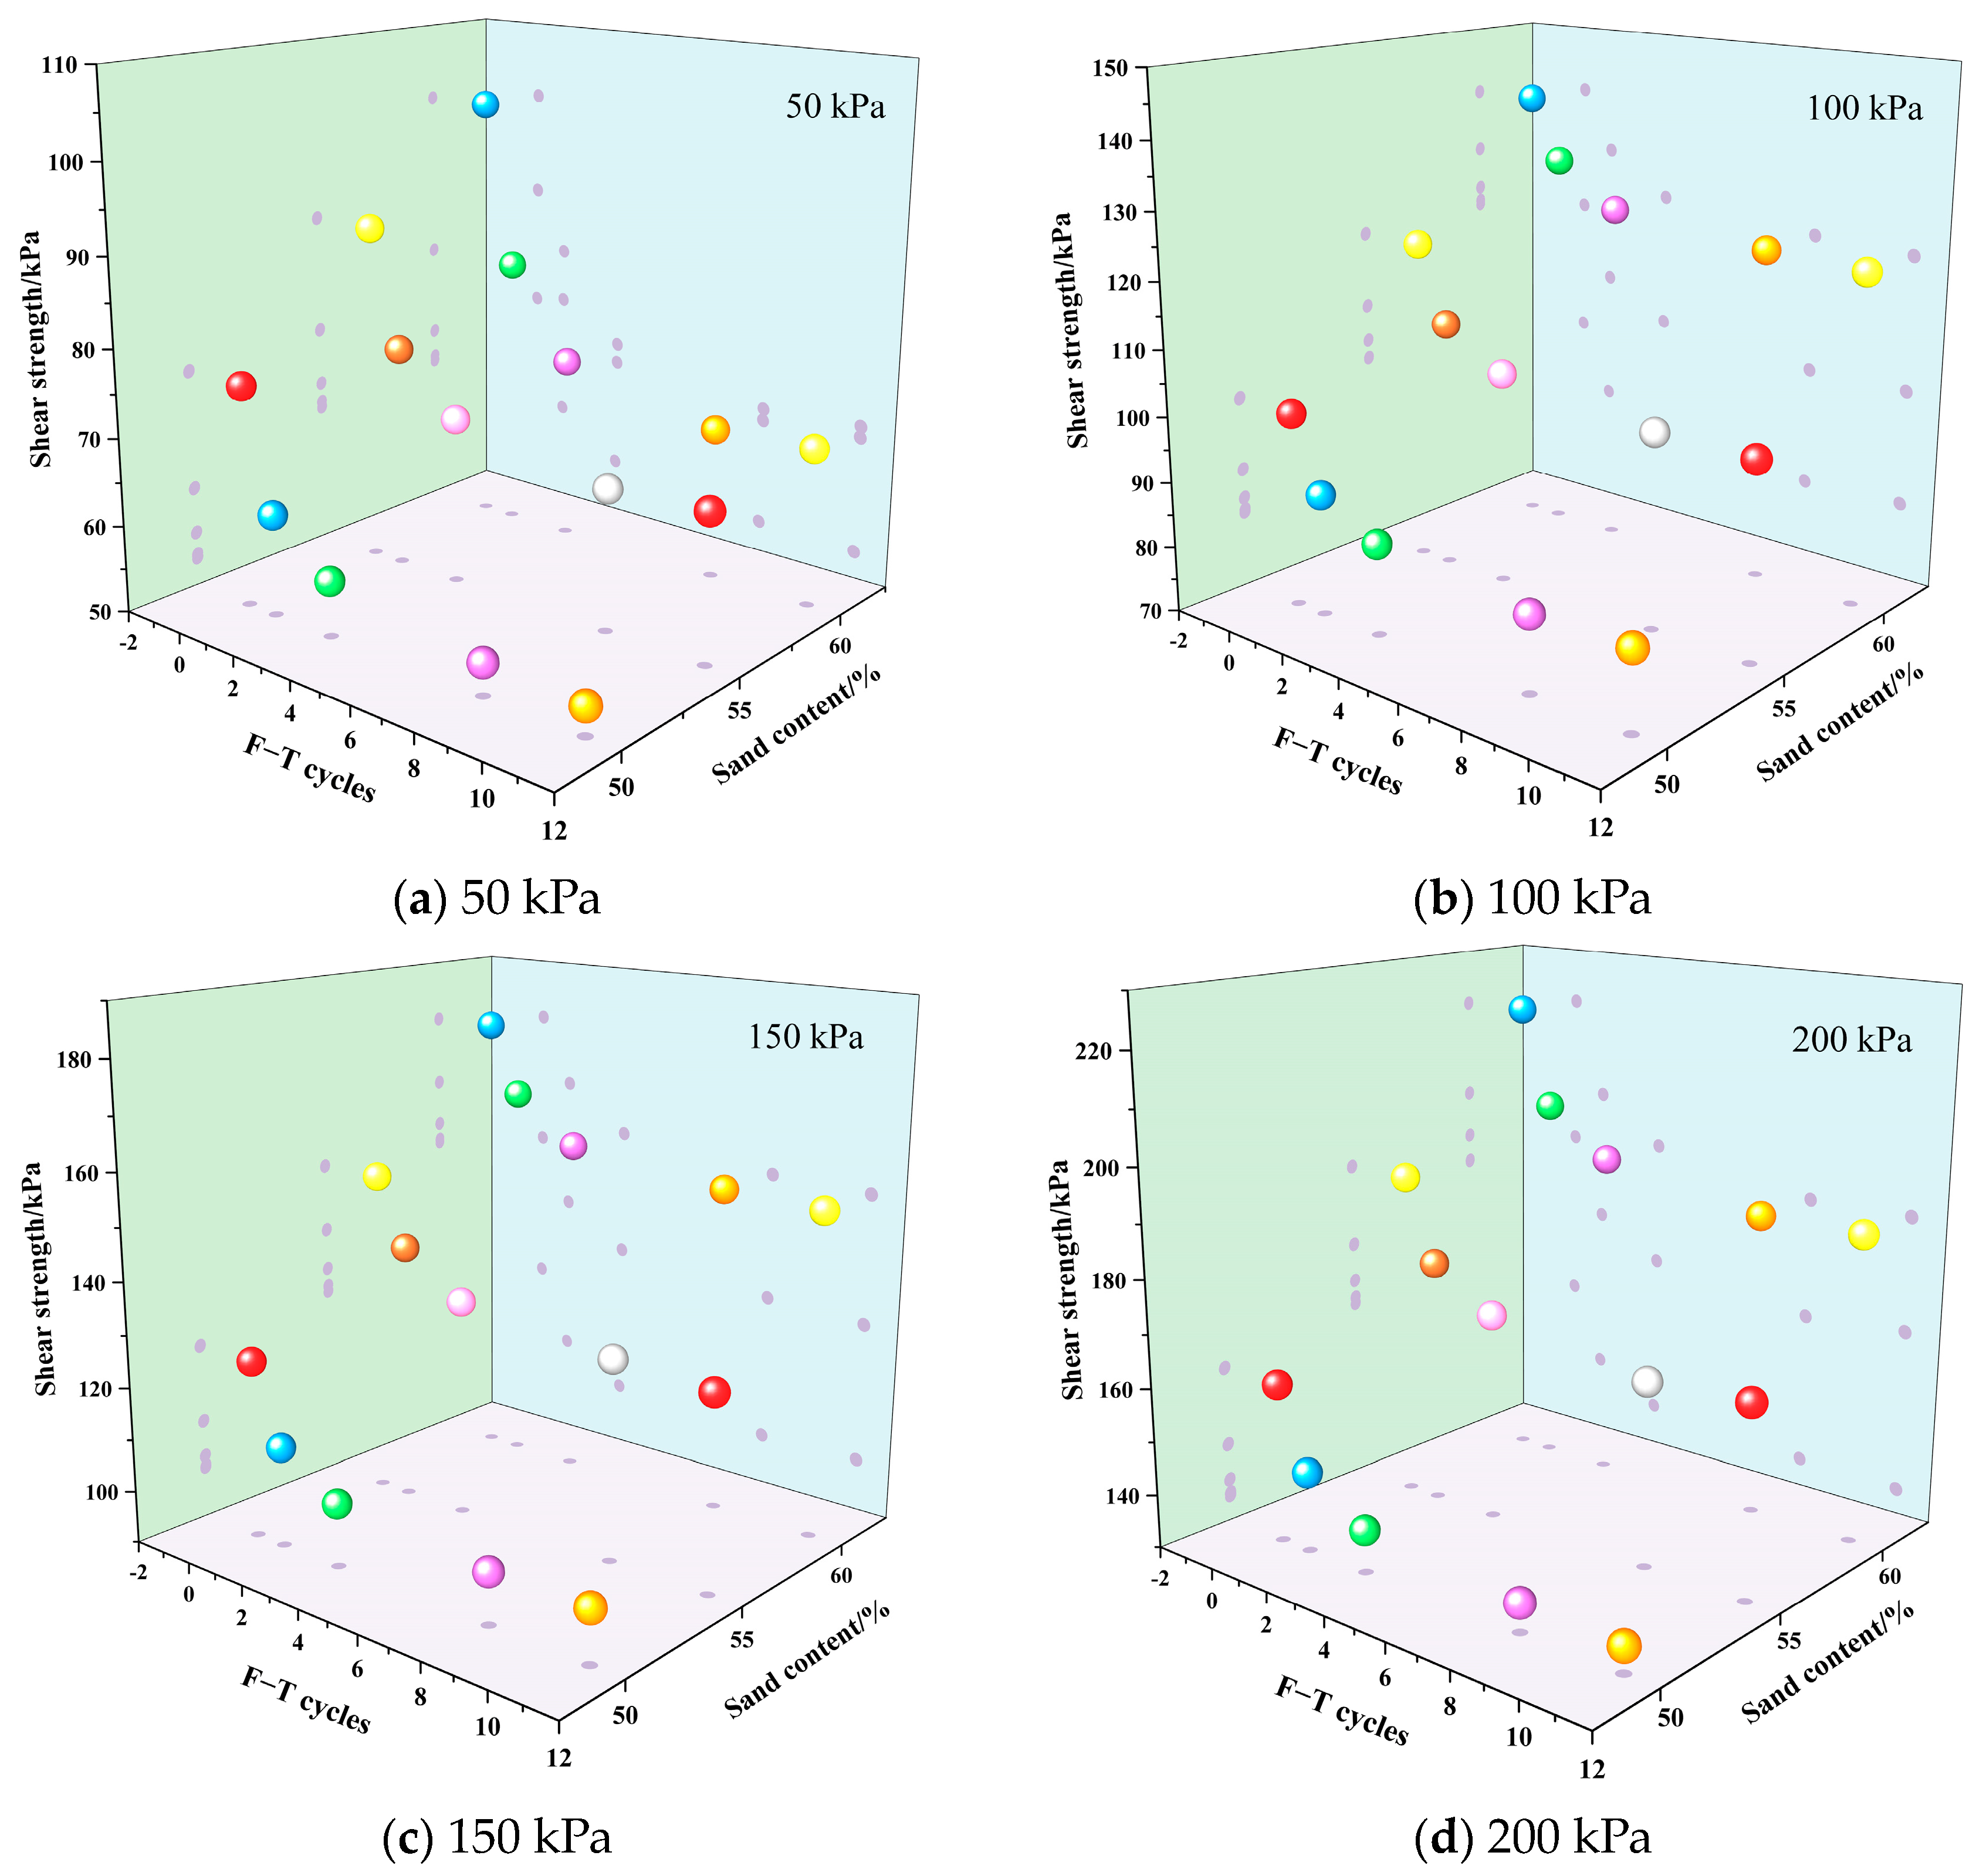
Figure 13 displays three-dimensional scatter plots illustrating the variation in contact surface shear strength across different levels of confining pressures and varying numbers of freeze-thaw cycles.
Freeze-thaw cycles significantly reduce the shear strength of the anchor-soil interface. The reduction in shear strength due to freeze-thaw cycles increases with the number of cycles, reaching a stable level after eight cycles. As shown in Figure 13a, when the confining pressure is 50 kPa, the specimens with sand contents of 50%, 55%, and 60% are damaged by freeze-thaw cycles and the shear strength of the anchor-soil interface decreases by 29.3%, 25.1%, and 32.5%, respectively; when the confining pressure is 200 kPa, the shear strength of the anchor-soil interfaces for specimens with sand contents of 50%, 55%, and 60% decrease by 15.6%, 13.6%, and 14.6%, respectively. After stabilisation by 11 freeze-thaw cycles, the soil is subjected to freeze-thaw damage in the range of 15–30%. When the confining pressure increases, the freeze-thaw cycle damage decreases by nearly half, so it can be seen that the change in the confining pressure has a great influence on the damage during freeze-thaw cycles.
Comparing the results of freeze-thaw damage under different sand content, the freeze-thaw damage rates of 50–60% sand content under 100 kPa confining pressure were 17.7%, 16.8%, and 13.4%, respectively. The increase in sand content reduces the decrease in the shear strength due to freeze-thaw cycles and helps to improve the resistance of anchors to freeze-thaw effects. Because of the high sand content of the soil, the particle gradation is uniform, and the arrangement between particles is more compact. The sand particles have a high shear strength and freeze-thaw resistance, which can better withstand the stress and deformation caused by freeze-thaw cycles and, thus, are less prone to breakage or deformation than clay particles.

3.2.5. Influence of Freeze-Thaw Cycles on the Apparent Cohesion and Internal Friction Angle of the Contact Surface

Based on the shear strengths of the anchor-soil interface obtained in the previous section for different numbers of freeze-thaw cycles, the Coulomb damage criterion is used to fit the experimental data and determine the internal friction angle and cohesion at the anchor-soil interface.
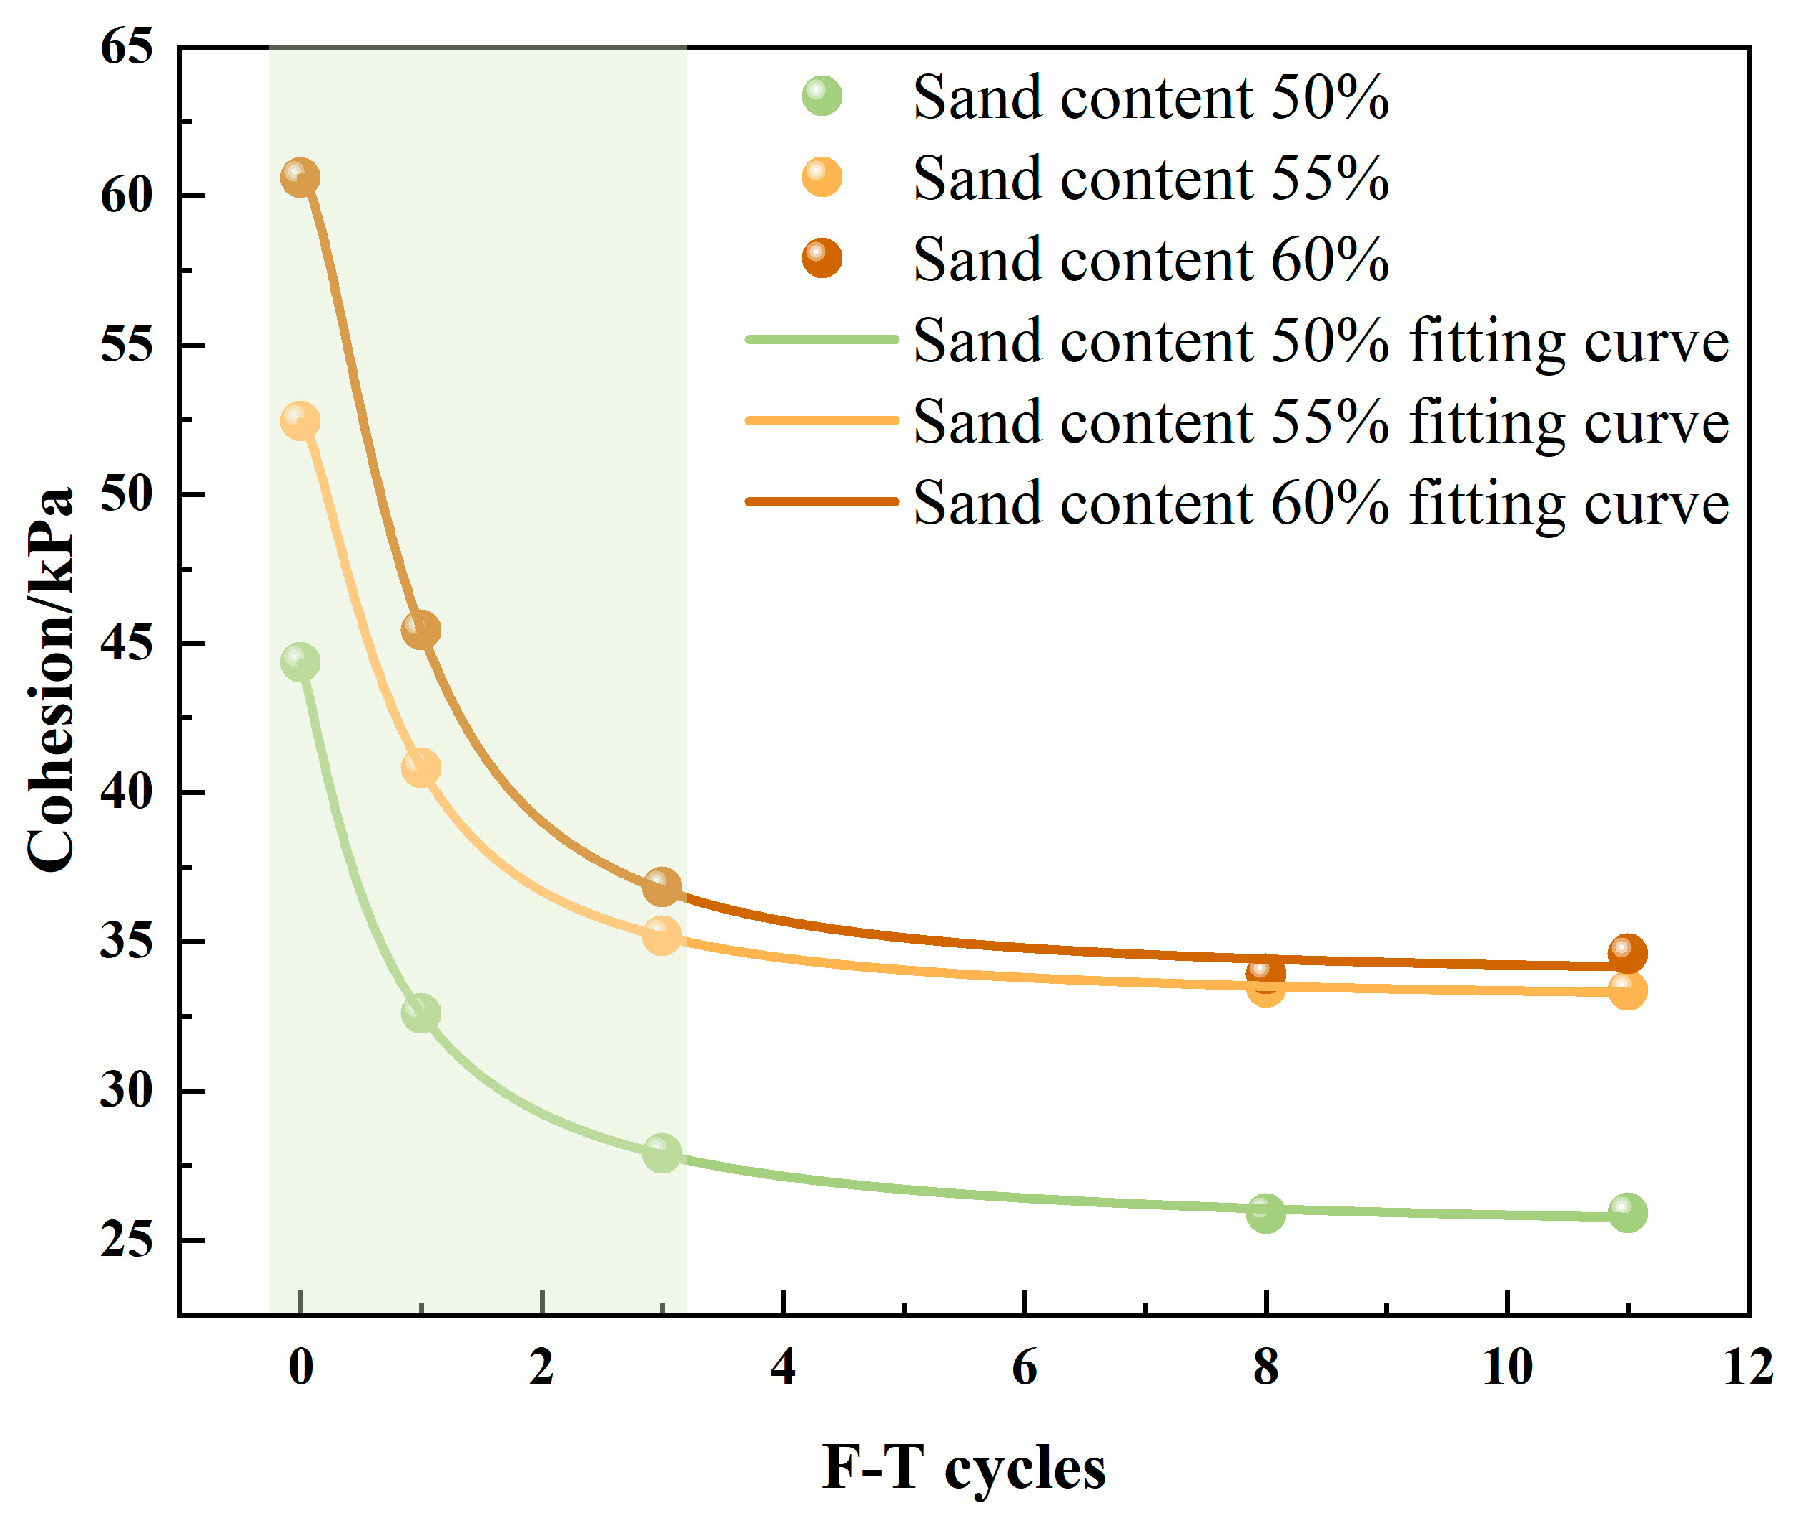
Figure 14 shows the damage curve of cohesion at the anchor-soil interface under freeze-thaw cycles; with the increase in the number of freeze-thaw cycles, the cohesion decreases, and the cohesion decreases the most with the first freeze-thaw cycle. The cohesions of the specimens with sand contents of 50%, 55% and 60% decrease by 26.2%, 21.6%, and 23.9%, respectively. After the first three freeze-thaw cycles, the soil damage is basically completed, and the cohesion of the specimens with 50%, 55%, and 60% sand contents decreases by 35.3%, 32.4%, and 39.4%, respectively. Then, as the number of freeze-thaw cycles continues to increase, the cohesion decreases slightly, and the cohesion remains stable after eight cycles. When not subjected to freezing and thawing, the cohesive forces of the specimens with 50%, 55% and 60% sand content are 45.33 kPa, 53.60 kPa and 61.24 kPa, respectively. As the sand content of the specimen increases, the volume and surface area of sand also increase, leading to a larger contact area between the particles. This results in a greater distribution of the water film on the surface of the sand particles, which in turn generates a higher adhesive cohesion.
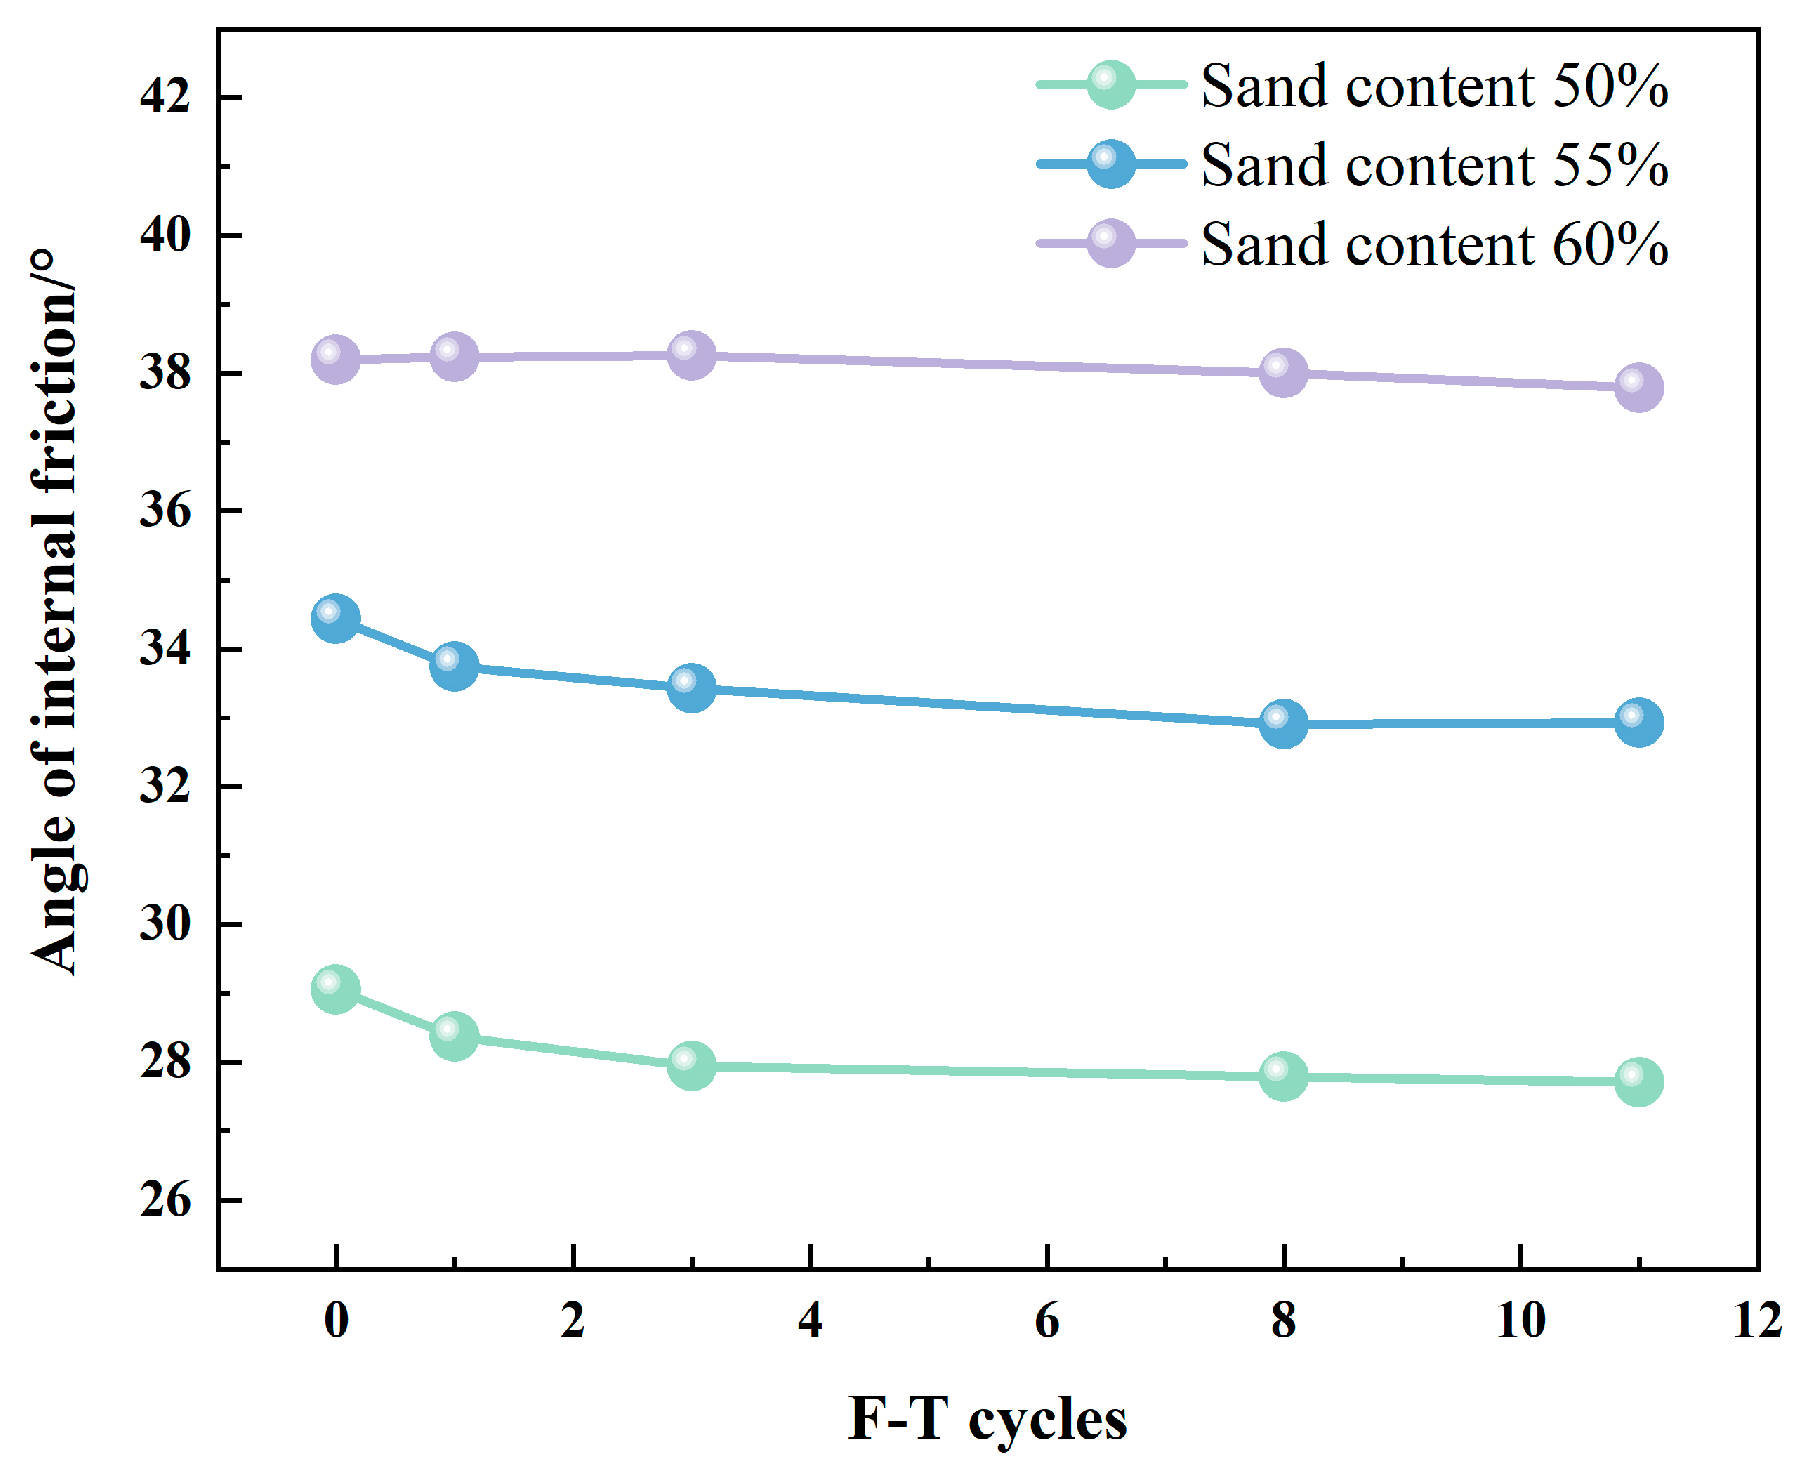
Figure 15 shows the curve of the variation in the internal friction angle. The internal friction angle is affected by the first few freeze-thaw cycles, but only slightly. The internal friction angle does not change much during the freeze-thaw process, the internal friction angle of the soil with a 50% sand content decreases from 29.1° to 27.7°, the internal friction angle of the soil with a 55% sand content decreases from 34.2° to 32.9°, and the internal friction angle of the soil with a 60% sand content decreases from 38.2° to only 37.9°. In general, under the action of freeze-thaw cycles, the internal friction angle at the anchor-soil interface of samples with different sand content will slightly decrease, but the decrease is not significant.

4. Discussion

The current research on the shear performance between soil and structures often employs direct shear tests [33]. However, these tests have several limitations, including unstable shear areas, interface shapes that do not match actual conditions, and difficulties in precisely controlling the forces on the anchor body, leading to failure in accurately reflecting the stress state of anchors in engineering applications.
This paper conducted an in-depth analysis of the shear characteristics of anchors in sandy soil under freeze-thaw cycles in northern China and found that, as the sand content in the specimens increased, the interface shear strength between the anchor and soil significantly improved. Specifically, under a confining pressure of 50 kPa, the interface shear strength at a sand content of 60% was 1.34 times that at a sand content of 50%. This indicates that an increase in sand content helps to enhance soil density and strengthen the interlocking effect between sand particles, thereby increasing cohesion and the angle of internal friction, and thus enhancing shear strength.
The impact of freeze-thaw cycles on the strength of the anchor interface was also discussed. After the first freeze-thaw cycle, the interface strength suffered the greatest damage, but as the number of cycles increased, the cohesion and angle of internal friction gradually decreased, stabilising after eight cycles. This pattern is similar to the research findings of Jiankun Liu [28]. This is because the volume expansion and contraction caused by the phase change in ice and water during the freeze-thaw process damaged the connections between soil particles, leading to a reduction in cohesion and the angle of internal friction.
Despite providing valuable insights, this paper has some limitations. Firstly, the standardized sandy soil used in the experiments may not fully simulate the complex conditions on site. Secondly, although the mechanism of the shear strength of the anchor-soil interface was explained from a macro perspective, the processes of ice−water phase change, soil deformation, and their superimposed modes at the micro level are not yet clear.
To overcome these limitations, future research should delve into the following areas: further testing of the microstructure of specimens under different freeze-thaw cycles and at room temperature using scanning electron microscopy (SEM) to observe changes in soil particle morphology, pore structure, and aggregate structure, as well as to obtain a more accurate assessment of the shear strength of the anchor-soil interface through quantitative analysis of micro parameters. We should expand the scope of the research to consider the changes in the internal forces of anchors and the overall structural stability in the support of slopes with frame anchors in the seasonal freezing area, helping to build a connection between anchor research and engineering applications to provide more comprehensive guidance for engineering practice.

5. Conclusions

In the context of complex freeze-thaw conditions and severe soil sandification in the cold regions of northern China, the safety and stability of foundation-pit-anchoring engineering is of utmost importance. This paper conducts experiments using a self-developed anchor-soil shear-pull device to study the influence of factors such as sand content, con-fining pressure, and freeze-thaw cycles on the shear characteristics of the anchor-soil interface. Indoor model tests are used to analyse the pull-out and shear results and to con-struct a unified model of the anchor-soil interface behaviour. The main conclusions are as follows:
(1)
The pull-out model of anchor rods is different than the shear model, and both curves can be fitted using a comprehensive model and normalized, with the fitting results showing a high degree of agreement with the measured curves.
(2)
The increase in the confining pressure has a significant effect on the shear strength of the anchor-soil interface. With a 50% sand content, the shear strengths under 100 kPa, 150 kPa, and 200 kPa confining pressures are approximately 1.32, 1.64, and 2.12 times higher than that under 50 kPa pressure, respectively, and the corresponding peak displacement is also increased by more than two times. The pattern of peak displacements observed in soils with different sand content is consistent, with sand content having a small effect on peak displacements.
(3)
Under the same confining pressure, the shear strength of the anchor-soil interface is greatly affected by the sand content of the soil. Under the condition of 50 kPa, the anchor-soil interface shear strength with a 55% sand content and 60% sand content is 1.18 times and 1.34 times that of with a 50% sand content, respectively.
(4)
Freeze-thaw cycles significantly reduce the shear strength of an anchor-soil interface. Comparing the results of the decreases in shear strength for different sand content rates, the results with 50–60% sand contents are 19.3%, 16.7%, and 14.5%, respectively, under 50 kPa. The appropriate increase in sand content will improve the freeze-thaw resistance of the anchored soil body. The anchor soil with a sand content of 60% experiences an increase in confining pressure from 50kPa to 200kPa, resulting in a decrease in shear strength damage from 32.5% to 14.6%. After a freeze-thaw cycle, the cohesion of the soil specimens with different sand contents is reduced by more than 30%, and the decrease in the internal friction angle is very small.

Author Contributions

Conceptualisation, Y.-C.W.; methodology, Y.-C.W. and Z.-H.W.; validation, Y.-D.Z. and H.-F.Z.; formal analysis, F.-W.G., Y.-C.W. and Z.-H.W.; investigation, J.D. and Y.-D.Z.; resources, Y.-C.W. and H.-F.Z.; data curation, Y.-C.W., F.-W.G. and Z.-H.W.; writing—original draft preparation, Y.-C.W. and F.-W.G.; writing—review and editing, H.-F.Z. and Z.-H.W.; funding acquisition, J.D. All authors have read and agreed to the published version of the manuscript.

Funding

The research described in this paper was financially supported by the Natural Science Foundation of China (NO. 51878242), The Natural Science Foundation of the Hebei Province of China (NO. E2020404007), The Research Project of Young Top Talent in Hebei Province (BJK2024116), The Project of Research Start-up Fund (B-202307).

Institutional Review Board Statement

Not applicable.

Informed Consent Statement

Not applicable.

Data Availability Statement

The data presented in this study are available upon request from the corresponding author.

Conflicts of Interest

The authors declare no conflicts of interest.

References

  1. Yang, Z.; Peng, W.; Cao, J.; Xie, D. Application of Wireless Sensor Network in Rock Bolt Pulling Force Distribution Pattern Monitoring. Iop Conf. Ser. Earth Environ. Sci. 2019, 267, 042005. [Google Scholar] [CrossRef]
  2. Ho, S.C.M.; Li, W.; Wang, B.; Song, G. A load measuring anchor plate for rock bolt using fiber optic sensor. Smart Mater. Struct. 2017, 26, 057003. [Google Scholar] [CrossRef]
  3. Barnard, C.; Kallu, R.R.; Warren, S.; Thareja, R. Inflatable rock bolt bond strength versus rock mass rating (RMR): A comparative analysis of pull-out testing data from underground mines in Nevada. Int. J. Min. Sci. Technol. 2016, 26, 19–22. [Google Scholar] [CrossRef]
  4. Suksiripattanapong, C.; Horpibulsuk, S.; Udomchai, A.; Arulrajah, A.; Tangsutthinon, T. Pullout resistance mechanism of bearing reinforcement embedded in coarse-grained soils: Laboratory and field investigations. Transp. Geotech. 2020, 22, 100297. [Google Scholar] [CrossRef]
  5. Chen, A.; Wang, Q.; Chen, Z.; Chen, J.; Chen, Z.; Yang, J. Investigating pile anchor support system for deep foundation pit in a congested area of Changchun. Bull. Eng. Geol. Environ. 2020, 80, 1125–1136. [Google Scholar] [CrossRef]
  6. Sun, Y.; Li, Z. Analysis of Deep Foundation Pit Pile-Anchor Supporting System Based on FLAC3D. Geofluids 2022, 2022, 1699292. [Google Scholar] [CrossRef]
  7. Su, T.; Zhou, Y.; Wang, Z.; Ye, S. Large Scale Model Test Study of Foundation Pit Supported by Pile Anchors. Appl. Sci. 2022, 12, 9792. [Google Scholar] [CrossRef]
  8. Cui, G.; Ma, S.; Liu, Z.; Liu, S.; Xi, C.; Cheng, Z. Effect of freeze-thaw cycles on deformation properties of deep foundation pit supported by pile-anchor in Harbin. Rev. Adv. Mater. Sci. 2022, 61, 756–768. [Google Scholar] [CrossRef]
  9. Su, W.; Fragaszy, R.J. Uplift Testing of Model Anchors. J. Geotech. Eng. 1988, 114, 961–983. [Google Scholar] [CrossRef]
  10. Martín, L.B.; Tijani, M.; Hadj-hassen, F. A new analytical solution to the mechanical behaviour of fully grouted rockbolts subjected to pull-out tests. Constr. Build. Mater. 2011, 25, 749–755. [Google Scholar] [CrossRef]
  11. Ghadimi, M.; Shahriar, K.; Jalalifar, H. A new analytical solution for the displacement of fully grouted rock bolt in rock joints and experimental and numerical verifications. Tunn. Undergr. Space Technol. 2015, 50, 143–151. [Google Scholar] [CrossRef]
  12. Xi, X.H.; Gu, S.C. Shearing Stress Model of Damage Bolt in Tunnel. Appl. Mech. Mater. 2011, 90–93, 1761–1767. [Google Scholar] [CrossRef]
  13. Zhu, Z.; Shu, X.; Li, Z.; Tian, H.; Tian, Y. Stress analysis of full-length grouted bolt under shear deformation of anchor interface. J. Mt. Sci. 2022, 19, 3286–3301. [Google Scholar] [CrossRef]
  14. Chen, C.; Liang, G.; Tang, Y.; Xu, Y. A new method for indoor testing of interface characteristics between anchor solid and soil for anchor rods. J. Geotech. Eng. 2015, 37, 1115–1122. (In Chinese) [Google Scholar]
  15. Chang, D.; Liu, J. Review of the influence of freeze-thaw cycles on the physical and mechanical properties of soil. Sci. Cold Arid. Reg. 2013, 5, 457–460. [Google Scholar]
  16. Qi, J.; Vermeer, P.A.; Cheng, G. A review of the influence of freeze-thaw cycles on soil geotechnical properties. Permafr. Periglac. Process. 2006, 17, 245–252. [Google Scholar] [CrossRef]
  17. Konrad, J. Physical processes during freeze-thaw cycles in clayey silts. Cold Reg. Sci. Technol. 1989, 16, 291–303. [Google Scholar] [CrossRef]
  18. Chamberlain, E.J.; Gow, A.J. Effect of freezing and thawing on the permeability and structure of soils. Eng. Geol. 1979, 13, 73–92. [Google Scholar] [CrossRef]
  19. Leuther, F.; Schlüter, S. Impact of freeze-thaw cycles on soil structure and soil hydraulic properties. Soil 2021, 7, 179–191. [Google Scholar] [CrossRef]
  20. Nartowska, E.; Kozłowski, T. The Effect of Freeze-Thaw Cycling and the Initial Mass of Water on the Unfrozen Water Content of Calcium Bentonites Modified by Copper Ions. Minerals 2022, 12, 66. [Google Scholar] [CrossRef]
  21. Zhao, Y.; Hu, X. How Do Freeze-Thaw Cycles Affect the Soil Pore Structure in Alpine Meadows Considering Soil Aggregate and Soil Column Scales? J. Soil Sci. Plant Nutr. 2022, 22, 4207–4216. [Google Scholar] [CrossRef]
  22. Eskişar, T.; Altun, S.; Kalıpcılar, İ. Assessment of strength development and freeze-thaw performance of cement treated clays at different water contents. Cold Reg. Sci. Technol. 2015, 111, 50–59. [Google Scholar] [CrossRef]
  23. Zhao, L.; Peng, J.; Ma, P.; Leng, Y.; Ma, Z. Microstructure response to shear strength deterioration in loess after freeze-thaw cycles. Eng. Geol. 2023, 323, 107229. [Google Scholar] [CrossRef]
  24. Xu, J.; Li, Y.; Lan, W.; Wang, S. Shear strength and damage mechanism of saline intact loess after freeze-thaw cycling. Cold Reg. Sci. Technol. 2019, 164, 102779. [Google Scholar] [CrossRef]
  25. Xu, J.; Ren, J.; Wang, Z.; Wang, S.; Yuan, J. Strength behaviors and meso-structural characters of loess after freeze-thaw. Cold Reg. Sci. Technol. 2018, 148, 104–120. [Google Scholar] [CrossRef]
  26. Qi, J.; Ma, W.; Song, C. Influence of freeze-thaw on engineering properties of a silty soil. Cold Reg. Sci. Technol. 2008, 53, 397–404. [Google Scholar] [CrossRef]
  27. Qu, Y.; Ni, W.; Niu, F.; Mu, Y.; Luo, J.; He, H. Shear Properties and Mechanism of Freeze-Thaw Interface in Unsaturated Coarse-Grained Soil from Qinghai-Tibet Plateau. Adv. Civ. Eng. 2021, 2021, 6688724. [Google Scholar] [CrossRef]
  28. Liu, J.; Chang, D.; Yu, Q. Influence of freeze-thaw cycles on mechanical properties of a silty sand. Eng. Geol. 2016, 210, 23–32. [Google Scholar] [CrossRef]
  29. Khoury, N.N.; Zaman, M.M. Effect of Wet-Dry Cycles on Resilient Modulus of Class C Coal Fly Ash-Stabilized Aggregate Base. Transp. Res. Rec. J. Transp. Res. Board 2002, 1787, 13–21. [Google Scholar] [CrossRef]
  30. Yao, Z.; Du, X.; Zhang, Z. Effects of ultra-freezing/thawing cycles on the mechanical properties and microstructure of Shanghai clay. In Proceedings of the Third International Conference on Optoelectronic Science and Materials (icosm 2021), Spie, Hefei, China, 10–12 September 2021. [Google Scholar]
  31. Mu, J.; Pei, X.; Huang, R.; Rengers, N.; Zou, X. Degradation characteristics of shear strength of joints in three rock types due to cyclic freezing and thawing. Cold Reg. Sci. Technol. 2017, 138, 91–97. [Google Scholar] [CrossRef]
  32. He, P.; Mu, Y.; Yang, Z.; Ma, W.; Dong, J.; Huang, Y. Freeze-thaw cycling impact on the shear behavior of frozen soil-concrete interface. Cold Reg. Sci. Technol. 2020, 173, 103024. [Google Scholar] [CrossRef]
  33. Pan, R.; Yang, P.; Shi, X.; Zhang, T. Effects of freeze-thaw cycles on the shear stress induced on the cemented sand–structure interface. Constr. Build. Mater. 2023, 371, 130671. [Google Scholar] [CrossRef]
  34. Dong, J.; Tao, C.; Zhong, S.; Wu, Z.; Yan, X. Shear behaviour of anchor solid-soil interface under confining pressure and freeze-thaw cycles. Arab. J. Geosci. 2022, 15, 879. [Google Scholar] [CrossRef]
  35. Pan, J.; Wang, B.; Wang, Q.; Ling, X.; Liu, J.; Fang, R.; Wang, Z. Deformation characteristics of the shear band of silty clay–concrete interface under the influence of freeze-thaw. Cold Reg. Sci. Technol. 2023, 206, 103750. [Google Scholar] [CrossRef]
  36. Yang, L.; Liu, Q. Statistical damage constitutive model for soil-structure contact surface. J. Undergr. Space Eng. 2006, 79–82+86. (In Chinese) [Google Scholar]
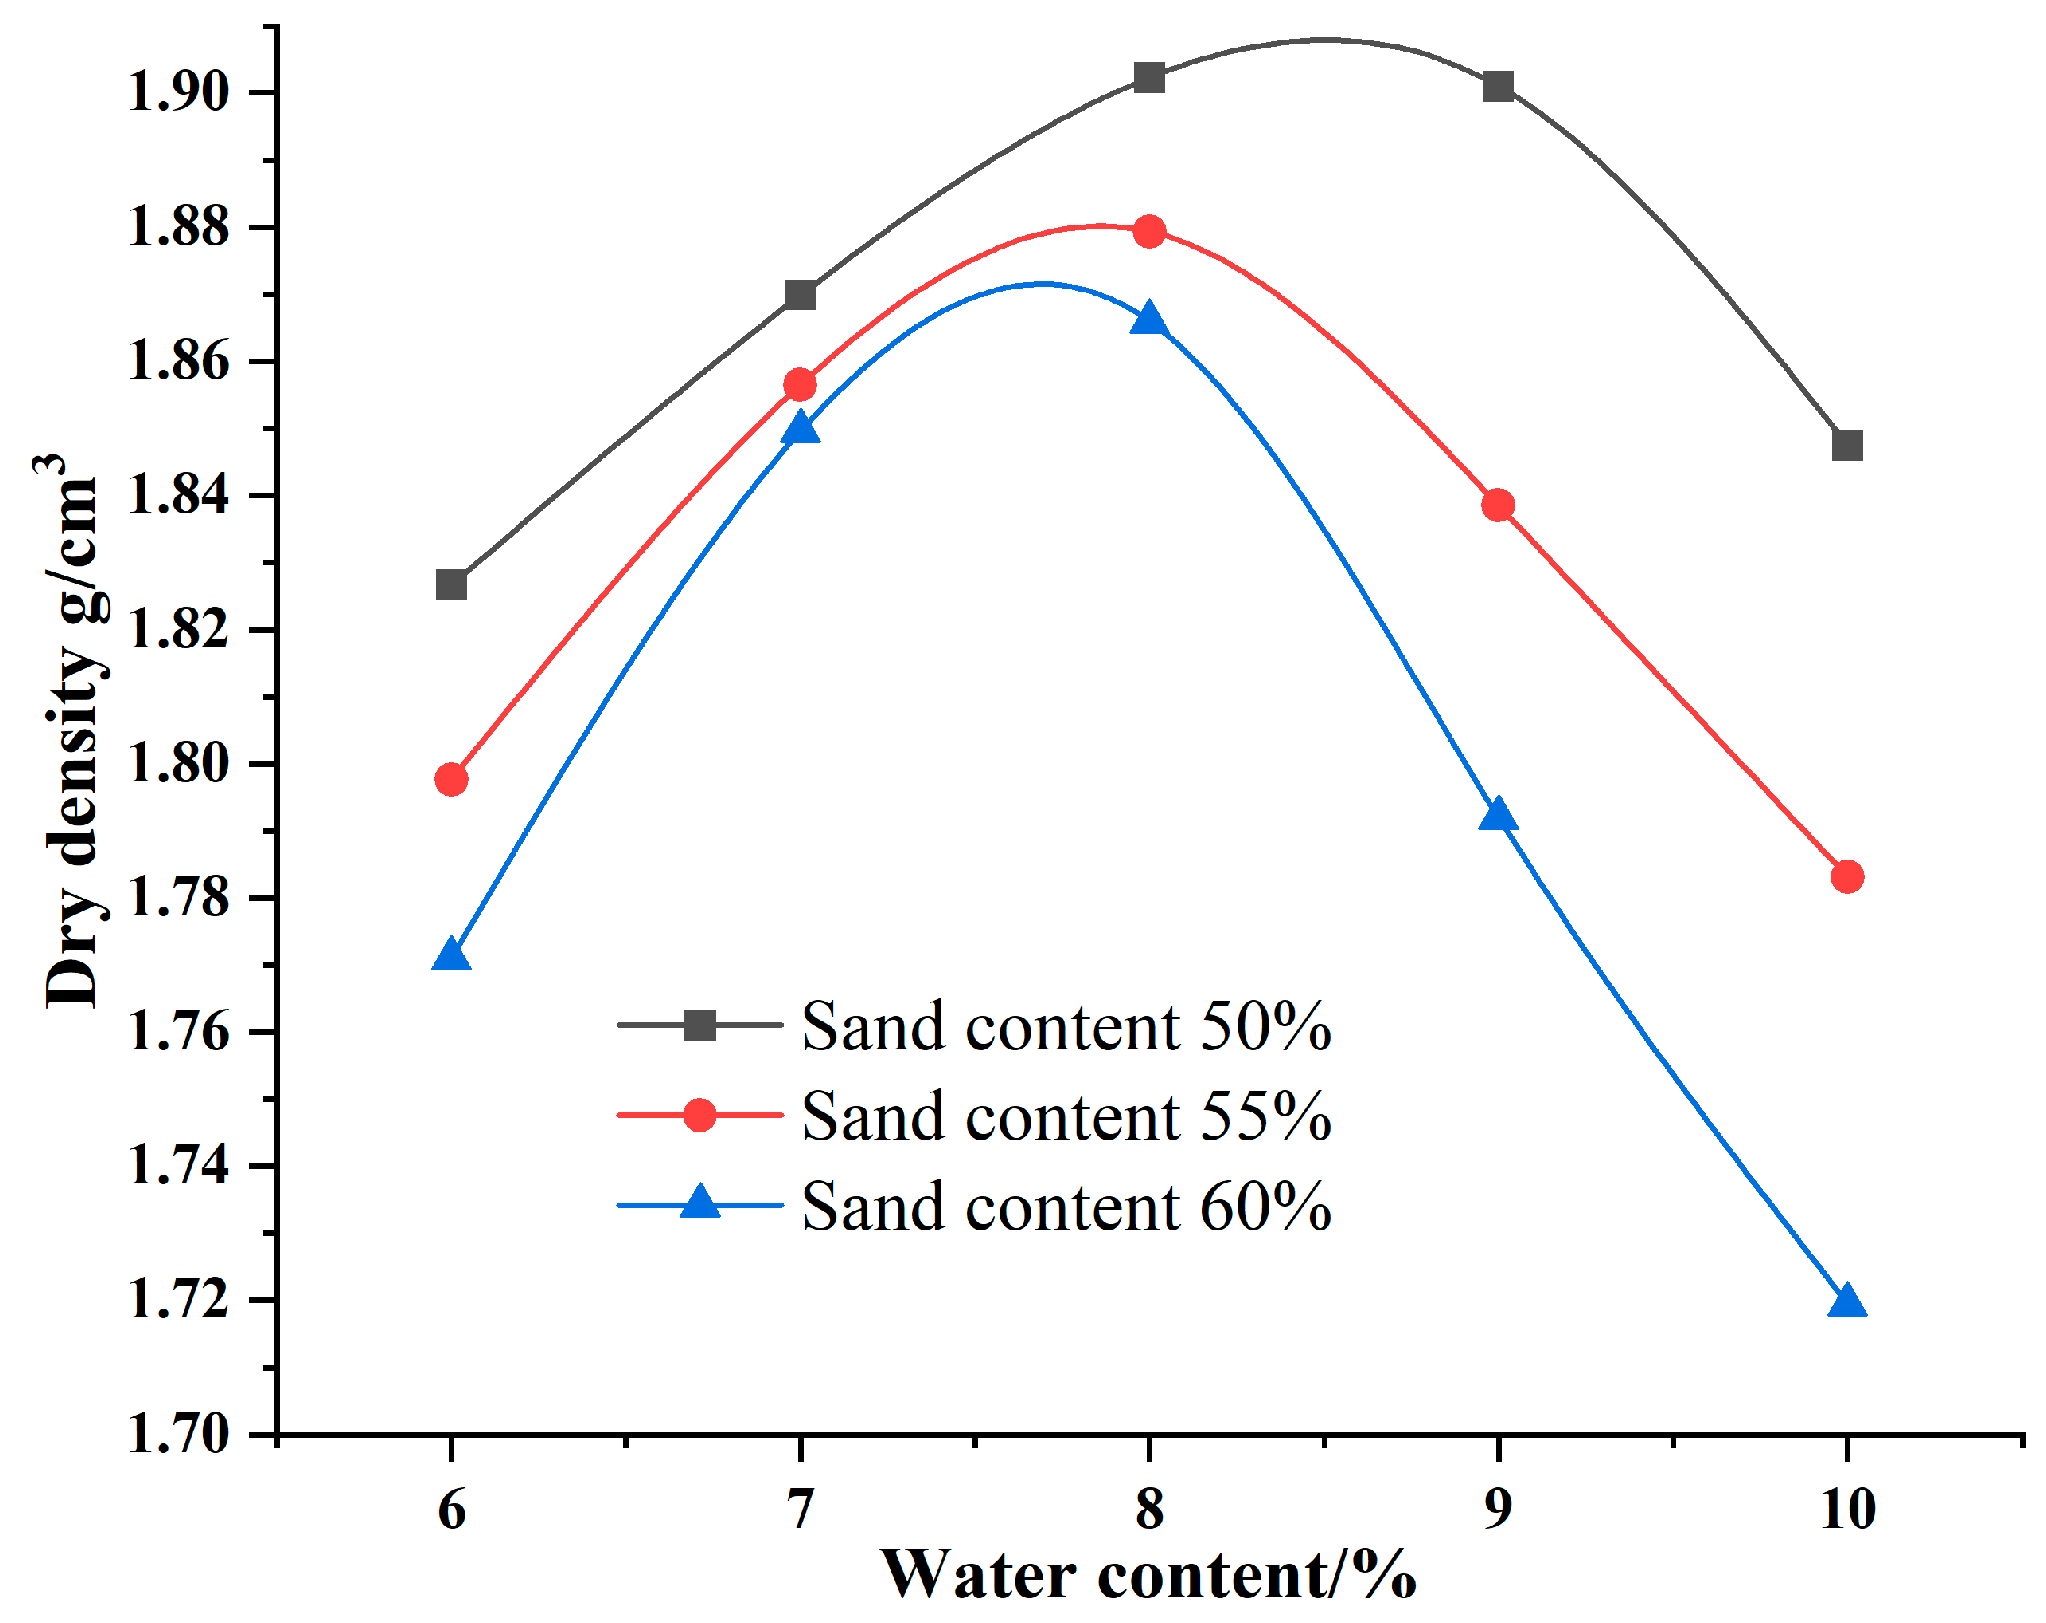
Figure 1. Compaction curve of the test soils.
Buildings 14 01772 g001
Figure 2. Bolt shear test system.
Buildings 14 01772 g002
Figure 3. Specimen force diagram.
Buildings 14 01772 g003
Figure 4. Load-displacement curves at different sand content levels.
Buildings 14 01772 g004
Figure 5. Comparison of the experimental pull-out data and fitted curve.
Buildings 14 01772 g005
Figure 6. Comparison of the experimental shear displacement data and fitted curve.
Buildings 14 01772 g006
Figure 7. Shear stress-shear displacement curves for different sand contents.
Buildings 14 01772 g007
Figure 8. Variations in the displacements corresponding to the peak shear strengths for different sand contents.
Buildings 14 01772 g008
Figure 9. Numerical model.
Buildings 14 01772 g009
Figure 10. Comparison of test data and model calculation results.
Buildings 14 01772 g010
Figure 11. Shear displacement curves for different confining pressures.
Buildings 14 01772 g011
Figure 12. Shear strength results for different sand contents.
Buildings 14 01772 g012
Figure 13. Shear strength of contact surface under different confining pressures and freeze-thaw cycles conditions.
Buildings 14 01772 g013
Figure 14. Change in cohesion with the number of freeze-thaw cycles.
Buildings 14 01772 g014
Figure 15. Variation in internal friction angle with freezing-thawing cycles.
Buildings 14 01772 g015
Table 1. The cohesion and internal friction angle of the test soils.
Sand Content/%Cohesion/kPaFriction/°
5053.0325.93
5555.0427.25
6050.0326.15
Table 2. Experimental protocol.
NumberSand Content/%Pressure/kPaFreeze-Thaw Cycles
MG150500/1/3/8/11
MG2100
MG3150
MG4200
MG555500/1/3/8/11
MG6100
MG7150
MG8200
MG960500/1/3/8/11
MG10100
MG11150
MG12200
Table 3. Load-displacement fitting results.
NumberA1A2A3B1B2B3C1C2C3
a1.841.301.482.841.391.400.891.131.62
b1.921.491.662.541.531.611.211.441.55
Correlation coefficient0.980.930.980.950.960.940.940.960.99
Table 4. Shear stress-shear displacement fitting results.
NumberA1A2A3B1B2B3C1C2C3
a9.172.521.328.822.822.946.491.190.94
b7.982.771.588.362.912.295.171.751.32
Correlaion coefficient0.990.960.990.990.980.990.980.970.98
Table 5. Physical and Mechanical Parameters.
Material
Parameter
Young’s
Modulus (GPa)
Poisson’s
Ratio
Friction
Angle (deg)
Cohesion (kPa)
Soil0.020.3525.9353.03
Anchor290.3
Disclaimer/Publisher’s Note: The statements, opinions and data contained in all publications are solely those of the individual author(s) and contributor(s) and not of MDPI and/or the editor(s). MDPI and/or the editor(s) disclaim responsibility for any injury to people or property resulting from any ideas, methods, instructions or products referred to in the content.