
A Generic Framework for Managing Schedule and Cost Risks of Construction Activities Using PERT and the EV Technique


Abstract
1. Introduction
- -
- The construction industry is lagging behind other industries in adopting smart technologies for almost all of its processes in general and for risk management in particular.
- -
- Many construction practitioners are not aware of and do not fully understand risk management techniques and how these techniques are used.
- -
- There is an absence of objective methods for quantifying the monetary impact of risk events.
- -
- The majority of the available risk management tools and techniques may not be applicable for the management of risks related to construction projects.
- -
- Current quantitative risk analysis methods often rely on qualitative expert opinions. While this is acceptable, the process of acquiring experts’ feedback should be dynamic and should always be updated.
- How to make construction practitioners fully aware of available smart technologies and risk management techniques?
- Can a tool, specifically customized for managing schedule and cost risks associated with construction activities, be developed?
- How to quantify the monetary impact of schedule and cost risk events related to construction activities using more objective tools?
- Can the process of acquiring experts’ opinions be dynamic and is it possible to update the database of experts’ opinions periodically?
2. Literature Review
2.1. Definition of Risk Management
2.2. Risk Management Techniques
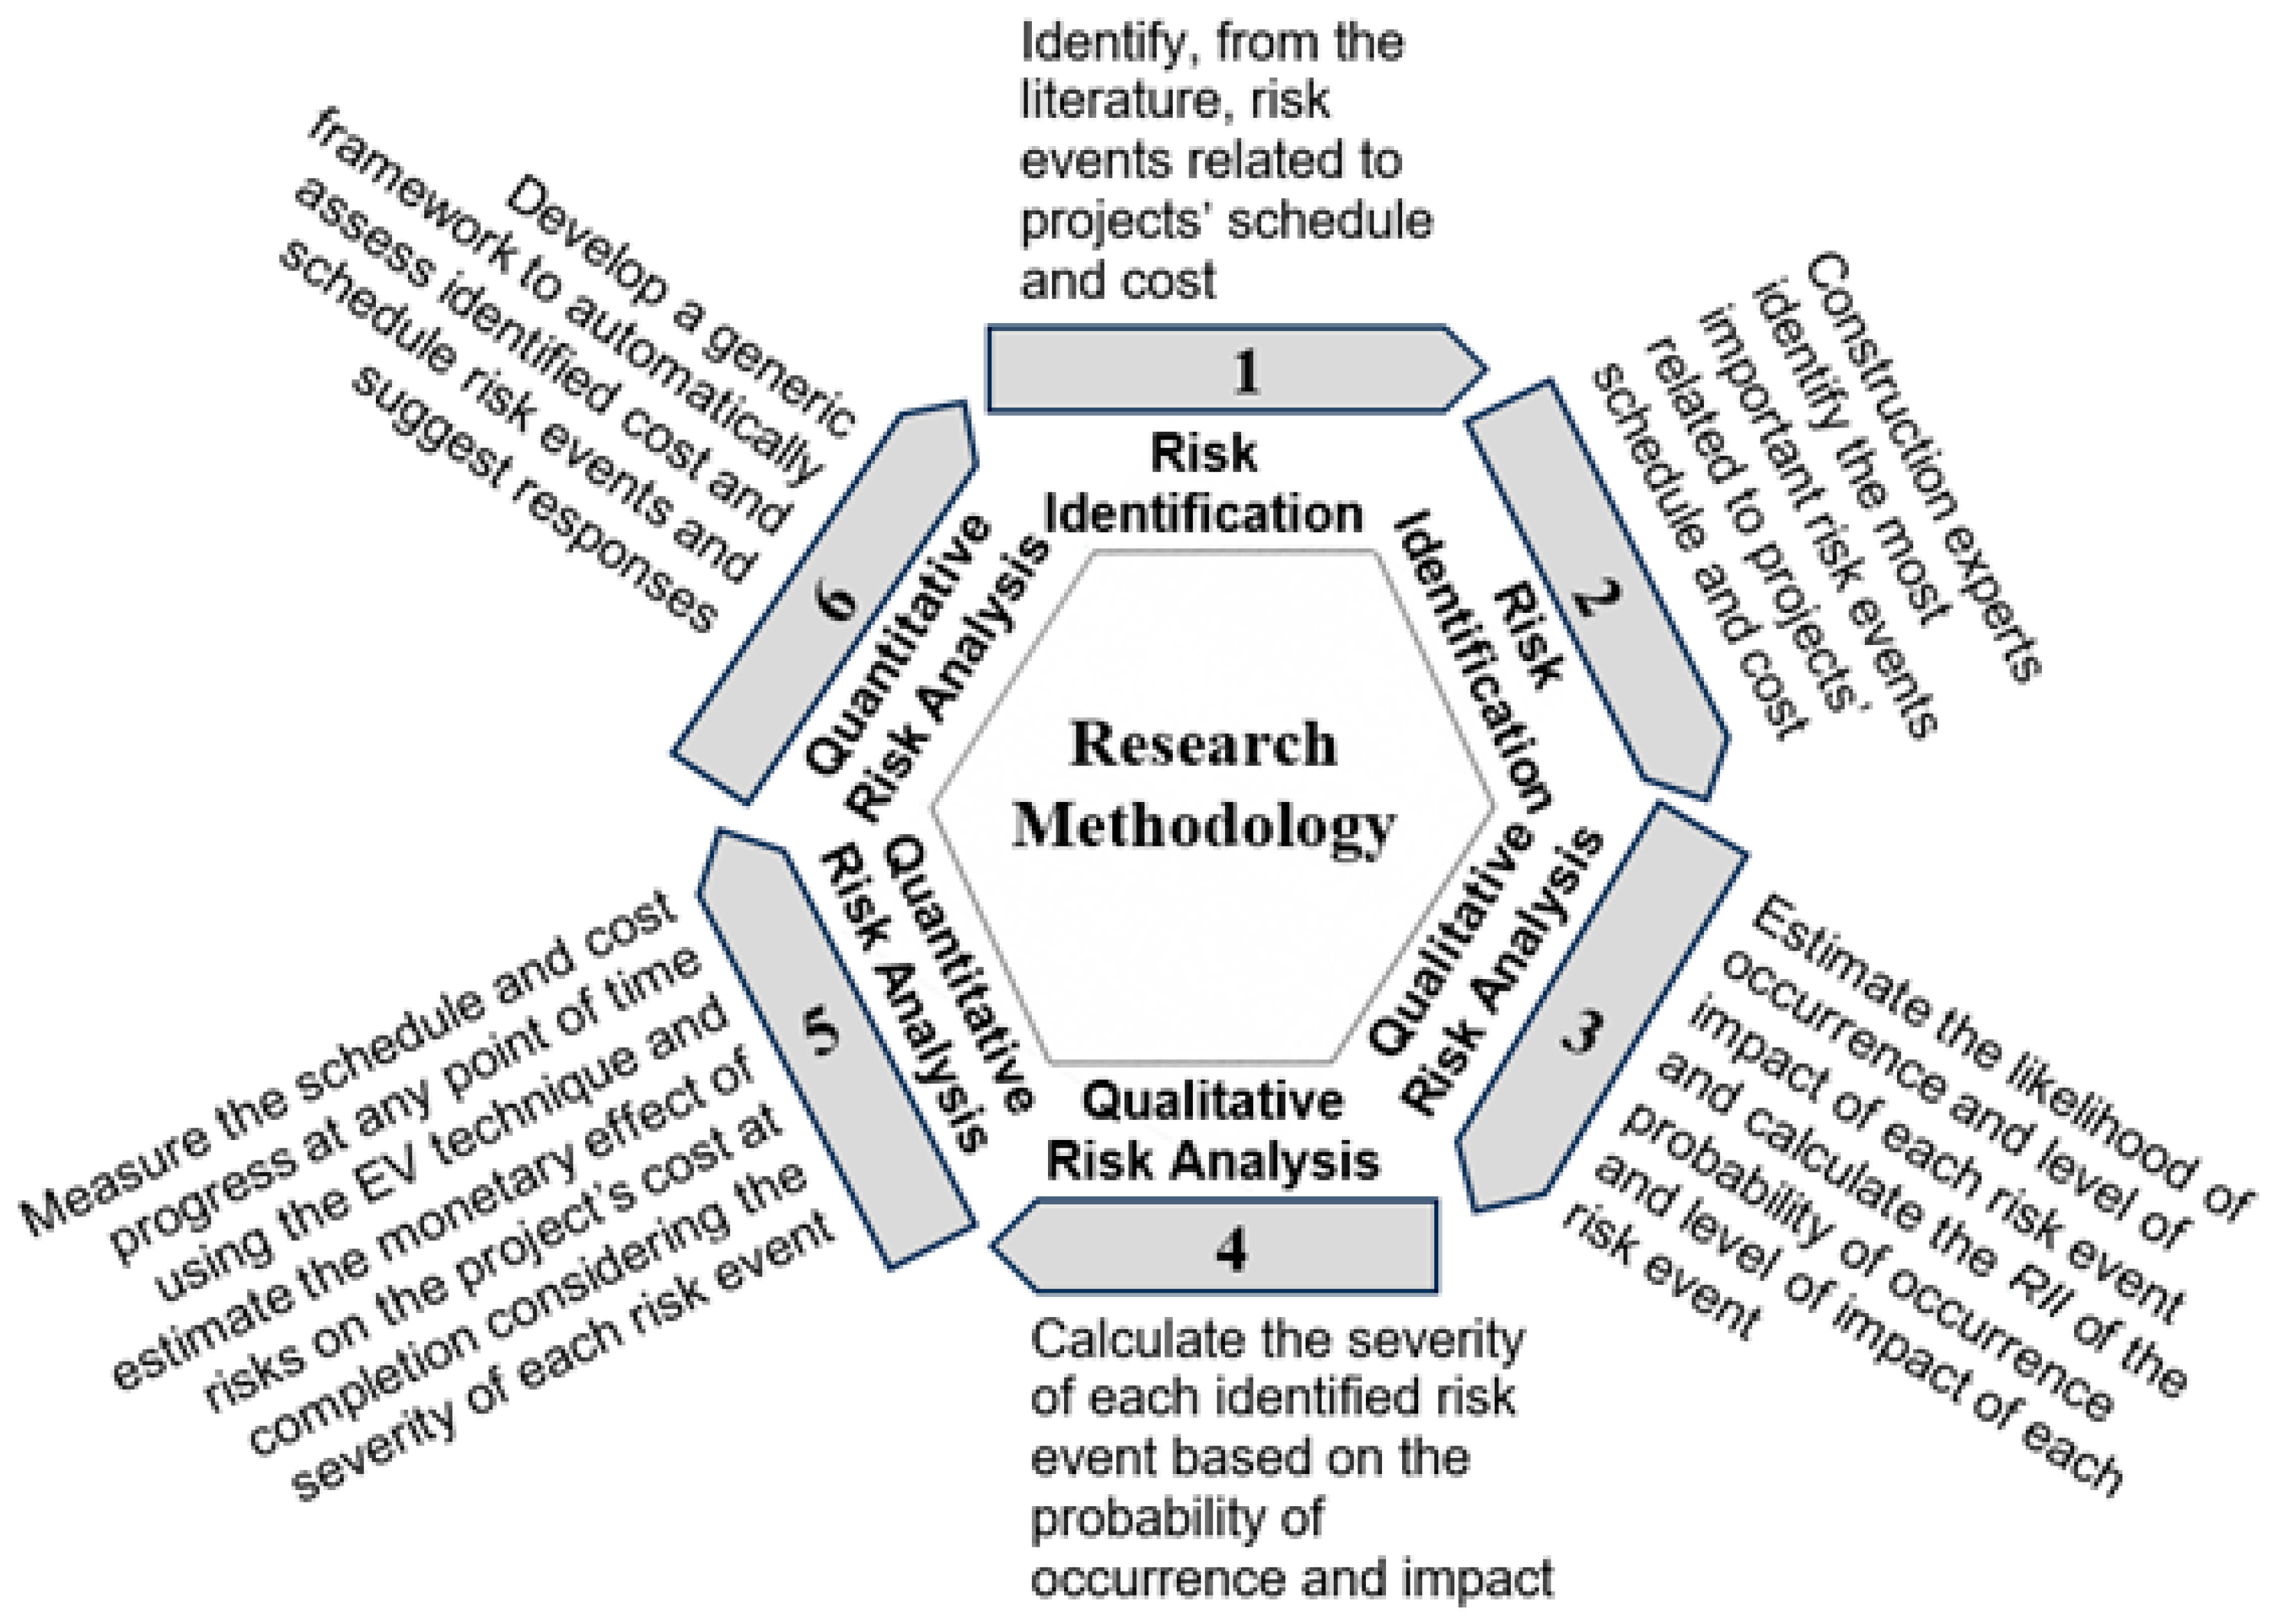
3. Research Objective and Methodology
- Previous research efforts were reviewed and 43 risk events that may affect projects’ schedule and cost were identified.
- Using the 43 risk events identified in item 1 above, an initial questionnaire survey was designed to elicit the feedback of construction practitioners in order to identify risk events and prioritize them, determine the probability of these risks happening, and estimate the degree of their impact. The survey was distributed to 68 practitioners from municipalities, contractors, and design offices in the UAE construction industry to provide their feedback regarding the most important schedule and cost risk events to be considered for further assessment and analysis. Construction practitioners were also requested to provide their feedback on the tools and techniques they use to manage risks associated with construction activities and the frequency of using these tools and techniques.
- The majority of respondents who participated in the initial survey suggested 15 risk events as the most important ones among the 46 suggested in the initial survey. Considering these 15 risk events, a more detailed survey was then designed and conducted among the construction experts, who responded to the initial survey and committed to respond to the detailed questionnaire survey, to elicit their feedback on the probability of occurrence and impact of each of the 15 risk events. The data received from the survey respondents were then analyzed and most important risk events related to construction projects’ schedule and cost were identified and analyzed as follows:
- Identified risk events were assessed and the probability of occurrence of the risks was calculated. Identified risks were ranked by calculating the relative importance index (RII) of the probability of occurrence of each risk event.
- The impact of each of the identified risk events was calculated and these risk events were ranked by calculating the RII of the impact of each risk event. Since the RII values of the probability of occurrence and impact of risk events were calculated based on a Likert scale range from 1 to 5, the values of the RII also had a 5-range scale (0% to <20%, ≥20% to <40%, ≥40% to <60%, ≥60% to <80%, and ≥80%), as shown in Table 1. The calculated RII values of the probability of occurrence and impact of risk events represent the level of occurrence and impact of each risk event.
- The severity of each identified risk event was then calculated based on their probability of occurrence and impact. The level of severity of each risk event was determined based on the severity of these risk events resulting from the calculated probability of occurrence and level of impact of the risk events.
- The “PERT” technique was used to perform a qualitative analysis of the impact and severity of risk events. The “EV” technique was then used to measure the schedule and cost progress at any point of time and quantify the monetary effect of risk events on the project’s cost at completion, considering the severity of identified risks. This task addresses research questions 2 and 3.
- In response to research question 4, a generic spreadsheet framework was then developed to automate the whole process in a dynamic environment. The dynamic framework performs the following tasks, addressing research questions 1, 2, 3, and 4:
- -
- Measures the qualitative RII of the probability of occurrence and impact of each identified risk event and their corresponding levels of severity.
- -
- Allows users to update the responses database and the severity risk matrix, which can change based on the input of construction experts, making the process current and dynamic. This task responds to research question 4 (Section 1).
- -
- Calculates the quantitative monetary effect of these risks on the project’s duration and cost, considering the estimated severity of identified risk events. Depending on the type of risk, some response actions can be suggested to mitigate risks and reduce their impact and severity.
- -
- Validate the proposed framework by requesting construction practitioners to use it in real life construction projects in order to familiarize them with this tool and increase their awareness of the benefits of such risk management tools.
4. The Questionnaire Surveys
4.1. Initial Questionnaire Survey
4.2. Detailed Questionnaire Survey
5. Data Analysis
6. Results and Discussion
7. Development of a Generic Framework for Managing risks
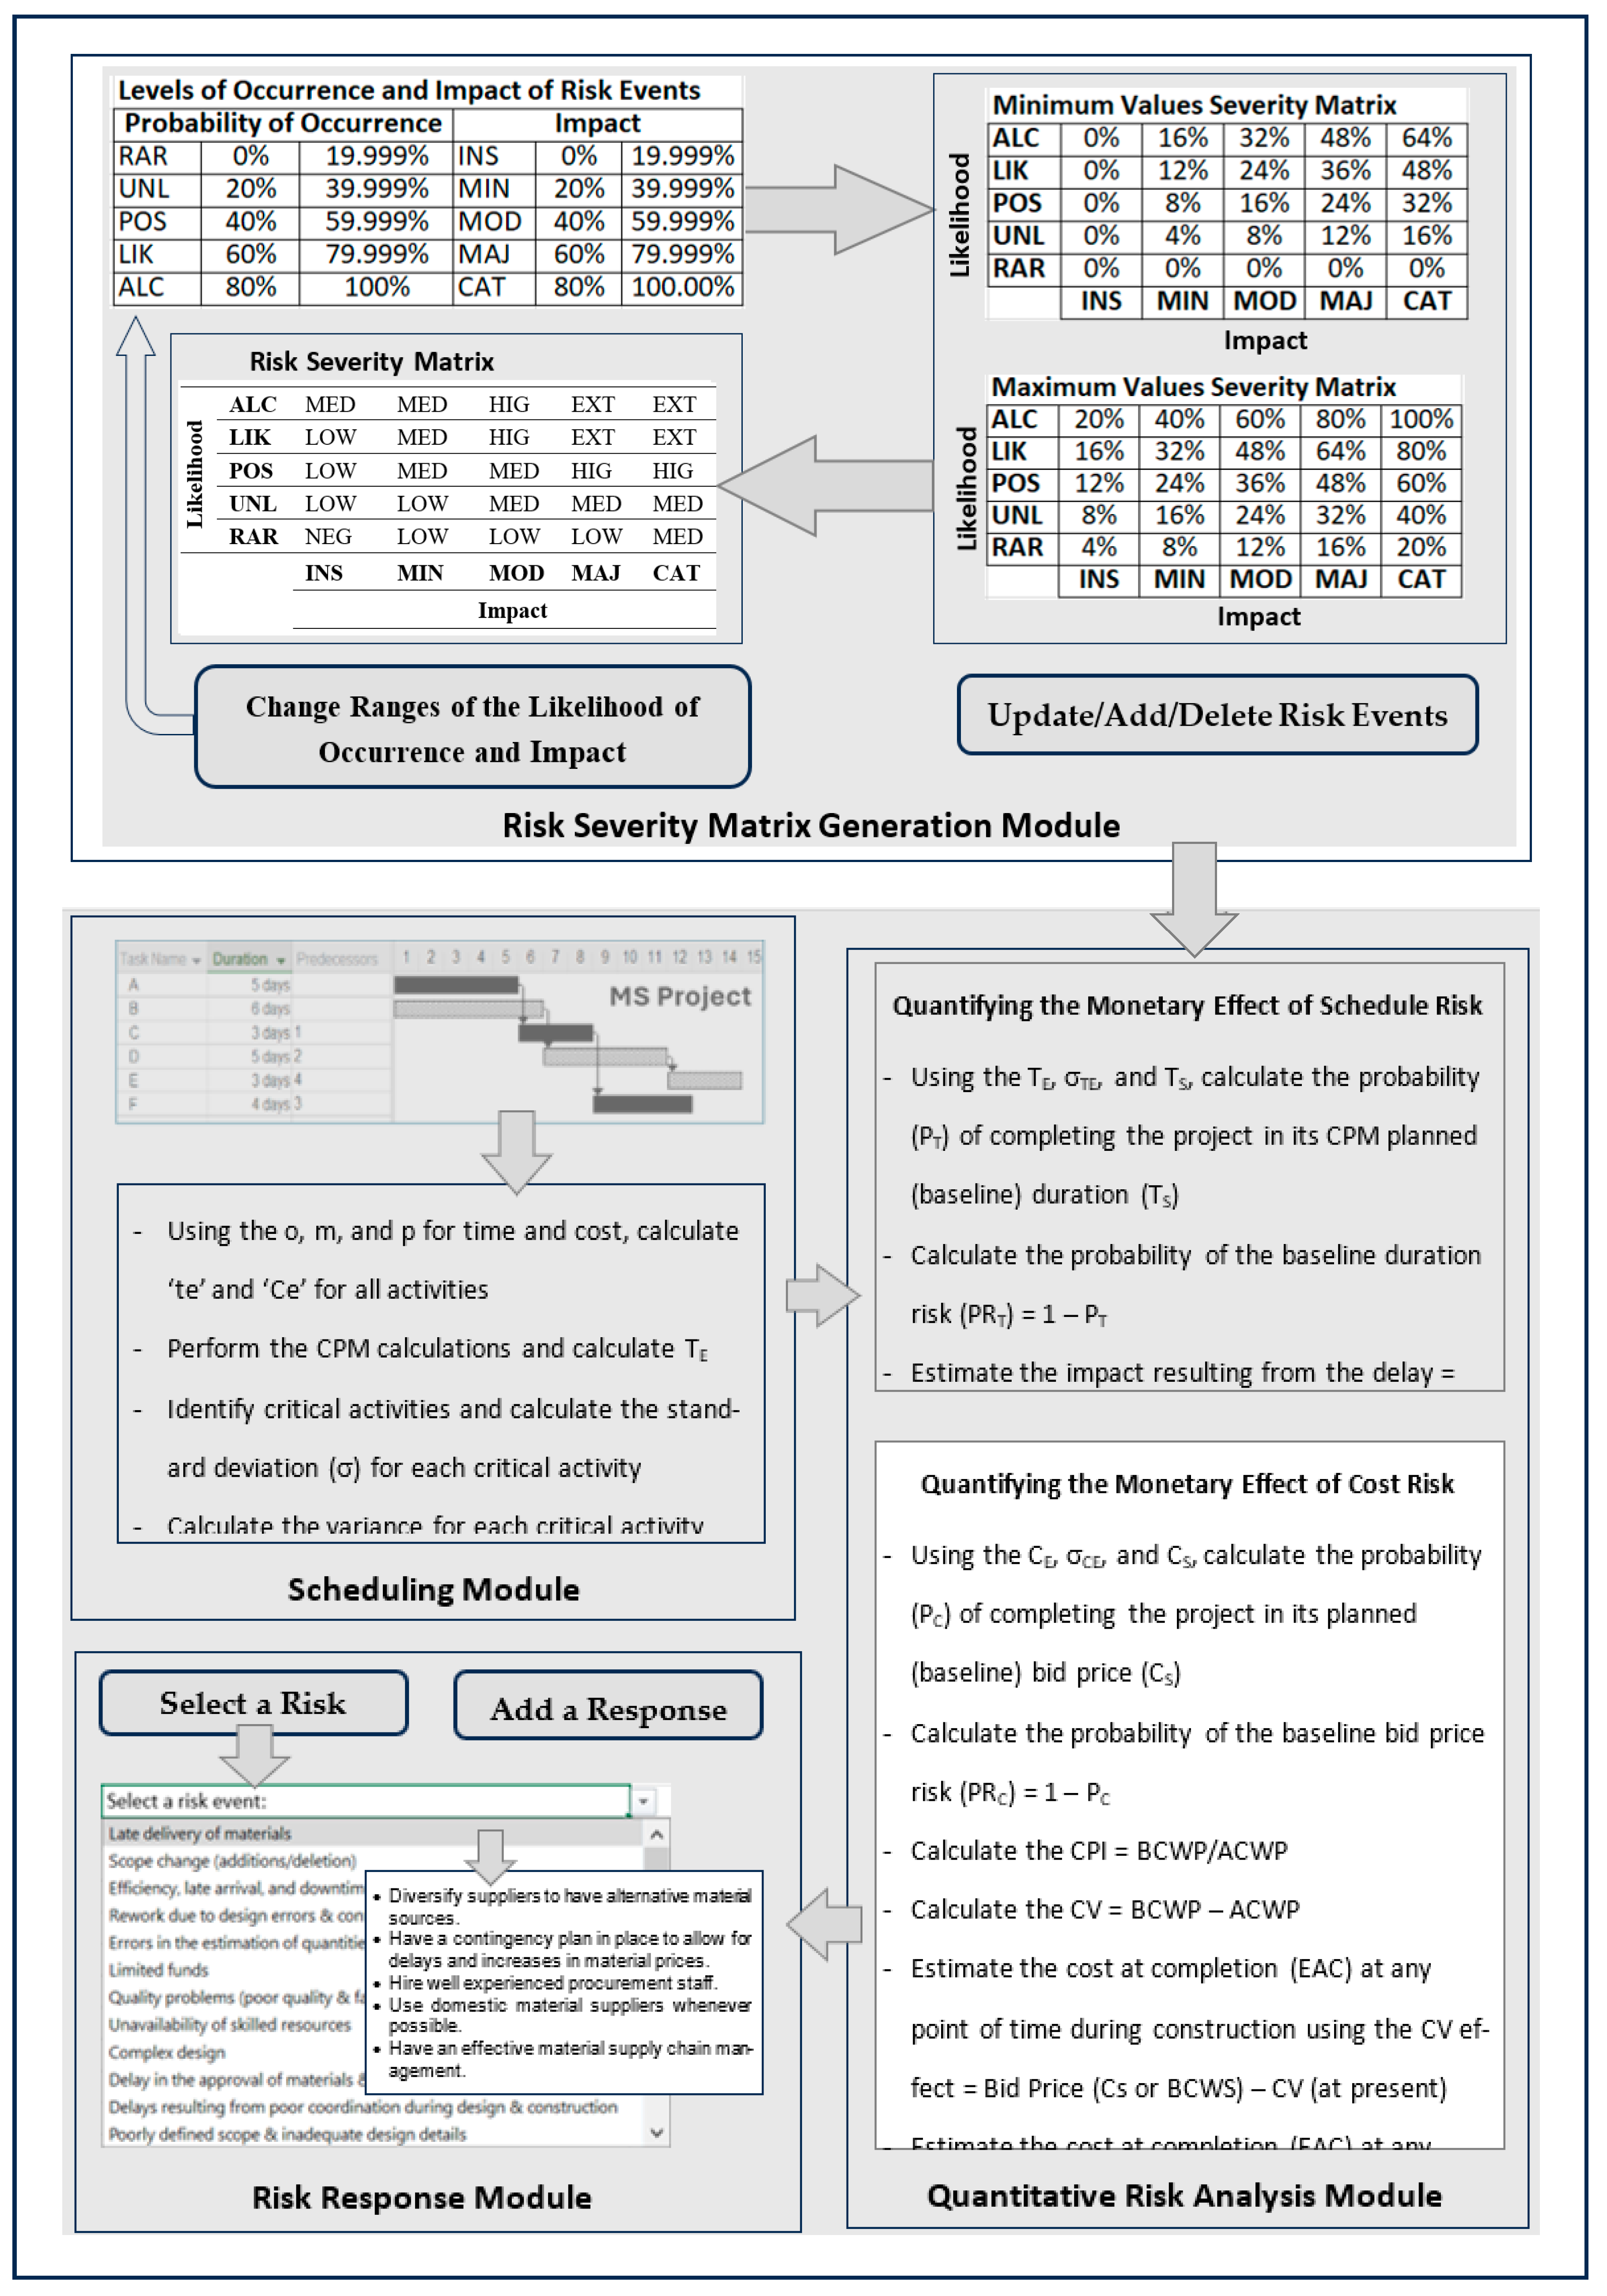
- The number of responses received for each of the likelihood of occurrence ranges (RAR, UNL, POS, LIK, and ALC) and impact ranges (INS, MIN, MOD, MAJ, and CAT) are entered for each of the 15 risk events. Based on the entered values, the framework calculates the RII values for the likelihood of occurrence and impact of each risk event using Equation (1).
- Using Equation (2), the framework calculates the severity level of each risk event based on the RII values calculated in item 1 above.
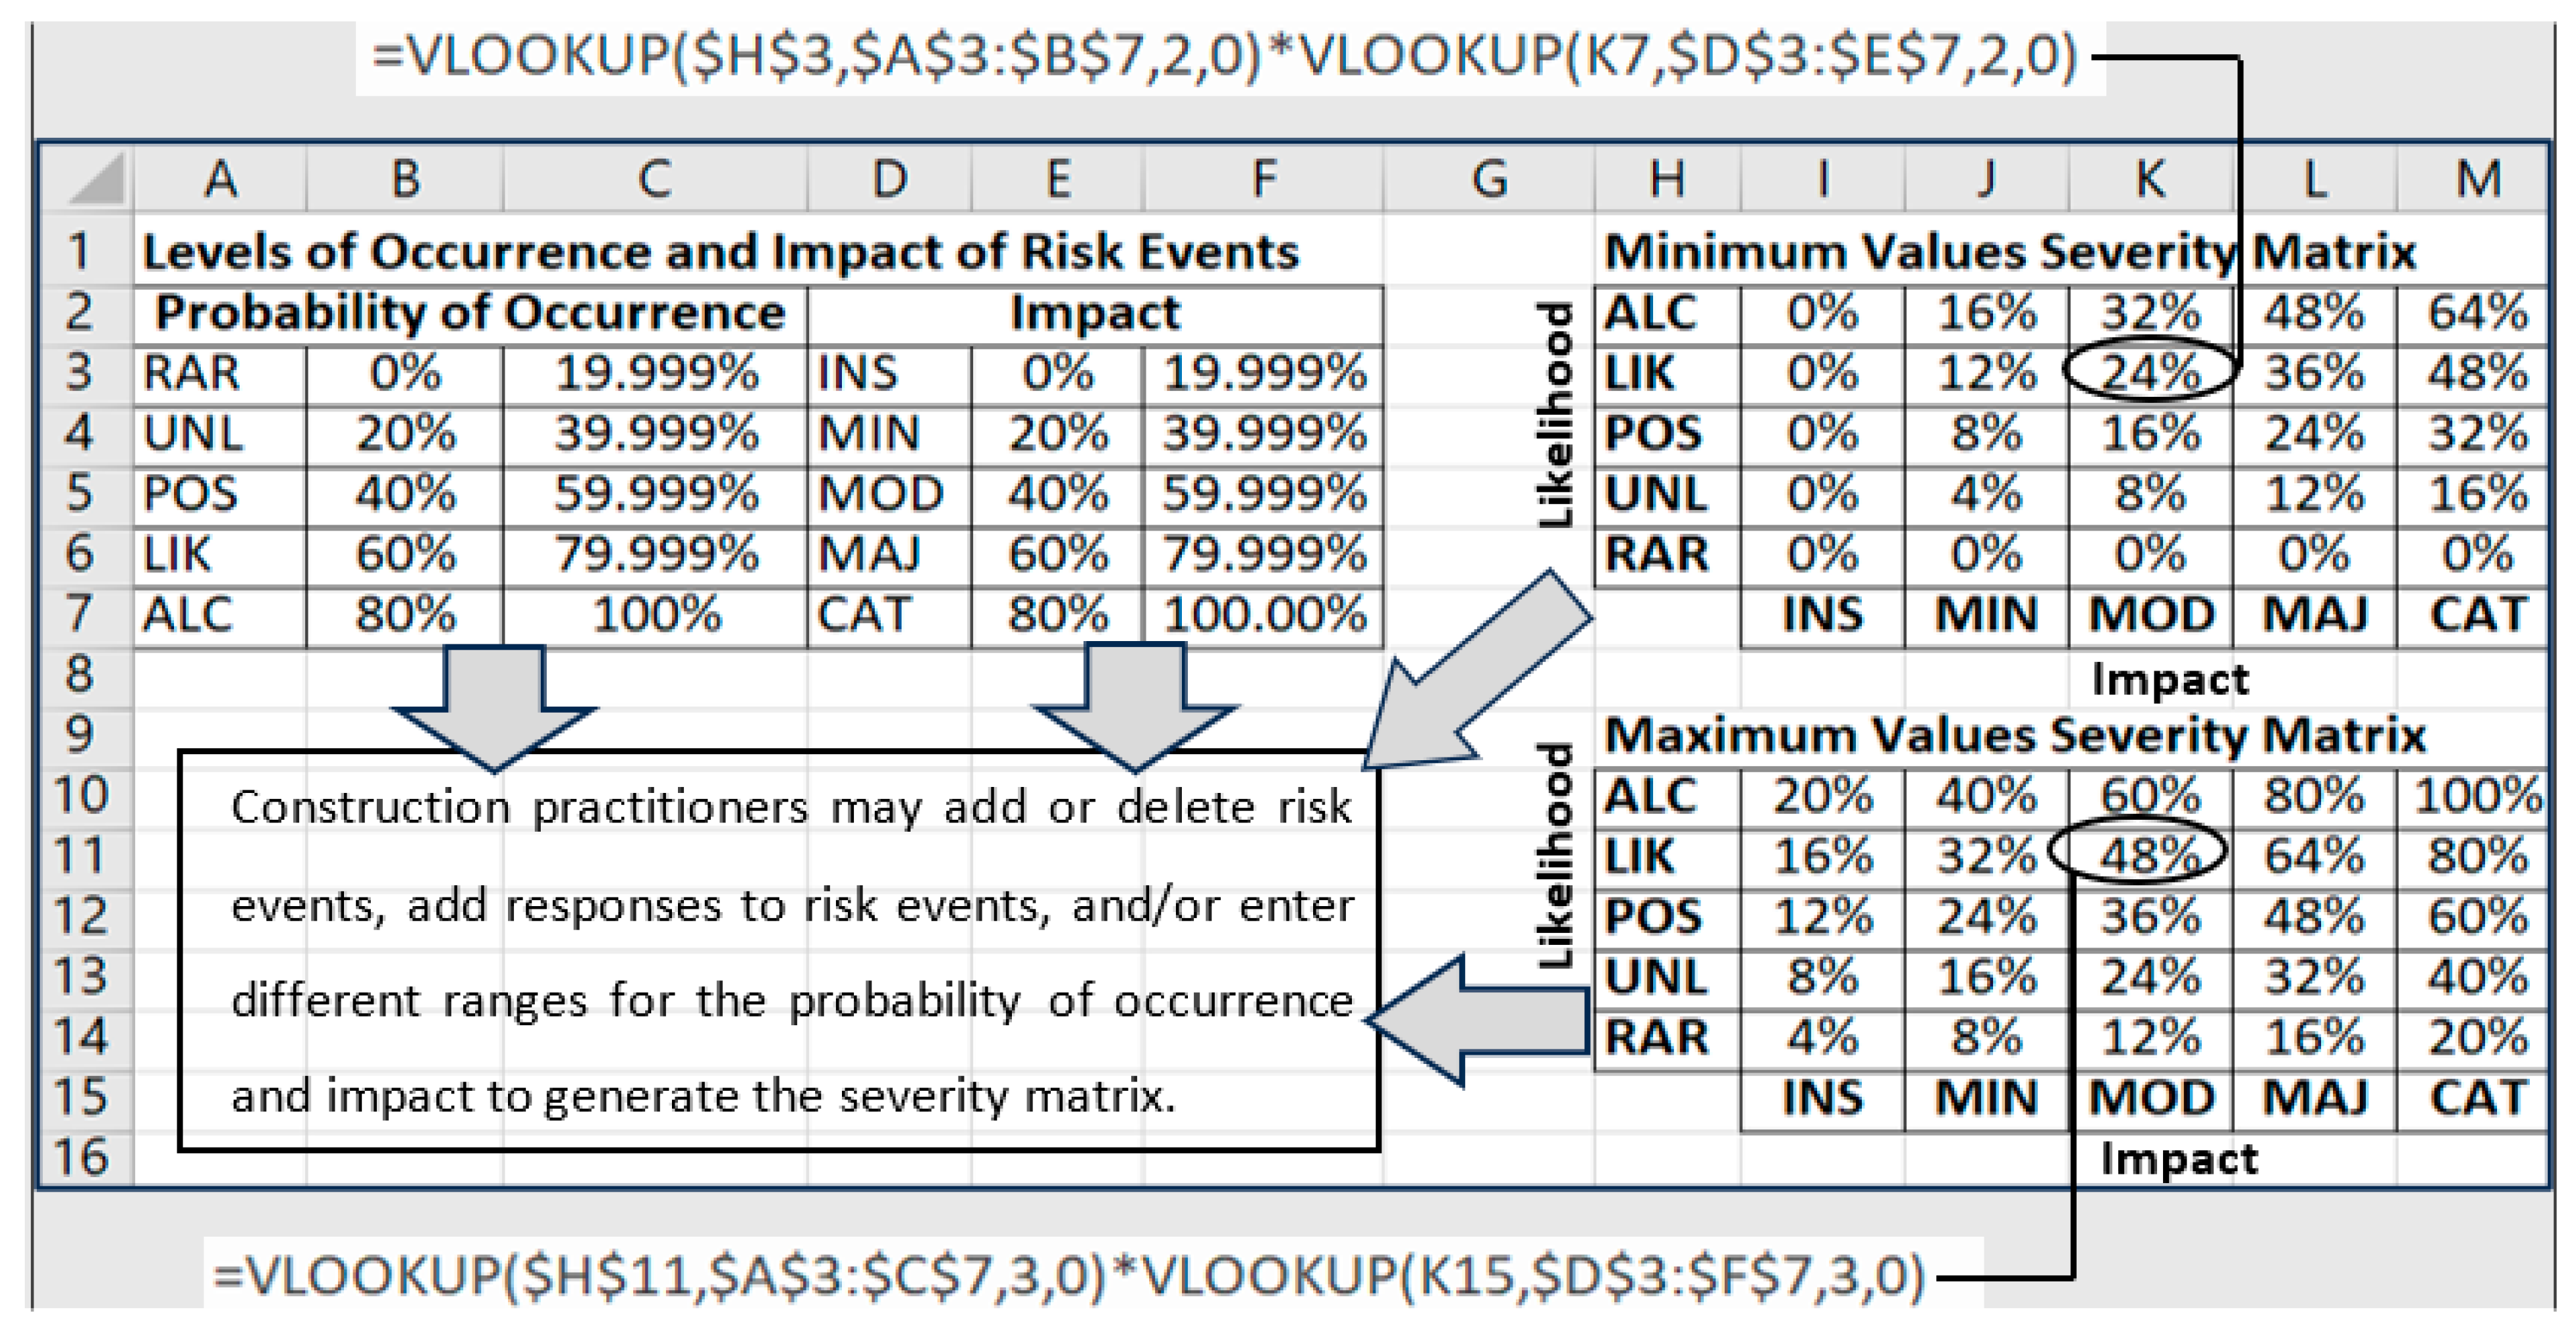
- The RII range for the levels of occurrence and impact of risk events given in Table 1 are then entered and, using this data, the framework calculates a generic range of severity levels using Equation (2). The RII ranges given in Table 1 for the levels of occurrence and impact of risk events form two 5 × 5 severity risk matrices for the minimum and maximum values of the RII ranges. Figure 2 shows the data tables used to calculate the minimum and maximum value range of the levels of severity of risk events. The table on the left side of Figure 2 shows the percentage range of the probability of occurrence and impact of risks, while the two tables on the right side automatically calculate the minimum and maximum values of risk severity.
- The two tables at the right side of Figure 2 calculate the minimum and maximum values of risk severity using the “Vlookup” function of the Microsoft 365 Excel.. For example, the minimum value of the severity of a particular risk event with a “Likely (LIK)” probability of occurrence of and a “Moderate (MOD)” impact of will be 60% × 40% = 24%, while the maximum value will be 80% × 60% = 48%. The calculated minimum and maximum values of risk severity in the two tables, shown in the right side of Figure 2, automatically generate a risk severity matrix, representing a range for each level of risk severity in the matrix array. Table 7 shows the range for each level of risk severity, while Table 8 shows the risk severity matrix generated from the calculated range of each level of risk severity.
- For a given set of activities in a project and their corresponding three “PERT” times (optimistic (o), most likely (m), and pessimistic (p)), the expected time (te = ), standard deviation (σ = ), and variance (v = σ2) are calculated for each activity.
- Microsoft Project scheduling software then reads the expected times (te) of activities from Excel using VBA in order to schedule the project and identify critical activities. Excel then reads the project’s expected time (TE) from Microsoft Project software and calculates the project’s standard deviation (σTE) using the critical activities identified by Microsoft Project software.
- Using the project’s calculated TE and σTE, this module calculates the probability (PT) of finishing the project in its baseline duration stipulated in the contract (TS). PT is calculated using Excel function “=NORMDIST(x, mean, standard_dev, cumulative)”, where “x” is baseline duration of the project (TS), “mean” is the “TE” value obtained from Microsoft Project software using the critical path method (CPM) technique, and “standard_dev” is the calculated “σTE” for critical activities of the project. The probability of risk (PRT) for finishing the project in its “TS” duration is then calculated as follows:PRT = 1 − PT
- Since a delay in finishing a construction project on its scheduled baseline time (TS) results in liquidated damages (delay penalty) to be paid by contractors for each day of delay as stipulated in the contract, the monetary impact resulting from the delay is calculated as follows:Impact of the delay = the overall delay (in days) × the liquidated damages (delay penalty) stipulated in the contract
- 3.
- The procedure of quantifying the risk associated with the project’s cost (bid price) is similar to that used for the project’s schedule, where a variation in costs for each activity is assigned (optimistic, most likely, and pessimistic) to establish the probability distribution corresponding to the cost of each activity in a project. The “PERT” technique is then used to calculate the expected project’s cost (CE) and the standard deviation of the expected project’s cost (σCE). The module provides an alternative way to quantify the risk associated with the project’s cost (bid price) using the “Pareto Principle” in order to select the tasks with significant cost impact for further analysis. The Pareto Principle assumes that 80% of the effect (consequences) comes from 20% of the causes (Le et al., 2022) [55]. This principle is also called the 80/20 rule or the ‘law of the vital few.’ In cost estimation, the Pareto Principle suggests that around 20% of items are responsible for around 80% of the total project cost. Following this rule, this module of the suggested framework selects the most expensive 20% of tasks and the accumulated costs of these tasks are considered to account for around 80% of the total project cost and used as the expected cost of the selected activities in the project (CE).
- 4.
- Once the costs are identified and the expected project’s cost (CE) and standard deviation of the expected project’s cost (σCE) are calculated, the procedure of quantifying the risk associated with the project’s cost is similar to that used for the project’s schedule. This module then calculates the probability (PC) of meeting the planned baseline bid price of the project (CS) using Excel function “=NORMDIST(x, mean, standard_dev, cumulative)”, where “x” is the planned baseline bid price of the project (CS), “mean” is the expected price value of the project “CE” calculated from the “PERT” three cost values (optimistic, most likely and pessimistic), and “standard_dev” is the calculated “σCE” for the project. The probability of risk (PRC) to meet the project’s baseline bid price is then calculated as follows:PRC = 1 − PC
- 5.
- The EV technique is then used to measure the progress of the project’s schedule at any point of time during construction using the schedule performance index () or the schedule variance (SV = BCWP − BCWS). The EV technique is also used to measure the project’s cost progress during construction using the cost performance index () or the cost variance (CV = BCWP − ACWP), where:
- BCWS is the budgeted cost of work scheduled (CS); this measures what is planned in terms of the budget cost of the work that should take place according to the baseline schedule of the work.
- BCWP is the budgeted cost of work performed (also called the earned value); this measures what is done in terms of budget cost of work that has actually been accomplished (completed) to date.
- ACWP is the actual cost of work performed; this measures what is paid in terms of the actual cost of work that has actually been accomplished (completed) to date.
- 6
- Once the estimate at completion (EAC) is calculated for a project at any point of time during construction, the monetary impact resulting from the effect of the current CV or CPI on the estimate at completion (EAC) is then calculated as follows:The impact of the EAC = EAC (calculated from equations 6 or 7) × (the project’s pessimistic price—CS)
- Late delivery of materials:
- Diversify suppliers to have alternative material sources.
- Have a contingency to allow for delays and increases in material prices.
- Hire well-experienced procurement staff.
- Use domestic material suppliers whenever possible.
- Have an effective material supply chain management.
- Regularly evaluate the performance of material suppliers.
- Plan the delivery of materials ahead of time, particularly for critical tasks.
- Make sure to have contracts with material suppliers that include delivery dates and clearly defined penalties.
- Define lead times for material delivery in the contracts with suppliers and track long-lead materials.
- Scope change (additions/deletion):
- Ensure clear project scope and specifications.
- Make a constructability review.
- Promote effective communication among all parties and ensure proper coordination during design to avoid redesign and added cost and delays.
- Have an established change order process and include a provision in the contract about change order procedures and rights of parties.
- Have an established quality control process.
- Obtaint written approvals for all change orders.
- Check the impact of change order on the project’s schedule.
- Select a type of contract that provides flexibility for changes.
- Efficiency, late arrival, and downtime of equipment:
- Hire well-experienced procurement staff.
- Diversify equipment suppliers to have alternative sources.
- Use domestic equipment suppliers whenever possible.
- Have an effective equipment supply chain management.
- Regularly evaluate the performance of equipment suppliers.
- Plan the delivery of equipment ahead of time, particularly for critical tasks.
- Make sure to have contracts with equipment suppliers that include delivery dates and clearly defined penalties.
- Have a contingency plan in case the equipment is not delivered on time.
- Schedule equipment downtime, create a maintenance schedule, and keep maintenance and repair records.
- Assign a qualified maintenance team.
- Provide periodical lubrication, oil changes, and filter changes, etc.
- List all routine and preventative maintenance requirements.
- Create backup plans in case of equipment delay/failure.
- Organize the site properly for maximum productivity.
- Check that equipment operators are qualified and have good training to operate and maintain equipment.
- Use equipment efficiently and use an optimum fleet of equipment.
- Rework due to design errors and conflicts in contract documents:
- Hire an experienced design team.
- Assign a coordinator during the design and construction stages.
- Promote effective communication among all parties.
- Allocate enough time for design.
- Review the various components of the design for errors, mistakes, discrepancies, and mismatches during the design stages to avoid costly rework, delays, and disputes, and ensure that the project meets the expectations of the client.
- Have professional liability insurance to transfer the risk of major design errors and mistakes to a third party.
- Review cross-referencing in drawings and other contract documents to avoid discrepancies and mismatches among the various design drawings and other contract documents.
- Errors in the estimation of quantities and costs:
- Have a clear and accurate scope definition to avoid underestimating or overestimating the project’s cost, duration, and quality.
- Allocate enough time for quantity takeoff and cost estimation.
- Use reliable software for quantity takeoff instead of manual practices to improve accuracy.
- Use consistent units and formats, cross-check your calculations, and update your data regularly to improve the reliability of the quantity takeoff.
- Study current market trends and analyze your competitors.
- Negotiate with your suppliers.
- Track your overhead costs and evaluate your risks and opportunities.
- Have a contingency plan in place to cover unexpected costs that may arise from errors and mistakes in quantities and cost estimation.
- Allocate enough time for quantity takeoff and cost estimation.
- Make periodical reviews and checks on quantities and unit prices.
- Select the right type of contract.
- Limited funds:
- Ensure an effective cost control system from the beginning of the project.
- Perform a value engineering exercise to reduce costs without affecting the functions or quality of the project.
- Perform time–cost tradeoff analysis (activities crashing). This exercise normally results in saving time and cost.
- Ensure accurate cost estimation.
- Manage the cash flow properly during the different stages of the project.
- Explore adaptive budgeting techniques to mitigate cost overruns.
- Have clear communication among project stakeholders including subcontractors and suppliers. This is essential for effective fund management.
- Make payment arrangements with subcontractors and material suppliers. Agreed delayed payments help contractors improve their funds for projects.
- Have professional liability insurance to mitigate unexpected costs resulting from negligence or mistakes made by project professionals.
- Quality problems (poor quality and failure to meet specifications):
- Identify, assess, and prepare responses for quality risks early during the project’s life cycle and implement a response plan.
- Have clear procedures and a control system in place for quality control and implement it carefully and effectively by monitoring and controlling your quality performance.
- Assign a team to supervise the work on site.
- Review and improve your quality system.
- Make sure to have quality and clear design drawings and specifications with minimum or no omissions discrepancies, errors, mistakes, and mismatches.
- Avoid using low-quality material to meet a budget.
- Use experienced engineers and skilled labor.
- Avoid complex designs.
- Avoid frequent and last-minute changes. These can compromise the quality of the final project.
- Availability of skilled resources:
- Prepare histograms/profiles for all resources to identify the daily requirements of skilled resources during construction.
- Increase and incentivize training programs for labor.
- Create a training outreach program through an industry association.
- Adopt new equipment and technologies that decrease labor needs.
- Invest in automation whenever possible to reduce the reliance on labor.
- Implement project management software to decrease the time it takes to perform a host of activities and thereby make your crew more productive and decrease labor needs.
- Improve safety precautions on site to attract skilled labor.
- Expand your efforts to recruit skilled labor and target the young generation.
- Provide attractive and competitive salaries.
- Subcontract to qualified contractors.
- Complex design:
- Get experienced engineers heavily involved early during the design stage in an attempt to avoid complex designs.
- Educate designers about the risks associated with complex designs and how these risks contribute significantly to the delays and cost overruns of construction projects.
- Perform an early assignment to recognize and identify undesirable risk events related to complex designs.
- Have a contingency plan to deal with risks resulting from complex designs.
- Delay in the approval of materials and shop drawings:
- Have a pre-defined schedule of submittals for all materials and shop drawings prepared before the commencement of construction.
- Submit materials and shop drawings ahead of time to avoid delays in the approval.
- Document all submittals and follow up on the approval status of materials and shop drawings on a regular basis.
- Give priority to critical tasks for material and shop drawing submittals.
- Claim time extension and compensation resulting from the failure of the client to approve materials and shop drawings within the time stipulated in the contract.
- Poor coordination during design and construction:
- Assign a coordinator during the design and construction stages.
- Establish effective communication channels and promote them among parties.
- Encourage regular meetings and updates among all project stakeholders.
- Conduct periodic coordination meetings during design and construction.
- Review cross-referencing in drawings and other contract documents to avoid discrepancies and mismatches among the drawings and other contract documents.
- Poorly defined scope and inadequate design details:
- Define the scope accurately when you have enough information about the project and do not define it too early with little information.
- Ensure the schedule and resource plan is centered on the defined deliverables.
- Measure performance against the project’s baseline.
- Involve stakeholders in the project work and have their input to define and review the client requirements.
- Allocate sufficient time for design and the production of design documents.
- Clearly define the project’s constraints in terms of time, budget, and resources.
- Evaluate scope, schedule impact, and resource requirements before any new activities are included within the schedule.
- Use clear language and terms to describe the project’s scope and avoid vague statements.
- Check the completeness of contract documents.
- Review contract documents to avoid omissions, discrepancies, errors, mistakes, and mismatches.
- Weather conditions:
- Be proactive and monitor upcoming weather reports.
- Use weather risk management software to manage extreme weather conditions.
- Install weather instruments at the project site to provide weather forecasting data. This includes data about wind, rain, snow, ice, temperature, etc.
- Use historical weather records for long-term planning.
- Make contingency plans for extreme weather events.
- Use safety personal protective equipment, such as hard hats, masks, goggles, and heavy-duty gloves when working outdoors in harsh weather conditions.
- Foster good communication on site among workers, vendors, and other stakeholders during harsh weather conditions to ensure that everyone is aware of the risks when bad weather strikes.
- Use good-quality construction equipment that is robust enough to withstand extreme weather conditions.
- Train construction workers on the potential risks of working outdoors during extreme weather, including common hazards such as falling debris, slippery surfaces, electrical accidents, etc. Training includes appropriate safety precautions to be taken as a protective measure against these risks.
- Schedule activities that require the use of cranes on clear days.
- Store materials on pallets and off the ground to protect them from standing water or flood situations, thereby limiting potential damage.
- Begin earthwork and trenching activities when the ground is dry and cover the trench before it rains.
- Install the exterior façade and windows as early as possible to protect the interior work.
- Start critical activities as early as possible and on clear days.
- Errors in the estimation of task durations:
- Clearly define the scope of work, including specifications, drawings, resource requirements (materials, labor, and equipment), and contingencies.
- Perform accurate quantity takeoff. Task durations are highly dependent upon the accurate estimation of task quantities.
- Estimate the number and productivity of crews needed for each task.
- Adjust durations for weather conditions and productivity factors.
- Review the accuracy of estimated task durations in order to identify the root causes of the task duration errors and the lessons learned from these mistakes. These lessons learned along with the best practices and recommendations for better estimates should be well documented and shared for future improvements.
- Monitor and control time estimates to track the actual times of activities and the project as a whole against the estimated baseline and measure the variances.
- Report the schedule progress of the individual activities and the project using the earned value technique, “schedule performance index”, or “schedule variance” and to the stakeholders regularly and honestly and implement corrective actions if the variances are significant or at unacceptable levels.
- Different site conditions:
- Carefully review all contract documents, including the project’s geotechnical investigation report.
- Conduct your own geotechnical investigation report to check the site’s underground conditions.
- Conduct site visits before submitting bids to assess any additional risks and inspect its accessibility, weather conditions, availability of services, bylaws, etc.
- Promptly report any unforeseen site conditions encountered.
- Include a clause in the contract about “latent conditions” to transfer the risk of differing site conditions to the client. The latent conditions clause generally states that if the contractor encounters a different condition during the execution of the work, the client will compensate the contractor for the resulting cost and/or time.
- Ask for as-built drawings of underground utilities and structures. These include existing cables, pipes, and other utilities on or near the site of the project.
8. Example of Using the Developed Framework
- The severity of the project’s bid price risk = (the estimated pessimistic price of the project—the project’s bid price (CS)) × (1—the probability of completing the project in its bid price value (CS)) = ($43,195,000 − $37,500,000) × (1 − 0.7809) = $1,247,775, where 0.7809 (or 78.09%) is the probability of completing the project in its bid price value.
- The estimated EAC of the project considering the risk associated with the project’s bid price = $41,208,791 + $1,247,775 = $42,456,566. The estimated EAC of $42,456,566 is compared to the $37,500,000 contractor’s original bid price and is used to mitigate the risk associated with the project’s bid price.
9. Risk Mitigation Strategies Suggested by Construction Experts
- Prepare a detailed risk management plan and implement it carefully.
- Obtain firm commitment from the organization for funding and staff.
- Seek feedback from construction experts to determine the likelihood of occurrence and impact of each risk event.
- Replan the work to avoid/remove some specific serious risks. It is important to note that avoiding a risk means taking another course of action so that the risk does not arise in new circumstances.
- Avoid overdesign and design using standard, modular, or well-understood methods. Do not reinvent the wheel.
- Avoid complex designs.
- Minimize safety and health issues that may result in a loss of project staff.
- Avoid untried or unfamiliar technology whenever practical and look for ways to achieve the required project specifications using tried-and-true technologies.
- Clearly document all project deliverables.
- Minimize changes.
- Have an effective change management process.
- Use a clear and consistent specification change control process.
- Consider the impact of external and environmental problems.
- Keep all contract documents current including drawings, specifications, bills of quantities, etc.
- When you use outside services, use experienced and reputable suppliers that you trust and have used successfully in the past.
- Ask for materials to be shipped early to avoid shipment delays.
- Rigorously manage outsourcing and control the work performed by others by managing and communicating external dependencies proactively.
- Detect and address problems in the project objective promptly.
- Rigorously track project resource use (resource management).
- Break large projects with large staff into smaller, parallel ones (e.g., work packages)
- Break long projects into phases that produce measurable outputs with scheduled project reviews at the end of each phase.
- Reduce the number of critical paths in a project to a minimum.
- Modify the work to have fewer activity dependencies.
- Schedule high-risk activities as early as possible.
- Take advantage of using the line of balance (LOB) technique to schedule repetitive activities and linear projects.
- Track progress with rigor and discipline, and report the status frequently.
- Build teamwork and trust in the project team.
- Avoid having the same staff members working on two successive or concurrent critical (or near-critical) activities.
- Decompose lengthy activities further.
- Reschedule work to provide better flexibility.
- Use a proper and effective project organizational structure.
- Obtain explicit availability commitments from all project staff and approvals from their managers and limit their commitments to other projects.
- Modify plans to reduce the load on excessively committed staff.
- Delegate risky work to experienced and successful problem solvers and use the best people available for the most critical activities.
- Train team members to use more efficient or faster methods and do it early in the project.
- Use mentoring to build teamwork and establish redundancy for critical skills.
- Implement the necessary safety measures on site, as required by OSHA.
- Upgrade or replace older equipment to make work more efficient.
- Automate manual work when possible.
- Gain access to experts to cover all skill areas not available in the project team.
- Minimize dependence on a single individual or another resource for project work.
- Establish contract terms with all suppliers and subcontractors that are consistent with project objectives.
- Be aware that the exercise of risk avoidance might increase the severity of other risks, introduce new risks, or result in a lost opportunity.
- Be aware that the exercise of risk reduction may result in residual risks.
- Provide sufficient and reliable data for a reasonably accurate qualitative and quantitative analysis of risks, which helps in mitigating risks.
- Establish a risk work breakdown structure and a risk register to track risks.
- Provide enough time to correctly estimate activities’ durations and quantities and pay attention to critical activities.
- Pay attention to areas where costs may increase and include contingencies in the project’s budget.
- Monitor the project’s schedule and cost and measure the project’s performance with earned value management.
- Have a clear and well-defined scope and avoid changing the scope of the project.
- Make sure that materials are delivered on time and track material and shop drawing submittals to make sure that they are approved on time.
- Assign a coordinator during the design and construction stages.
- Do not finalize the project’s budget until the plan and schedule are complete.
- Transfer risks where the impact is primely financial by reassigning accountability, responsibility, and authority to other stakeholders such as subcontractors and suppliers. This also includes insurance against theft, injury, damage to property or equipment, and third-party liabilities. Other examples include the use of equipment warranties, bid bonds, performance bonds, payment guarantees, and delivery methods (e.g., joint ventures, public–private partnership, franchises, design–build, build–operate–transfer, etc.).
- Continue the attempts to reduce risks iteratively until residual risks become as low as reasonably practicable.
10. Limitations and Recommendations for Future Work
- While a good percentage (58%) of the survey participants have more than 10 years of experience in the construction industry and their opinions might be reasonably true, the reliance on expert opinions may involve some subjectivity. This is because the feedback depends on the personal experiences of the respondents and may limit the generalization of the findings.
- While the sample size used in this study (52 participants) is quite representative, it is recommended to have a larger size in order to obtain more accurate and reliable results.
- Limiting the study to the construction industry in the UAE may not fully capture other risk factors, thus limiting the applicability of the results to the UAE. It is, therefore, recommended to expand the geographical scope of the research by including other countries. This will provide a comprehensive understanding of the risks associated with construction projects in a global context.
- The study is limited to municipalities, contractors, and design offices. It is suggested to include other construction stakeholders such as developers, specialty contractors, suppliers and vendors, and other participants.
- The study is limited to schedule and cost risk events. More research is needed considering other risk factors such as risks related to safety, political issues, the supply chain, etc.
- While the use of the PERT and EV techniques is quite effective, it may not encompass all the complexities of modern construction projects, particularly those involving advanced technologies and innovative construction methods.
- Future research should also explore the integration of emerging technologies such as building information modeling (BIM), artificial intelligence (AI), and machine learning (ML) in risk assessment and management, as these technologies have the potential of providing more precise and efficient risk analysis.
- Using other qualitative methods, such as in-depth interviews and case studies, along with the quantitative techniques could offer a more holistic understanding of the risk management process related to construction projects.
11. Concluding Remarks
Supplementary Materials
Author Contributions
Funding
Data Availability Statement
Acknowledgments
Conflicts of Interest
References
- Aven, T. Risk assessment and risk management: Review of recent advances on their foundation. Eur. J. Oper. Res. 2016, 253, 1–13. [Google Scholar] [CrossRef]
- Abu Qalbin, R.; Rabayah, H.; Darwish, M.; Abendeh, R. Assessment of construction risks in projects funded by external sources in Jordan during the COVID-19 pandemic. Buildings 2023, 13, 1885. [Google Scholar] [CrossRef]
- Nasrun, M.; Nawi, M.; Baluch, N.; Bahauddin, A. Impact of Fragmentation Issue in Construction Industry: An Overview. In Proceedings of the Building Surveying, Facilities Management and Engineering Conference (BSFMEC 2014), Perak, Malaysia, 27 August 2014; Volume 15, p. 01009. [Google Scholar] [CrossRef]
- Prebanić, K.R.; Vukomanović, M. Exploring Stakeholder Engagement Process as the Success Factor for Infrastructure Projects. Buildings 2023, 13, 1785. [Google Scholar] [CrossRef]
- Love, P.; Matthews, J. When ‘less is more’: The rationale for an adaptive toolbox to manage the risk and uncertainty of rework. Dev. Built Environ. 2022, 12, 100084. [Google Scholar] [CrossRef]
- Tamošaitienė, J.; Sarvari, H.; Chan, D.W.M.; Cristofaro, M. Assessing the Barriers and Risks to Private Sector Participation in Infrastructure Construction Projects in Developing Countries of Middle East. Sustainability 2022, 13, 153. [Google Scholar] [CrossRef]
- Taroun, A. Towards a better modelling and assessment of construction risk: Insights from a literature review. Int. J. Proj. Manag. 2014, 32, 101–115. [Google Scholar] [CrossRef]
- Kuru, K.; Artan, D. Riesgo: A knowledge-based qualitative risk assessment system for PPP projects. Buildings 2024, 14, 953. [Google Scholar] [CrossRef]
- Dey, P.K. Decision support system for risk management: A case study. Manag. Decis. 2001, 39, 634–649. [Google Scholar] [CrossRef]
- El-Sayegh, S.M. Risk assessment and allocation in UAE construction industry. Int. J. Proj. Manag. 2007, 26, 431–438. [Google Scholar] [CrossRef]
- Laryea, S.; Hughes, W. How contractors price risk in bids: Theory and practice. Constr. Manag. Econ. 2008, 26, 911–924. [Google Scholar] [CrossRef]
- Clark, R.M.; Besterfield-Sacre, M.E. A new approach to hazardous materials transportation risk analysis: Decision modeling to identify critical variables. Risk Anal. 2009, 29, 344–354. [Google Scholar] [CrossRef]
- Qiao, Y.; Keren, N.; Mannan, M.S. Utilization of accident databases and fuzzy sets to estimate frequency of HazMat transport accidents. J. Hazard. Mater. 2009, 167, 374–382. [Google Scholar] [CrossRef]
- Kim, S.-Y.; Tuan, N.V.; Ogunlana, S.O. Quantifying schedule risk in construction projects using Bayesian belief networks. Int. J. Proj. Manag. 2009, 27, 39–50. [Google Scholar]
- Meacham, B.J. Risk-informed performance-based approach to building regulation. J. Risk Res. 2010, 13, 877–893. [Google Scholar] [CrossRef]
- Linthicum, A.S.; Lambert, J.H. Risk management for infrastructure corridors vulnerable to adjacent land development. J. Risk Res. 2010, 13, 983–1006. [Google Scholar] [CrossRef]
- Li, H.X.; Al-Hussein, M.; Lei, Z.; Ajweh, Z. Risk identification and assessment of modular construction utilizing fuzzy analytic hierarchy process (AHP) and simulation. Can. J. Civ. Eng. 2013, 40, 1184–1195. [Google Scholar] [CrossRef]
- Hwang, B.-G.; Zhao, X.; Toh, L.P. Risk management in small construction projects in Singapore: Status, barriers and impact. Int. J. Proj. Manag. 2014, 32, 116–124. [Google Scholar] [CrossRef]
- Creemers, S.; Demeulemeester, E.; Van de Vonder, S. A new approach for quantitative risk analysis. Ann. Oper. Res. 2014, 213, 27–65. [Google Scholar] [CrossRef]
- Mouraviev, N.; Kakabadse, N.K. Risk allocation in a public–private partnership: A case study of construction and operation of kindergartens in Kazakhstan. J. Risk Res. 2014, 17, 621–640. [Google Scholar] [CrossRef]
- Hossen, M.M.; Kang, S.; Kim, J. Construction schedule delay risk assessment by using combined AHP-RII methodology for an international NPP project. Nucl. Eng. Technol. 2015, 47, 362–379. [Google Scholar] [CrossRef]
- Gunduz, M.; Nielsen, Y.; Ozdemir, M. Fuzzy assessment model to estimate the probability of delay in Turkish construction projects. J. Manag. Eng. 2015, 31, 04014055. [Google Scholar] [CrossRef]
- Muneeswaran, G.; Manoharan, P.; Awoyera, P.O.; Adesina, A. A statistical approach to assess the schedule delays and risks in Indian construction industry. Int. J. Constr. Manag. 2018, 20, 450–461. [Google Scholar] [CrossRef]
- Budayan, C.; Dikmen, I.; Birgonul, T.; Ghaziani, A. A computerized method for delay risk assessment based on fuzzy set theory using MS ProjectTM. KSCE J. Civ. Eng. 2018, 22, 2714–2725. [Google Scholar] [CrossRef]
- Farooq, M.U.; Thaheem, M.J.; Arshad, H. Improving the risk quantification under behavioural tendencies: A tale of construction projects. Int. J. Proj. Manag. 2018, 36, 414–428. [Google Scholar] [CrossRef]
- El-Kholy, A.M. Exploring the best ANN model based on four paradigms to predict delay and cost overrun percentages of highway projects. Int. J. Constr. Manag. 2019, 21, 694–712. [Google Scholar] [CrossRef]
- Muizz, O.S.-A.; Rosli, M.Z.; Sunday, O.O. Machine learning model for delay risk assessment in tall building projects. Int. J. Constr. Manag. 2020, 22, 2134–2143. [Google Scholar] [CrossRef]
- El-Rasas, T.; Marzouk, M. Fuzzy model for assessing delays in Egyptian residential projects. J. Financ. Manag. Prop. Constr. 2020, 25, 225–246. [Google Scholar] [CrossRef]
- Gondia, A.; Siam, A.; El-Dakhakhni, W.; Nassar, A.H. Machine learning algorithms for construction projects delay risk prediction. J. Constr. Eng. Manag. 2020, 146, 04019085. [Google Scholar] [CrossRef]
- Boateng, A.; Ameyaw, C.; Mensah, S. Assessment of systematic risk management practices on building construction projects in Ghana. Int. J. Constr. Manag. 2020, 22, 3128–3136. [Google Scholar] [CrossRef]
- Zhang, L.; Huang, Y.; Wu, X.; Skibniewski, M.J. Risk-based estimate for operational safety in complex projects under uncertainty. Appl. Soft Comput. 2017, 54, 108–120. [Google Scholar] [CrossRef]
- Zou, Y.; Kiviniemi, A.; Jones, S.W. A review of risk management through BIM and BIM-related technologies. Safety Science 2017, 97, 88–98. [Google Scholar] [CrossRef]
- Sami Ur Rehman, M.; Thaheem, M.J.; Nasir, A.; Khan, K.I.A. Project schedule risk management through building information modelling. Int. J. Constr. Manag. 2020, 22, 1489–1499. [Google Scholar] [CrossRef]
- Hoseini, E.; Hertogh, M.; Bosch-Rekveldt, M. Developing a generic risk maturity model (GRMM) for evaluating risk management in construction projects. J. Risk Res. 2021, 24, 889–908. [Google Scholar] [CrossRef]
- Pham, D.-H.; Ly, D.-H.; Tran, N.-K.; Ahn, Y.-H.; Jang, H. Developing a risk Management process for general Contractors in the bidding stage for design–build projects in Vietnam. Buildings 2021, 11, 542. [Google Scholar] [CrossRef]
- Chatzimichailidoua, M.; Ma, Y. Using BIM in the safety risk management of modular construction. Saf. Sci. 2022, 154, 105852. [Google Scholar] [CrossRef]
- El Khatib, M.; Alnaqbi, K.; Alzoubi, H.M. BIM as a tool to optimize and manage project risk management. J. Mech. Eng. 2022, 7, 6307–6323. [Google Scholar]
- Zhao, X. Evolution of construction risk management research: Historiography and keyword co-occurrence analysis. Eng. Constr. Arch. Manag. 2022, 31, 1408–1428. [Google Scholar] [CrossRef]
- Mohamed, A.G.; Ammar, M.H.; Nabawy, M. Risks assessment using structural equation modeling: Mega housing projects construction in Egypt. Int. J. Constr. Manag. 2022, 23, 2717–2728. [Google Scholar] [CrossRef]
- Alfadil, M.O.; Kassem, M.A.; Ali, K.N.; Alaghbari, W. Construction industry from perspective of force Majeure and environmental risk compared to the COVID-19 outbreak: A systematic literature review. Sustainability 2022, 14, 1135. [Google Scholar] [CrossRef]
- Wang, K.; Ying, Z.; Goswami, S.; Yin, Y.; Zhao, Y. Investigating the role of artificial intelligence technologies in the construction industry using a Delphi-ANP-TOPSIS hybrid MCDM concept under a fuzzy environment. Sustainability 2023, 15, 11848. [Google Scholar] [CrossRef]
- Antoniou, F.; Tsioulpa, A.V. Assessing the delay, cost, and quality risks of claims on construction contract performance. Buildings 2024, 14, 333. [Google Scholar] [CrossRef]
- You, Z.; Feng, L. Integration of industry 4.0 related technologies in construction industry: A framework of cyber-physical system. IEEE Access 2020, 8, 122908–122922. [Google Scholar] [CrossRef]
- García de Soto, B.; Juan, I.A.; Joss, S.; Hunhevicz, J. Implications of Construction 4.0 to the workforce and organizational structures. Int. J. Constr. Manag. 2019, 22, 205–217. [Google Scholar] [CrossRef]
- El-Sayegh, S. Project risk management practices in the UAE construction industry. Int. J. Proj. Organ. Manag. 2014, 6, 121–137. [Google Scholar] [CrossRef]
- Antoniou, F.; Agrafioti, N.F.; Aretoulis, G. Should we depend on expert opinion or statistics? a meta-analysis of accident-contributing factors in construction. Buildings 2024, 14, 910. [Google Scholar] [CrossRef]
- PMI. A Guide to the Project Management Body of Knowledge (PMBOK Guide), 7th ed.; Project Management Institute: Pennsylvania, PA, USA, 2021. [Google Scholar]
- ISO 31000:2018; Risk Management—Guidelines. International Organization for Standardization (ISO): Geneva, Switzerland, 2018.
- DOD, Department of Defense. DoD Risk Management Guide for Defense Acquisition Programs; United States Department of Defense: Arlington, VA, USA, 2017. [Google Scholar]
- ISO/IEC 31010:2019; Risk Management—Risk Assessment Techniques. International Organization for Standardization (ISO): Geneva, Switzerland, 2019.
- SA/SNZ HB 89:2013; Risk Management—Guidelines on Risk Assessment Techniques. SAI Global Limited: Sydney, Australia, 2013.
- PMI. Practice Standard for Project Risk Management; Project Management Institute: Pennsylvania, PA, USA, 2009. [Google Scholar]
- Jepson, J.; Kirytopoulos, K.; London, K. Insights into the application of risk tools and techniques by construction project managers. Int. J. Constr. Manag. 2020, 20, 848–866. [Google Scholar] [CrossRef]
- Lyons, T.; Skitmore, M. Project risk management in the Queensland engineering construction industry: A survey. Int. J. Proj. Manag. 2004, 22, 51–61. [Google Scholar] [CrossRef]
- Le, C.; Jeong, H.D.; Bukkapatnam, S. Pareto Principle in scoping-phase cost estimating: A multiobjective optimization approach for selecting and applying optimal major work items. J. Constr. Eng. Manag. 2022, 148, 04022076. [Google Scholar] [CrossRef]

| Likelihood of Occurrence | Impact | RII |
|---|---|---|
| Rare (RAR) | Insignificant (INS) | <20% |
| Unlikely (UNL) | Minor (MIN) | ≥20% to <40% |
| Possible (POS) | Moderate (MOD) | ≥40% to <60% |
| Likely (LIK) | Major (MAJ) | ≥60% to <80% |
| Almost Certain (ALC) | Catastrophic (CAT) | ≥80% |
| City | Surveys Distributed | Responses Received | Response Rate (%) |
|---|---|---|---|
| Abu Dhabi | 27 | 21 | 78% |
| Dubai | 25 | 19 | 76% |
| Sharjah | 5 | 3 | 60% |
| Ajman | 4 | 3 | 75% |
| Ras Al-Khaimah | 3 | 2 | 67% |
| Al-Fujairah | 2 | 2 | 100% |
| Umm Al-Quwain | 1 | 1 | 100% |
| Al-Ain | 1 | 1 | 100% |
| Total | 68 | 52 | 76% |
| Risk Event | Likelihood | ||||
|---|---|---|---|---|---|
| 1 (RAR) | 2 (UNL) | 3 (POS) | 4 (LIK) | 5 (ALC) | |
| Late delivery of materials | 3 | 8 | 15 | 14 | 12 |
| Scope change (additions/deletions) | 3 | 5 | 11 | 18 | 15 |
| Efficiency, late arrival, and downtime of equipment | 7 | 18 | 16 | 7 | 4 |
| Rework due to design errors and conflicts in contract documents | 10 | 13 | 10 | 11 | 8 |
| Errors in the estimation of quantities and costs | 4 | 6 | 18 | 11 | 13 |
| Limited funds | 12 | 20 | 10 | 6 | 4 |
| Quality problems (poor quality and failure to meet specifications) | 6 | 14 | 10 | 11 | 11 |
| Availability of skilled resources | 7 | 12 | 17 | 9 | 7 |
| Complex design | 10 | 14 | 16 | 8 | 4 |
| Delay in the approval of materials and shop drawings | 3 | 7 | 12 | 16 | 14 |
| Poor coordination during design and construction | 2 | 8 | 15 | 15 | 12 |
| Poorly defined scope and inadequate design details | 4 | 7 | 12 | 15 | 14 |
| Weather conditions | 14 | 16 | 15 | 5 | 2 |
| Errors in the estimation of task durations | 2 | 7 | 11 | 15 | 17 |
| Different site conditions | 11 | 18 | 16 | 4 | 3 |
| Risk Event | Impact | ||||
|---|---|---|---|---|---|
| 1 (INS) | 2 (MIN) | 3 (MOD) | 4 (MAJ) | 5 (CAT) | |
| Late delivery of materials | 3 | 8 | 17 | 11 | 13 |
| Scope change (additions/deletion) | 2 | 10 | 14 | 14 | 12 |
| Efficiency, late arrival, and downtime of equipment | 3 | 7 | 13 | 15 | 14 |
| Rework due to design errors and conflicts in contract documents | 5 | 8 | 16 | 11 | 12 |
| Errors in the estimation of quantities and costs | 2 | 8 | 15 | 15 | 12 |
| Limited funds | 6 | 8 | 16 | 12 | 10 |
| Quality problems (poor quality and failure to meet specifications) | 6 | 10 | 17 | 11 | 8 |
| Availability of skilled resources | 4 | 7 | 16 | 12 | 13 |
| Complex design | 1 | 8 | 14 | 17 | 12 |
| Delay in the approval of materials and shop drawings | 6 | 9 | 16 | 12 | 9 |
| Poor coordination during design and construction | 6 | 11 | 17 | 11 | 7 |
| Poorly defined scope and inadequate design details | 3 | 5 | 14 | 16 | 14 |
| Weather conditions | 12 | 17 | 15 | 5 | 3 |
| Errors in the estimation of task durations | 6 | 7 | 15 | 12 | 12 |
| Different site conditions | 9 | 16 | 15 | 8 | 4 |
| Risk Event | Likelihood | Impact | Severity | Rank | |||
|---|---|---|---|---|---|---|---|
| RII | Level | RII | Level | ||||
| Late delivery of materials | 69.2% | LIK | 68.8% | MAJ | 47.7% | HIG | 5 |
| Scope change (additions/deletion) | 74.2% | ALC | 69.2% | MAJ | 51.3% | EXT | 2 |
| Efficiency, late arrival, and downtime of equipment | 53.5% | UNL | 71.5% | CAT | 38.2% | MED | 11 |
| Rework due to design errors and conflicts in contract documents | 57.7% | POS | 66.5% | MAJ | 38.4% | MED | 10 |
| Errors in the estimation of quantities and costs | 68.8% | LIK | 70.4% | CAT | 48.5% | HIG | 4 |
| Limited funds | 48.5% | RAR | 64.6% | MOD | 31.3% | LOW | 13 |
| Quality problems (poor quality and failure to meet specifications) | 62.7% | POS | 61.9% | MOD | 38.8% | MED | 9 |
| Availability of skilled resources | 58.8% | POS | 68.8% | MAJ | 40.5% | HIG | 8 |
| Complex design | 53.1% | UNL | 71.9% | CAT | 38.1% | MED | 12 |
| Delay in the approval of materials and shop drawings | 71.9% | ALC | 63.5% | MOD | 45.6% | HIG | 6 |
| Poor coordination during design and construction | 70.4% | ALC | 60.8% | MOD | 42.8% | HIG | 7 |
| Poorly defined scope and inadequate design details | 70.8% | ALC | 72.7% | CAT | 51.4% | EXT | 1 |
| Weather conditions | 46.5% | RAR | 48.5% | INS | 22.6% | NEG | 15 |
| Errors in the estimation of task durations | 74.6% | ALC | 66.5% | MAJ | 49.6% | HIG | 3 |
| Different site conditions | 48.5% | RAR | 53.1% | MIN | 25.7% | LOW | 14 |
| Risk Event | Likelihood | Impact | Severity | |||
|---|---|---|---|---|---|---|
| Mean | SD | Mean | SD | Mean | SD | |
| Late delivery of materials | 3.46 | 2.43 | 3.44 | 2.46 | 2.38 | 1.19 |
| Scope change (additions/deletion) | 3.71 | 3.25 | 3.46 | 2.37 | 2.56 | 1.54 |
| Efficiency, late arrival, and downtime of equipment | 2.67 | 1.50 | 3.58 | 2.76 | 1.91 | 0.83 |
| Rework due to design errors and conflicts in contract documents | 2.88 | 1.28 | 3.33 | 2.22 | 1.92 | 0.57 |
| Errors in the estimation of quantities and costs | 3.44 | 2.56 | 3.52 | 2.54 | 2.42 | 1.30 |
| Limited funds | 2.42 | 1.01 | 3.23 | 2.01 | 1.57 | 0.41 |
| Quality problems (poor quality and failure to meet specifications) | 3.13 | 1.78 | 3.10 | 1.79 | 1.94 | 0.64 |
| Availability of skilled resources | 2.94 | 1.57 | 3.44 | 2.47 | 2.03 | 0.77 |
| Complex design | 2.65 | 1.36 | 3.60 | 2.74 | 1.91 | 0.75 |
| Delay in the approval of materials and shop drawings | 3.60 | 2.85 | 3.17 | 1.89 | 2.28 | 1.08 |
| Poor coordination during design and construction | 3.52 | 2.54 | 3.04 | 1.73 | 2.14 | 0.88 |
| Poorly defined scope and inadequate design details | 3.54 | 2.74 | 3.63 | 2.93 | 2.57 | 1.61 |
| Weather conditions | 2.33 | 1.37 | 2.42 | 1.34 | 1.13 | 0.37 |
| Errors in the estimation of task durations | 3.73 | 3.26 | 3.33 | 2.24 | 2.48 | 1.46 |
| Different site conditions | 2.42 | 1.54 | 2.65 | 1.31 | 1.29 | 0.40 |
| Severity | Level of Risk Severity |
|---|---|
| Negligible (NEG) | <4% |
| Low (LOW) | ≥4% to <16% |
| Medium (MED) | ≥16% to <40% |
| High (HIG) | ≥40% to <60% |
| Extreme (EXT) | ≥60% |
| Likelihood | ALC | MED | MED | HIG | EXT | EXT |
| LIK | LOW | MED | HIG | EXT | EXT | |
| POS | LOW | MED | MED | HIG | HIG | |
| UNL | LOW | LOW | MED | MED | MED | |
| RAR | NEG | LOW | LOW | LOW | MED | |
| INS | MIN | MOD | MAJ | CAT | ||
| Impact | ||||||
| Task | Time (Days) | Cost ($) | ||||||||
|---|---|---|---|---|---|---|---|---|---|---|
| O | M | P | te | σ | O | M | P | Ce | σ | |
| 1–2 | 2 | 6 | 9 | 5.83 | 1.17 | 120,000 | 150,000 | 190,000 | 151,667 | 11,667 |
| 2–3 | 1 | 4 | 8 | 4.17 | 1.17 | 50,000 | 75,000 | 95,000 | 74,167 | 7500 |
| 2–4 | 8 | 10 | 13 | 10.17 | 0.83 | 135,000 | 150,000 | 170,000 | 150,833 | 5833 |
| 3–7 | 3 | 6 | 8 | 5.83 | 0.83 | 70,000 | 85,000 | 100,000 | 85,000 | 5000 |
| 3–9 | 7 | 9 | 12 | 9.17 | 0.83 | 150,000 | 170,000 | 195,000 | 170,833 | 7500 |
| 4–5 | 6 | 9 | 13 | 9.17 | 1.17 | 240,000 | 250,000 | 270,000 | 251,667 | 5000 |
| 4–8 | 5 | 7 | 10 | 7.17 | 0.83 | 190,000 | 210,000 | 240,000 | 211,667 | 8333 |
| 4–7 | Dummy | |||||||||
| 5–6 | 4 | 6 | 8 | 6.00 | 0.67 | 135,000 | 150,000 | 170,000 | 150,833 | 5833 |
| 5–8 | Dummy | |||||||||
| 6–10 | 2 | 3 | 5 | 3.17 | 0.50 | 450,000 | 550,000 | 600,000 | 541,667 | 25,000 |
| 7–8 | 12 | 14 | 17 | 14.17 | 0.83 | 1,240,000 | 1,280,000 | 1,330,000 | 1,281,667 | 15,000 |
| 7–9 | 5 | 8 | 12 | 8.17 | 1.17 | 740,000 | 900,000 | 1,100,000 | 906,667 | 60,000 |
| 7–15 | 7 | 9 | 12 | 9.17 | 0.83 | 120,000 | 140,000 | 170,000 | 141,667 | 8333 |
| 8–11 | 7 | 10 | 12 | 9.83 | 0.83 | 340,000 | 360,000 | 390,000 | 361,667 | 8333 |
| 9–12 | 9 | 11 | 14 | 11.17 | 0.83 | 2,250,000 | 2,400,000 | 2,700,000 | 2,425,000 | 75,000 |
| 10–11 | 3 | 5 | 8 | 5.17 | 0.83 | 730,000 | 750,000 | 900,000 | 771,667 | 28,333 |
| 10–13 | 5 | 7 | 11 | 7.33 | 1.00 | 40,000 | 55,000 | 65,000 | 54,167 | 4167 |
| 11–14 | 5 | 8 | 10 | 7.83 | 0.83 | 4,500,000 | 5,000,000 | 7,000,000 | 5,250,000 | 416,667 |
| 12–15 | 8 | 10 | 13 | 10.17 | 0.83 | 95,000 | 100,000 | 110,000 | 100,833 | 2500 |
| 13–14 | 3 | 5 | 8 | 5.17 | 0.83 | 7,000,000 | 8,000,000 | 10,000,000 | 8,166,667 | 500,000 |
| 14–15 | 3 | 5 | 8 | 5.17 | 0.83 | 10,500,000 | 11,000,000 | 12,000,000 | 11,083,333 | 250,000 |
| 15–16 | 6 | 8 | 11 | 8.17 | 0.83 | 4,200,000 | 4,500,000 | 5,400,000 | 4,600,000 | 200,000 |
| Task | Delay (Days) | Expected Risk Event | Severity |
|---|---|---|---|
| 2–3 | 2 | Scope change (additions) | EXT (51.4%) |
| 2–4 * | 1 | Late delivery of materials | HIG (47.7%) |
| 3–9 | 2 | Availability of skilled resources | HIG (40.5%) |
| 5–6 | 1 | Errors in the estimation of task durations | HIG (49.6%) |
| 7–9 | 3 | Late delivery of materials | HIG (47.7%) |
| 7–15 | 1 | Weather conditions | NEG (22.6%) |
| 8–11 * | 1 | Availability of skilled resources | HIG (40.5%) |
| 9–12 | 3 | Complex design | MED (38.2%) |
| 14–15 * | 1 | Weather conditions | NEG (22.6%) |
| 15–16 * | 4 | Late delivery of materials | HIG (47.7%) |
Disclaimer/Publisher’s Note: The statements, opinions and data contained in all publications are solely those of the individual author(s) and contributor(s) and not of MDPI and/or the editor(s). MDPI and/or the editor(s) disclaim responsibility for any injury to people or property resulting from any ideas, methods, instructions or products referred to in the content. |
© 2024 by the authors. Licensee MDPI, Basel, Switzerland. This article is an open access article distributed under the terms and conditions of the Creative Commons Attribution (CC BY) license (https://creativecommons.org/licenses/by/4.0/).
Share and Cite
Zaneldin, E.; Ahmed, W. A Generic Framework for Managing Schedule and Cost Risks of Construction Activities Using PERT and the EV Technique. Buildings 2024, 14, 1918. https://doi.org/10.3390/buildings14071918
Zaneldin E, Ahmed W. A Generic Framework for Managing Schedule and Cost Risks of Construction Activities Using PERT and the EV Technique. Buildings. 2024; 14(7):1918. https://doi.org/10.3390/buildings14071918
Chicago/Turabian StyleZaneldin, Essam, and Waleed Ahmed. 2024. "A Generic Framework for Managing Schedule and Cost Risks of Construction Activities Using PERT and the EV Technique" Buildings 14, no. 7: 1918. https://doi.org/10.3390/buildings14071918
APA StyleZaneldin, E., & Ahmed, W. (2024). A Generic Framework for Managing Schedule and Cost Risks of Construction Activities Using PERT and the EV Technique. Buildings, 14(7), 1918. https://doi.org/10.3390/buildings14071918