Article

Evolution of High Toughness Cementitious Composites Gas Permeability after Thermal-Mechanical Coupling Damage

1
School of Hydraulic and Environmental Engineering, Changsha University of Science & Technology, Changsha 410114, China
2
Key Laboratory of Water-Sediment Sciences and Water Disaster Prevention of Hunan Province, Changsha 410114, China
*
Author to whom correspondence should be addressed.
Buildings 2024, 14(7), 1923; https://doi.org/10.3390/buildings14071923
Submission received: 3 April 2024 / Revised: 26 April 2024 / Accepted: 16 June 2024 / Published: 24 June 2024

Abstract

:
High-toughness cementitious composite (HTCC) may be considered for use as a concrete lining material for underground lined rock caverns in compressed air energy storage (CAES) power stations. This experiment investigated the effect of coupled thermal-mechanical cycling on the changes in the gas permeability and pore structure of HTCC. According to the different operating conditions of CAES power stations, nine test conditions were selected with a compressive stress of 10 MPa and a temperature of 150 °C. The test results show that the HTCC have a peak tensile strain of up to 1.6% and an average crack width of 41~49 μm, providing good toughness and crack control. The permeabilities of HTCC were all significantly larger after loading by thermal-mechanical coupling cycles, but the change in permeability was more sensitive to compressive stresses. When the compressive stress is lower than 7.5 MPa and the temperature is lower than 100 °C, the permeability of HTCC can be maintained within 10−18 m2 orders of magnitude after the thermal-mechanical coupling cycle, which can satisfy the requirement of CAES impermeability performance. When the compressive stress reaches 10 MPa, the HTCC’s critical pore size increases, the pore size coarsens, and the permeability resistance deteriorates rapidly.

1. Introduction

Compressed air energy storage (CAES), as a large-scale power storage technology, is an effective means to solve the problem of wind and light abandonment, improve the level of renewable energy consumption, and promote the achievement of the goals of “carbon peaking” and “carbon neutrality”. The underground lined rock caverns, as an important part of the normal operation and reliable safety of CAES power plants, are the key to guaranteeing the operational efficiency of CAES power plants. The underground lined rock caverns consist of three parts, the sealing layer, the concrete lining layer, and the perimeter rock, in which the concrete lining layer plays the role of transferring stress and assisting in the sealing of compressed air, and it is an important structure to guarantee the normal operation of underground gas storage caverns [1,2]. During the operation of the underground gas storage caverns, the air pressure and temperature inside the caverns undergo cyclic changes, and the cracking of ordinary concrete lining under the coupled cyclic action of alternating air pressure (mechanical) and variable temperature (thermal) is difficult to avoid [3]. The damage to the concrete is significantly random, and after the concrete cracking, the sealing performance of the gas storage caverns decreases, and the operating efficiency of the power station decreases. The study concluded that a daily leakage of less than 1% is required to ensure the operational efficiency of CAES power plants [4,5]. Therefore, the resistance of the concrete lining to cracking and permeability is critical to the proper operation of CAES power plants.
Jiang et al. [6,7] found that in gas storage caverns operating at air pressures of 2.0~10.0 MPa, the maximum circumferential strain of the concrete lining layer reached 5.45 × 10⁻⁴. Kim et al. [8] stated that the magnitude of tangential tensile stresses in the concrete lining layer for underground lined rock caverns with a burial depth of 100 m and a gas storage pressure of 5~8 MPa ranged from 2.4 to 5.26 MPa. Based on the above research results, high-toughness cementitious composite (HTCC) was prepared by blending polyvinyl alcohol (PVA) into the cement matrix [9,10,11]. HTCC combines good toughness and excellent crack control and can be considered an optional material for constructing concrete lining layers. However, due to the specialty working conditions of CAES underground gas storage caverns, the gas permeability of HTCCs under CAES working conditions should be in-vestigated in detail before considering its engineering application.
The operating conditions of HTCC lining layers in CAES artificially lined caverns are unique. The operating air pressure of the storage caverns at the Huntorf Salt Rock CAES power plant in Germany varies from 4.6 to 7.2 MPa, and the maximum temperature of the compressed air in its caverns exceeds 50 °C. Khaledi et al. [12] pointed out that when the operating air pressure in the caverns is 5.0~8.0 MPa, the temperature variation in the compressed air can even reach 55~110 °C if the cooling equipment used has a low heat conversion capacity. Jiang et al. [6,7] found that the temperature inside the underground lined rock caverns varies from −6 to 47 °C when the caverns operate at 2.0~10.0 MPa. As a result, the HTCC lining layers are subject to both cycling temperature and cycling stress under operating conditions at once, which fluctuates over a range depending on the operating conditions. In this case, the periodic thermal-mechanical coupling becomes a critical implication of the gas permeability of HTCC.
Most of the current research focuses on the effect of temperature changes on the mechanical properties of cementitious materials. Ye et al. [13] found that the gas permeability of cementitious materials decreased with the increase in the upper-temperature limit during each temperature cycle. However, when the number of temperature cycles increased, the gas permeability showed an overall increasing trend and concluded that the temperature cycles induced the generation of microcracks. Lin et al. [14] showed that the permeability of mortar increases with the increase of the upper of cycle temperature and the number of cycles. The main reason for the increase in porosity and permeability is the discrepancy between the coefficients of thermal expansion of the matrix and the aggregate. The above experimental study only considered the effect of cycling temperature on mortar permeability and did not consider the loading effect, which does not correspond to the actual operating conditions of CAES. A few scholars have considered the effects of fatigue loading and temperature effects on the mechanical properties of concrete. Zhao et al. [15] loaded cyclic stresses on high-strength concrete after high temperatures and found that the pore volume increased significantly with the number of cyclic stresses. Zhou et al. [16] found that stress loading leads to expanding microcracks produced by temperature action. Although the above studies considered the effects of temperature action and stress action on the mechanical properties of concrete, the temperature and stress were not loaded synchronously, which is still different from the actual working conditions of CAES.
Due to the uniqueness of the operating environment of CAES underground lined rock caverns, there are almost no studies on the gas permeability of HTCC materials under cycling temperature and cycling stress with simultaneous loading. Therefore, this paper simulates the operating environment of cyclic alternating load (mechanical) and variable temperature (thermal) in CAES underground lined rock caverns and carries out the temperature–pressure synchronous cyclic loading test, high-pressure gas permeability test, and mercury intrusion porosimetry test on HTCC specimens, to investigate the effect of thermal-mechanical coupling on the gas permeability properties and microstructure of HTCC.

2. Materials and Methods

2.1. Raw Materials and Mix Proportions of Specimens
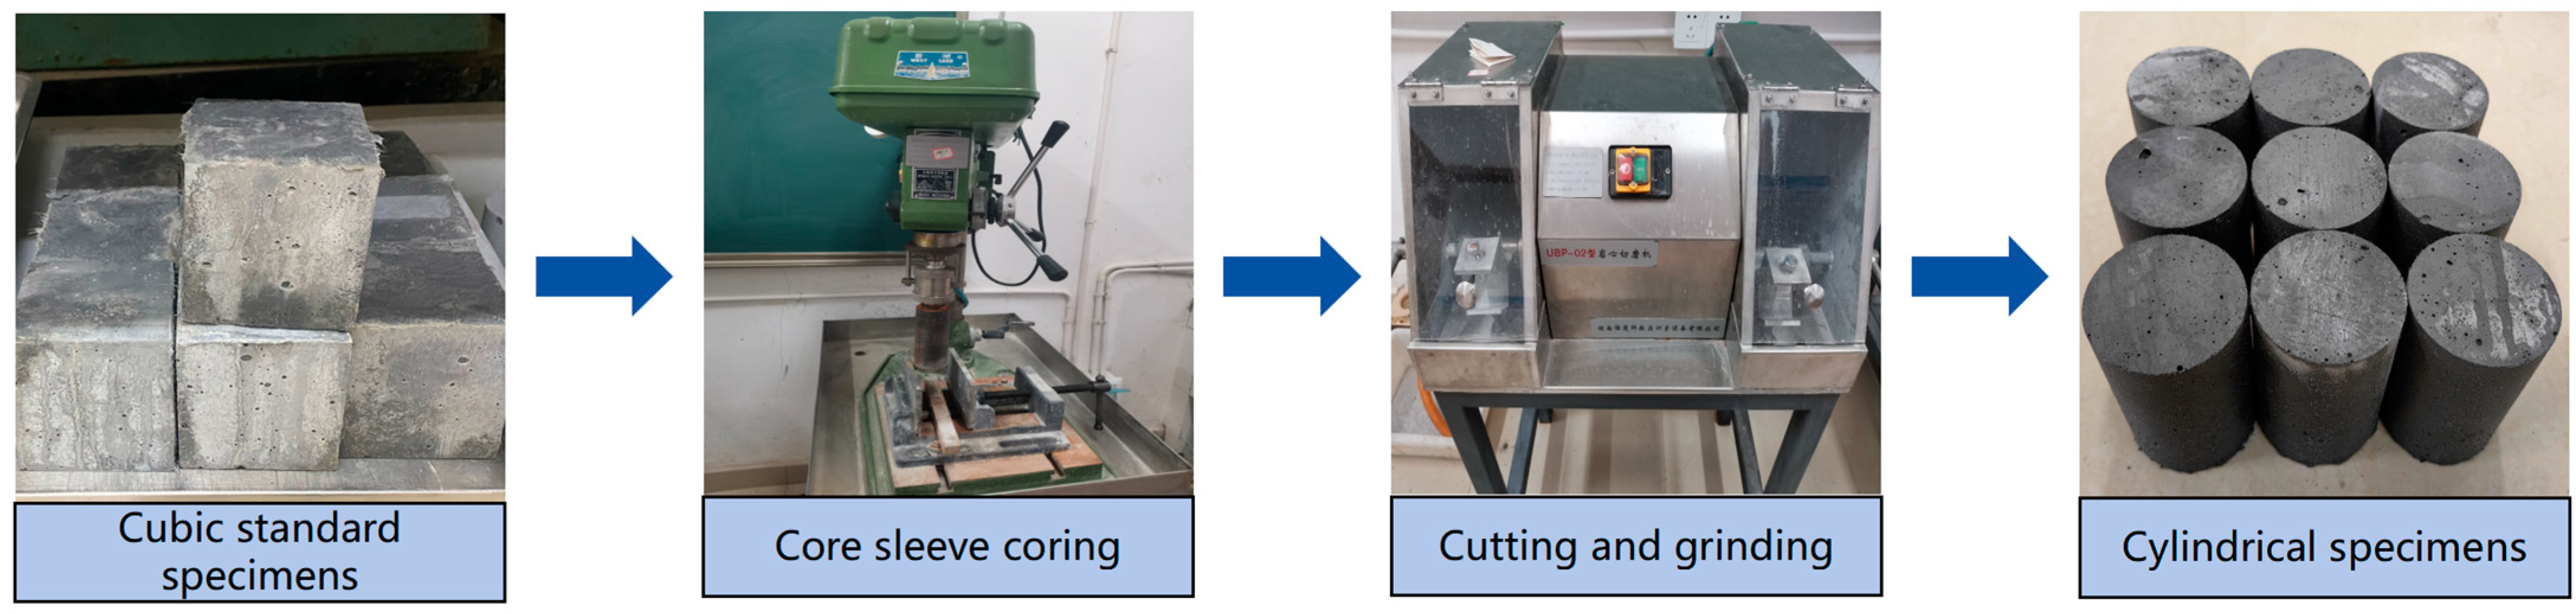
P.O42.5 ordinary Portland cement produced by Hunan Southern Cement Co., Ltd., Changsha, China was used in the test, and the fly ash was class I fly ash with a bulk density of 1.12 g/cm3. The fine aggregate was refined quartz sand with particle sizes between 70 and 160 mesh, and the fiber was PVA fibers. The design of mixing ratios for HTCC specimens is shown in Table 1. The best of the 6 groups of the mixing ratio designs, group A4, was selected for the high-pressure gas permeability test and mercury intrusion porosimetry test. The HTCC of group A4 had a PVA fibers dosage of 2.0% by volume, a water/cement ratio of 0.24, and a sand/cement ratio of 0.36, and it was mixed with ordinary tap water and admixtures during the mixing process.
The test is divided into three stages: ① Basic physical and mechanical properties test: We designed 6 groups of HTCC specimens (A1~A6) with ratios according to the strength grade of C30, and the basic physical and mechanical properties test was carried out by the Standard Test Method for Mechanical Properties of Ductile Reinforced Cementitious Composites (JC/T2461-2018) [17]. ② High-pressure gas permeation test: We choose the best group in the above 6 groups of material mixing ratios, and made 10 groups (C, T1~T9) of cube standard specimens with a side length of 70.7 mm cube standard specimens, of which C is the control group and T1~T9 are temperature and pressure synchronous cyclic loading groups, each group had 3specimens, for a total of 30 specimens, for the high-pressure gas permeation test. The specimens were unmoulded after 1 day of molding and taken out after 28 days of standard maintenance. Then, the cylindrical specimens with a diameter of φ 50 mm and a height of 50 mm were obtained by coring with a core drilling sleeve. The specimen process is shown in Figure 1. Water must be removed from the specimens before the high-pressure gas permeation test is carried out. The specimens were placed in a vacuum oven at 40 °C and dried slowly until the quality of the specimen was stable [13]. ③ Mercury intrusion porosimetry test: We took samples from the T1~T3, T6, and T9 groups of specimens after the high-pressure gas permeation test, and made samples of about 1 cm in size for the mercury intrusion porosimetry test.

2.2. Test Methods

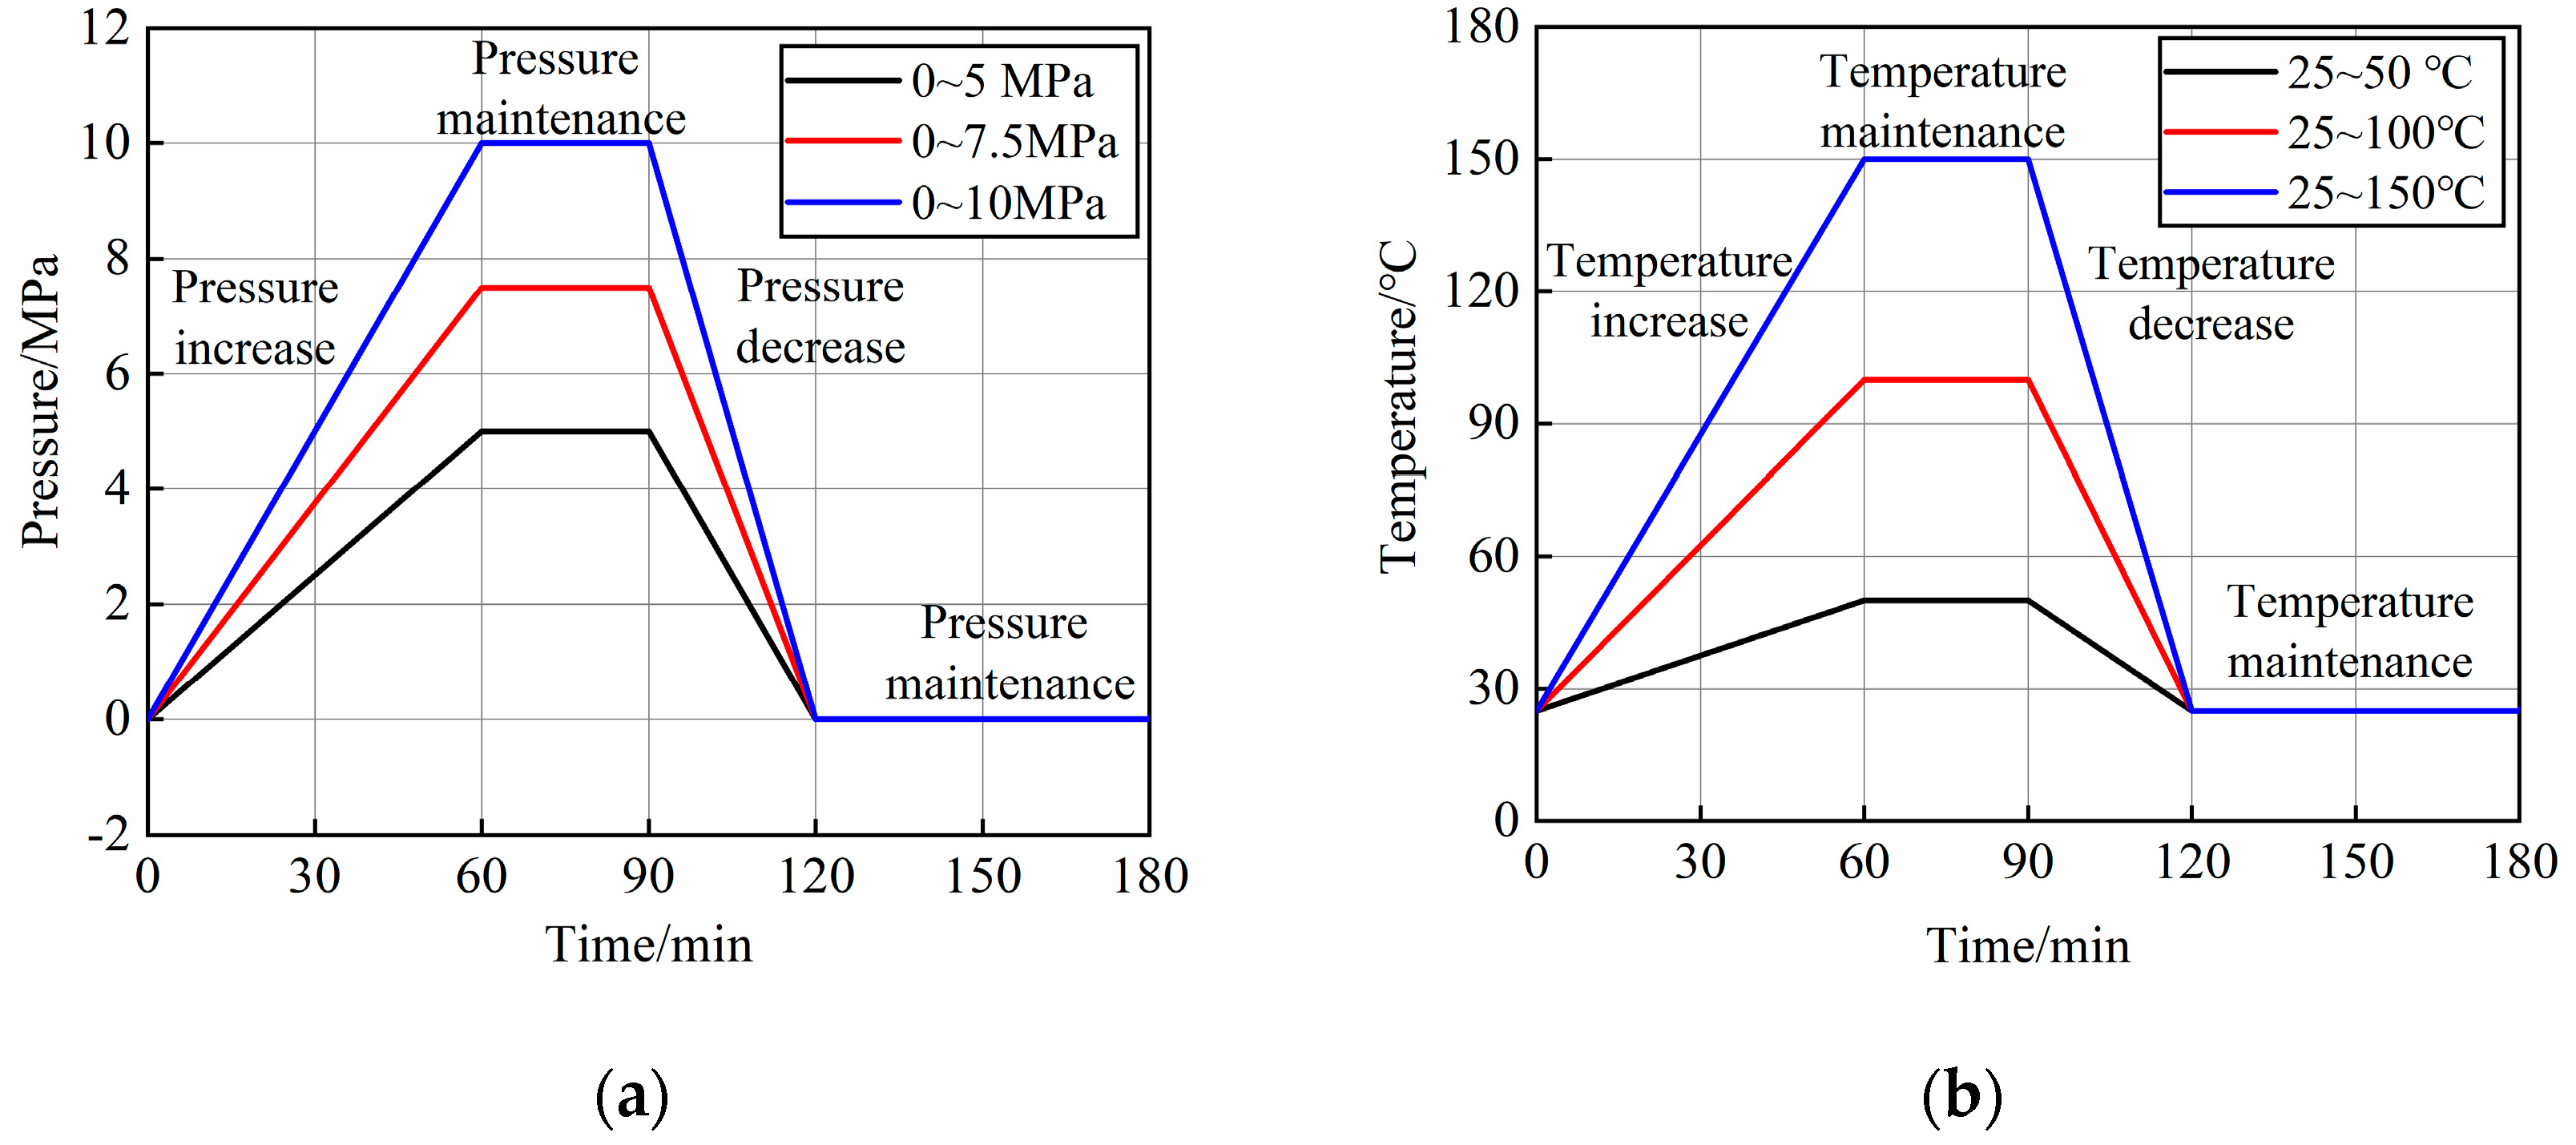
2.2.1. Temperature-Pressure Synchronous Cyclic Loading Test

We adopted a self-developed UWYSS-500 temperature–pressure synchronous cyclic loading tester to simulate the operating conditions of the CAES gas storage to load the specimen, as shown in Figure 2. The specimens were a cylindrical specimen of φ 50 mm in diameter and 50 mm in height. The test temperature and pressure control process were set as follows: pressure/temperature increase—pressure/temperature maintenance—pressure/temperature decrease—pressure/temperature maintenance. The specimens were placed into the test chamber of the instrument and the cycle temperature, cycle pressure, and cycles were set. The cycle loading and unloading control times are shown in Table 2. The number of cycles was 10.
According to the operating pressure of the existing CAES underground gas storage, the general operating air pressure inside the cavern is under 10 MPa. It has been shown that the temperature inside the cavern can reach about 150 °C when the air entry temperature is 20 °C and the maximum pressure inside the cavern is 10 MPa [18]. Based on this, the test pressure and temperature were set up for three groups of conditions, the cyclic loading and unloading test parameters are shown in Table 3, and the pressure and temperature control process lines are shown in Figure 3.

2.2.2. Temperature–Pressure Synchronous Cyclic Loading Test

The high-pressure gas permeation test was carried out using a self-developed high-pressure gas permeation tester, as shown in Figure 4.
We loaded the concrete specimen after temperature-pressure synchronous cyclic loading into the gripper of the penetrometer, tightened the gripper, and adjusted the pressure to the appropriate value with the regulator. The inlet pressures were taken as 1 MPa, 2 MPa, 3 MPa, 4 MPa, and 5 MPa, and the confining pressure was 8 MPa. The high-pressure permeation gas is N2. When the test was completed, we opened the pressure relief valve, and took out the specimen after the pressure was released. We used self-developed supporting software to automatically collect and record the pressure and flow rate values in the system, and draw pressure, flow rate, and time graphs.
The permeability is calculated by the following formula:
k = 2 Q μ L p 0 A ( p 2 p 0 2 ) ,
where: k is the permeability, m2; Q is the test flow rate, mL/min; μ is the gas viscosity, mPa·s; L is the length of the specimen, m; A is the cross-sectional area of the specimen, m2; p0 is the atmospheric pressure, taken as 0.1 MPa; and p the pressure of the inlet, MPa.

2.2.3. Mercury Intrusion Porosimetry Test

After the gas permeation test, samples from groups T1~T3, T6, and T9 were taken for the mercury intrusion porosimetry test. The samples with dimensions not larger than 0.5 cm × 0.5 cm × 1 cm were soaked in anhydrous ethanol and then dried and processed into the sample container of the apparatus, and pressurized gradually from 0 to 33,000 psi. By testing the number of volumes of mercury pressed into the samples at low and high pressures, the corresponding curves of the pore structure and pore volume of the samples were analyzed and obtained. The test apparatus was a Conta Pore Master 33 series mercury intrusion porosimetry tester.

3. Test Results and Analyses

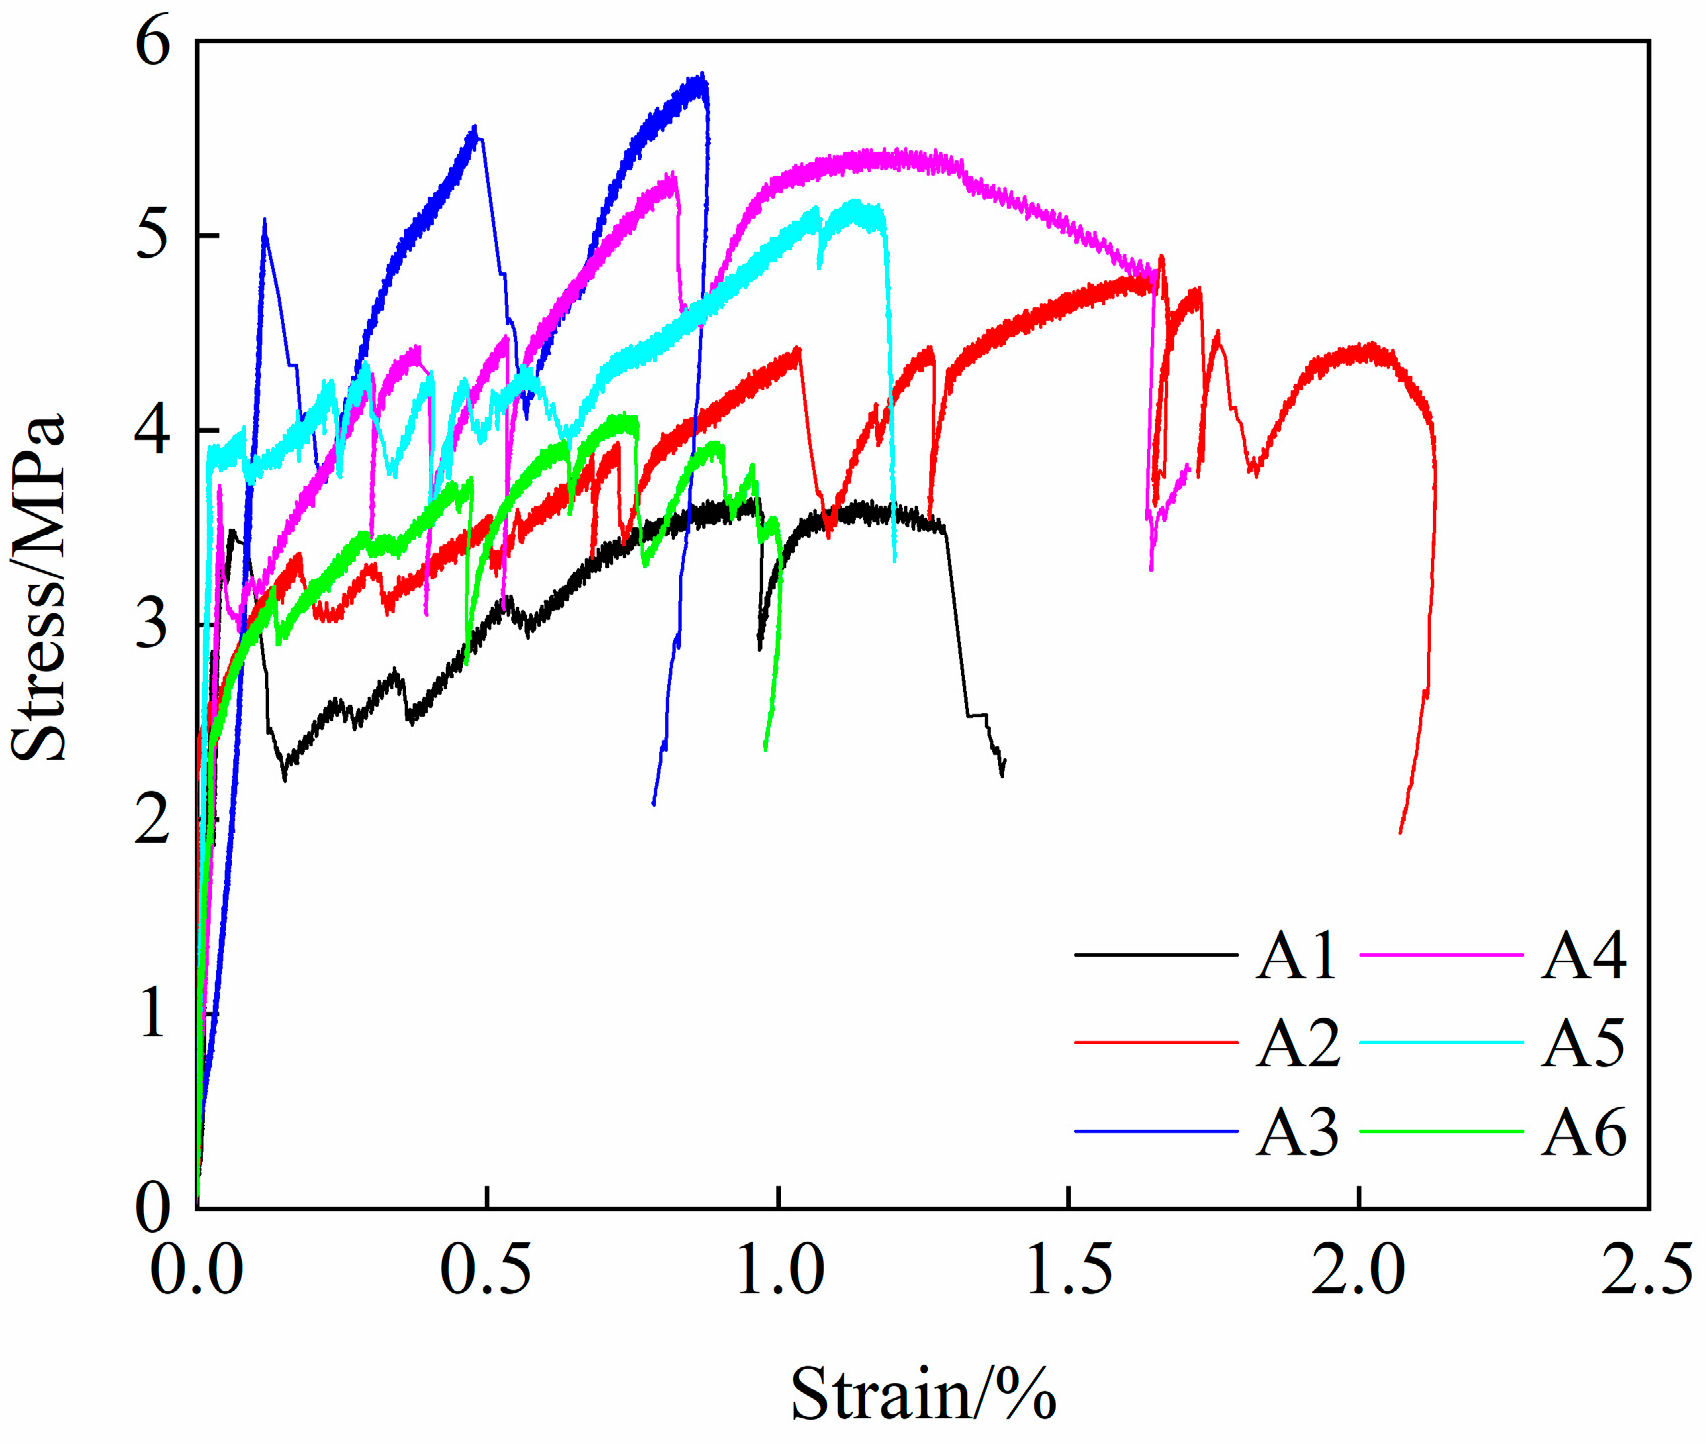
3.1. Basic Physical and Mechanical Properties of Test Materials

The basic mechanical property parameters of HTCC specimens are shown in Table 4. The compressive strengths of the six groups of specimens were 29.4~44.4 MPa, the initial crack strengths were 3.17~5.05 MPa, the ultimate tensile strengths were 3.65~5.81 MPa, the peak tensile strains were 0.7%~1.6%, the tensile modulus of elasticity was 8.4~10.8 GPa, the tensile-to-compression ratios were 0.15~0.20, and the average crack widths ranged from 41 to 49 μm, indicating that the HTCC have a very good tensile toughness and crack control ability. The tensile stress–strain curves of HTCC specimens are shown in Figure 5. After the tensile curve reaches the first turning point (cracking point), the tensile stress rises with increasing deformation in the form of sawtooth fluctuation, which is a typical “tensile strain hardening” behavior. The apparent morphology after stretching is shown in Figure 6. The specimen will not be destroyed immediately after the initial cracking, but multiple parallel microcracks will appear with the increase in the load, and the damage will extend to the weakest section after reaching the strength limit value, which belongs to the multi-seam cracking damage mode.
The maximum operating pressure of CAES underground gas storage caverns is generally set at 10 MPa or less, and it has been shown that the tensile stress generated by the concrete lining structure in the service environment can reach 1.4~5.26 MPa, the maximum longitudinal strain can reach 4.27 × 10⁻⁴, and the maximum circumferential strain can reach 5.45 × 10⁻⁴ [6,19,20,21]. From the perspective of compressive strength, A1~A6 are comparable with the same grade of C30 ordinary concrete, which meets the performance requirements of the concrete lining structure of CAES underground gas storage caverns; from the perspective of tensile strength, the specimens of the A3 and A4 groups can meet the requirements of the above-mentioned research results. Considering that a better toughness of the concrete material can reduce the lining tangential tensile stress [19], while the specimens of the A4 group have a smaller modulus of elasticity, and the toughness is better, and after comparison, it is finally decided to use the HTCC material of the A4 group ratio as the lining material of the CAES underground gas storage caverns.

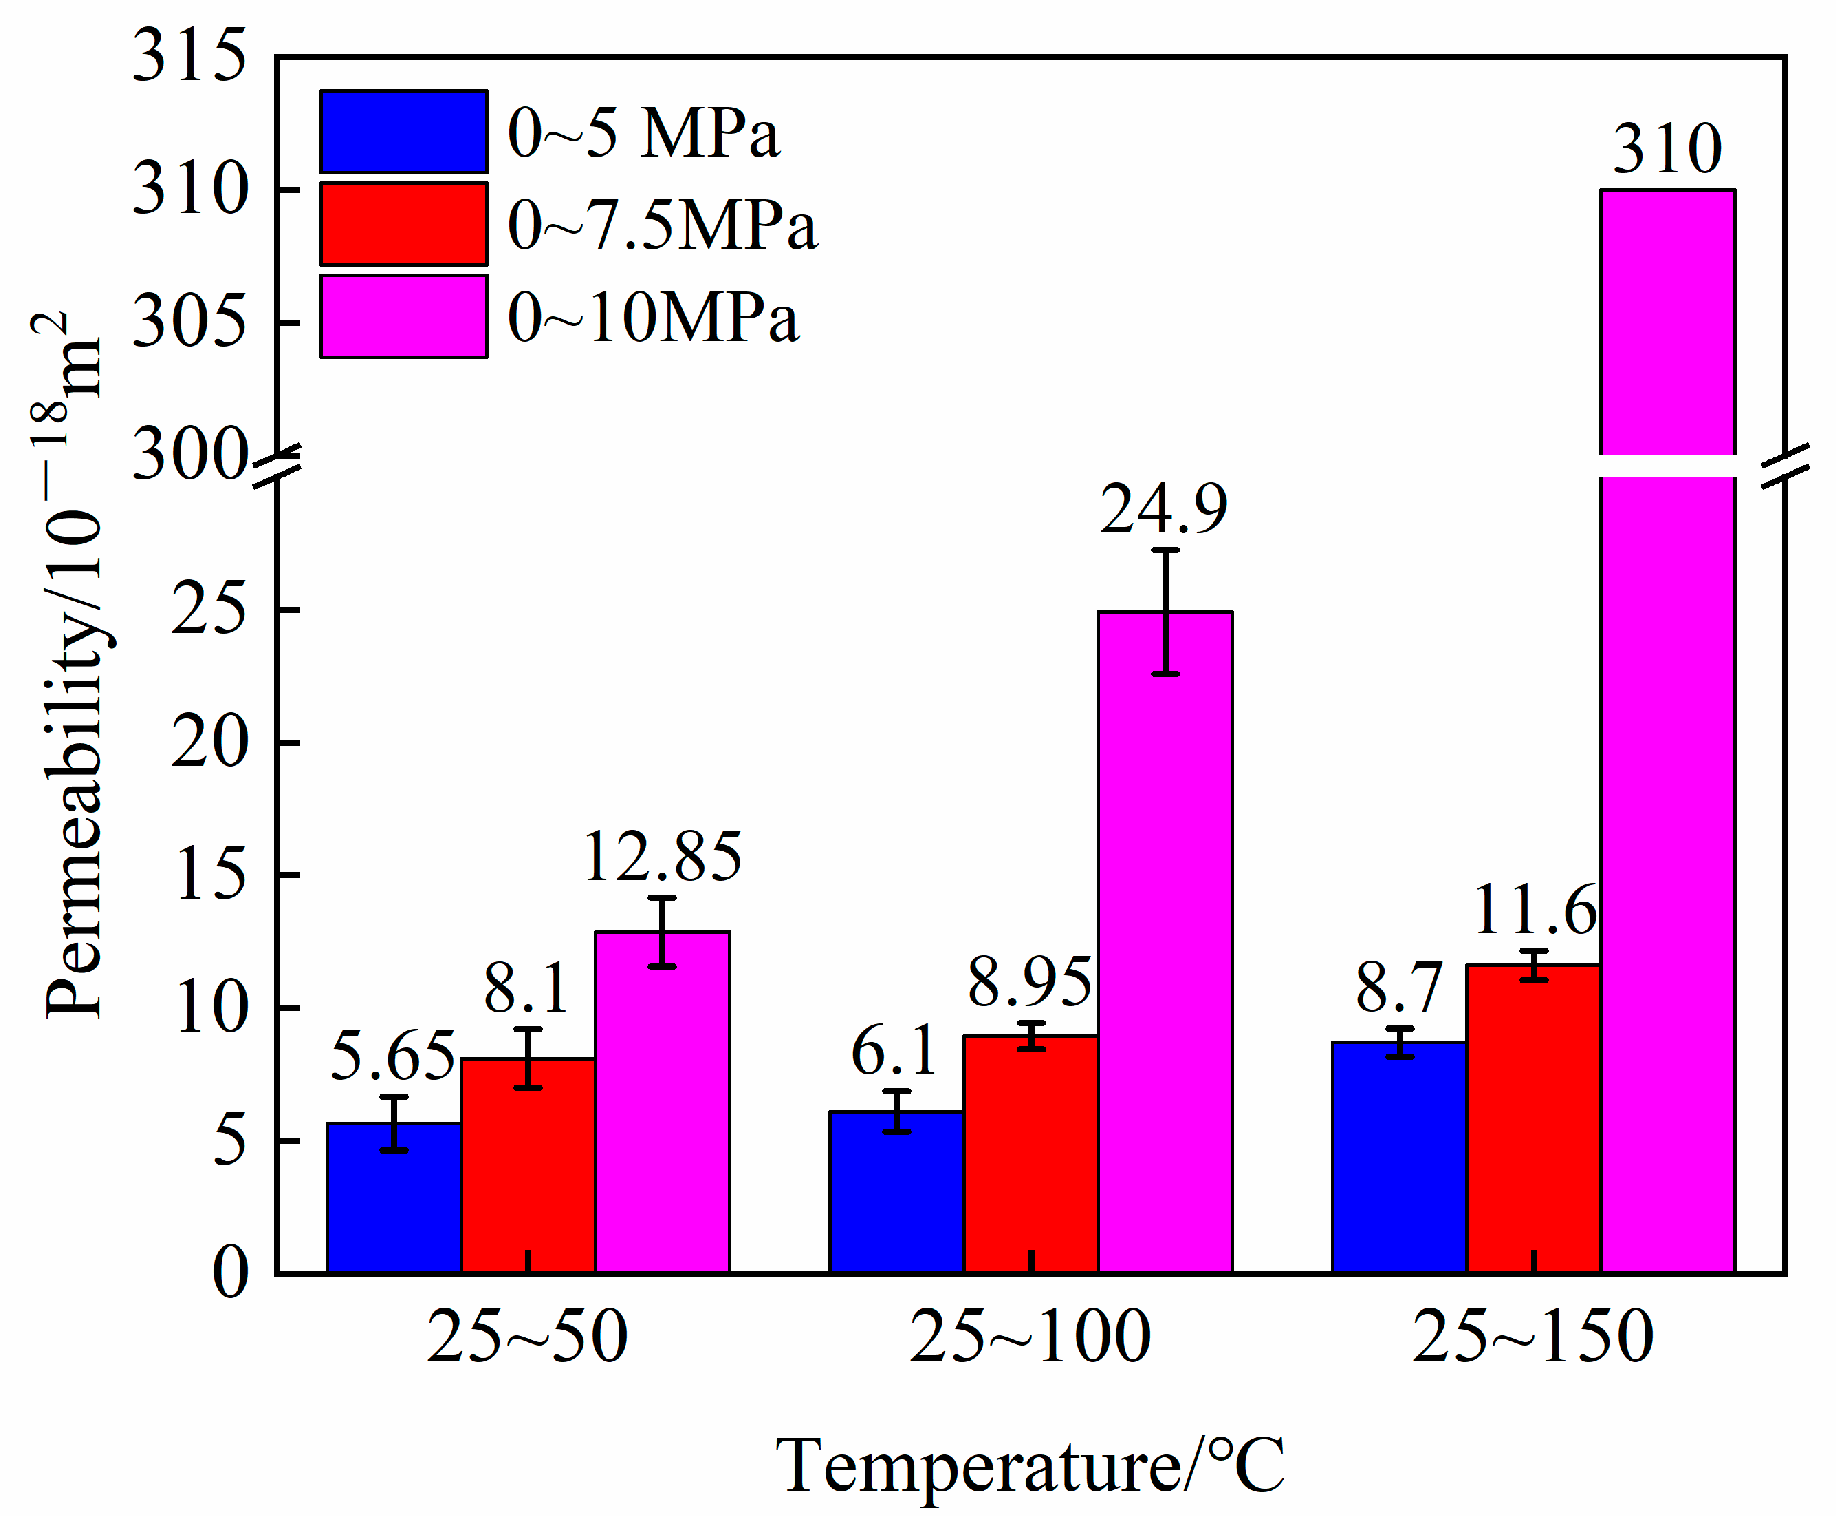
3.2. High-Pressure Gas Permeation Test Results and Analyses

The specimens after the synchronous cycling of temperature and pressure were loaded into the gas permeation instrument for a high-pressure gas permeation test, and the results of the specimen gas permeation test are shown in Table 5. Among them, group T9 cracked during the test, and the gas permeation flow rate was more than 200 mL/min, which exceeded the range of the gas permeation instrument, and the permeability was more than 310 × 10−18 m2.
As shown in Table 5, the average permeability of specimens in group C (control group) was 4.09 × 10⁻¹⁸ m2, and after temperature–pressure synchronous cyclic loading, the permeability of T1~T9 increased gradually. The cyclic compressive stress of groups T1~T3 was 0~5 MPa, and with the increase in the cyclic temperature from 25~50 °C to 25~150 °C, the gas permeability increased from 5.65 × 10⁻¹⁸ m2 to 8.70 × 10⁻¹⁸ m2, and the growth rate was 38.1~112.7% compared with the control group. The cyclic compressive stress in groups T4~T6 was 0~7.5 MPa, and as the cyclic temperature increased from 25~50 °C to 25~150 °C, the gas permeability increased from 8.10 × 10⁻¹⁸ m2 to 1.16 × 10⁻¹⁷ m2, and the growth rate was 98.0~183.6% compared with the control group. In the T7~T8 groups (T9 showed cracking and abnormal permeability), the cyclic compressive stress was 0~10 MPa, and the gas permeability increased from 1.285 × 10⁻¹⁷ m2 to 2.49 × 10⁻¹⁷ m2 as the cyclic temperature increased from 25~50 °C to 25~100 °C, with a growth rate of 214.2~508.8%. This indicates that the gas permeability of HTCC is positively correlated with the temperature when the temperature is increased from 50 °C to 150 °C. It has been shown that microcracks are generated on the specimen’s surface when the upper limit temperature of the cycling temperature exceeds 60 °C. The increase in the upper limit temperature of the cycling temperature causes the deterioration of the interfacial transition zone and the generation of more microcracks, leading to the expansion of the interfacial transition zone and matrix cracks and ultimately an increase in the gas permeability [13,22,23].
The influence patterns of temperature and compressive stress on the gas permeability properties of the specimens are shown in Figure 7. Although both temperature and compressive stress have significant effects on the gas permeability, the degree of influence is significantly different. When the test compressive stress is lower than 7.5 MPa, the growth of permeability is relatively stable even when the temperature loading is increased to 150 °C. However, when the compressive stress reaches 10 MPa and the temperature exceeds 100 °C, the permeability grows very rapidly. When the compressive stress reaches a certain stress ratio, the transport rate of the medium inside the material increases dramatically, and the HTCC permeability increases significantly [24,25,26]. It has been suggested that among all the loading factors, fatigue stress is one of the biggest influencing factors; the higher the loading level and the higher the number of cycles, the more obvious the microcrack connectivity and extension, the larger the total porosity of concrete, and the larger the transmission rate of the medium [27,28]. This phenomenon suggests that compressive stress is the main reason for the increase in permeability of the material, and when the stress ratio exceeds a critical value (0.30), the permeability resistance deteriorates rapidly.
The Voigt function method and the Levenberg–Marquardt optimization algorithm were used to nonlinearly fit the variables of upper limit temperature T, upper limit compressive stress p, and average permeability k. The results of fitting the average permeability of the HTCC to T and p under the effect of 10 thermal-mechanical cycles are shown in Equations (2)–(4):
k ( T , p ) = 3.166 + 942455 × [ 0.00192 ( 1 + A ) ( 1 + B ) + 0.998 e 0.5 ( A + B ) ] ,
A = ( T 374.976 83.199 ) 2 ,
B = ( p 15.735 1.657 ) 2
where: k is the permeability, 10−18 m2; T is the upper limit of the test temperature control range, °C; and p is the upper limit of the test pressurization range, MPa.
According to the above equations, the average permeability of the HTCC materials can be obtained based on the temperature control range values and pressurization range values set for the thermal-mechanical coupling condition. The fitted response surface is shown in Figure 8, with a correlation coefficient R2 (COD) of 0.9963. Figure 8 shows that the deterioration of the permeability resistance is more sensitive to changes in cyclic compressive stress.
The relationship between inlet pressure and material permeability is shown in Figure 9. Analyzing Figure 7, it is not difficult to find that the permeability of the material decreases with the increase in inlet pressure, but when the inlet pressure is more than 3 MPa, the permeability tends to be stable. Taking T6 as an example, when the inlet pressure increases from 1 MPa to 3 MPa, the permeability of the specimen decreases by 24.6%. When the inlet pressure increases from 3 MPa to 5 MPa, the permeability of the specimen decreases by 1.4%. The gas permeability of HTCC specimens decreased with the increase in pore pressure, and there was a critical value near the pore pressure of 2 MPa. Before the critical pore pressure, the gas permeability decreases more obviously; after the critical pore pressure, the gas permeability tends to level off gradually. This may be due to the fact that before the critical pore pressure, with the gradual increase in the pore pressure, the internal pores of the HTCC specimen are compressed, the pore connectivity becomes poor, the effective porosity decreases, and the gas permeability also decreases [29].

3.3. Mercury Intrusion Porosimetry Test Results and Analyses

The distribution of the pore size structure of T1, T2, T3, T6, and T9 specimen samples after thermal-mechanical coupling loading is shown in Table 6 and Figure 10.
In Table 6 and Figure 10, the cyclic compressive stresses of T1, T2, and T3 were all from 0 to 5 MPa, and when the cyclic temperature was increased from 25~50 °C to 25~150 °C, the porosity of the specimens was reduced from 23.628% to 10.959%, whereas the permeability was increased from 5.65 × 10⁻¹⁸ m2 to 8.7 × 10⁻¹⁸ m2. This result seems to be inconsistent with the law that microcracks are created in cementitious materials at high temperatures due to thermal induction, which leads to an increase in porosity. However, the mechanism of the effect of temperature on gas permeability is complex. Ye et al. [13] in monotonic cyclic loading tests on cement mortar from 20 to 70 °C found that the porosity of the material decreased with increasing temperature. It was also noted that this was due to the differential expansion of the mortar due to the increase in temperature, which resulted in a decrease in the pore aperture inside the cement paste. The study by Kjellsen et al. [30] also concluded that the high-temperature effect caused an increase in the polymerization of silicates in C-S-H gels, resulting in the C-S-H gels becoming harder, stronger, and denser. High temperatures are also capable of increasing the energy of gas molecules and accelerating the rate of gas permeation through the pores of the matrix [31]. Houaria et al. [22] and Sogbossi et al. [23] tested and found a significant increase in the gas permeability of cement mortars after heat treatment.
The permeability of concrete is determined by the pore size structure and the connectivity of the pores [32], and the increase in HTCC gas permeability is mainly due to the increase in temperature which increases the connectivity of the pores within the HTCC material. It is speculated that the decrease in porosity of HTCC materials in the range of 25~150 °C is mainly due to two reasons, on the one hand, the differential expansion of mortar due to the increase in temperature, and on the other hand, the appropriate temperature increase promotes cement hydration, and the filling of pores by the hydration products produced by the hydration of cement reduces the porosity.
In Table 6, the cycling temperatures of T3, T6, and T9 were all 25~150 °C. When the cycling compressive stress was increased from 0~5 MPa to 0~10 MPa, the porosity of the specimens increased from 10.959% to 22.782%, and the permeability of the gas also increased from 8.7 × 10⁻¹⁸ m2 (T3) to 11.6 × 10⁻¹⁸ m2 (T6) to 3.10 × 10⁻¹⁶ m2 (T9) and above (see Table 5). In Figure 10, the peaks of the pore size distribution curves of T3, T6, and T9 (critical pore sizes) are significantly shifted to the right with the increase in cyclic compressive stress. Therefore, due to the increase in compressive stress, new microcracks are generated inside the material, the pore size is coarsened, and the permeability is enhanced.
It has been confirmed that the effect of loading on the pore structure and permeability of concrete is related to the compressive stress ratio (percentage of compressive stress to compressive strength). When the compressive stress ratio is below 30%, the concrete pore structure remains stable; when the compressive stress ratio exceeds 30%, the concrete starts to produce plastic deformation, new microcracks are generated, and the porosity increases [33,34]. In the test of this paper, the strength class of the specimen is C30, and the measured average compressive strength is 33.5 MPa. When the test compressive stress is within 7.5 MPa for cyclic loading, the compressive stress ratio is within 30%, and the pore structure of the material basically remains stable. When the test compressive stress reaches 10 MPa, the compressive stress ratio is close to or even exceeds 30%, and new cracks begin to be generated inside the matrix, the porosity increases, and the permeability increases rapidly.

4. Conclusions

This study focuses on the effects of thermal-mechanical coupling on the gas permeability and microstructural changes of HTCCs. The test simulates the service environment of CAES underground lined rock caverns and selects nine groups of different thermal-mechanical coupling conditions to load HTCC specimens, measures the gas permeability of HTCC specimens by the high-pressure permeability test, and obtains the pore structure of the specimens by the mercury pressure test. Based on the test measurement results, the following conclusions can be drawn:
(1)
The compressive strength of HTCC 28d is 33.5 MPa, and it shows “tensile strain hardening” in tension, the ultimate tensile strength is 5.44 MPa, the ultimate tensile strain is 1.65%, and the average crack width is between 41and 49 μm, which indicates good toughness and crack controlling ability. HTCC are well adapted to the concrete lining of underground lined rock caverns in terms of toughness and resistance to cracking. At the same time, HTCC have a broad application prospect in underground engineering and all kinds of projects that have certain requirements for sealing performance.
(2)
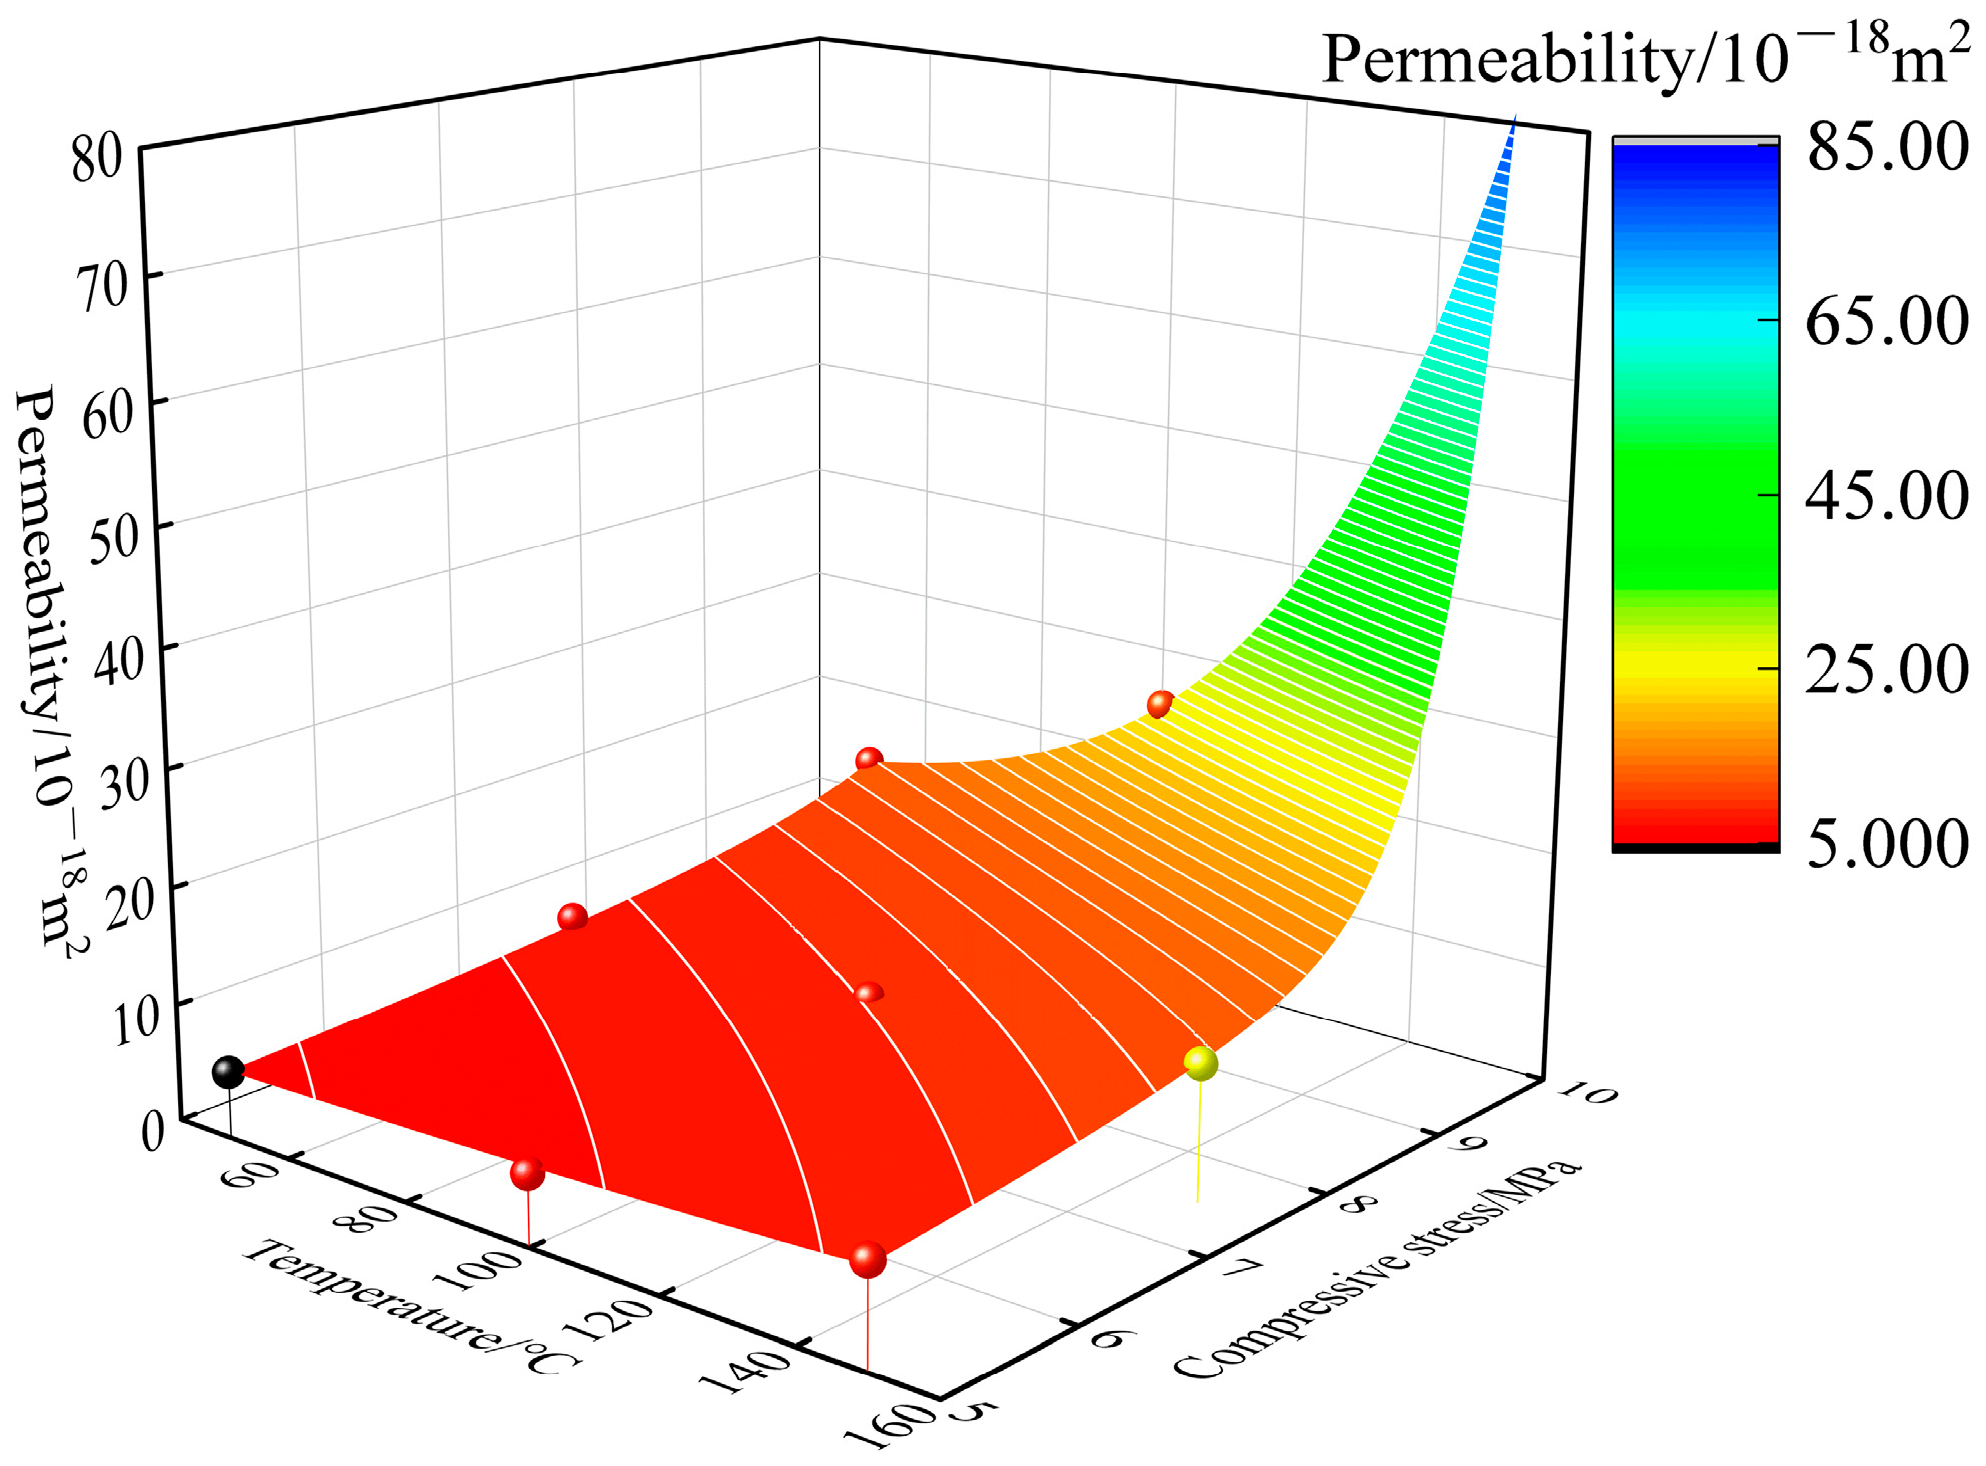
Both temperature and compressive stress cause the deterioration of HTCC gas permeability, but compressive stress is the main cause of the increased permeability of HTCC materials. The average gas permeability of the HTCC control group was 4.09 × 10⁻¹⁸ m2. The increase in gas permeability varies at different stress ratios for compressive stress. The maximum increase in gas permeability of specimens with different compressive stress combinations (compressive stress ratios) of 0~5 MPa (0.15), 0~7.5 MPa (0.22), and 0~10 MPa (0.30) was 112.7%, 183.6%, and 508.8% when the temperature was increased from 25~50 °C to 25~150 °C as compared with the control group. Accordingly, when HTCC are used as the lining layer of CAES underground lined rock caverns, it is recommended that the operating temperature of the caverns should not be higher than 100 °C and the compressive stress ratio is less than 0.30.
(3)
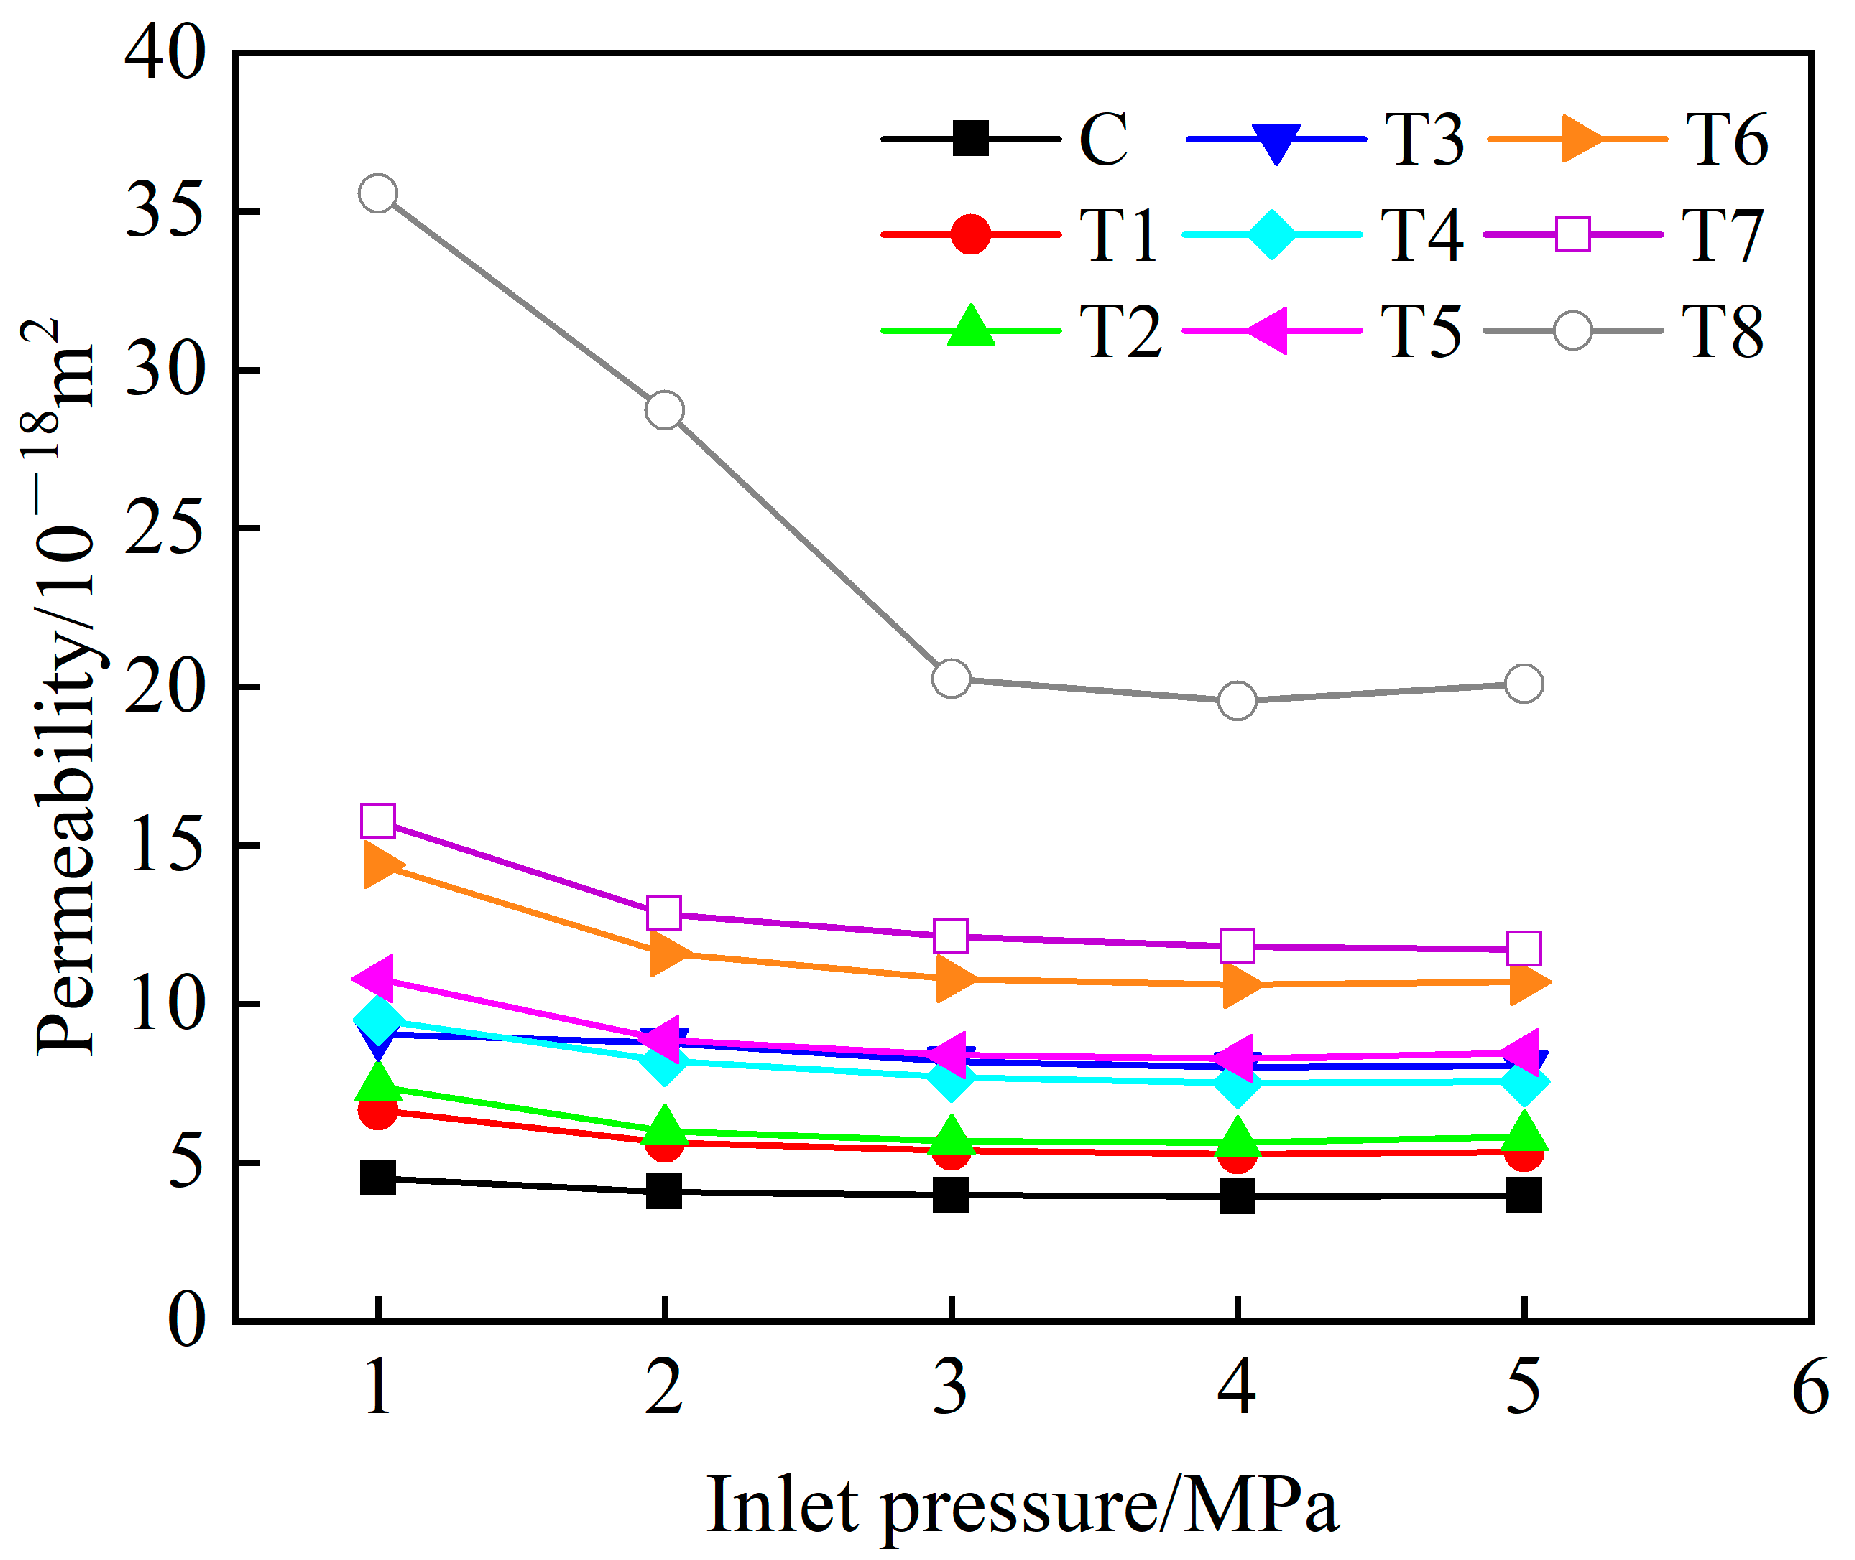
The gas permeability decreases gradually with the increase in inlet pressure, but it basically stabilizes when the inlet pressure exceeds 3 MPa.
(4)
The results of analyzing the pore structure in the Mercury intrusion porosimetry test show that the porosity of HTCC decreases and the gas permeability increases as the maximum cycling temperature increases. This indicates that the expansion of the HTCC matrix occurs while the effective porosity within the material increases. The temperature effect produces microcracks.
(5)
The results of analyzing the pore structure in the mercury intrusion porosimetry test show that the porosity of HTCC rises and the gas permeability increases with the increase in the maximum cyclic stress. This indicates that the compressive stress will have a damaging effect on the HTCC matrix, with the coarsening of the pore size and increased connectivity of the internal pores of the material.

Author Contributions

Z.Z.: Conceptualization, methodology, investigation, data curation, writing—original draft preparation, writing—review and editing. D.Z.: Conceptualization, formal analysis, investigation, data curation, project administration, funding acquisition, writing—review and editing. All authors have read and agreed to the published version of the manuscript.

Funding

This research was funded by Natural Science Projects of Hunan Province, grant number 2022JJ30614.

Data Availability Statement

The original contributions presented in the study are included in the article, further inquiries can be directed to the corresponding author.

Acknowledgments

Thanks are due to all members of the subject team for their help with the experiment.

Conflicts of Interest

The authors declare no conflicts of interest.

References

  1. Budt, M.; Wolf, D.; Span, R.; Yan, J.Y. A review on compressed air energy storage: Basic principles, past milestones and recent developments. Appl. Energy 2016, 170, 250–268. [Google Scholar] [CrossRef]
  2. Zhou, S.W.; Xia, C.C.; Du, S.G.; Zhang, P.Y.; Zhou, Y. An analytical solution for mechanical responses induced by temperature and air pressure in a lined rock cavern for underground compressed air energy storage. Rock Mech. Rock Eng. 2015, 48, 749–770. [Google Scholar] [CrossRef]
  3. Kim, H.M.; Rutqvist, J.; Ryu, D.W.; Choi, B.H.; Sunwoo, C.; Song, W.K. Exploring the concept of compressed air energy storage(CAES) in lined rock caverns at shallow depth: A modeling study of air tightness and energy balance. Appl. Energy 2011, 92, 653–667. [Google Scholar] [CrossRef]
  4. Zhou, Y.; Xia, C.C.; Zhao, H.B.; Wang, X.J.; Mei, S.H.; Zhou, S.W. A method for estimating air leakage through inner seals and mechanical responses of the surrounding rock of lined rock caverns for compressed air energy storage. Chin. J. Rock Mech. Eng. 2017, 36, 297–309. [Google Scholar] [CrossRef]
  5. Allen, R.D.; Doherty, T.J.; Fossum, A.F. Geotechnical Issues and Guidelines for Storage of Compressed Air in Excavated Hard Rock Caverns; Pacific Northwest Laboratory: Richland, WA, USA, 1982. [Google Scholar] [CrossRef]
  6. Jiang, Z.M.; Li, P.; Zhao, H.B.; Feng, S.R.; Tang, D. Experimental study on performance of shallow rock cavern for compressed air energy storage. Rock Soil Mech. 2020, 41, 235–241. [Google Scholar] [CrossRef]
  7. Jiang, Z.M.; Gan, L.; Zhang, D.X.; Xiao, Z.Z.; Liao, J.H. Study on distribution characteristics and evolution law of liner cracks in underground cavern for compressed air energy storage. Chin. J. Geotech. Eng. 2024, 46, 110–119. [Google Scholar] [CrossRef]
  8. Kim, H.M.; Rutqvist, J.; Kim, H.; Park, D.; Ryu, D.W.; Park, E.S. Failure Monitoring and Leakage Detection for Underground Storage of Compressed Air Energy in Lined Rock Caverns. Rock Mech. Rock Eng. 2016, 49, 573–584. [Google Scholar] [CrossRef]
  9. Li, V.C. On Engineered Cementitious Composites (ECC) A Review of the Material and Its Applications. J. Adv. Concr. Technol. 2003, 1, 215–230. [Google Scholar] [CrossRef]
  10. Xu, S.L.; Cai, X.H. Experimental studies on permeability and carbonation properties of ultra high toughness cemen-titious composites. Acta Mater. Compos. Sin. 2010, 27, 177–183. [Google Scholar] [CrossRef]
  11. Xu, S.L.; Zhou, F.; Li, Q.H.; Chen, B.K.; Jiang, X.; Yin, X.; Wu, P. Comparative study on performance of UHTCC and RPC thick panels under hard projectile impact loading. Cem. Concr. Compos. 2021, 122, 104134. [Google Scholar] [CrossRef]
  12. Khaledi, K.; Mahmoudi, E.; Datcheva, M.; Schanz, T. Analysis of compressed air storage caverns in rock salt considering thermo-mechanical cyclic loading. Environ. Earth Sci. 2016, 75, 1149. [Google Scholar] [CrossRef]
  13. Ye, B.; Cheng, Z.R.; Ni, X.Q. Effects of multiple heating-cooling cycles on the permeability and microstructure of a mortar. Constr. Build. Mater. 2018, 176, 156–164. [Google Scholar] [CrossRef]
  14. Lin, Z.; Xu, W.Y.; Wang, W.; Zhang, J.C.; Wang, H.L.; Wang, R.B. Experimental Study on Hydraulic and Macro-Mechanical Property of a Mortar under Heating and Cooling Treatment. J. Adv. Concr. Technol. 2016, 14, 261–270. [Google Scholar] [CrossRef]
  15. Zhao, D.F.; Jia, P.H.; Liu, H.X.; Gao, H.J.; Liu, Y.C. An experimental study on microstructure of high strength concrete after high temperature and uniaxial compressive fatigue. J. Vib. Shock 2018, 37, 83–88. [Google Scholar] [CrossRef]
  16. Zhou, X.G.; Wu, J.L. Preliminary Research on Fatigue Behavior of Concrete after Exposed to High Temperature. Ind. Constr. 1996, 26, 33–35. [Google Scholar]
  17. JC/T2461-2018; Standard Test Method for Mechanical Properties of Ductile Reinforced Cementitious Composites. Ministry of Industry and Information Technology of the People’s Republic of China: Beijing, China, 2018.
  18. Lux, K.H. Design of salt caverns for the storage of natural gas, crude oil and compressed air: Geomechanical aspects of construction, operation and abandonment. Geol. Soc. Lond. Spec. Publ. 2009, 313, 93–128. [Google Scholar] [CrossRef]
  19. Kim, H.M.; Rutqvist, J.; Jeong, J.H.; Choi, B.H.; Ryu, D.W.; Song, W.K. Characterizing Excavation Damaged Zone and Stability of Pressurized Lined Rock Caverns for Underground Compressed Air Energy Storage. Rock Mech. Rock Eng. 2013, 46, 1113–1124. [Google Scholar] [CrossRef]
  20. Schmidt, F.; Menéndez, J.; Konietzky, H.; Pascual-Muñoz, P.; Castro, J.; Loredo, J.; Sánchez, A.B. Converting closed mines into giant batteries: Effects of cyclic loading on the geomechanical performance of underground compressed air energy storage systems. J. Energy Storage 2020, 32, 101882. [Google Scholar] [CrossRef]
  21. Jiang, Z.M.; Liu, L.L.; Li, S.L.; Liu, L.T.; Zhao, H.B.; Mei, S.H.; Li, P. Numerical study on mechanical characteristics of the Ping jiang pilot cavern for compressed air energy storage. J. Chang. Univ. Sci. Technol. (Nat. Sci.) 2017, 14, 62–68. [Google Scholar] [CrossRef]
  22. Houaria, M.B.A.; Abdelkader, M.; Marta, C.; Abdelhafid, K. Comparison between the permeability water and gas permeability of the concretes under the effect of temperature. Energy Procedia 2017, 139, 725–730. [Google Scholar] [CrossRef]
  23. Sogbossi, H.; Verdier, J.; Multon, S. Permeability and damage of partially saturated concrete exposed to elevated temperature. Cem. Concr. Compos. 2020, 109, 103563. [Google Scholar] [CrossRef]
  24. Fu, C.Q.; Ye, H.L.; Jin, X.Y.; Yan, D.M.; Jin, N.G.; Peng, Z.X. Chloride penetration into concrete damaged by uniaxial tensile fatigue loading. Constr. Build. Mater. 2016, 125, 714–723. [Google Scholar] [CrossRef]
  25. Desmettre, C.; Charron, J.P. Water permeability of reinforced concrete with and without fiber subjected to static and constant tensile loading. Cem. Concr. Res. 2012, 42, 945–952. [Google Scholar] [CrossRef]
  26. Yuan, J.Y.; Chen, X.D.; Shen, N.; Fan, X.Q.; Lu, J. Experimental study on the pore structure variation of self-compacting rubberised concrete under fatigue load. Road Mater. Pavement Des. 2021, 22, 716–733. [Google Scholar] [CrossRef]
  27. Chen, D.; Yu, X.T.; Liao, Y.T.; Wang, Q.F.; Wang, X. Progress of Study on Sulfate Attack on Concrete Material. J. Chongqing Jiaotong Univ. (Nat. Sci.) 2016, 35, 24–30. [Google Scholar]
  28. Cui, Z.L.; Zhang, X.H.; Tang, B. Effect of Different Curing Environments on Strength and Carbonation of Fly Ash Concrete. Bull. Chin. Ceram. Soc. 2019, 38, 65–69. [Google Scholar] [CrossRef]
  29. Wang, H.L.; Xu, W.Y.; Zuo, J.; Shao, J.F.; Jia, Z.J. Evolution law of the permeability and porosity for low-permeability rock based on gas permeability test. J. Hydraul. Eng. 2015, 46, 208–216. [Google Scholar] [CrossRef]
  30. Pei, Y.; Agostini, F.; Skoczylas, F. The effects of high temperature heating on the gas permeability and porosity of a cementitious material. Cem. Concr. Res. 2017, 95, 141–151. [Google Scholar] [CrossRef]
  31. Kjellsen, K.O.; Detwiler, R.J.; Gjørv, O.E. Backscattered electron imaging of cement pastes hydrated at different temperatures. Cem. Concr. Res. 1990, 20, 308–311. [Google Scholar] [CrossRef]
  32. Bošnjak, J.; Ožbolt, J.; Hahn, R. Permeability measurement on high strength concrete without and with polypropylene fibers at elevated temperatures using a new test setup. Cem. Concr. Res. 2013, 53, 104–111. [Google Scholar] [CrossRef]
  33. Yao, Y.; Wang, L.; Wang, Z.D.; Cao, Y.; Tang, B.G.; Du, P.; Huang, P.F. Research and progress on durability of concrete under combined mechanical load and environment actions. J. Sustain. Cem.-Based Mater. 2018, 37, 855–865. [Google Scholar] [CrossRef]
  34. Qu, F.L.; Li, W.G.; Dong, W.K.; Tam, V.W.Y.; Yu, T. Durability deterioration of concrete under marine environment from material to structure: A critical review. J. Build. Eng. 2021, 35, 102074. [Google Scholar] [CrossRef]
Figure 1. Specimen production process.
Buildings 14 01923 g001
Figure 2. Temperature and pressure synchronized cyclic loading tester.
Buildings 14 01923 g002
Figure 3. Pressure and temperature control process lines. (a) Pressure control process lines; (b) Temperature control process lines.
Buildings 14 01923 g003
Figure 4. High-pressure gas permeation tester.
Buildings 14 01923 g004
Figure 5. Tensile stress–strain relationship.
Buildings 14 01923 g005
Figure 6. HTCC tensile cracking pattern. (a) Uniaxial tensile specimens; (b) multiple seam cracking.
Buildings 14 01923 g006
Figure 7. Influence of thermal-mechanical cyclic loading on gas permeability law.
Buildings 14 01923 g007
Figure 8. Response diagram of temperature-compressive stress vs. permeability.
Buildings 14 01923 g008
Figure 9. Relationship between inlet pressure and permeability.
Buildings 14 01923 g009
Figure 10. Pore size distribution.
Buildings 14 01923 g010
Table 1. Proportions of the mixture for HTCC groups.
GroupsVf/%Components (kg·m−3)
CementFly AshSandWaterPCE 1HPMC 2
A11.55937114743395.220.59
A22.05937114743395.220.59
A32.05937114742875.220.59
A42.05937114743125.220.59
A52.07175874743395.220.59
A62.06526524743395.220.59
1 PCE: It is Polycarboxylate, a highly efficient water-reducing agent. 2 HPMC: It is hydroxypropyl methylcellulose, a thickener.
Table 2. Cyclic loading and unloading control time.
Pressure/Temperature Increase Time (min)Pressure/Temperature Maintenance Time (min)Pressure/Temperature Decrease Time (min)Pressure/Temperature Maintenance Time (min)
60303060
Table 3. Parameter table of cyclic loading and unloading test.
Specimen CodesPressurization RangeTemperature Control RangeCycles
C(Control group)\\\
T10~5 MPa25~50 °C10
T225~100 °C
T325~150 °C
T40~7.5 MPa25~50 °C
T525~100 °C
T625~150 °C
T70~10 MPa25~50 °C
T825~100 °C
T925~150 °C
Table 4. HTCC physical and mechanical properties.
GroupsCompressive Strength 1 (MPa)Tensile Initial Cracking Strength 1 (MPa)Tensile Initial Strain 1 (%)Peak Tensile Stress 1 (MPa)Tensile Ultimate Strain 1 (%)Modulus of Elasticity 1 (GPa)
A134.9 ± 2.93.480.0573.651.328.5
A229.4 ± 3.03.370.1774.902.138.4
A343.8 ± 1.35.050.1185.810.8810.7
A433.5 ± 2.83.730.0365.441.658.9
A544.4 ± 1.63.920.0305.181.2010.4
A635.1 ± 4.33.170.1284.071.0110.8
1 The values of each parameter in the table are average values.
Table 5. High-pressure gas permeation test results.
Specimen CodesPermeability (×10−18 m2)Average Permeability
(×10−18 m2)
1 MPa 12 MPa 13 MPa 14 MPa 15 MPa 1
C4.514.083.973.933.964.09 ± 0.22
T16.645.625.385.275.335.65 ± 1.01
T27.396.005.685.625.826.10 ± 0.76
T39.048.788.208.018.068.70 ± 0.54
T49.508.217.707.517.568.10 ± 1.11
T510.808.878.398.288.478.95 ± 0.49
T614.4011.6010.8010.6010.7011.60 ± 0.55
T715.7512.8412.1311.8011.7312.85 ± 1.30
T835.5628.7320.2619.5620.1024.90 ± 2.33
T9>310>310
1 1.0 MPa, 2.0 MPa, 3.0 MPa, 4.0 MPa, and 5.0 MPa are inlet pressures.
Table 6. Porosity and characteristic pore diameter.
Specimen CodesPorosity (%)Average Pore Diameter (nm)Median Pore Diameter (nm)The Most Probable Aperture (nm)Specific Pore Volume (mL/g)
T123.62843.41129115.070.128
T215.10738.01235.112.620.08
T310.95936.122746.90.056
T619.48351.681070110.108
T922.78233.0456.276.920.124
Disclaimer/Publisher’s Note: The statements, opinions and data contained in all publications are solely those of the individual author(s) and contributor(s) and not of MDPI and/or the editor(s). MDPI and/or the editor(s) disclaim responsibility for any injury to people or property resulting from any ideas, methods, instructions or products referred to in the content.

