Abstract
Earth–rock dams are widely distributed in China and play an important role in flood control, water storage, water-level regulation, and water quality improvement. As an emerging seepage control and reinforcement technology in the past few years, enzyme (urease)-induced calcium carbonate precipitation (EICP) has the qualities of durability, environmental friendliness, and great economic efficiency. For EICP-solidified standard sand, this study analyzes the effect of dry density, amount of cementation, standing time, perfusion method, and other factors on the permeability and strength characteristics of solidified sandy soil by conducting a permeability test and an unconfined compression test and then working out the optimal solidification conditions of EICP. Furthermore, a quantitative relationship is established between the permeability coefficient (PC), unconfined compressive strength (UCS), and CaCO3 generation (CG). The test findings indicate that the PC of the solidified sandy soil decreases and the UCS rises as the starting dry density, amount of cementation, and standing time rise. With the increase of CG, the PC of the solidified sandy soil decreases while the UCS increases, indicating a good correlation among PC, UCS, and CG. The optimal condition of solidification by EICP is achieved by the two-stage grouting method with an initial dry density of 1.65 g/cm3, cementation time of 6 d, and standing time of 5 d. Under such conditions, the permeability of the solidified sandy soil is 6.25 × 10⁻⁴ cm/s, and the UCS is 1646.94 kPa. The findings of this study are of great theoretical value and scientific significance for guiding the reinforcement of earth–rock dams.
1. Introduction
Earth–rock dam is a general term for earth dams, rockfill dams, and mixed rockfill dams. These have a long history of construction and development and are very common all over the world. Earth–rock dams have the advantages of low construction cost, utilization of local materials, simple structure, and strong adaption to foundation deformation. In recent years, due to climate change, rainstorms have frequently broken out and caused floods above normal level. Traditional grouting reinforcement can effectively fill the cracks and improve the overall stability of dams. However, earth–rock dams have the disadvantages of high cost, complex operation, and environmental pollution. In order to address the increasingly serious environmental pollution in construction projects, more green environmental protections and more environmentally friendly construction materials and process technologies that focus on environmental protection and ensure lower energy consumption have been developed and applied to actual production. In recent years, EICP has been identified as an alternative technology to microbial-induced carbonate precipitation because no organisms are directly involved in the process. For this reason, EICP is regarded as a bio-inspired technology. EICP technology provides inspiration and a scientific basis for the rapid development of bio-inspired geotechnics. EICP is a method of mixing urea, calcium chloride, and urease [1,2] into the soil. Urea is hydrolyzed under the catalysis of the enzyme to generate ammonium ions and carbonate ions. Ammonium ions provide an alkaline environment in the solution, and carbonate ions and calcium ions combine to achieve calcium carbonate precipitation so as to reinforce the soil. At present, environmental requirements are becoming higher and higher. From the perspective of sustainable development, it is more and more difficult for the traditional foundation-reinforcement methods to meet the current engineering requirements. As a new environment-friendly geotechnical technology, EICP will attract more and more public attention. EICP treatment can be used in a variety of ways, including injection, surface infiltration, soil mixing, surface spraying, etc. It can be applied to different kinds of soil improvement, such as increasing bearing capacity, reducing liquefaction, and strengthening slope stability and corrosion resistance of foundations [3,4,5]. Through infiltration, spraying, and other methods, the soil structure is not changed, and it does not need to mix the soil, making this technology more suitable for practical applications [6]. Soil erosion is an important problem in geotechnical engineering, and dams and slopes are vulnerable to erosion caused by water flow [7,8]. Therefore, the application of cost-effective, environment-friendly, and sustainable EICP technology to the control of soil erosion as a result of water runoff is more feasible. In the field of rock and soil reinforcement, Gao et al. separated urease from soybeans to induce calcium carbonate precipitation for the solidification of silty soil. The results [9] show that silting does not appear in the silty soil, and the mechanical properties are significantly improved. In Hoang’s test [10], the strength of fine-grained siliceous sand reached 900 kPa after solidification. EICP technology can significantly improve soil permeability. Some scholars found that soil permeability was significantly improved after treatment using EICP technology. According to some researchers, sandy soil’s permeability was reduced by a magnitude or more based on the permeability test results after cementing sandy soil with EICP technology [2]. In addition, some scholars employed the EICP method to treat an original porous medium and Berea sandstone core. After three rounds of cementation, the permeability of the unconsolidated porous medium sample was reduced by 97%. After two rounds of cementation, the permeability of the Berea sandstone core was reduced by 98% [1]. Meanwhile, EICP technology can significantly enhance the physical and mechanical behavior of the soil. Many researchers have found that soil compressive strength is significantly improved after treatment using EICP technology. Some researchers believe that the quantity of CaCO3 generated by the soils increases and that the strength of the soil also increases [11]. Furthermore, some scholars cemented subgrade loess through EICP technology, and the unconfined compressive strength (UCS) of the cemented soil increased to 0.232 MPa, realizing an increase of 20.8% [12]. Based on EICP technology, some scholars added a proper number of additives to the urease solution and found that the strength of the soil treated by the combination of additives and EICP technology was enhanced by four times in comparison to the untreated soil [13]. In recent years, the development of EICP has been rapid. Scholars have proposed various efficient EICP methods to significantly improve the calcium conversion efficiency and the uniformity of calcium carbonate distribution in the sand samples, as well as the utilization rate of urease [5,14,15,16,17]. At the same time, the EICP soil treatment has 90% less abiotic depletion potential and 3% less global warming potential compared to conventional methods of soil stabilization [18]. However, the current research on EICP treatment is mainly based on solidifying small laboratory samples, while in actual geotechnical engineering, it is usually a large-scale foundation treatment. Further research is needed to determine whether existing treatment methods can ensure the uniformity of solidified soil during large-scale processing. At present, EICP has gradually stood out from the field of biocementation. It is more environmentally friendly and effective than traditional reinforcement methods. It can avoid such problems as microbial ecological insecurity, showing long-term promotional value [18,19].
As an emerging seepage control and reinforcement technology, EICP has the characteristics of high economic efficiency, environmental friendliness, and durability and shows broad prospects of application in foundation reinforcement, liquefaction control, crack repair, dust suppression, and contaminated soil treatment. For the EICP-solidified sandy soil, we analyze the effect of dry density (ρd), cementation number (n), standing time (t), perfusion method, and other factors on the permeability and strength characteristics of solidified sandy soil by conducting permeability and unconfined compression tests, and we establish the quantitative relationship between the permeability coefficient, UCS, and CaCO3 generation. The findings from this research can be referenced while repairing and reinforcing earth–rock dams.
2. Materials and Methods
2.1. Test Materials
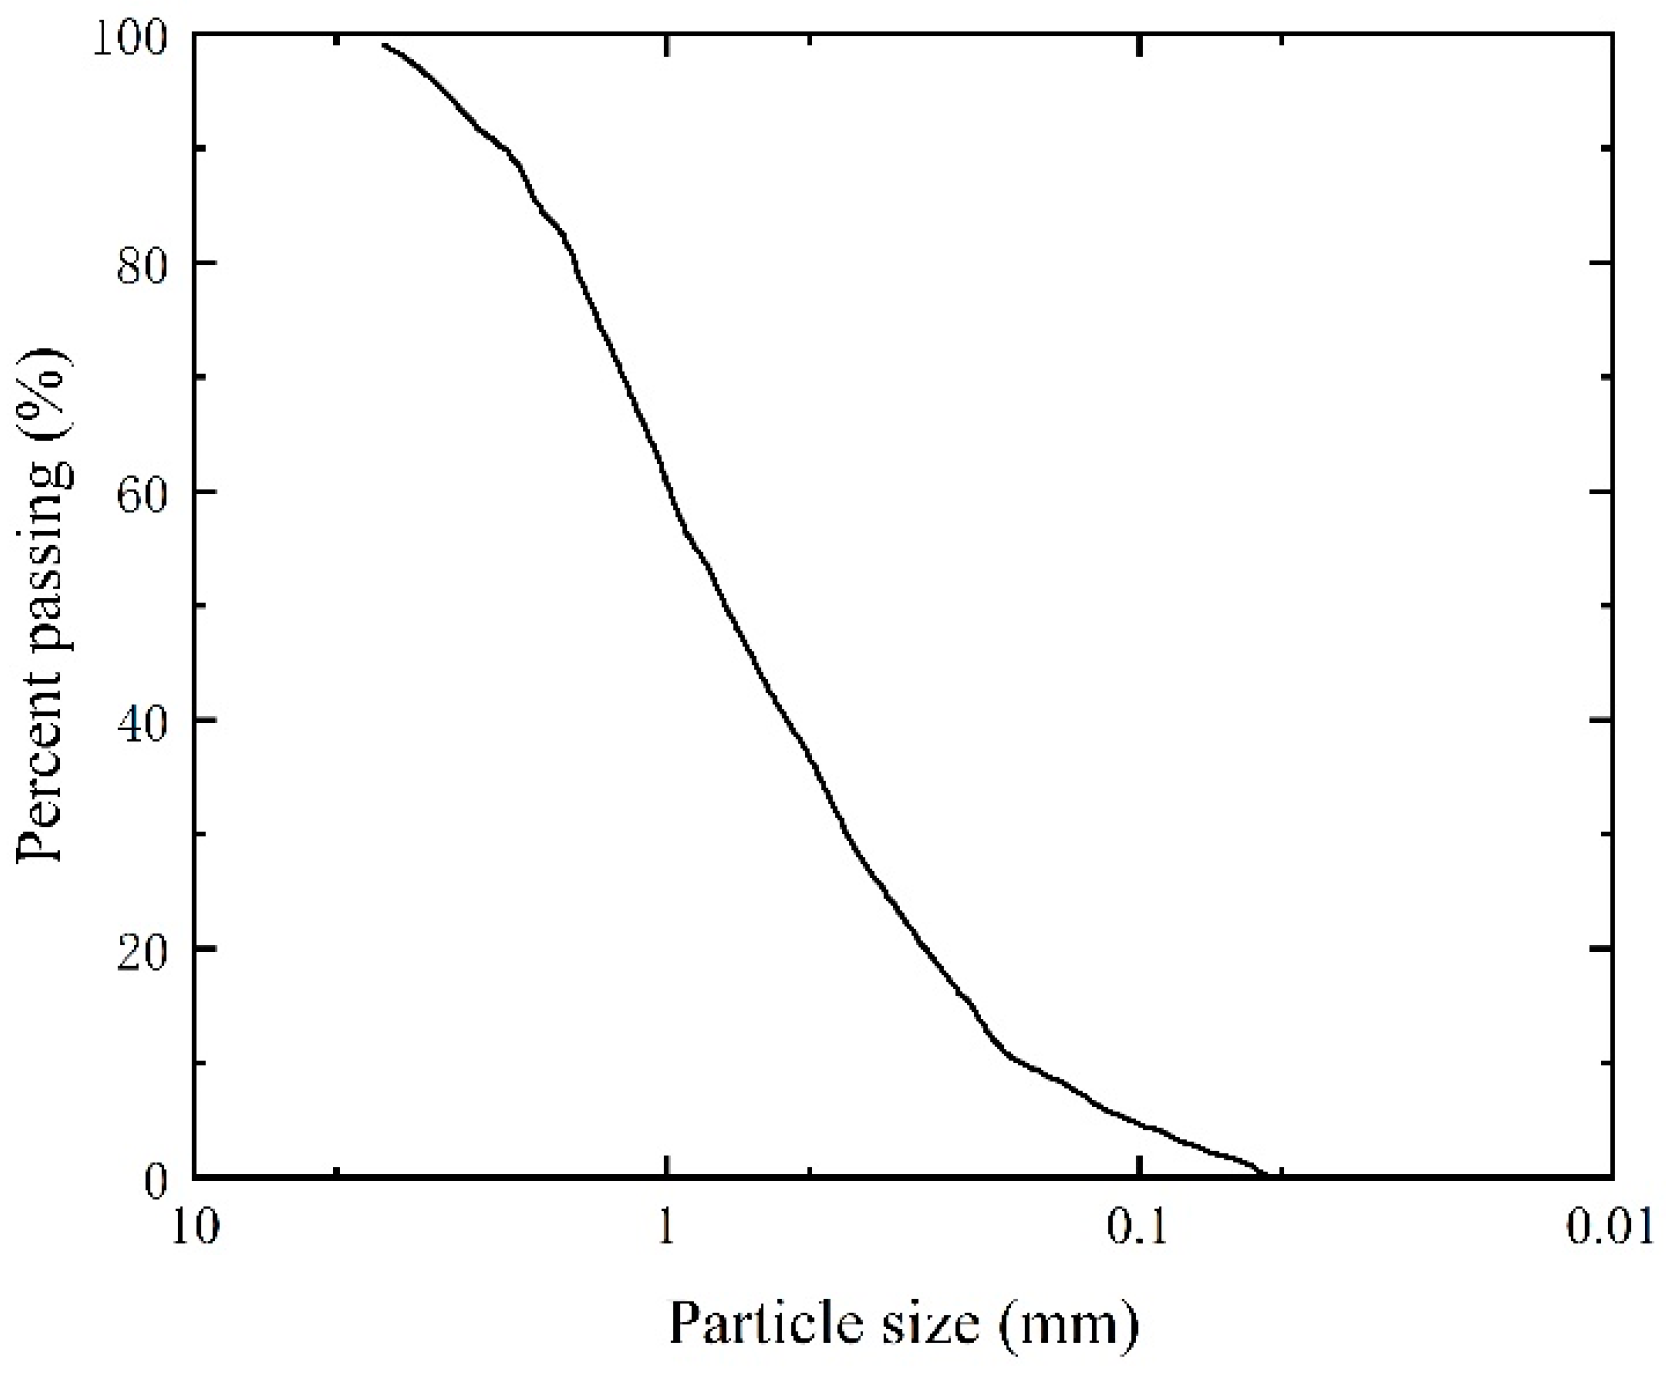
The standard purchased from Xiamen, China, in accordance with GB/T17671-1999 [20], was used for the test. See Figure 1 for the grading curve and Table 1 for the main physical property indicators. In accordance with the standard for geotechnical test methods (GB/T50123-2019) [21], the coefficient of uniformity Cu is 4.853, and the coefficient of curvature Cc is 1.003 for the sandy soil. Therefore, it is determined as poorly graded fine-grained sand.

Figure 1.
Particle grading curve of the standard sand.

Table 1.
Main physical property indicators of the standard sand.
2.2. Sample Preparation
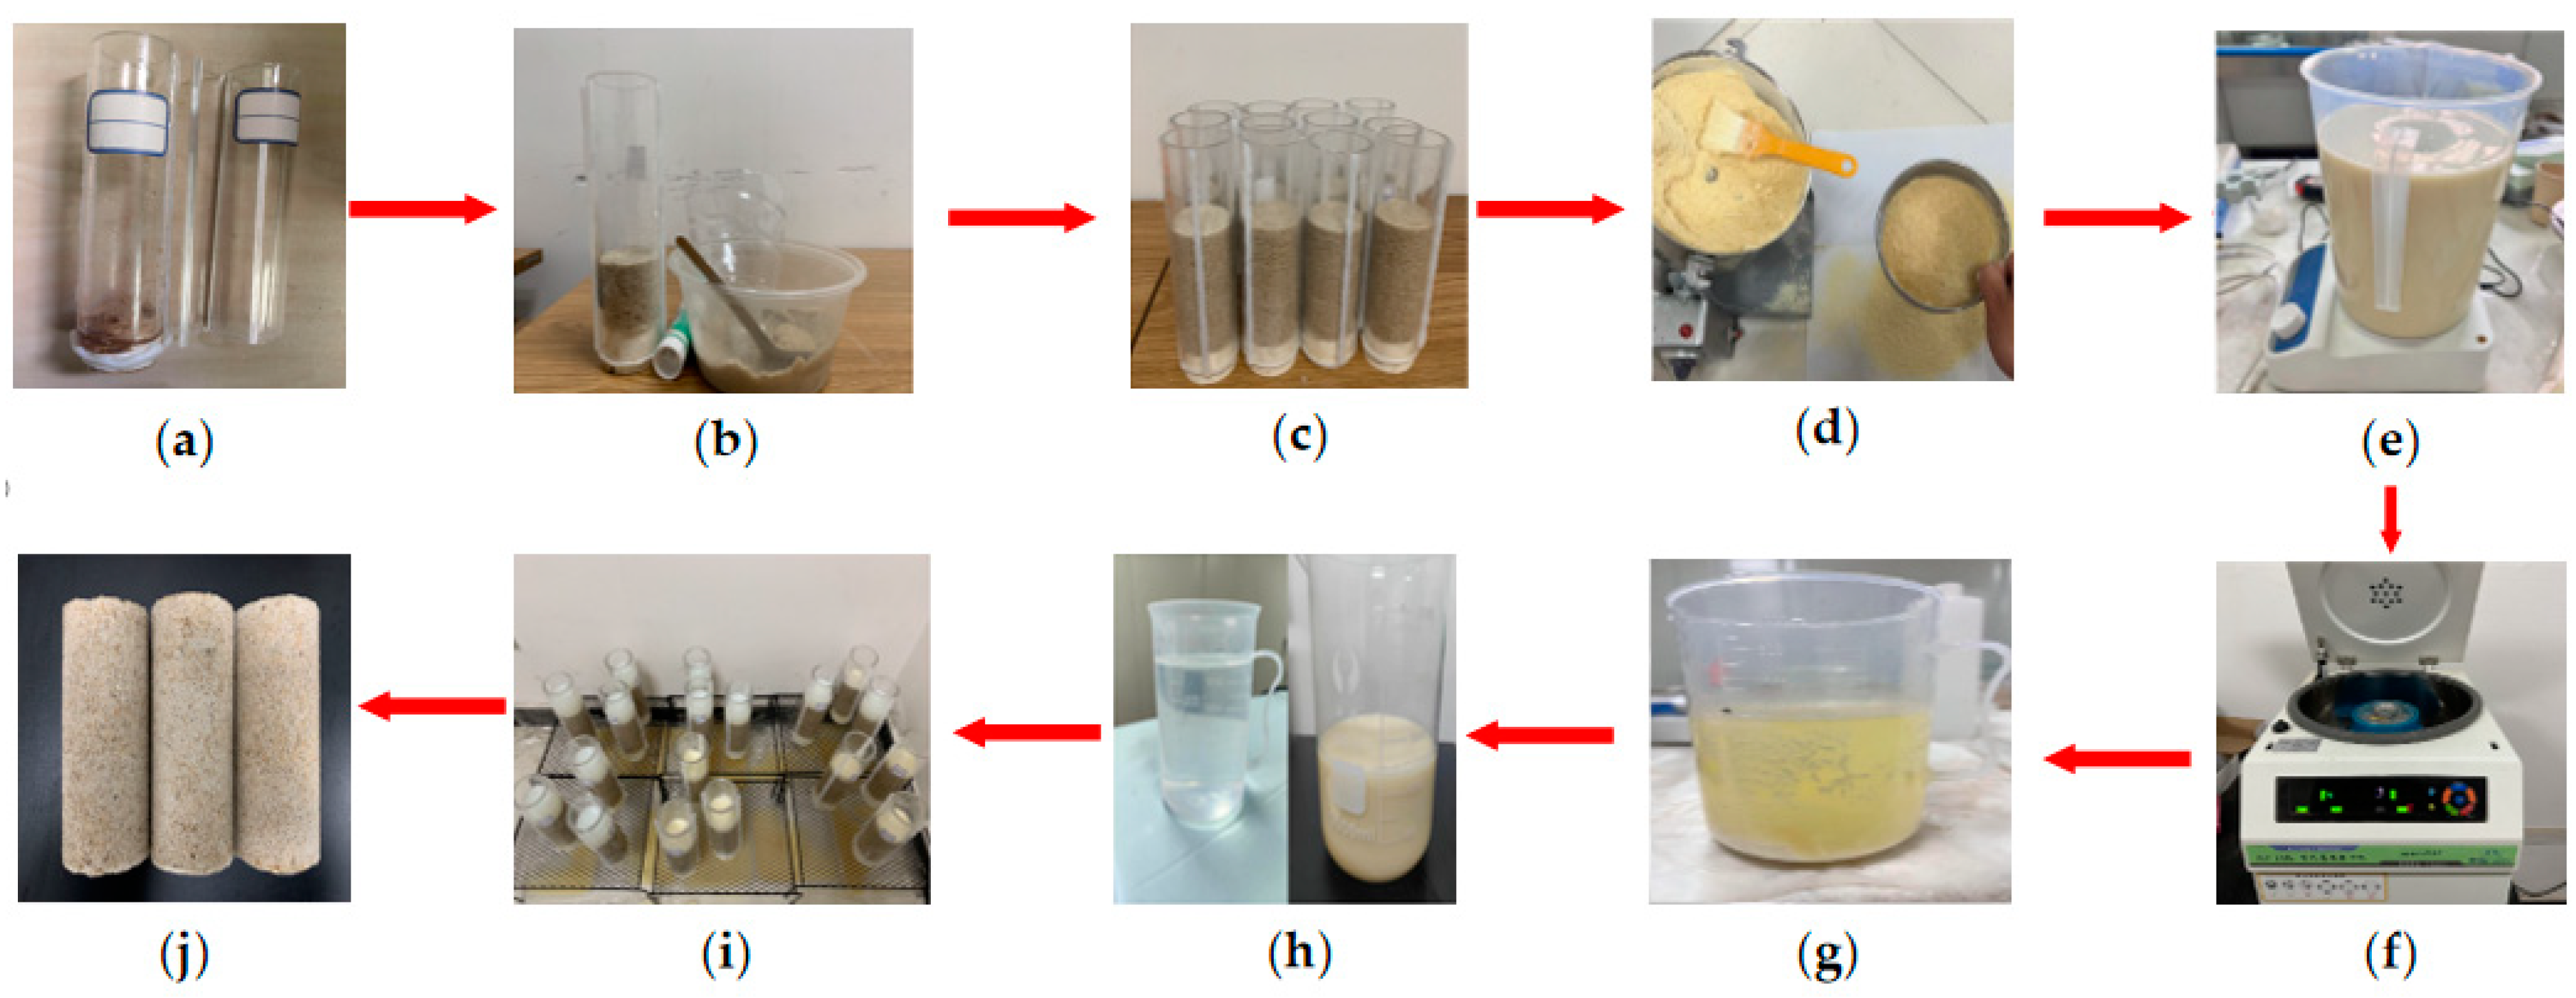
The trial mold was made of PVC tubing that measured 150 mm in height and 39.1 mm in inner diameter. A stainless steel clamp was used for fixing the mold, and hot-melt adhesive was coated onto each crack to prevent the solution from leaking. The sample was prepared in four layers according to the standard for geotechnical test methods (GB/T50123-2019) [21] and the surface of each layer was roughened. Three layers of filter paper were placed at the specimen’s bottom prior to the specimen being added. One layer of filter paper was placed on top of the mold after the specimens were added. The bottom of the mold was sealed by a rubber plug with a hole and the reserved hole was connected with a liquid outlet. The sample preparation process is shown in Figure 2. The chemical composition of urea that was used in the test is CO(NH2)2.

Figure 2.
The flow diagram of sample preparation: (a) fixed mold; (b) standard sand injection; (c) compacted sand column; (d) extract soybean powder; (e) stirring; (f) centrifugation; (g) urease solution; (h) urease and cementitious fluid; (i) perfusion; (j) sample.
2.3. Test Method
Permeability test and unconfined compression strength test schemes were formulated to analyze the effect of initial dry density, cementation number, standing time, perfusion method, and other elements on the permeability and unconfined compressive strength (UCS) of EICP-solidified standard sand. See Table 2 for the test scheme. According to the standard for geotechnical test methods (GB/T50123-2019) [21], the constant head method was used for the permeability test, and repeated tests were arranged for the test in each group. Then, a soil static triaxial testing machine (KTL-LDF50, manufactured by Xi’an KTL Instruments Co., Ltd., Xi’an, China) was used to carry out the unconfined compression test. The load was applied by a strain rate of 1.0%/min, and the test was stopped when the peak value of deviator stress or axial strain reached 15%. Repeated tests were arranged for the test in each group.

Table 2.
The test scheme of permeability and unconfined compression strength.
Three perfusion methods, including stepwise perfusion (SP) [22], mixed perfusion (MP) [23], and two-stage perfusion (TP) [24,25], were set for the test to ensure the relative uniformity of the sample solidification. The urease concentration was set to 100 g/L, the concentration of calcium chloride and urea solutions was set to 1.25 mol/L, and the pH of the solution was brought to 8. The time interval between two perfusion cycles was 24 h. Based on the relevant research results [5,14,22,23,24,25], the concentration of urease, with urea and calcium chloride concentrations, was determined to be 100 g/L, 1.25 mol/L, and 1.25 mol/L, respectively; the standing time was determined to be 1, 3, and 5, respectively; and the perfusion methods were MP, SP, and TP, respectively.
3. Results
3.1. Analysis of the Effect of Dry Density on Permeability and Strength Characteristics of Sandy Soil
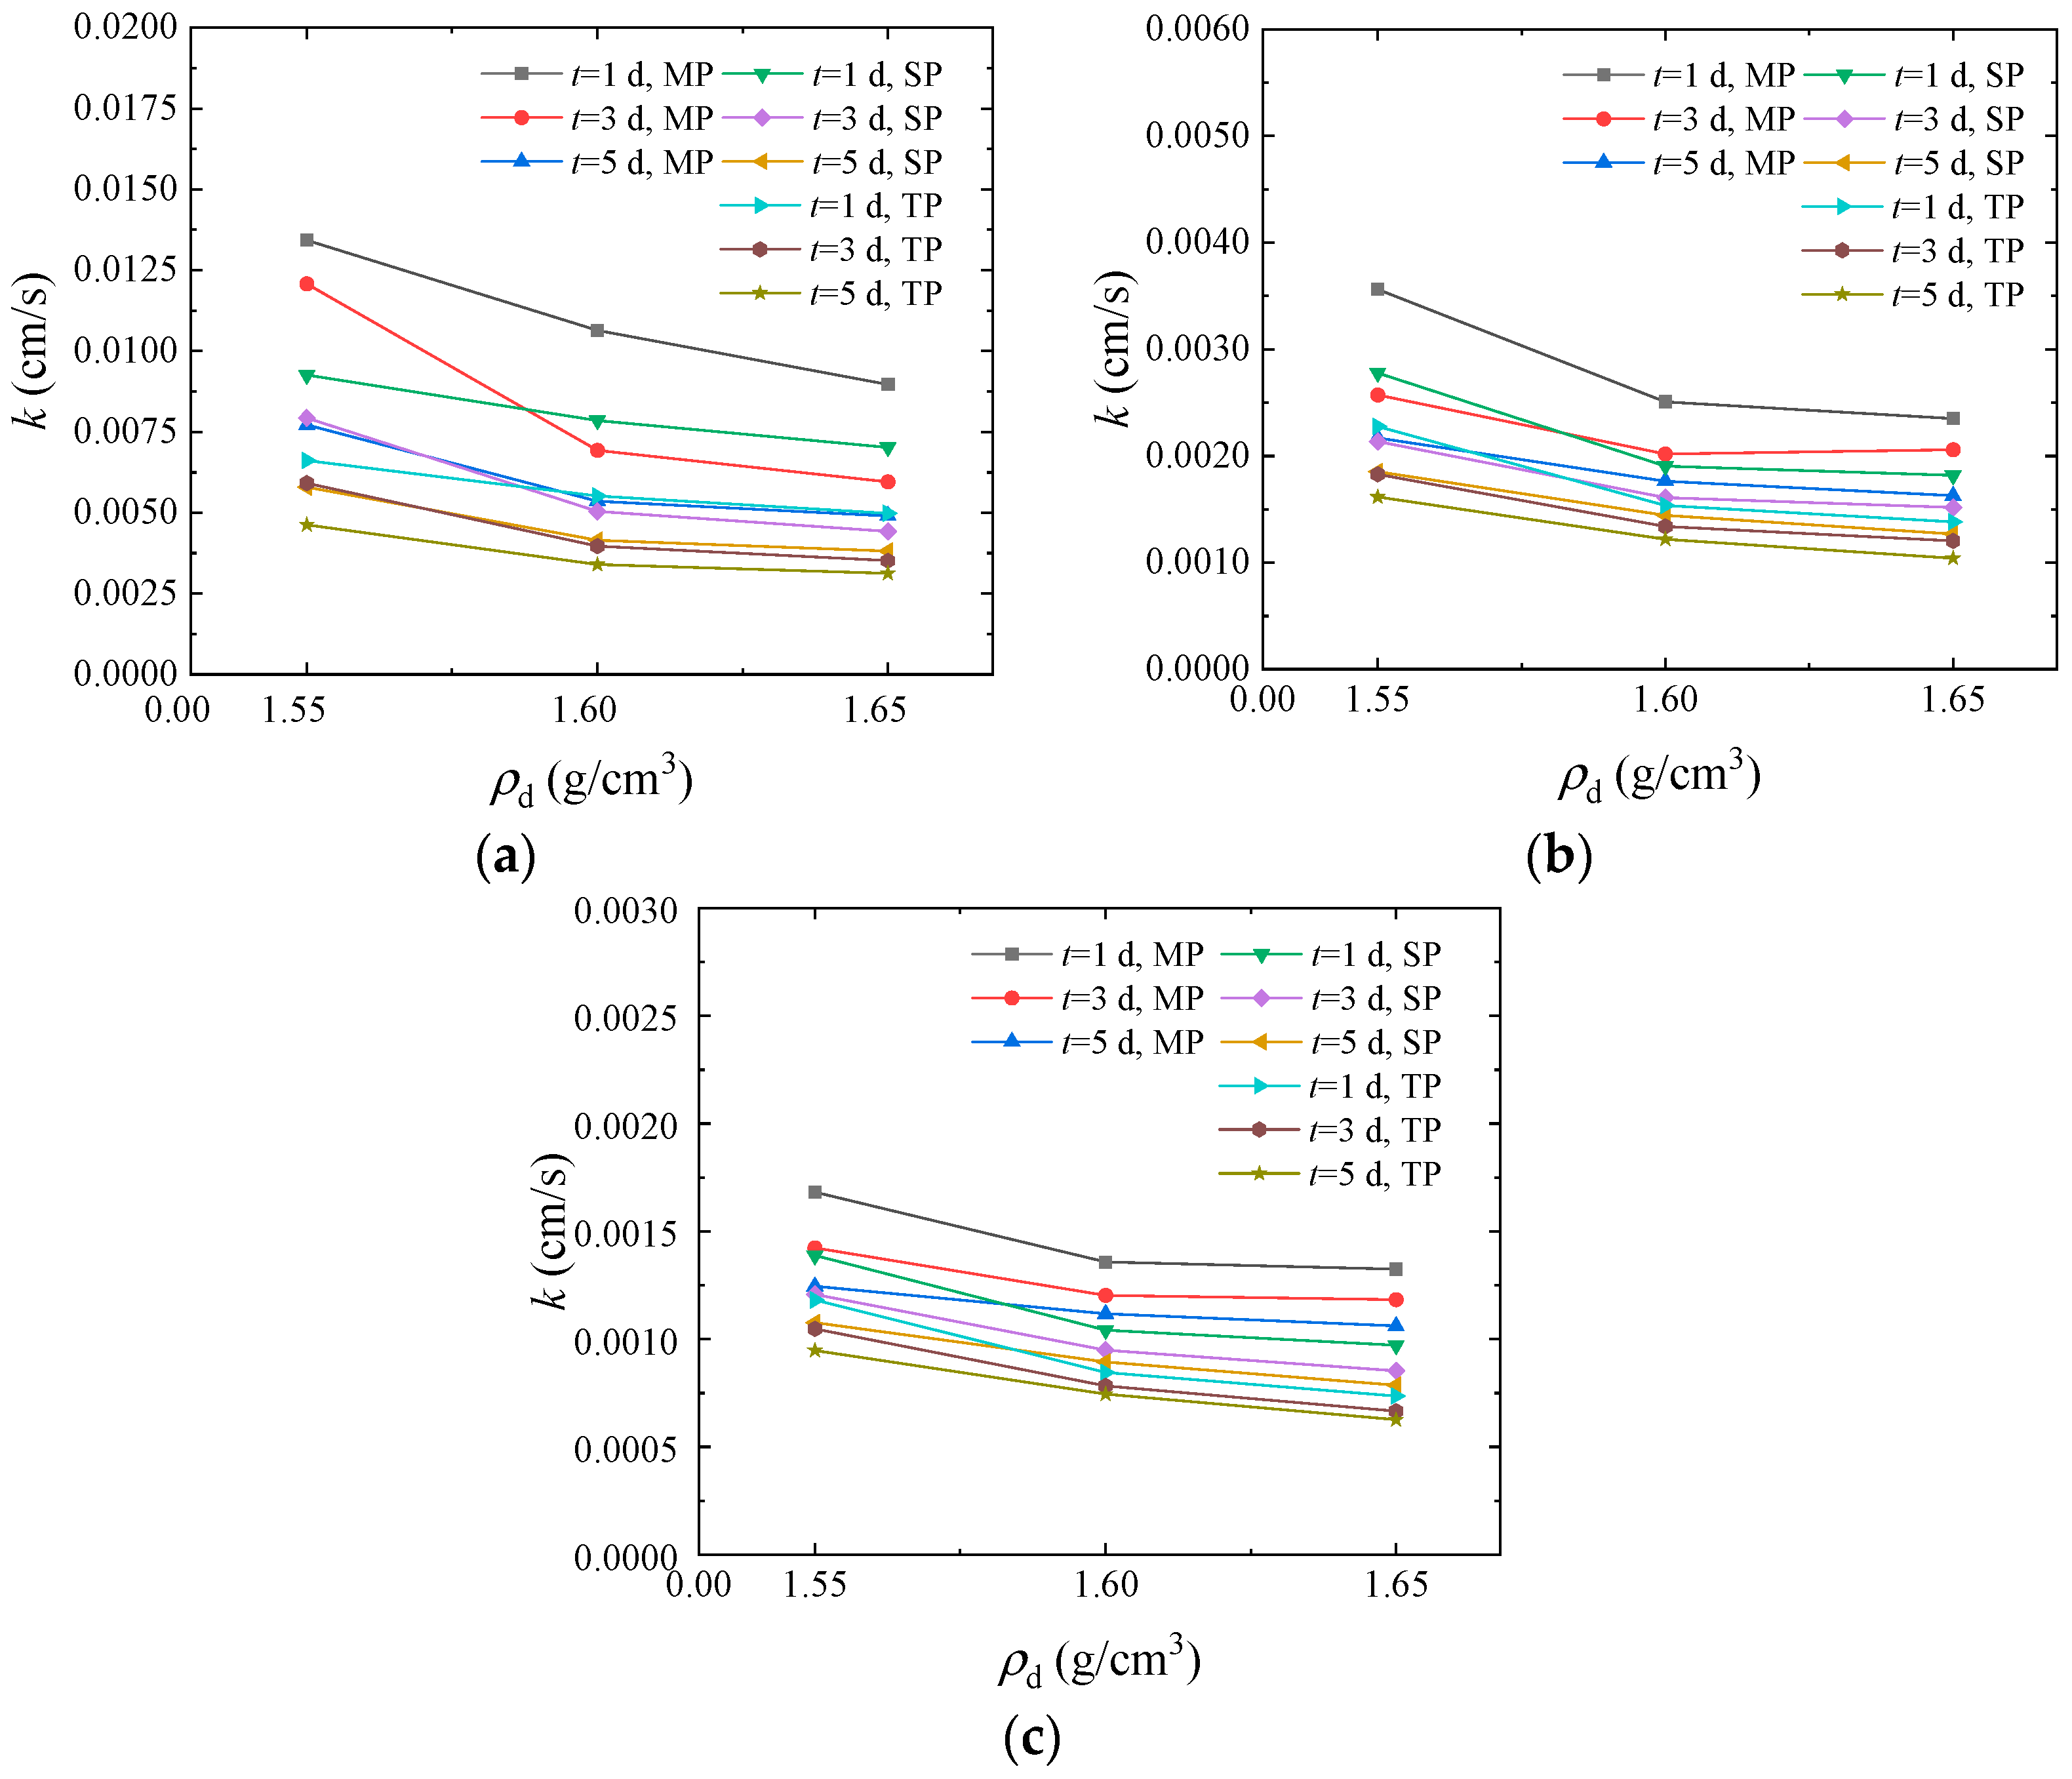
The size of sandy soil pores is determined by the dry density. Therefore, dry density has a major influence on the permeability of sandy soil. To examine how the initial dry density affected the permeability characteristics of the EICP-solidified sandy soil, Figure 3 shows the curve of the change in permeability coefficient with initial dry density when the cementation number is 2, 4, and 6. As shown in the figure, the permeability coefficient of the cemented specimen decreases as the initial dry density rises. When the cementation number is constant, the permeability coefficient of the sample decreases as the cementation standing time increases, which is consistent with the conclusions of Reference [26]. When the two-stage perfusion method is applied, the cementation number is 6, and the standing time is 1 day, the initial dry density increases from 1.55 to 1.65 g/cm3 and the permeability coefficient of the cemented sample decreases from 0.00118 to 0.00073 cm/s, leading to the worst permeability. This is mainly because there is a closer contact between particles when the sample has a large initial dry density, and the CaCO3 crystals generated by EICP can effectively cement sand particles into a whole, thus blocking the seepage path of soil mass, enlarging the water penetration path, and causing a decrease in the permeability coefficient.

Figure 3.
Curve of relationship between permeability coefficient and initial dry density: (a) n = 2; (b) n = 4; (c) n = 6.
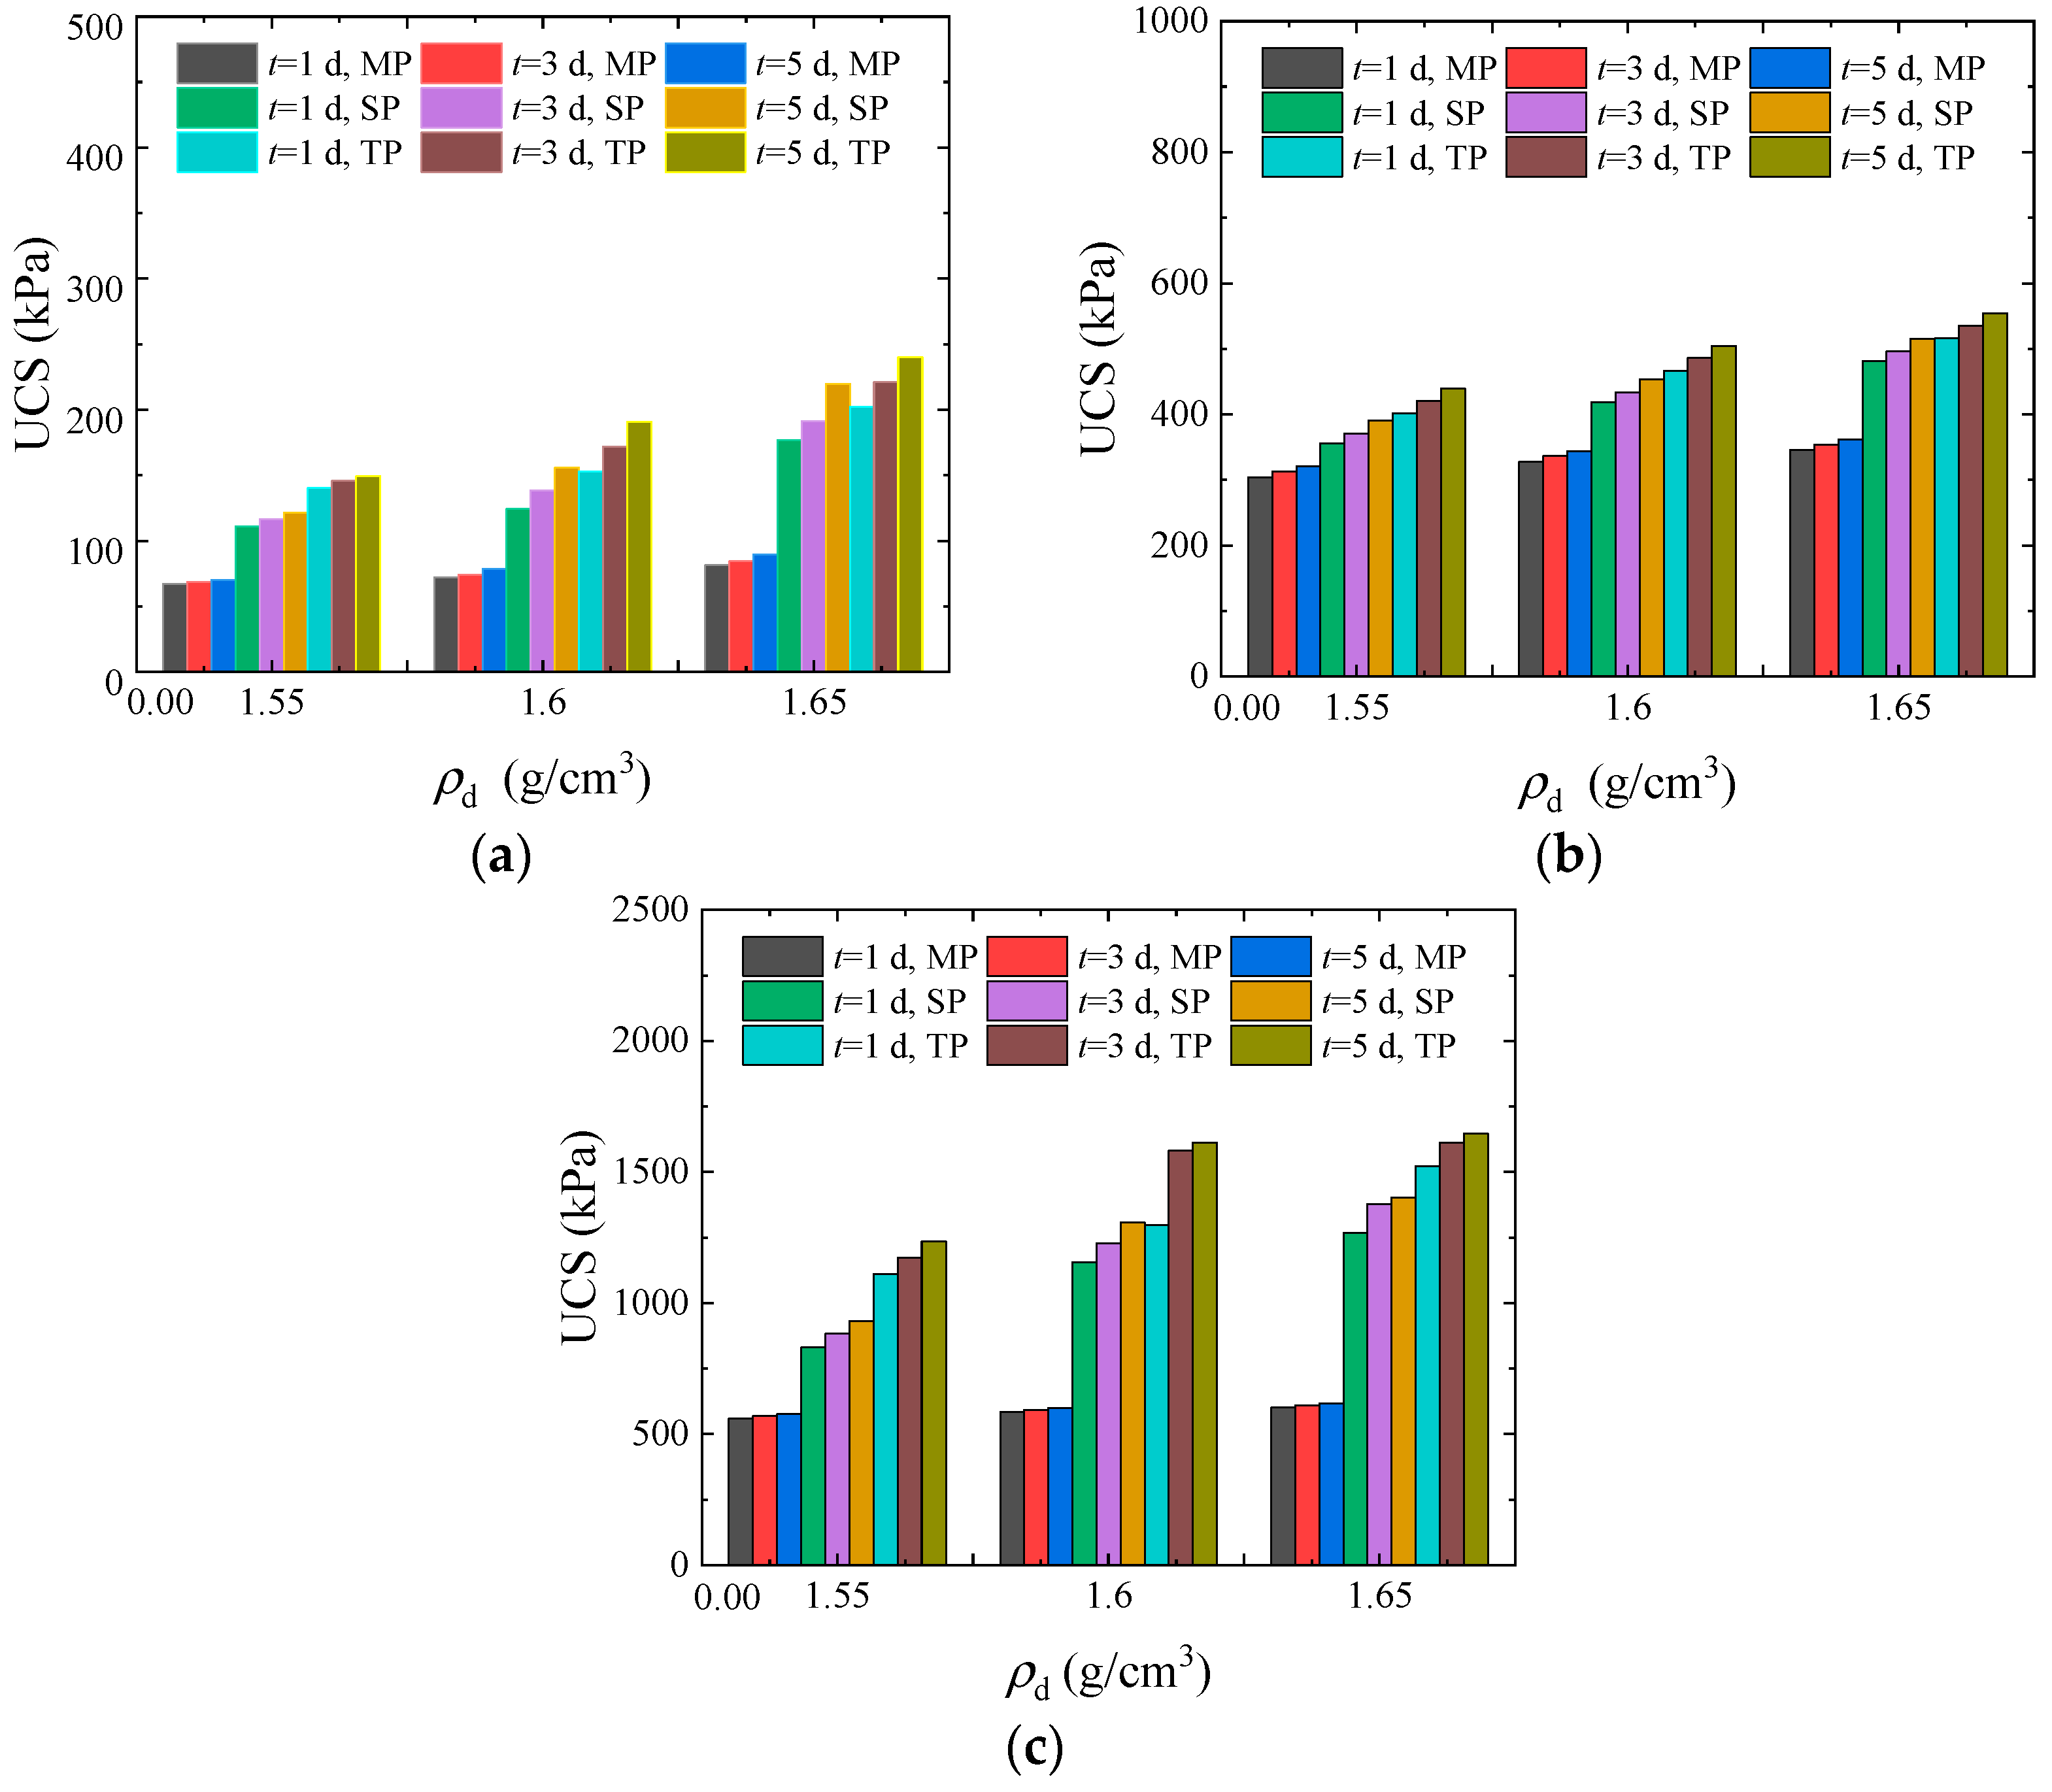
UCS is an important indicator reflecting the effect of soil solidification. Figure 4 presents the histograms of the change in unconfined compressive strength with dry initial density of the solidified sandy soil after 2, 4, and 6 cementation cycles. As shown in the figure, the UCS of the cemented sample shows an increasing trend by increasing the initial dry density. Related studies have shown that as the dry density increases, the unconfined compressive strength also increases, which is consistent with the results of this research [27]. When the two-stage perfusion method is applied, the cementation number is 6, the standing time is 1 day, and the initial dry density increases from 1.55 to 1.65 g/cm3, the UCS of the cemented solidified sandy soil increases from 1110.25 to 1523.48 kPa, achieving the highest UCS. When the dry density of the sample is larger, the smaller the spacing between the sand particles, the better the CaCO3 cementing effect. When the sample is under an external load, the friction and cohesive force between sand particles increase at the same time and the strength of the solidified standard sand is improved accordingly in comparison with the loose standard sand.

Figure 4.
Histogram of change in UCS with dry initial density: n = (a) 2; (b) 4; (c) 6.
3.2. Analysis of the Effect Caused by the Cementation Number on Permeability and Strength Characteristics of Sandy Soil
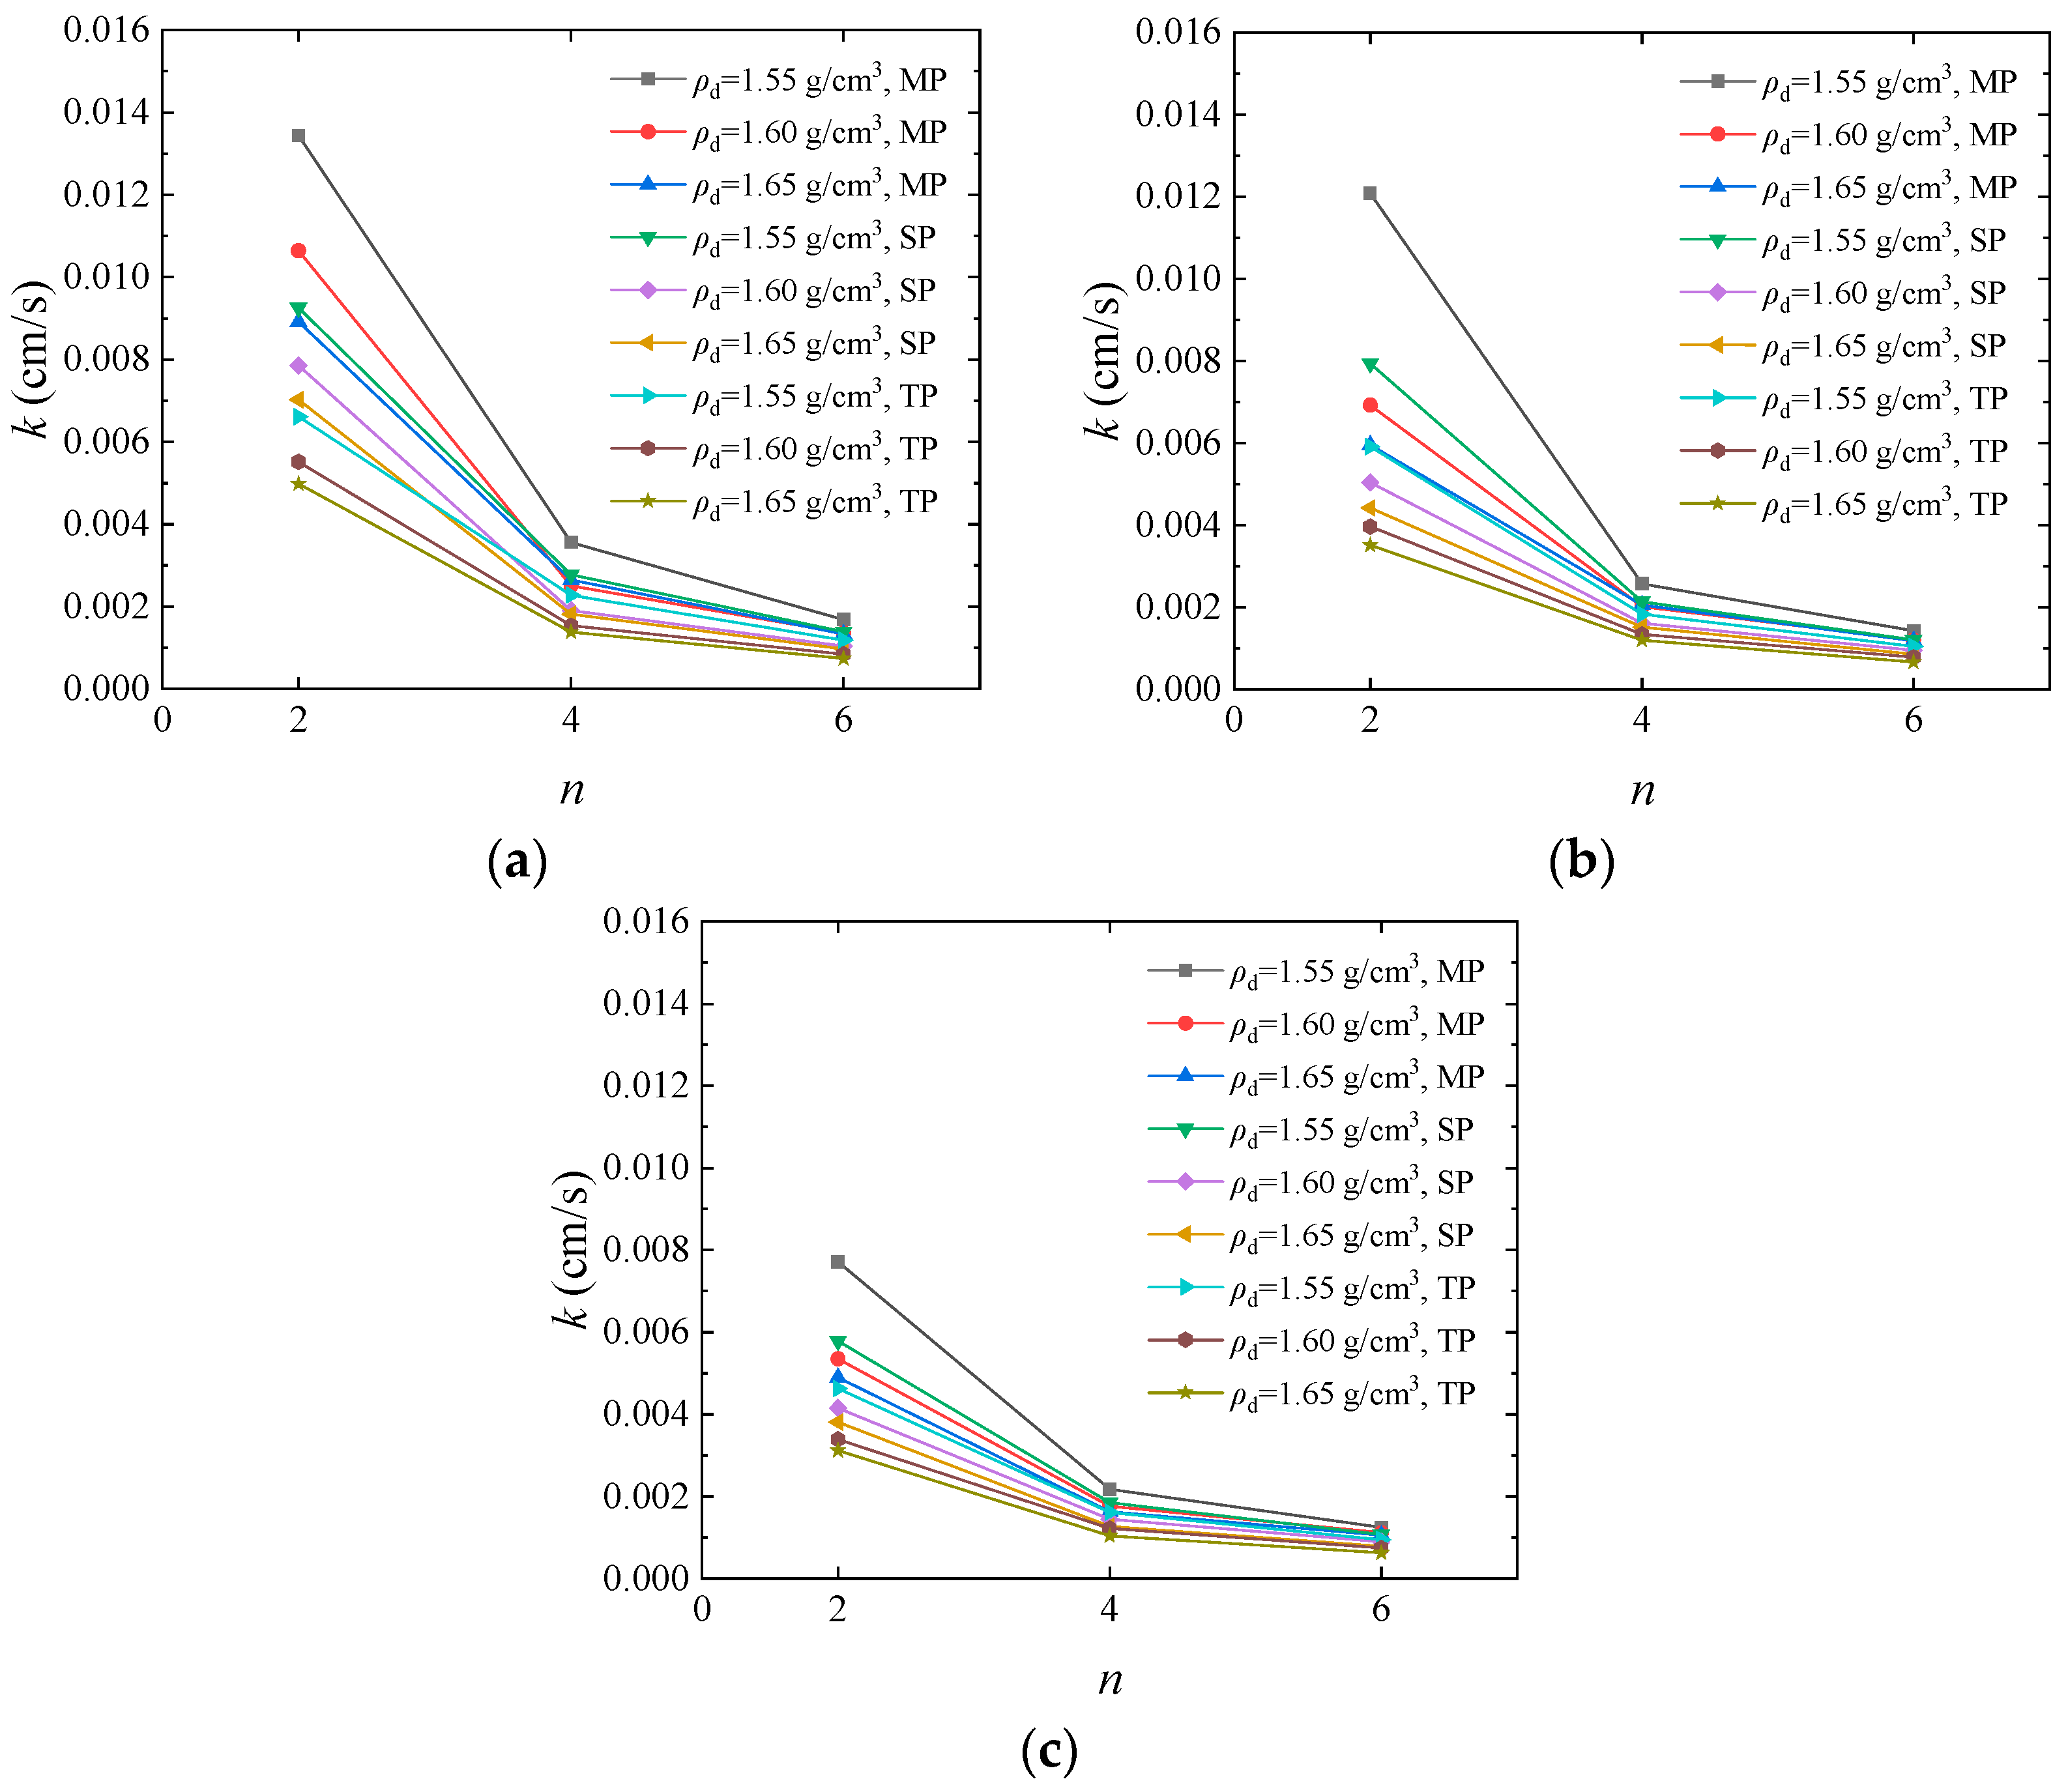
Cementation number has an effect on the generation and crystal size of CaCO3 in EICP-solidified sandy soil. Therefore, it also has an effect on the permeability and strength of solidified sandy soil. Figure 5 shows the curve of the change in the permeability coefficient of the solidified sample with the cementation number when the standing time is 1, 3, and 5 days. The chart indicates a notable decrease trend in the permeability coefficient of sandy soil when the cementation number increases from 2 to 4, and the permeability coefficient shows a slow downward trend when the cementation number increases from 4 to 6. When the two-stage perfusion method is applied, the initial dry density is 1.65 g/cm3, the standing time is 3 days, and the cementation number is 6, the permeability coefficient of the cemented sample is 0.00066 cm/s, the lowest permeability coefficient. With respect to the primary cause of the above situation, a higher cementation number (six times) can ensure that the urease and cementing solution can generate more CaCO3 crystals to effectively fill the pores between sand particles and cement them into a whole. Moreover, the seepage path of the sample is blocked, causing a decrease in the permeability of the solidified sandy soil.

Figure 5.
Curve of relationship between permeability coefficient and cementation number: t = (a) 1; (b) 3; (c) 5 d.
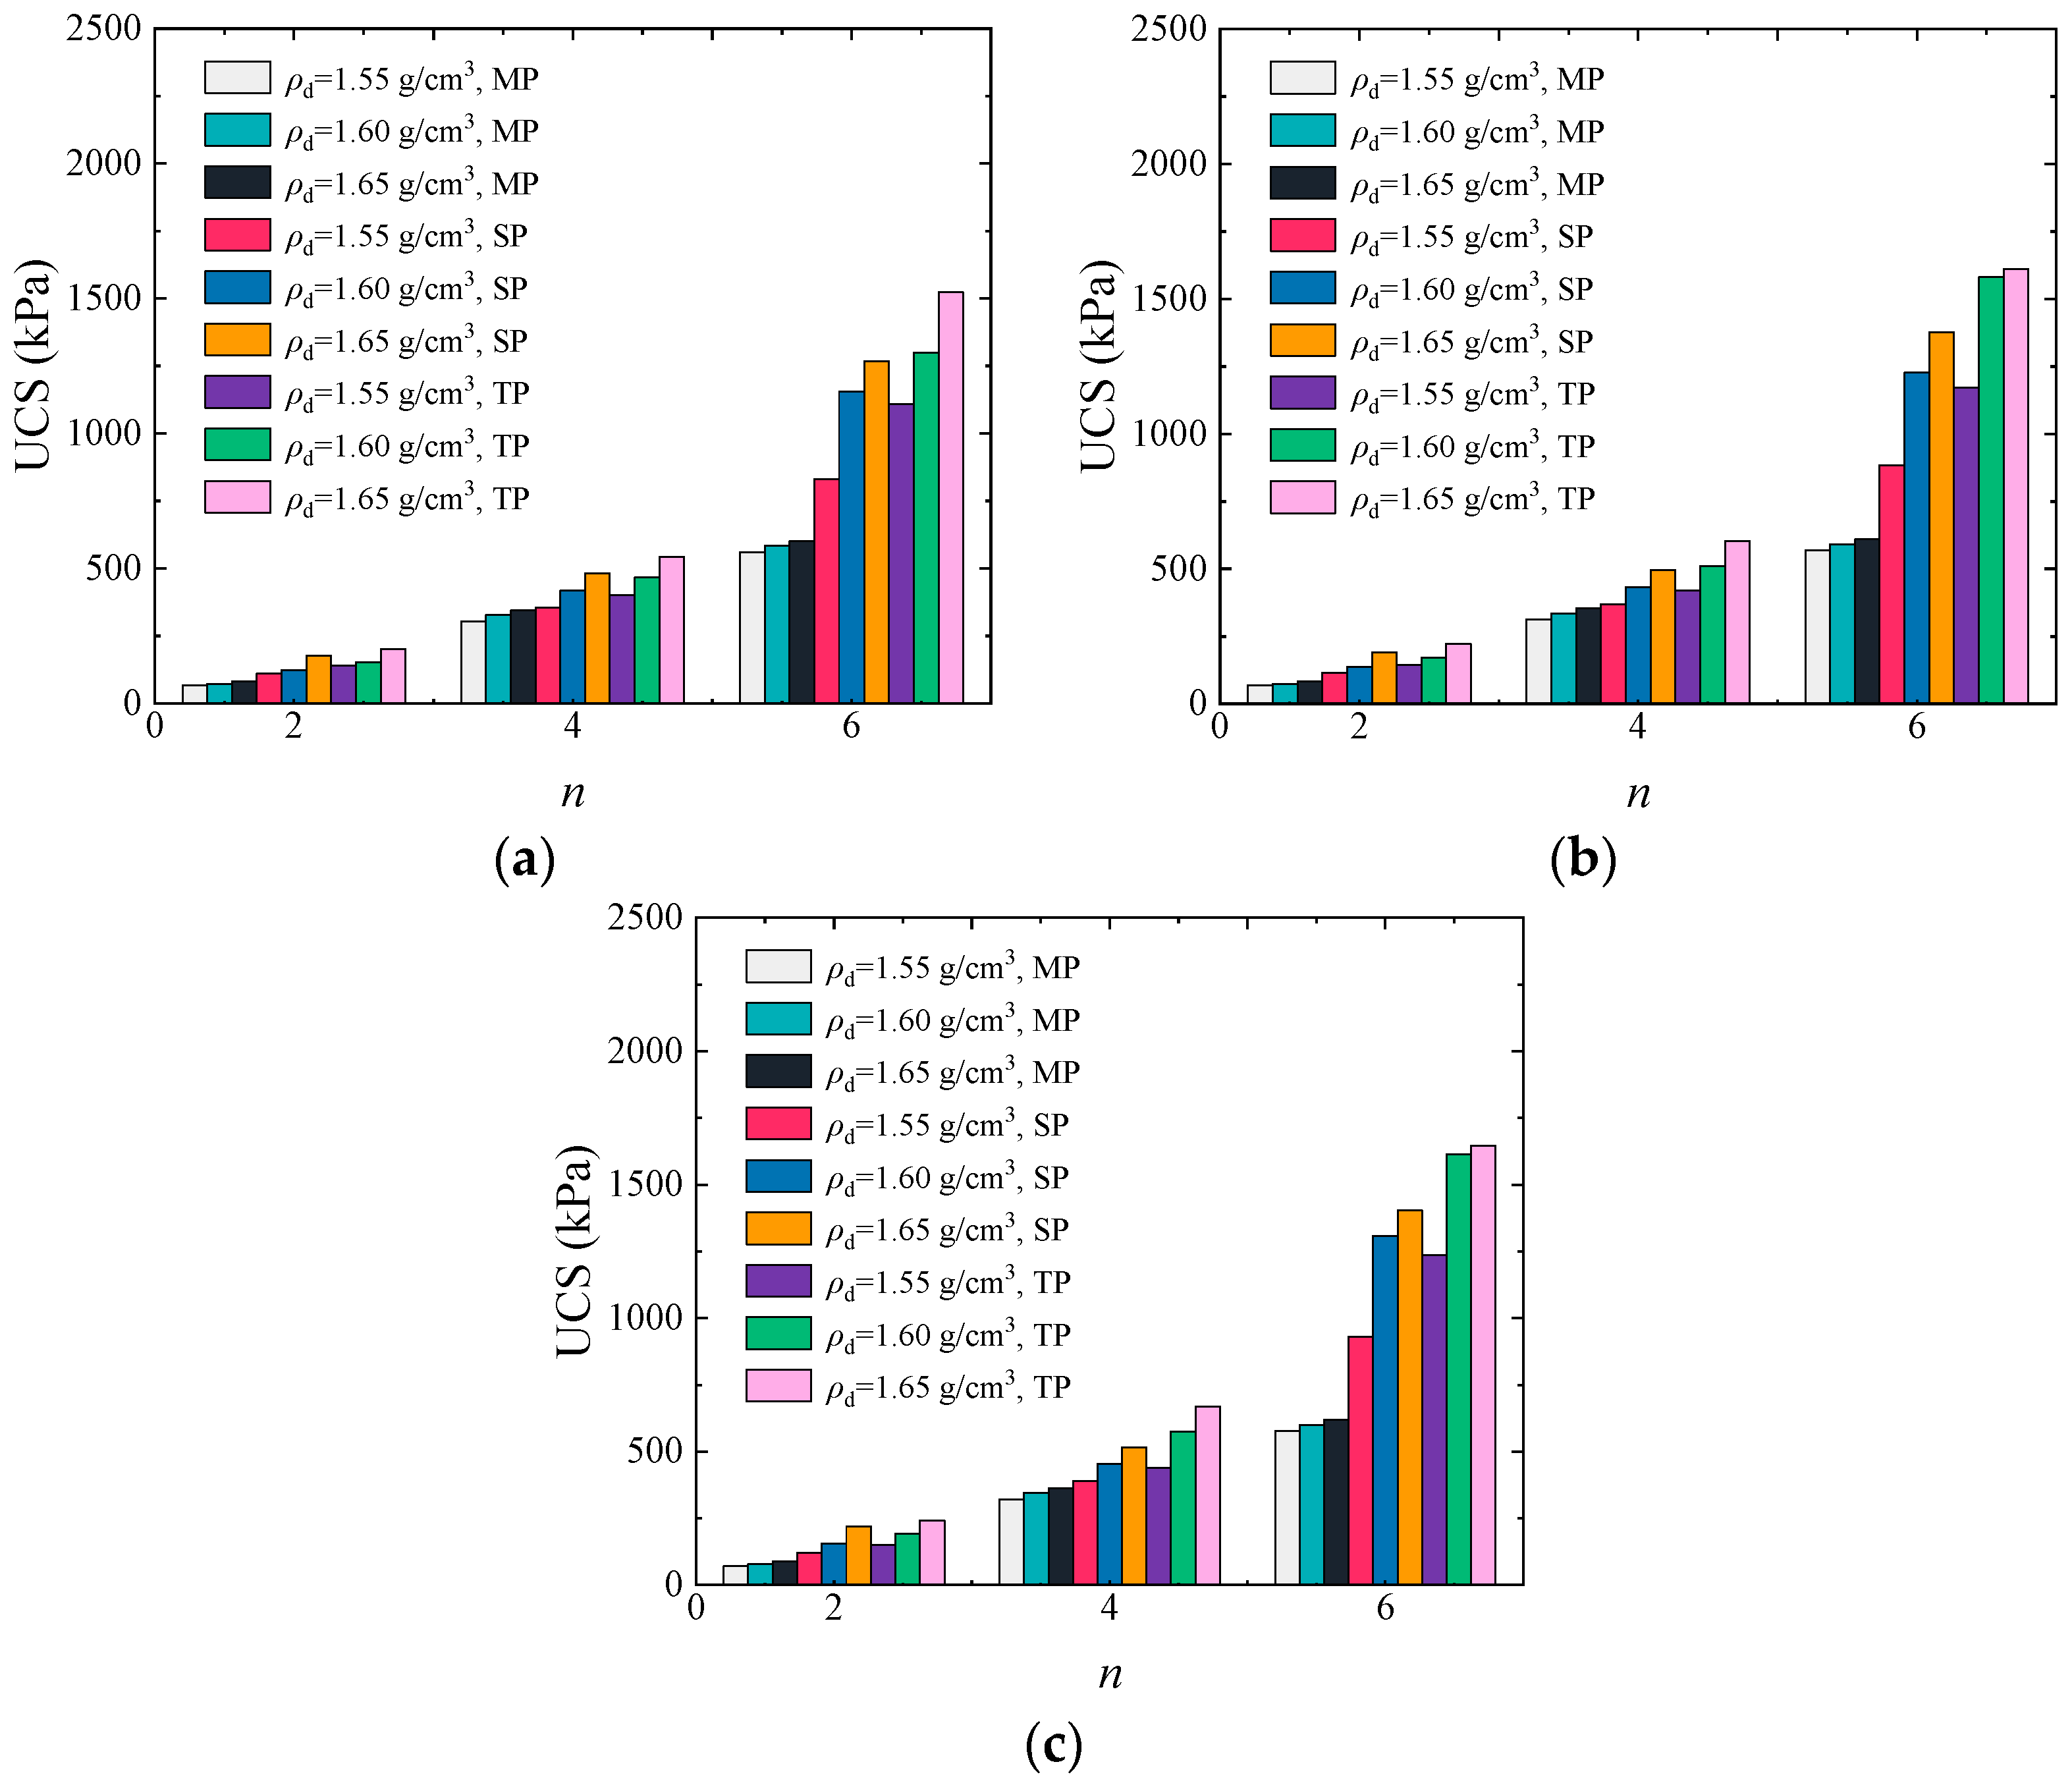
Figure 6 summarizes the histograms of the change in UCS of solidified sandy soil with the cementation number when the standing time is 1, 3, and 5 days. As shown in the figure, the UCS of the cemented sample shows an increasing trend with the increase in cementation number. These results agree with a previous study [28]. When the two-stage perfusion method is applied, the initial dry density is 1.65 g/cm3, the standing time is 3 days, and the perfusion number increases from 2 to 6, the UCS of the sample increases from 221.48 to 1611.32 kPa. This is mainly because the generation of CaCO3 crystals and the uniformity of crystal distribution jointly determine the strength of the solidified sandy soil. A larger cementation number (six times) can ensure the generation of more CaCO3 crystals to effectively fill the pores between sand particles and cement them into a whole, thus promoting the UCS of the solidified sandy soil.

Figure 6.
Histogram of change in UCS with the cementation number: t = (a) 1; (b) 3; (c) 5 d.
3.3. Analysis of the Effect of Standing Time on Permeability and Strength Characteristics of Sandy Soil
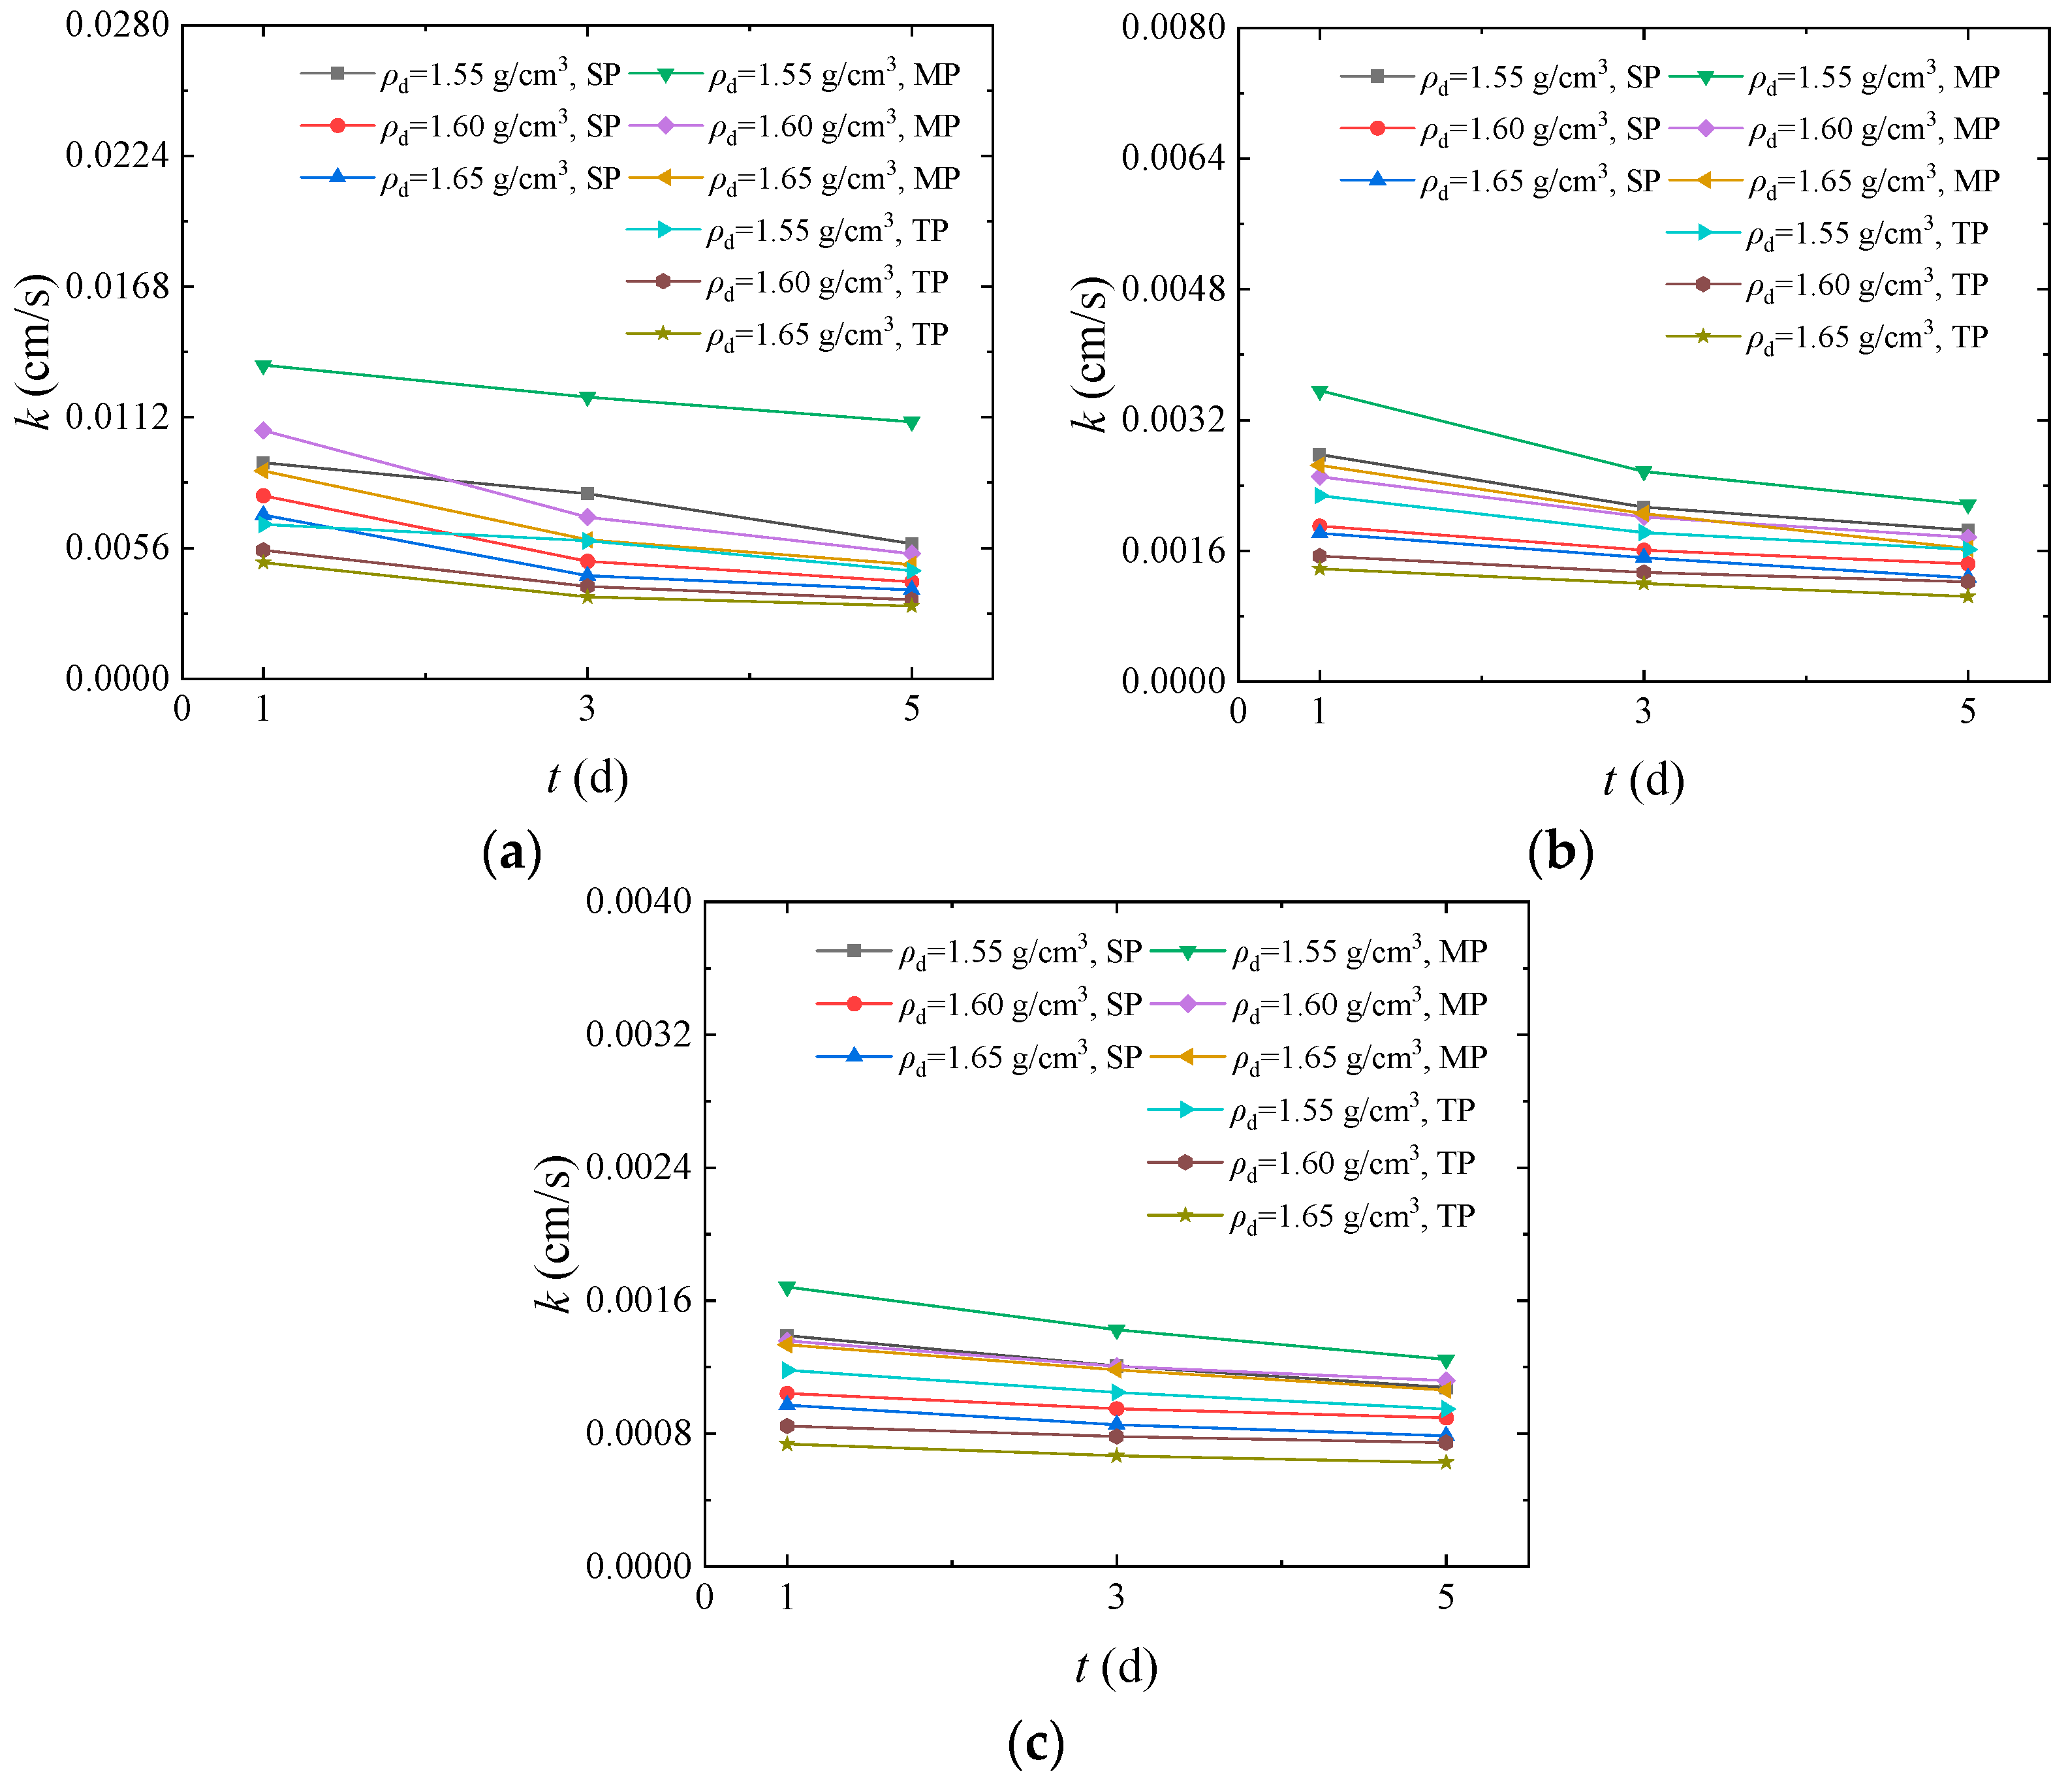
For the purpose of examining how standing time affects the permeability properties of EICP-solidified sandy soil, Figure 7 shows the curve of the change in permeability coefficient with the standing time of solidified sandy soil when the cementation number is 2, 4, and 6. As shown in the figure, by increasing the standing time, the permeability coefficient of the solidified sandy soil shows a gradually decreasing trend. When the two-stage perfusion method is applied, the initial dry density is 1.65 g/cm3, the cementation number is 4, and the standing time is 1, 3, and 5 days, the permeability coefficient of the sample is 0.00138, 0.00120, and 0.00104 cm/s, respectively. This is mainly because the urease solution can continue to mineralize with the cementing solution, generating more CaCO3 crystals to solidify the standard sand and reduce the permeability. According to the test results, the solidified sandy soil has the lowest permeability when the standing time is 5 days. If the standing time is too short, the incomplete reaction between urease and cementing solution increases the permeability coefficient of the sandy soil. Therefore, an appropriate extension of standing time is beneficial to the complete reaction between urease and cementing solution.

Figure 7.
Curve of relationship between permeability coefficient and standing time: n = (a) 2; (b) 4; (c) 6.
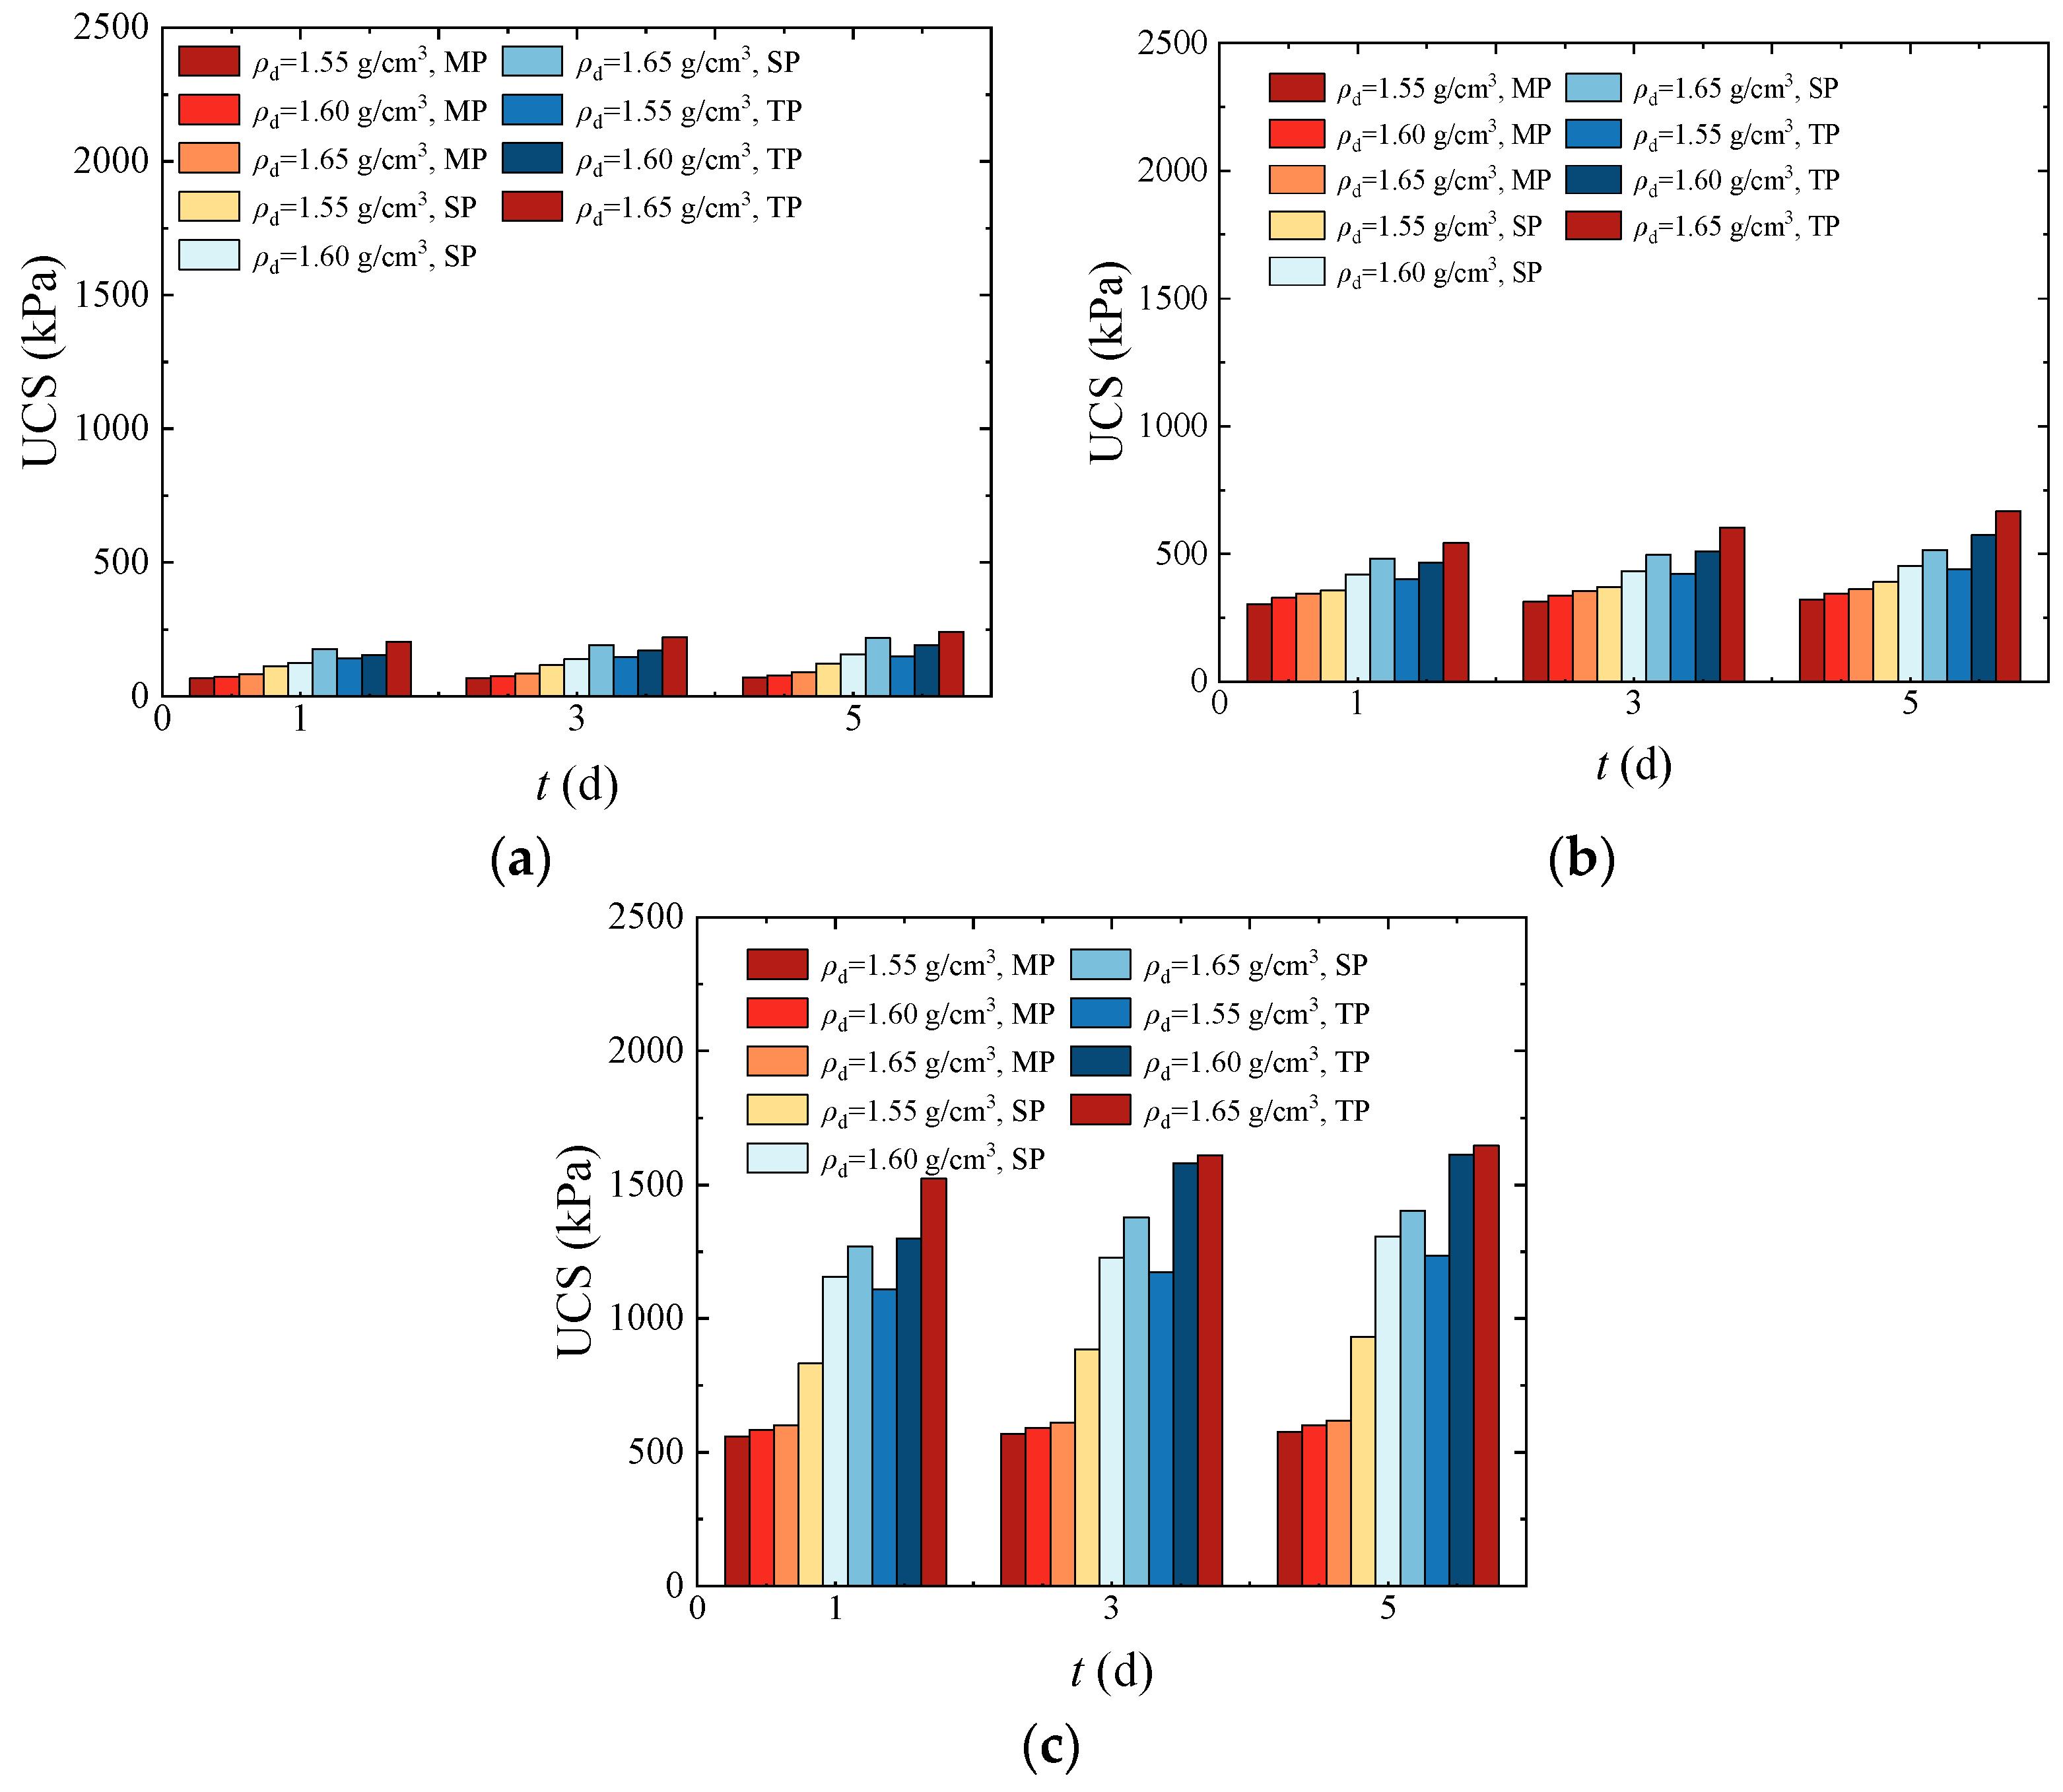
Figure 8 summarizes the histograms of the change in UCS of solidified sandy soil with the standing time when the cementation number is 2, 4, and 6. As shown in the figure, the UCS of the solidified sand shows a gradually increasing trend with the increase in standing time. The results are consistent with those of Reference [29]. When the two-stage perfusion method is applied, the initial dry density is 1.65 g/cm3, the cementation number is 6, and the standing time is 1, 3, and 5 days, the UCS of the cemented sample reaches 1523.48, 1611.32, and 1646.94 kPa, respectively. In consideration of the primary cause, the urease has a higher activity during the test and the residual urease in the pores of sand particles continues to react with the cementing reagent to generate CaCO3 crystals and cement the sandy soil, thereby improving the sample strength. According to the test results, the solidified sample has the highest UCS when the standing time is 5 days. If the standing time is too short, the incomplete reaction between urease and cementing solution leads to a lower UCS.

Figure 8.
Histogram of change in UCS with standing time: n = (a) 2; (b) 4; (c) 6.
3.4. Analysis of the Effect of Perfusion Methods on Permeability and Strength Characteristics of Sandy Soil
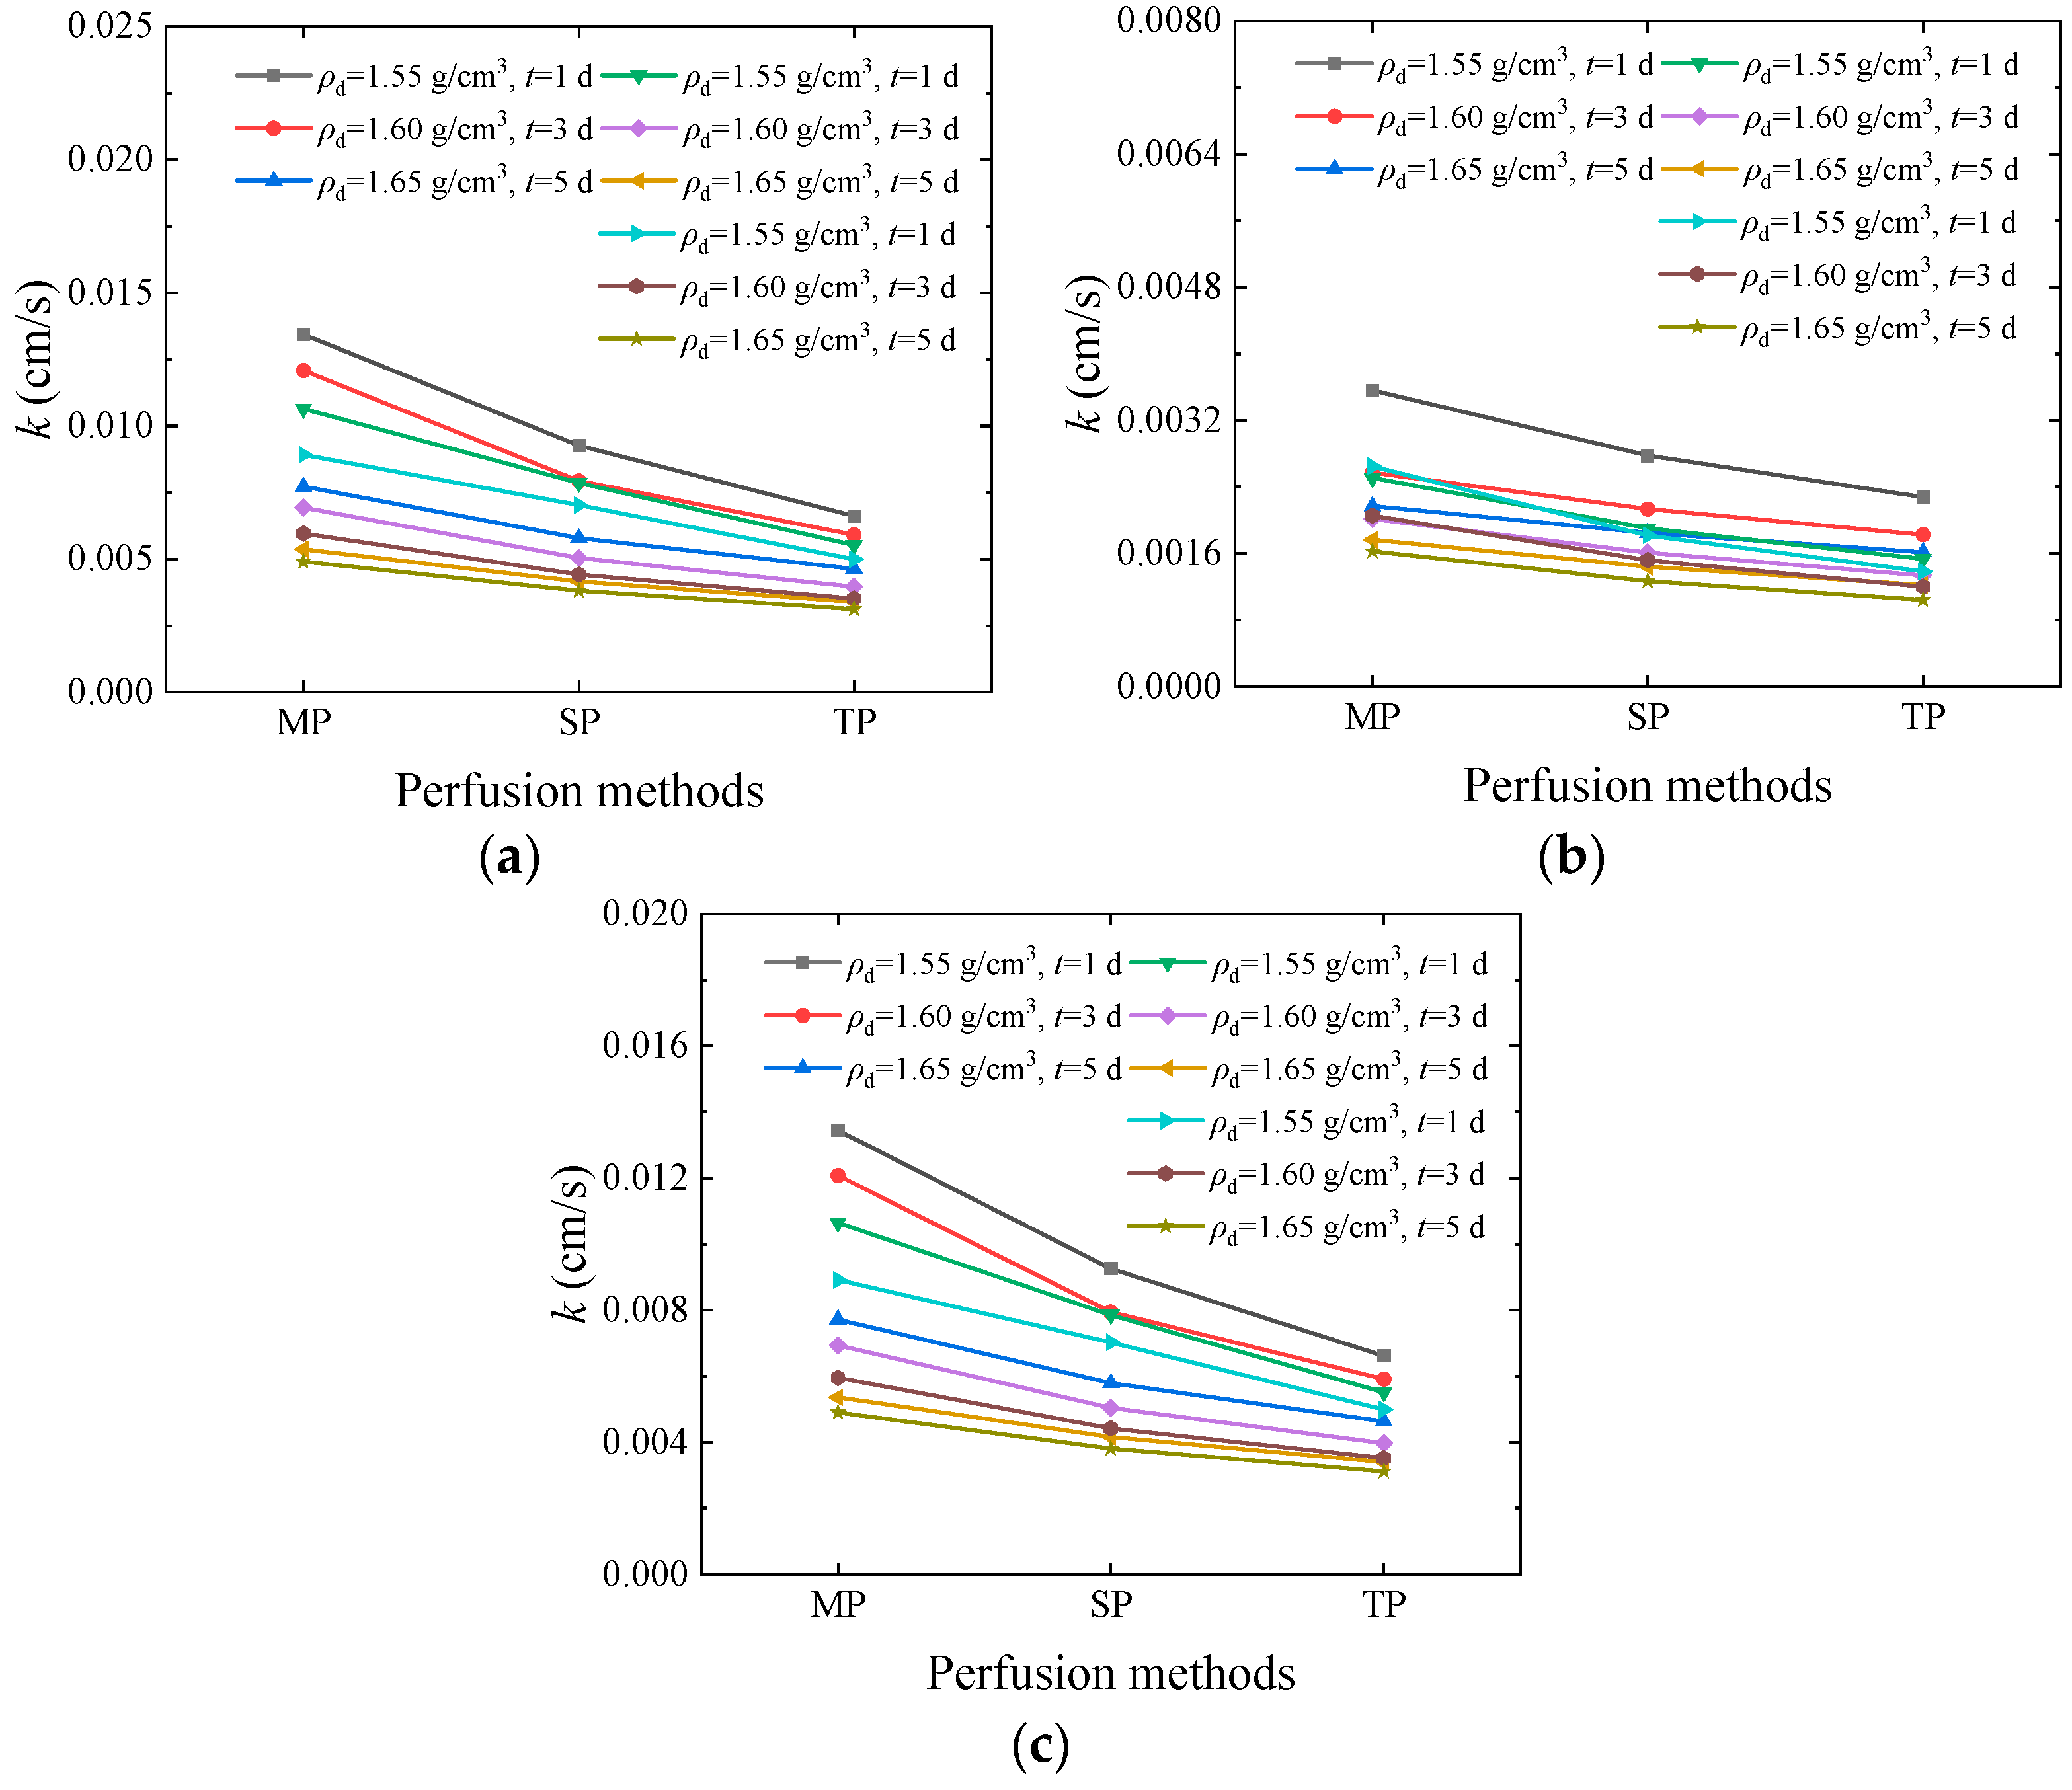
Perfusion methods have a significant effect on the generation and uniform distribution of CaCO3 crystals. To examine how different perfusion techniques affect the permeability properties of solidified sandy soil, Figure 9 presents the curve of the relationship between the permeability coefficient of solidified sandy soil and the perfusion method when the cementation number is 2, 4, and 6. As can be seen from the figure, the mixed perfusion method causes the highest permeability coefficient and vice versa for the two-stage perfusion method when the initial dry density and standing time are constant. When the initial dry density is 1.65 g/cm3, the cementation number is 6, and the standing time is 5 days, the permeability coefficients of the solidified sandy soil are 0.0010, 0.00078, and 0.00062 cm/s, respectively, under mixed, stepwise, and two-stage perfusion. The test results demonstrate that the two-stage perfusion method contributes the best solidification effect, the stepwise perfusion method causes a moderate solidification effect, and the mixed perfusion method leads to the worst solidification effect.

Figure 9.
Curve of relationship between permeability coefficient and perfusion method: n = (a) 2; (b) 4; (c) 6.
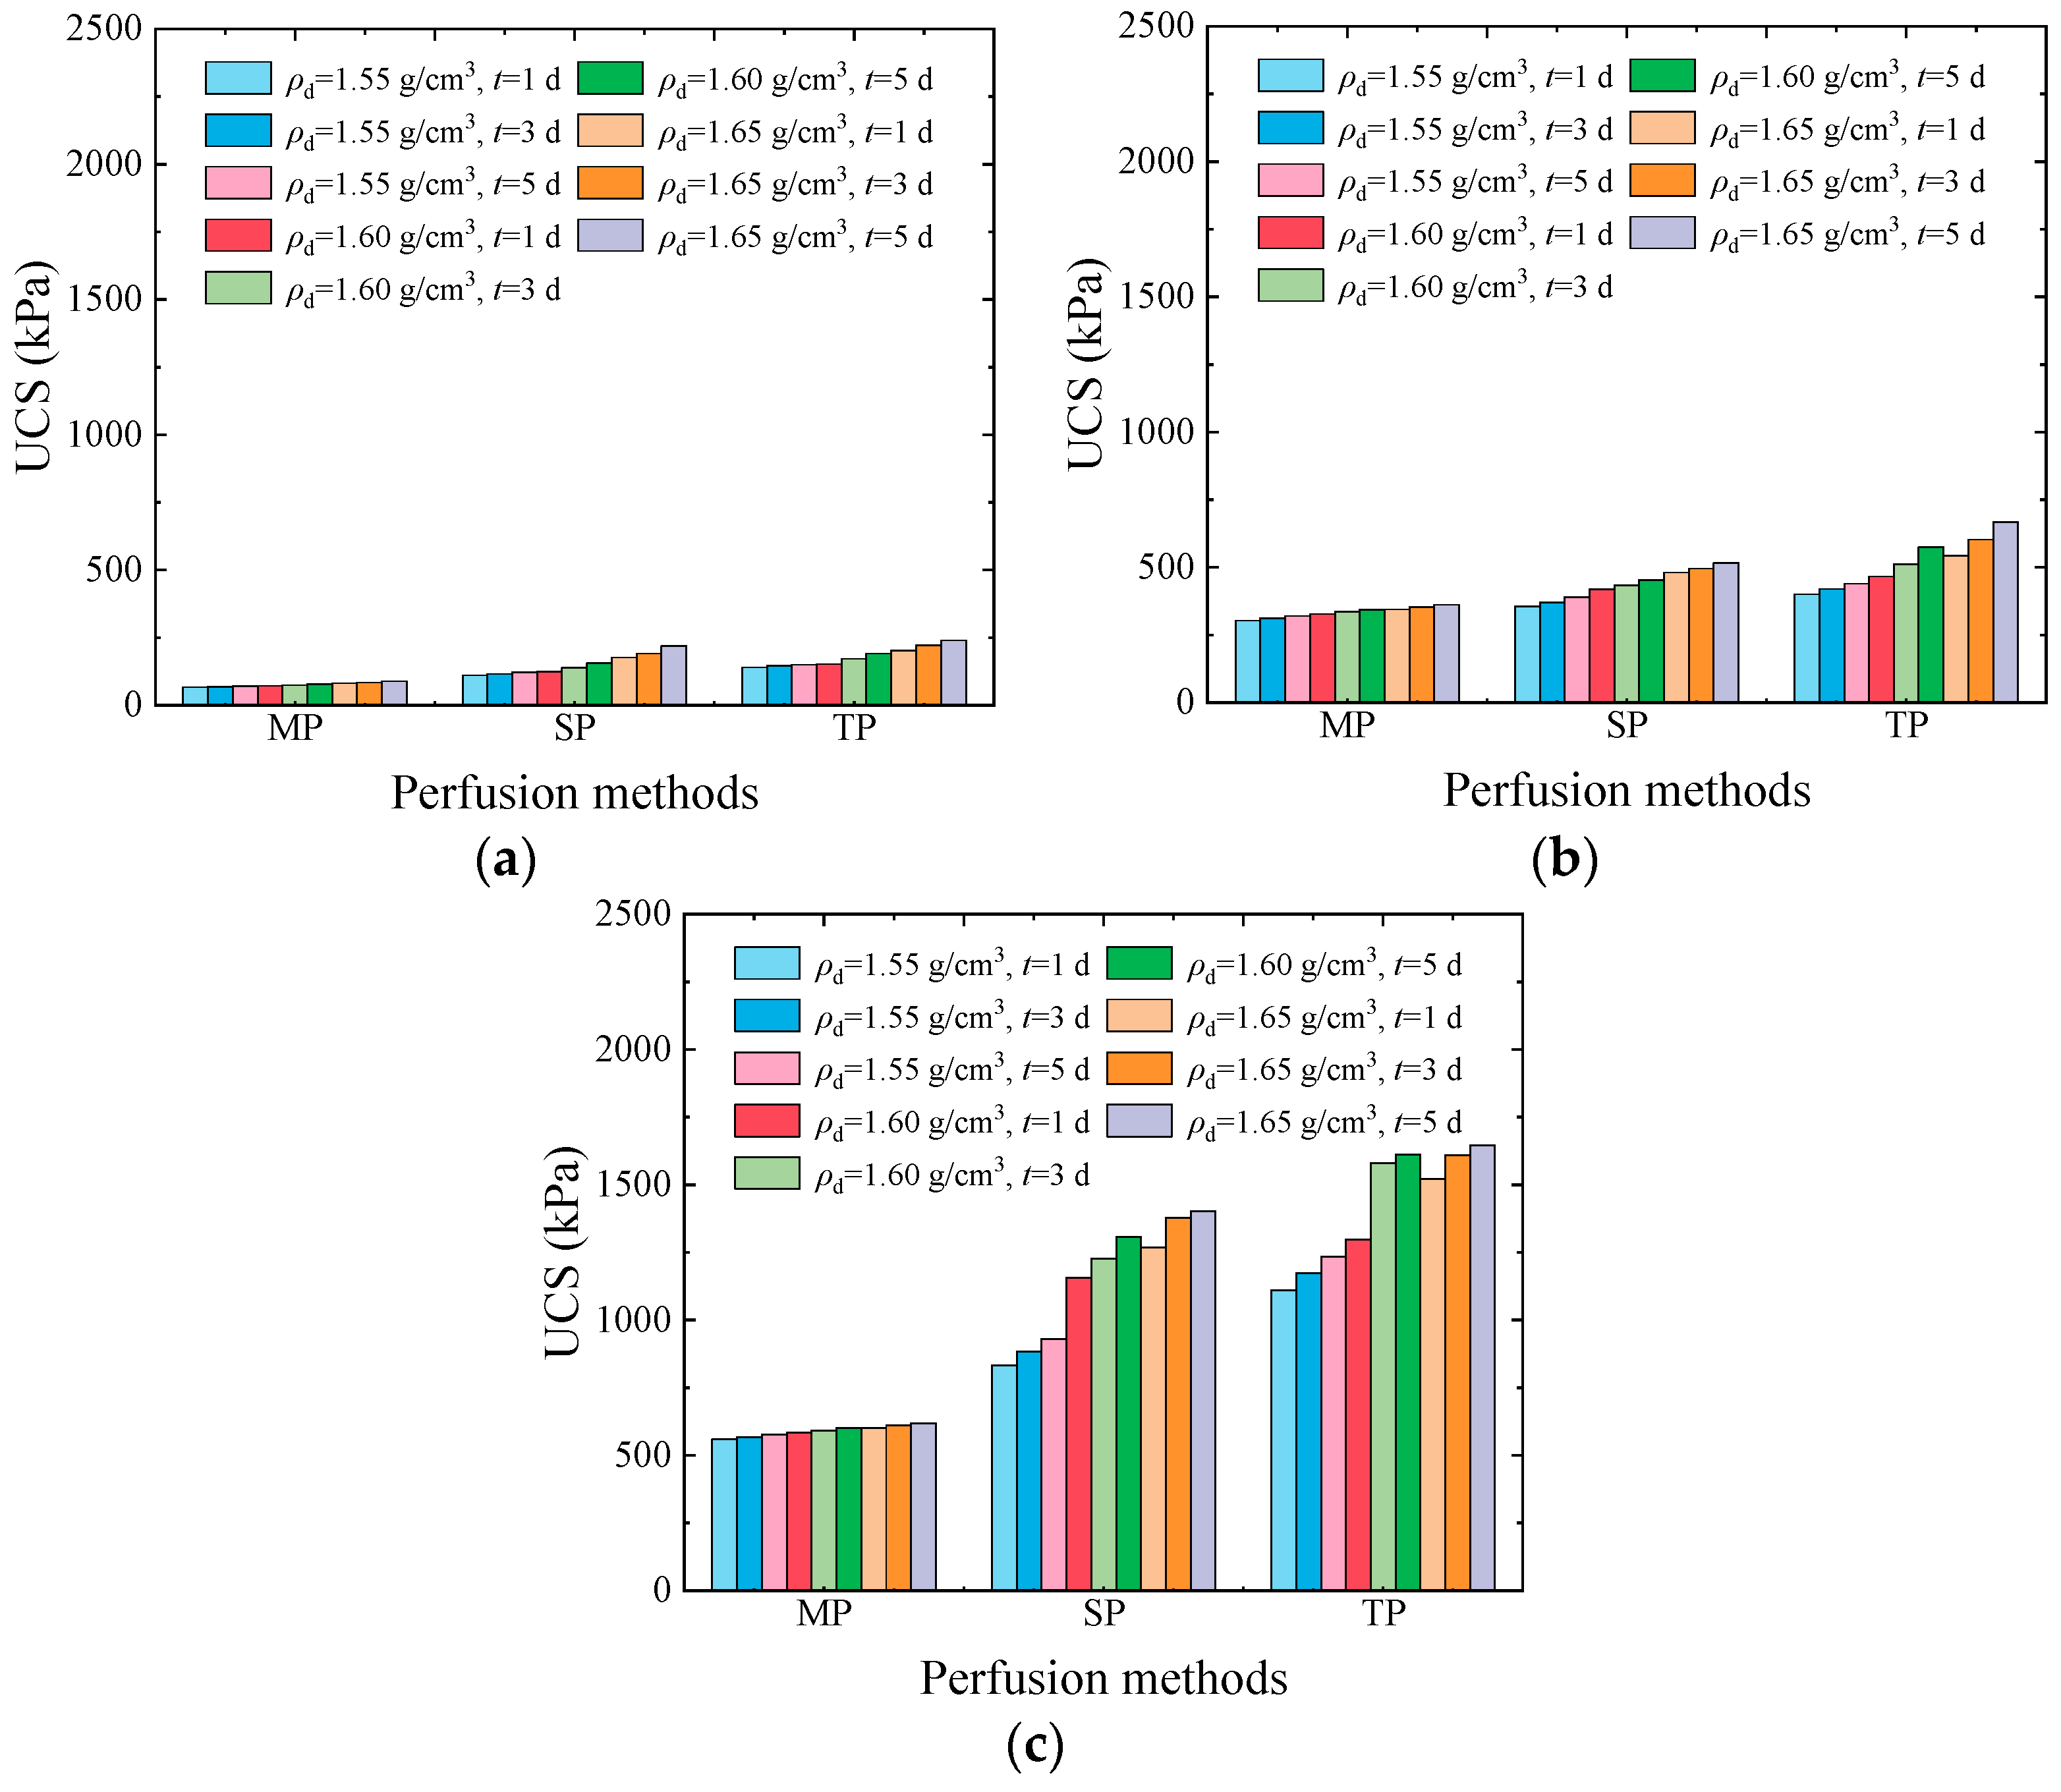
Figure 10 summarizes the histograms of the change in UCS of solidified sandy soil with perfusion methods when the cementation number is 2, 4, and 6. As shown in the figure, the UCS of the solidified sandy soil based on the two-stage perfusion method is relatively high and that of the sample using the mixed perfusion method is relatively low when the cementation number is constant. When the cementation number is small, the difference in UCS is not significant. However, the difference in UCS becomes significant with the increase in cementation number. When the initial dry density is 1.65 g/cm3, the cementation number is 6, and the standing time is 5 days, the UCS of the solidified sandy soil reaches 618.02, 1403.61, and 1646.94 kPa, respectively, under mixed, stepwise, and two-stage perfusion. Compared with a previous study [28], the UCS of the two-stage method increases by 1028 kPa, while the UCS of the premixed method increases by 1720 kPa. According to the test results, the two-stage perfusion method contributes the best solidification effect, the stepwise perfusion method causes a moderate solidification effect, and the mixed perfusion method leads to the worst solidification effect. The results of the UCS and permeability tests can be mutually verified. The mixed perfusion method can fully react with urease and cementing solution after mixing, with high conversion efficiency, but it can easily hinder subsequent grouting and lead to poor perfusion results. The stepwise perfusion method can improve the stability of the mechanical properties of sandy soil, but the conversion efficiency is low. The two-stage perfusion method can make the cementing solution more evenly distributed in the rock and soil, improve the accuracy and effectiveness of cementing, and exhibit a high conversion efficiency. Therefore, the two-stage perfusion method has the best effect.

Figure 10.
Histogram of change in UCS with perfusion methods: n = (a) 2; (b) 4; (c) 6.
3.5. Analysis of the Relationship of Permeability Coefficient and UCS with the CaCO3 Generation
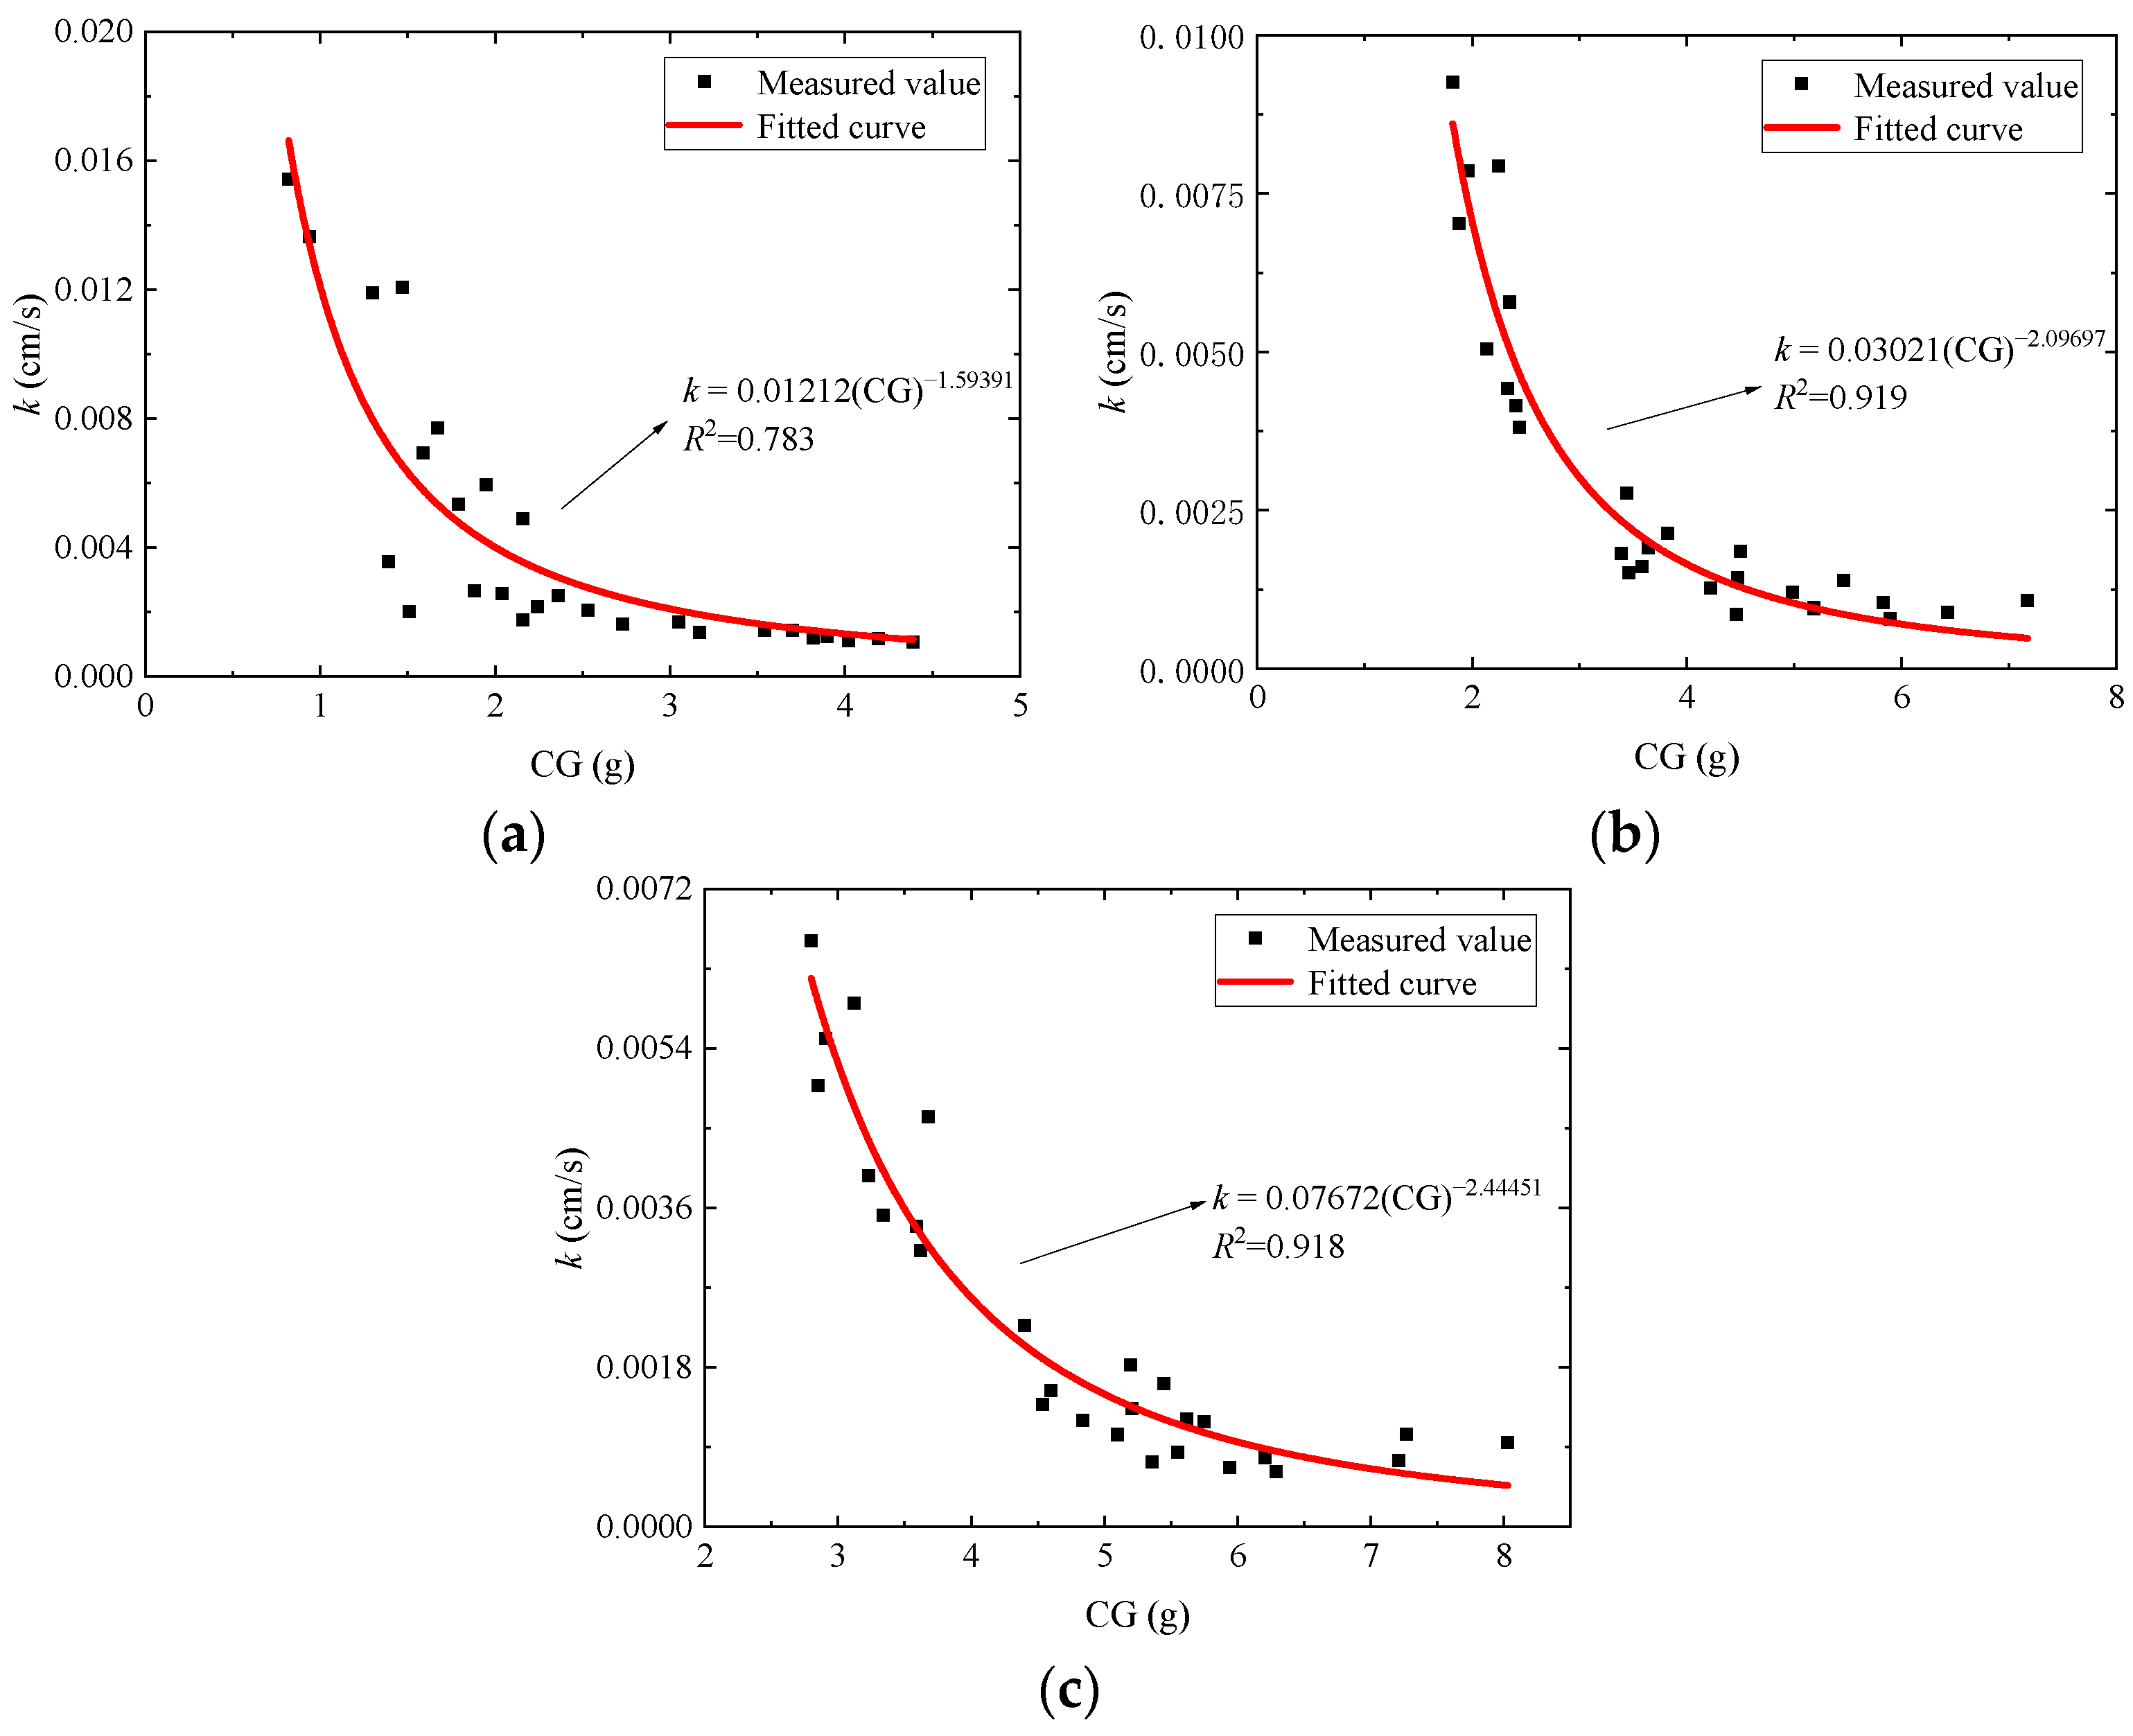
The permeability characteristics of solidified sandy soil are significantly impacted by the production of CaCO3 crystals, which represents both the benefits and drawbacks of the EICP mineralization process. Figure 11 summarizes the curve of the relationship between the permeability coefficient and CaCO3 generation (CG) of solidified sandy soil under different perfusion methods. As shown in the figure, the permeability coefficient of the sample decreases by increasing the CaCO3 generation, showing a negative correlation. The stepwise perfusion and two-stage perfusion methods have higher coefficients of determination, of 0.919 and 0.918, respectively, denoting a good correlation between the permeability coefficient and CaCO3 generation. This is mainly because the CaCO3 crystals generated by EICP mineralization have the function of filling pores and cementing sand particles, thus blocking the seepage path of soil mass, enlarging the water penetration path, and causing a decrease in the permeability coefficient. Therefore, the generation of CaCO3 in the process of EICP mineralization has a significant negative correlation with the permeability coefficient of sandy soil.

Figure 11.
Curve of relationship between permeability coefficient and CaCO3 generation: (a) mixed perfusion method; (b) stepwise perfusion method; (c) two-stage perfusion method.
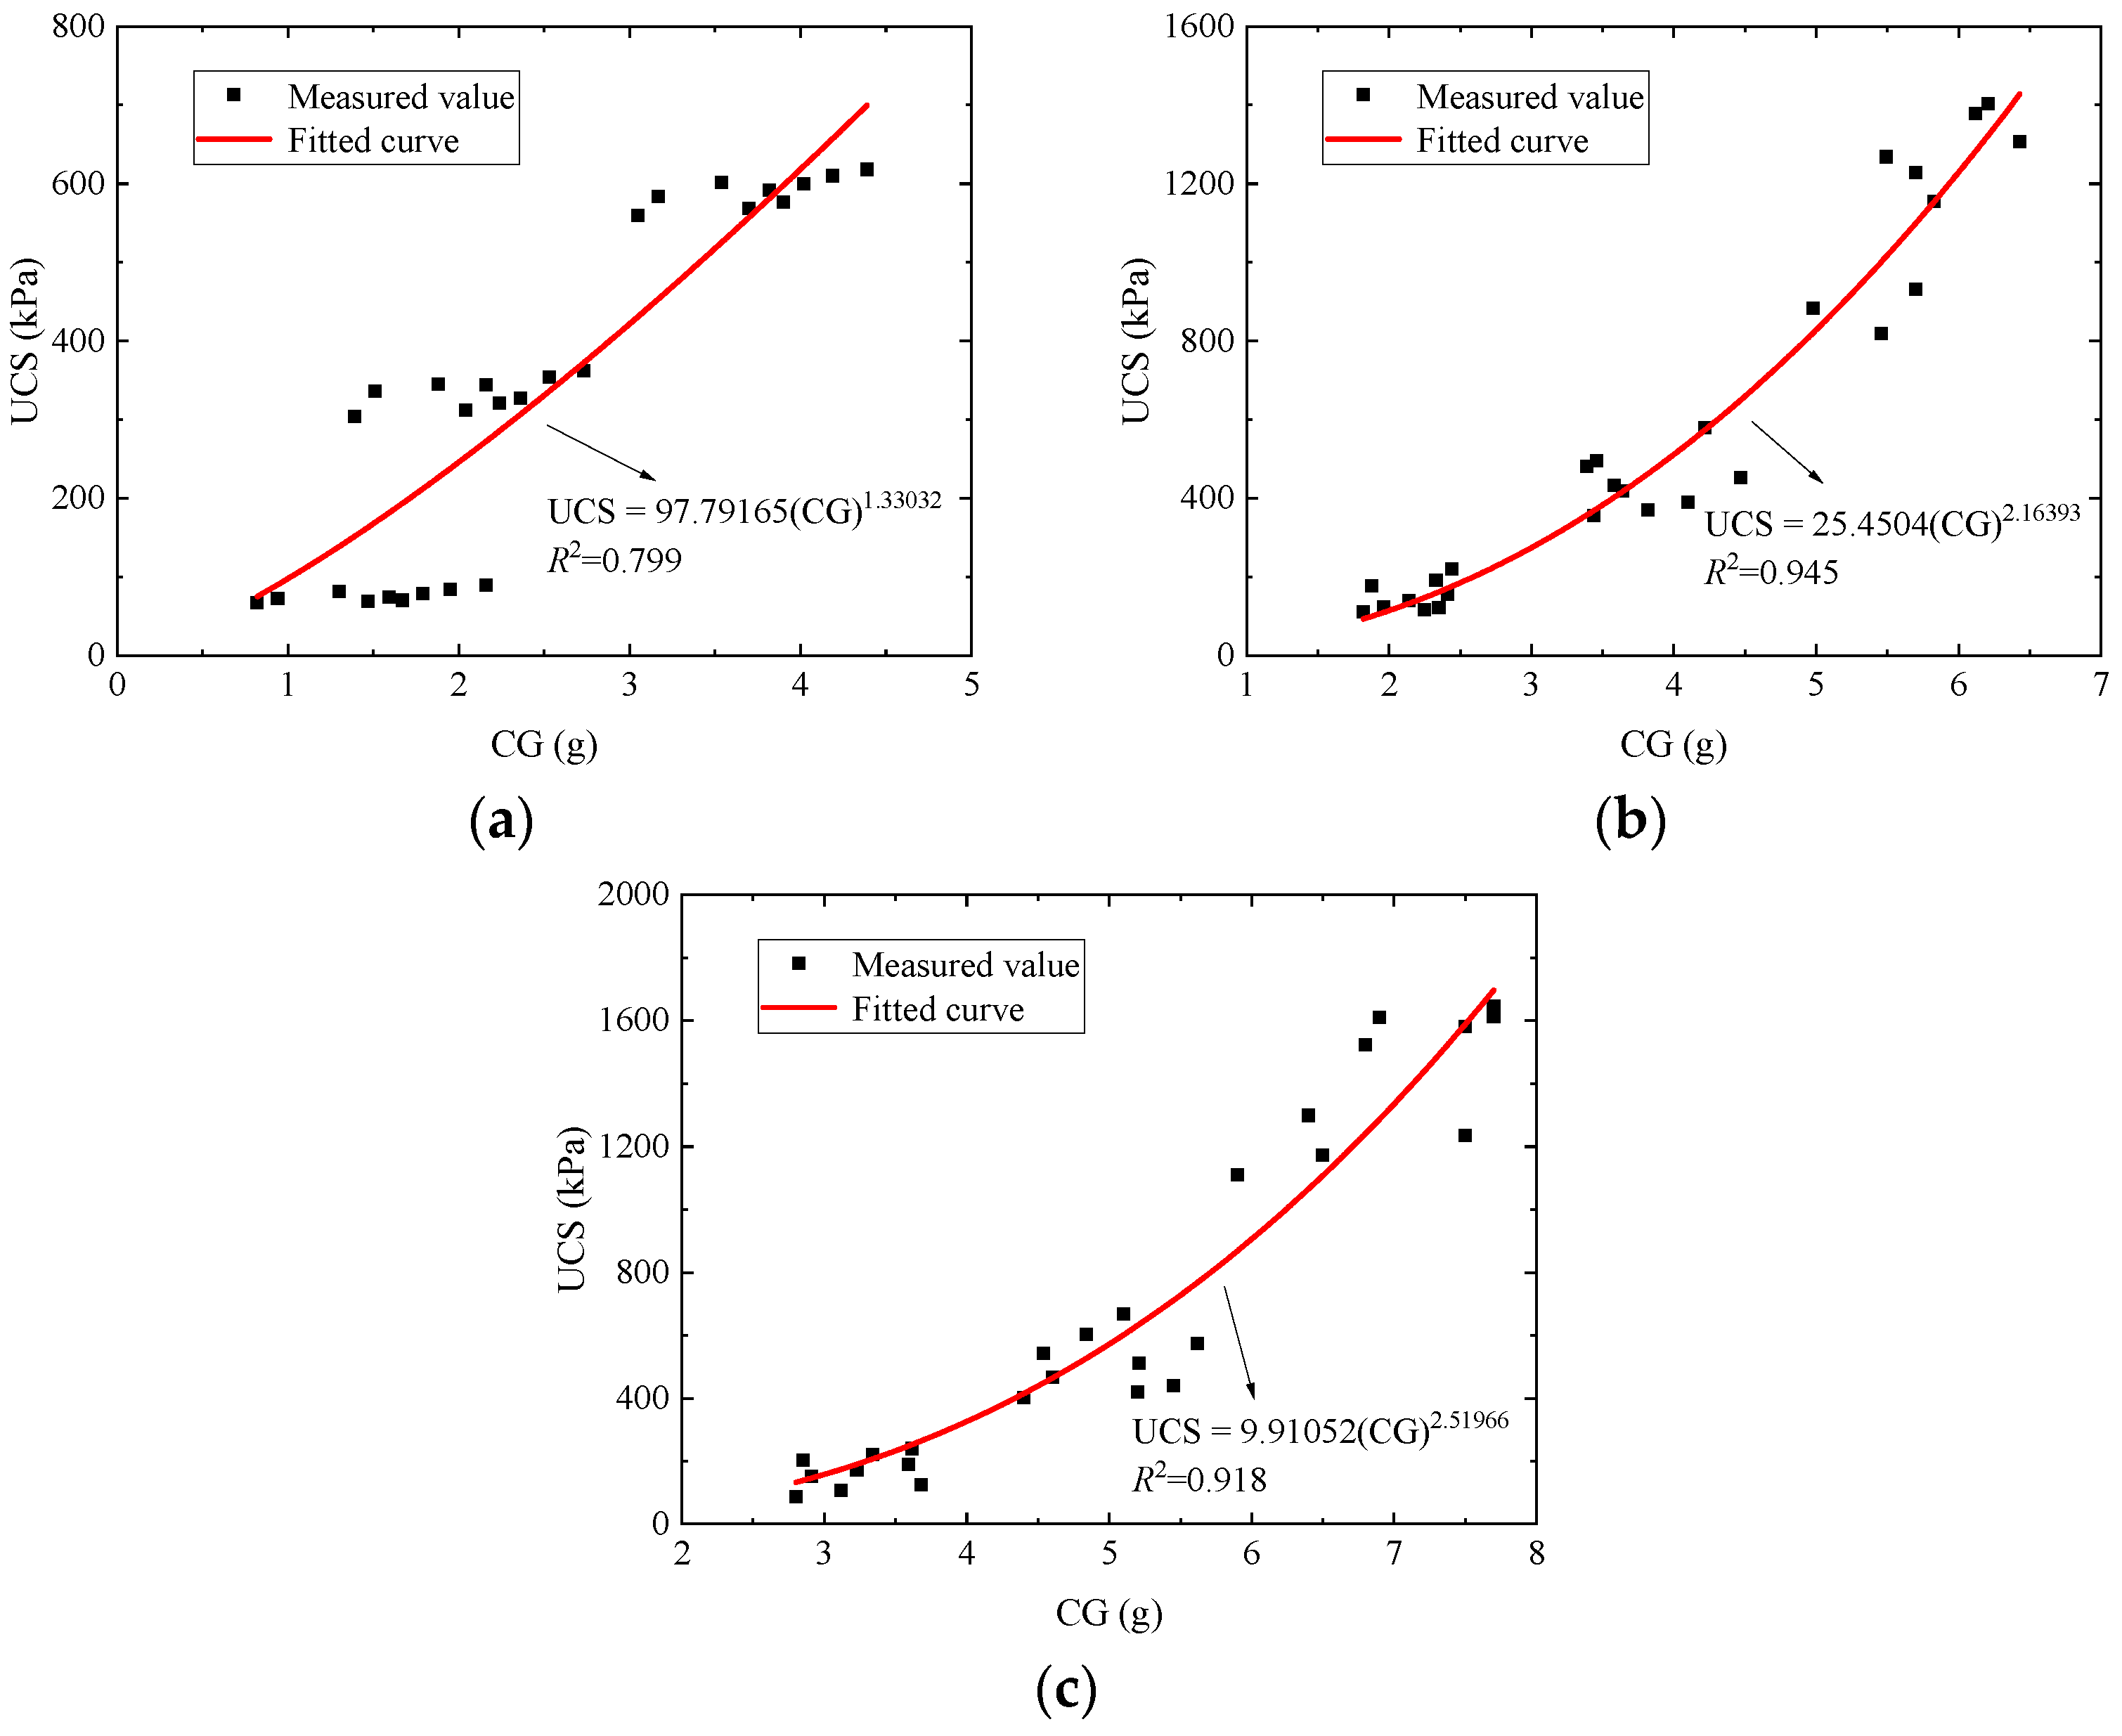
Figure 12 summarizes the curve of the relationship between UCS and CaCO3 generation in solidified sandy soil under different perfusion methods. As shown in the figure, the UCS of the specimen increases as the CaCO3 generation increases, showing a positive correlation. For the two-stage perfusion method, its coefficient of determination reaches 0.918, denoting a good correlation between UCS and CaCO3 generation. Compared with previous studies [30,31,32], the UCS increases with the increase in CaCO3 generation. This is mainly because the CaCO3 crystals generated by EICP fill pores, cement sand particles, and increase the cohesive force and friction between sand particles, cementing the loose particles of sand to form a whole to bear any external load and improve the overall compressive strength. As a result, the CaCO3 generation has a significant positive correlation with the UCS of the sample.

Figure 12.
Curve of relationship between UCS and CaCO3 generation: (a) mixed perfusion, (b) stepwise perfusion, and (c) two-stage perfusion methods.
4. Conclusions
For the EICP-solidified standard sand sample, we analyze the impact of the initial dry density, cementation number, standing time, perfusion method, and other factors on the permeability and strength characteristics of solidified sandy soil by conducting permeability and unconfined compression tests, and we establish the quantitative relationship between the permeability coefficient, unconfined compressive strength (UCS), and CaCO3 generation. The following are the primary conclusions:
- (1)
- The permeability coefficient of the solidified sandy soil decreases but the UCS presents an increasing trend by increasing the initial dry density and cementation number.
- (2)
- The permeability coefficient of the solidified sandy soil shows a gradually decreasing trend but the UCS presents an increasing trend by increasing the standing time.
- (3)
- When the two-stage perfusion method is applied, the initial dry density is 1.65 g/cm3, the cementation number is 6, and the standing time is 5 days, the permeability coefficient of the solidified sandy soil is 6.25 × 10⁻⁴ cm/s and the UCS reaches 1646.94 kPa, which constitute the optimal condition for the EICP-solidified standard sand.
- (4)
- The permeability coefficient of the sample decreases with the CaCO3 generation, showing a negative correlation; the UCS increases by increasing the CaCO3 generation, showing a positive correlation.
- (5)
- Combined with practical engineering, EICP technology could be used to repair earth–rock dams, playing a role in anti-seepage and reinforcement. More research may be needed for practical engineering applications, and subsequent research will be more closely aligned with actual engineering based on this foundation.
Author Contributions
Conceptualization, J.L. and G.L.; methodology, J.L. and P.W.; validation, J.Z. and C.L.; writing—original draft preparation, L.Y. and G.L.; writing—review and editing, L.Y. and G.L.; funding acquisition, G.L. All authors have read and agreed to the published version of the manuscript.
Funding
This study was supported by the Natural Science Basic Research Program of Shaanxi Province (2021JM-535) and the Scientific Research Program Funded by the Education Department of Shaanxi Provincial Government (23JS061).
Institutional Review Board Statement
Not applicable.
Informed Consent Statement
Not applicable.
Data Availability Statement
All data generated or analyzed during this study are included in this published article.
Conflicts of Interest
Author Pengzhou Wang is employed by the China Construction Fourth Engineering Division Corp., Ltd. The remaining authors declare that the research was conducted in the absence of any commercial or financial relationships that could be construed as a potential conflict of interest.
References
- Nemati, M.; Voordouw, G. Modification of porous media permeability, using calcium carbonate produced enzymatically in situ. Enzyme Microb. Technol. 2003, 33, 635–642. [Google Scholar] [CrossRef]
- Yasuhara, H.; Neupane, D.; Hayashi, K.; Okamura, M. Experiments and predictions of physical properties of sand cemented by enzymatically induced carbonate precipitation. Soils Found. 2012, 52, 539–549. [Google Scholar] [CrossRef]
- Arab, M.G.; Alsodi, R.; Almajed, A.; Yasuhara, H.; Zeiada, W.; Shahin, M.A. State-of-the-art review of enzyme-induced calcite precipitation (EICP) for ground improvement: Applications and prospects. Geosciences 2021, 11, 492. [Google Scholar] [CrossRef]
- Sharma, M.; Satyam, N.; Reddy, K.R. State of the art review of emerging and biogeotechnical methods for liquefaction mitigation in sands. J. Hazard. Toxic Radioact. Waste 2021, 25, 03120002. [Google Scholar] [CrossRef]
- Hu, W.; Cheng, W.C.; Wen, S.; Yuan, K. Revealing the enhancement and degradation mechanisms affecting the performance of carbonate precipitation in EICP process. Front. Bioeng. Biotech. 2021, 9, 750258. [Google Scholar] [CrossRef] [PubMed]
- Bruce, D.A.; Grouting Committee of the Geo-Institute. Glossary of grouting terminology. J. Geotech. Geoenviron. Eng. 2005, 131, 1534–1542. [Google Scholar] [CrossRef]
- Luo, H.; Zhao, T.; Dong, M.; Gao, J.; Peng, X.; Guo, Y.; Wang, Z.; Liang, C. Field studies on the effects of three geotextiles on runoff and erosion of road slope in Beijing. Catena 2013, 109, 150–156. [Google Scholar] [CrossRef]
- Álvarez-Mozos, J.; Abad, E.; Giménez, R.; Campo, M.A.; Goñi, M.; Arive, M.; Casalí, J.; Díez, J.; Diego, I. Evaluation of erosion control geotextiles on steep slopes. Part 1: Effects on runoff and soil loss. Catena 2014, 118, 168–178. [Google Scholar] [CrossRef]
- Gao, Y.; He, J.; Tang, X.; Chu, J. Calcium carbonate precipitation catalyzed by soybean urease as an improvement method for fine-grained soil. Soils Found. 2019, 59, 1631–1637. [Google Scholar] [CrossRef]
- Hoang, T.; Alleman, J.; Cetin, B.; Choi, S.G. Engineering properties of biocementation coarse-and fine-grained sand catalyzed by bacterial cells and bacterial enzyme. J. Mater. Civ. Eng. 2020, 32, 04020030. [Google Scholar] [CrossRef]
- Wang, H.X.; Miao, L.C.; Sun, X.H.; Wu, L.Y.; Fan, G.C. Experimental study on sand solidification and optimization of EICP in different temperature environments. J. Southeast Univ. Nat. Sci. Ed. 2022, 52, 712–719. [Google Scholar]
- Tian, W.; Li, T.; Jia, N.; He, L.; Zhang, X.K.; Zhang, X.D. Properties of subgrade loess solidified by calcium lignosulfonate-EICP solution. Mater. Rep. 2022, 36, 78–85. [Google Scholar]
- Yuan, H.; Ren, G.; Liu, K.; Zheng, W.; Zhao, Z. Experimental Study of EICP Combined with Organic Materials for Silt Improvement in the Yellow River Flood Area. Appl. Sci. 2020, 10, 7678. [Google Scholar] [CrossRef]
- Iamchaturapatr, J.; Piriyakul, K.; Petcherdchoo, A. Characteristics of sandy soil treated using EICP-based urease enzymatic acceleration method and natural hemp fibers. Case Stud. Constr. Mater. 2022, 16, e00871. [Google Scholar] [CrossRef]
- Cui, M.J.; Lai, H.J.; Hoang, T.; Chu, J. One-phase-low-pH enzyme induced carbonate precipitation (EICP) method for soil improvement. Acta Geotech. 2021, 16, 481–489. [Google Scholar] [CrossRef]
- Meng, H.; Shu, S.; Gao, Y.F.; Yan, B.Y.; He, J. Multiple-phase enzyme-induced carbonate precipitation (EICP) method for soil improvement. Eng. Geol. 2021, 294, 106374. [Google Scholar] [CrossRef]
- Zhang, Q.; Ye, W.M.; Liu, Z.R.; Wang, Q.; Chen, Y.G. Influence of injection methods on calcareous sand cementation by EICP technique. Constr. Build. Mater. 2023, 363, 129724. [Google Scholar] [CrossRef]
- Alotaibi, E.; Arab, M.G.; Abdallah, M.; Nassif, N.; Omar, M. Life cycle assessment of biocemented sands using enzyme induced carbonate precipitation (EICP) for soil stabilization applications. Sci. Rep. 2022, 12, 6032. [Google Scholar] [CrossRef] [PubMed]
- van Paassen, L.A.; Ghose, R.; van der Linden, T.J.; van der Star, W.R.; van Loosdrecht, M.C. Quantifying biomediated ground improvement by ureolysis: Large-scale biogrout experiment. J. Geotech. Geoenviron. Eng. 2010, 136, 1721–1728. [Google Scholar] [CrossRef]
- GB/T 17671-1999; Method of Testing Cements-Determination of Strength. National Bureau of Quality and Technical Supervision: Beijing, China, 1999.
- GB/T 50123-2019; Standard for Geotechnical Testing Method. Construction Ministry of PRC: Beijing, China, 2019.
- Cheng, L.; Cord-Ruwisch, R. In situ soil cementation with ureolytic bacteria by surface percolation. Ecol. Eng. 2012, 42, 64–72. [Google Scholar] [CrossRef]
- Tobler, J.D.; Maclachlan, E.; Phoenix, R.V. Microbially mediated plugging of porous media and the impact of differing injection strategies. Ecol. Eng. 2012, 42, 270–278. [Google Scholar] [CrossRef]
- Cheng, L.; Shahin, M.A.; Chu, J. Soil bio-cementation using a new one-phase low-pH injection method. Acta Geotech. 2019, 5, 615–626. [Google Scholar] [CrossRef]
- Harkes, M.P.; Van Paassen, A.L.; Booster, J.L.; Whiffin, V.S.; van Loosdrecht, M.C. Fixation and distribution of bacterial activity in sand to induce carbonate precipitation for ground reinforcemen. Ecol. Eng. 2010, 36, 112–117. [Google Scholar] [CrossRef]
- Shan, Z.; Zhang, P.; Kou, H. Mechanical and engineering behavior of MICP-treated coarse siliceous sands. KSCE J. Civ. Eng. 2022, 26, 79–87. [Google Scholar] [CrossRef]
- Li, J.; Zhu, F.Q.; Wu, F.S.; Chen, Y.X.; Richards, J.; Li, T.X.; Li, P.; Shang, D.J.; Yu, J.; Viles, H.; et al. Impact of soil density on biomineralization using EICP and MICP techniques for earthen sites consolidation. J. Environ. Manag. 2024, 363, 121410. [Google Scholar] [CrossRef] [PubMed]
- Shu, S.; Yan, B.Y.; Meng, H.; Bian, X. Comparative study of EICP treatment methods on the mechanical properties of sandy soil. Soils Found. 2022, 62, 101246. [Google Scholar] [CrossRef]
- Arab, M.G.; Rohy, H.; Zeiada, W.; Almajed, A.; Omar, M. One-phase EICP biotreatment of sand exposed to various environmental conditions. J. Mater. Civ. Eng. 2021, 33, 04020489. [Google Scholar] [CrossRef]
- Tian, K.L.; Wang, X.D.; Zhang, S.C.; Zhang, H.L.; Zhang, F.; Yang, A.Q. Effect of reactant injection rate on solidifying aeolian sand via microbially induced calcite precipitation. J. Mater. 2020, 32, 04020291. [Google Scholar] [CrossRef]
- Zhao, Y.; Wang, Q.; Yuan, M.N.; Chen, X.; Xiao, Z.Y.; Hao, X.H.; Zhang, J.; Tang, Q. The effect of MICP on physical and mechanical properties of silt with different fine particle content and pore ratio. Appl. Sci. 2021, 12, 139. [Google Scholar] [CrossRef]
- Wang, L.; Liu, S.H. Mechanism of sand cementation with an efficient method of microbial-induced calcite precipitation. Materials 2021, 14, 5631. [Google Scholar] [CrossRef]
Disclaimer/Publisher’s Note: The statements, opinions and data contained in all publications are solely those of the individual author(s) and contributor(s) and not of MDPI and/or the editor(s). MDPI and/or the editor(s) disclaim responsibility for any injury to people or property resulting from any ideas, methods, instructions or products referred to in the content. |
© 2024 by the authors. Licensee MDPI, Basel, Switzerland. This article is an open access article distributed under the terms and conditions of the Creative Commons Attribution (CC BY) license (https://creativecommons.org/licenses/by/4.0/).

