
Experimental and Numerical Investigation on Stress Concentration Factors of Offshore Steel Tubular Column-to-Steel Beam (STCSB) Connections

Abstract
:1. Introduction
2. Materials and Methods
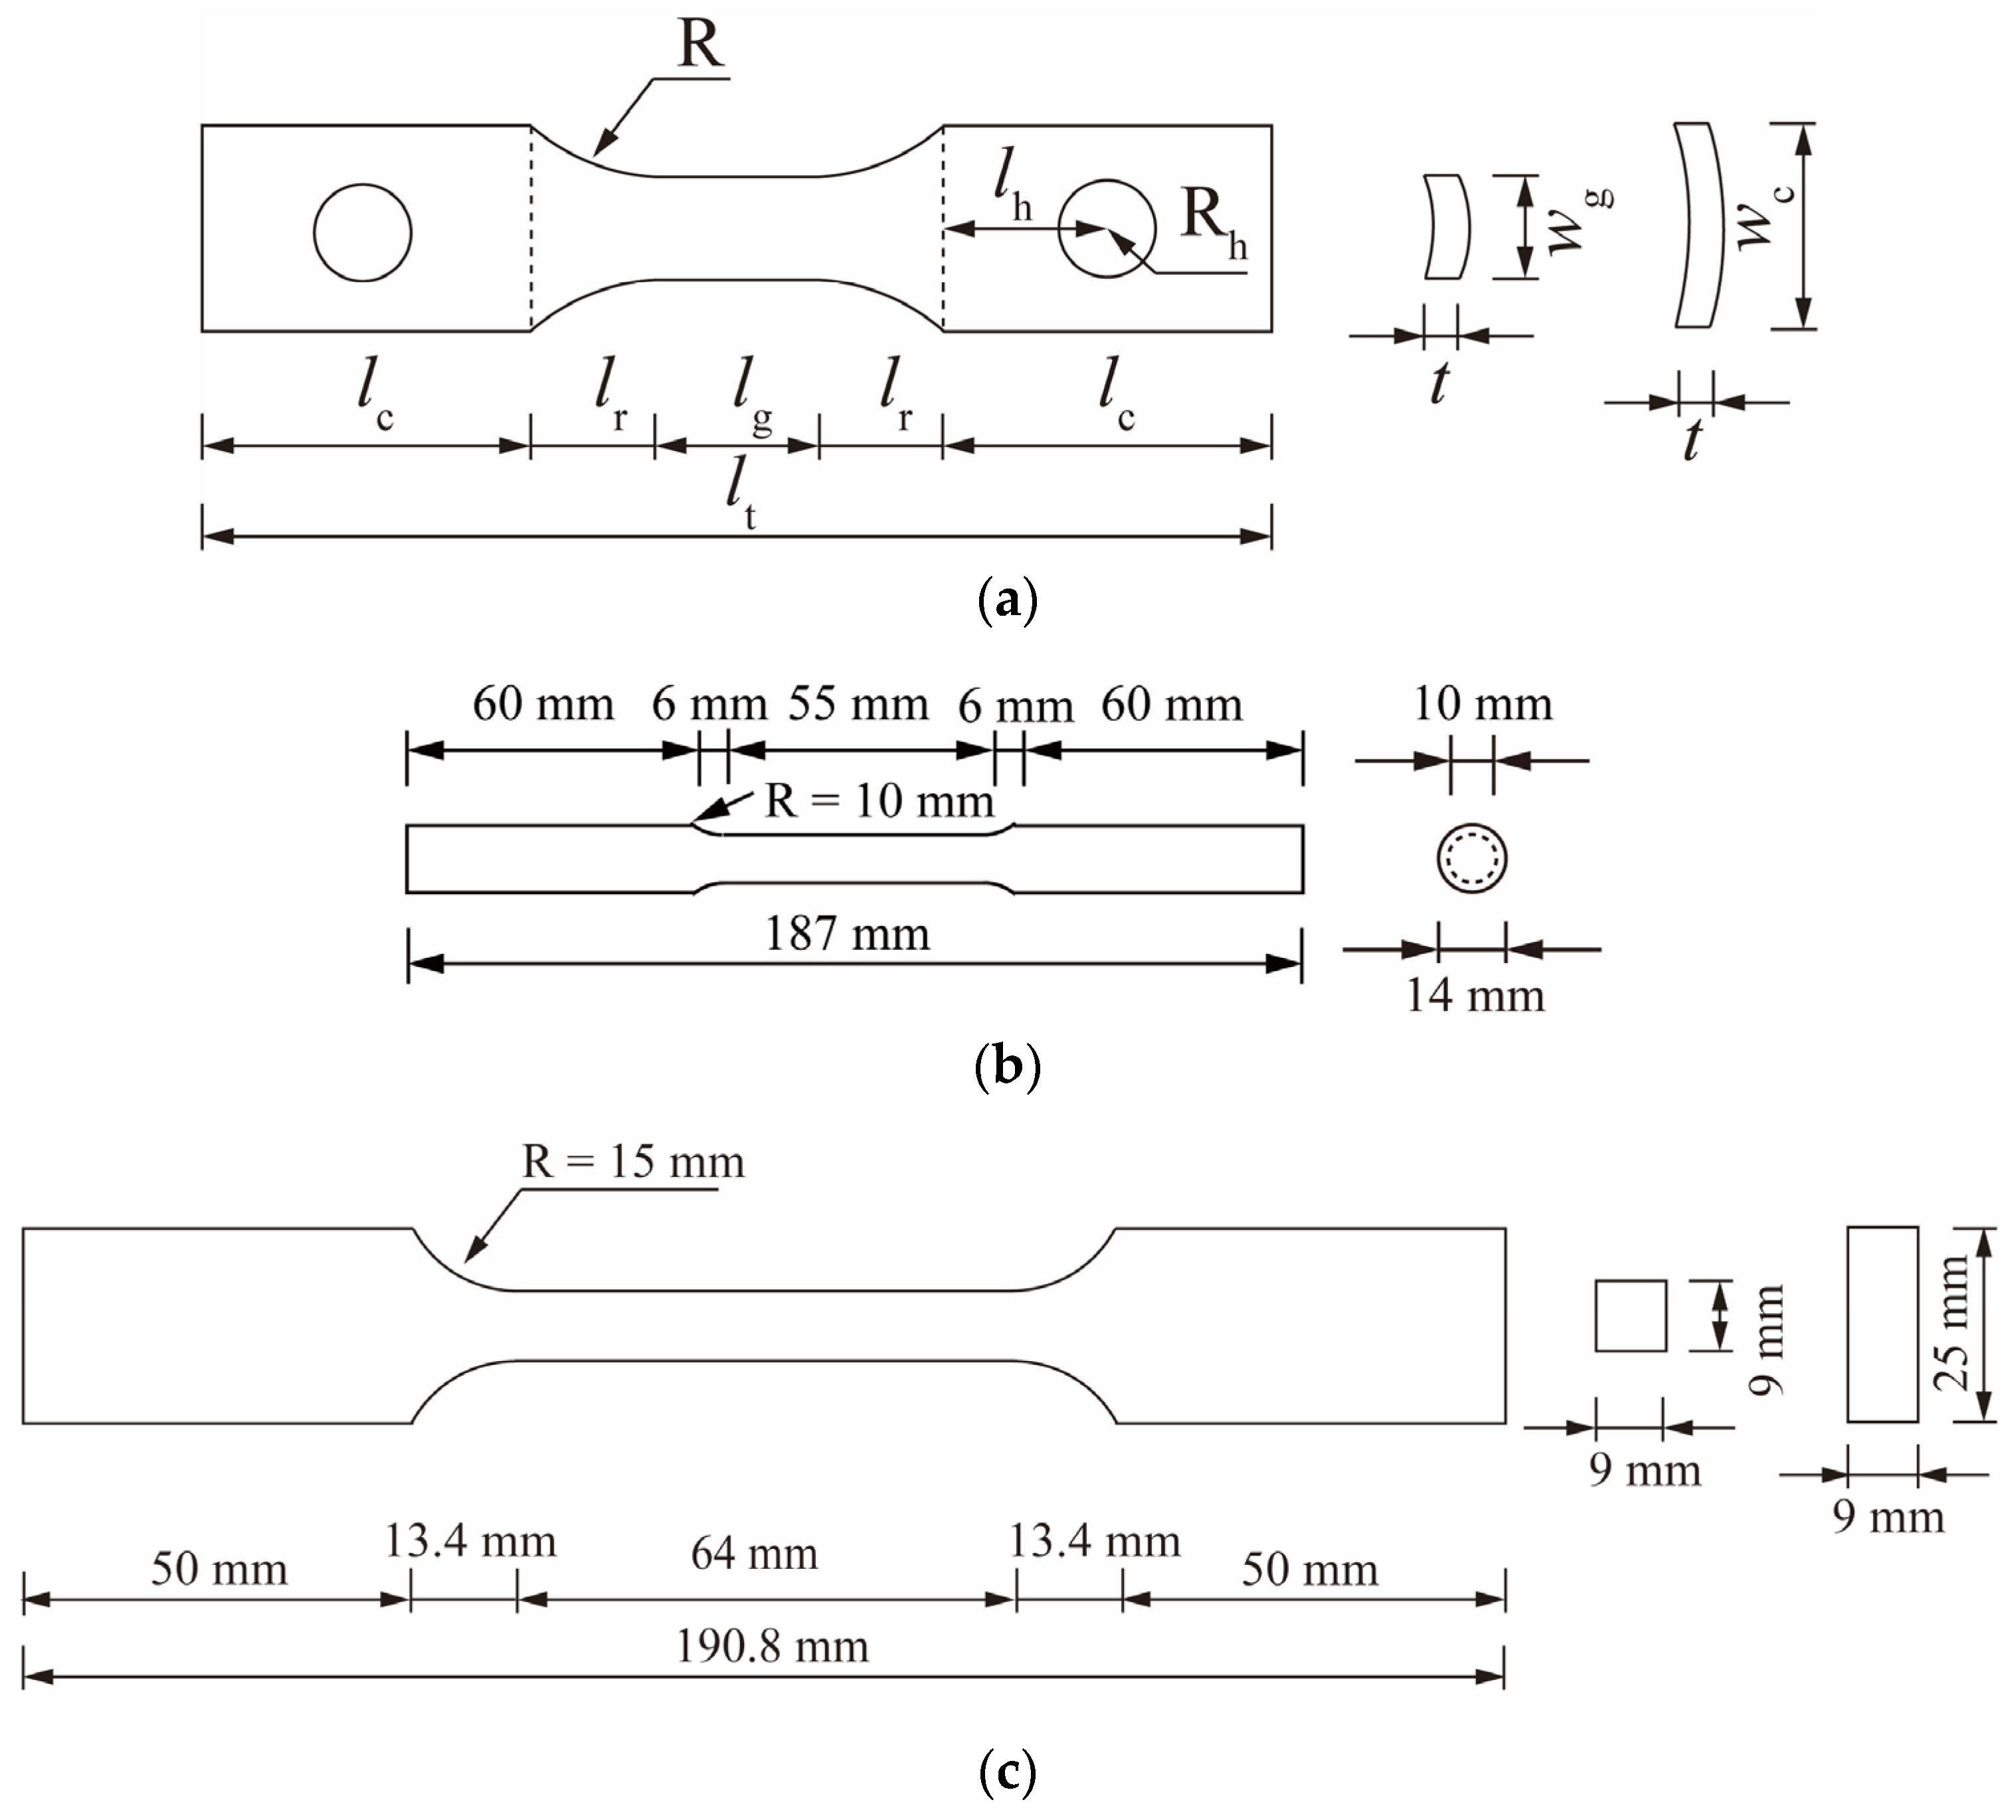
2.1. Specimens
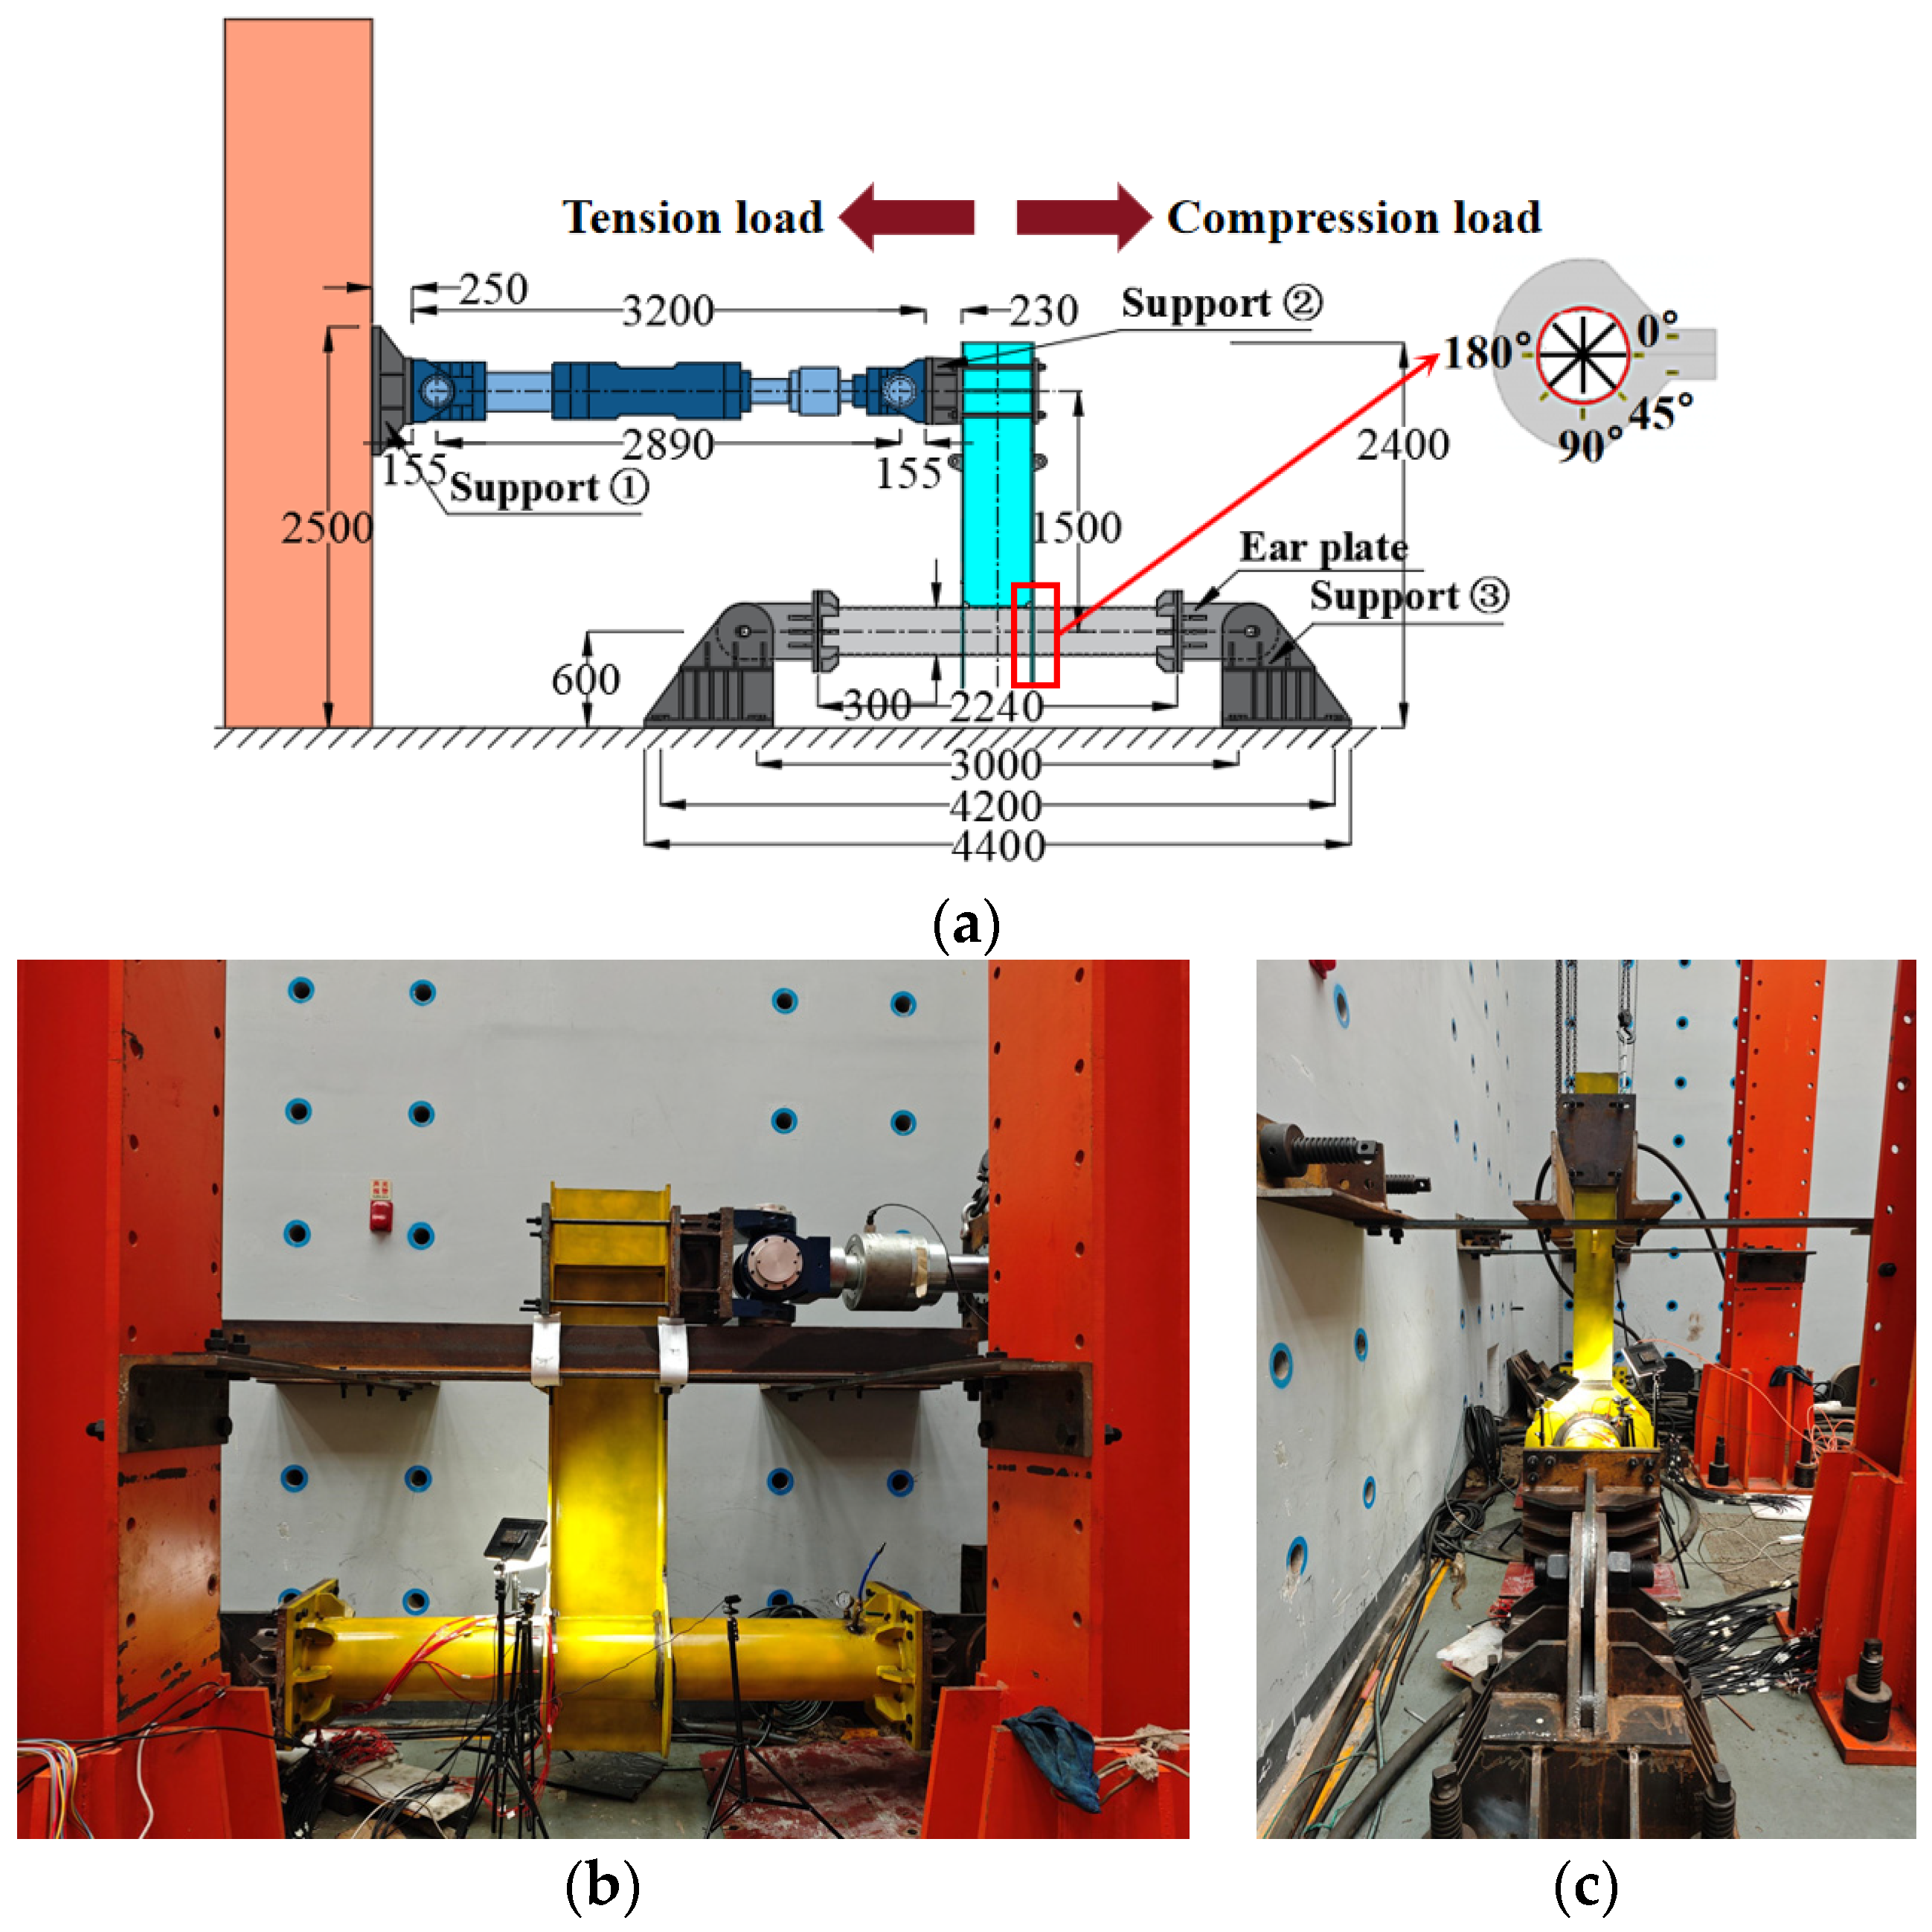
2.2. Test Setup
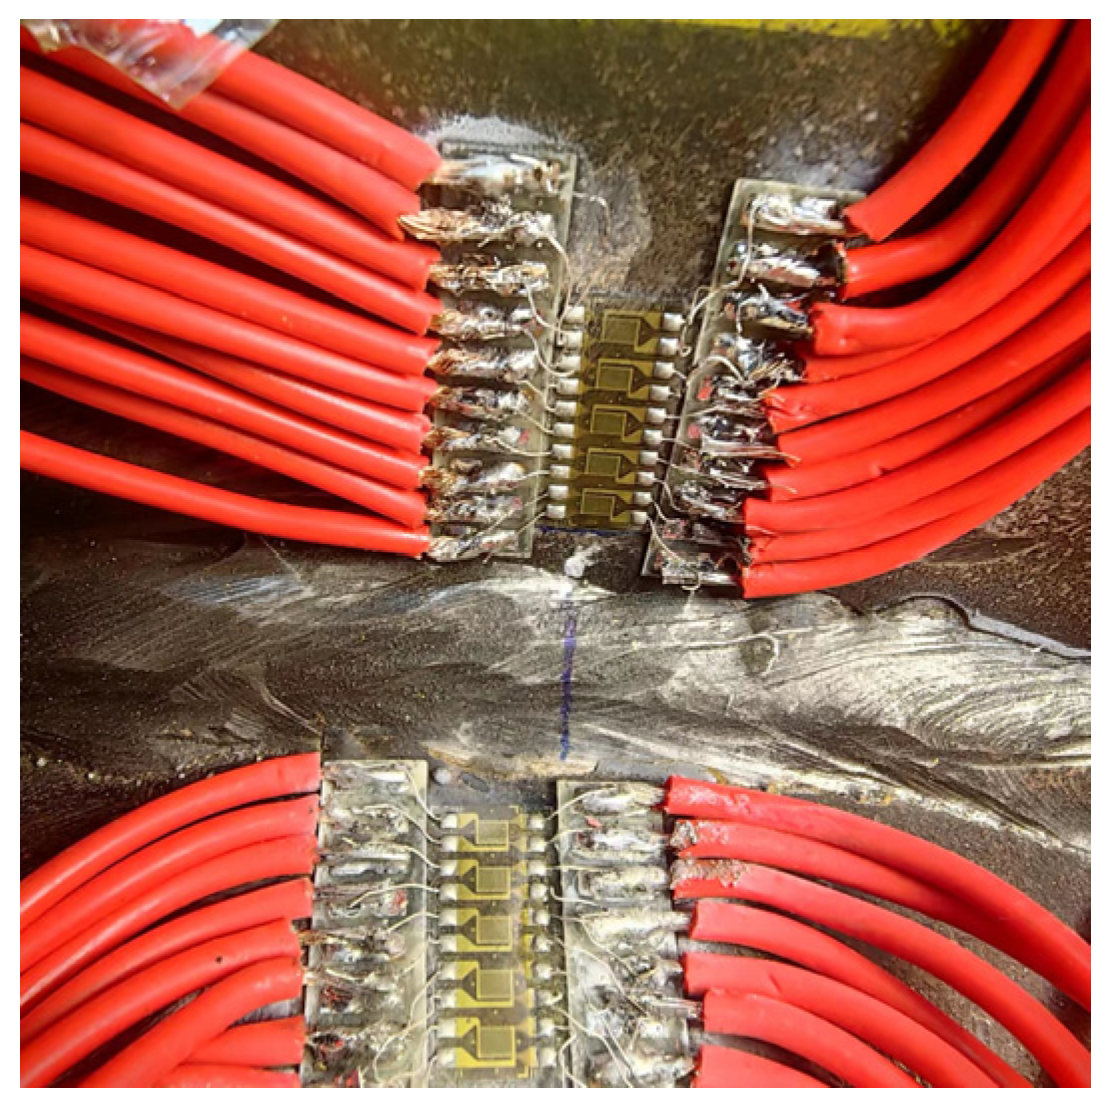
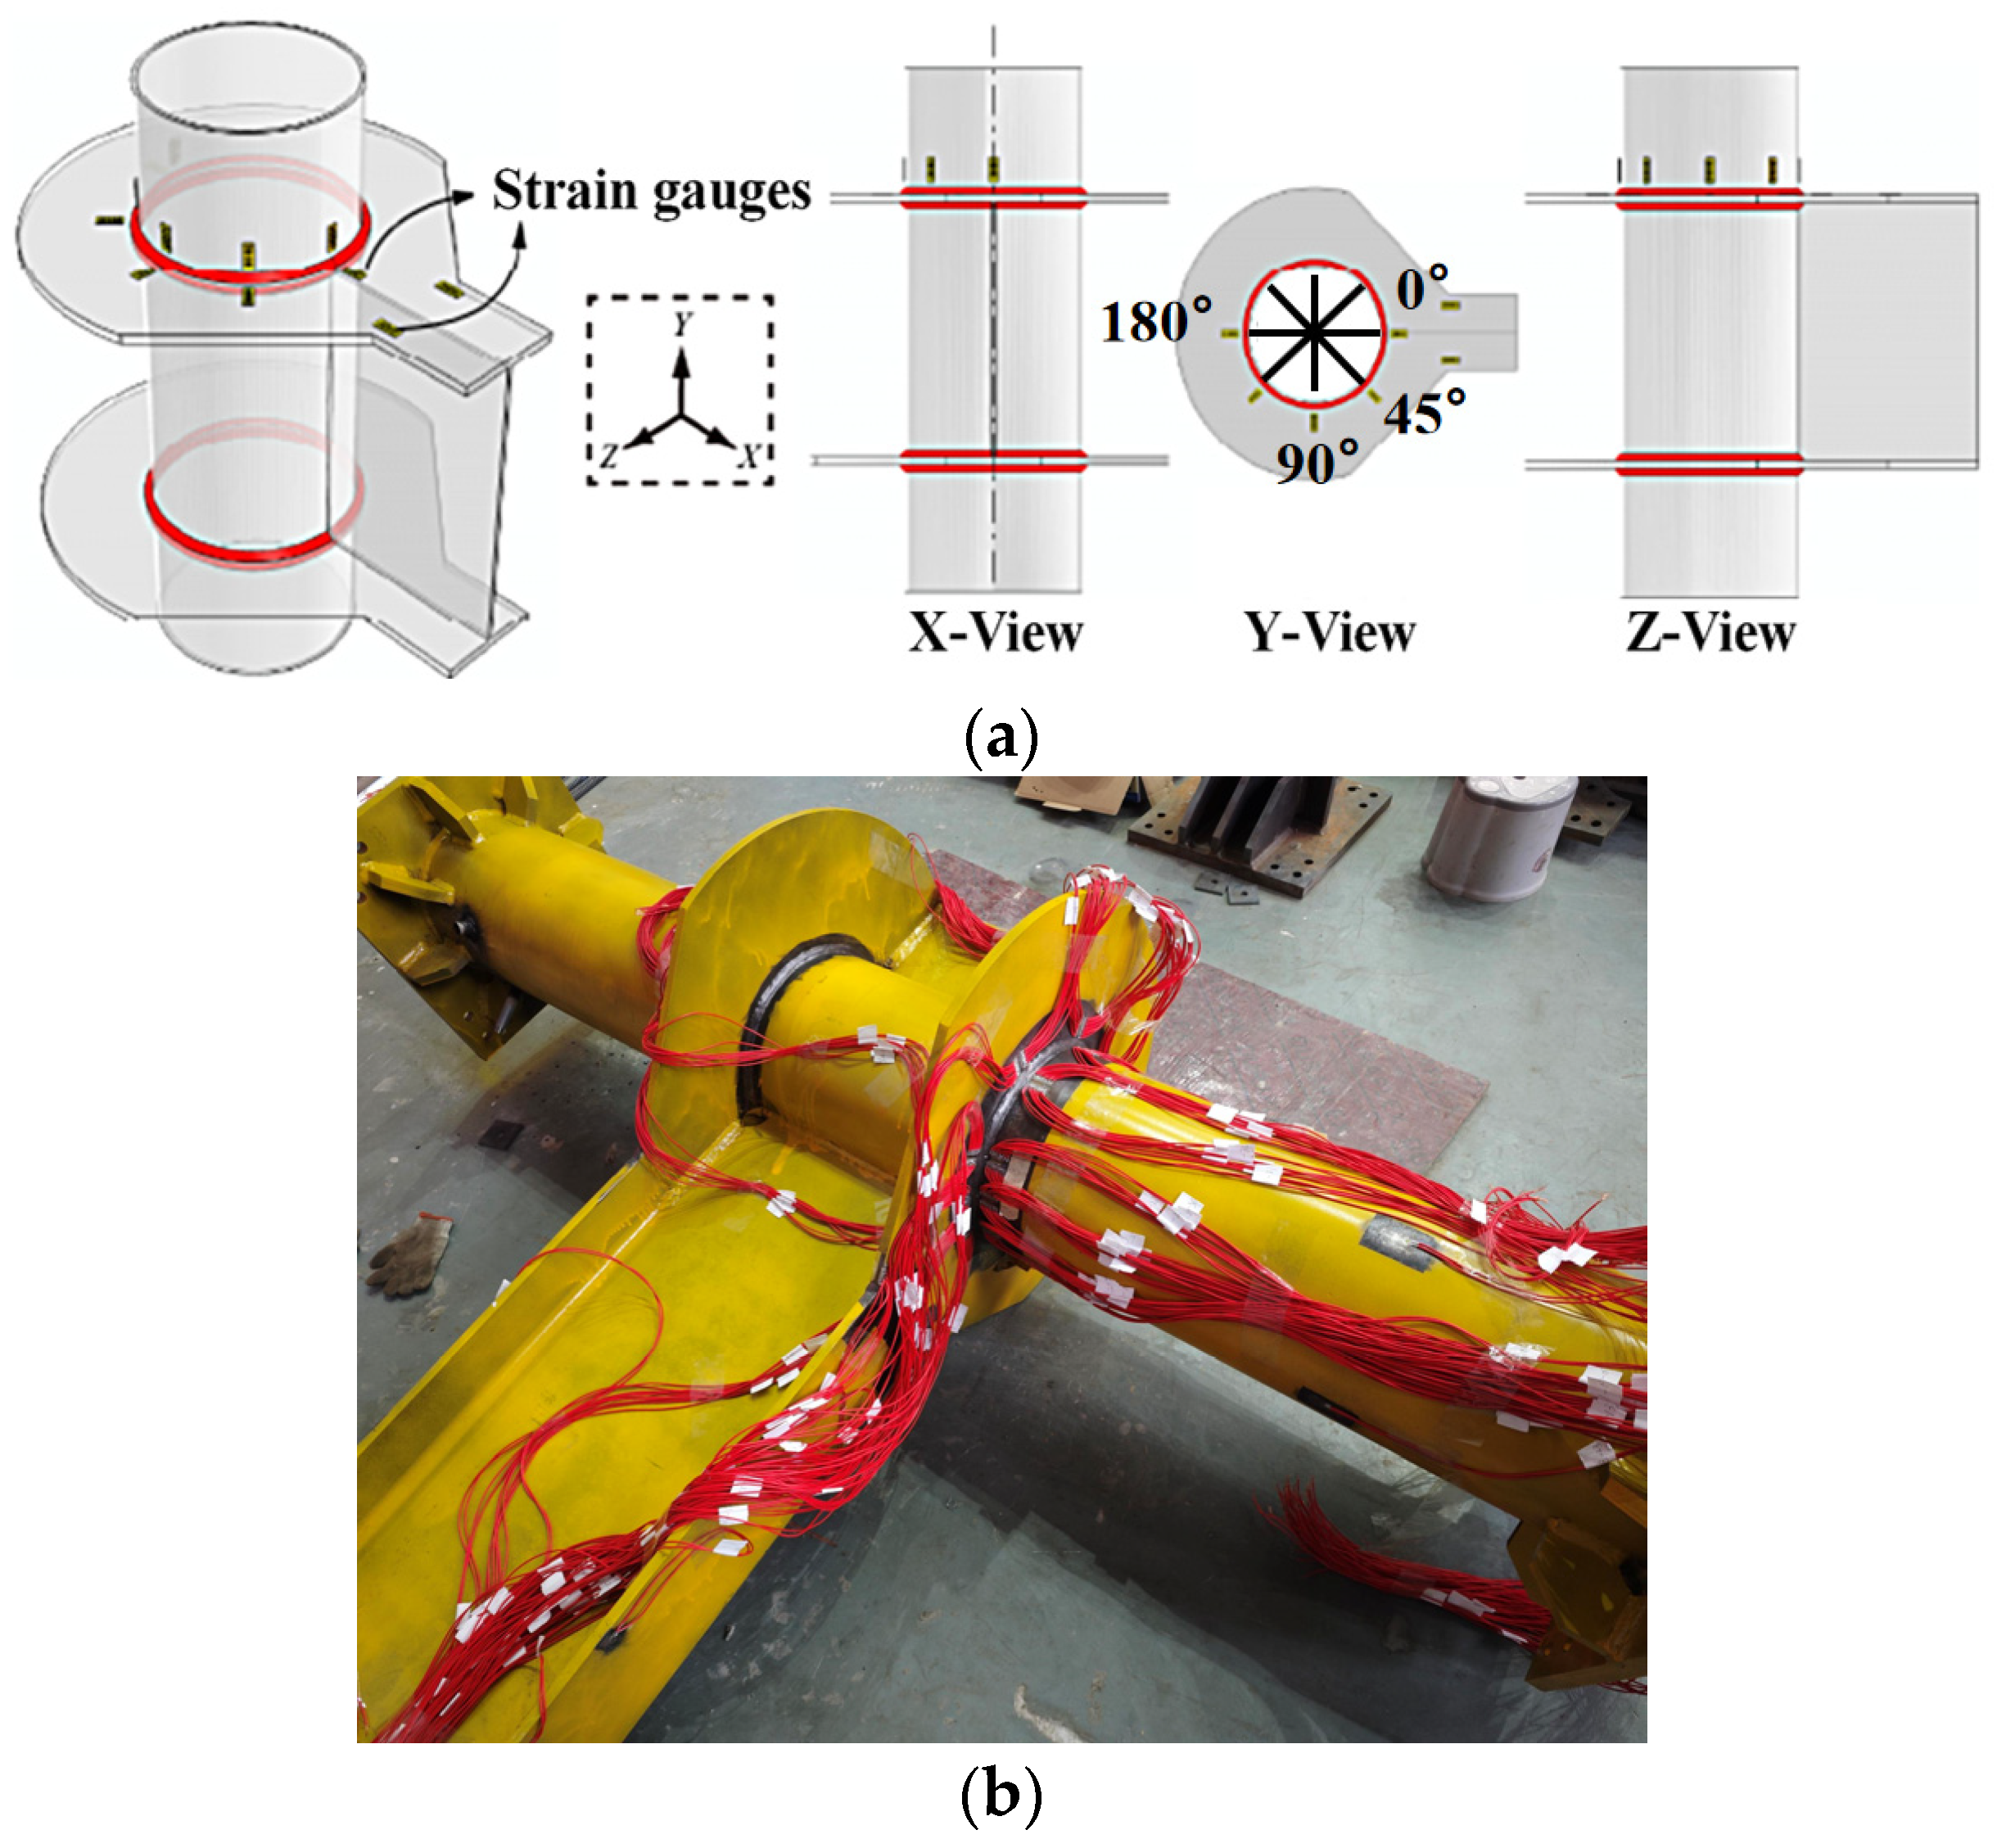
2.3. Measuring and Loading System
3. Test Results and Discussion
4. Finite Element Analysis
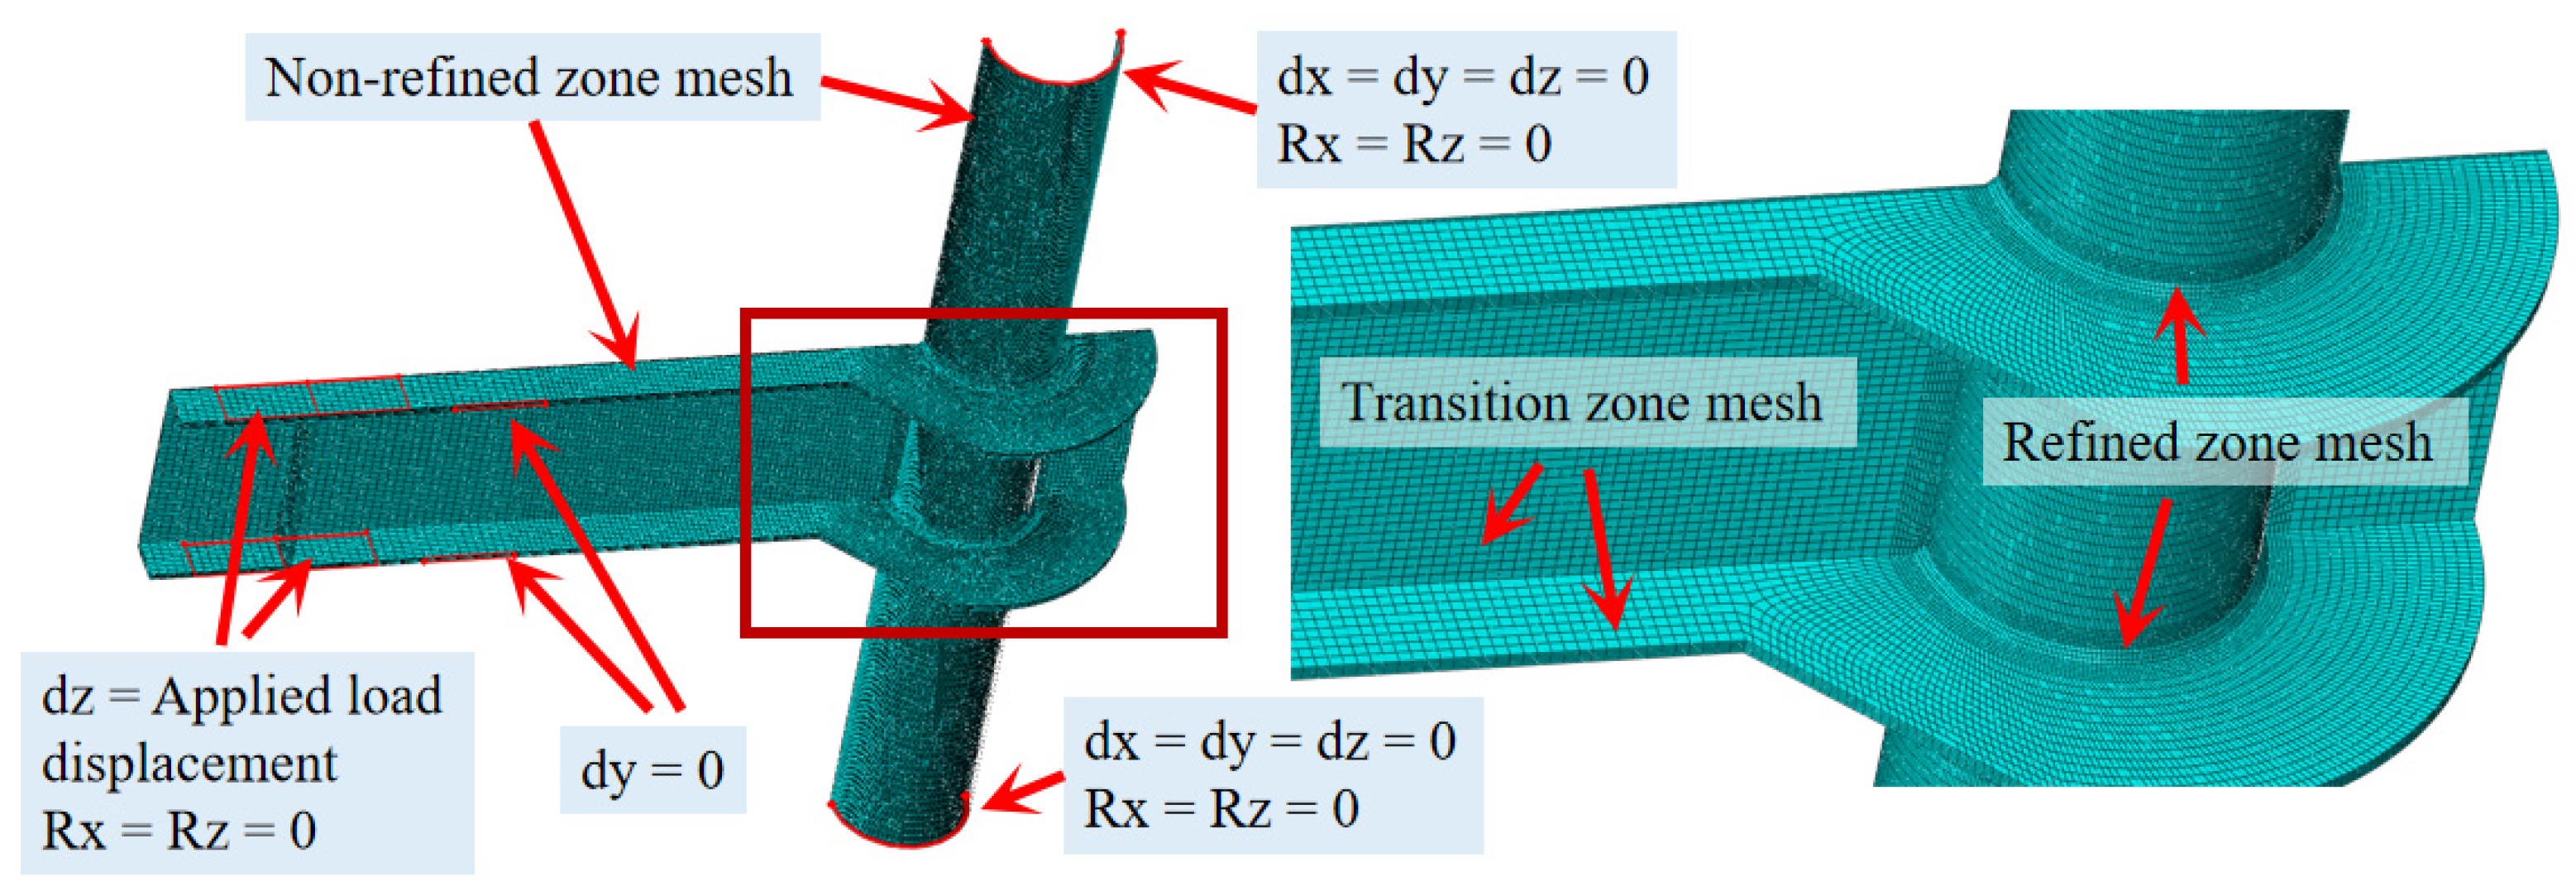
4.1. FE Models
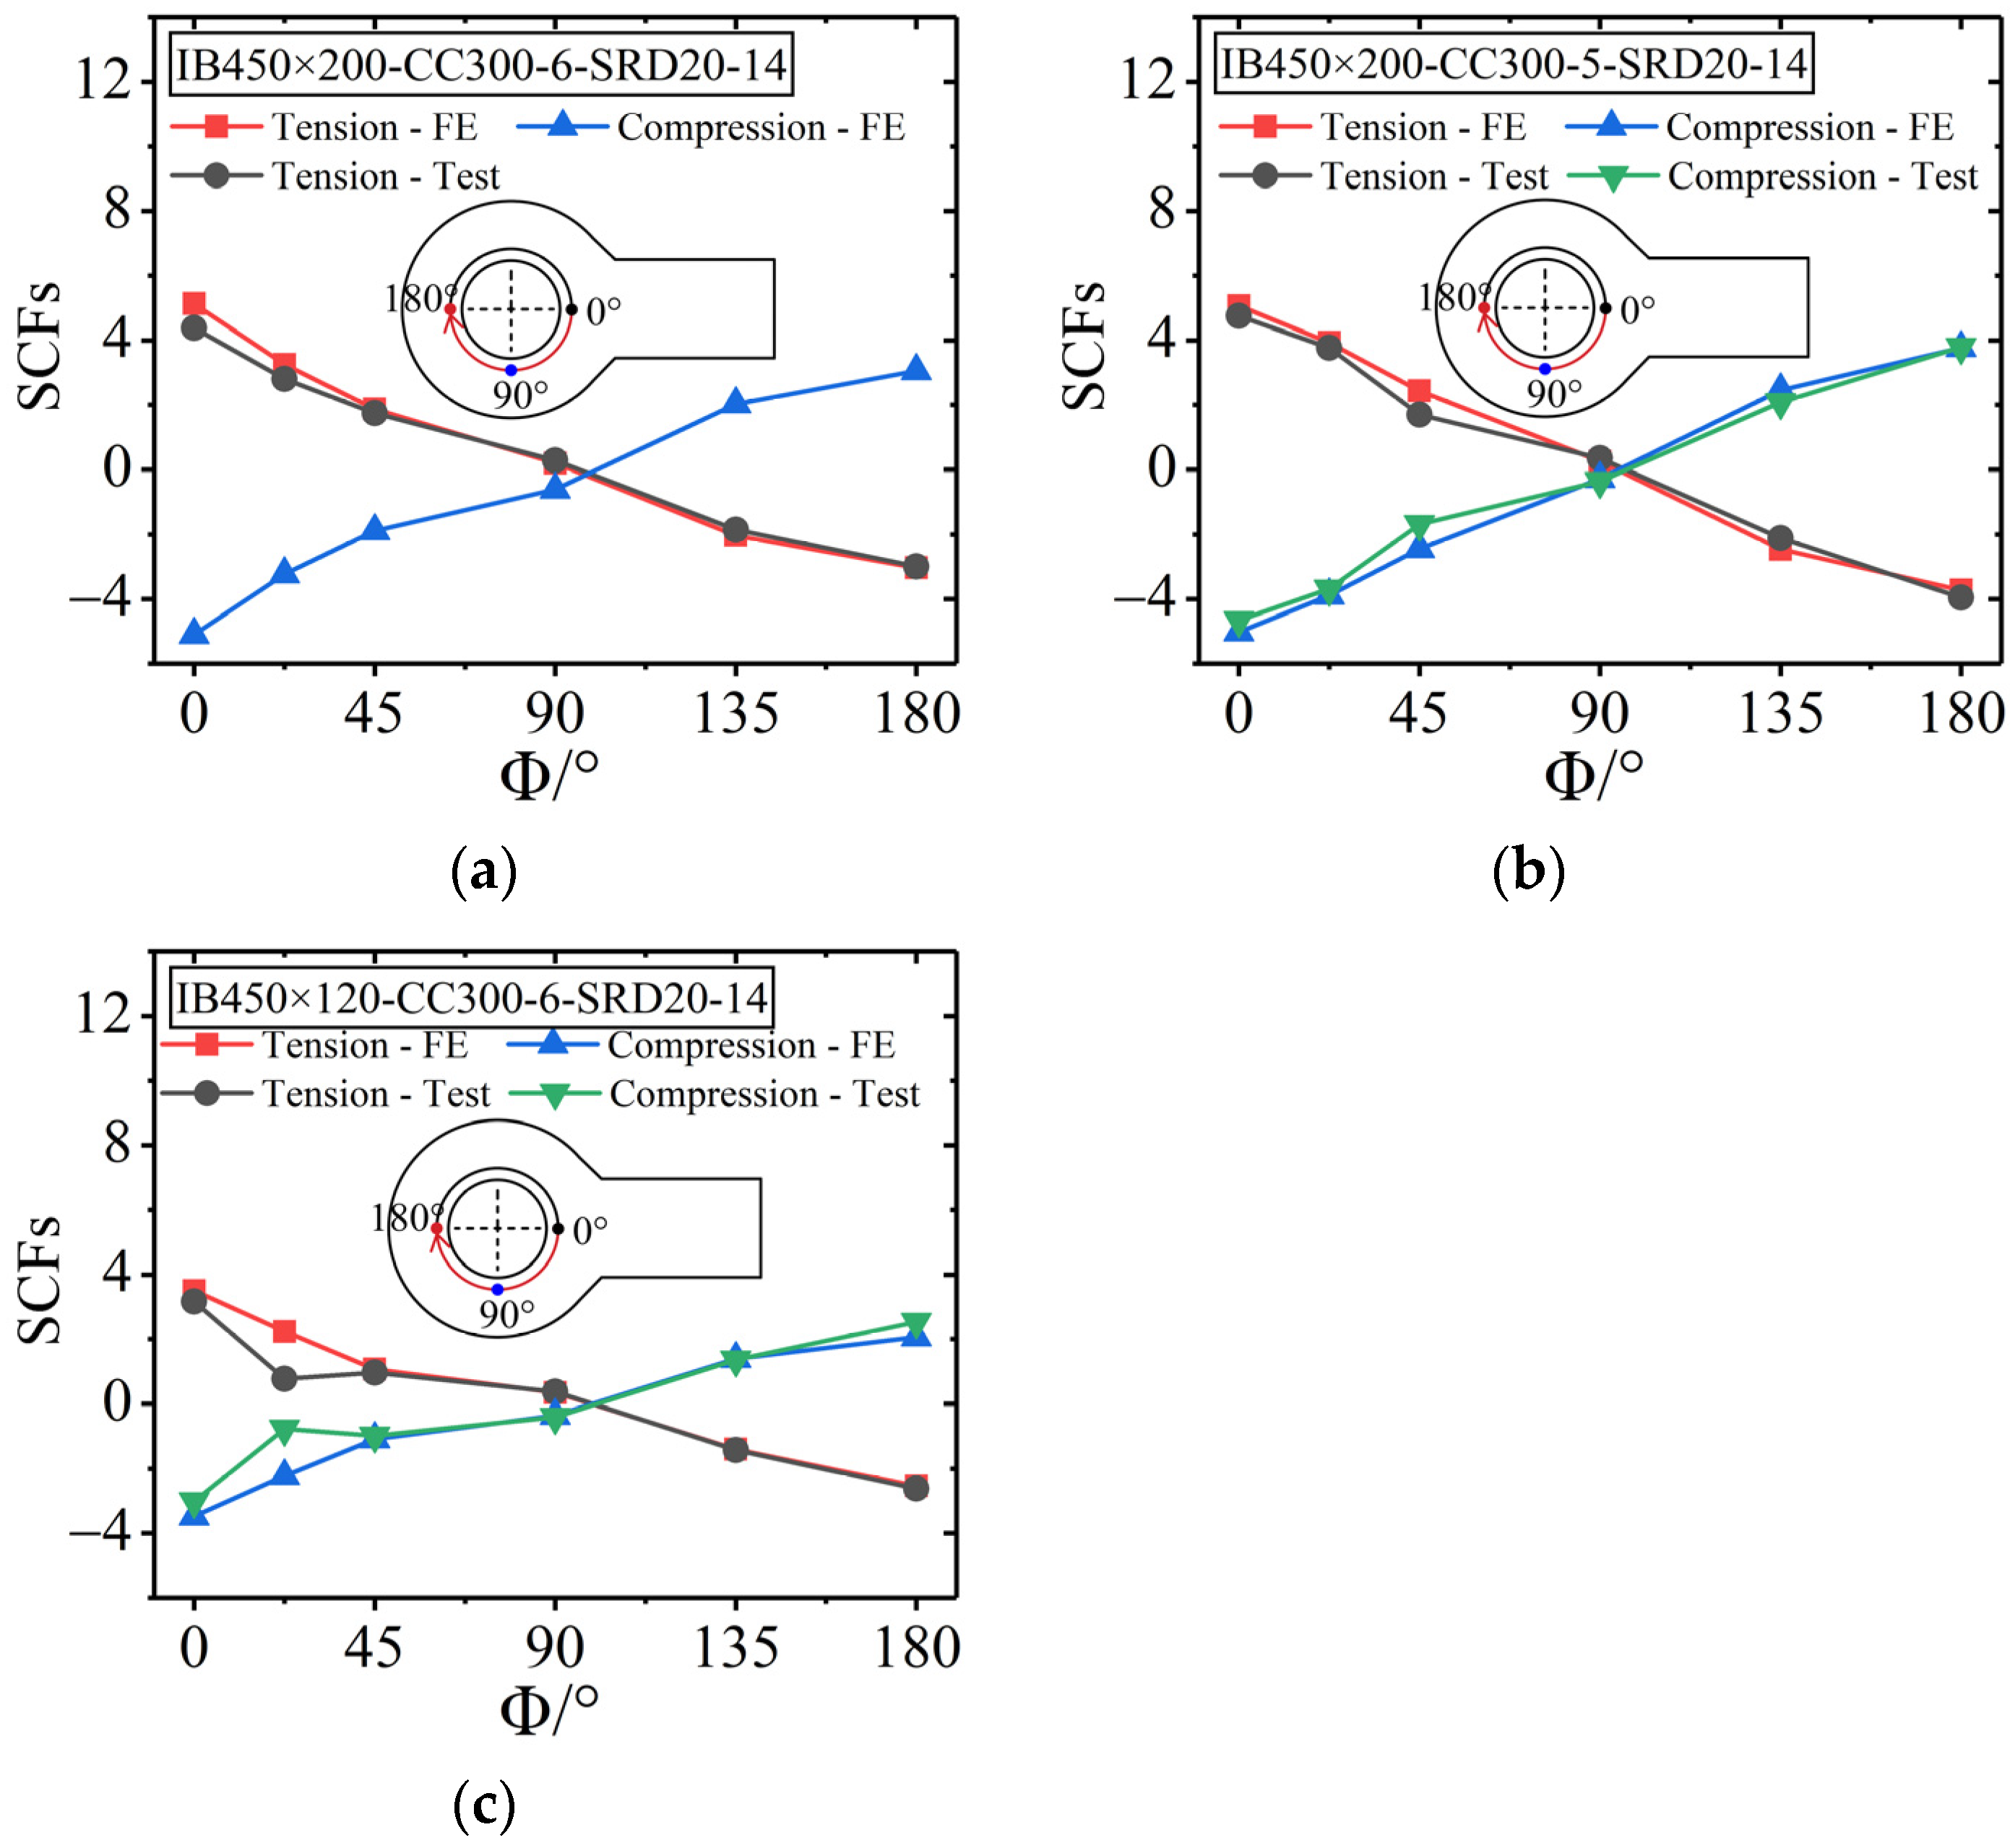
4.2. Validations
5. Parametric Study
5.1. General
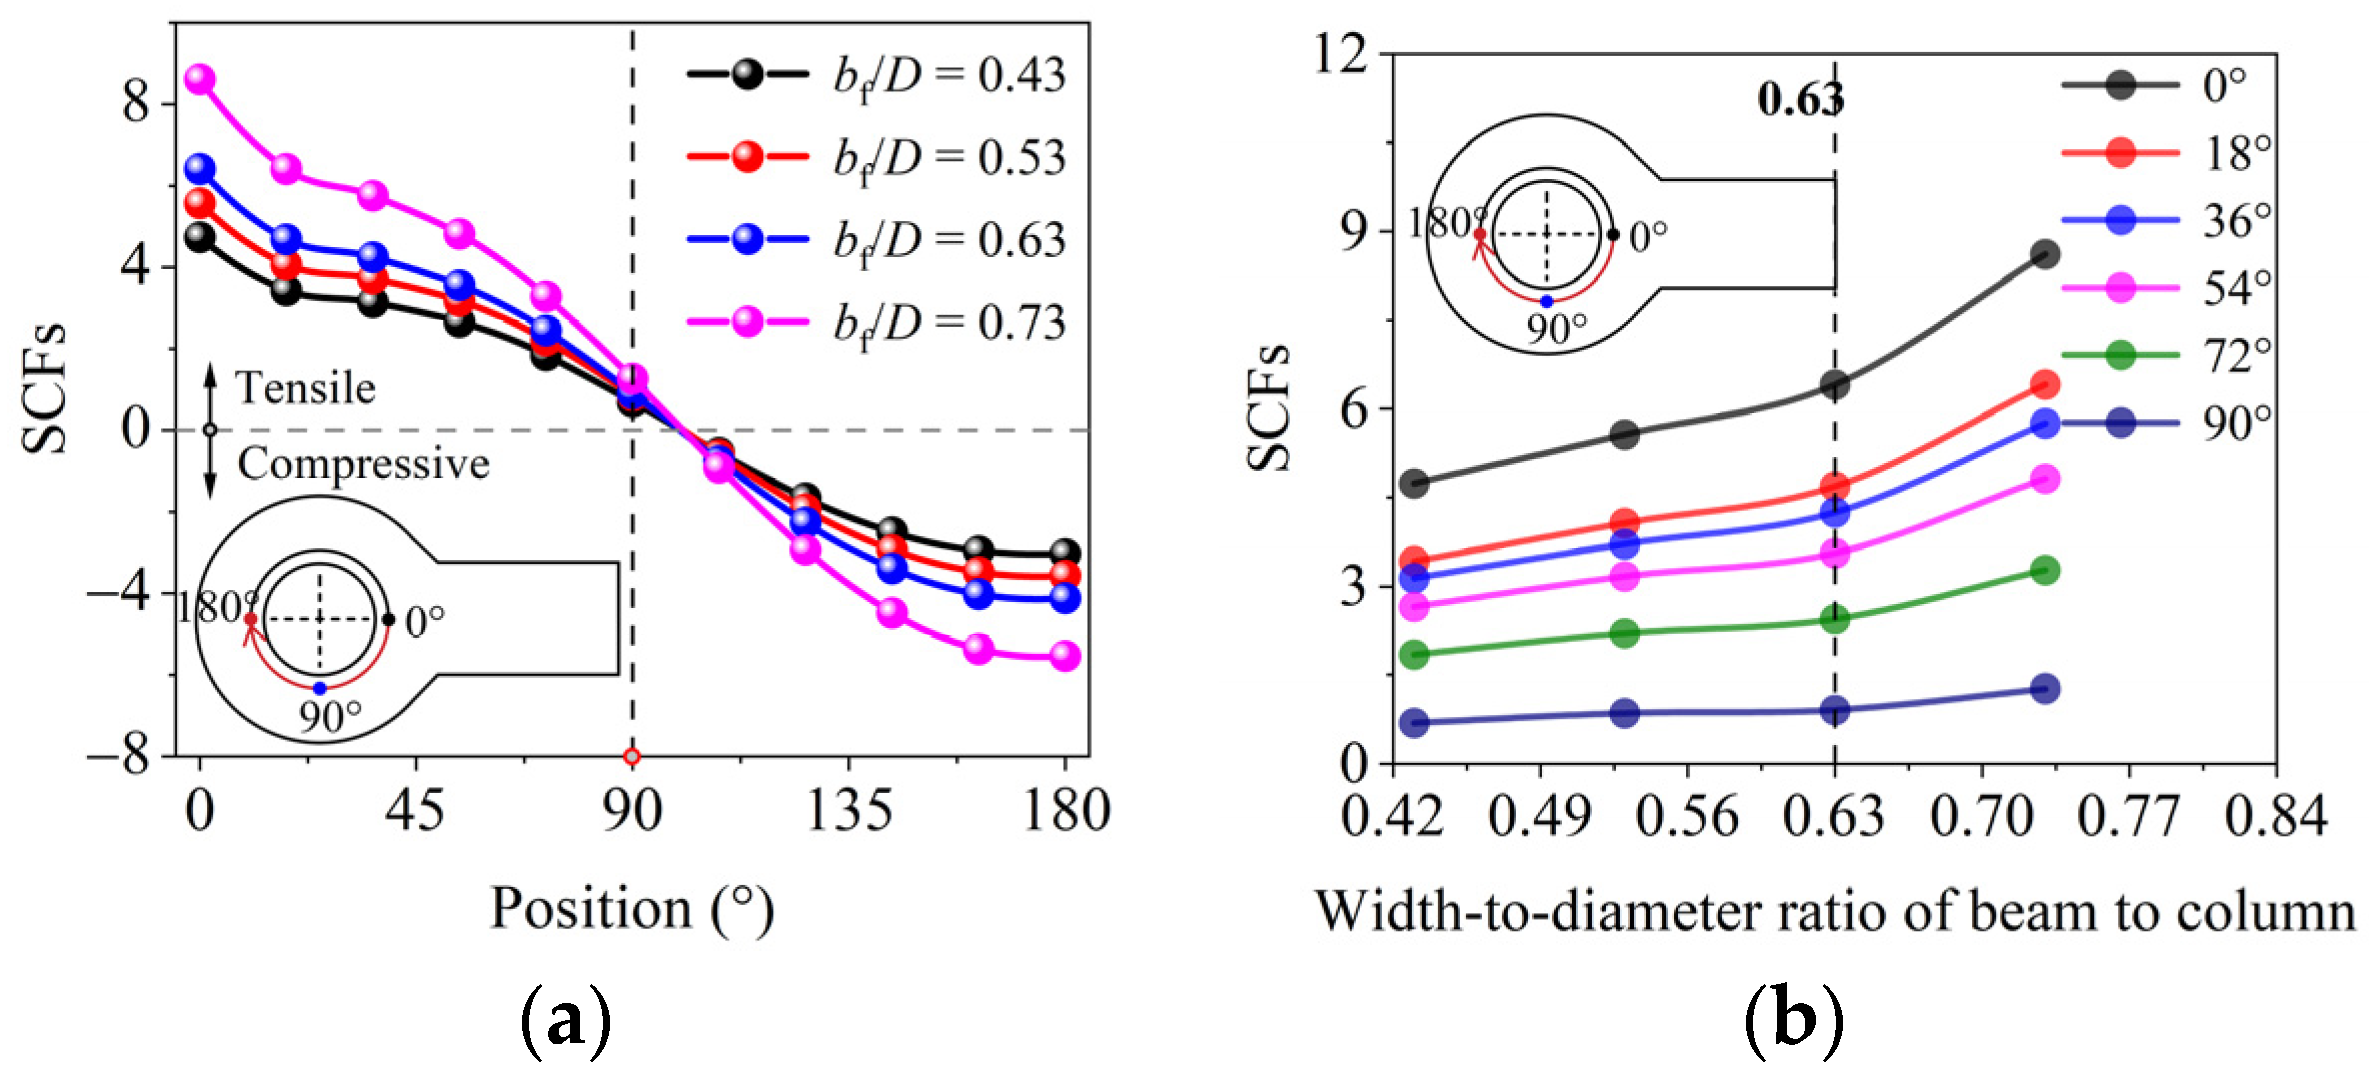
5.2. Influence of the Width-to-Diameter Ratio of Beam to Column
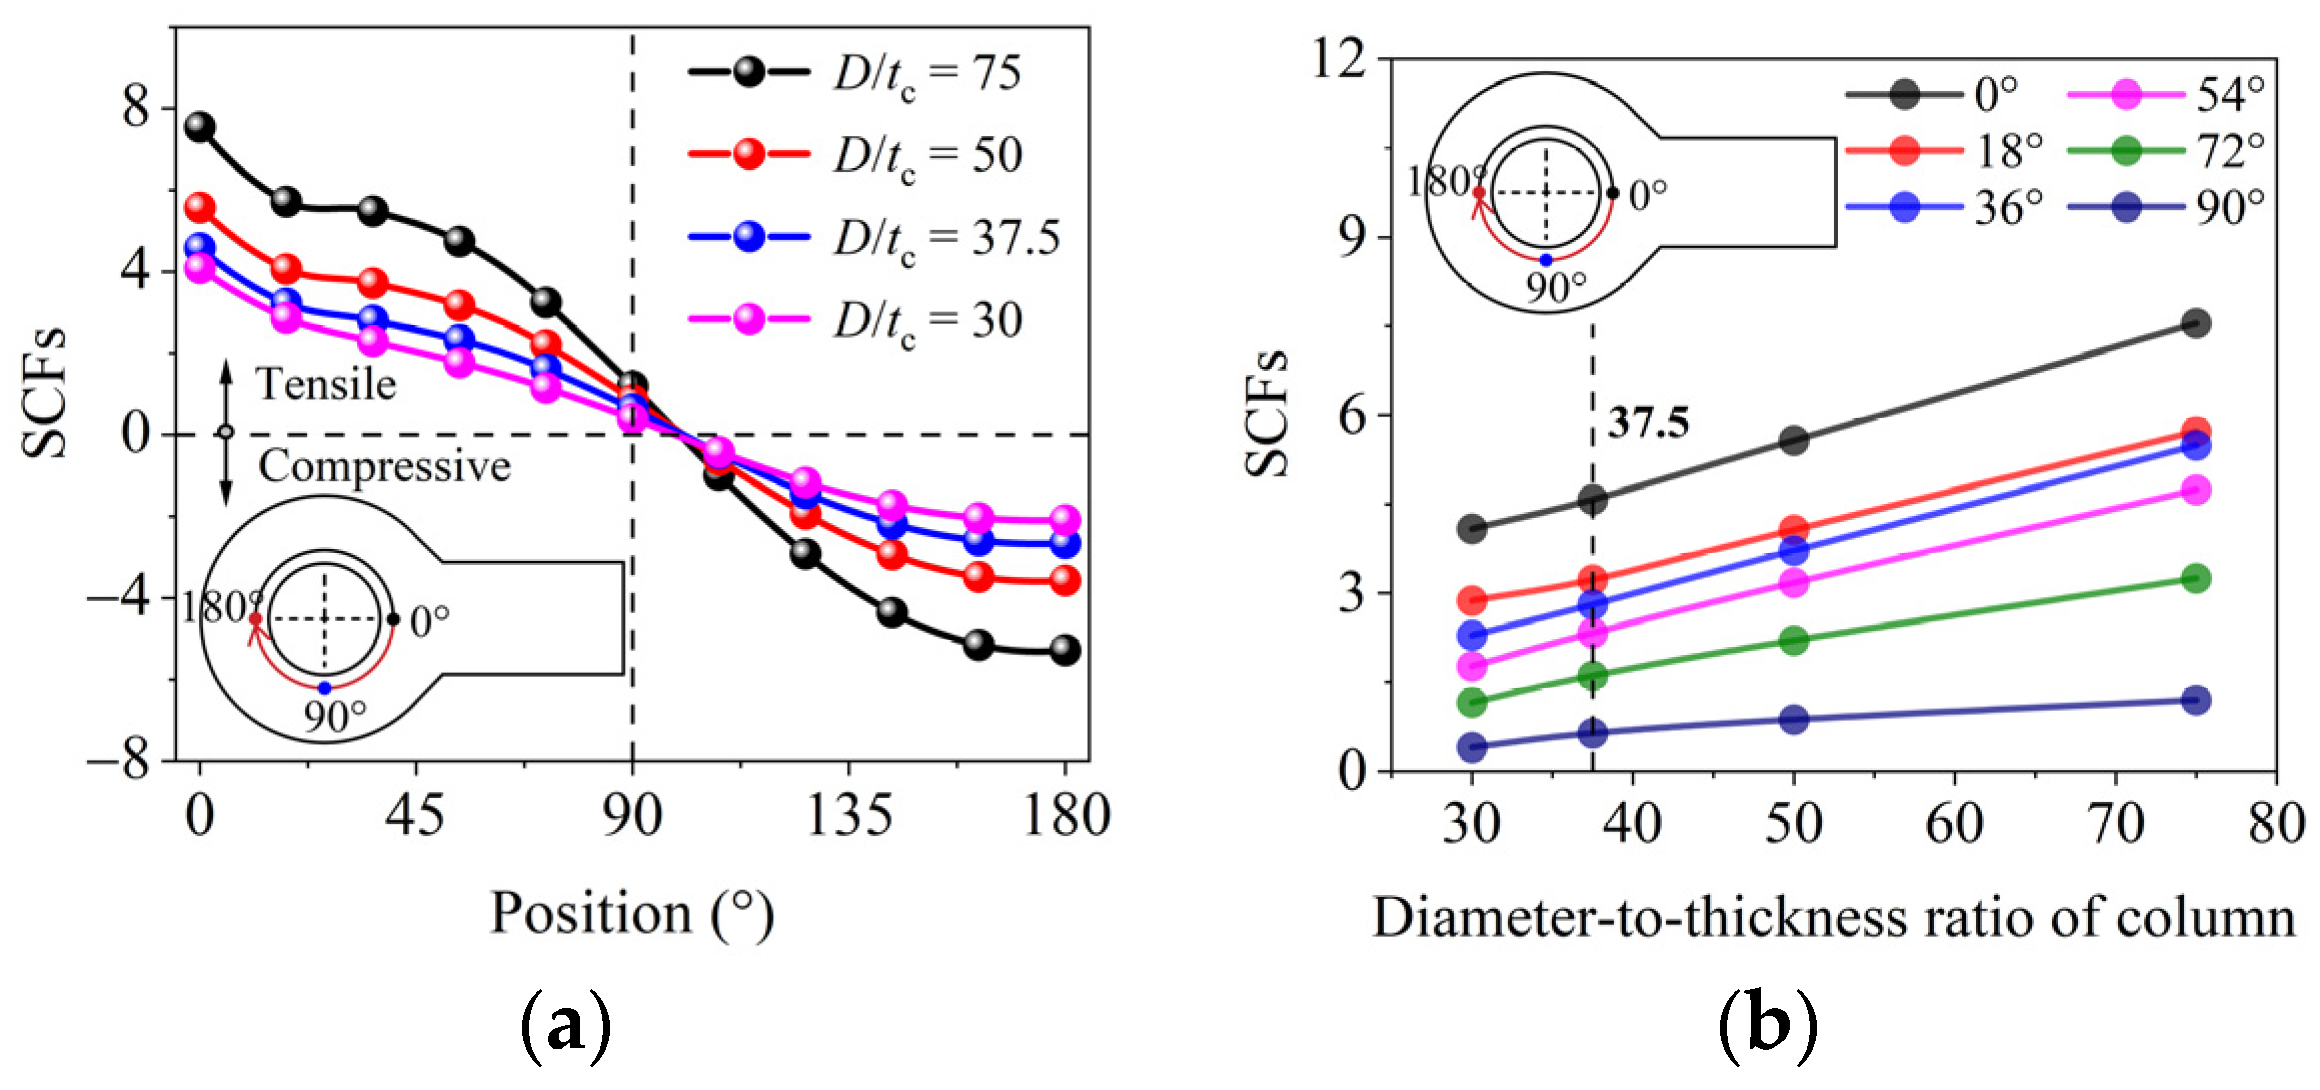
5.3. Influence of the Diameter-to-Thickness Ratio of the Column
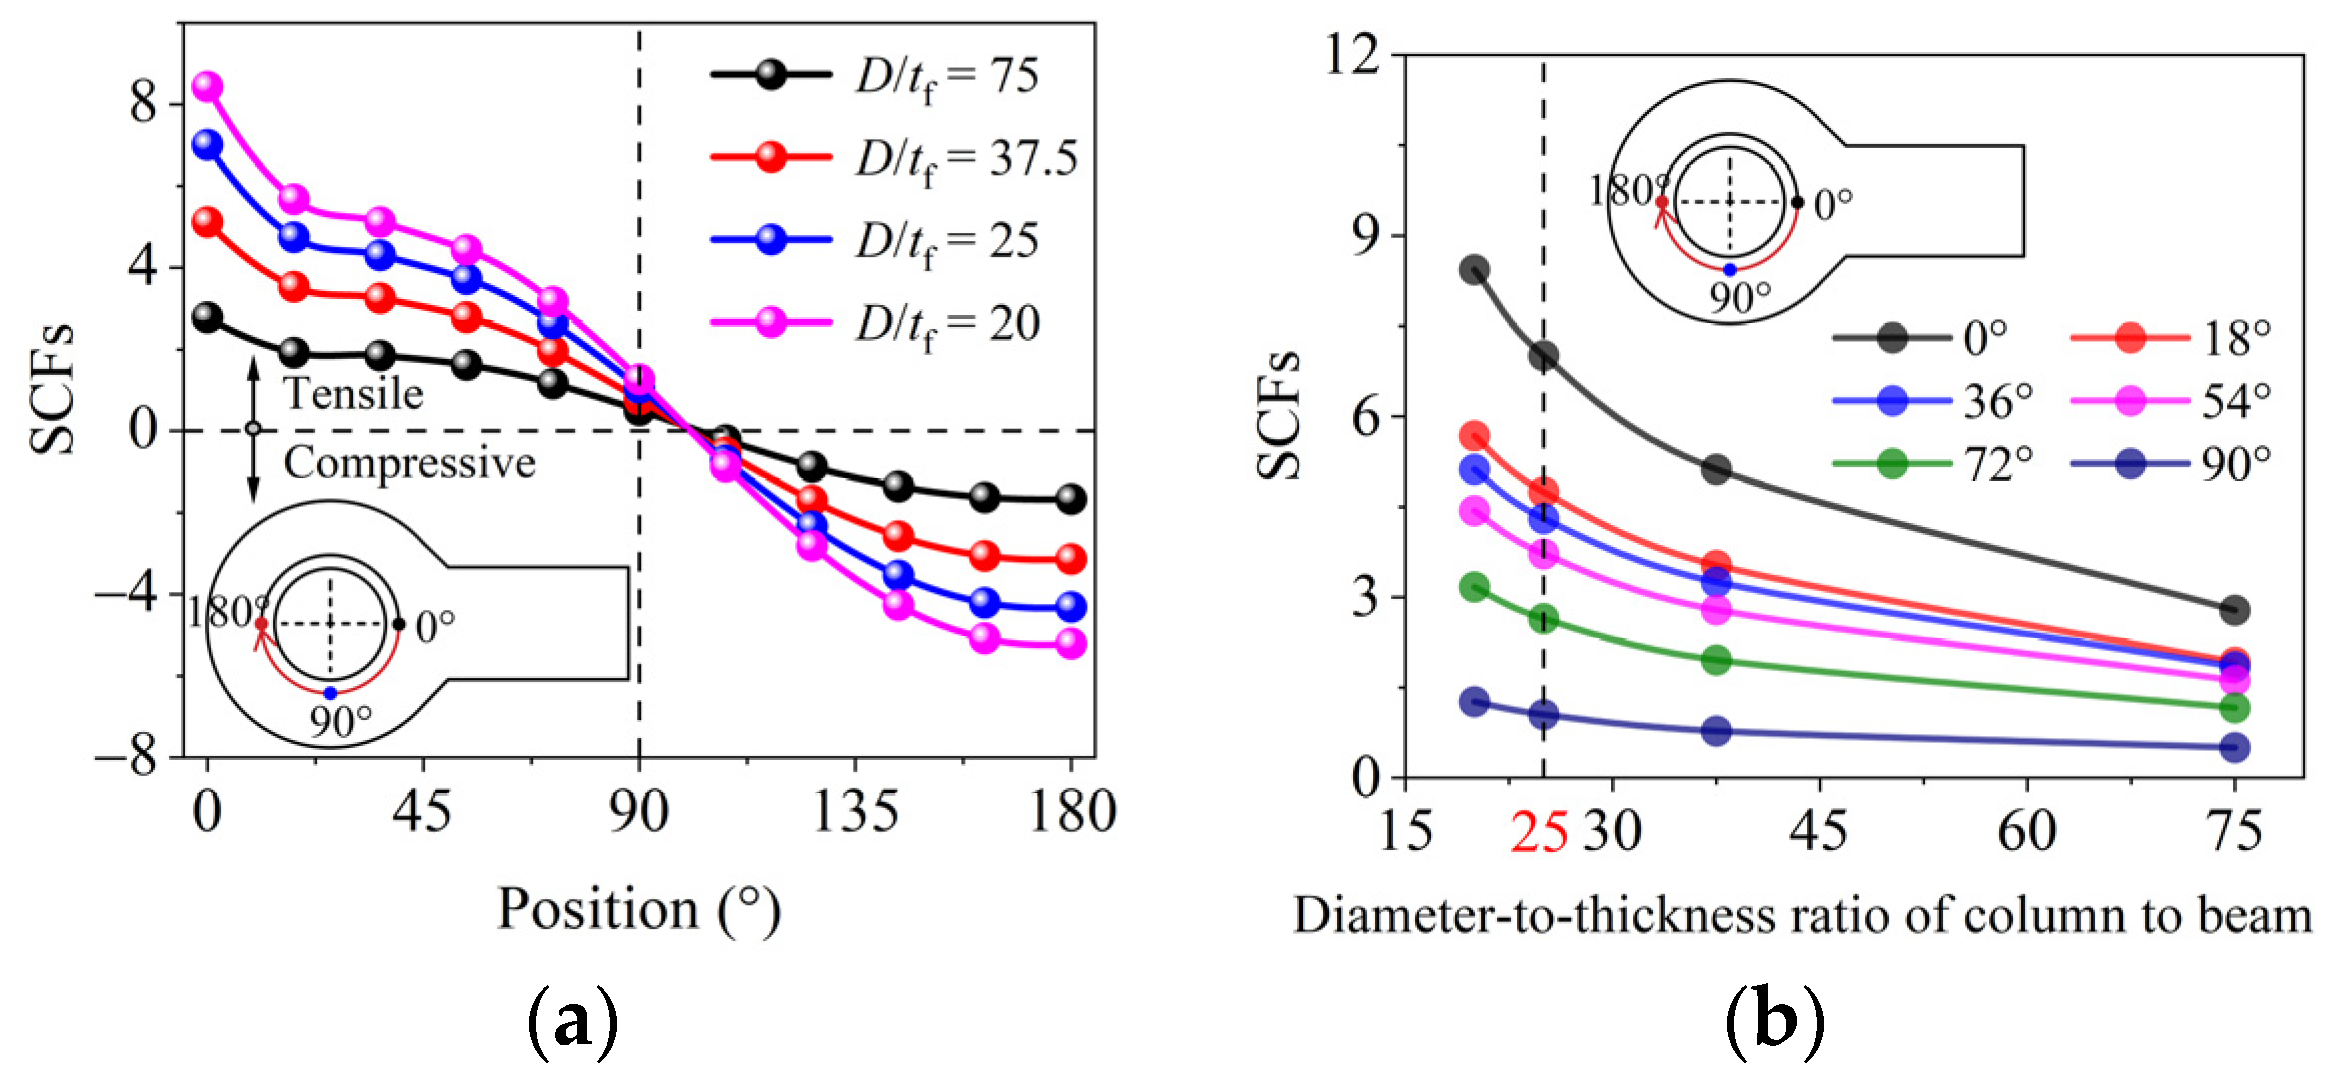
5.4. Influence of Column Diameter-to-Beam Thickness Ratio
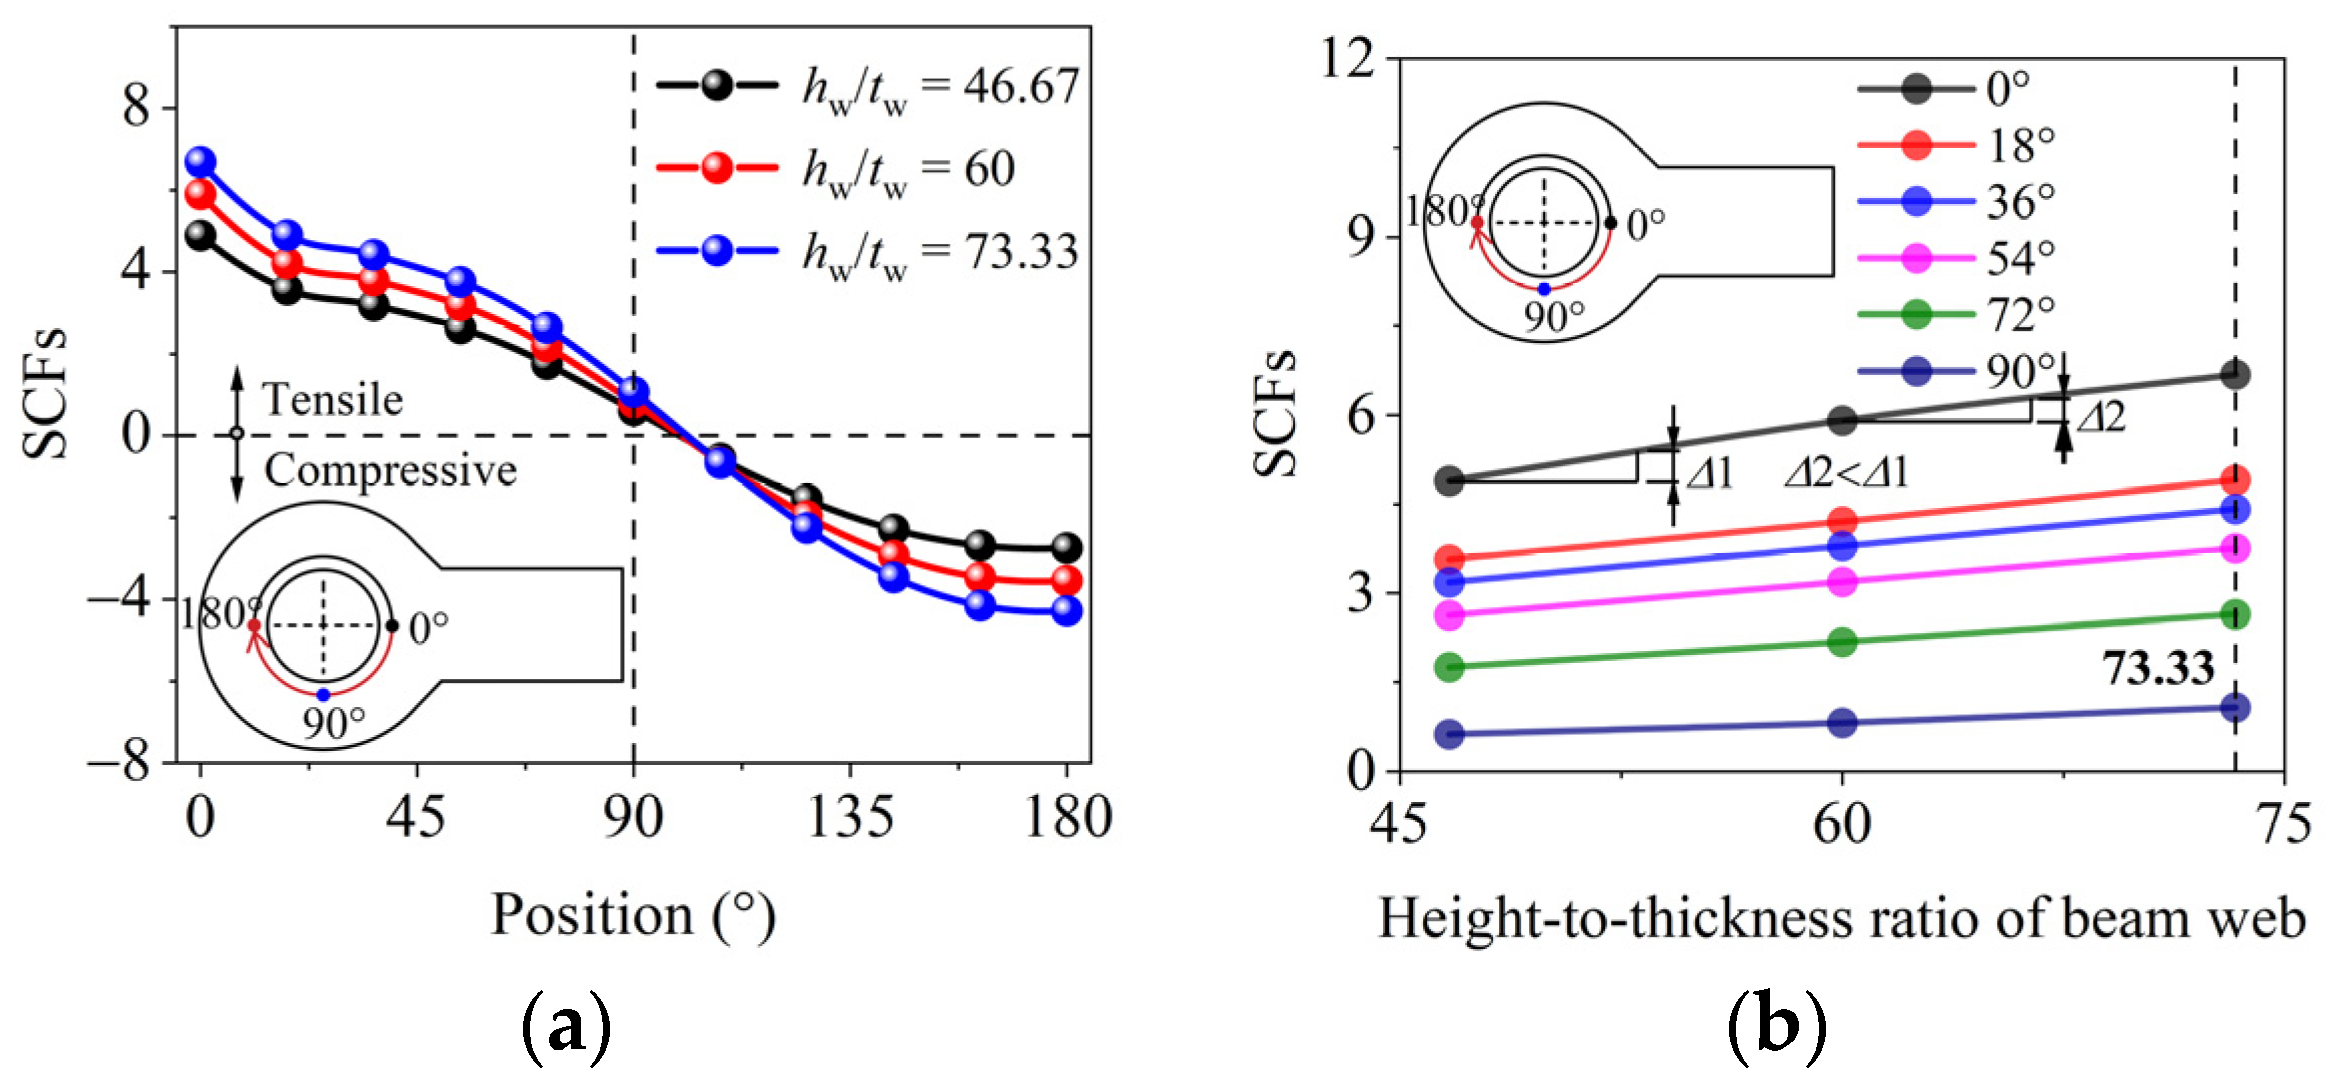
5.5. Influence of the Height-to-Thickness Ratio of the Beam Web
6. Optimization of STCSB Connections
7. Conclusions
Author Contributions
Funding
Data Availability Statement
Conflicts of Interest
References
- Allan, B.; Lewis, J.I.; Oatley, T. Green industrial policy and the global transformation of climate politics. Glob. Environ. Politics 2021, 21, 1–19. [Google Scholar] [CrossRef]
- Zou, C.N.; Xiong, B.; Xue, H.Q.; Zheng, D.W.; Ge, Z.X.; Wang, Y.; Jiang, L.Y.; Pan, S.Q.; Wu, S.T. The role of new energy in carbon neutral. Pet. Explor. Dev. 2021, 48, 480–491. [Google Scholar] [CrossRef]
- Paraschiv, S.; Paraschiv, L.S.; Serban, A.; Cristea, A.G. Assessment of onshore wind energy potential under temperate continental climate conditions. Energy Rep. 2022, 8, 251–258. [Google Scholar] [CrossRef]
- Oh, K.Y.; Nam, W.; Ryu, M.S.; Kim, J.Y.; Epureanu, B.I. A review of foundations of offshore wind energy convertors: Current status and future perspectives. Renew. Sustain. Energy Rev. 2018, 88, 16–36. [Google Scholar] [CrossRef]
- Ahmadi, H.; Lotfollahi-Yaghin, M.A. Effect of SCFs on SN based fatigue reliability of multi-planar tubular DKT-joints of offshore jacket-type structures. Ships Offshore Struct. 2013, 8, 55–72. [Google Scholar] [CrossRef]
- Ahmadi, H.; Lotfollahi-Yaghin, M.A.; Aminfar, M.H. Effect of stress concentration factors on the structural integrity assessment of multi-planar offshore tubular DKT-joints based on the fracture mechanics fatigue reliability approach. Ocean Eng. 2011, 38, 1883–1893. [Google Scholar] [CrossRef]
- Ahmadi, H.; Lotfollahi-Yaghin, M.A.; Aminfar, M.H. The development of fatigue design formulas for the outer brace SCFs in offshore three-planar tubular KT-joints. Thin Walled Struct. 2012, 58, 67–78. [Google Scholar] [CrossRef]
- Wang, W.; Chen, Y.Y.; Li, W.Q.; Chen, X. Behaviour of Steel Structures in Seismic Areas; Trans Tech Publications: London, UK, 2009. [Google Scholar]
- Li, J.F.; Mou, B.; Wang, Z. Cyclic behavior of column-to-column connections in novel prefabricated H-shaped steel beam to CFST column joint. J. Constr. Steel Res. 2023, 200, 107657. [Google Scholar] [CrossRef]
- Korkmaz, H.H.; Tankut, T. Performance of a precast concrete beam-to-beam connection subject to reversed cyclic loading. Eng. Struct. 2005, 27, 1392–1407. [Google Scholar] [CrossRef]
- Cao, X.-Y.; Feng, D.-C.; Wang, C.-L.; Shen, D.; Wu, G. A stochastic CSM-based displacement-oriented design strategy for the novel precast SRC-UHPC composite braced-frame in the externally attached seismic retrofitting. Compos. Struct. 2023, 321, 117308. [Google Scholar] [CrossRef]
- Lu, L.H.; Wardenier, J. The static strength and behaviour of uniplanar and multiplanar connections between I-beams and RHS columns. In Connections in Steel Structures III; Pergamon: Elmsford, NY, USA, 1996; pp. 127–135. [Google Scholar] [CrossRef]
- Kamba, T.; Taclendo, C. CHS column connections without stiffener. In Tubular Structures VIII; A. A. Balkema: Rotterdam, The Netherlands, 1998; pp. 567–576. [Google Scholar]
- Kim, T.; Whittaker, A.S.; Gilani, A.S.J.; Bertero, V.V.; Takhirov, S.M. Cover-plate and flange-plate steel moment-resisting connections. J. Struct. Eng. 2002, 128, 474–482. [Google Scholar] [CrossRef]
- Kosteski, N.; Packer, J.A.; Puthli, R.S. A finite element method based yield load determination procedure for hollow structural section connections. J. Constr. Steel Res. 2003, 59, 453–471. [Google Scholar] [CrossRef]
- Kamba, T.; Taclendo, C.; Namba, H. Tubular Column to H-Beam Connections without Diaphragms. In Tubular Structures X; Routledge: London, UK, 2002. [Google Scholar]
- Packer, J.; Wardenier, J.; Zhao, X.-L.; van der Vegte, G.; Kurobane, Y. Design Guide for Rectangular Hollow Section (RHS) Joints under Predominantly Static Loading; CIDECT: Geneva, Switzerland, 2009. [Google Scholar]
- Goswami, R.; Murty, C.V.R. Externally reinforced welded I-beam-to-box-column seismic connection. J. Eng. Mech. 2010, 136, 23–30. [Google Scholar] [CrossRef]
- Couchaux, M.; Vyhlas, V.; Kanyilmaz, A.; Hjiaj, M. Passing-through I-beam-to-CHS column joints made by laser cutting technology: Experimental tests and design model. J. Constr. Steel Res. 2021, 176, 106298. [Google Scholar] [CrossRef]
- Dong, X.T.; Wang, L.; Xu, Z.F.; Guan, S.S.; Liu, L.Y.; Chen, H.T. Seismic behaviour of concrete-filled steel tubular column to H-shape steel beam connection with side plate. Structures 2023, 50, 1608–1624. [Google Scholar] [CrossRef]
- Chen, Y.; Zhou, F.; Zheng, S.; Li, J.Q.; Shang, C.Z.; Lin, X.X. Influence of cyclic hardening characteristic on seismic performance of welded austenitic stainless steel H-section beam-column. Eng. Struct. 2023, 288, 116210. [Google Scholar] [CrossRef]
- ISO-6892-1; Metallic Materials–Tensile Testing—Part 1: Method of Test at Room Temperature. ISO: Geneva, Switzerland, 2019.
- Huang, Y.; Young, B. The art of coupon tests. J. Constr. Steel Res. 2014, 96, 159–175. [Google Scholar] [CrossRef]
- DNV-RP-C203; Fatigue Design of Offshore Steel Structures. Det Norske Veritas: Bærum, Norway, 2011.
- Zhao, X.-L.; Herion, S.; Packer, J.A.; Puthli, R.; Sedlacek, G.; Wardenier, J. Design Guide for Circular and Rectangular Hollow Section Joints under Fatigue Loading; CIDECT Publication; TUV-Verlag: Köln, Germany, 2000. [Google Scholar]
- Shao, Y.B.; Lie, S.-T. Experimental and numerical studies of the stress concentration factor (SCF) of tubular K-joints. Eng. Mech. 2006, 23, 79–85. [Google Scholar]
- van Wingerde, A.M.; Packer, J.A.; Wardenier, J. Criteria for the fatigue assessment of hollow structural section connections. J. Constr. Steel Res. 1995, 35, 71–115. [Google Scholar] [CrossRef]
- Tong, L.W.; Xu, G.W.; Zhao, X.-L.; Zhou, H.M.; Xu, F. Experimental and theoretical studies on reducing hot spot stress on CHS gap K-joints with CFRP strengthening. Eng. Struct. 2019, 201, 109827. [Google Scholar] [CrossRef]
- CCS. Guidelines for the Fatigue Strength Assessment of Offshore Engineering Structures; China Classification Society (CCS): Beijing, China, 2022. [Google Scholar]


| Number | L | l | Dt | tc | hw | bf | tw | tf | bo | t0 | Type of Stiffening Ring |
|---|---|---|---|---|---|---|---|---|---|---|---|
| mm | mm | mm | mm | mm | mm | mm | mm | mm | mm | ||
| IB450 × 200-CC300-6-SRD20-14 | 2240 | 1800 | 300 | 6 | 450 | 200 | 9 | 14 | 20 | 14 | Diamonds |
| IB450 × 200-CC300-5-SRD20-14 | 2240 | 1800 | 300 | 5 | 450 | 200 | 9 | 14 | 20 | 14 | Diamonds |
| IB450 × 120-CC300-6-SRD20-14 | 2240 | 1800 | 300 | 6 | 450 | 120 | 9 | 14 | 20 | 14 | Diamonds |
| Member | Parameter | lt/mm | lr/mm | lg/mm | lc/mm | R/mm | t/mm | wg/mm | wc/mm | Rh/mm | lh/mm | Number |
|---|---|---|---|---|---|---|---|---|---|---|---|---|
| Circular steel column | 300 × 5 | 214 | 15.0 | 64 | 60 | 15 | 5 | 16 | 45 | 6 | 30 | 2 |
| 300 × 6 | 214 | 15.0 | 64 | 60 | 15 | 6 | 13 | 40 | 6 | 30 | 2 |
| Stage | Strain Rate/s−1 |
|---|---|
| Elastic stage | 0.000017 |
| Yield plateau stage | 0.00005 |
| Strain-hardening stage | 0.0002 |
| Necking stage | 0.00033 |
| Member | Specimen | Elastic Modulus/GPa | Yield Strength/MPa | Ultimate Strength/MPa |
|---|---|---|---|---|
| Circular steel column | 300 × 5-1 | 220.72 | 435.79 | 582.86 |
| 300 × 5-2 | 223.37 | 435.71 | 571.33 | |
| 300 × 6-1 | 200.76 | 405.37 | 559.31 | |
| 300 × 6-2 | 197.37 | 394.75 | 556.34 | |
| I-shape steel beam | Web-450 × 200-1 | 219.33 | 376.63 | 544.76 |
| Web-450 × 200-2 | 226.66 | 385.34 | 548.51 | |
| Flange-450 × 200-1 | 207.64 | 357.10 | 552.03 | |
| Flange-450 × 200-2 | 194.03 | 363.07 | 552.55 |
| Member | Tensile Side | Compressive Side | |||||||||||
|---|---|---|---|---|---|---|---|---|---|---|---|---|---|
| 0° | 22.5° | 45° | 90° | 135° | 180° | 0° | 22.5° | 45° | 90° | 135° | 180° | ||
| IB450 × 200-CC300-6-SRD20-14 | Column | 4.38 | 2.81 | 1.74 | 0.29 | −1.85 | −3.00 | - | - | - | - | - | - |
| Plate | - | - | - | - | - | - | - | - | - | - | - | - | |
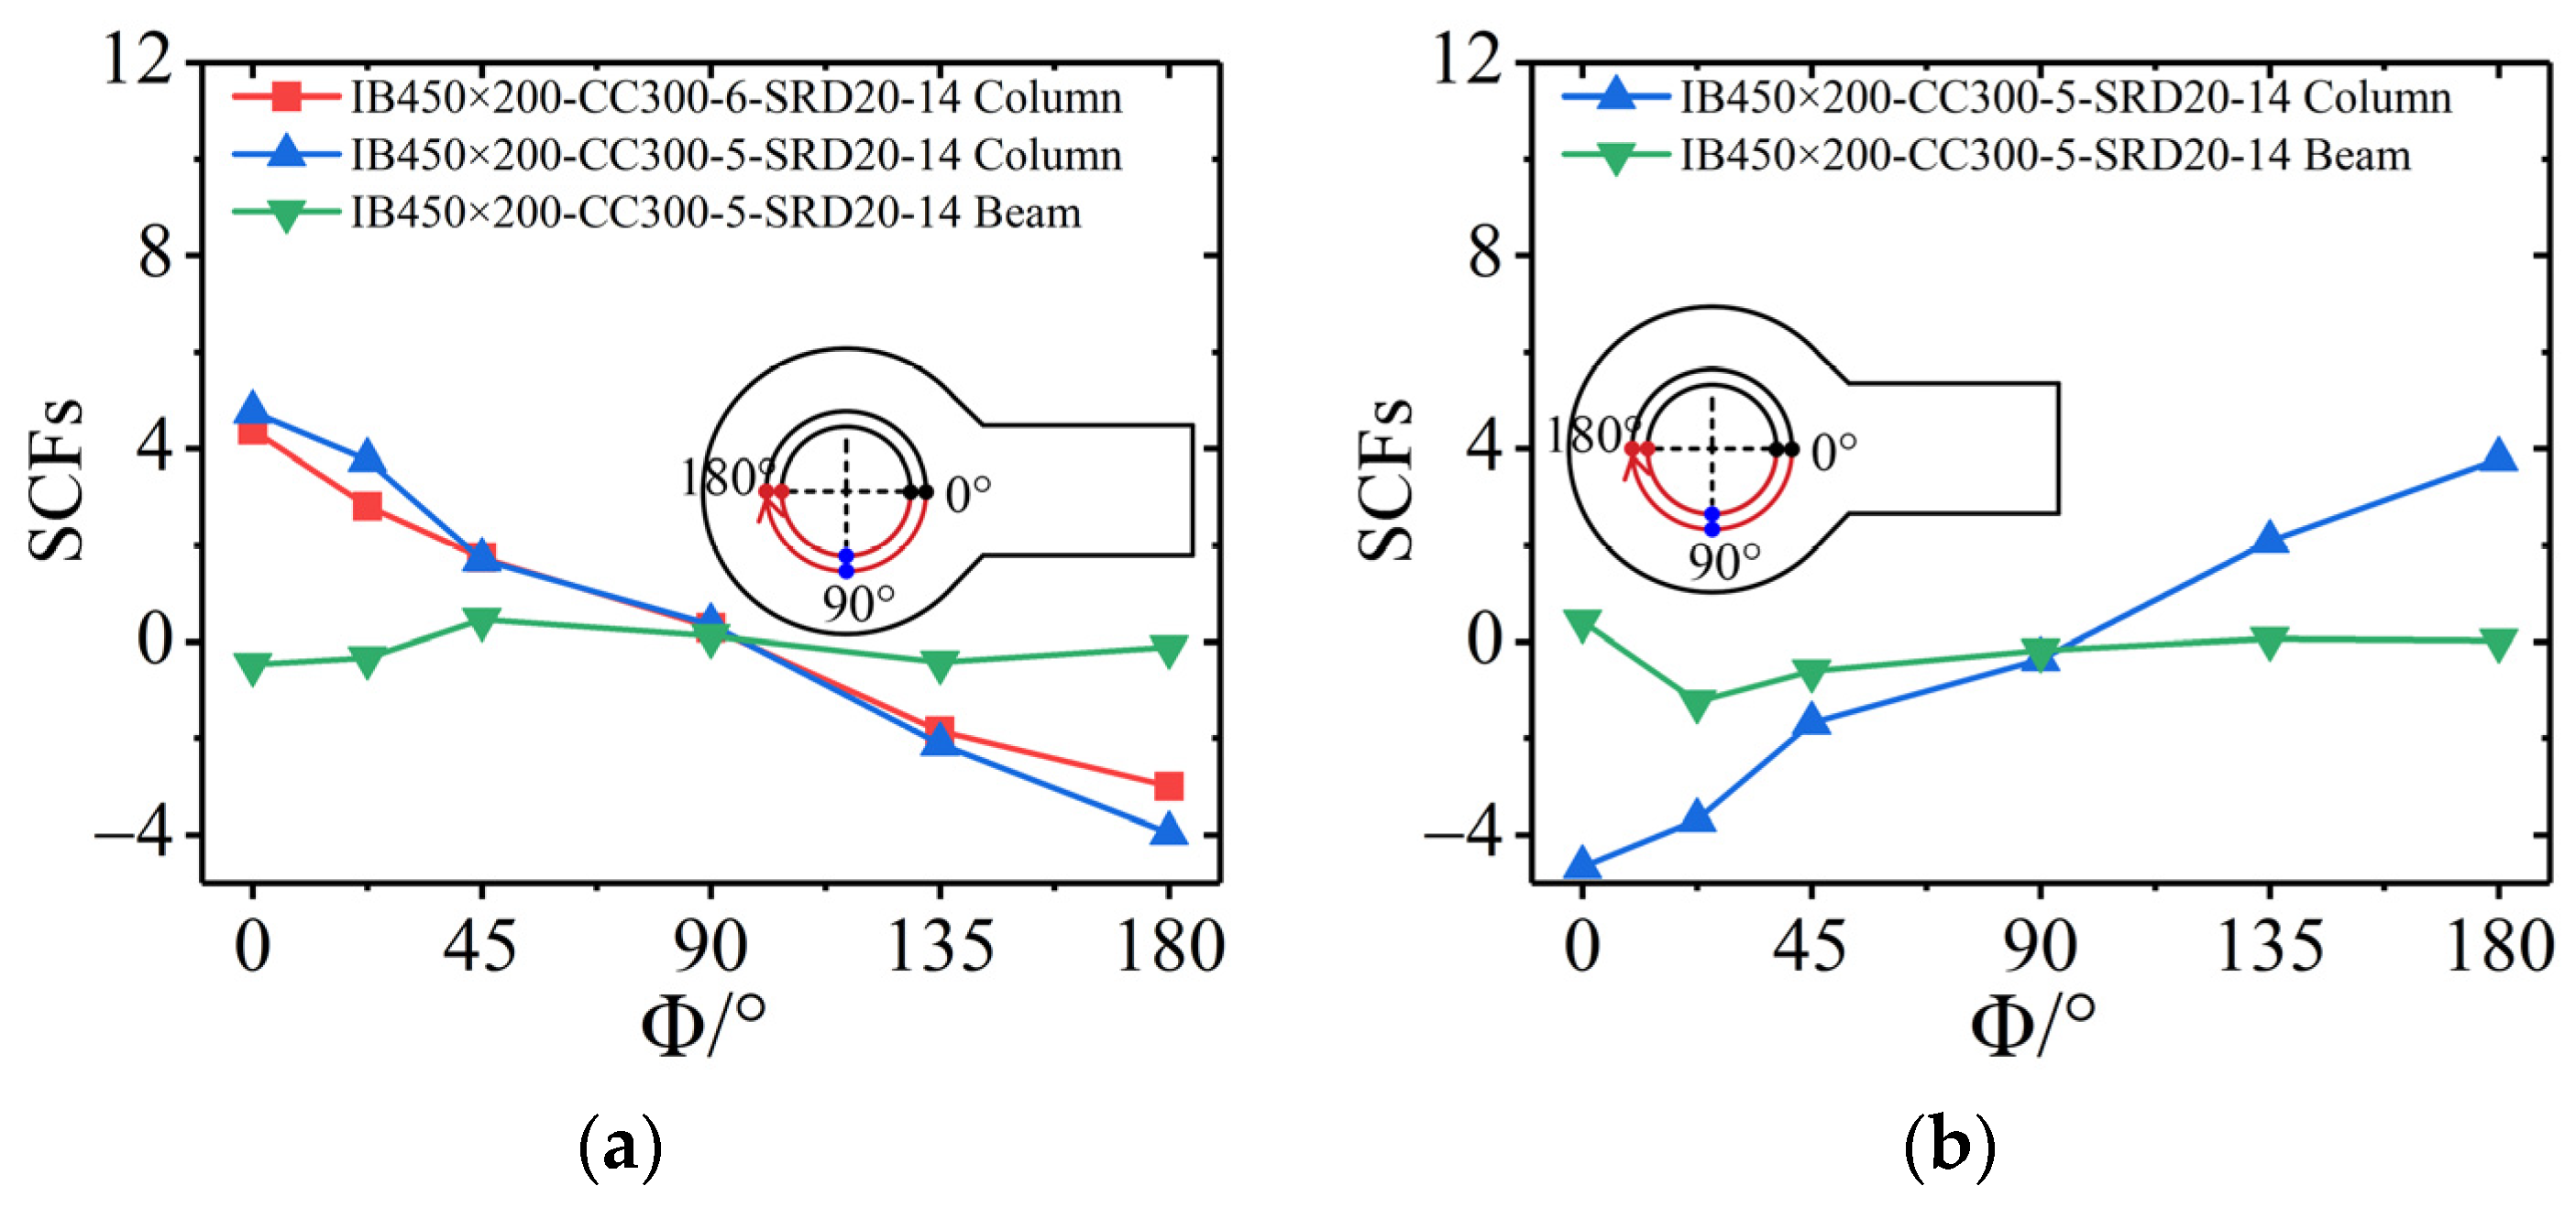
| IB450 × 200-CC300-5-SRD20-14 | Column | 4.76 | 3.77 | 1.70 | 0.35 | −2.12 | −3.96 | −4.66 | −3.69 | −1.68 | −0.36 | 2.08 | 3.79 |
| Plate | −0.47 | −0.33 | 0.46 | 0.12 | −0.42 | −0.11 | 0.42 | −1.24 | −0.60 | −0.18 | 0.06 | 0.02 | |
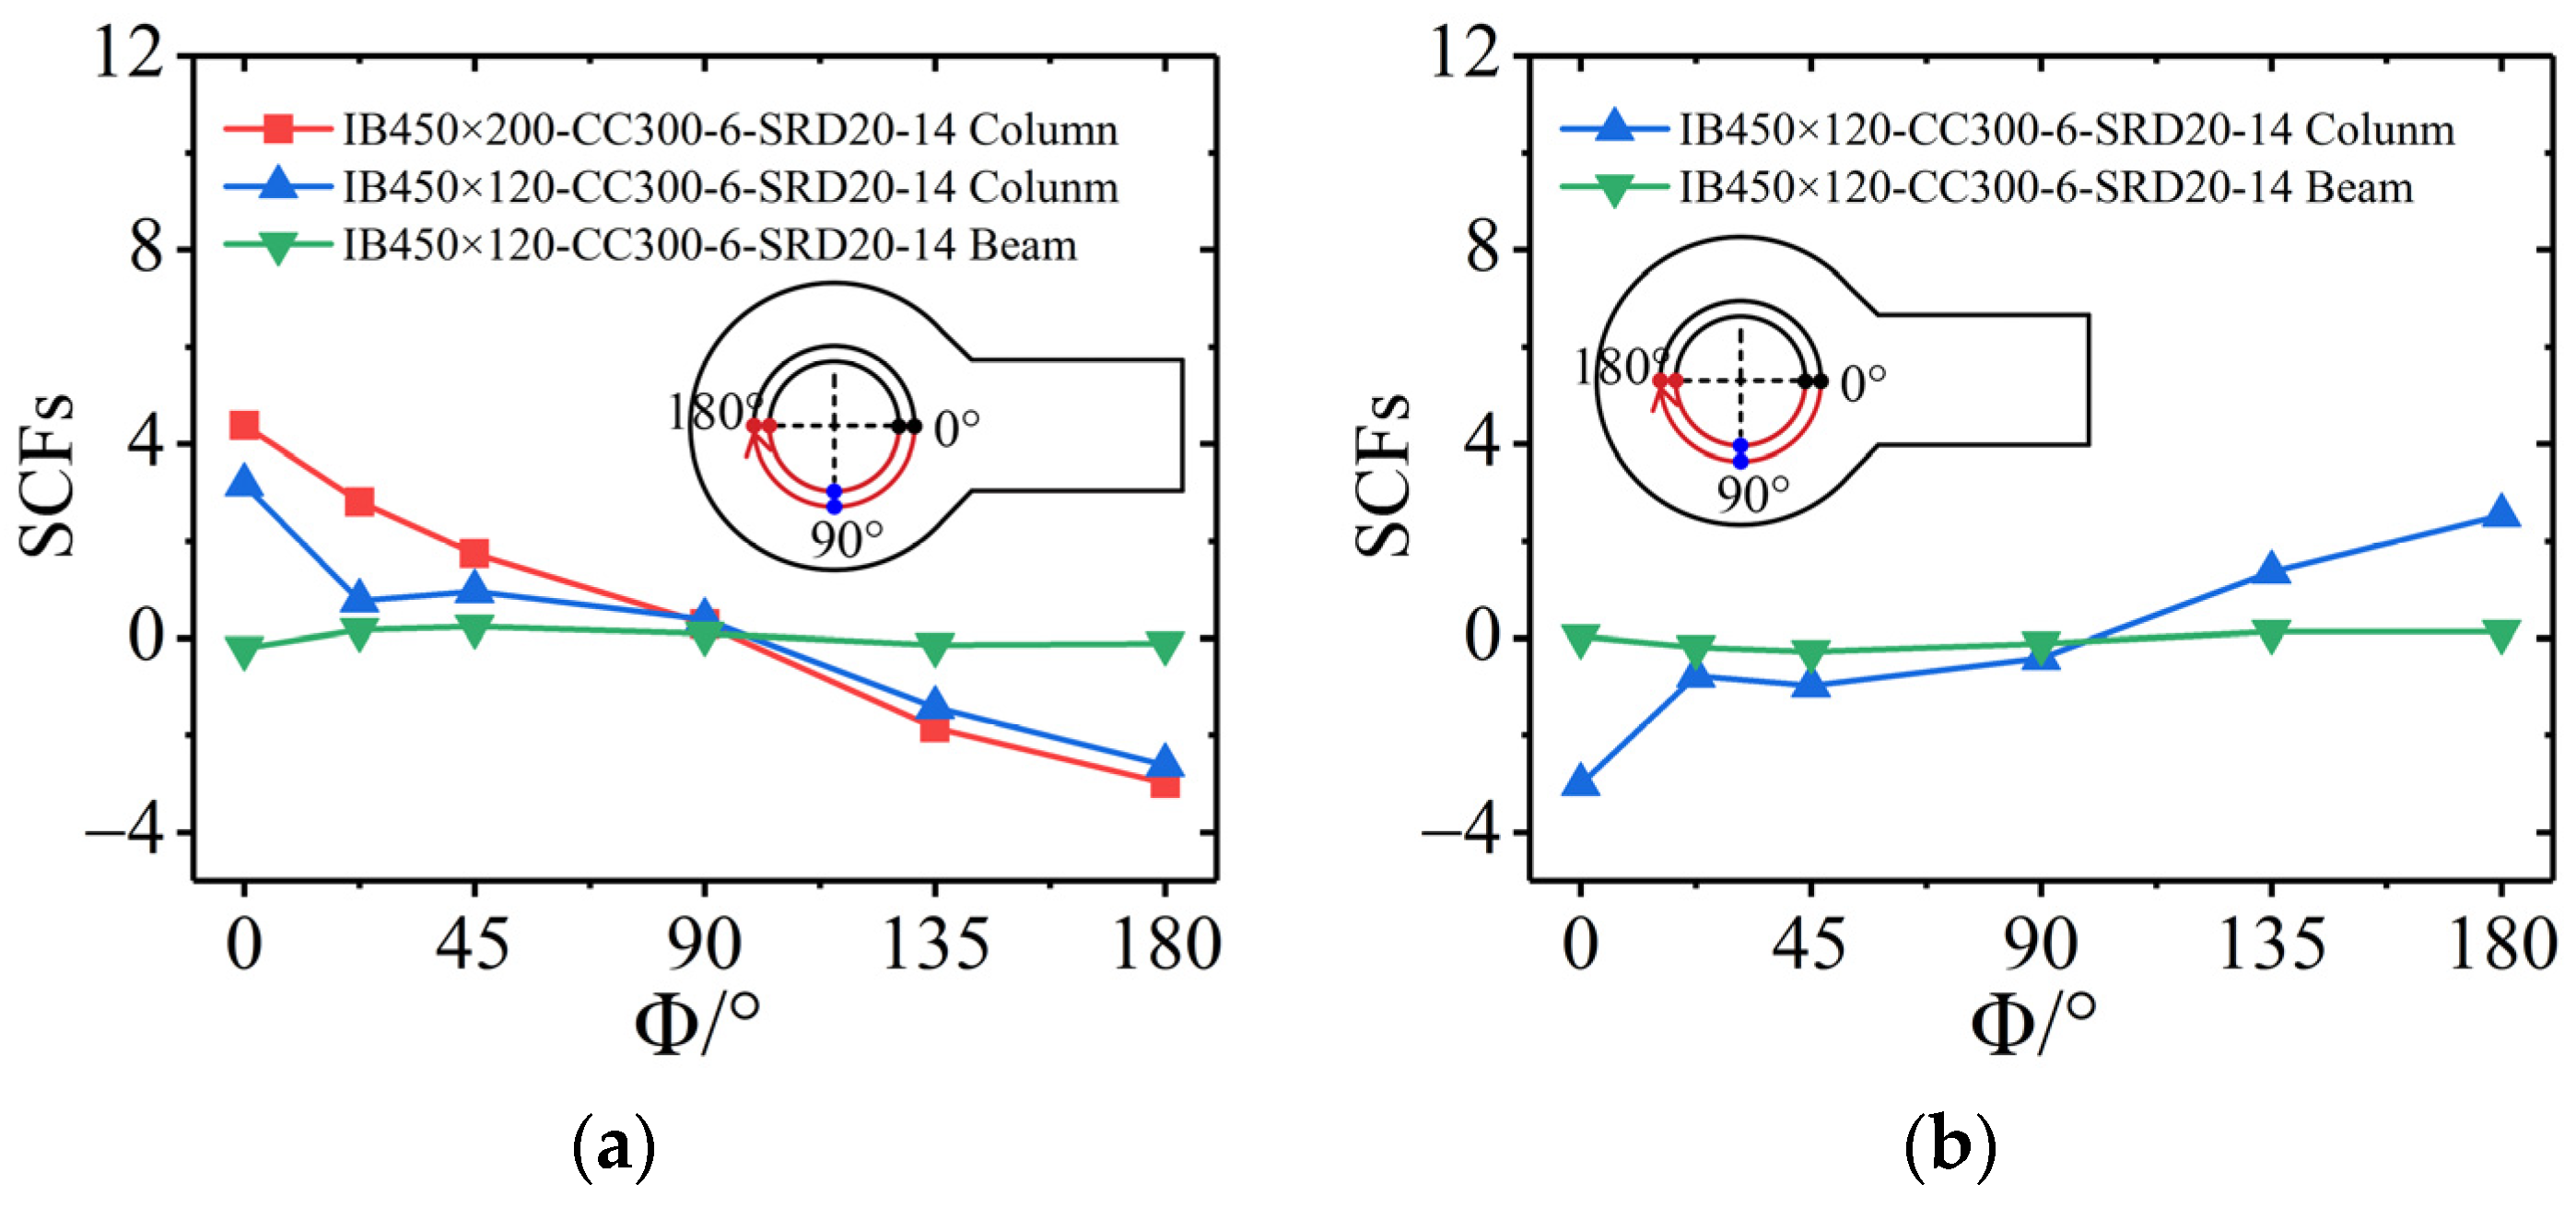
| IB450 × 120-CC300-6-SRD20-14 | Column | 3.17 | 0.77 | 0.96 | 0.38 | −1.43 | −2.62 | −3.02 | −0.77 | −0.98 | −0.41 | 1.36 | 2.54 |
| Plate | −0.21 | 0.17 | 0.24 | 0.09 | −0.14 | −0.11 | 0.03 | −0.19 | −0.27 | −0.11 | 0.13 | 0.13 | |
| Member | SCFFE | SCFTest | |||||||||||
|---|---|---|---|---|---|---|---|---|---|---|---|---|---|
| Tensile Side | 0° | 22.5° | 45° | 90° | 135° | 180° | 0° | 22.5° | 45° | 90° | 135° | 180° | |
| IB450 × 200-CC300-6-SRD20-14 | Column | 5.13 | 3.26 | 1.87 | 0.20 | −2.03 | −3.04 | 4.38 | 2.81 | 1.74 | 0.29 | −1.85 | −3.00 |
| IB450 × 200-CC300-5-SRD20-14 | Column | 5.07 | 3.93 | 2.44 | 0.26 | −2.47 | −3.73 | 4.76 | 3.77 | 1.70 | 0.35 | −2.12 | −3.96 |
| IB450 × 120-CC300-6-SRD20-14 | Column | 3.51 | 2.24 | 1.07 | 0.35 | −1.40 | −2.54 | 3.17 | 0.77 | 0.96 | 0.38 | −1.43 | −2.62 |
| Compressive side | |||||||||||||
| IB450 × 200-CC300-6-SRD20-14 | Column | −5.10 | −3.23 | −1.89 | −0.61 | 2.03 | 3.06 | - | - | - | - | - | - |
| IB450 × 200-CC300-5-SRD20-14 | Column | −5.02 | −3.89 | −2.45 | −0.28 | 2.46 | 3.77 | −4.66 | −3.69 | −1.68 | −0.36 | 2.08 | 3.79 |
| IB450 × 120-CC300-6-SRD20-14 | Column | −3.49 | −2.23 | −1.08 | −0.36 | 1.39 | 2.06 | −3.02 | −0.77 | −0.98 | −0.41 | 1.36 | 2.54 |
| Member | SCFFE/SCFTest | Average | CoV | ||||||
|---|---|---|---|---|---|---|---|---|---|
| Tensile Side | 0° | 22.5° | 45° | 90° | 135° | 180° | |||
| IB450 × 200-CC300-6-SRD20-14 | Column | 1.17 | 1.16 | 1.07 | 0.69 | 1.10 | 1.01 | 1.03 | 0.12 |
| IB450 × 200-CC300-5-SRD20-14 | Column | 1.07 | 1.04 | 1.44 | 0.74 | 1.17 | 0.94 | 1.07 | 0.16 |
| IB450 × 120-CC300-6-SRD20-14 | Column | 1.11 | 2.91 | 1.11 | 0.92 | 0.98 | 0.97 | 1.02 | 0.07 |
| Compressive side | |||||||||
| IB450 × 200-CC300-6-SRD20-14 | Column | ||||||||
| IB450 × 200-CC300-5-SRD20-14 | Column | 1.08 | 1.05 | 1.46 | 0.78 | 1.18 | 0.99 | 1.09 | 0.15 |
| IB450 × 120-CC300-6-SRD20-14 | Column | 1.16 | 2.90 | 1.10 | 0.88 | 1.02 | 0.81 | 0.99 | 0.12 |
| Member | Geometrical Parameter | Column | Plate | Beam | Parameter Analysis Range | |||||
|---|---|---|---|---|---|---|---|---|---|---|
| D | tc | hs | ts | bf | tf | hw | tw | |||
| 1 | Width-to-diameter ratio of beam to column (bf/D) | 300 | 6 | 200 | 12 | 130 | 12 | 440 | 6 | 0.43 |
| 2 | 160 | 0.53 | ||||||||
| 3 | 190 | 0.63 | ||||||||
| 4 | 220 | 0.73 | ||||||||
| 5 | Diameter-to-thickness ratio of column (D/tc) | 300 | 4 | 200 | 12 | 160 | 12 | 440 | 6 | 30.0 |
| 6 | 6 | 37.5 | ||||||||
| 7 | 8 | 50.0 | ||||||||
| 8 | 10 | 72.0 | ||||||||
| 9 | Diameter-to-thickness ratio of column to beam (D/tf) | 300 | 6 | 200 | 12 | 160 | 4 | 440 | 6 | 75.0 |
| 10 | 8 | 37.5 | ||||||||
| 11 | 12 | 25.0 | ||||||||
| 12 | 15 | 20.0 | ||||||||
| 13 | Height-to-thickness ratio of beam web (hw/tw) | 300 | 6 | 200 | 12 | 160 | 12 | 280 | 6 | 46.67 |
| 14 | 360 | 60.00 | ||||||||
| 15 | 440 | 73.33 | ||||||||
| Member | Stiffener | bsti/mm | hsti/mm | tsti/mm | β1/° | β2/° |
|---|---|---|---|---|---|---|
| S1 | Method 1 | 190.73 | 190.73 | 6 | 45 | - |
| S2 | 190.73 | 190.73 | 12 | 45 | - | |
| S3 | 190.73 | 330.35 | 6 | 60 | - | |
| S4 | 190.73 | 330.35 | 12 | 60 | - | |
| S5 | 88.52 | 330.35 | 6 | 75 | - | |
| S6 | 147.51 | 147.51 | 6 | 45 | 45 | |
| S7 | Method 2 | 100 | - | 6 | - | - |
| S8 | 100 | - | 12 | - | - |
| Member | Outer Flange Configurations | bsti/mm | bf/mm | Rsti/mm | β1/° |
|---|---|---|---|---|---|
| S9 | Diamond | 200 | 200 | - | 45 |
| S10 | Arc | 200 | 200 | 1167 | |
| S11 | 200 | 200 | 540 | - | |
| S12 | 200 | 200 | 365 | - | |
| S13 | 200 | 200 | 285 | - | |
| S14 | Circle | 200 | 200 | - | -- |
Disclaimer/Publisher’s Note: The statements, opinions and data contained in all publications are solely those of the individual author(s) and contributor(s) and not of MDPI and/or the editor(s). MDPI and/or the editor(s) disclaim responsibility for any injury to people or property resulting from any ideas, methods, instructions or products referred to in the content. |
© 2024 by the authors. Licensee MDPI, Basel, Switzerland. This article is an open access article distributed under the terms and conditions of the Creative Commons Attribution (CC BY) license (https://creativecommons.org/licenses/by/4.0/).
Share and Cite
Hu, C.; Xia, Q.; Zeng, E.; Zhu, J.; Yu, S.; Zhang, L.; Xu, F. Experimental and Numerical Investigation on Stress Concentration Factors of Offshore Steel Tubular Column-to-Steel Beam (STCSB) Connections. Buildings 2024, 14, 2004. https://doi.org/10.3390/buildings14072004
Hu C, Xia Q, Zeng E, Zhu J, Yu S, Zhang L, Xu F. Experimental and Numerical Investigation on Stress Concentration Factors of Offshore Steel Tubular Column-to-Steel Beam (STCSB) Connections. Buildings. 2024; 14(7):2004. https://doi.org/10.3390/buildings14072004
Chicago/Turabian StyleHu, Chao, Qian Xia, Erxian Zeng, Jielong Zhu, Songsong Yu, Lei Zhang, and Fei Xu. 2024. "Experimental and Numerical Investigation on Stress Concentration Factors of Offshore Steel Tubular Column-to-Steel Beam (STCSB) Connections" Buildings 14, no. 7: 2004. https://doi.org/10.3390/buildings14072004