Abstract
This study primarily investigates the effect of fly ash (FA) content on the mechanical properties and hydration performance of alkali-activated ground granulated blast furnace slag cement (AAGC) and compares the related properties with ordinary Portland cement (OPC). Additionally, we examined the hydration products; performed thermal analysis, MIP, and SEM; and determined chemically bound water and pH values of AAGC. The compressive strength of AAGC showed a retrogression phenomenon from 3 to 28 days, with the 14-day and 28-day compressive strengths of AAGC being higher than those of OPC. The AAGC with 20% FA content exhibited the highest 28-day compressive strength (75 MPa). The hydration heat release rate curve of OPC and AAGC was divided into the initial induction period, induction period, acceleration period, deceleration period, and steady period. As FA content increased, the 28-day pore volume of AAGC increased, while pH values and chemically bound water decreased. SEM images of AAGC with low FA content showed more microcracks.
1. Introduction
Apart from water, concrete is the most widely used material on Earth and is also a significant contributor to CO2 emissions, accounting for 7.5% of total global emissions. CO2 emissions from Portland cement in concrete are particularly high [1], representing approximately 5% of global carbon emissions [2]. Clinker, which constitutes 65–85% of Portland cement, is responsible for 90–98% of these emissions [3]. Therefore, reducing the proportion of clinker in Portland cement and developing new low-carbon clinkers, along with decreasing energy consumption during clinker production, are the key strategies for lowering CO2 emissions in concrete [1,4]. Alkali-activated cementitious materials are considered an environmentally friendly alternative to Portland cement. These materials, which include cementitious active materials and activators, are produced through a relatively simple process. Their primary raw materials are solid wastes from the metallurgical industry, such as ground granulated blast furnace slag (GBFS), fly ash (FA), and steel slag [5,6]. The production and utilization of alkali-activated cementitious materials can significantly reduce energy consumption and CO2 emissions in concrete production, thus contributing to the protection of both social and ecological environments.
FA has low cementitious activity. When FA is added, the compressive strength of alkali-activated cementitious materials decreases, while plasticity increases [7,8,9,10]. The incorporation of slag increases the strength [8]. It has been observed that a retrogression phenomenon occurs in the compressive and flexural strength of water glass-activated FA-GBFS cement products under different curing conditions at the same age [11]. With the increase in the phosphor gypsum content, the compressive strength of alkali-activated FA-GBFS cement increases, and the setting time shortens [12]. Increasing the amount of Na2SiO3∙5H2O enhances the dissolution of raw materials such as GBFS and FA during the hydration process, increases the compressive strength of alkali-activated FA-GBFS cement, and increases the pH value [13]. With a GBFS content of 40–50%, the early compressive strength of cementitious materials reaches approximately 90% of the 28-day strength [14].
With a steel slag content of 20%, an alkali content of 6%, and a water glass modulus of 1.2, the 28-day compressive strength of AAGC is relatively high. As the water–cement ratio decreases, the compressive strength at the same age increases [15]. As the carbide slag content increases, the 28-day compressive strength of AAGC materials gradually decreases [16]. With increased GBFS content, the compressive strength and fluidity of geopolymer mortar improve, and the normal consistency water requirement decreases [17]. Increasing the coal slag content enhances the fluidity and late strength of GBFS-based geopolymer. With more electrolytic manganese residue, the setting time and fluidity of GBFS-based geopolymer decrease [18]. Increasing the GBFS content shortens the setting time and increases the compressive strength of geopolymer paste [19]. The mechanical and frost resistance properties of water glass-activated CACG (calcined coal gangue)–GBFS cementitious materials are superior to those of OPC, with GBFS contributing to the mechanical performance and frost resistance of the cementitious materials [20]. Pu et al. [21] prepared an FA–phosphoric acid geopolymer and found that with 50% phosphoric acid content, the geopolymer exhibited better water resistance and compressive strength. Wang et al. [22] used circulating fluidized bed FA, ground granulated blast furnace slag, and lime to prepare cementitious materials, achieving a 28-day compressive strength of up to 33.44 MPa. Huang et al. [23] discovered that the incorporation of Ca(OH)2 in alkali-activated GBFS cement can significantly increase compressive strength and decrease fluidity, while the incorporation of CaSO4∙2H2O decreases both compressive strength and fluidity. Naqi et al. [24] established a linear relationship equation between the compressive strength and hydration heat of NaOH-activated GBFS cement mortar, with the Na2O content affecting the long-term mechanical properties of the mortar. Chen et al. [25] found that increasing the curing temperature reduced the 1-day and 28-day compressive strength of alkali-activated water glass-activated GBFS cement mortar and effectively alleviated drying shrinkage. Guan [26] found that, compared to room temperature curing, both thermal curing and microwave curing improved the early compressive strength of water glass-activated FA cement.
Furthermore, numerous researchers have conducted studies on the hydration properties, microstructure, and pH of various types of alkali-activated cementitious materials.
AAGC materials contain multiple gels such as C-A-S-H, N-A-S-H, and C-S-H [27]. In NaOH, water glass, and Na2CO3-Na2SO4-Ca(OH)2-activated GBFS cementitious materials, the main hydration products are C-S-H and a hydrotalcite-type phase, with chemically bound water increasing with age [28,29]. During the co-activation of Na2CO3 and calcium carbide residue (CCR) in GBFS cement, CO32− ions are initially removed, generating OH− ions in the aqueous phase to enhance alkalinity, and Ca2+ ions promote the polymerization of C-A-S-H type gels, accompanied by the formation of other calcium-containing products such as calcite, calcium hemicarboaluminate, and calcium monocarboaluminate [29]. Ahmad et al. [30,31] utilized flue gas residues, air pollution control residue, and commercial sodium silicate for co-activation in FA-GBFS cement, with the main hydration products being N-A-S-H, C-N-A-S-H, and C-A-S-H. The co-activation of NaOH and Na2CO3 in GBFS cement primarily produced calcite and gaylussite as hydration products [32]. In sodium silicate-activated FA-GBFS cement, carbonation led to the decalcification of C-A-S-H gels and the formation of calcium carbonate and silica gel, while N-A-S-H gels remained largely unchanged after carbonation, with the primary carbonate phase being calcite, and water glass modulus increased, leading to the formation of vaterite and aragonite [33]. The incorporation of incinerator FA hindered the formation of gel in the paste and reduced the compressive strength of alkali-activated GBFS cement [34]. GBFS facilitates the transformation of N-A-S-H gels into C-A-S-H gels, thus improving compressive strength and water impermeability. The addition of 30% red mud hindered the formation of N-A-S-H gels, resulting in more flocculent loose hydration products, and decreased mechanical strength and impermeability [35].
Regarding the hydration properties of alkali-activated cementitious materials, the addition of superabsorbent polymer reduced the drying shrinkage of AAGC mortar, improved compressive strength to some extent, and delayed the hydration heat release rate [36]. Nedunuri et al. [37] reported low cementitious activity of FA [8]. As the FA content increased, the setting time of AAGC increased, and the hydration heat release rate slowed down; the smaller the particle size of GBFS, the shorter the induction period of hydration of Na2CO3-activated FA-GBFS cement, promoting the formation of C-(N)-S-A-H and calcite [38]. The reaction rate of NaOH-activated FA cement primarily depends on the particle size distribution of FA, FA composition, and NaOH concentration [39].
Under different drying conditions, the test results of hydration products of alkali-activated GBFS cement showed small differences in product type but significant differences in the pore structure [40]. With the incorporation of flue gas desulfurization gypsum (DG), the early strength of alkali-activated FA-GBFS cement increased. SO42− in DG continuously reacts with Ca2+ and reactive silicates to form ettringite, which can fill micropores and microcracks, forming a denser matrix structure [41]. The incorporation of basic oxygen furnace slag altered the workability and setting time of AAGC, reducing microcracks in the microstructure [42]. Under low-temperature oxidation conditions, the type of hydration products inside the alkali-activated FA-GBFS cement paste remained consistent, but the quantity of hydration products varied, harmful pores increased, and the compressive strength of the mortar decreased [43]. Song et al. [44] reported that the addition of steel slag (SS) and GBFS increased the compressive strength before and after the curing of composite cementitious materials and reduced the porosity of the paste. With the increase in alkali content and quicklime content, the fluidity of alkali-activated GBFS-SS cement decreased, and the setting time shortened. As the age increased, the hydration of the paste was sufficient, and the porosity decreased [45].
With 2.5% CaO and 5% Na2CO3 co-activation, GBFS cement exhibited better microstructure and compressive strength. Chemically bound water increased with age [46]. When the cool air slag–GBFS content was 20%, the compressive strength and chemically bound water of alkali-activated GBFS cementitious materials were highest, and with an increase in curing age, the chemically bound water of the cementitious materials gradually increased [47]. The trend of chemically bound water and compressive strength growth of AAGC within 28 days was consistent [48].
In alkali-activated ferronickel slag cementitious materials, the pH of the slurry did not change significantly within 3–120 min but gradually decreased after more than 120 min [49]. At the same age, the pH of the sealed FA-GBFS cement paste was lower than that of the unsealed paste, possibly due to the loss of Na+ and OH− in the unsealed paste [50]. In the AAGC paste, the concentration of Ca2+, Si4+, Al3+, and Mg2+ was correlated with the solution pH. When the solution pH was high, the concentrations of Al3+ and Si4+ were higher, while the concentrations of Ca2+ and Mg2+ were lower. A solution pH greater than 11.5 was favorable for the hydration reaction of AAGC [51]. With an increase in the steel slag content, the presence of f-CaO in the steel slag increased the pH of the AAGC paste [52].
Under an 80 °C curing temperature, the incorporation of glass microsphere waste and quartz powder in alkali-activated FA-GBFS cement improved the compressive strength and acid resistance [53]. Replacing 10–25% of GBFS with glass powder, feldspar, and metakaolin significantly improved the heat resistance and chloride ion penetration resistance of GBFS [54].
In summary, numerous scholars have studied the cementitious activity of FA and GBFS, finding that the cementitious activity of GBFS is higher than that of FA. Additionally, the effects of single activators and composite activators on the performance of cementitious materials have been investigated, with findings indicating that the activation effect of water glass is superior. Previous researchers have rarely compared the mechanical and hydration properties of alkali-activated materials with OPC. Additionally, studies on the compressive and flexural strength of alkali-activated cementitious materials at different days within the 28-day age are relatively limited. This study aims to reveal the correlation between the variation in the FA content and the hydration performance and compressive strength of AAGC. This research investigates the trends and differences in the compressive strength and flexural strength of AAGC from 3 to 28 days under varying contents of OPC and FA while also exploring the differences in hydration performance of AAGC with varying contents of OPC and FA.
Therefore, we designed six FA content levels (0, 10%, 20%, 30%, 40%, and 50%) of alkali-activated granulated blast furnace slag cement (AAGC) and used OPC42.5 as a reference group to test the compressive and flexural strength of AAGC and OPC42.5 from 3 to 28 days (3 d, 7 d, 14 d, and 28 d). We analyzed the strength development trends and age-related strength differences between AAGC and OPC, tested the hydration heat of AAGC and OPC 42.5, investigated the effect of the FA content on the hydration heat of AAGC, and analyzed the differences in hydration heat compared to OPC 42.5. To further study the strength development trends and hydration heat mechanism of AAGC, we performed XRD, TGA, SEM, and MIP, as well as pH and chemically bound water analyses, to comprehensively explain the correlation between various performance data and the strength and hydration heat of AAGC. This research aims to provide data support for the promotion and application of AAGC.
2. Materials and Methods
2.1. Materials
Ground granulated blast furnace slag (GBFS), FA, and OPC42.5 were provided by Hebei Construction Group Co., Ltd. (Baoding, China). OPC42.5 was used for comparing the strength and hydration heat of composite cementitious materials. Sodium silicate nonahydrate (water glass) was of analytical grade, purchased from Tianjin Huashi Chemical Reagent Co., Ltd. (Tianjin, China), and tap water was used in the laboratory.
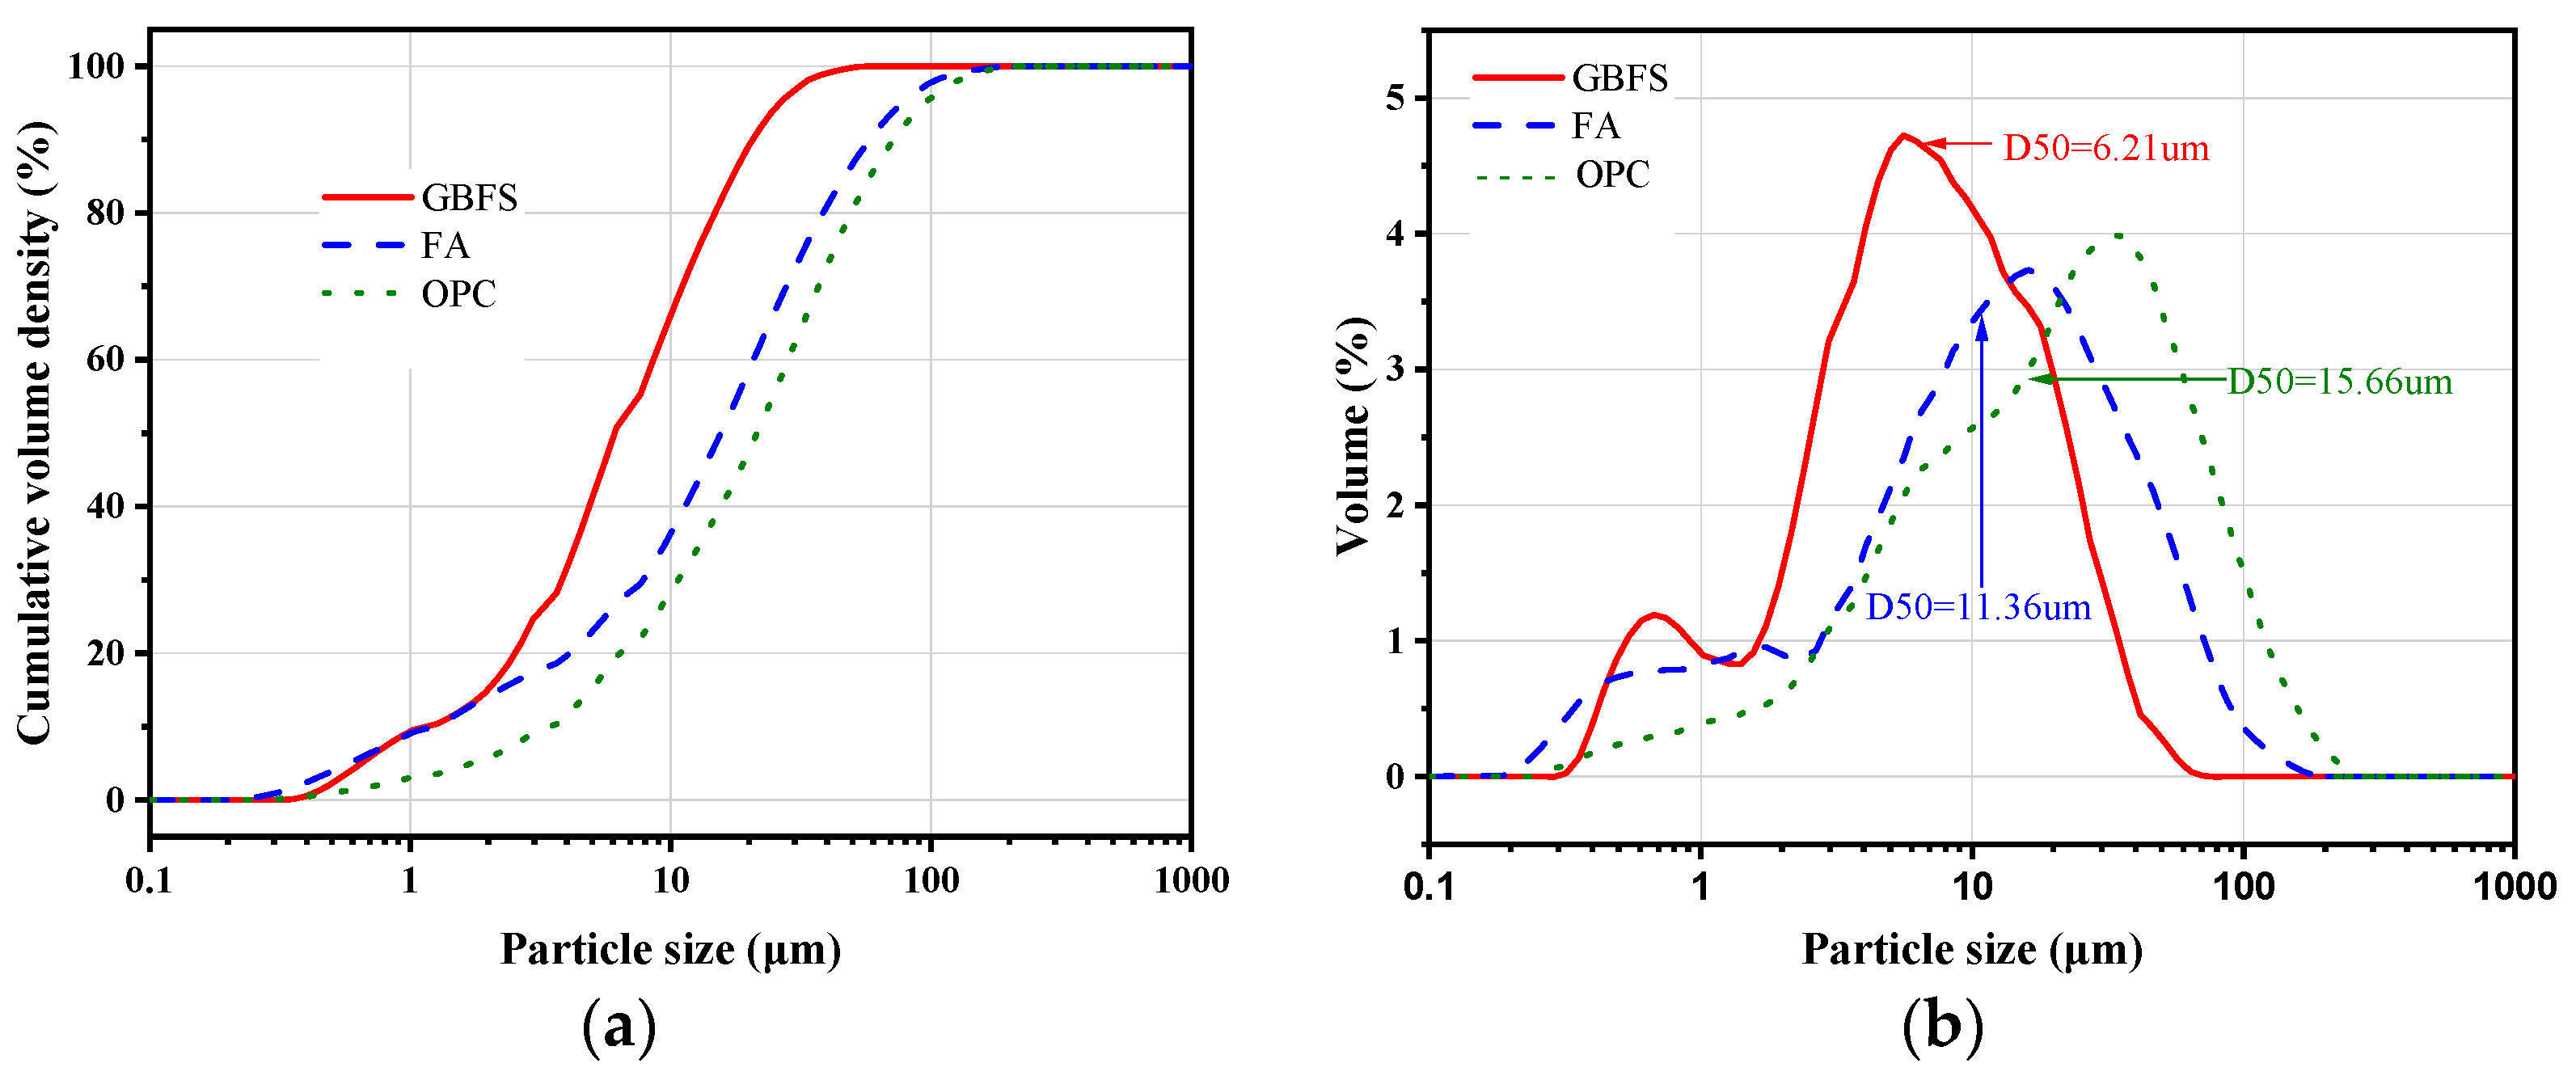
The chemical composition of the raw material powders was tested using the X-ray method, with the equipment being PANalytical Axios (Netherlands). The chemical composition is shown in Table 1. The microscopic morphology of the raw material powder is shown in Figure 1. The particle size distribution of the raw material powders was tested using a BT-9300S laser particle size analyzer (China), with D50 values of 6.21 μm and 11.36 μm, as shown in Figure 2. The density and specific surface area are shown in Table 2. The specific surface area and density of the raw material powders were tested according to GB/T 8074 [55] and GB/T 208 [56].

Table 1.
Main composite of materials.
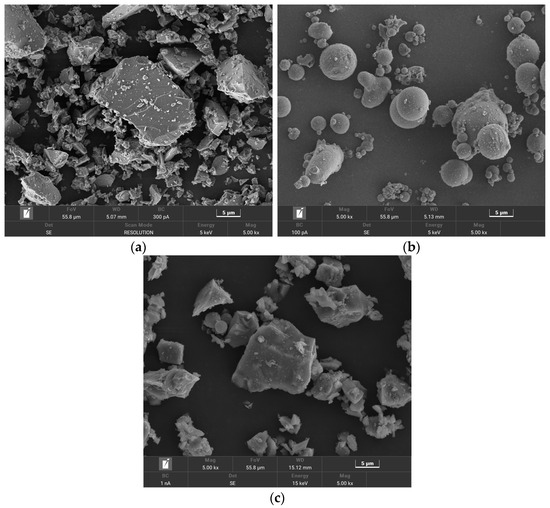
Figure 1.
Morphology of (a) GBFS; (b); FA; (c) OPC.

Figure 2.
The particle size distribution of materials: (a) cumulative volume; (b) particle volume.
Table 2.
Density and specific surface area of materials.
The GBFS hydraulic coefficient was determined as follows:
2.2. Mixture Proportions and Specimen Preparation
Using FA as a variable, with a Na2O-to-powder mass ratio of 0.03 and a water-to-cement ratio of 0.4, a total of seven mix designs were developed, labeled as OPC, FA-0, FA-10, FA-20, FA-30, FA-40, and FA-50, as shown in Table 3.
Table 3.
Mix proportions.
The water and sodium silicate used in the mix designs were dissolved and cooled to room temperature for later use. GBFS, FA, and the sodium silicate solution were sequentially added to the mixer and stirred for 2 min. The stirred slurry was poured into 40 mm × 40 mm × 160 mm molds. After curing at room temperature for one day, the molds were removed, and the specimens were cured under conditions of 20 ± 2 °C and relative humidity not less than 95%.
2.3. Methods
2.3.1. Compressive Strength and Flexural Strength
The strength of the neat paste specimens was tested according to GB/T 17671 [57]. The compressive and flexural strengths of the neat paste specimens were tested at 3 days, 7 days, 14 days, and 28 days.
2.3.2. Isothermal Calorimetry Analysis
In this study, the early hydration heat effects of alkali-activated slag–FA paste were tested using isothermal calorimetry, according to GB/T 12959 [58]. The equipment used in this study was model SHR-16 from Jingqiang (Tianjin) Test Instrument Technology. First, the materials required to prepare cement paste were placed in a constant temperature laboratory at 20 °C for 24 h. Then, AAGC was mixed uniformly at 20 °C and poured into the test container, sealed with soft clay, and placed in a 20 °C constant temperature water bath. During the early hydration period (7 days) of AAGC paste specimens, temperature changes were continuously monitored to study the heat effects of early hydration.
2.3.3. Chemically Bound Water and pH Values
The mixed paste specimens were placed into sealed plastic tubes and cured under the specified conditions. At predetermined ages, small amounts of the hardened paste were soaked in acetone to stop hydration and then ground to a fine powder. The samples were dried in a vacuum oven at 80 °C until a constant weight was reached. Using an electronic balance, approximately 2 g of the sample was weighed with an accuracy of 0.001 g, and this mass was recorded as m80. The weighed sample was then placed into a crucible and heated in a muffle furnace to 1060 °C until a constant weight was achieved, recorded as m1060. Considering that raw materials also lose mass during burning, the results were corrected. The chemically bound water (Wne) of the final sample was calculated using the following formula:
where LS and Lfa are the loss on ignition for slag and FA, respectively, and α and β are the mass fractions of slag and FA in the composite cementitious material system.
At the appropriate age, a small amount of hardened paste was dried in a vacuum oven at 80 °C and ground. A small amount of the ground sample was sieved using a 200-mesh sieve (sieve aperture size 0.075 mm). About 1 g of the sieved sample was weighed and placed into a beaker, to which 10 g of deionized water was added. The mixture was stirred with a magnetic stirrer for 10 min and then left to stand for 2 h. The pH value of the supernatant was then measured using a pHS-2C pH meter.
2.3.4. Scanning Electron Microscopy (SEM) and Mercury Intrusion Porosimetry (MIP) Analyses
Representative samples from each group at the appropriate ages were broken into pieces and soaked in anhydrous ethanol to stop the hydration of the hardened paste. The microstructural characteristics of the alkali-activated slag mortar were analyzed using a Czech TESCAN MIRA LMS scanning electron microscope (SEM). Before SEM analysis, the samples were removed from the ethanol, vacuum-dried, and sputter-coated with gold for 120 s to enhance conductivity.
At the appropriate ages, a small amount of intact hardened paste was soaked in anhydrous ethanol to stop hydration. The samples were dried to constant weight in a vacuum oven at 80 °C, and the pore structure was tested using a Micromeritics Auto Pore V 9620 automatic mercury intrusion porosimeter.
2.3.5. Characterization
After curing to the test age, the neat paste specimens were broken into small pieces and soaked in anhydrous ethanol (≥48 h) to stop hydration. They were then dried in a vacuum oven at 40 °C (≥48 h), ground, sieved through an 80 μm sieve, and the powder samples were bagged and labeled for qualitative analysis of the mineral composition of hydration products at different test ages.
The mineral composition was tested using a Japanese Rigaku Ultima IV X-ray diffractometer. The target material was Cu, with a working voltage of 40 V and a working current of 30 mA. The scanning speed was 2°/min, and the scanning angle ranged from 10° to 80° (2θ).
The functional groups of the hydration products in the alkali-activated slag–FA cementitious materials were analyzed using an American Thermo Fisher Scientific Nicolet iS20 Fourier transform infrared spectrometer (FTIR). The analysis was conducted in the frequency range of 4000–400 cm−1, with a resolution of 4.0 and 128 scans.
Thermogravimetric analysis (TGA) followed the same sample preparation process as XRD. Approximately 10 mg of the prepared powder sample was placed in an alumina crucible. Under nitrogen protection, the sample was tested using a differential scanning calorimeter with a heating rate of 10 °C/min, increasing from 50 °C to 900 °C, to quantitatively analyze the changes in hydration product content at different test ages.
3. Results
3.1. Compressive Strength and Flexural Strength
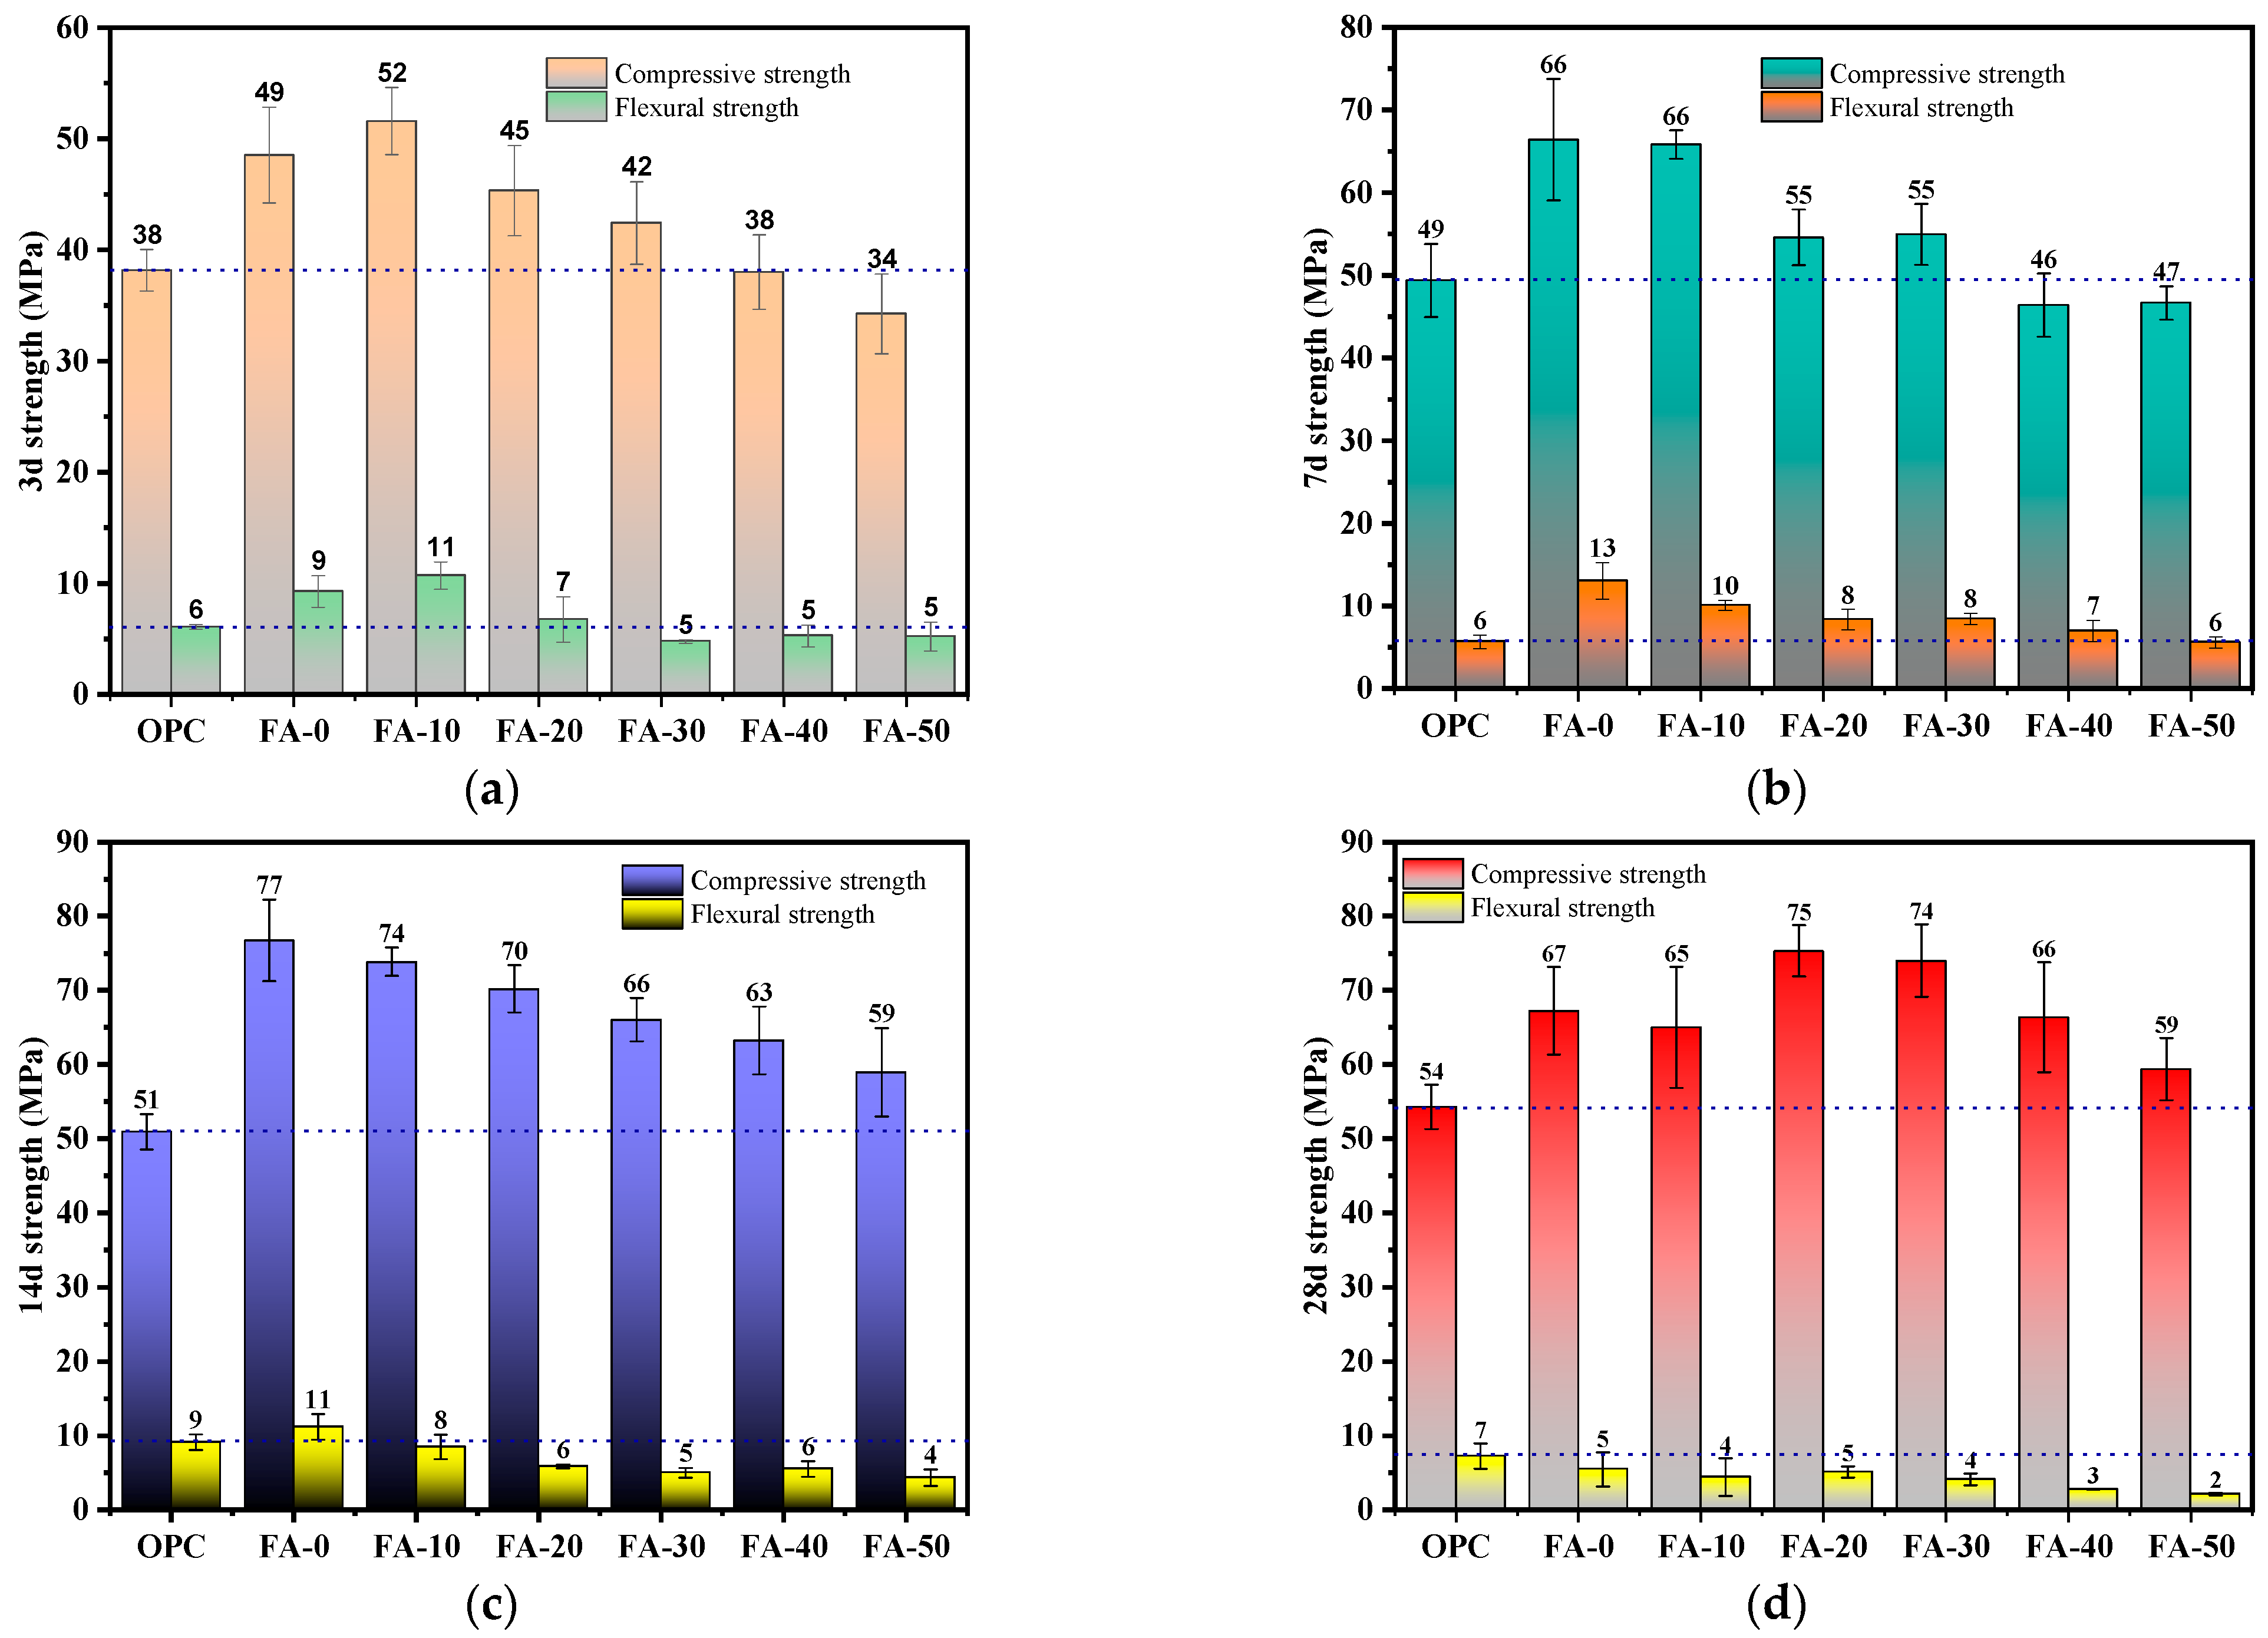
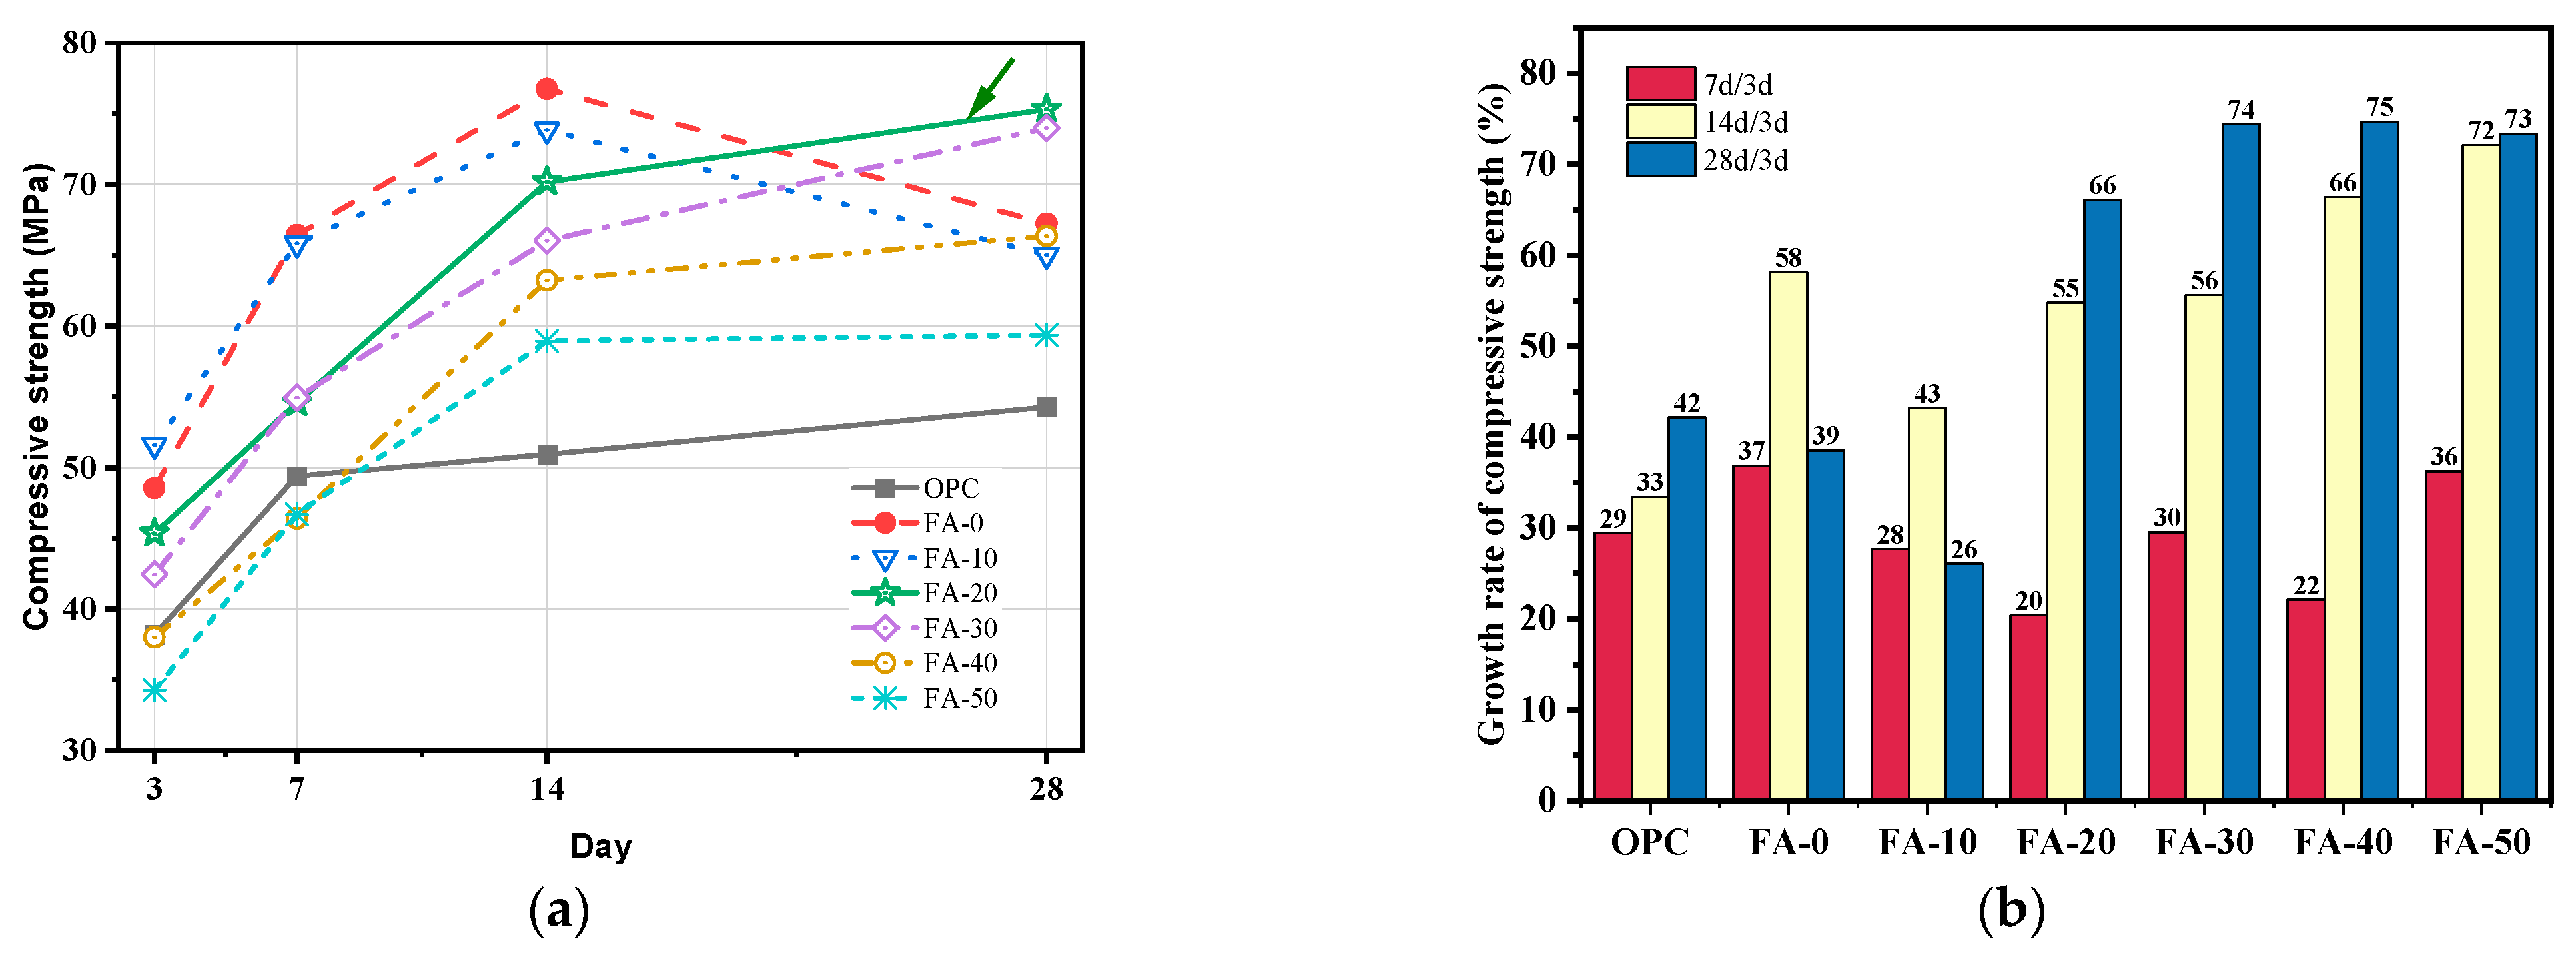
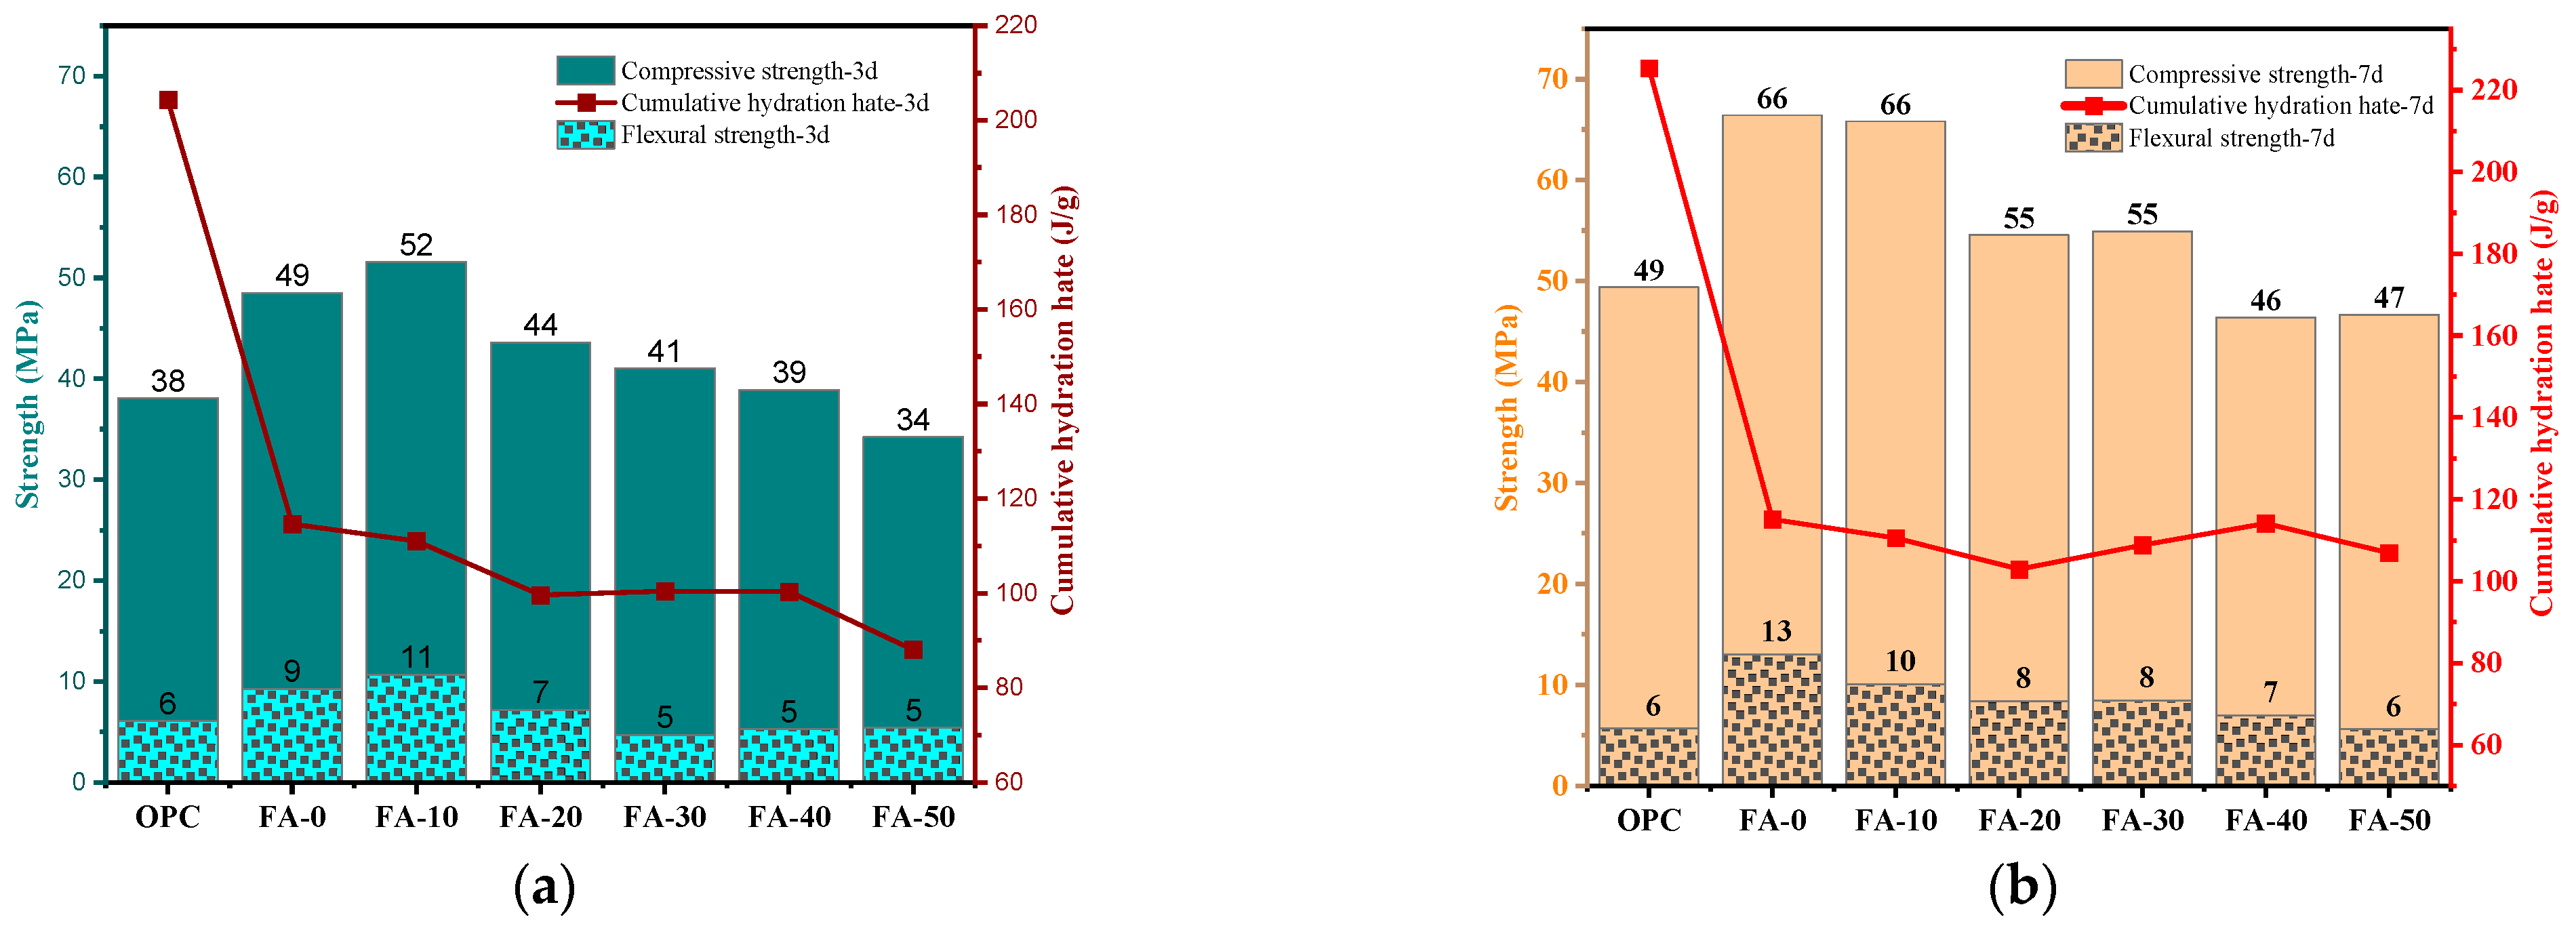
As shown in Figure 3a, the 3-day compressive strength of OPC is 38.16 MPa. With an increase in the FA content, the compressive strength of AAGC paste specimens shows a decreasing trend. The 3-day compressive strengths of FA-10 and FA-0 are the highest, with strength values of 51.59 MPa and 48.53 MPa, respectively, which are 35% and 27% higher than that of OPC. The 3-day compressive strength of OPC is higher than that of FA-40 and FA-50 [14,34,35], at 6.06 MPa. The flexural strength of AAGC paste specimens follows the same trend as the compressive strength, showing a decreasing trend with the increase in the FA content. AAGC cementitious materials exhibit relatively high shrinkage [59], which leads to the formation of numerous microcracks in the paste. In the 28-day paste of FA-0, a higher number of microcracks are observed. Additionally, due to the relatively low cementitious activity of fly ash, it primarily serves a filling role and improves the pore structure of the cementitious material in the early stages [60]. As a result, the experiment shows that FA-10 exhibits the highest compressive strength at 3 days. The 3-day flexural strengths of FA-10 and FA-0 are the highest, at 10.7 MPa and 9.26 MPa, which are 76% and 52% higher than that of OPC, respectively. The 3-day flexural strength of OPC is higher than that of FA-30, FA-40, and FA-50 [14,44]. The low cementitious activity of FA and the increase in the FA content delay the hydration reaction of AAGC paste, resulting in fewer hydration products, thus affecting the compressive and flexural strength of AAGC paste [7,8].

Figure 3.
The compressive strength and flexural strength of AGGC with different FA contents: (a) 3 d; (b) 7 d; (c) 14 d; (d) 28 d.
As shown in Figure 3b, the 7-day compressive strength of OPC is 49.38 MPa, which is higher than the compressive strength of FA-40 and FA-50. The 7-day compressive strengths of FA-0 and FA-10 are the highest, at 66.42 MPa and 65.83 MPa, respectively, which are 34% and 33% higher than that of OPC paste [14,19]. The 7-day flexural strength of OPC is 5.66 MPa. The 7-day flexural strengths of FA-0 and FA-10 are the highest, at 13.03 MPa and 10.06 MPa, respectively, which are 130% and 77% higher than that of OPC [44]. With the increase in the FA content, the compressive and flexural strengths of AAGC paste specimens show a decreasing trend.
As shown in Figure 3c, the 14-day compressive strength of OPC is 50.92 MPa, with a slight increase compared to the 7-day compressive strength. The 14-day compressive strengths of AAGC paste specimens with different ratios are all higher than that of OPC paste. The 14-day compressive strengths of FA-0 and FA-10 are the highest, at 76.75 MPa and 73.85 MPa, respectively, which are 50% and 45% higher than that of OPC paste. With the increase in the FA content, the 14-day compressive strength of AAGC paste specimens shows a linear decrease [53]. The 14-day flexural strengths of OPC and FA-0 are 9.11 MPa and 11.16 MPa, respectively. The 14-day flexural strength of FA-0 is 22% higher than that of OPC. The 14-day flexural strengths of FA-10, FA-20, FA-30, FA-40, and FA-50 are all lower than that of OPC. With the increase in the FA content, the 14-day flexural strength of AAGC paste specimens shows a decreasing trend.
As shown in Figure 3d, the compressive strengths of the specimens at all different ratios are higher than that of OPC. With the increase in the FA content, the compressive strength first increases and then decreases. The compressive strengths of AAGC with 20–30% FA content are the highest, at 75 MPa and 74 MPa, respectively, which are 38% and 37% higher than that of OPC [9,19]. The 28-day flexural strengths of AAGC specimens are all lower than that of OPC. With the increase in the FA content, the 28-day flexural strength of AAGC paste specimens shows a decreasing trend [44].
As shown in Figure 4, the compressive strength of OPC increases from 3 to 28 days, with a slower growth trend from 7 to 28 days. For FA-0 and FA-10, the compressive strength increases first and then decreases from 3 to 28 days, with the highest strength at 14 days. The strength growth rate from 3 to 14 days is 58% and 43%, respectively, while from 14 to 28 days, the compressive strength declines, with the growth rate from 3 to 28 days being 39% and 26% [11,61]. Srinivasamurthy et al. found that under different curing conditions at the same age, the compressive strength of water glass-activated FA-GBFS cement exhibited a decreasing phenomenon. For FA-20, FA-30, FA-40, and FA-50, the compressive strength shows an increasing trend from 3 to 28 days, with a smaller increase at 7 days and a growth rate between 20 and 36%. The compressive strength increases significantly from 14 to 28 days, with the growth rate from 14 to 28 days ranging from 55 to 73%, which increases with the FA content, and the growth rate from 3 to 28 days is 66–75%.

Figure 4.
The compressive strength development of each mix: (a) 3–28 d; (b) growth rate of compressive strength.
From 0 to 3 days, the compressive strength of FA-0 and FA-10 is high due to the high cementitious activity of GBFS, high hydration rate, and production of a large number of hydration products, resulting in high early compressive strength. When the FA content exceeds 10%, the low cementitious activity of FA slows the hydration exothermic rate of AAGC paste, forming fewer hydration products and thus resulting in a lower compressive strength. From 7 to 28 days, when the FA content is not less than 20%, the hydration reaction of FA becomes dominant, leading to a high growth rate of compressive strength for AAGC paste specimens. Comparing the compressive strength growth data of OPC paste and AAGC paste specimens, it is found that the compressive strength of OPC paste grows slowly after 7 days, while the compressive strength of AAGC paste specimens increases significantly from 7 to 14 days and decreases or grows slowly after 14 days.
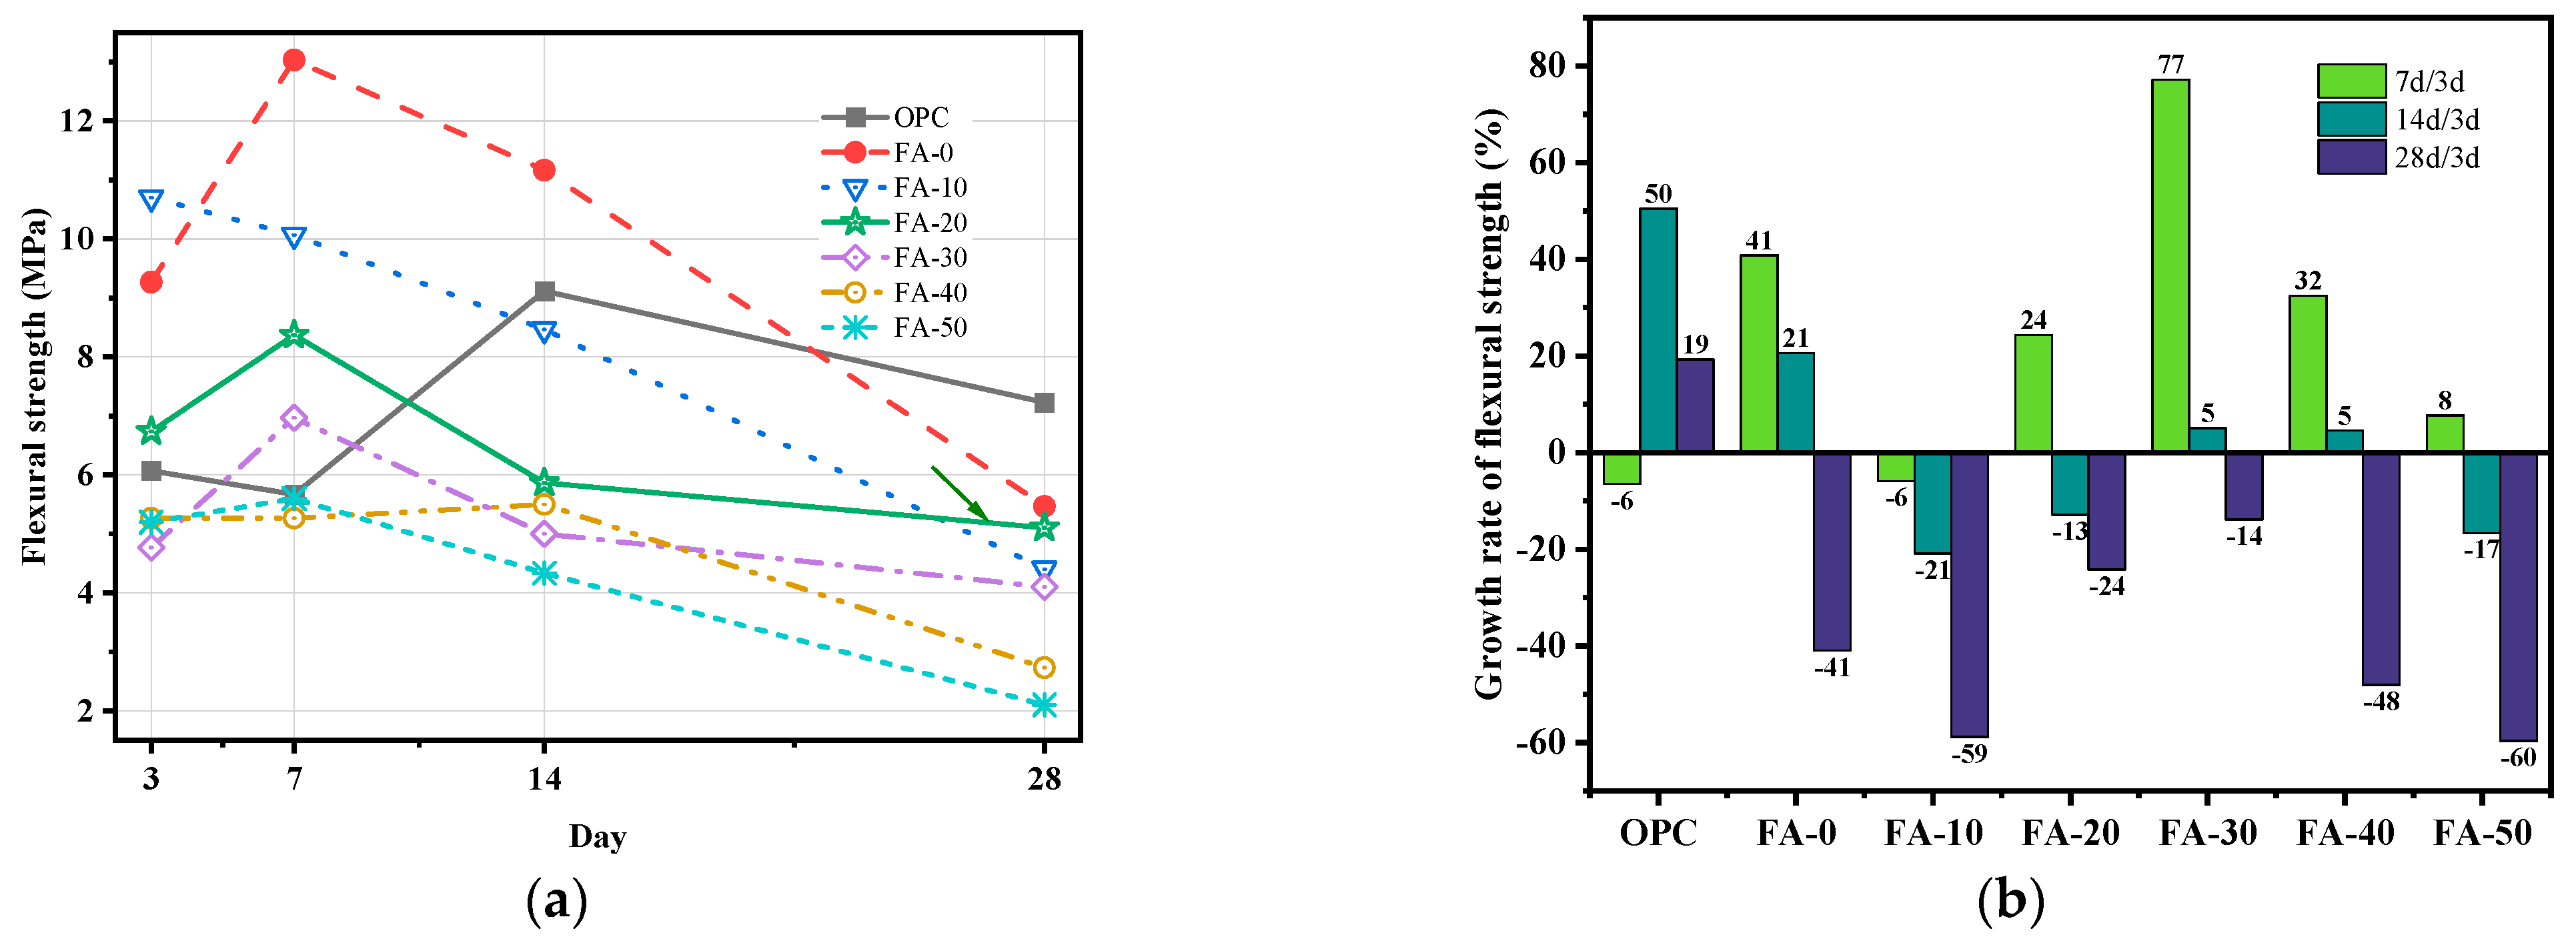
As shown in Figure 5, both OPC and AAGC paste specimens exhibit a decreasing trend in flexural strength. From 3 to 28 days, the flexural strength of OPC is highest at 14 days, and the 28-day flexural strength is higher than that of AAGC paste. As the age increases, the flexural strength of FA-10 decreases in a linear fashion. The 7-day flexural strengths of FA-0, FA-20, FA-30, and FA-50 are the highest, with a growth rate of 8–77%, while the 28-day flexural strength is lower than the 3-day flexural strength, with a growth rate of −14% to −60%.

Figure 5.
Flexural strength development of each mix: (a) 3–28 d; (b) the growth rate of compressive strength.
Comprehensively analyzing the data from Figure 3, Figure 4 and Figure 5, it can be seen that the high cementitious activity of GBFS contributes to the compressive and flexural strengths of AAGC paste from 0 to 3 days, mainly due to the rapid hydration of GBFS. The rapid hydration of GBFS causes quick shrinkage of the paste, leading to the formation of microcracks within the paste. As the age increases, the development and number of microcracks increase, causing a decrease in the compressive and flexural strengths of AAGC paste samples with a low FA content, especially impacting the flexural strength. From 7 to 28 days, the hydration reaction of FA becomes dominant, and the increase in the FA content leads to a higher growth rate of compressive strength in AAGC paste samples. Considering the development of compressive and flexural strengths with different ratios, FA-20 exhibits relatively stable mechanical properties.
3.2. Isothermal Calorimetry Analysis
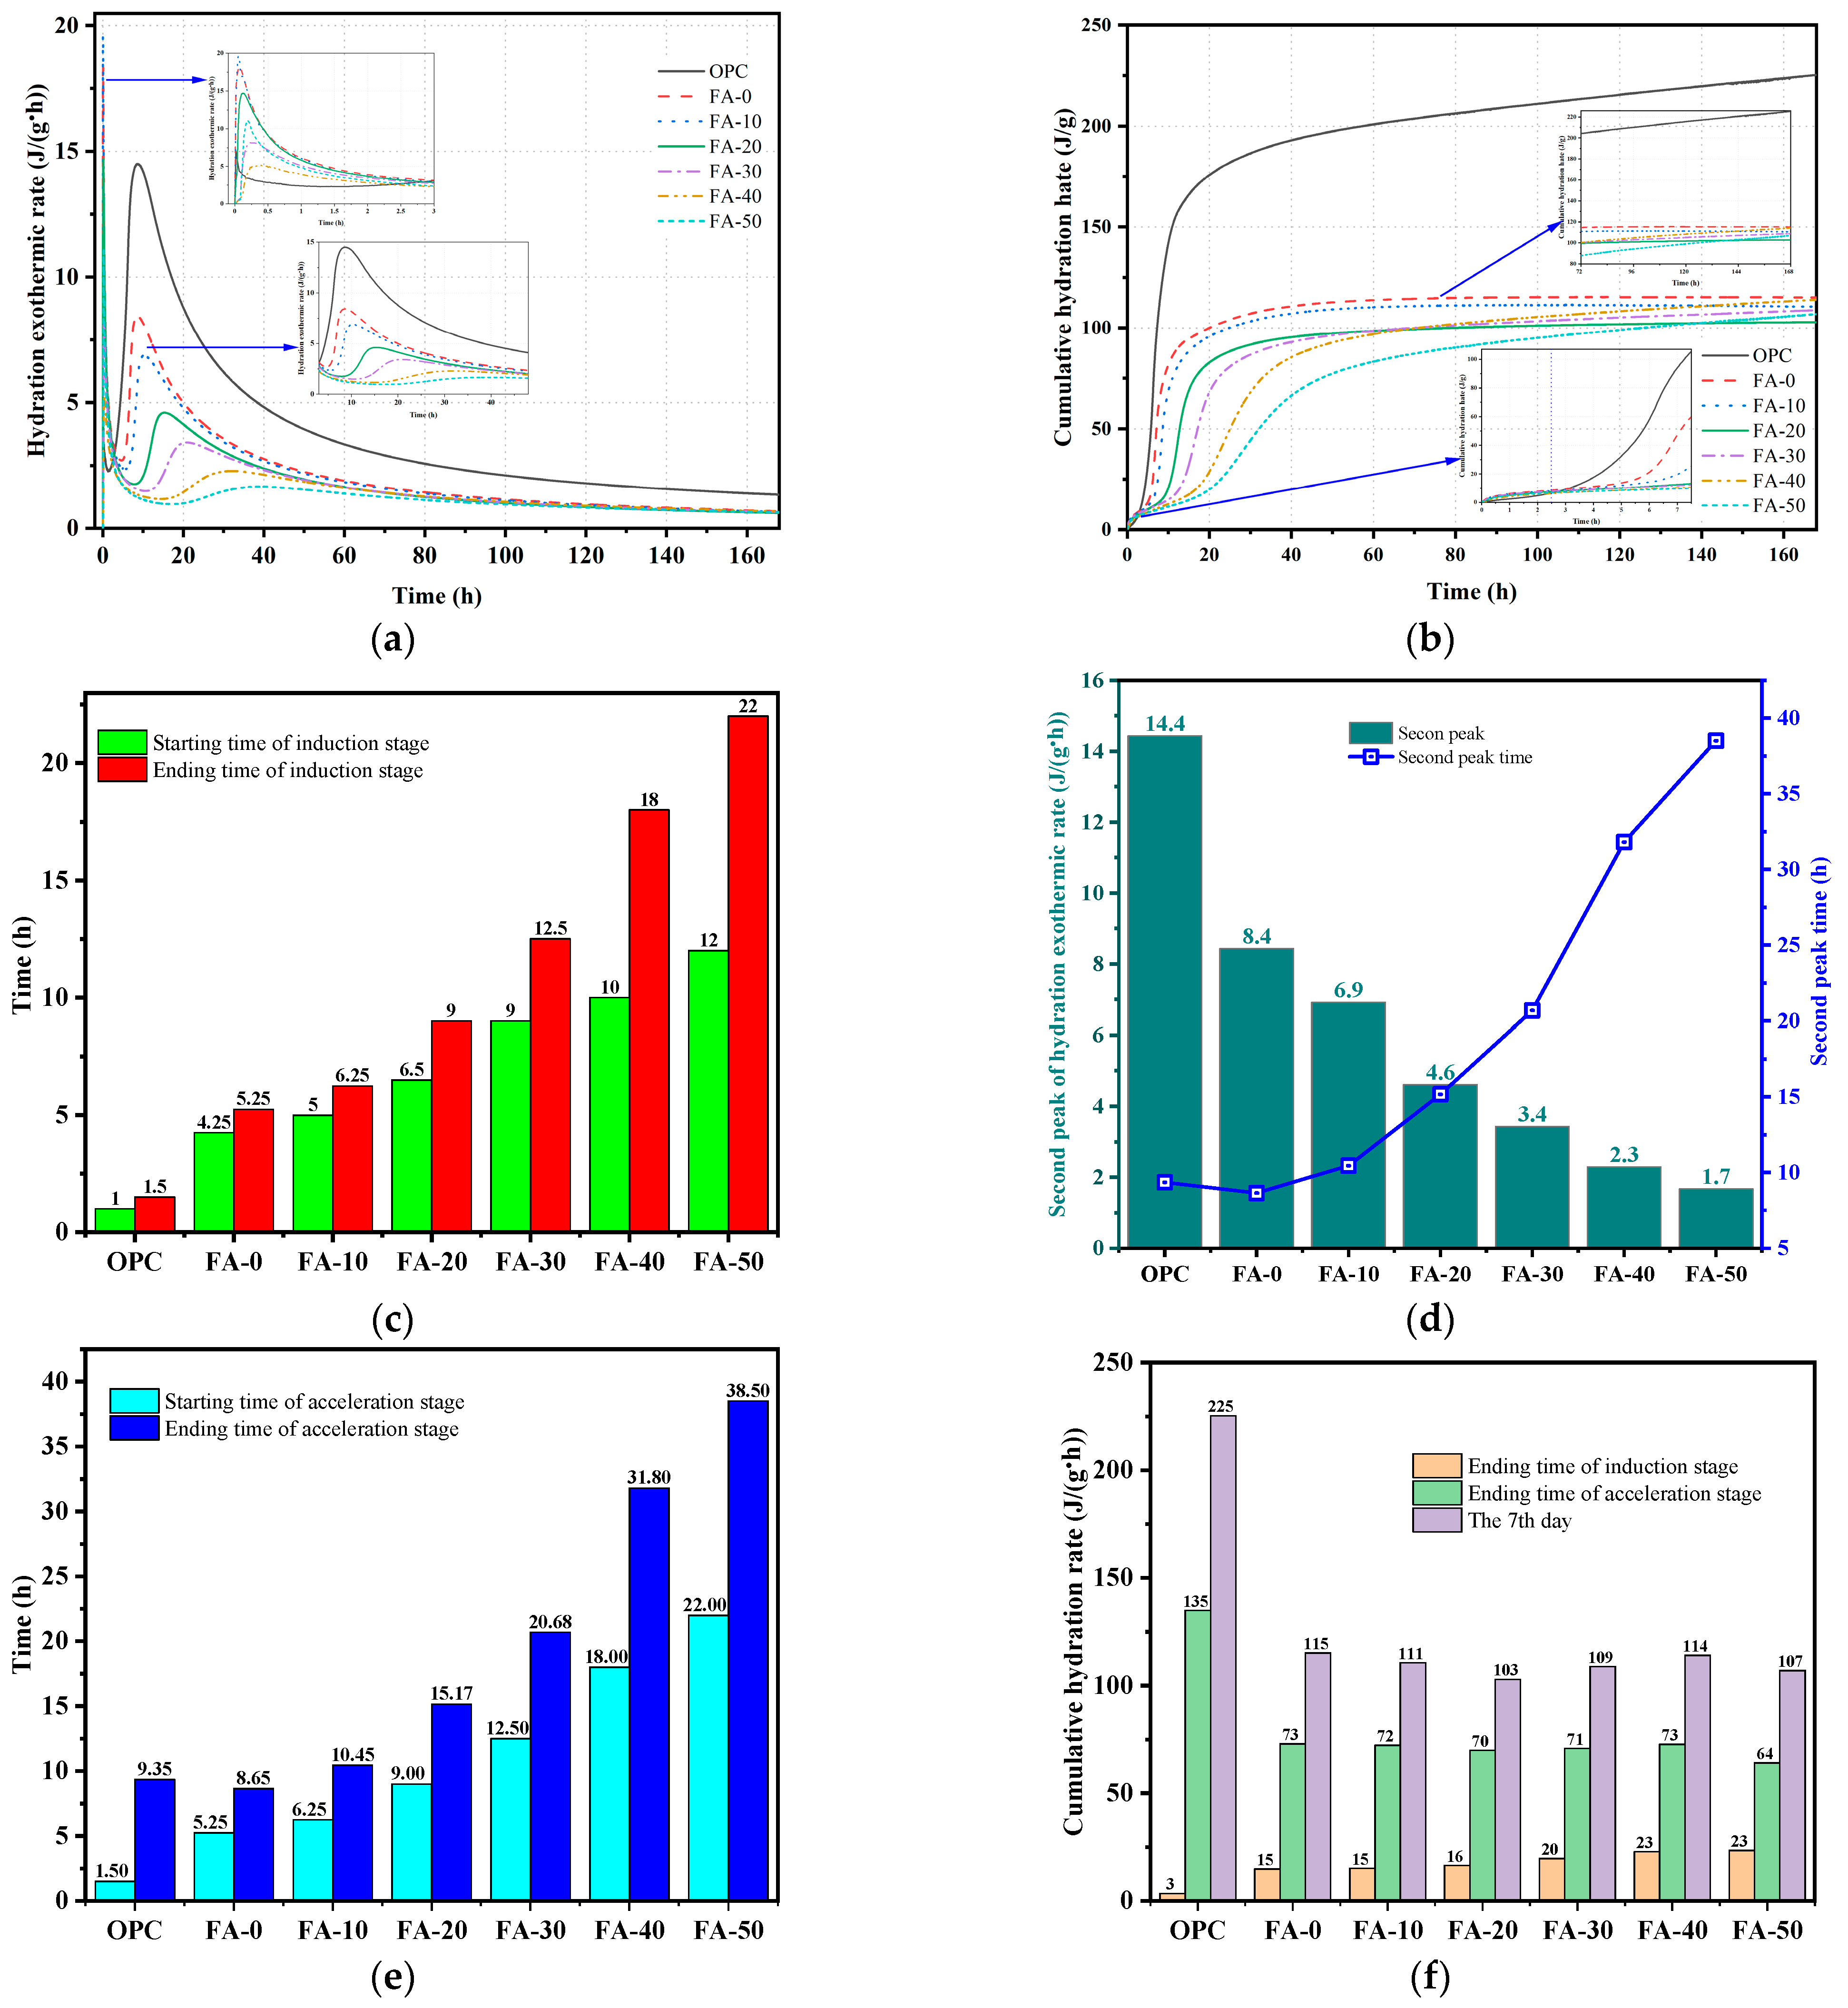
Figure 6 shows the hydration heat curves of OPC and AAGC. When the paste mixture is placed in the isothermal calorimeter, an exothermic peak appears within a few minutes [62]. The hydration curves of OPC and AAGC are similar to those of tricalcium silicate in Portland cement clinker and can be divided into five stages: pre-induction, induction, acceleration, deceleration, and a steady state [63]. However, the cumulative hydration heat and the hydration heat rate at each stage differ between OPC and AAGC.

Figure 6.
Hydration heat results of OPC and AAGC: (a) hydration exothermic rate; (b) cumulative hydration rate; (c) induction stage; (d) acceleration stage; (e) start and end times of acceleration stage; (f) cumulative hydration rate at different stages.
Pre-induction Stage: As shown in Figure 6a, both OPC and AAGC exhibit a peak value within a short period. For OPC, this peak is due to the rapid hydration of C3S and C3A, with a peak heat release rate of 7.049 J/(g∙h) [63]. For AAGC, the release of surface energy from GBFS and FA particles, along with the dissolution of Si, Al, and Ca from GBFS and FA in the water glass solution, contributes to the initial exothermic peak [64,65]. Except for FA-40, the peak heat release rates of the other AAGC samples are higher than those of OPC. As the FA content increases, the initial exothermic peak gradually decreases, with peak values ranging from 5.178 to 19.610 J/(g∙h), indicating that, in an alkaline environment, GBFS has higher cementitious activity than FA [66].
Induction Stage: As shown in Figure 6c, the induction period for OPC begins the earliest, approximately 1 h into the hydration reaction, and lasts the shortest, about 0.5 h. During this stage, the heat release rate of OPC is lower than that of AAGC [67]. As the FA content increases, the start time of the induction period for AAGC is delayed, ranging from approximately 4.25 to 12 h, and the duration of the induction period extends, lasting approximately 1 to 10 h [68]. This extension in the induction period increases the cumulative hydration heat at the end of the induction period with the increase in the FA content. The surface of fly ash contains a large number of Si-O-Si bonds, and after interacting with water, a significant number of hydroxyl groups appear on the particle surface. Under the influence of electrostatic adsorption between positive and negative charges [69], the adsorption of Ca2+ on the surface of FA lowers the concentration of Ca2+ in the solution, delaying the nucleation of Ca(OH)2 and thereby prolonging the induction period [70].
Acceleration Stage: In an alkaline environment, this stage is marked by the formation of hydration products in AAGC [71,72]. OPC exhibits the highest peak hydration heat rate, at 14.43 J/(g∙h), with the highest cumulative hydration heat value during the acceleration stage, at 134.92 J/g. As the FA content increases, the peak hydration heat rate of AAGC gradually decreases, and the time to reach the peak increases. For instance, FA-50 has a peak heat release rate of 1.67 J/(g∙h) at 38.5 h. The low cementitious activity of FA and increased FA content extend the duration of the acceleration stage, ranging from 3.4 to 16.5 h, resulting in relatively consistent cumulative hydration heat at the peak time of the acceleration stage for AAGC [37,67].
Deceleration Stage: The heat release rate of OPC declines rapidly, but both the hydration heat rate and cumulative hydration heat are higher than those of AAGC [37]. With an increase in the FA content, the hydration heat rate of AAGC decreases slowly, and the duration of the deceleration stage increases [67,68,73]. The cumulative hydration heat rates for FA-0, FA-10, and FA-20 gradually level off, as FA has certain cementitious activity but reacts slowly. With a higher FA content, the cumulative hydration heat rates for FA-30, FA-40, and FA-50 rise gradually.
Steady-State Stage: Around 72 h, the hydration heat rate and cumulative hydration heat for both OPC and AAGC tend to level off, with OPC showing the highest cumulative hydration heat, followed by FA-0 and FA-20. However, the heat release rate of cement is still higher than that of the alkali-activated slag–FA paste [37]. FA continues to hydrate in the steady-state stage, and with an increase in the FA content, the cumulative hydration heat of FA-30, FA-40, and FA-50 continues to increase gradually. Therefore, AAGC with a high FA content shows a higher rate of compressive strength increase in the later stages [74]. By the seventh day, the cumulative hydration heat of AAGC is around 110 J/g, with FA-0 and FA-40 having the highest values at 115.11 J/g and 114.07 J/g, respectively, and FA-20 having the lowest at 102.91 J/g.
3.3. X-ray Diffraction (XRD) Analysis
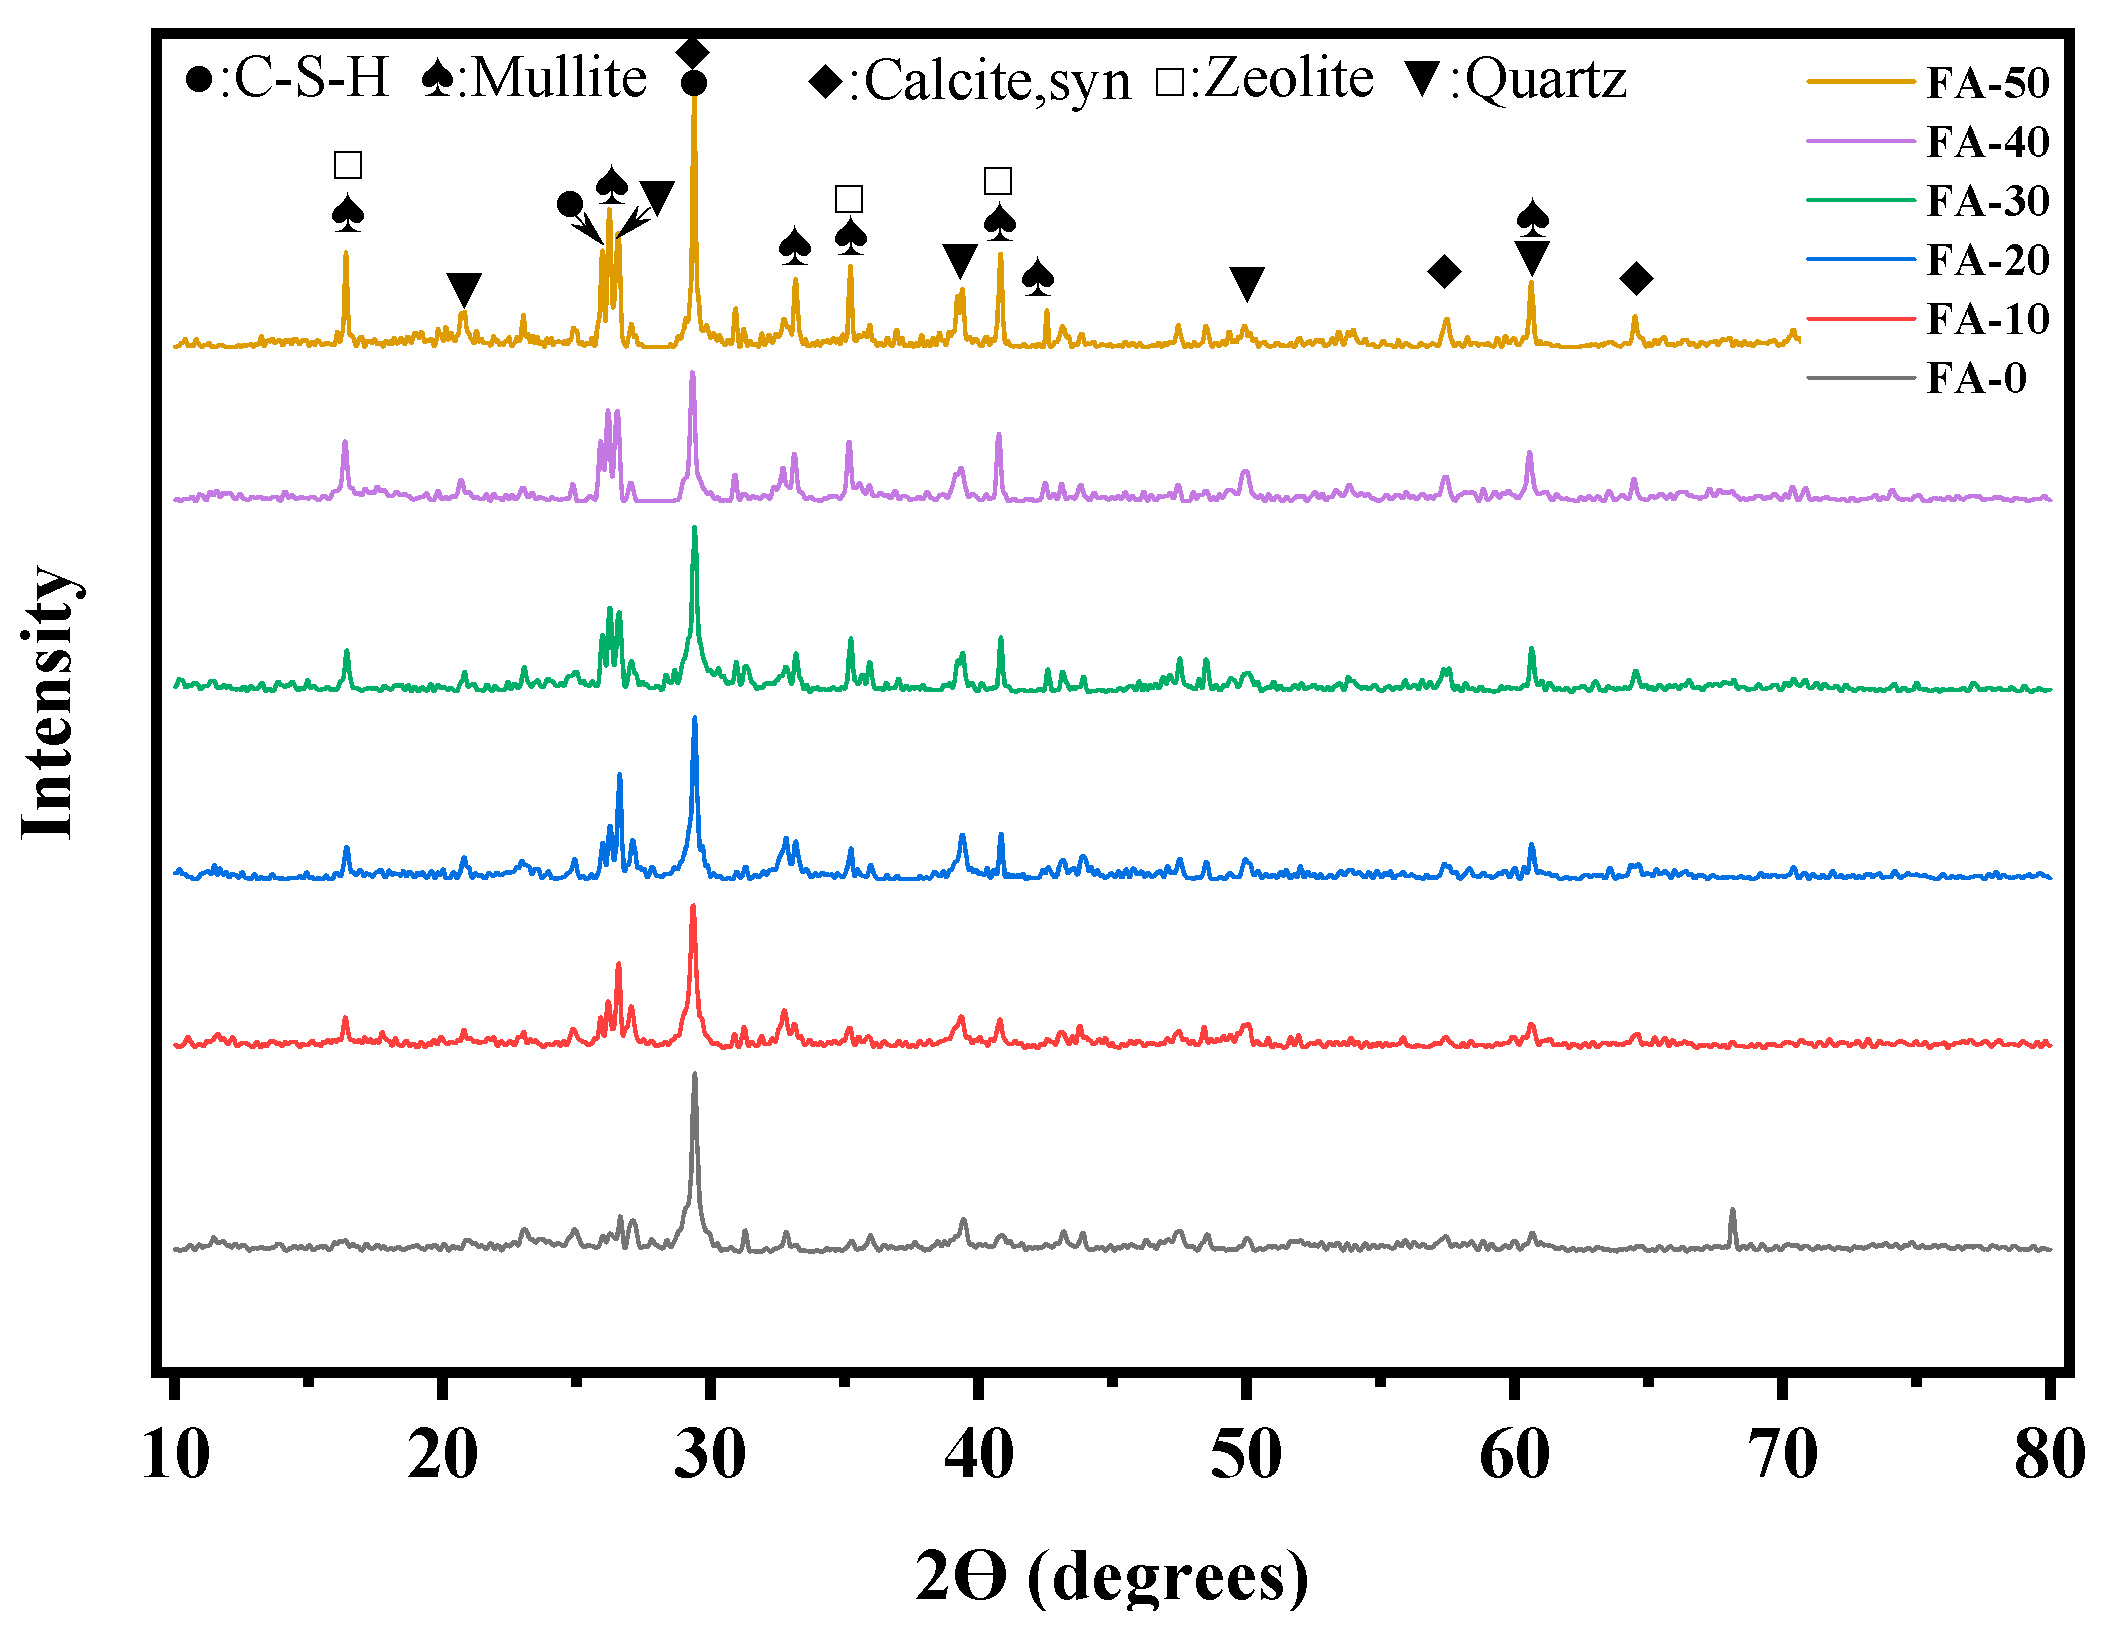
As shown in Figure 7, the AAGC paste specimens cured for 28 days were soaked in anhydrous ethanol to terminate hydration and vacuum-dried. After grinding, the hydration products were tested using an X-ray diffractometer. By comparing with PDF standard cards and referencing the existing literature, five minerals were identified: mullite-like (PDF#084-1205), C-S-H, calcite (PDF#037-1496), zeolite, and quartz (PDF#046-1045).
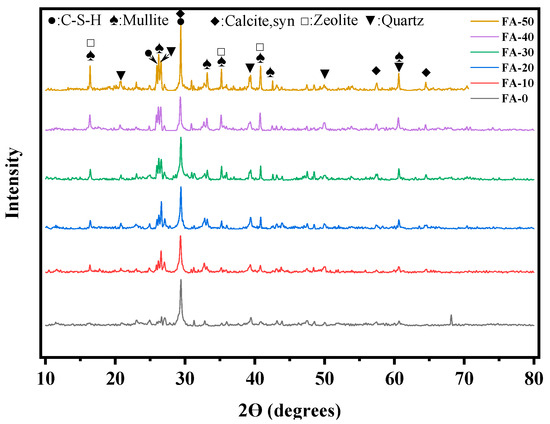
Figure 7.
XRD patterns of AAGC paste samples at 28 days.
In an alkaline environment, the silicon–oxygen network structure of GBFS is disrupted, generating a large number of zeolite-like products, such as sodalite, natrolite, and tobermorite [65]. Li et al. prepared alkali-activated FA-GBFS cement and found that the hydration products of paste samples dried at different temperatures included hydrotalcite, C-(N)-S-H, calcite, mullite, and quartz [38]. Rafeet et al. [66] prepared FA-GBFS cement with different GBFS concentrations, and the hydration products of the paste included mullite, C-A-S-H, hydrotalcite, and quartz. Luan et al. prepared flue gas desulfurization gypsum and water glass composite-activated FA-GBFS cement, and the main hydration products of the paste included calcium silicate, calcite, mullite, ettringite, and quartz [41].
3.4. Thermal Analysis
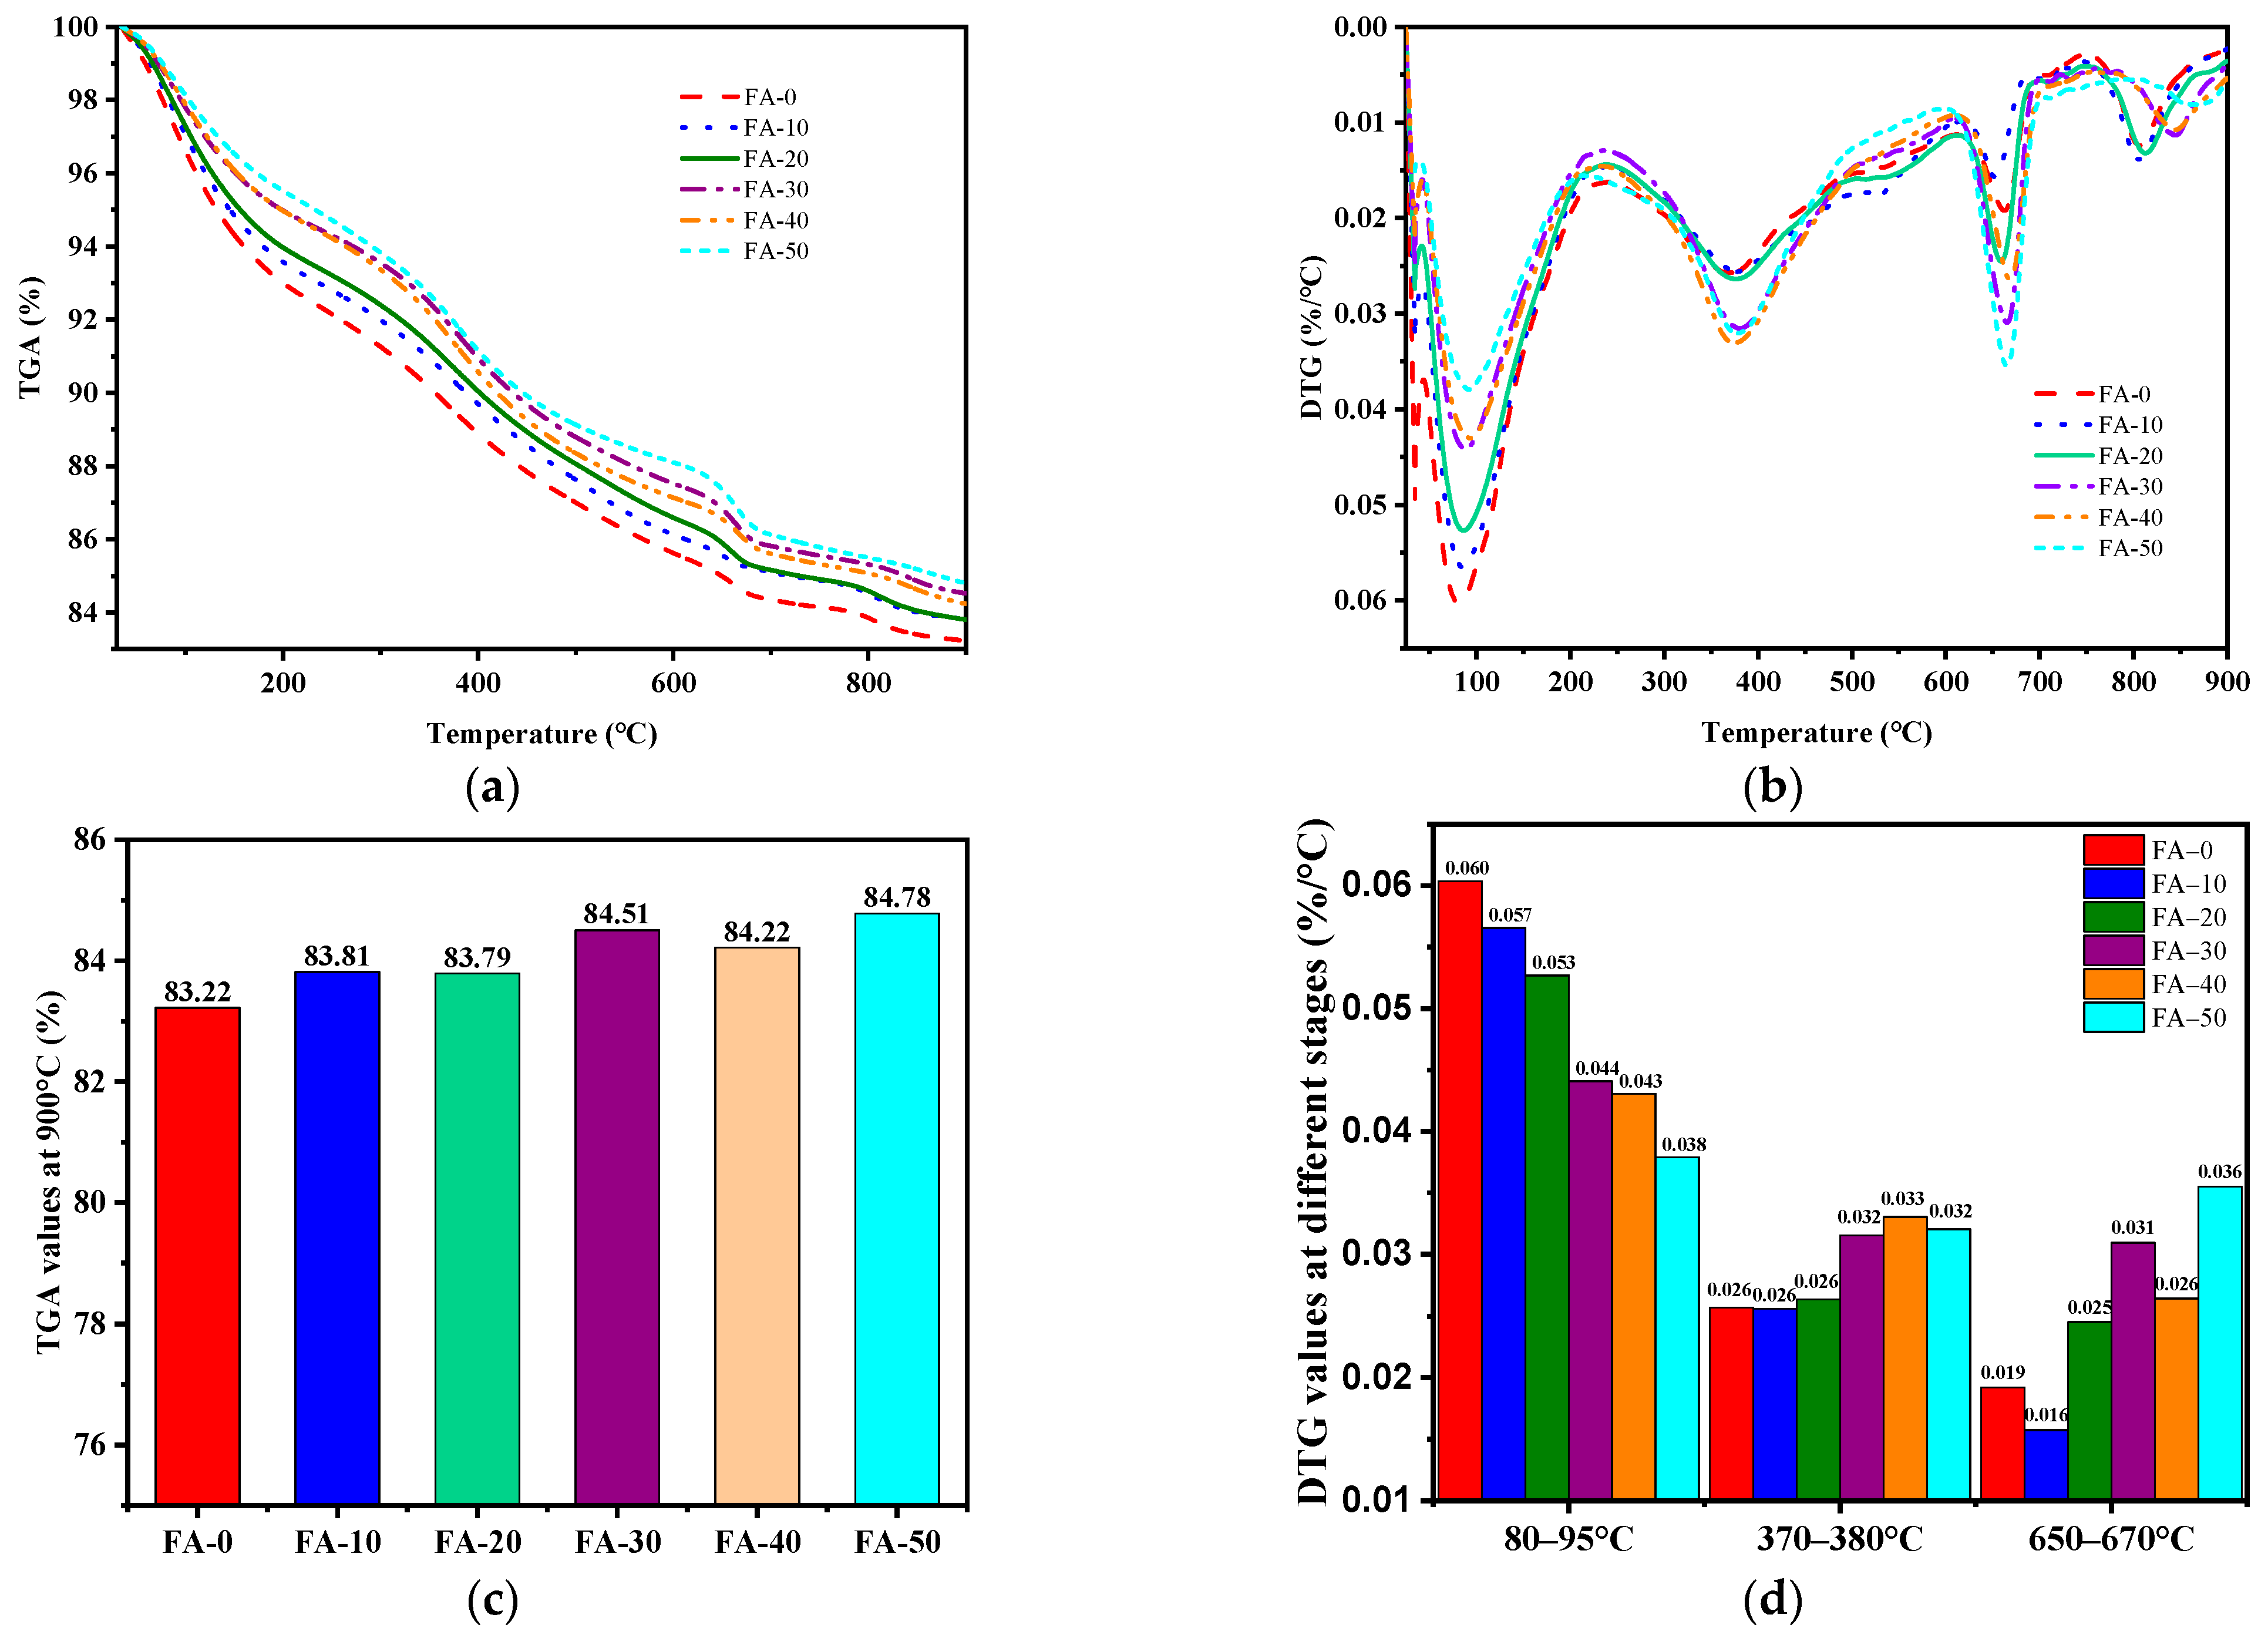
Figure 8 shows the thermogravimetric data of 28-day AAGC pastes. In Figure 8b, the DTG data of AAGC pastes show three distinct peaks. Based on relevant literature [75,76,77], the mass loss of AAGC is divided into three stages: 25–200 °C, 300–500 °C, and 600–750 °C.

Figure 8.
Thermal analysis of AAGC paste at 28 days: (a) TGA; (b) DTG; (c) TGA values at 900 °C; (d) DTG values at different stages.
From 25 to 200 °C, the mass loss is primarily due to the evaporation of free water and chemically bound water in the N-A-S-H and C-A-S-H gel structures [78,79]. As the FA content increases, the mass loss rate decreases, indicating that a higher FA content results in fewer gel products in AAGC pastes, leading to lower strength.
From 300 to 500 °C, the gel products in AAGC paste lose hydroxyl groups, especially the calcium-rich gels [75,79]. The small shoulder peak around 500 °C is possibly due to the dehydration and decomposition of unreacted Ca(OH)2; into CaO and H2O [17].
In the temperature range from 600 °C to 750 °C, various carbonate-containing phases decompose, with an endothermic peak around 650 °C, which is caused by the decomposition of calcite, thus releasing CO2 and forming CaO [13]. Between 800 °C and 900 °C, a small peak appears in AAGC, likely due to the decomposition of CaCO3 [80].
As shown in Figure 8c, at 900 °C, the mass loss of AAGC paste specimens ranges from 15.22% to 16.78%. With an increase in the FA content, the mass loss of AAGC paste samples decreases, indicating that a higher FA content results in fewer hydration gel products in AAGC paste. This validates the strength development trend of AAGC paste specimens at different ages [75].
3.5. Pore Structure and Scanning Electron Microscopy
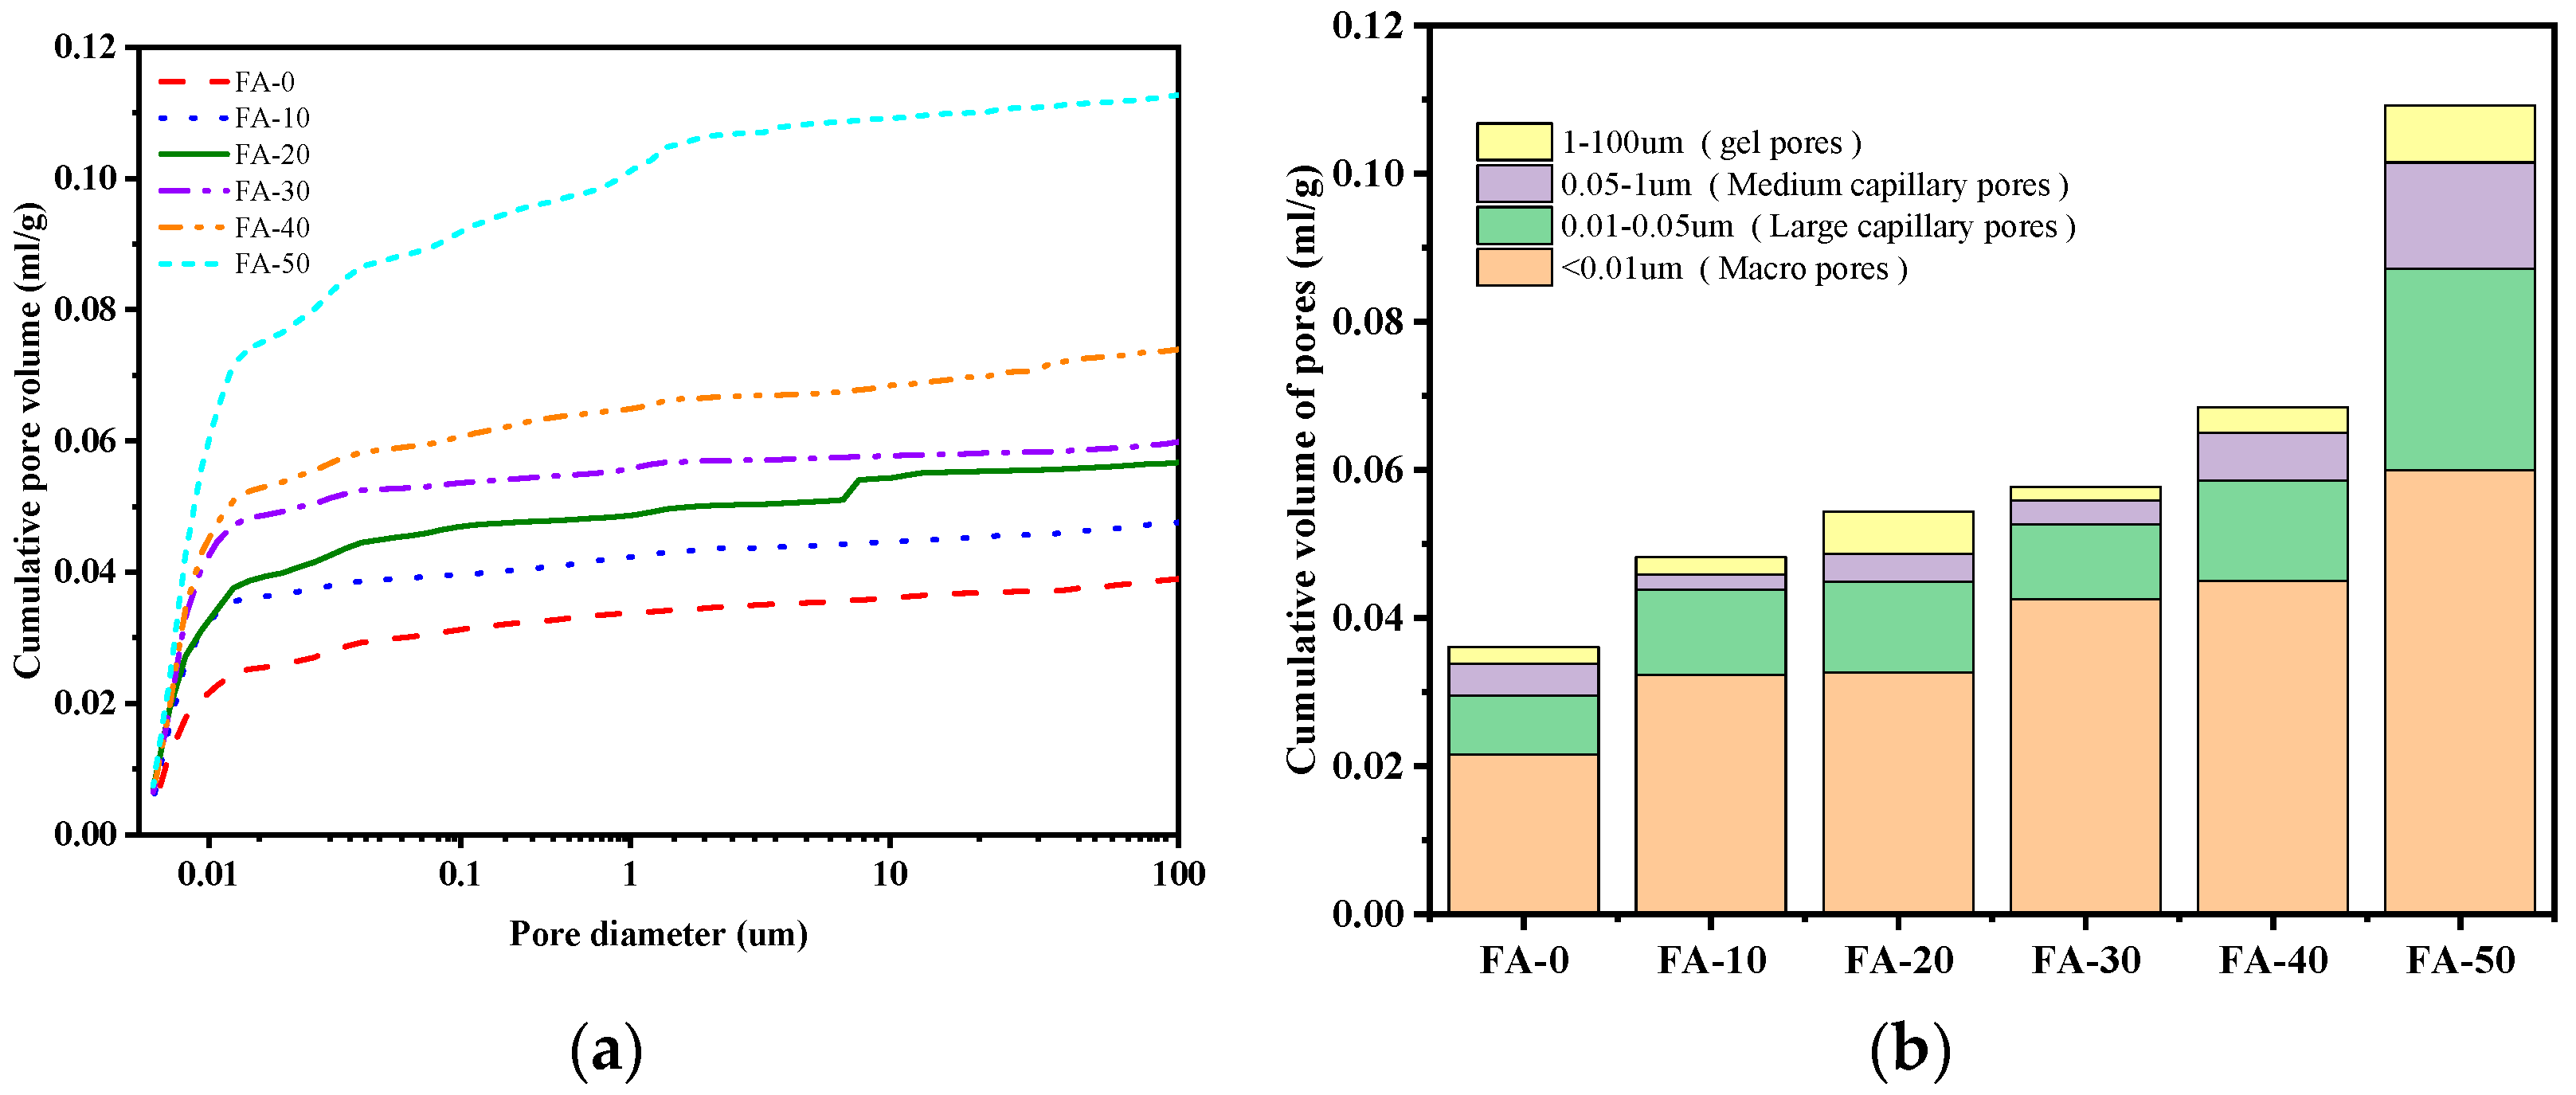
Figure 9 illustrates the pore size distribution of 28-day AAGC paste samples. Based on the relevant literature and pore size characteristics, the pore size characteristics of inorganic cementitious materials are categorized into gel pores (<10 nm), medium capillary pores (10–50 nm), large capillary pores (50–1000 nm), and macropores (>1000 nm). According to the influence of pore distribution on the performance of inorganic cementitious materials (mechanical properties, shrinkage, cracks, durability, etc.), pores ranging from 0 to 1000 nm are classified into harmless pores (<10 nm), less harmful pores (10–50 nm), and harmful pores (>50 nm) [81,82,83].

Figure 9.
MIP results of AAGC pastes at 28 days: (a) cumulative pore volume; (b) cumulative pore volume of AAGC at different scales.
As shown in Figure 9, with the increase in the FA content, the cumulative pores of AAGC paste specimens increase, leading to a decrease in the overall compressive strength of 28-day AAGC paste (Figure 3d). In FA-0 and FA-10, microcracks form due to shrinkage during curing (Figure 10a), resulting in lower 28-day compressive strength than that of FA-20. With the increase in the FA content, harmless pores, i.e., gel pores, increase, with cumulative pores ranging from 0.02157 to 0.06 mL/g, leading to an increase in the 28-day compressive strength growth rate (Figure 4b). This indicates that FA undergoes continuous hydration reactions in the later stages, forming gel products (Figure 6b). For an FA content ranging from 0 to 30%, the harmful pores (0.05–100 μm) in AAGC paste samples show little difference. The cumulative harmful pores in the hardened paste of FA-10 and FA-30 are the smallest, with cumulative pore volumes of 0.00729 mL/g and 0.00723 mL/g, respectively. FA-50 has the largest cumulative harmful pore volume in the hardened paste, at 0.02549 mL/g. The size of cumulative harmful pores alone does not fully reflect the variation in the 28-day compressive strength of AAGC paste samples. The analysis reveals that the proportion of pore size and shrinkage cracks during curing equally affect the strength of the hardened paste. The decrease in flexural strength of AAGC paste (Figure 5a) is mainly due to shrinkage cracks during curing, followed by the porosity of the hardened paste.
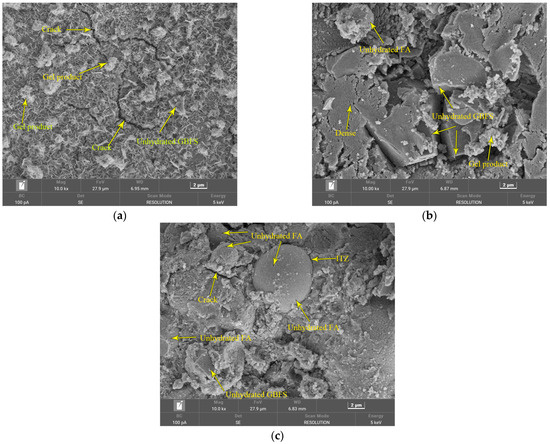
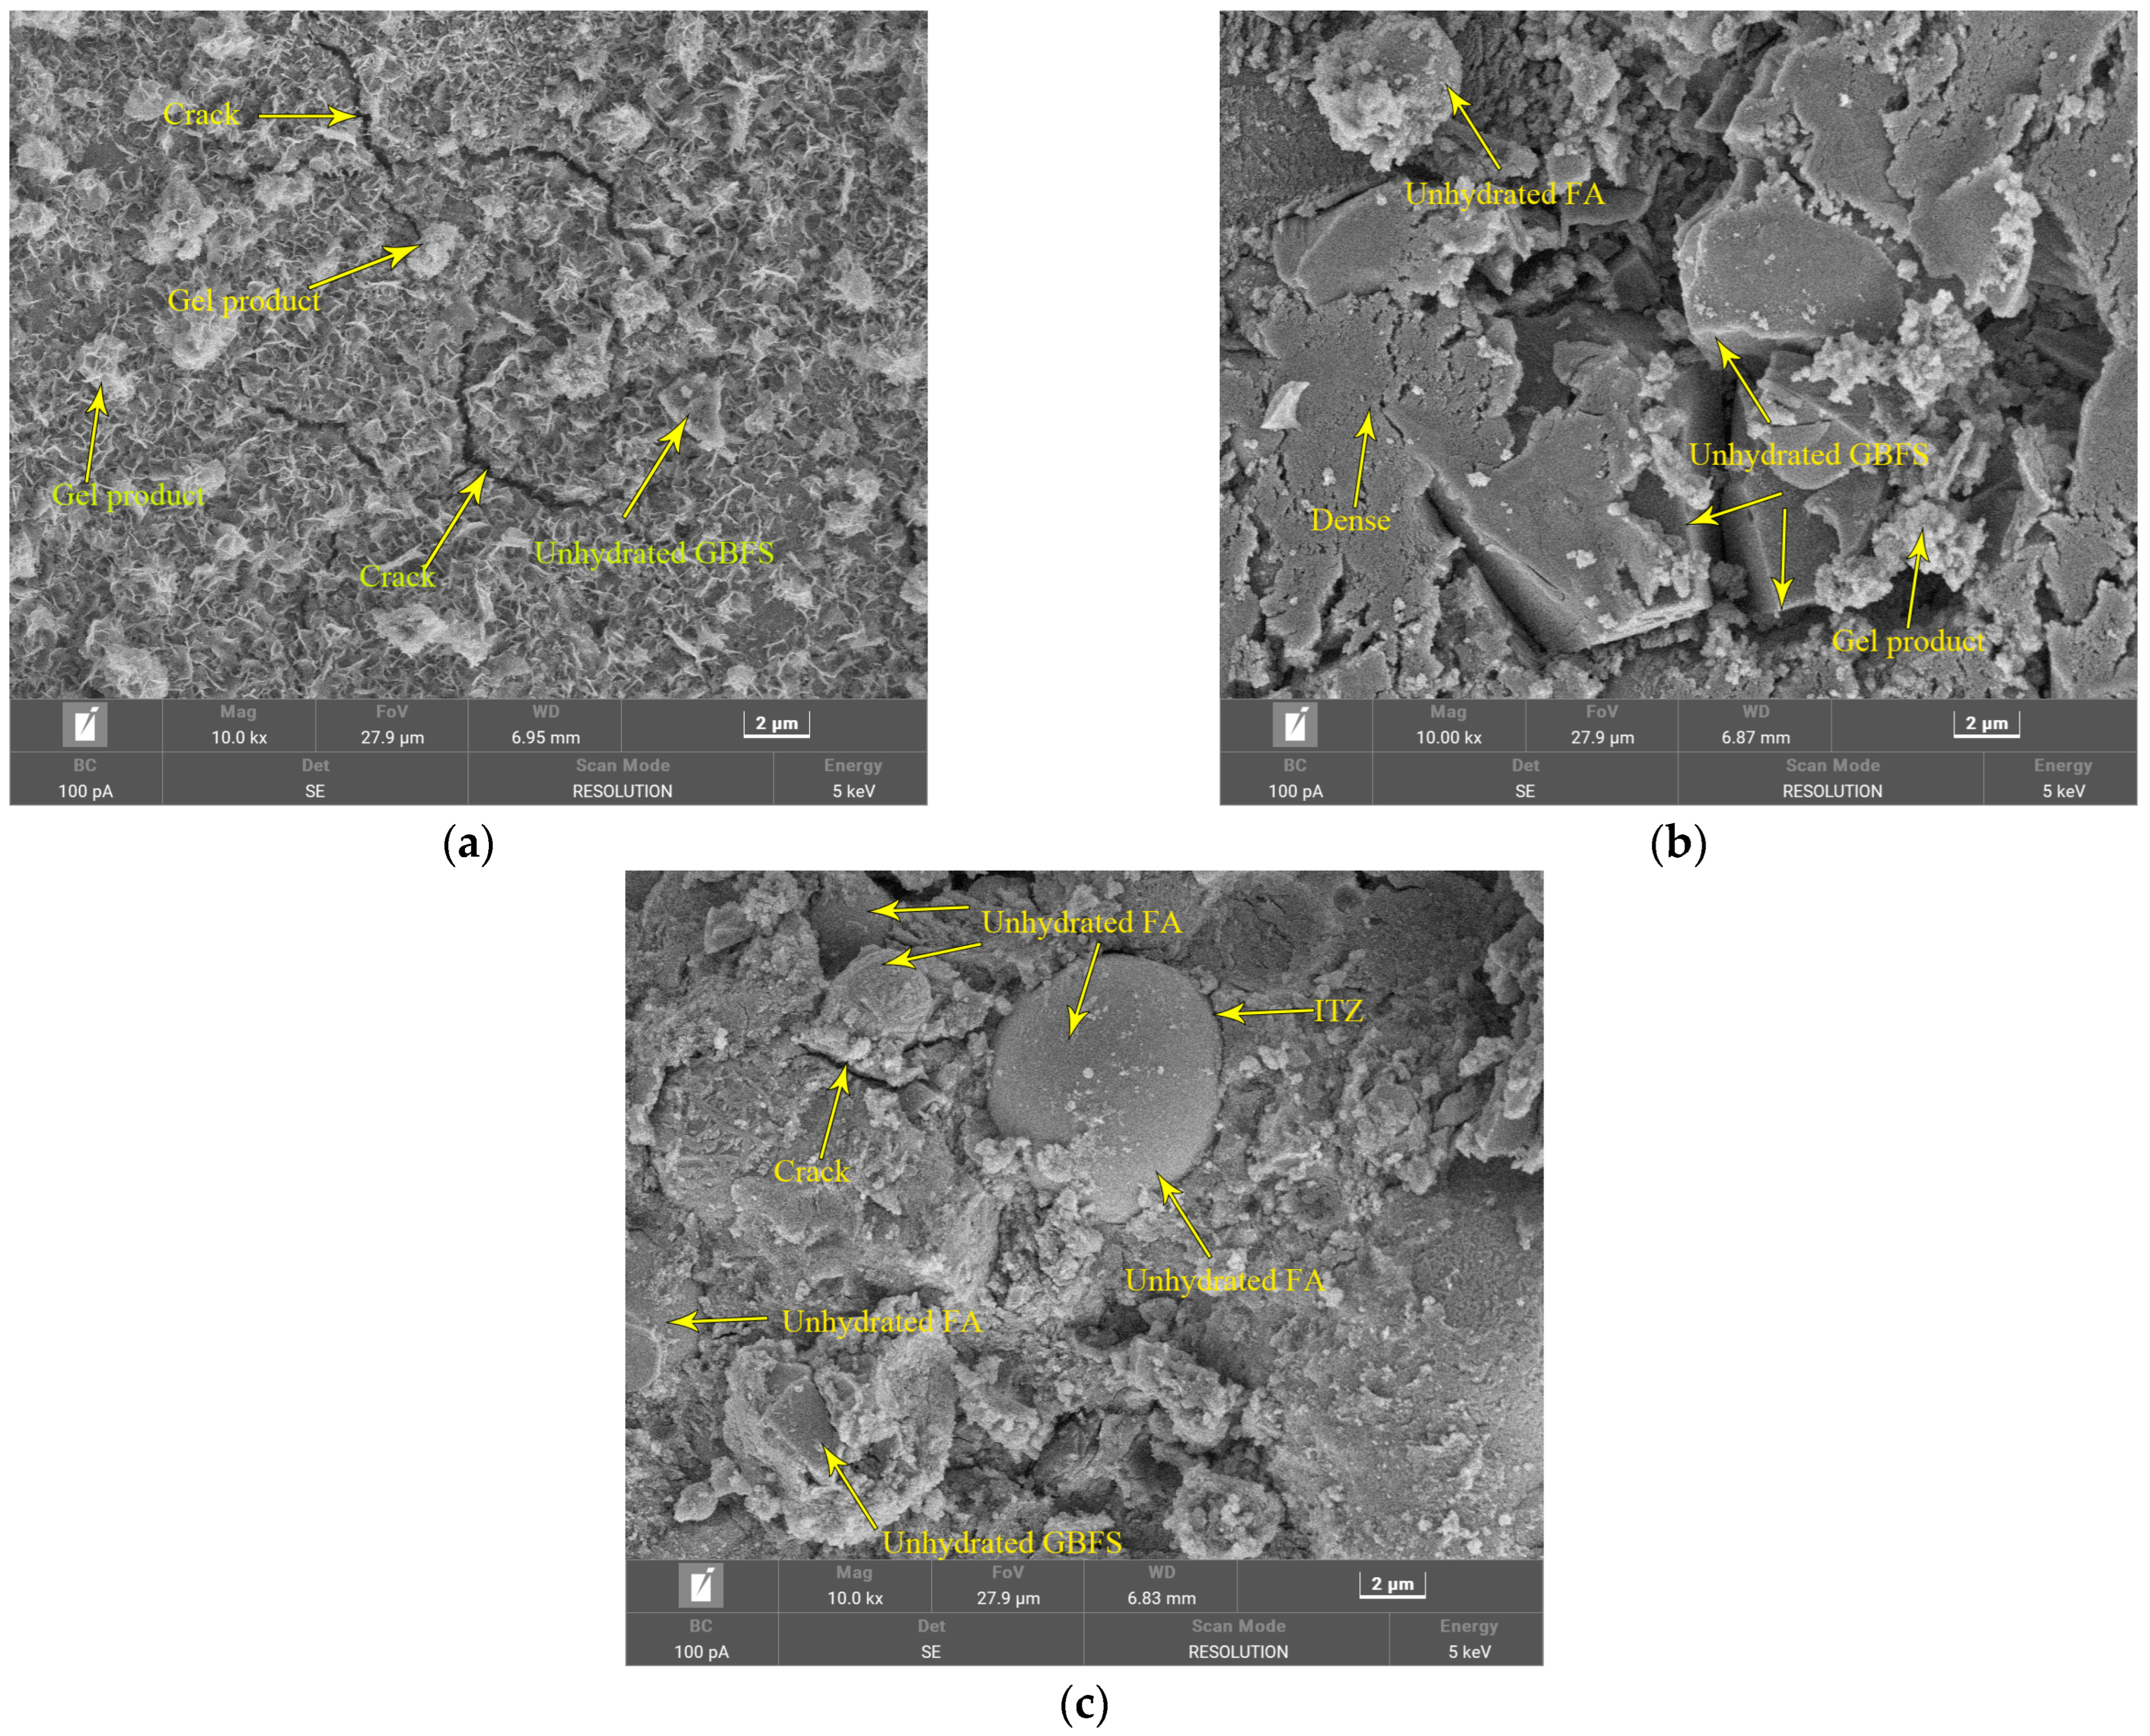
Figure 10.
SEM images of AAGC paste specimens with different FA contents: (a) FA-0; (b) FA-30; (c) FA-50.
Figure 10 shows SEM images for FA-0, FA-30, and FA-50 at 28 days. Considering the morphology and particle size distribution of the raw materials (Figure 1 and Figure 2), we can identify unhydrated GBFS and FA in the images.As shown in Figure 10a, there is minimal unhydrated GBFS, resulting in a dense microstructure, but numerous microcracks are present. These cracks may be due to shrinkage during the curing process [44,84], leading to high early compressive and flexural strength for FA-0, which subsequently declines. As shown in Figure 10a, a network of hydrated gel products develops, covering the surface [44,85]. As shown in Figure 10b,c, some FA particles are covered with hydration products, while others are embedded in the paste, indicating that FA has low pozzolanic activity and slowly participates in hydration reactions. As the FA content increases, the microstructure of the paste becomes more porous, reducing the mechanical properties of AAGC but with relatively fewer microcracks [39], which can be inferred from the strength data in Figure 4 and MIP data in Figure 9. The interface transition zone (ITZ) between FA and paste indicates tight bonding [13,35,38]. As the FA content increases, the amount of unreacted GBFS and FA in the paste increases. Considering the pore solution pH and chemically bound water, fewer hydration products form, and porosity increases. For the same age and FA content, there is a higher loss of OH− and lower chemically bound water in the paste, resulting in lower early compressive and flexural strength.
3.6. Chemically Combined Water and pH Values
During the 28-day period, the trend of chemically bound water and compressive strength growth in water glass-activated GBFS cementitious materials is generally consistent. Chemically bound water reflects the degree of hydration of the cementitious materials, and as the curing period increases, the amount of chemically bound water correspondingly increases [46,48]. Figure 11 shows the chemically bound water content of FA-GBFS cement at 3 days and 28 days of curing. As the FA content increases, the chemically bound water content shows a decreasing trend. When the FA content exceeds 20%, its impact on the chemically bound water content gradually diminishes. GBFS has relatively high cementitious activity and reacts rapidly with OH− in an alkaline environment. Therefore, at the same curing period, the higher the GBFS content is, the greater the chemically bound water in FA-GBFS cement. FA, having lower activity, leads to a reduction in the chemically bound water content of FA-GBFS cement as its content increases because some OH− reacts with the FA. Maekawa’s study [81] indicates that slag has a higher capacity for chemically bound water during its reaction, whereas FA has a lower capacity for chemically bound water during its reaction.
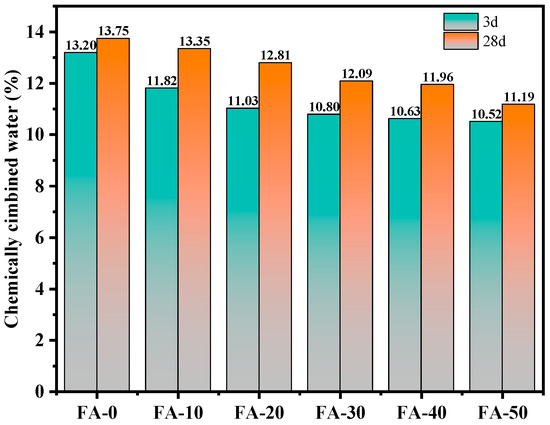
Figure 11.
Chemically combined water of AAGC cement.
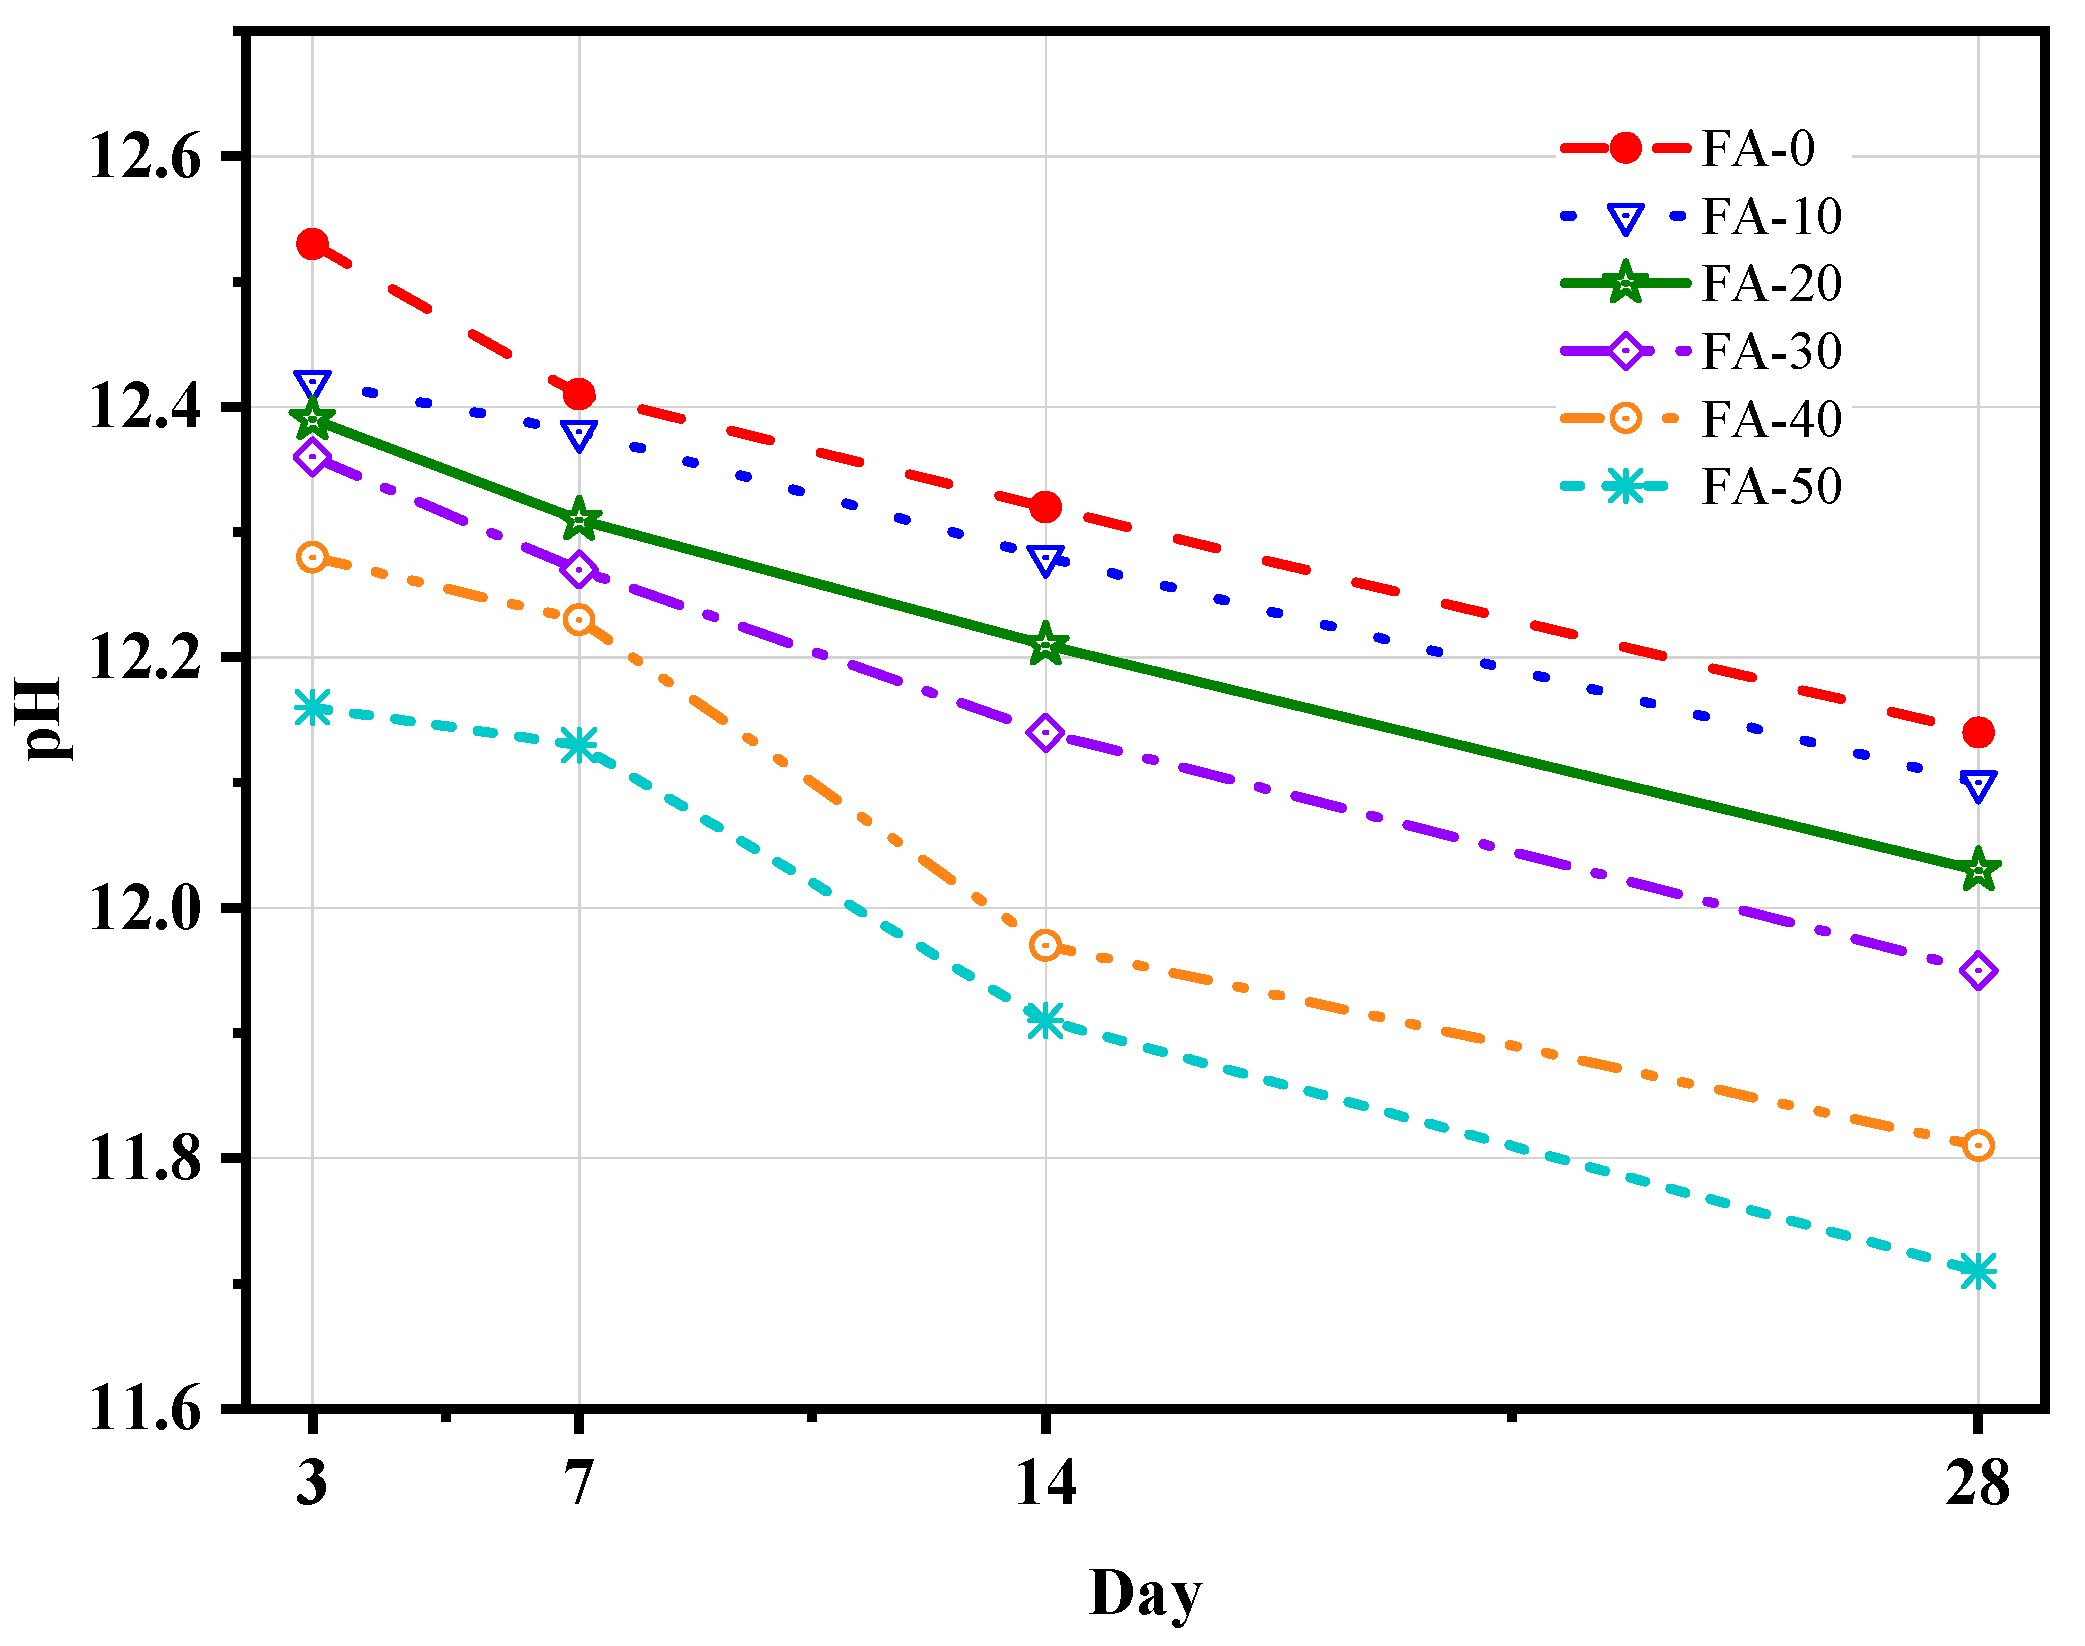
As shown in Figure 12, we determined the pore solution pH values of slag–FA hardened paste at the ages of 3 days, 7 days, 14 days, and 28 days using the solid–liquid extraction method, as shown in Figure 7. In the alkali-activated GBFS cementitious system, the pH value of the paste pore solution is related to the activation degree of GBFS. When the pH is greater than 11.5, the activation degree of GBFS is high [51]. With the increase in age, the pH of FA-GBFS cement decreases. OH− ions can break the aluminosilicate network of the GBFS glass phase, and most of the Na+ is captured or absorbed by the C-(A)-S-H gel. The pH value of the pore solution of each mix gradually decreases with the increase in age [86]. For instance, the pH value of the FA-0 pore solution is 12.53 at 3 days and 12.14 at 28 days, a decrease of 0.39. Due to the low cementitious activity of FA and the loss of Na+ and OH− under wet curing conditions, the pH value of the pore solution decreases with the increase in the FA content at the same age [50], showing a trend consistent with the strength trend of specimens at the same age (<28 days). As the age increases, the pH values of FA-0, FA-1, FA-2, and FA-3 decrease in a nearly linear trend, while the pH values of FA-5 and FA-6 decrease significantly between 7 and 14 days, reducing by 0.24 and 0.22, respectively.
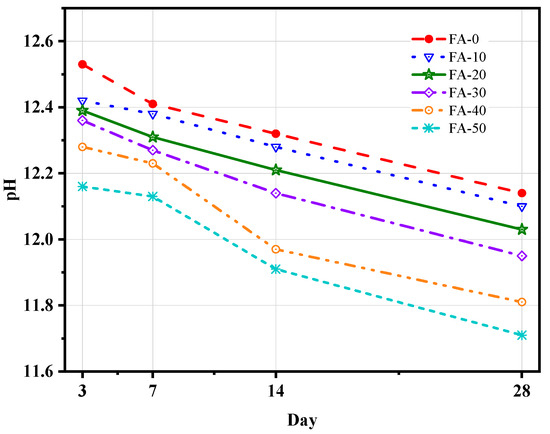
Figure 12.
pH value of FA-GBFS cement.
4. Discussion
In terms of the strength growth of AAGC, the compressive strength of AAGC with 0–30% FA content at various ages is higher than that of AAGC with 40–50% FA content, and the compressive strength at 14 and 28 days is higher than that of OPC. Therefore, AAGC is considered an early-strength cementitious material. The compressive strength of OPC increases slowly from 49 MPa to 54 MPa between 7 and 28 days, a growth of 10%. For AAGC with 20–50% FA content, the compressive strength continuously increases between 7 and 28 days, with a growth rate of 27–43%. Both OPC and AAGC exhibit retrogression in flexural strength. Compared to the highest flexural strength of each mix, AAGC shows a retrogression degree of −38% to −62%, while OPC shows a retrogression of −20%. The flexural strength of AAGC reaches its highest value between 3 and 7 days. Research results indicate [11,87,88] that under different humidity and partial immersion curing conditions, AAGC exhibits efflorescence behavior. As the curing period increases, some AAGC specimens develop surface cracks, indicating strength retrogression.
As shown in Figure 13, the cumulative heat of hydration of OPC at 3 and 7 days is higher than that of AAGC. However, the compressive strength of AAGC with 0–30% FA content is higher than that of OPC. The early cumulative heat of hydration of OPC is mainly provided by C3A and C3S in the clinker [63], while that of AAGC is primarily provided by the activated GBFS. The raw material characteristics and reaction mechanisms of OPC and AAGC are different, and the cumulative heat of hydration and strength correlation of these two cementitious materials is not significant. As shown in Figure 13a, the gelation activity of GBFS is high [66]. With an increase in the FA content, the cumulative heat of hydration of AAGC at 3 days decreases, and the compressive and flexural strength of AAGC shows a downward trend. As shown in Figure 6b and Figure 13b, although the gelation activity of FA is low [7], FA continues to hydrate during the deceleration and stabilization periods. The compressive strength of AAGC with 30–50% FA content shows a large growth rate (Figure 4b).

Figure 13.
Strength and the cumulative hydration rate: (a) 3 d; (b) 7 d.
As shown in Figure 14a, the water-to-binder ratio of AAGC is 0.4. With the increase in the FA content, the 28-day chemically bound water of AAGC decreases, and the 28-day pore volume (<100 µm) increases. Due to the low gelation activity and increased content of FA, less water participates in the hydration reaction, resulting in more free water in AAGC. Additionally, the porosity of FA leads to a decrease in chemically bound water and an increase in pore volume (<100 µm) in AAGC with a high FA content, which results in lower strength. As shown in Figure 14b, with the increase in the FA content, the 28-day pH of AAGC decreases. A high pH indicates a high activation degree of GBFS [51]. The low pH of AAGC with a high FA content may be due to the loss of Na+ and OH− [50]. Coupled with the low gelation activity of FA, the increase in the FA content leads to a decrease in AAGC strength. The fast early hydration of FA-0 and FA-10 (Figure 6) results in microcracks within the paste (Figure 10a), causing the compressive strength of FA-0 and FA-10 to be lower than that of FA-20 and FA-30.
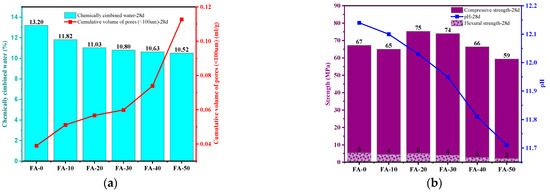
Figure 14.
Correlation analysis: (a) chemically combined water and cumulative volume of pores at 28 days; (b) strength and pH values at 28 days.
In summary, the difference in raw material characteristics and reaction mechanisms between OPC and AAGC results in inconsistent trends in strength development and hydration heat release. Compared with OPC, the strength growth trend of AAGC is unstable, especially in terms of flexural strength. To accelerate the promotion and application of alkali-activated cementitious materials in practical engineering, based on the analysis of experimental results, future research should focus on the drying shrinkage and chemical shrinkage of AAGC. Additionally, studies on long-term curing and different curing conditions, as well as the mechanical properties and durability of AAGC, should be conducted. Furthermore, the incorporation of inert powder admixtures should be considered to reduce the cost of AAGC, and the comprehensive impact of inert powder admixtures on the setting time, hydration performance, mechanical properties, and shrinkage performance of AAGC should be studied. The proposed future research can systematically elucidate the hydration mechanism of AAGC and address the issue of unstable strength development.
5. Conclusions
In this study, the strength and hydration performance of six AAGC and OPC mix proportions were comprehensively studied. Additionally, the hydration products, electron microscope images, pore structure, pH values, and chemically bound water of AAGC were examined. The main conclusions of the study are as follows:
- Compared to OPC, AAGC exhibited higher early compressive and flexural strengths. After 7 days, the compressive strength of OPC increased slowly. Excluding FA-0 and FA-10, the increase in the compressive strength of AAGC from 7 to 28 days was significantly greater than that of OPC, with the 28-day compressive strength of AAGC exceeding that of OPC. However, the 28-day flexural strength of AAGC was lower than that of OPC. As the gelation activity of FA was low, an increase in the FA content resulted in a general decline in the compressive strength of AAGC at the same age. When the FA content was 20%, AAGC exhibited no strength regression, and the 28-day compressive strength was the highest (75 MPa), with a relatively low degree of flexural strength regression.
- The hydration heat release rate curves of OPC and AAGC similarly included pre-induction, induction, acceleration, deceleration, and steady periods. During the induction period, the hydration heat release rate and cumulative hydration heat of OPC were lower than those of AAGC, leading to the higher compressive strength of AAGC with 0–30% FA content compared to OPC. In the pre-induction period, the cumulative hydration heat of OPC gradually surpassed that of AAGC. During the steady period, the cumulative hydration heat of FA-40, FA-50, and OPC increased slowly, with FA continuing to participate in the hydration reaction, resulting in the 14–28 day compressive strength of FA-40 and FA-50 being higher than that of OPC.
- The primary hydration products of AAGC included mullite, C-S-H, calcite, zeolite, and quartz. At the same temperature, as the FA content increased, the mass loss of AAGC decreased.
- In the 28-day SEM images of AAGC paste, unhydrated FA and GBFS are observed. As the FA content increased, the porosity of the paste also increased, leading to a rise in the cumulative pore volume (<100 µm), which resulted in lower compressive and flexural strength for AAGC with a high FA content. The SEM image of the FA-0 28-day paste shows a dense structure but with numerous cracks. The high early hydration heat release rate of paste samples with a low FA content caused the formation of microcracks within the paste, and as the curing period progressed, the number of microcracks increased, leading to a reduction in compressive strength for FA-0 and FA-10.
- As the FA content increased, the chemically bound water and pH of AAGC decreased, which was roughly consistent with the strength development trend of AAGC. The chemically bound water and pH to some extent reflected the degree of hydration reaction of AAGC.
Author Contributions
Conceptualization, Y.L., Y.W. and K.N.; methodology, Z.F., Y.L. and S.Z.; software, X.Y. and Z.F.; validation, Y.Z. (Yimeng Zhao), D.X. and B.L.; formal analysis, Y.L., Z.F. and X.Y.; investigation, X.O., Y.Z. (Yangyang Zong), and Y.L.; resources, Z.Y., Z.S. and Z.Z.; data curation, S.Y., H.Y. and Z.F.; writing—original draft preparation, Y.L., Z.F. and S.Z.; writing—review and editing, Y.L., W.T. and K.N. and Y.W.; visualization, Z.F. and Y.L.; supervision, K.N. and Y.W.; funding acquisition, Z.Y., Y.W. and K.N. All authors have read and agreed to the published version of the manuscript.
Funding
This research was funded by Basic Research Funding for Central Universities of China (No. 06500139) and the Beijing Natural Science Foundation (No. IS23045).
Data Availability Statement
The data presented in this study are available upon request from the corresponding author.
Conflicts of Interest
Authors Zhiyu Yao, Zhibin Sun and Zhilu Zhen were employed by the company Hebei Construction Group Corporation Limited. The remaining authors declare that the research was conducted in the absence of any commercial or financial relationships that could be construed as a potential conflict of interest.
References
- Dunant, C.F.; Joseph, S.; Prajapati, R.; Allwood, J.M. Electric recycling of Portland cement at scale. Nature 2024, 629, 1055–1061. [Google Scholar] [CrossRef] [PubMed]
- Barcelo, L.; Kline, J.; Walenta, G.; Gartner, E. Cement and carbon emissions. Mater. Struct. 2014, 47, 1055–1065. [Google Scholar] [CrossRef]
- Miller, S.A.; Horvath, A.; Monteiro, P.J. Readily implementable techniques can cut annual CO2 emissions from the production of concrete by over 20%. Environ. Res. Lett. 2016, 11, 074029. [Google Scholar] [CrossRef]
- Zunino, F.; Dhandapani, Y.; Ben Haha, M.; Skibsted, J.; Joseph, S.; Krishnan, S.; Parashar, A.; Juenger, M.C.G.; Hanein, T.; Bernal, S.A.; et al. Hydration and mixture design of calcined clay blended cements: Review by the RILEM TC 282-CCL. Mater. Struct. 2022, 55, 234. [Google Scholar] [CrossRef]
- Gökçe, H.S.; Tuyan, M.; Nehdi, M. Alkali-activated and geopolymer materials developed using innovative manufacturing techniques: A critical review. Constr. Build. Mater. 2021, 303, 124483. [Google Scholar] [CrossRef]
- Sun, B.; Ye, G.; De Schutter, G. A review: Reaction mechanism and strength of slag and fly ash-based alkali-activated materials. Constr. Build. Mater. 2022, 326, 126843. [Google Scholar] [CrossRef]
- Ma, H.; Li, X.; Zheng, X.; Niu, X.; Fang, Y. Effect of active MgO on the hydration kinetics characteristics and microstructures of alkali-activated fly ash-slag materials. Constr. Build. Mater. 2022, 361, 129677. [Google Scholar] [CrossRef]
- Montoya, A.; Rodríguez-Barboza, L.; Colmenero, F.; Cárcel-Carrasco, J.; Gómez-Zamorano, L. Composite Cements Using Ground Granulated Blast Furnace Slag, Fly Ash, and Geothermal Silica with Alkali Activation. Buildings 2023, 13, 1854. [Google Scholar] [CrossRef]
- Zhang, W.; Yao, X.; Yang, T.; Zhang, Z. The degradation mechanisms of alkali-activated fly ash/slag blend cements exposed to sulphuric acid. Constr. Build. Mater. 2018, 186, 1177–1187. [Google Scholar] [CrossRef]
- Xue, L.; Zhang, Z.; Wang, H. Early hydration kinetics and microstructure development of hybrid alkali activated cements (HAACs) at room temperature. Cem. Concr. Compos. 2021, 123, 104200. [Google Scholar] [CrossRef]
- Srinivasamurthy, L.; Chevali, V.; Zhang, Z.; Longhi, M.; Loh, T.; Wang, H. Mechanical property and microstructure development in alkali activated fly ash slag blends due to efflorescence. Constr. Build. Mater. 2022, 332, 127273. [Google Scholar] [CrossRef]
- Feng, Y.; Xue, Z.; Baifa, Z.; Xie, J.h.; Chen, C.; Tan, J.; Zhao, C. Effects of phosphogypsum substitution on the performance of ground granulated blast furnace slag/fly ash-based alkali-activated binders. J. Build. Eng. 2023, 70, 106387. [Google Scholar] [CrossRef]
- Soltan, M.; Abo-El-Enein, S.; Zaky Sayed, A.; El-sokkary, T.M.; Hammad, H. Incorporation of Cement Bypass Flue Dust in Fly Ash and Blast Furnace Slag-based Geopolymer. Case Stud. Constr. Mater. 2018, 8. [Google Scholar] [CrossRef]
- Htut, T.; Keong, L.; Parnham, G.; Rowles, M.; Ng, T. Investigation of geopolymers containing fly ash and ground-granulated blast-furnace slag blended by amorphous ratios. Constr. Build. Mater. 2019, 222, 731–737. [Google Scholar] [CrossRef]
- Wang, M.; Xu, J.; Zhang, X.; Tan, L.; Mei, Y. Mechanical Performance Optimization and Microstructural Mechanism Study of Alkali-Activated Steel Slag–Slag Cementitious Materials. Buildings 2024, 14, 1204. [Google Scholar] [CrossRef]
- Li, Z.; Xu, K.; Sun, N.; Wang, J.; Xue, K.; Xu, L.; Ren, Y.; Yan, Z.; Sima, T. Compressive Strength and Microstructure of Carbide Slag and Alkali-Activated Blast Furnace Slag Pastes in China. Buildings 2024, 14, 1681. [Google Scholar] [CrossRef]
- Shi, Y.; Xue, C.; Jia, Y.; Guo, W.; Zhang, Y.; Qiu, Y.; Zhao, Q. Preparation and curing method of red mud-calcium carbide slag synergistically activated fly ash-ground granulated blast furnace slag based eco-friendly geopolymer. Cem. Concr. Compos. 2023, 139, 104999. [Google Scholar] [CrossRef]
- Zhonghu, W.; Zhang, H.; Pu, S.; Cai, G.; Duan, W.; Song, H.; Zeng, C.; Yang, Y. Synergistic preparation of geopolymer using electrolytic manganese residue, coal slag and granulated blast furnace slag. J. Build. Eng. 2024, 91, 109609. [Google Scholar] [CrossRef]
- Chandrasekaran, R.; Saha, S. Enhancement of the properties of fly ash based geopolymer paste by incorporating ground granulated blast furnace slag. Constr. Build. Mater. 2017, 145, 615–620. [Google Scholar] [CrossRef]
- Zhao, Y.; Yang, C.; Li, K.; Yang, J.; Wu, Z.; Yan, C. Mechanical Performances and Frost Resistance of Alkali-Activated Coal Gangue Cementitious Materials. Buildings 2022, 12, 2243. [Google Scholar] [CrossRef]
- Pu, S.; Zhu, Z.; Wang, W.; Duan, W.; Wu, Z.; Li, N. Water resistance of fly ash phosphoric acid-based geopolymer. Dev. Built Environ. 2022, 12, 100093. [Google Scholar] [CrossRef]
- Wang, X.; Wang, X.; Lv, J.; Yang, J.; He, B.; Han, P.; Bai, X.-H. Mechanical properties and hydration behaviour of circulating fluidised bed fly ash- ground granulated blast furnace slag-lime ecofriendly cementitious material. Constr. Build. Mater. 2023, 409, 133964. [Google Scholar] [CrossRef]
- Huang, G.; Zhang, X.; Liu, M.; Fang, B.; Wang, C.; Mi, H. Compatibility of sodium hydroxide, sodium silicate and calcium-enriched additives in alkali-activated materials: From the perspectives of flowability, strength and microstructure. Constr. Build. Mater. 2023, 403, 133102. [Google Scholar] [CrossRef]
- Naqi, A.; Delsaute, B.; Königsberger, M.; Staquet, S. Monitoring early age elastic and viscoelastic properties of alkali-activated slag mortar by means of repeated minute-long loadings. Dev. Built Environ. 2023, 16, 100275. [Google Scholar] [CrossRef]
- Chen, W.; Li, B.; Guo, M.-Z.; Wang, J.; Chen, Y.-T. Impact of heat curing regime on the compressive strength and drying shrinkage of alkali-activated slag mortar. Dev. Built Environ. 2023, 14, 100123. [Google Scholar] [CrossRef]
- Guan, X.; Luo, W.; Liu, S.; García, A.; Do, H.; Li, B. Ultra-high early strength fly ash-based geopolymer paste cured by microwave radiation. Dev. Built Environ. 2023, 14, 100139. [Google Scholar] [CrossRef]
- Kamath, M.; Prashant, S.; Ralegaonkar, R. Microstructure Properties of Popular Alkali-Activated PastesCured in Ambient Temperature. Buildings 2023, 13, 858. [Google Scholar] [CrossRef]
- Escalante-Garcia, J.I.; Fuentes, A.; Fraire-Luna, P.; Gorokhovsky, A.; Mendoza-Suarez, G. Hydration Products and Reactivity of Blast-Furnace Slag Activated by Various Alkalis. J. Am. Ceram. Soc. 2003, 86, 2148–2153. [Google Scholar] [CrossRef]
- Gao, X.; Yao, X.; Yang, T.; Zhou, S.; Wei, H.; Zhang, Z. Calcium carbide residue as auxiliary activator for one-part sodium carbonate-activated slag cements: Compressive strength, phase assemblage and environmental benefits. Constr. Build. Mater. 2021, 308, 125015. [Google Scholar] [CrossRef]
- Ahmad, M.; Khan, M.; Wang, A.; Zhang, Z.; Dai, J.-G. Alkali-activated materials partially activated using flue gas residues: An insight into reaction products. Constr. Build. Mater. 2023, 371, 130760. [Google Scholar] [CrossRef]
- Ahmad, M.; Lanping, Q.; Fang, Y.; Wang, A.; Dai, J.-G. A multiscale study on gel composition of hybrid alkali-activated materials partially utilizing air pollution control residue as an activator. Cem. Concr. Compos. 2022, 136, 104856. [Google Scholar] [CrossRef]
- Kovtun, M.; Kearsley, E.; Shekhovtsova, J. Chemical acceleration of a neutral granulated blast-furnace slag activated by sodium carbonate. Cem. Concr. Res. 2015, 72, 1–9. [Google Scholar] [CrossRef]
- Zhang, J.; Shi, C.; Zhang, Z. Carbonation induced phase evolution in alkali-activated slag/fly ash cements: The effect of silicate modulus of activators. Constr. Build. Mater. 2019, 223, 566–582. [Google Scholar] [CrossRef]
- Liu, Y.; Zhu, W.; Yang, E.-H. Alkali-activated ground granulated blast-furnace slag incorporating incinerator fly ash as a potential binder. Constr. Build. Mater. 2016, 112, 1005–1012. [Google Scholar] [CrossRef]
- Li, Z.; Zhang, J.; Lei, Z.; Gao, M.; Sun, J.; Tong, L.; Shunman, C.; Wang, Y. Designing low-carbon fly ash based geopolymer with red mud and blast furnace slag wastes: Performance, microstructure and mechanism. J. Environ. Manag. 2024, 354, 120362. [Google Scholar] [CrossRef] [PubMed]
- Shi, P.; Falliano, D.; Vecchio, F.; Marano, G. Investigation on the compressive strength and durability properties of alkali-activated slag mortar: Effect of superabsorbent polymer dosage and water content. Dev. Built Environ. 2024, 17, 100322. [Google Scholar] [CrossRef]
- Nedunuri, A.; Salman, M. Fundamental understanding of the setting behaviour of the alkali activated binders based on ground granulated blast furnace slag and fly ash. Constr. Build. Mater. 2021, 291C, 123243. [Google Scholar] [CrossRef]
- Li, G.; Tan, H.; Zhang, J.; Deng, X.; Liu, X.; Zhongtao, L. Ground granulated blast-furnace slag/fly ash blends activated by sodium carbonate at ambient temperature. Constr. Build. Mater. 2021, 291, 123378. [Google Scholar] [CrossRef]
- Fernández-Jiménez, A.; Palomo, A.; Criado, M. Microstructure development of alkali-activated fly ash cement: A descriptive model. Cem. Concr. Res. 2005, 35, 1204–1209. [Google Scholar] [CrossRef]
- Zhang, Z.; Zhu, Y.; Zhu, H.; Zhang, Y.; Provis, J.; Wang, H. Effect of drying procedures on pore structure and phase evolution of alkali-activated cements. Cem. Concr. Compos. 2018, 96, 194–203. [Google Scholar] [CrossRef]
- Luan, Y.; Wang, J.; Ma, T.; Wang, S.; Li, C. Modification mechanism of flue gas desulfurization gypsum on fly ash and ground granulated blast-furnace slag alkali-activated materials: Promoting green cementitious material. Constr. Build. Mater. 2023, 396, 132400. [Google Scholar] [CrossRef]
- Kabay, N.; Miyan, N.; Özkan, H. Basic oxygen furnace and ground granulated blast furnace slag based alkali-activated pastes: Characterization and optimization. J. Clean. Prod. 2021, 327, 129483. [Google Scholar] [CrossRef]
- Wei, X.; Li, D.; Ming, F.; Yang, C.; Chen, L.; Liu, Y. Influence of low-temperature curing on the mechanical strength, hydration process, and microstructure of alkali-activated fly ash and ground granulated blast furnace slag mortar. Constr. Build. Mater. 2021, 269, 121811. [Google Scholar] [CrossRef]
- Song, W.; Zhu, Z.; Pu, S.; Wan, Y.; Huo, W.; Song, S.; Zhang, J.; Yao, K.; Hu, L. Efficient use of steel slag in alkali-activated fly ash-steel slag-ground granulated blast furnace slag ternary blends. Constr. Build. Mater. 2020, 259, 119814. [Google Scholar] [CrossRef]
- Li, B.; Sun, Q.; Chen, X.; Xu, Z.; Yang, L. Preparation and microstructure analysis of alkali-activated ground granulated blast furnace slag-steel slag grouting materials. Case Stud. Constr. Mater. 2024, 20, e03235. [Google Scholar] [CrossRef]
- Wang, J.; Lyu, X.; Wang, L.; Cao, X.; Liu, Q.; Zang, H. Influence of the combination of calcium oxide and sodium carbonate on the hydration reactivity of alkali-activated slag binders. J. Clean. Prod. 2017, 171, 622–629. [Google Scholar] [CrossRef]
- Eldidamony, H.; Amer, A.; El-sokkary, T.M.; Abdel-Gawwad, H. Effect of substitution of granulated slag by air-cooled slag on the properties of alkali activated slag. Ceram. Int. 2013, 39, 171–181. [Google Scholar] [CrossRef]
- Qing-Hua, C.; Tagnit-Hamou, A.; Sarkar, S.L. Strength and Microstructural Properties of Water Glass Activated Slag. MRS Online Proc. Libr. 1991, 245, 49–54. [Google Scholar] [CrossRef]
- Bian, Z.; Jin, G.; Ji, T. Effect of combined activator of Ca(OH)2 and Na2CO3 on workability and compressive strength of alkali-activated ferronickel slag system. Cem. Concr. Compos. 2021, 123, 104179. [Google Scholar] [CrossRef]
- Nedeljković, M.; Ghiassi, B.; Van der Laan, S.; Li, Z.; Ye, G. Effect of curing conditions on the pore solution and carbonation resistance of alkali-activated fly ash and slag pastes. Cem. Concr. Res. 2018, 116, 146–158. [Google Scholar] [CrossRef]
- Song, S.; Jennings, H.M. Pore Solution Chemistry of Alkali-Activated Ground Granulated Blast Furnace Slag. Cem. Concr. Res. 1999, 29, 159–170. [Google Scholar] [CrossRef]
- Huang, G.; Wang, M.; Liu, Q.; Zhao, S.; Liu, H.; Liu, F.; Feng, L.; Song, J. Simultaneous utilization of mine tailings and steel slag for producing geopolymers: Alkali-hydrothermal activation, workability, strength, and hydration mechanism. Constr. Build. Mater. 2024, 414, 135029. [Google Scholar] [CrossRef]
- Zhang, W.; Yao, X.; Yang, T.; Liu, C.; Zhang, Z. Increasing mechanical strength and acid resistance of geopolymers by incorporating different siliceous materials. Constr. Build. Mater. 2018, 175, 411–421. [Google Scholar] [CrossRef]
- Kohani Khoshkbijari, R.; Farahmandfar, A.; Zehni, N.; Samimi, M. Properties of ground granulated blast-furnace slag-based geopolymer mortars containing glass powder, feldspar, and metakaolin under different curing conditions. Constr. Build. Mater. 2024, 435, 136753. [Google Scholar] [CrossRef]
- Chen, P. GB/T 8074-2008 Testing Method for Specific Surface of Cement-Blaine Method; Standardization Administration of China: Beijing, China, 2008. [Google Scholar]
- GB/T 208-2014; Test Method for Determinging Cement Density. Standardization Administration of China: Beijing, China, 2014.
- GB/T 17671-2021; Test Methods of Cement Mortar Strength. Standardization Administration of China: Beijing, China, 2021.
- GB/T 12959-2024; Test Methods for Heat of Hydration of Cement. Standardization Administration of China: Beijing, China, 2024.
- Yang, T.; Yao, X.; Gu, G.; Zhu, H. Effects of slag on reaction and composition of alkali-activated fly ash-slag blends. J. Nanjing Tech. Univ.(Nat. Sci. Ed.) 2015, 37, 19–26. [Google Scholar]
- Yang, T.; Yao, X.; Zhang, Z.; Wang, H. Mechanical property and structure of alkali-activated fly ash and slag blends. J. Sustain. Cem. -Based Mater. 2012, 1, 167–178. [Google Scholar] [CrossRef]
- Ates, F.; Park, K.; Kim, K.; Woo, B.-H.; Kim, H.G. Effects of treated biomass wood fly ash as a partial substitute for fly ash in a geopolymer mortar system. Constr. Build. Mater. 2023, 376, 1–11. [Google Scholar] [CrossRef]
- Sun, Z.; Vollpracht, A. Isothermal calorimetry and in-situ XRD study of the NaOH activated fly ash, metakaolin and slag. Cem. Concr. Res. 2017, 103, 110–122. [Google Scholar] [CrossRef]
- Yuan, R. Cementitious Material Science; Wuhan University of Technology Press: Wuhan, China, 1996. [Google Scholar]
- Bernal, S.; Provis, J.; Rose, V.; Mejia, R. Evolution of Binder Structure in Sodium Silicate-Activated Slag-Metakaolin Blends. Cem. Concr. Compos. 2011, 33, 46–54. [Google Scholar] [CrossRef]
- Shi, C. Alkali-Activated Cements and Concretes; CRC Press: Boca Raton, FL, USA, 2003. [Google Scholar]
- Rafeet, A.; Vinai, R.; Soutsos, M.; Sha, W. Effects of slag substitution on physical and mechanical properties of fly ash- based alkali activated binders (AABs). Cem. Concr. Res. 2019, 122, 118–135. [Google Scholar] [CrossRef]
- Chithiraputhiran, S.; Neithalath, N. Isothermal Reaction Kinetics and Temperature Dependence of Alkali Activation of Slag, Fly Ash and Their Blends. Constr. Build. Mater. 2013, 45, 233–242. [Google Scholar] [CrossRef]
- Mahmood, A.; Babaee, M.; Foster, S.; Castel, A. Capturing the early-age physicochemical transformations of alkali-activated fly ash and slag using ultrasonic pulse velocity technique. Cem. Concr. Compos. 2022, 130, 104529. [Google Scholar] [CrossRef]
- Study on the structure and composition of activated fly ash. Chin. Environ. Sci. 1996, 1, 51–55.
- Fang, H. Study on Hydration Characteristics and Kinetics of Composite Binder; China University of Mining and Technology: Beijing, China, 2015. [Google Scholar]
- Zhang, Z.; Wang, H.; Provis, J.; Bullen, F.; Reid, A.; Zhu, Y. Quantitative Kinetic and Structural Analysis of Geopolymers. Part 1. The Activation of Metakaolin With Sodium Hydroxide. Thermochim. Acta 2012, 539, 23–33. [Google Scholar] [CrossRef]
- Zhang, Z.; Provis, J.; Wang, H.; Bullen, F.; Reid, A. Quantitative kinetic and structural analysis of geopolymers. Part 2. Thermodynamics of sodium silicate activation of metakaolin. Thermochim. Acta 2013, 565, 163–171. [Google Scholar] [CrossRef]
- G, I.; Singh, B.; Deshwal, S.; Bhattacharyya, S.K. Effect of sodium carbonate/sodium silicate activator on the rheology, geopolymerization and strength of fly ash/slag geopolymer pastes. Cem. Concr. Compos. 2018, 97, 226–238. [Google Scholar] [CrossRef]
- Nath, S.K.; Mukherjee, S.; Maitra, S.; Kumar, S. Kinetics study of geopolymerization of fly ash using isothermal conduction calorimetry. J. Therm. Anal. Calorim. 2017, 127, 1953–1961. [Google Scholar] [CrossRef]
- Liang, G.; Yao, W. Effect of diatomite on the reaction kinetics, early-age chemical shrinkage and microstructure of alkali-activated slag cements. Constr. Build. Mater. 2023, 376, 131026. [Google Scholar] [CrossRef]
- Huang, G.; Lv, Y.; Ren, S.; Liao, Y.; Wang, X.-Y.; Guo, R.; Lin, R.-S. Production of low-CO2 ternary binder using red sandstone, cement, and granulated blast furnace slag: A comprehensive performance analysis. Constr. Build. Mater. 2024, 431, 136576. [Google Scholar] [CrossRef]
- Liang, G.; Liu, T.; Li, H.; Wu, K. Shrinkage mitigation, strength enhancement and microstructure improvement of alkali-activated slag/fly ash binders by ultrafine waste concrete powder. Compos. Part B Eng. 2022, 231, 109570. [Google Scholar] [CrossRef]
- Lin, R.-S.; Han, Y.; Wang, X.-Y. Macro–meso–micro experimental studies of calcined clay limestone cement (LC3) paste subjected to elevated temperature. Cem. Concr. Compos. 2021, 116, 103871. [Google Scholar] [CrossRef]
- Rivera, O.G.; Long, W.R.; Weiss, C.; Moser, R.D.; Williams, B.; Torres Cancel, K.; Gore, E.R.; Allison, P. Effect of elevated temperature on alkali-activated geopolymeric binders compared to portland cement-based binders. Cem. Concr. Res. 2016, 90, 43–51. [Google Scholar] [CrossRef]
- Wang, K.; Shah, S.; Mishulovich, A. Effects of Curing Temperature and NaOH Addition on Hydration and Strength Development of Clinker-Free CKD-Fly Ash Binders. Cem. Concr. Res. 2004, 34, 299–309. [Google Scholar] [CrossRef]
- Scrivener, K.; Snellings, R.; Lothenbach, B. A Practical Guide to Microstructural Analysis of Cementitious Materials; CRC Press: Boca Raton, FL, USA, 2015. [Google Scholar]
- Silva, D.; John, V.; Ribeiro, J.L.; Roman, H.R. Pore size distribution of hydrated cement pastes modified with polymers. Cem. Concr. Res. 2001, 31, 1177–1184. [Google Scholar] [CrossRef]
- Wang, S.; Zhang, G.; Wang, Z.; Huang, T.; Wang, P. Evolutions in the properties and microstructure of cement mortars containing hydroxyethyl methyl cellulose after controlling the air content. Cem. Concr. Compos. 2022, 129, 104487. [Google Scholar] [CrossRef]
- Li, S.; Zhang, W.; Ning, Y.; Casas, J. Utilization of ultra-fine dredged sand from the Yangtze River in alkali-activated slag/fly ash mortars: Mechanical properties, drying shrinkage and microstructure. Case Stud. Constr. Mater. 2023, 19, e02264. [Google Scholar] [CrossRef]
- Lou, Y.; Huang, M.; Kang, S.; Hu, M.; Wu, W.; Chen, S. Study on basic performance and drying shrinkage of binary solid waste geopolymer prepared with recycled powders and slag. Case Stud. Constr. Mater. 2024, 20, e03195. [Google Scholar] [CrossRef]
- Luo, X.; Huang, L.; Wei, L.; Chen, M.; Zhou, Z.; Zhang, T. A technique for preparing one-part geopolymers by activating alkali-fused lithium slag with solid sodium silicate. Constr. Build. Mater. 2024, 435, 136817. [Google Scholar] [CrossRef]
- Zhang, M.; He, M.; Zhang, J. Mitigation of efflorescence for multi-componential geopolymer: Influence of steel slag, flue gas desulfurization gypsum and pre-curing periods. J. Clean. Prod. 2023, 403, 136835. [Google Scholar] [CrossRef]
- Lu, X.; Tian, Y.; Jiskani, I.M.; Zhou, W.; Zhao, B.; Ding, X.; Ao, Z. Innovate geopolymer synthesis for green mine road construction: Analysis of efflorescence behavior and strength analysis. Constr. Build. Mater. 2023, 401, 132963. [Google Scholar] [CrossRef]


Disclaimer/Publisher’s Note: The statements, opinions and data contained in all publications are solely those of the individual author(s) and contributor(s) and not of MDPI and/or the editor(s). MDPI and/or the editor(s) disclaim responsibility for any injury to people or property resulting from any ideas, methods, instructions or products referred to in the content. |
© 2024 by the authors. Licensee MDPI, Basel, Switzerland. This article is an open access article distributed under the terms and conditions of the Creative Commons Attribution (CC BY) license (https://creativecommons.org/licenses/by/4.0/).