
Dust Pollution in Construction Sites in Point-Pattern Housing Development


Abstract
:1. Introduction
2. Materials and Methods
3. Results
- -
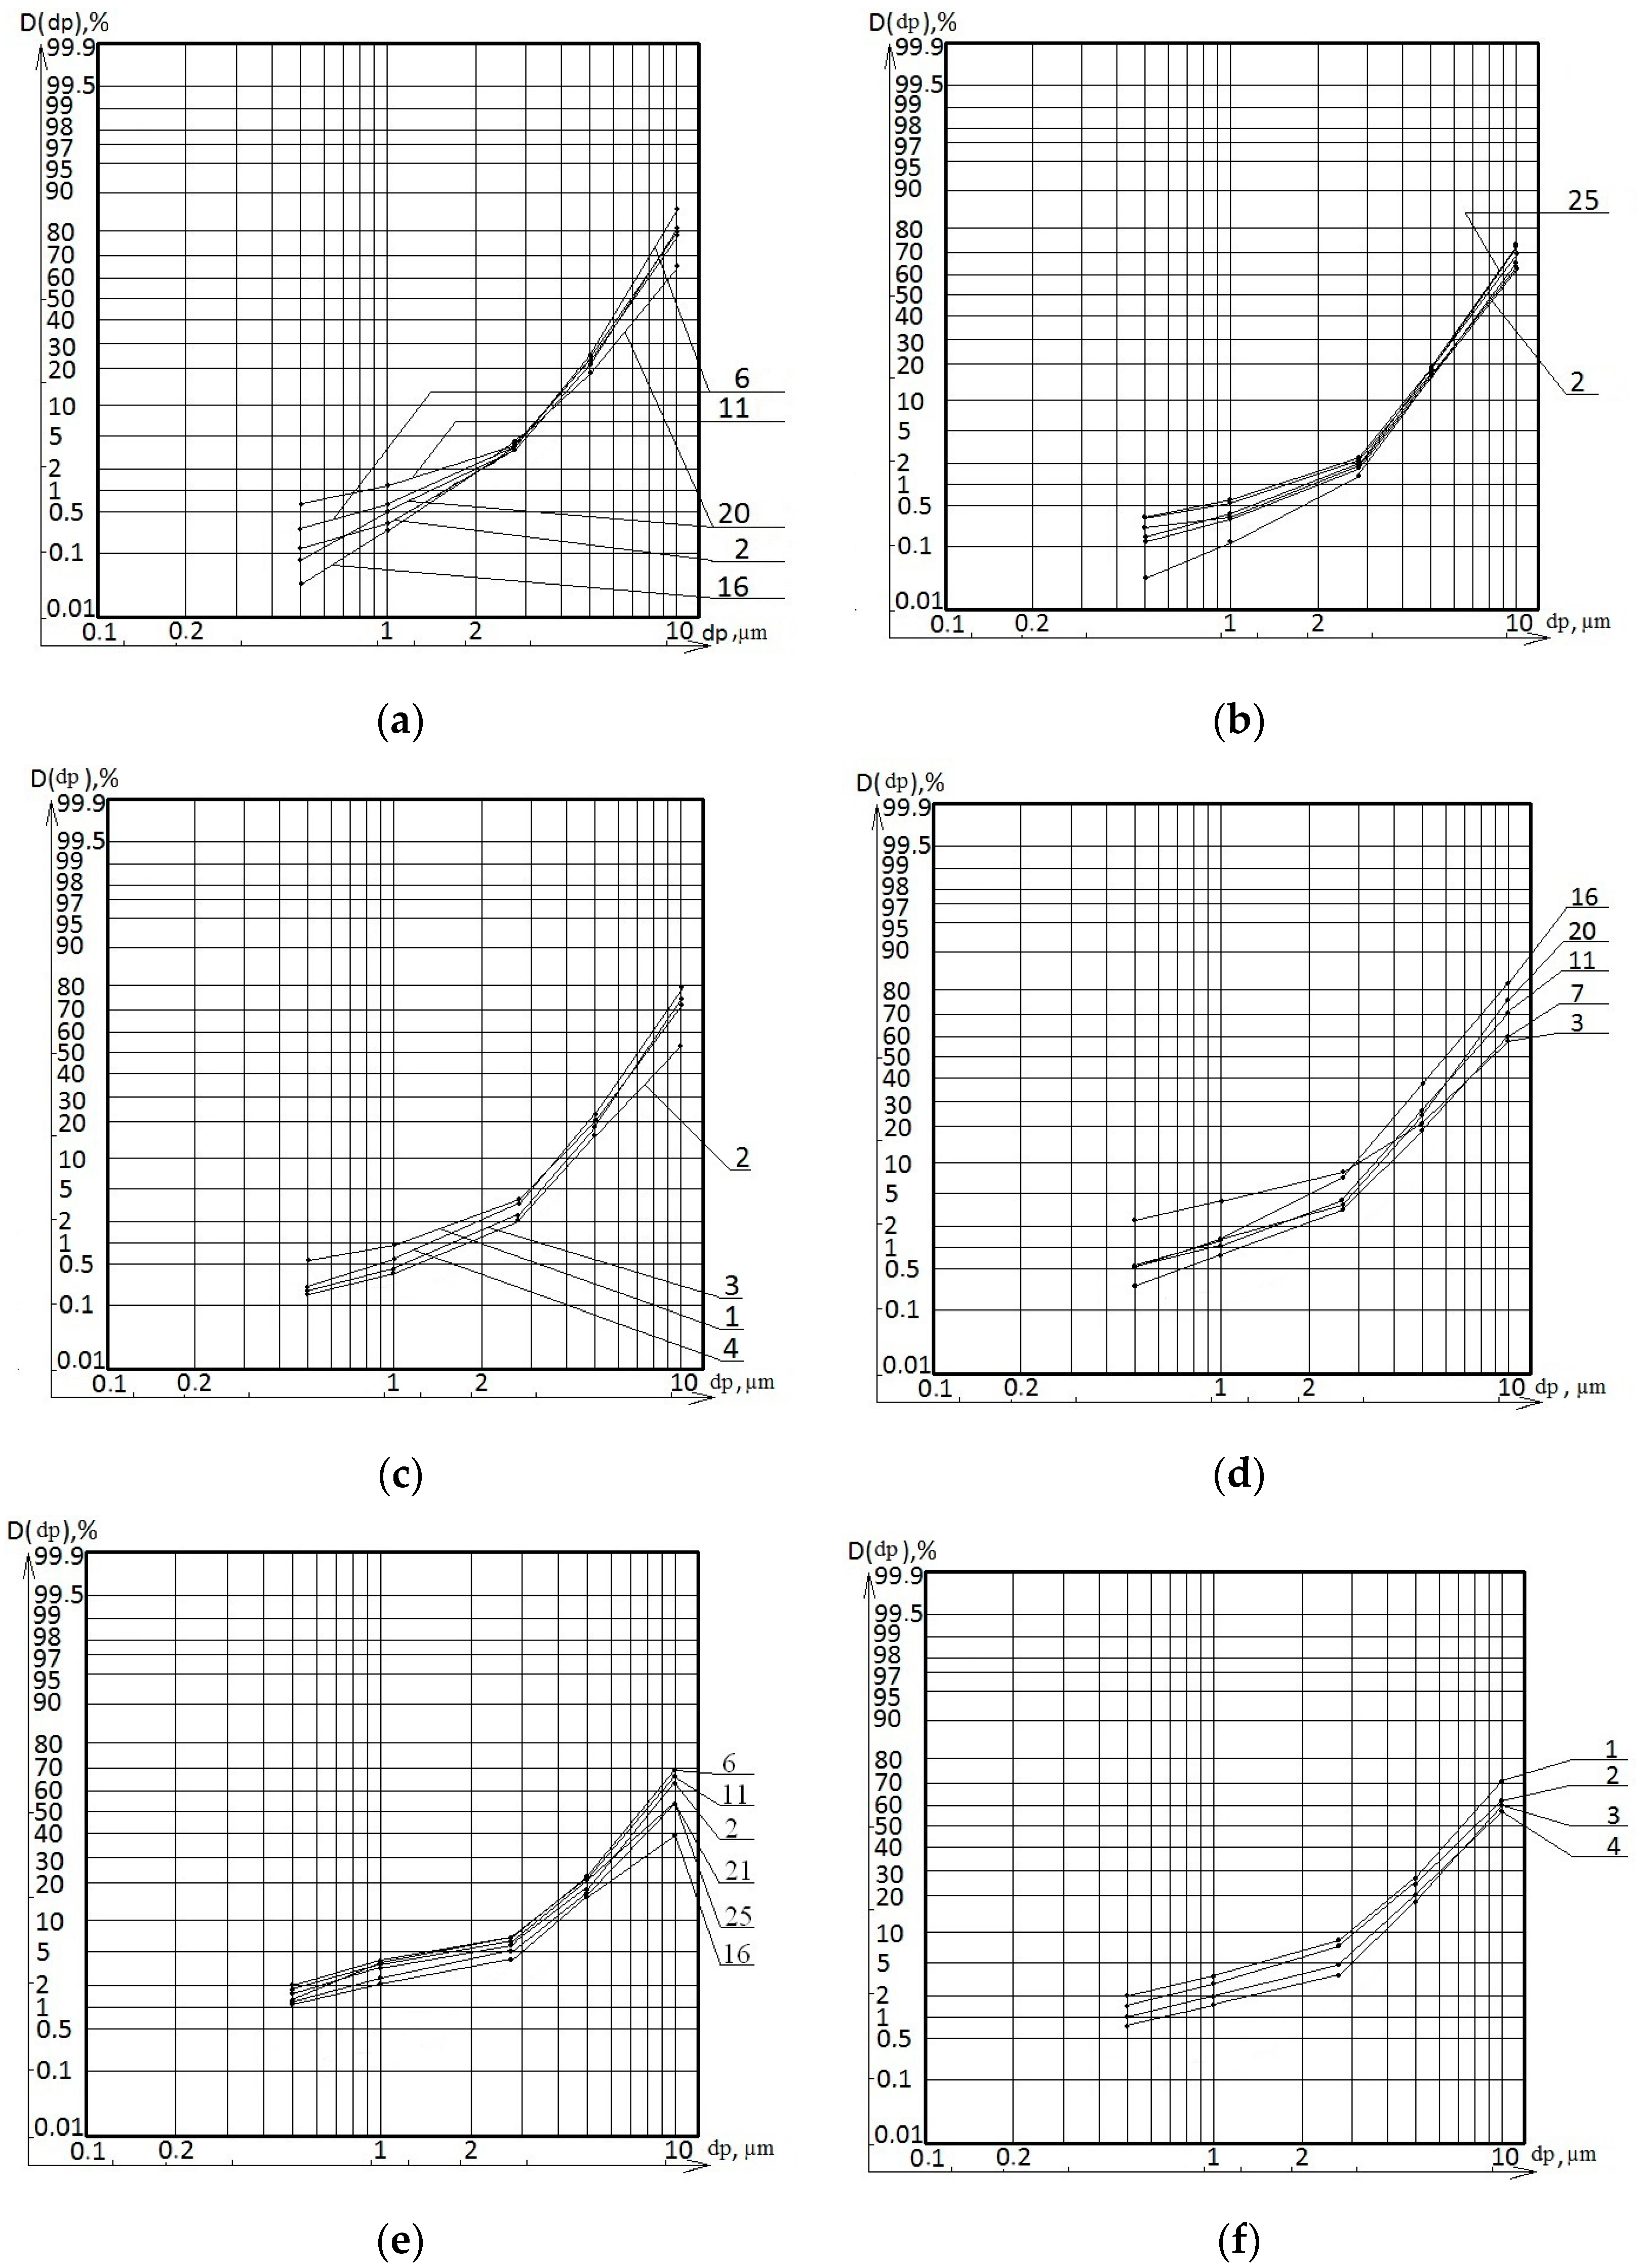
- In summer, the percentage of PM10 dust in the total amount varies between 51% and 80%, whereas in winter, this indicator is in the range of 57–70.05%.
- -
- In the winter months, the concentration of PM2.5 dust particles near construction sites increases to 3–8% of their total weight, while in summer, this figure ranges between 2–3%. For smaller particles PM1, seasonal fluctuations are observed: in summer, their level varies from 0.4% to 0.9%, whereas in winter, it rises to 1.4–4%. As for the smallest particles PM0.5, their share in the total dust amount increases in winter to 0.7–2%, while summer values remain in the range from 0.2% to 0.55%.
4. Discussion
5. Conclusions
Funding
Data Availability Statement
Conflicts of Interest
References
- Lumens, M.E.G.L.; Spee, T. Determinants of exposure to respirable quartz dust in the construction industry. Ann. Occup. Hyg. 2001, 45, 585–595. [Google Scholar] [CrossRef] [PubMed]
- Dickerson, D.E. Environmental relative burden index: A streamlined life cycle assessment method for facilities pollution prevention. J. Green Build. 2016, 11, 95–107. [Google Scholar] [CrossRef]
- Hu, M. Assessment of effective energy retrofit strategies and related impact on indoor environmental quality. J. Green Build. 2017, 12, 38–55. [Google Scholar] [CrossRef]
- Zuo, J.; Rameezdeen, R.; Hagger, M.; Zhou, Z.; Ding, Z. Dust pollution control on construction sites: Awareness and self-responsibility of managers. J. Clean. Prod. 2017, 166, 312–320. [Google Scholar] [CrossRef]
- Sarkar, A.; Thakur, B.; Gupta, A. Generation and Control of construction dust at Residential building construction site in Kolkata, India. Goolden Jubil. Year Spec. Issue 2023, 2023, 90–94. [Google Scholar]
- Sarkar, A.; Thakur, B.; Gupta, A. Particulate pollution at construction sites of Kolkata and associated health burden for exposed construction workers. Urban Clim. 2023, 52, 101750. [Google Scholar] [CrossRef]
- Wu, Z.; Zhang, X.; Wu, M. Mitigating construction dust pollution: State of the art and the way forward. J. Clean. Prod. 2016, 112, 1658–1666. [Google Scholar] [CrossRef]
- Tong, R.; Cheng, M.; Zhang, L.; Liu, M.; Yang, X.; Li, X. The construction dust-induced occupational health risk using Monte-Carlo simulation. J. Clean. Prod. 2018, 184, 598–608. [Google Scholar] [CrossRef]
- Chen, X.; Guo, C.; Song, J.; Wang, X.; Cheng, J. Occupational health risk assessment based on actual dust exposure in a tunnel construction adopting roadheader in Chongqing, China. Build. Environ. 2019, 165, 106415. [Google Scholar] [CrossRef]
- Cheriyan, D.; Choi, J.-H. A review of research on particulate matter pollution in the construction industry. J. Clean. Prod. 2020, 254, 120077. [Google Scholar] [CrossRef]
- Xu, L.; Pei, Z. Preparation and Optimization of a Novel Dust Suppressant for Construction Sites. J. Mater. Civ. Eng. 2017, 29, 04017051. [Google Scholar] [CrossRef]
- Noh, H.-J.; Lee, S.-K.; Yu, J.-H. Identifying Effective Fugitive Dust Control Measures for Construction Projects in Korea. Sustainability 2018, 10, 1206. [Google Scholar] [CrossRef]
- Evelyn, T.N.; Simone, H.; Ton, S.; Judith, S.; Friso, S.; Mieke, L.; Dick, H. Dust control measures in the construction industry. Ann. Occup. Hyg. 2003, 47, 211–218. [Google Scholar]
- Mweendi, P.; Shafodino, F.; Munyaradzi, Z.; Mwapagha, L. Assessment of Bacteria, Morphological Characteristics, and Elemental Composition of Dust Fallout. J. Geosci. Environ. Prot. 2023, 11, 114–130. [Google Scholar] [CrossRef]
- Samaradiwakara, D.S.; Pitawala, H.M.T.G.A. Extent of air pollution in Kandy area, Sri Lanka: Morphological, mineralogical and chemical characterization of dust. Ceylon J. Sci. 2021, 50, 475–486. [Google Scholar] [CrossRef]
- Karin, A.-D.; Clifford, K.; Hand, J. Dust Under the Radar: Rethinking How to Evaluate the Impacts of Dust Events on Air Quality in the United States. GeoHealth 2023, 7, 1029. [Google Scholar]
- Kim, M.-S.; Kim, J.-Y.; Park, J.; Yeon, S.-H.; Shin, S.; Choi, J. Assessment of Pollution Sources and Contribution in Urban Dust Using Metal Concentrations and Multi- Isotope Ratios (13C, 207/206Pb) in a Complex Industrial Port Area, Korea. Atmosphere 2021, 12, 840. [Google Scholar] [CrossRef]
- Xing, J.; Ye, K.; Zuo, J.; Jiang, W. Control Dust Pollution on Construction Sites: What Governments Do in China? Sustainability 2018, 10, 2945. [Google Scholar] [CrossRef]
- Zhang, Y.; Tang, W.; Li, H.; Guo, J.; Wu, J.; Guo, Y. The Evaluation of Construction Dust Diffusion and Sedimentation Using Wind Tunnel Experiment. Toxics 2022, 10, 412. [Google Scholar] [CrossRef]
- Tao, G.; Feng, J.; Feng, H.; Feng, H.; Zhang, K. Reducing Construction Dust Pollution by Planning Construction Site Layout. Buildings 2022, 12, 531. [Google Scholar] [CrossRef]
- Klaver, Z.M.; Crane, R.C.; Ziemba, R.A.; Bard, R.L.; Adar, S.D.; Brook, R.D.; Morishita, M. Reduction of Outdoor and Indoor PM2.5 Source Contributions via Portable Air Filtration Systems in a Senior Residential Facility in Detroit, Michigan. Toxics 2023, 11, 1019. [Google Scholar] [CrossRef] [PubMed]
- Yu, B.; Lu, X.; Fan, X.; Fan, P.; Zuo, L.; Yang, Y.; Wang, L. Analyzing environmental risk, source and spatial distribution of potentially toxic elements in dust of residential area in Xi’an urban area, China. Ecotoxicol. Environ. Saf. 2021, 208, 111679. [Google Scholar] [CrossRef] [PubMed]
- Han, S.-W.; Joo, H.-S.; Kim, K.-C.; Cho, J.-S.; Moon, K.-J.; Han, J.-S. Modification of Hybrid Receptor Model for Atmospheric Fine Particles (PM2.5) in 2020 Daejeon, Korea, Using an ACERWT Model. Atmosphere 2024, 15, 477. [Google Scholar] [CrossRef]
- Dietrich, M.; Barlow, C.F.; Entwistle, J.A.; Meza-Figueroa, D.; Dong, C.; Gunkel-Grillon, P.; Jabeen, K.; Bramwell, L.; Shukle, J.T.; Wood, L.R.; et al. Predictive modeling of indoor dust lead concentrations: Sources, risks, and benefits of intervention. Environ. Pollut. 2023, 319, 121039. [Google Scholar] [CrossRef] [PubMed]
- Li, Z.; Guo, H.; Zhang, L.; Liang, D.; Zhu, Q.; Liu, X.; Zhou, H. Time-Series Monitoring of Dust-Proof Nets Covering Urban Construction Waste by Multispectral Images in Zhengzhou, China. Remote Sens. 2022, 14, 3805. [Google Scholar] [CrossRef]
- Kumi, L.; Jeong, J.; Jeong, J.; Lee, J. Empirical Analysis of Dust Health Impacts on Construction Workers Considering Work Types. Buildings 2022, 12, 1137. [Google Scholar] [CrossRef]
- Tian, G.; Li, G.; Yan, B.-L.; Huang, Y.-H.; Qin, J.-P. Spatial dispersion laws of fugitive dust from construction sites. Huan Jing Ke Xue 2008, 29, 259–262. [Google Scholar]
- Cheng, S.; Chen, D.; Li, J.; Wang, H. An ARPS-CMAQ Modeling Approach for Assessing the Atmospheric Assimilative Capacity of the Beijing Metropolitan Region. Water Air Soil Pollut. 2007, 181, 211–224. [Google Scholar] [CrossRef]
- Burgos, W.; Ellwood, A. Regulatory Methods Used in Writing NPDES Permits for the Shipbuilding and Repair Industry. Nav. Eng. J. 2009, 111, 91–97. [Google Scholar]
- Kim, J.-H.; Sohn, J.-I.; Oh, S.-Y. Environmental monitoring of toxic metals in roadside soil and dust in Ulsan, South Korea: Pollution evaluation and distribution characteristics. Environ. Monit. Assess. 2020, 192, 773. [Google Scholar] [CrossRef]
- Stephanie, W.; Alistair, S.; Yongming, T.; Marc, S.; Andrew, Y.; Eddy, R.; Andy, W. The simulation of mineral dust in the United Kingdom Earth System Model UKESM1. Atmos. Chem. Phys. 2022, 22, 14503. [Google Scholar]
- Samek, L.; Styszko, K.; Stegowski, Z.; Zimnoch, M.; Skiba, A.; Turek-Fijak, A.; Gorczyca, Z.; Furman, P.; Kasper-Giebl, A.; Rozanski, K. Comparison of PM10 Sources at Traffic and Urban Background Sites Based on Elemental, Chemical and Isotopic Composition: Case Study from Krakow, Southern Poland. Atmosphere 2021, 12, 1364. [Google Scholar] [CrossRef]
- Azarov, V.N.; Trokhimchyk, M.K.; Sidelnikova, O.E. Research of dust content in the earthworks working area. Procedia Eng. 2016, 150, 2008. [Google Scholar] [CrossRef]
- Menzelintseva, N.V.; Karapuzova, N.Y.; Mikhailovskaya, Y.S.; Redhwan, A.M. Efficiency of standards compliance for PM10 and PM2.5. Int. Rev. Civil Eng. 2016, 7, 1. [Google Scholar]
- Evtushenko, A.; Lupinogin, V.; Kaluzgina, E.; Strelyaeva, A.; Sakharova, A. Investigation of air pollution with fine dust during repair and construction work inside premises. IOP Conf. Ser. Earth Environ. Sci. 2021, 937, 022082. [Google Scholar] [CrossRef]
- Sergina, N.M. Issues of protection of atmospheric air against dust pollution in production of construction materials. IOP Conf. Ser. Mater. Sci. Eng. Int. Conf. Constr. Archit. Technosphere Saf. 2019, 687, 066034. [Google Scholar] [CrossRef]
- GOST R 58577-2019; Regulation for Establishment of Permissible Limits of Pollutant Emissions by Economic Entities Being Projected and in Operation and Methods of Determination of the Limits. Russian Federation: Moscow, Russia, 2019.
- Lapko, A.; Vasiliy, L. Estimation of traditional numerical characteristics of lognormal distribution laws of a one-dimensional random variable in conditions of large volume statistical data. Izmer. Tekh. 2024, 2, 23–29. [Google Scholar] [CrossRef]
- GOST R 56929-2016; Emissions of the Polluting Substances in the Atmosphere. Research of Fractional Composition of Dust by Optical Method at Rationing Quality of Atmospheric Air. Russian Federation: Moscow, Russia, 2016.
- Huang, Y. Cascades and Kolmogorov’s lognormal scaling in two-dimensional bacterial turbulence. Phys. Fluids 2024, 36, 065149. [Google Scholar] [CrossRef]
- WHO Global Air Quality Guidelines. Particulate Matter (PM2.5 and PM10), Ozone, Nitrogen Dioxide, Sulfur Dioxide and Carbon Monoxide; World Health Organization: Geneva, Switzerland, 2021. [Google Scholar]
- Ishkuvatov, R.; Musatov, D.; Shen, A. Approximating Kolmogorov complexity. Computability 2023, 12, 283–297. [Google Scholar] [CrossRef]


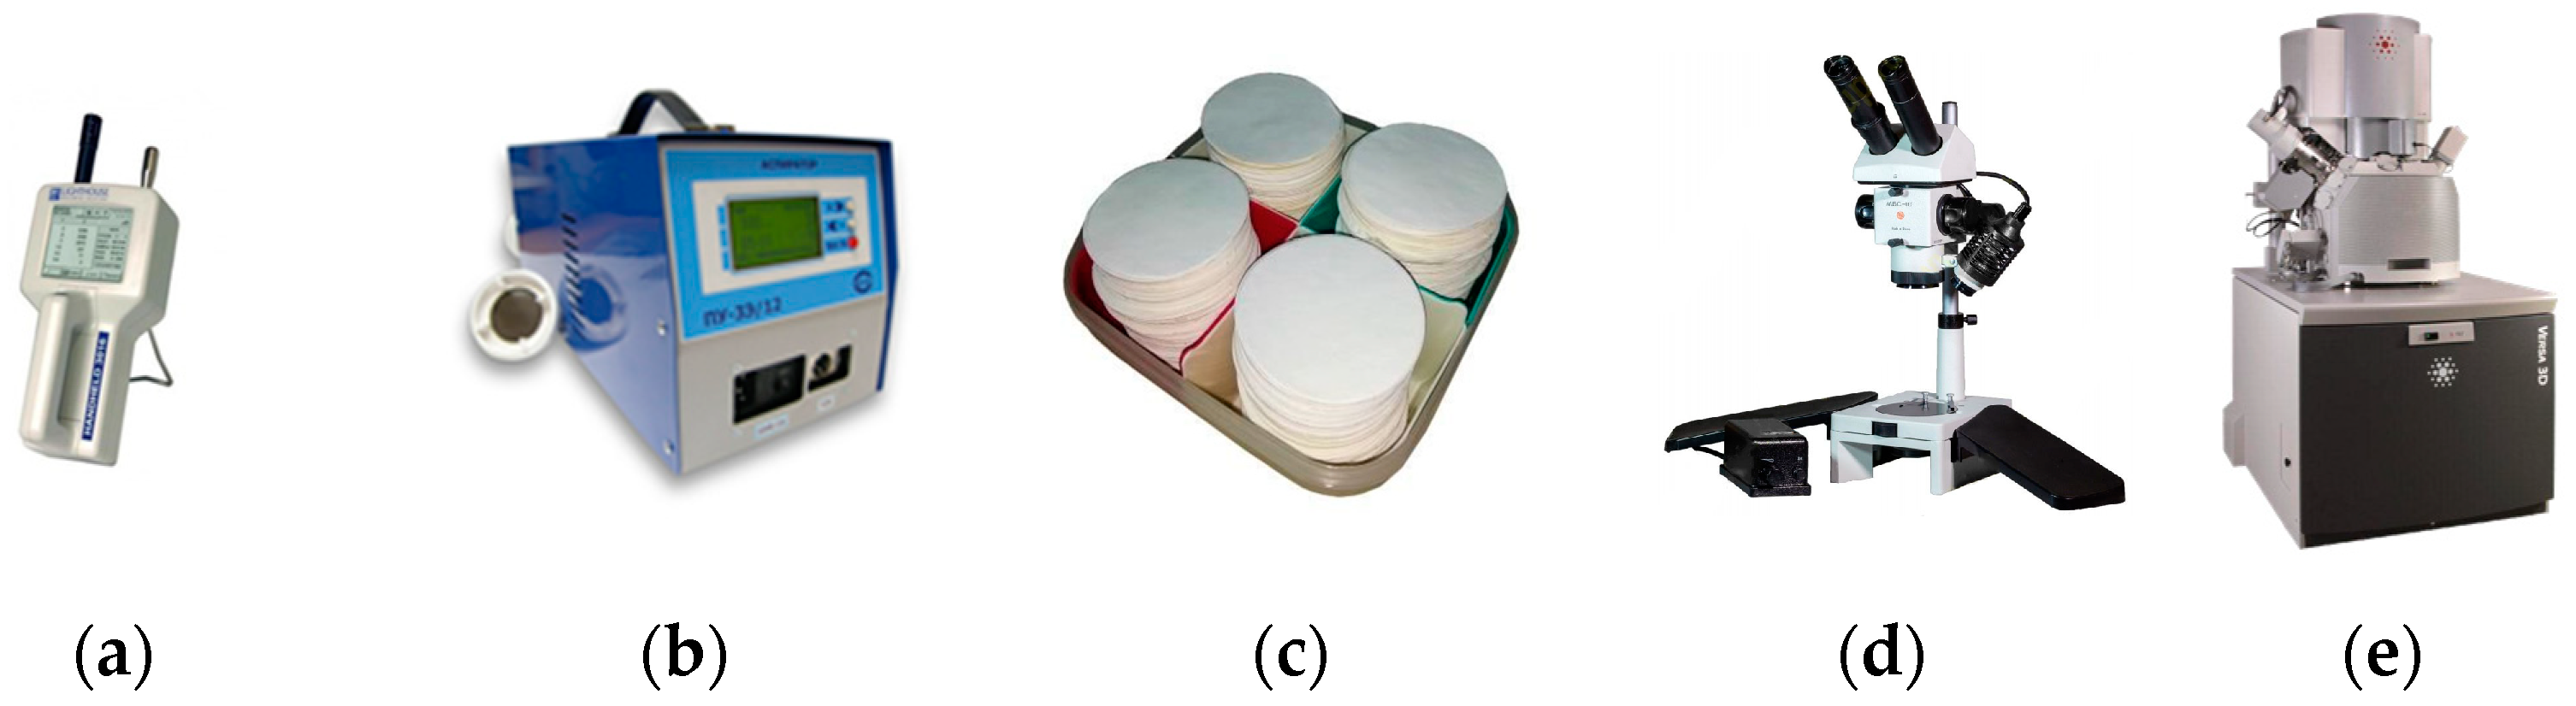
| Devices and Equipment | Specification |
|---|---|
| Lighthouse Handheld 3016 particle counter | Handheld 3016: 0.3–25 µm, 0.1 CFM (2.83 LPM) flow rate View 6 particle sizes simultaneously Approximate mass concentration in µg/m3 Memory for storing data (3000 samples) Concentration limit—4,000,000/ft3 50-record configurable recipe database 200 user-defined alphanumeric location labels open Architecture Connectivity with OPC Server Operating: 50–104 °F (10–40 °C)/20–95% non-condensing |
| PU-3E/12 electric respirator | Metrological support—the device is included in the Russian State Register No. 14531-13 Installation and stabilization of flow through channels (40–150 L/min per channel), setting the sampling time (min), indication of the selected volume through the channel (L), air humidity, temperature, atmospheric pressure, battery voltage are displayed, the history of completed selections is maintained The volume of the air sample is measured by the built-in electronic volume meter The number of parallel samples is from 1 to 3 The filter resistance is not more than 2 kPa A total air consumption of at least 200 L/min The limit of the basic relative error of measuring the sample volume is ±5% The duration of sampling in the range from 2 to 60 min Operating: relative humidity up to 98% at 25 °C; ambient temperature from 263 to 313 K (−10–+40 °C); atmospheric pressure is 84–106.7 kPa (630–800 mmHg). Sampling AFA aerosol filters |
| AFA VP-10 aerosol filters | Designed for gravimetric method The material used in the fibers of the fabric is perchlorovinyl The working surface area of the filter is 10 cm2 The permissible air load on the filter is 70 L/min |
| MBS-10 stereoscopic microscope | Magnification in the range 4–100 times Linear field of vision in the range 39–2.4 mm, Operating distance is no less 95 mm, lens f = 90 mm Illumination source is halogen lamp 12 V/20 W The change in the interpupillary distance is from 56 to 72 mm, rounded magnification values: 7, 4, 2, 1 and 0.6 times |
| Versa 3D DualBeam FEI electron-ion (bi-beam) microscope | High-resolution field emission SEM column optimized for high-brightness/high-current, Schottky thermal field emitter 60-degree objective lens geometry with through-the-lens differential pumping Accelerating voltage: 200 V–30 kV; landing voltage range: standard—200 V–30 kV; beam deceleration—50 V–30 kV Probe current: up to 200 nA—continuously adjustable Magnification 30×–1280k× in “quad” mode Pump-down time (high vacuum): <6 × 10⁻⁴ Pa Low vacuum: 10–200 Pa, ESEM vacuum: 10–4000 Pa Extended vacuum range to 4000 Pa |
| Object of the Study | Sampling Location, Floor/Sampling Point | Concentration, mug/m3 |
|---|---|---|
| 25-storey residential building next to the construction site | 2 | 1825 |
| 6 | 4842 | |
| 11 | 1009 | |
| 16 | 684 | |
| 21 | 1216 | |
| 25 | 703 | |
| Construction site | 1 | 312 |
| 2 | 844 | |
| 3 | 809 | |
| 4 | 658 | |
| 20-storey house with repair and construction works | 2 | 1696 |
| 6 | 956 | |
| 11 | 360 | |
| 16 | 4018 | |
| 20 | 10,761 |
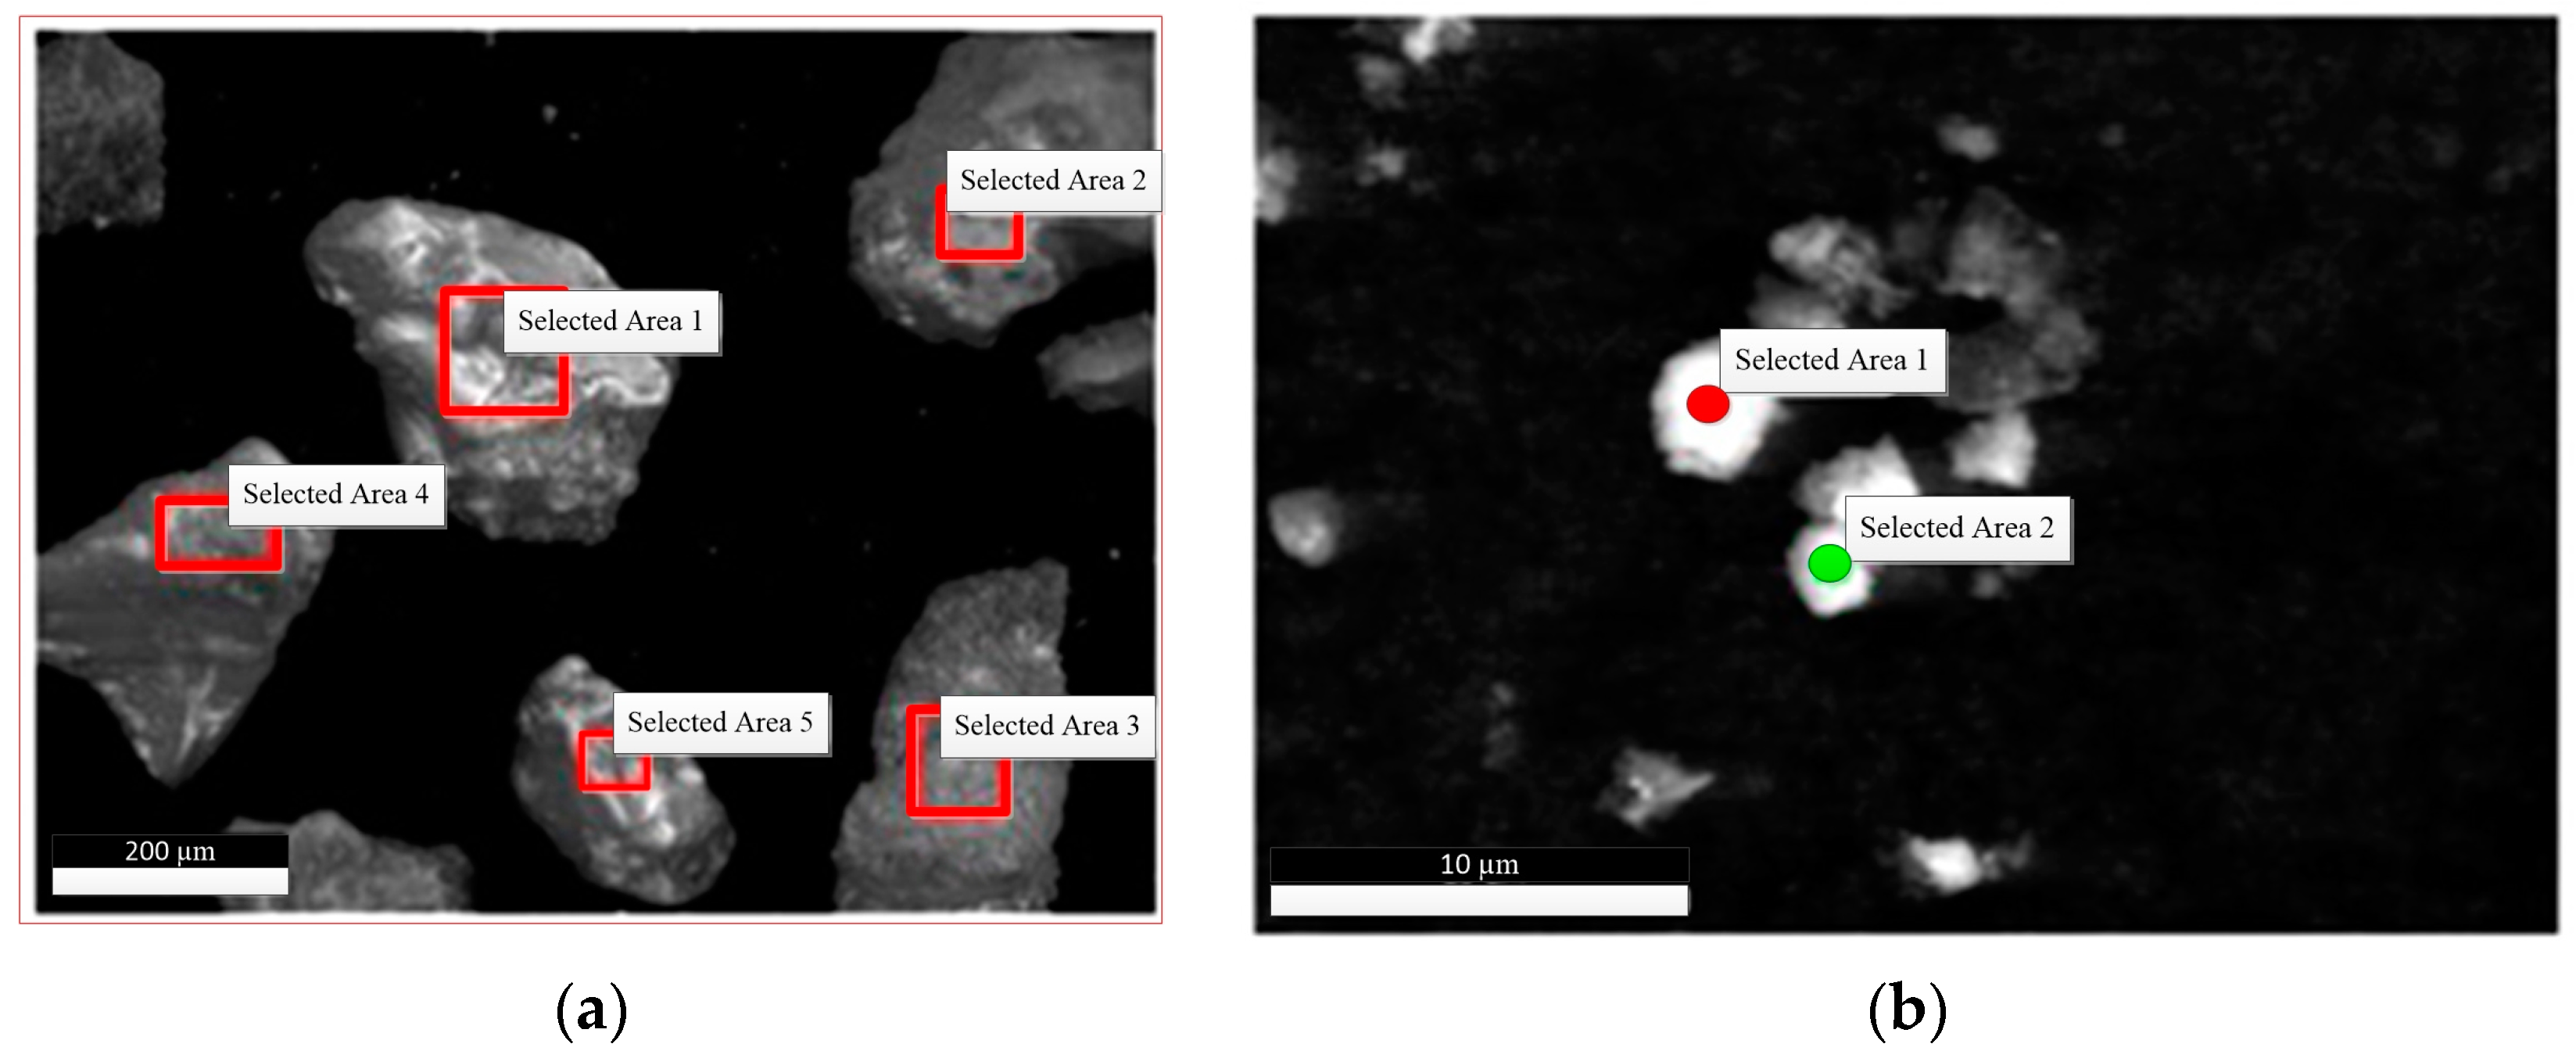
| Element | Weight Fraction, % | Atomic Fraction, % | Imprecision, % | ||||||||||||
|---|---|---|---|---|---|---|---|---|---|---|---|---|---|---|---|
| C | 18.60 | 7.3 | 15.5 | 13.4 | 12.9 | 27.01 | 12.3 | 24.01 | 23.01 | 19.01 | 10 | 28 | 9 | 9 | 1 |
| O | 48.00 | 45.3 | 50.7 | 50.1 | 55.01 | 50.9 | 54.3 | 59.1 | 8.06 | 61.01 | 9 | 8 | 9 | 9 | 8 |
| Na | 0.25 | 0.2 | 0.6 | 0.3 | 0.3 | 0.3 | 0.4 | 0.4 | 0.16 | 0.15 | 19 | 19 | 19 | 27 | 20 |
| Mg | 0.10 | 0.2 | 0.2 | 0.2 | 0.1 | 0.6 | 0.1 | 0.14 | 0.2 | 0.13 | 38 | 14 | 26 | 14 | 26 |
| Al | 1.06 | 0.54 | 2.1 | 1.5 | 1.6 | 0.7 | 0.7 | 1.3 | 0.9 | 0.9 | 6 | 6 | 5 | 6 | 4 |
| Si | 25.25 | 44.5 | 5.3 | 10.9 | 28.01 | 16.1 | 27 | 4.11 | 8.2 | 17.7 | 3 | 2 | 4 | 3 | 3 |
| S | 1.7 | 0.25 | 8.01 | 0.5 | 0.5 | 0.6 | 0.4 | 5.1 | 0.2 | 0.3 | 5 | 12 | 2 | 10 | 9 |
| K | 0.7 | 0.47 | 0.7 | 0.7 | 0.9 | 0.2 | 0.3 | 0.2 | 0.3 | 0.1 | 11 | 11 | 11 | 10 | 9 |
| Ca | 3.33 | 0.1 | 12.6 | 20.9 | 1.98 | 1.2 | 0.9 | 6.1 | 10.3 | 0.8 | 2 | 6 | 1 | 1 | 2 |
| Fe | 1.1 | 0.06 | 2.4 | 0.03 | 0.02 | 0.2 | 0.4 | 0.7 | 0.3 | 0.2 | 10 | 4 | 3 | - | - |
| Element | Weight Fraction, % | Atomic Fraction, % | Imprecision, % | |||
|---|---|---|---|---|---|---|
| C | 28.5 | 41.3 | 45.11 | 44.03 | 7 | 7 |
| O | 45.4 | 38.3 | 38.92 | 37.11 | 9 | 9 |
| Na | 0.06 | 0.12 | 0.13 | 0.16 | 26 | 26 |
| Mg | 0.34 | 0.21 | 0.26 | 0.16 | 11 | 11 |
| Al | 0.45 | 1.04 | 0.5 | 0.58 | 5 | 5 |
| Si | 2.01 | 4.98 | 1.9 | 2.8 | 4 | 3 |
| S | 0.3 | 0.4 | 0.25 | 0.2 | 7 | 7 |
| K | 0.2 | 0.3 | 0.16 | 0.16 | 9 | 8 |
| Ca | 0.05 | 0.15 | 0.12 | 0.08 | 16 | 16 |
| Fe | 23.2 | 12.7 | 10.2 | 5.01 | 1 | 1 |
Disclaimer/Publisher’s Note: The statements, opinions and data contained in all publications are solely those of the individual author(s) and contributor(s) and not of MDPI and/or the editor(s). MDPI and/or the editor(s) disclaim responsibility for any injury to people or property resulting from any ideas, methods, instructions or products referred to in the content. |
© 2024 by the author. Licensee MDPI, Basel, Switzerland. This article is an open access article distributed under the terms and conditions of the Creative Commons Attribution (CC BY) license (https://creativecommons.org/licenses/by/4.0/).
Share and Cite
Manzhilevskaya, S. Dust Pollution in Construction Sites in Point-Pattern Housing Development. Buildings 2024, 14, 2991. https://doi.org/10.3390/buildings14092991
Manzhilevskaya S. Dust Pollution in Construction Sites in Point-Pattern Housing Development. Buildings. 2024; 14(9):2991. https://doi.org/10.3390/buildings14092991
Chicago/Turabian StyleManzhilevskaya, Svetlana. 2024. "Dust Pollution in Construction Sites in Point-Pattern Housing Development" Buildings 14, no. 9: 2991. https://doi.org/10.3390/buildings14092991
APA StyleManzhilevskaya, S. (2024). Dust Pollution in Construction Sites in Point-Pattern Housing Development. Buildings, 14(9), 2991. https://doi.org/10.3390/buildings14092991