Abstract
An online inspection method based on machine vision was proposed and validated to address the issues of high work intensity, low efficiency, low accuracy, and risk of missed inspection in traditional sampling methods for screw threads of rebar head. Firstly, an industrial camera was used to capture real-time images of the processed rebar thread heads, preprocess the images, and locate the target positions in the images to reduce the complexity and running time of subsequent algorithms. Then, the Canny operator was used to roughly extract the edge feature information of the rebar head, and the Shi–Tomasi algorithm was used for corner inspection to achieve precise optimization of sub-pixel level corners. Based on robust linear regression, the diagonal points were fitted with lines to detect the corresponding size parameters. Finally, an inspection system on screw threads of rebar head parameter was designed and developed, which consisted of an image-acquisition device, Siemens PLC controller, and inspection software. Test results show that this method can achieve online inspection without contact, with inspection accuracy reaching the micrometer level, and 8–10 rebar heads can be inspected per second.
1. Introduction
In the realm of construction engineering, rebars serve as the backbone of structural integrity, providing essential support and reinforcement to concrete structures. The effectiveness of these rebars is significantly enhanced through the application of threading, which not only facilitates their secure integration into the concrete matrix but also improves their mechanical performance. Rebar threads play a pivotal role in ensuring the stability, strength, and durability of various construction projects, ranging from residential buildings to large-scale infrastructure such as bridges and tunnels [1]. As an important component of mechanical connection, the screw threads of rebar head are mainly processed by ribbing and rolling, whose shape is shown in Figure 1. The processing quality of thread heads is extremely important to the quality and safety of engineering, and their size parameters directly affect the processing quality of finished products as well. Due to the harsh processing environment, the wear or damage to the cutter heads of ribbing and rolling, or the improper operation by operators and so on, will lead to damage, deformation, oversize, or undersize to the screw threads, thereby affecting the connection quality. Therefore, the accuracy and consistency obtained from the measurement and inspection of screw threads are crucial for the connection of rebars [2].
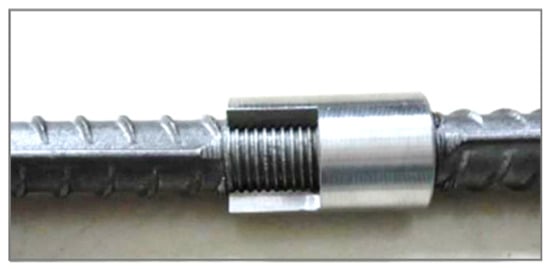
Figure 1.
Rebar head in kind.
Despite the critical importance of rebar threads, detecting and evaluating their quality and integrity remain challenging tasks. Ongoing research in the field of thread measurement highlights the significance of measuring thread characteristics. During industrial inspection, inspection methods on thread size are categorized into two types: contact and non-contact.
Contact measurement principally involves using gauges [3], the three-pin method [4], and so on for a detailed or single-parameter assessment to the screw threads of rebar head. Despite their widespread usage, the aforementioned measurement methods have their limitations. Gauges have a slow inspection speed and cannot obtain the specific size of the thread head. The increase in rolling automation and production speed has made traditional manual-based thread quality sampling and testing methods inefficient, imprecise, and prone to leaks. This makes it difficult for such methods to meet the needs of modern production, and as such, non-contact measurement has become a trend.
Non-contact measurement techniques mainly include laser inspection, eddy current inspection, ultrasonic inspection, and the microscopic measurement method, among others [5]. An automatic thread parameter measurement system was introduced by Tong et al. [6], which was based on the laser measurement theory. The system employed a position sensitive device (PSD) to measure the coordinate data of the thread profile and uses a precision grating to detect and estimate the thread profile’s axial displacement. An inspection system was designed by Yang et al. [7] to evaluate defects in workpieces by monitoring impedance changes in the inspection coil of an eddy current sensor. They used the principle of eddy current flaw inspection to identify defects in the thread root of the drilling rod. Li et al. [8] established an experimental platform for laser ultrasonic inspection. They employed the thermoelastic effect and laser interferometric reception method to observe the directionality of the transverse wave generated by a point-focused excitation and the effects of defects on the ultrasonic signals at the inner surface. This enabled the location of cracks on the inner surface of round pipe-type thread components. This study succeeded in localizing cracks on the inner surface of a circular pipe thread component. Companies such as KORDT in Germany [9] and Universe in the United States have developed thread detectors that can measure various thread parameters, eliminating errors caused by visual fatigue or subjectivity, and accurate data is efficiently recorded as a result. Of the non-contact measurement methods mentioned above, laser inspection can measure the thread diameter; however, laser inspection is more sensitive to environmental factors, and its application is limited. Eddy current and ultrasonic inspection, on the other hand, qualify the threads, but cannot determine the specific size of the rebar thread head. Eddy current inspection is applicable to small batches, while ultrasonic inspection is mainly reserved for large-scale equipment in coal-fired power plants and other non-destructive inspections. Although industrial microscopes and other optical principles can meet the accuracy requirements for thread measurement, improving the inspection speed is difficult. While various detectors can measure a variety of parameters, their high cost can pose challenges for enterprise production and operation.
With the development of digital measurement technology, non-contact inspection technology based on machine vision has been widely used in the industrial field, and it has become a trend to use image-processing technology as the core method of online inspection [10]. Machine vision is a computer technology that mimics the human visual system. By analyzing and interpreting the image data, it allows the computer to identify and understand the objects, scenes, and movements in the image, extract and judge the target feature information, and make the corresponding decision or feedback, which provides new opportunities for online inspection of the dimensional parameters of rebar screw threads. Gadelmawla [11] developed a non-contact measurement system using a measurescope, personal computer, and developed software, for measuring and inspecting most of the common types of screw threads. Zhou et al. [12] developed a thread parametric measurement system that was based on machine vision technology. The system used the rotation of the threaded workpiece to collect contour data of the thread. This was achieved by following the thread with the camera against a parallel backlight. The system allowed for parametric measurement of threads. Mohamed A et al. [13] employed machine vision technology to examine cylindrical parts by locating the outer circle, thus completing the inspection process. A two-stage, high-precision imaging system was developed by Hunsicker, Randal J. [14] of the University of North Carolina at Charlotte, USA, by utilizing a calibration gauge pin to calibrate the pixel ratio of the vision system and two pitch standards (max, min) to correct for lighting and image distortion. Little research has been conducted on vision-based thread measurement, and existing methods or equipment utilized for such measurement are either time-consuming or expensive. No single effective measurement method currently exists, and many cannot be utilized for online inspection on production lines.
To solve the problems of high work intensity, low efficiency, and poor precision associated with traditional manual sampling inspection of the rebar thread head, the automatic inspection technology based on machine vision was studied. In this paper, suitable image-preprocessing algorithms to obtain high-quality images and reduce the complexity of subsequent image-processing algorithms were designed. Secondly, edge extraction and sub-pixel corner detection of the image were achieved through a series of inspection algorithms. In order to measure the pitch diameter, a corresponding mathematical model to measure the pitch diameter was established. The Gray Wolf Optimization algorithm (GWO) has a strong convergence, a simple structure, few parameters, and an adaptive adjustment of convergence factor and information feedback mechanism, which can well achieve the balance between local optimization and global search, and perform in both solution precision and convergence speed. Therefore, the optimized mathematical model of pitch diameter measurement by GWO was proposed. In addition, in order to reduce inspection errors caused by cone threads, this study also established a length-compensation mathematical model for the major diameter, pitch diameter, and minor diameter of rebar thread heads based on the actual processing situation of the factory.
The remainder of this paper is structured as follows. The principles and methods of screw threads inspection for rebar head are presented in Section 2. The composition, development, and design of the rebar thread head inspection system are analysed and evaluated in detail in Section 3. The inspection results and discussion are illustrated in Section 4. Finally, the conclusions are presented in Section 5.
2. Method
Online inspection of rebar thread head with machine vision primarily relies on feature extraction and parameter recognition to the image. The inspection results are displayed through the web end, of which, image processing is the critical component. Figure 2 shows the basic process of image processing for screw threads of rebar head.
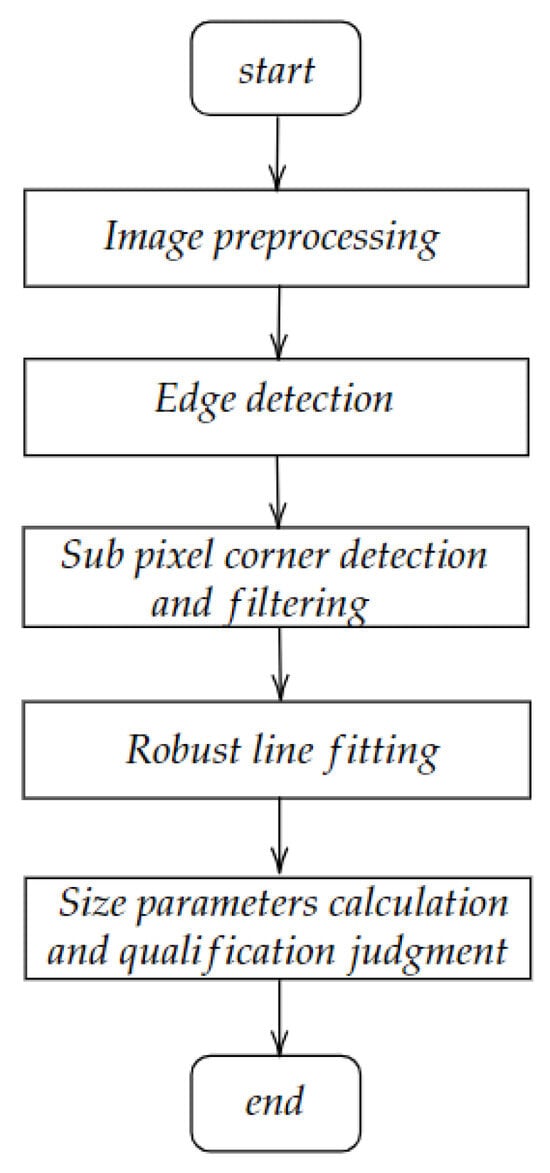
Figure 2.
Basic process of image processing for screw threads of rebar head.
- Image preprocessing. The collected color raw images are converted into grayscale images to improve the image-processing speed and facilitate later image processing. After that, the algorithm of adaptive weighted median filtering is adopted to filter out noise information. Multi-scale top-hat transform is used to achieve adaptive morphology image enhancement while retaining thread edge information and suppressing burrs and isolated points. The extraction of the Regions of Interest (ROI) to locate the target is crucial in reducing the complexity and running time of subsequent algorithms.
- Edge detection. The goal of this research is to extract edge feature information from threaded images of rebar head with the adaptive Canny operator.
- Detection and screening of subpixel corners. The corner points are detected by the Shi–Tomasi algorithm, and ultimately achieving adaptive localization and precise optimization of subpixel corners based on OpenCV.
- Robust linear regression is employed in this study to fit the line, thereby mitigating the effects of outliers on the regression model and enhancing the robustness and reliability of the fit.
- The processed rebar heads are evaluated for quality by measuring the distance between the point and the straight line and comparing the rebar size parameters with the national standard.
2.1. Image Pre-Processing
The color image of the rebar head is captured by the camera. However, the on-site environment and signal conversion during shooting and transmission will degrade the image quality. As a result, the image contains significant amounts of noise and coolant residue on the surface. In addition, a large number of images contain useless background information, which will increase the algorithmic complexity and computational load of the original image processing. Therefore, it is critical to perform image pre-processing and extract the relevant parameters. Thus, pre-processing of the image is necessary to extract the relevant size parameters. The primary techniques for image pre-processing include grayscale transformation, image denoising, image enhancement, and extraction of ROI.
2.1.1. Grayscale Transformation
The color images captured by the industrial camera are comprised of three components, R, G, and B, which contain vast amounts of information, making it difficult and slow to process. To simplify subsequent image processing, the color image needs to be converted to grayscale first. The grayscale value can be calculated by employing the luminance weighting method, which assigns varying weights to different colors based on the human eye’s sensitivity, as presented in Equation (1):
where the conversion coefficients for grayscale images are denoted by the variables and , while R, G, and B represent the three monochrome components of RGB. These conversion coefficients may be adjusted depending on the specific circumstances. Upon conversion to grayscale, the size, shape, and original feature information of the image remain unchanged.
2.1.2. Adaptive Weighted Median Filtering
The basic principle of median filtering is to replace the gray value of the current pixel with the median value of the pixels within a window [15]. If the probability of black and white noise exceeds 20%, the filtering effect will considerably drop with traditional median filtering as it does not differentiate between the noise and regular points within the window. Once the ratio of invalid noise points becomes more than 50%, the median point can be considered as a noise point, which defeats the purpose of filtering. To tackle the issue of filtering failure, adaptive median filtering adjusts the size of the filter window and sets judgment conditions to distinguish between the noise point and the median point. If the window is identified to contain noise points, then the output value of the filtering process is the median pixel point within the neighborhood. However, if there is no noise pollution in the window, then the output value shall be the same as the original pixel point. Referring to the flow chart in Figure 3, the variables , , , , , , , and correspond to the image to be processed, the filtered image, any pixel point on the image coordinates, the filter window size, the maximum value of the adaptive window size, the maximum pixel value of the current window, the minimum pixel value of the current window, and the median pixel value of the current window, respectively.
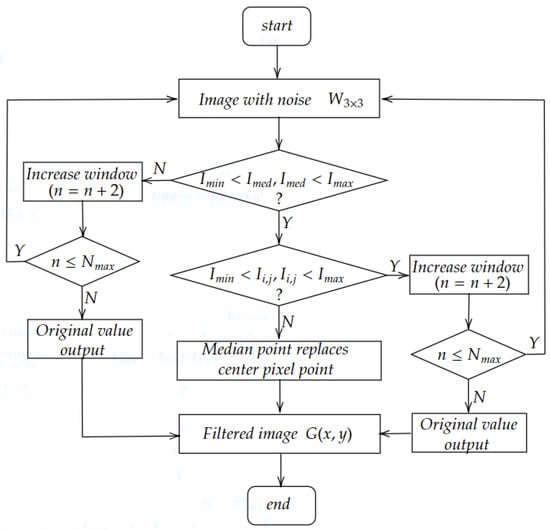
Figure 3.
Flow chart of adaptive median filtering algorithm.
2.1.3. Multi-Scale Top-Hat Transformation
The multi-scale top-hat transformation is a morphological method that accentuates small details or local areas in an image [16]. Detailed information that can improve image edges is extracted by computing the difference between the original image and a set of structural elements with diverse scales. A square design is a popular choice for structural elements. According to Figure 4, nL represents the size of the square structural element , whereas nW denotes the size of square edge structural element . Additionally, nM refers to the size of the edge in . With and , the multi-scale top-hat transformation can extract bright or dim images with size no more than M.
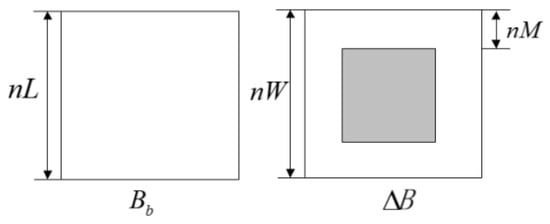
Figure 4.
The square structural elements.
Assuming the utilization of structural elements with scales, the size of each structural element will gradually change across scales, as presented in Equations (2) and (3):
where denotes the growth step for the size in every scale.
Equations (4)–(9) express expansion, erosion, open operation, close operation, and top-hat transformation with multiple scales of structural element .
where f is the input image, and are, respectively, the definitions domain of and , , , , . represents gray expansion, represents gray corrosion, represents gray open operation, represents gray close operation, represents white top-hat transformation, and represents black top-hat transformation. By changing from 1 to n, multi-scale bright and dim image regions can be extracted.
The multi-scale structure elements contain multi-scale structure information about the target region, thus enhancing the performance of the top-hat transformation for region extraction to some extent. Moreover, the suppression of negative grayscale values helps to reduce some noise, which enhances the effectiveness of the target enhancement.
2.1.4. Extraction of ROI
The extraction of ROI is a crucial step in image processing. Its primary purpose is to locate the target rebar thread head in the image and demarcate it through a rectangular box for subsequent processing. The ROI is a part of the image that significantly reduces its size, simplifying the subsequent algorithms and improving the system’s operational speed. To extract the ROI, the target image’s edge contour is searched with the help of OpenCV, and the results are stored as a set of points within the contour container. The Douglas–Peucker algorithm [17] is then used to approximate the points within the contour using a given threshold. The curve is gradually approximated until it satisfies the approximation accuracy requirements, forming a polygon contour that constitutes the extracted ROI region.
2.2. Edge Detection
In an image, the edge of an object often refers to an area where the grayscale value of the image suddenly changes. It is also the place with the most information.
The common methods of edge detection can be divided into traditional differential operator edge-detection algorithms and modern ones. There are many traditional edge-detection algorithms, such as Sobel operator, Roberts operator, Laplacian operator, Log operator, Prewitt operator, Kirsch operator, and so on [18]. The basic principle of the above algorithm is to calculate the gradient of the local area window, which has high real-time performance and a low implementation cost. However, it is highly sensitive to noise in the target-detection image and has a low signal-to-noise ratio. Modern edge-detection algorithms include edge detection using neural networks, genetic algorithms, ant colony algorithms, and so on. They have high robustness and high edge-positioning accuracy, but require a large amount of data for training, which result in high detection costs and are not suitable for online detection. John Canny proposed three criteria for evaluating edge extraction: signal-to-noise ratio criteria, positioning accuracy criteria, and unilateral response criteria. Based on these three criteria, the Canny operator was proposed [19]. The Canny operator has better accuracy than the above methods. Here, the Canny operator is used to extract the edge features of the rebar thread head, and the specific process is as follows:
(1) The Canny operator first uses a Gaussian filter to remove image noise before processing and uses the first derivative of a two-dimensional Gaussian function to smooth the image. The two-dimensional Gaussian function is shown in Equation (10):
where the gradient vector is as follows:
In order to improve the operational speed of the Canny operator, the two-dimensional convolution template of ∇G(x, y) is decomposed into two one-dimensional filters, which are shown in Equations (12) and (13):
where k is the derivative coefficient. Convolve these two templates with the image f(x,y) to obtain Ex and Ey.
Let , , where reflects the edge intensity at the (i, j) point on the image, α (i, j) is the direction of the edge, and σ is a parameter which affects the quality of the Gaussian filter.
(2) Use finite differences with 2 * 2 neighborhoods in both horizontal and vertical directions to obtain the gradient of data array M(x, y). Partial derivative in both directions at point (x, y), defined as and are expressed in Equations (16) and (17), respectively.
The calculation of derivatives is very sensitive to noise. It is easy to make misinspection if the edge detection is performed on an image only from horizontal and vertical directions. The gradient amplitude and gradient direction of a pixel are calculated with the transformation formula from rectangular coordinates to polar coordinates, and the gradient amplitude and direction are calculated with the second order norm in Equation (18) and Equation (19), respectively.
If the gradient amplitude Q (x, y) of a pixel point (x, y) is greater than or equal to the gradient amplitude of two adjacent pixel points along the gradient direction P (x, y), it can be determined that the point is a possible edge point.
(3) In order to obtain more accurate edge points of the rebar thread head image, it is necessary to subdivide them to find the edge points with the most prominent amplitude fluctuations. The processing flow for non-maximum suppression is as follows: First, find the non-zero point of the gradient intensity, and find two adjacent points along the gradient direction of the point. If the amplitude of these two adjacent points is greater than their starting point, it can be determined that the point is not on the edge. Otherwise, it can be used as a candidate edge point.
(4) The algorithm of dual threshold uses high and low thresholds for segmentation of images that have undergone non-maximum suppression. In this way, by continuously marking edge points, unclosed edge points can be connected into edge contours, thereby obtaining the edges of the image.
2.3. Corner Detection and Screen
To collect specific information about the edge corner points, it is necessary to carry out corner point detection on the edge curve of the rebar thread head. The commonly used algorithms for corner point detection mainly include Harris corner point detection [20] and Shi–Tomasi corner point detection [21]. The latter is an improvement of the former. Compared with other complex corner detection algorithms, the Shi–Tomasi algorithm has lower computational complexity, so it can achieve faster processing speed, especially suitable for real-time processing or a resource-limited environment. By improving the corner response function of Harris, the algorithm improves the stability of corner detection and can detect corner more accurately even when there is noise or texture change in the image. In addition, due to the robustness of the algorithm itself and the tunability of parameters, the Shi–Tomasi algorithm can adapt to different image types and scenes, including indoor, outdoor, lighting changes, and other complex environments. As the principle of it is relatively simple and easy to integrate, so it has been widely used and recognized in the field of computer vision and image processing. Therefore, the Shi–Tomasi algorithm is selected for corner point detection in this paper.
The Shi–Tomasi corner-detection algorithm detects corner points based on the variation of grayscale. The following specific process is used:
(1) Define a window function that utilizes the window to scan across the original image, and produce a grayscale alteration in the following manner:
where w(x,y) represents the window function, I(x + u, y + v) denotes the gray level of the image after panning, and I(x, y) refers to the original image gray level. The gray level of the image after panning can be calculated using the following expression:
where and refer to the partial derivatives of the image I, which are also the gradient maps of the image in the x and y directions. represents the higher order infinitesimal term. Taking Equation (21) to Equation (20), the result is as follows:
The final form can be obtained by removing the variables u and v:
where matrix M is located as follows:
where R represents the corner point response function, while and refer to the eigenvalues.
(2) Define the corner point response function R:
(3) To identify a corner point, a threshold is established and the value of the Corner Response Function (CRF) for the pixel point is compared to it. If the CRF value exceeds the threshold, the pixel is classified as a corner point.
(4) To obtain sub-pixel level coordinates with higher accuracy, we perform iterative optimisation with the Lucas–Kanade iterative algorithm (LK) based on OpenCV. The LK algorithm is a commonly employed optical flow estimation algorithm for computing the sub-pixel level coordinates of feature points in an image. During the iterative process, the algorithm continuously adjusts the position of the corner point by comparing the changes in gray values of the surrounding pixels. Then the sub-pixel level coordinates of the corner point are calculated, providing a more precise estimation of its sub-pixel level position.
2.4. Robust Regression (RR)
RR is a statistical method used to build reliable regression models in data sets prone to outliers [22]. Traditional Ordinary Least Squares (OLS) [23] performs poorly when dealing with outliers. To address this problem, RR reduces this effect by applying robust estimation methods relying on M-estimation [24]. M-estimation involves iterative weighted least squares estimation of regression coefficients to derive weights wi for each point, based on the regression residuals’ magnitude. This approach ensures robustness. The objective of the optimisation function is to achieve that as follows:
where is the parameter value obtained by robust estimation; is the parameter to be estimated, which belongs to some parameter space ; n is the number of observations; is the i-th observation residuals, usually defined as , is the observed value, is the model prediction, is the independent variable; and is a robust loss function, which is a non-negative function that measures the magnitude of residuals and is insensitive to outliers. To mitigate the influence of outliers, the observations considered in the regression analysis can be weighted. This process assigns higher weights to data with smaller residuals and lower weights to outliers. The weights are established based on the size of the residuals, and a weighted least squares estimate is computed correspondingly. The weight coefficients are improved through an iterative process until the change in weight coefficients falls below a certain permissible error threshold. This method minimizes the influence of outliers on the regression coefficient estimation process and, therefore, enhances the model’s robustness.
2.5. Size Inspection of the Rebar Thread Head
Extracting the edge feature of the rebar thread head yields a series of sub-pixel angular points, denoted by , as shown in Figure 5. To inspect the dimensions of the screw threads of rebar head, a robustness regression can fit a straight line. Robust regression can be used for line fitting, calculating the distance between points and lines, the distance between points, and the angle between lines. These parameters provide the major diameter, pitch diameter, minor diameter, thread length, and thread angle.
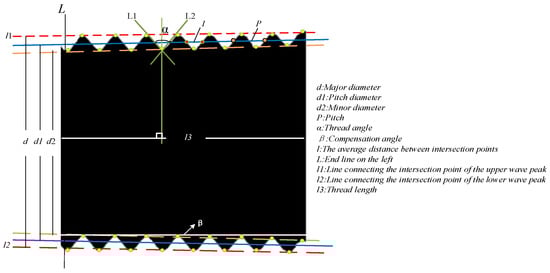
Figure 5.
Size-inspection diagram of rebar thread head.
(1) Major diameter
The equation of line l1 is , and the equation of line l2 is . Any point on l2 can be defined as point , and any point on l1 can be defined as point . The major diameter can be expressed as follows:
The minor diameter and thread length are calculated in the same manner as the major diameter.
(2) Pitch diameter
The pitch diameter is defined as the diameter of the threaded head cone that passes through the thread on the grooves and bumps of equal width. However, the ideal median diameter does not exist in actual measurement. Therefore, this paper establishes a relevant mathematical model and uses the GWO to optimize the traditional pitch diameter measurement method. Make the expression of the center diameter line be Ax + By = C. The intersection of this pitch line with each thread line is designated as points . Then, the intersection of the pitch line with each thread line is shown in Equation (28), and the average distance is shown in Equation (29).
In the expression for the pitch diameter, A, B, and C denote the three variables; , , and represent the slope intercept and other relevant parameters of the ith thread line; while l denotes the average distance. Thus, the difference between the distances of every two adjacent intersections and the average distance can be defined with Equation (30). As a result, all of the differences can be defined with Equation (31):
where refers to the absolute sum of all differences. When is at its minimum, k and b represent the slope and intercept of the pitch line. To determine the extreme value of accurately and efficiently, the GWO algorithm is utilized to solve the pitch line [25].
(3) Pitch
The pitch is defined as the axial distance between two neighboring teeth on a thread at two corresponding points on the pitch line. To obtain the pitch, we calculate the intersections of the pitch line with each thread line, then determine the distance between each of the three adjacent intersections, and finally calculate their average. We set the intersection point of the pitch diameter line and each thread line as . Then, the pitch expression can be expressed as:
(4) Thread angle
The thread angle refers to the angle between the adjacent teeth on both sides. To calculate the thread angle, the lateral edges of the adjacent teeth are extended in reverse, and the slopes of the two reverse extension lines are measured with the inverse tangent formula. In the image coordinate system, the slope of the reverse extension line L1 is assigned as k1, and the slope of the reverse extension line L2 is assigned as k2. By determining k1 and k2, as demonstrated in Equation (33) and Figure 5, the angle α of the dental angle can be calculated.
2.6. Models of Dimensional Compensation
As the actual processed thread head typically appears in a tiny cone state, as depicted in Figure 5, it is not parallel to the upper and lower states. Therefore, compensation calculation is essential when determining the major, pitch, and minor diameters. Using the calculation of the minor diameter as an example, given that the fitted upper minor diameter line makes an angle of β with the horizontal line, and considering that the processed thread head is often symmetrical up and down, the theoretically fitted lower minor diameter line also makes an angle of β with the horizontal line. To calculate the appropriate length of the minor diameter, it is crucial to compensate for its length. This compensation allows obtaining the actual array of the minor diameter length of the rebar thread head. Figure 6 illustrates the specific compensation method. By setting a particular data in the minor diameter array as m, the actual minor diameter length is calculated as . The final average minor diameter length is then calculated as . The same methodology applies to compute the major and pitch diameters.
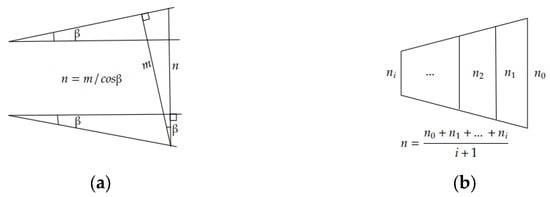
Figure 6.
(a) Mathematical model of actual minor diameter length; (b) Calculation method of the final average minor diameter length.
3. The Inspection System for Screw Threads of Rebar Head
Prior to image detection, a monocular camera undergoes calibration to determine the internal and external parameters of the camera, as well as the distortion parameters [26]. These parameters are used to convert the pixel dimensions in the image to the actual dimensions. At present, there are three common methods for camera calibration: traditional camera calibration methods, camera self-calibration methods, and active vision-based calibration methods. The Zhang Zhengyou calibration method [27] is a hybrid of traditional calibration methods and self-calibration methods. This method is based on the imaging principle and geometric relationship of the camera, which calculates correspondence between known spatial points and their corresponding image points to determine the internal and aberration parameters of the camera. Due to its high calibration accuracy and versatility, it can be used with different types of cameras, which is why the Zhang Zhengyou calibration method is employed.
The inspection system for screw threads of rebar head, based on machine vision, consists mainly of hardware and software components. The system’s schematic diagram is shown in Figure 7. The hardware components of the system include a backlight, an industrial camera, a PLC controller, etc. The software system is the measurement and management system for screw threads of rebar head, featuring a Browser/Server (B/S) architecture [28]. The system’s composition is shown in Figure 8. The browser-side component is developed through the Layui framework, a lightweight front-end UI framework based on popular web development technologies (HTML, CSS, JavaScript). This framework provides a range of UI components and rigorous coding specifications, allowing for the quick construction of responsive web pages. It also provides a variety of built-in modules, such as forms, tables, pop-ups, and rotations, to meet various development needs. In addition, Layui provides a flexible extension mechanism, allowing customisation and expansion of components according to individual needs. The server-side component is developed through the Django framework, an open-source web application framework written in Python with its own ORM system. Django provides efficient development tools and features for building complex, flexible, and secure web applications. The Django REST framework is a set of tools and libraries for building and publishing Web APIs based on the RESTful architecture. The combination of Django and the Django REST framework enables fast creation of a comprehensive web application. Django manages the server-side logic and data processing, while the Django REST framework is used for creating and deploying the web API, which facilitates data interaction and communication between the front-end and back-end systems. The program adopts the SQLite database as its preferred choice for data storage. SQLite is a lightweight, cross-platform embedded relational database management system that operates as a library, which can be directly integrated with the application. It does not require a separate server process. Additionally, it is rated as a lightweight database engine that excels in terms of speed, reliability, simplicity, and cross-platform ability. The system can operate online within the production line. To minimize expenses, the inspection system integrates a MindVision CMOS Gigabit Ethernet industrial camera with 5-megapixel and a parallel backlight. Additionally, a PLC-controlled conveyor chain transmits the rebar head to the camera lens for image acquisition, which is uploaded to a computer. The captured images are then processed using Python and OpenCV to calculate the dimensional parameters of the thread head. Based on the national standard, it is determined whether the screw threads of rebar head are qualified or not. Finally, the results of the inspection are displayed on the web front-end.
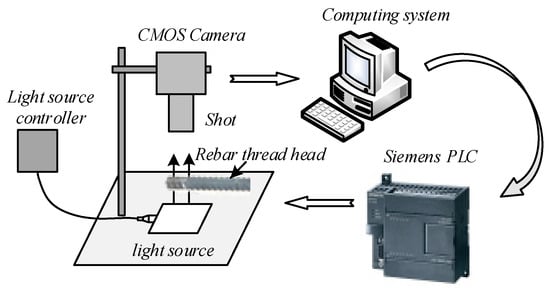
Figure 7.
Composition of the rebar thread head inspection system.
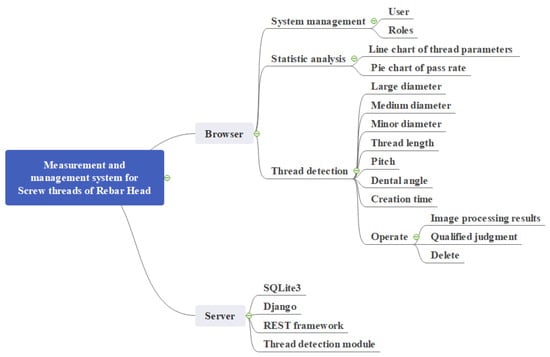
Figure 8.
Thread measurement and management system.
4. Results and Discussion
4.1. The Results of the Test
Based on the above technology, an inspection system for screw thread of rebar head was developed, which can be used to carry out the size inspection of rebar thread head. A total of 20 rebar thread heads with a diameter of 25 mm, a pitch of 3 mm, and a thread angle of 60 degrees were collected as samples under the laboratory environment, as shown in Figure 9. All the corner points could be found during the inspection process, and a straight line was fitted to the sub-pixel corner points to find the distance between point and line, the distance between point and point, and the angle between line and line. As a result, the major diameter, pitch diameter, minor diameter, thread angle, thread length, and pitch of each sample were obtained. Compare them with the national standard to determine whether they were qualified or not. The process of image processing is shown in Figure 10.
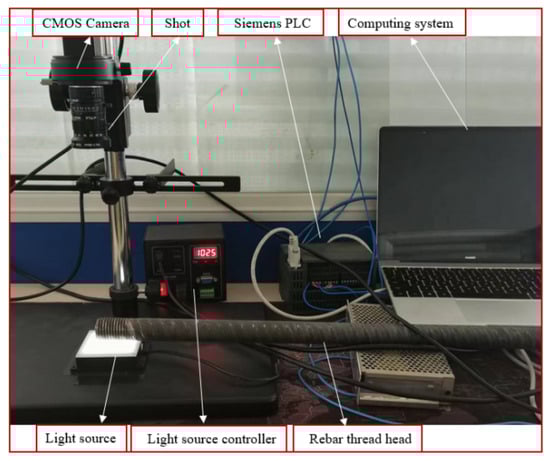
Figure 9.
Thread head sample collection in laboratory.
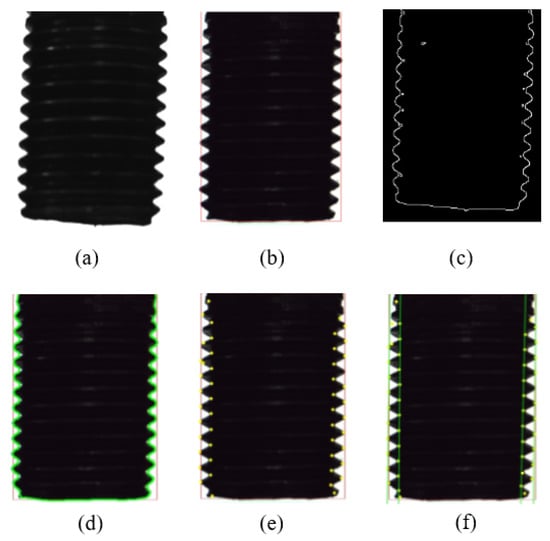
Figure 10.
(a) Image preprocessing; (b) ROI extraction; (c) Edge extraction; (d) Image contours; (e) Corner detection; (f) Robust line fitting.
Each production batch of thread heads must comply with the 6f accuracy requirements, as stated in the “Technical Specification for Mechanical Connection of Rebars JGJ 107-2016” [29] and “Ordinary Thread Tolerance GB/T 197-2018” [30]. For the rebars with diameters of 25 mm, when the size of the pitch is 3 mm, the pitch diameter should range from 23.387 mm to 23.587 mm and the major diameter should range from 25.162 mm to 25.537 mm to qualify. The thread length should range from 31 mm to 37 mm in theory. The remaining parameters should also meet the industry requirements. The inspection results are shown in Table 1.

Table 1.
Online inspection results.
To ensure the conformity of measured products and system accuracy, both the through gauge and the stop gauge were selected to verify the conformity of the screw threads. The inspection process is shown in Figure 11. The rebar thread heads are verified and found to be qualified, which indicates the accuracy of the inspection system.
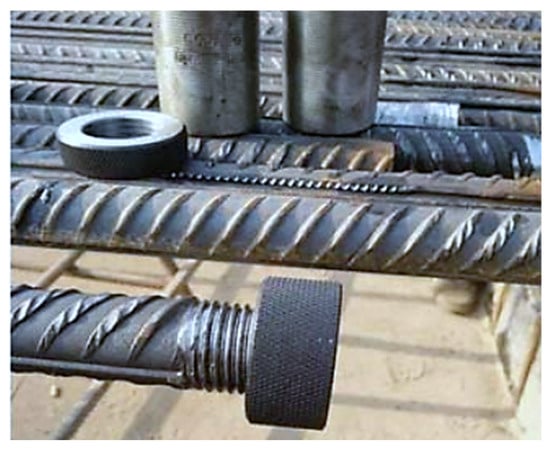
Figure 11.
The ring gauge inspection.
To validate the inspection effect of the size-inspection method for the rebar thread proposed in this paper, the algorithm’s accuracy and speed were tested in the lab. To verify the accuracy of the size measurement of rebar thread heads, taking the major diameter parameter as an example, the following specific verification method was used. A certain number of qualified thread heads were selected. First, use a micrometer to measure the length of the major diameter, and then use the proposed algorithm to measure the size of the rebar thread head in this paper. Next, the accuracy analysis of the algorithm was conducted by taking the mean, maximum, minimum, and the root-mean-square error (RMSE) of the inspection error as reference. Use the average detection time as a reference for speed analysis, where RMSE can be described as follows:
where represents the measurement error of the ith rebar thread head, n is the number of thread heads measured, is the value of inspected parameter, and is the actual value of the thread head. The specific measurement results and errors are shown in Table 2.
Table 2.
Test results of major diameter.
In order to further verify the detection effect of the proposed method in practical application, a kind of rebars with a diameter of 32 mm were used as the measurement objects. When the pitch is 3 mm, the major diameter qualified range is from 32.162 mm to 32.537 mm, and the pitch diameter qualified range is from 30.386 mm to 30.586 mm. Take a batch of rebars recently processed by an enterprise as an example to measure. As a result, 10 rebars were selected for measurement. In the laboratory environment, the pitch diameter was measured by the German KORDT optical thread comprehensive tester, the three-pin method, and the rebar thread size measurement algorithm proposed in this paper. At the same time, in order to get a theoretical pitch diameter, a micrometer was used to measure the major diameter, and the theoretical pitch diameter was calculated by Equation (35). The results measured by the above three methods were compared with the theoretical pitch diameter, and the results are shown in Table 3:
where P is the value of pitch and d is the value of major diameter.
Table 3.
Test results of pitch diameter.
In addition, we did a comprehensive analysis from cost and techniques to demonstrate the proposed system’s advantages over traditional methods. The comparison results of financial advantages and technical advantages are shown in Table 4 and Table 5.
Table 4.
The comparison results of financial advantages between proposed and traditional methods.
Table 5.
The comparison results of technical advantages between proposed and traditional methods.
4.2. Discussion
From Table 1, we can find that all 20 rebar thread heads are qualified since each parameter is within the corresponding reference range. Therefore, the qualification rate is 100%. Table 2 shows that the size-inspection algorithm of the system has a maximum measurement error of 0.034 mm, which satisfies national standard detection requirements. The minimum detection error is 0.006 mm, and the value of RMSE is 0.023 mm. At the same time, the average error in detection is 0.0215 mm. All the results meet the micrometre-level inspection criteria, whereas the average inspection speed reaches 8–10 thread heads per second. Table 3 shows that the diameters of the 10 selected rebars are all within the qualified range. Compared with the theoretical value, the results obtained by the three measurement methods are not much different, and the measured results are also within the qualified range. However, the measurement algorithm for the size of the rebar thread head proposed in this paper is closer to the theoretical value. The average error between the experimental and theoretical values is 0.0112 mm, which is smaller than that obtained by the KORDT optical thread tester, and the three-pin method proves the superiority and effectiveness of the proposed algorithm. As can be seen from Table 4, the high cost of the initial setup of machine vision systems is mainly due to the high-quality hardware equipment and software development investment. However, this investment lays the foundation for subsequent automated and efficient inspection. In the long term, machine vision systems achieve significant financial savings by reducing labor costs, increasing production efficiency, and reducing scrap rates and rework costs. In contrast, although the traditional method has a low initial cost, it faces the problems of high labor cost, low efficiency, and high scrap rate in long-term operation. Therefore, despite the higher initial setup costs of machine vision systems, their financial advantages in maintenance and long-term operation are clear. With the expansion of production scale and the passage of time, this advantage will be more obvious. For enterprises pursuing efficient, high-quality, and low-cost production, the use of machine vision technology for online inspection of rebar thread is a forward-looking and economic choice. Table 5 shows that the speed, efficiency, accuracy, and reliability of contact inspection have certain deficiencies in all aspects, and some non-contact thread-inspection methods can be used for thread inspection, but they are not suitable for online inspection. Whereas machine vision technology meets all the requirements of online inspection of thread heads.
From these results, it can be seen that the trends of the measured values are consistent with one another. The calculated inspection speed of the system is 8–10 thread heads per second, which meets the requirements of industrial production and enhances the flexibility and degree of automation in thread head processing and production. In fact, the factory generally requires processing more than 3000 thread heads per day. If the production line works eight hours a day, as a result, it can process about 3840–4800 thread heads, which can meet the actual needs. Of course, the maintenance cycle of the rebar thread head production line should be formulated according to the use of the equipment and the manufacturer’s recommendations, and the daily maintenance, regular maintenance, and maintenance plans under special circumstances should be strictly implemented to ensure the normal operation of the equipment and extend the service life.
In terms of inspection accuracy, there is a small deviation between the measured value of the screw threads parameter inspection system and the theoretical thread head parameters after measuring the rebar thread head. This deviation is called systematic error. Systematic error is inevitable in any testing equipment, which cannot be avoided, but can be minimized with specific methods to decrease the size of the deviation value.
There are two main categories of measurement errors in the entire screw threads parameter inspection system. The first category is the hardware error. Multiple components make up the measurement system, and the signals from each component are susceptible to interference and distortion during transmission, culminating in errors in the final measurement results. Furthermore, there are several other factors that influence the results of the subsequent software processing. These factors include lens distortion errors, system calibration errors, illumination errors of the light source, sample quality, computer system quality and configuration, the toolmaker’s microscope quality, and the observation environment. The second category of measurement errors pertains to the influence of the inspection system software. The algorithm implementation process involves numerous image-processing operators and algorithms. Different methods will result in different results, and the same method will also affect the final image-processing results when the parameters change. Furthermore, the calculation of screw threads parameters can also result in certain errors. By extracting eigenvalues from the thread head image and computing the object size based on these values, the formula used plays a fundamental role in determining the calculated size. For instance, measuring the major diameter of thread head requires a straight line, which is created by extracting the apexes of the left and right threads. However, there might be a gap between the fitted straight line and the actual apexes’ position, leading to some degree of error in the results obtained.
Therefore, in order to reduce the measurement error based on machine vision, it is necessary to optimize the hardware equipment, image-processing algorithm, detection parameter setting, system calibration and calibration, and the collaboration between software and hardware. The following methods can be adopted:
- Optimize the hardware equipment
Improve the quality of the image-acquisition equipment. Choose a high-resolution, high-sensitivity camera to ensure that the image is clear and rich in detail. Optimize light source layout and intensity, reduce shadows and reflections, and improve image contrast. Adjust the focal length, exposure time, and other parameters of the camera according to the actual detection requirements to ensure that the image quality meets the measurement requirements. According to the characteristics of the measurement object and the actual detection environment, set the parameters of the measurement algorithm reasonably to improve the measurement accuracy. Select high-precision mechanical transmission parts, such as precision guide rails, stepper motors, etc., to reduce the error in the process of mechanical movement.
- 2.
- Optimize the image-processing algorithm
In the process of image processing, select the suitable image-processing methods according to actual needs to reduce noise interference and improve image quality. Adopt an advanced edge-detection algorithm to improve the accuracy and robustness of edge detection. Process the detected edges at sub-pixel level to improve the measurement accuracy. Research more advanced algorithms, such as deep learning, combined with machine vision, to further improve the intelligence of the algorithm and improve the detection speed and accuracy.
- 3.
- Strengthen the system calibration
Regularly calibrate cameras, light sources, and other equipment to ensure stable and reliable performance. Calibrate the machine vision inspection system accurately, including the internal parameter calibration of the camera and the external parameter calibration between the camera and the mechanical system, to reduce the influence of calibration error on the measurement results.
- 4.
- Improve the collaboration between software and hardware
Optimize the matching degree between the software algorithm and the hardware device to ensure that the software algorithm can make full use of the performance advantages of the hardware device and improve the overall measurement efficiency and accuracy. Strengthen the real-time and stable communication between software and hardware to ensure the accuracy and real-time performance of measurement data. Debugging several times can enhance measurement accuracy when considering all potential sources of error.
5. Conclusions
To solve the problems of high work intensity, low efficiency, and poor precision associated with traditional manual sampling inspection of the rebar thread head, the automatic inspection technology based on machine vision was studied in this paper. The following main conclusions were obtained:
- A series of image-processing algorithms suitable for thread head parameter extraction were studied, including image preprocessing algorithm, edge extraction, subpixel corner detection algorithm, robust regression algorithm, etc.
- The calculation method of thread head parameters was studied, the mathematical of pitch diameter was established, and the GWO algorithm was used to optimize the traditional pitch diameter measurement method. According to the actual processing situation of the factory, the mathematical model of the length compensation of the major, pitch, and minor diameter of the rebar thread head was established to reduce the inspection error caused by the cone thread. The experiment results showed that the inspection accuracy reached the micrometre levels; the error of both major and pitch diameter measurement results were smaller than that of traditional algorithms.
- A web-based thread measurement and management system with Python and OpenCV technologies was developed. The system provided non-contact, real-time inspection to the rebar thread heads through hardware and software components, including industrial cameras, PLC controllers, and image-processing algorithms, and showed a well-rounded system development, which allowed users to remotely monitor product parameters anytime, anywhere. It is a significant advancement of integrating machine vision for rebar thread inspection, and providing a non-contact, real-time solution. The experiment results showed that the average inspection speed reached 8–10 rebar heads per second and the efficiency and degree of automation all met industrial requirements. The proposed method reduced the inspection cost, risk of leakage, and labor intensity while improving production flexibility and automation, making it ideal for large-volume industrial production and processing of rebar thread heads.
However, obviously, current measurement results are affected by many variables, such as the external environment (dust, light, etc.), hardware facilities (camera, light source, etc.), and software algorithms (image processing, parameter calculation), and there is some error between the measured results and the actual results. In the actual processing, usually flexible processing, the external environment and the actual situation of the inspection object have a great impact on the inspection results. Therefore, whether the algorithm in this paper is suitable for the inspection of different environments and different rebar threads needs to be verified. We will continue to study the thread online inspection system in the future in order to reduce the impact of the above factors on the measurement results.
With the rapid development of industrial manufacturing and the continuous improvement of product quality requirements, the market demand for thread parameter measurement technology based on machine vision will continue to grow. The application of high-precision cameras, high-sensitivity sensors, and advanced image-processing algorithms will make the measurement results more accurate and reliable. At the same time, the integration of intelligent technologies, such as deep learning, machine learning, and so on, will enable the system to automatically learn and self-optimize. Future research will focus on the inspection of thread parameters based on deep learning to further improve the measurement accuracy and efficiency.
Author Contributions
Conceptualization, L.L., Z.L. and X.Q.; Investigation, L.L. and X.Q.; Methodology, L.L.; Validation, L.L.; Software, L.L. and X.Q; Visualization, X.Q.; Writing—original draft, L.L. and X.Q.; Formal analysis, L.L. and X.Q.; Supervision, Z.L.; Funding acquisition, L.L. and Z.L. All authors have read and agreed to the published version of the manuscript.
Funding
This study was funded in part by Research Fund of China Academy of Building Research under grant 20220202330730014 and in part by Research Fund of North China Institute of Aerospace Engineering under grants KY202410 and ZD202206.
Data Availability Statement
The authors will make the raw data supporting this article’s conclusions available on request. Due to privacy concerns, the data are not publicly available.
Acknowledgments
The authors would like to thank the CABR Construction Machinery Technology Co., Ltd. in Langfang for technical consultation and providing us with related rebar thread heads.
Conflicts of Interest
Author Xuefei Qian was employed by the company China Petroleum Pipeline Bureau Engineering Co., Ltd. The remaining authors declare that the research was conducted in the absence of any commercial or financial relationships that could be construed as a potential conflict of interest.
References
- Yin, Y.; Zeng, H.; Deng, X. Research on Application Practice of Rebar Mechanical Connection. IOP Conf. Ser. Earth Environ. Sci. 2021, 7, 022049. [Google Scholar] [CrossRef]
- Gadelmawla, E.S. Computer vision algorithms for measurement and inspection of external screw threads. Measurement 2017, 100, 36–49. [Google Scholar] [CrossRef]
- Wu, Q.; Zhang, M. Research on Quantitative Testing Method for Thread Ring Gauges. Henan Sci. Technol. 2019, 26, 50–52. [Google Scholar]
- Zhang, X.; Wei, H.; Wang, Y.; An, X. Analysis of Three Needle Testing Technology for Conical Thread. Meas. Technol. 2013, 33, 12–14. [Google Scholar]
- Yang, J.Y. Research on Parameter Detection System of Rebar Head Basedon Machine Vision. Master’s Thesis, Xi’an University of Science and Technology, Xi’an, China, 2020. [Google Scholar]
- Tong, Q.; Ding, Z.; Chen, J.; Ai, L.; Yuan, F. The Research of Screw Thread Parameter Measurement Based on Position Sensitive Detector and Laser. J. Phys. Conf. Ser. 2006, 48, 561–565. [Google Scholar] [CrossRef]
- Yang, L.; Zhang, J.; Gao, S. Research on Eddy Current Testing Method for Drill Pipe Threads. Instrum. Technol. Sens. 2010, 08, 98–100. [Google Scholar]
- Li, H.; Li, Q.; Wang, Z.; Pan, Q. Laser ultrasonic localization detection of defects at the threads of circular tube components. Prog. Laser Optoelectron. 2018, 55, 173–178. [Google Scholar]
- Claudinon, S.; Lamesle, P.; Orteu, J.; Fortunier, R. Continuous in situ measurement of quenching distortions using computer vision. J. Mater. Process. Technol. 2002, 122, 69–81. [Google Scholar] [CrossRef]
- Lei, J.P.; Yan, S.; Shen, S. Research on CCD Visual Inspection System for Thread Parameters. Process Insp. 2010, 4, 96–99. [Google Scholar]
- Gadelmawla, E.S. A novel system for automatic measurement and inspection of parallel screw threads. Proc. Inst. Mech. Eng. Part B J. Eng. Manuf. 2004, 218, 545–556. [Google Scholar] [CrossRef]
- Zhou, C.; Li, X. Thread parameter measurement system based on machine vision. Laser Technol. 2016, 40, 5. [Google Scholar]
- Mohamed, A.; Esa, A.; Ayub, M. Roundness measurement of cylindrical part by machine vision. Int. Conf. Electr. Control Comput. Eng. 2011, 7, 486–490. [Google Scholar]
- Hunsicker, R.; Patten, J.; Ledford, A.; Ferman, C.; Allen, M.; Ellis, C. Automatic vision inspection and measurement system for external screw threads. J. Manuf. Syst. 1994, 13, 370–384. [Google Scholar] [CrossRef]
- Liu, K. An adaptive median filtering of visual product image based on gradient direction information. Int. J. Prod. Dev. 2022, 26, 206–215. [Google Scholar] [CrossRef]
- Liu, L.; Jin, H.; Tang, B.; Lu, Z.; Li, Z. Optimization algorithm for infrared image enhancement using multi-scale high-hat transform. J. Detect. Control 2015, 37, 66–69. [Google Scholar]
- Liu, J.; Li, H.; Yang, Z.; Wu, K.; Liu, Y.; Liu, R. Adaptive douglas-peucker algorithm with automatic thresholding for ais-based vessel trajectory compression. IEEE Access 2019, 7, 150677–150692. [Google Scholar] [CrossRef]
- Jing, J.; Liu, S.; Wang, G.; Zhang, G.W.; Sun, C. Recent advances on image edge detection: A comprehensive review. Neurocomputing 2022, 503, 259–271. [Google Scholar] [CrossRef]
- Canny, J. A Computational Approach to Edge Detection. IEEE Trans. Pattern Anal. Mach. Intell. 1986, 8, 184–203. [Google Scholar] [CrossRef]
- Zeng, F.; Zhang, G.; Jiang, J. Text Image with Complex Background Filtering Method Based on Harris Corner-point Detection. J. Softw. 2013, 8, 1827–1834. [Google Scholar] [CrossRef][Green Version]
- Bansal, M.; Kumar, M.; Kumar, M.; Kumar, K. An efficient technique for object recognition using Shi-Tomasi corner detection algorithm. Soft Comput. A Fusion Found. Methodol. Appl. 2021, 6, 25. [Google Scholar]
- Zhou, X.; Gao, Y.; Yao, W.; Yu, N. A Robust Segmented Mixed Effect Regression Model for Baseline Electricity Consumption Forecasting. J. Mod. Power Syst. Clean Energy 2022, 10, 71–80. [Google Scholar] [CrossRef]
- Mirezi, B.; Kaçıranlar, S.; Özbay, N. A minimum matrix valued risk estimator combining restricted and ordinary least squares estimators. Commun. Stat.—Theory Methods 2021, 52, 1580–1590. [Google Scholar] [CrossRef]
- Fan, R.; Zhang, S.; Wu, Y. Nonconcave penalized M-estimation for the least absolute relative errors model. Commun. Stat.—Theory Methods 2023, 52, 1118–1135. [Google Scholar] [CrossRef]
- Mirjalili, S.; Mirjalili, S.M.; Lewis, A. Grey Wolf Optimizer. Adv. Eng. Softw. 2014, 69, 46–61. [Google Scholar] [CrossRef]
- Qi, W.; Sun, Z. Overview of camera calibration methods for machine vision. Appl. Res. Comput. 2004, 21, 4–6. [Google Scholar]
- Zhang, Z. Flexible camera calibration by viewing a plane from unknow orientations. In Proceedings of the 7th IEEE International Conference on Computer Vision, Kerkyra, Greece, 20–27 September 1999; Volume 1, pp. 666–673. [Google Scholar]
- Hao, Y. Retraction Note: Platform Design of Sports Meeting Management System for Regular Colleges and Universities Based on B/S Structure. Wirel. Pers. Commun. 2018, 102, 1223–1232. [Google Scholar]
- JGJ 107-2016; Technical Specification for Mechanical Connection of Steel Bars. China Standards Publishing House: Beijing, China, 2016.
- GB/T 197-2018; General Thread Tolerance. China Standards Press: Beijing, China, 2018.


Disclaimer/Publisher’s Note: The statements, opinions and data contained in all publications are solely those of the individual author(s) and contributor(s) and not of MDPI and/or the editor(s). MDPI and/or the editor(s) disclaim responsibility for any injury to people or property resulting from any ideas, methods, instructions or products referred to in the content. |
© 2024 by the authors. Licensee MDPI, Basel, Switzerland. This article is an open access article distributed under the terms and conditions of the Creative Commons Attribution (CC BY) license (https://creativecommons.org/licenses/by/4.0/).