Article

Comparative Genomics and Pathogenicity Analysis of Two Bacterial Symbionts of Entomopathogenic Nematodes: The Role of the GroEL Protein in Virulence

by
Abraham Rivera-Ramírez
1,
Rosalba Salgado-Morales
2,
Alfredo Jiménez-Pérez
3,
Rebeca Pérez-Martínez
2,
Blanca Inés García-Gómez
4 and
Edgar Dantán-González
2,*
1
Instituto de Investigaciones en Ciencias Básicas y Aplicadas, Universidad Autónoma del Estado de Morelos, Av. Universidad 1001, Chamilpa, Cuernavaca 62209, Morelos, Mexico
2
Centro de Investigación en Biotecnología, Universidad Autónoma del Estado de Morelos, Av. Universidad 1001, Chamilpa, Cuernavaca 62209, Morelos, Mexico
3
Centro de Desarrollo de Productos Bióticos, Instituto Politécnico Nacional, Calle Ceprobi No. 8, San Isidro, Yautepec 62739, Morelos, Mexico
4
Instituto de Biotecnología, Universidad Nacional Autónoma de México, Apdo. Postal 510-3, Cuernavaca 62250, Morelos, Mexico
*
Author to whom correspondence should be addressed.
Microorganisms 2022, 10(3), 486; https://doi.org/10.3390/microorganisms10030486
Submission received: 26 January 2022 / Revised: 14 February 2022 / Accepted: 17 February 2022 / Published: 22 February 2022
(This article belongs to the Section Systems Microbiology)

Abstract

:
Bacteria of the genera Xenorhabdus and Photorhabdus are symbionts of entomopathogenic nematodes. Despite their close phylogenetic relationship, they show differences in their pathogenicity and virulence mechanisms in target insects. These differences were explored by the analysis of the pangenome, as it provides a framework for characterizing and defining the gene repertoire. We performed the first pangenome analysis of 91 strains of Xenorhabdus and Photorhabdus; the analysis showed that the Photorhabdus genus has a higher number of genes associated with pathogenicity. However, biological tests showed that whole cells of X. nematophila SC 0516 were more virulent than those of P. luminescens HIM3 when both were injected into G. mellonella larvae. In addition, we cloned and expressed the GroEL proteins of both bacteria, as this protein has been previously indicated to show insecticidal activity in the genus Xenorhabdus. Among these proteins, Cpn60-Xn was found to be the most toxic at all concentrations tested, with an LC50 value of 102.34 ng/larva. Sequence analysis suggested that the Cpn60-Xn toxin was homologous to Cpn60-Pl; however, Cpn60-Xn contained thirty-five differentially substituted amino acid residues that could be responsible for its insecticidal activity.

1. Introduction

Xenorhabdus and Photorhabdus are closely related phylogenetic groups belonging to the family Enterobacteriaceae; they are Gram-negative gammaproteobacteria that have evolved to form symbiotic associations with soil entomopathogenic nematodes of the families Steinernematidae and Heterorhabditidae, respectively [1]. These bacteria have a complex life cycle involving a mutualistic symbiotic stage, in which the bacteria become established and colonize the nematode gut, and a pathogenic stage, in which susceptible insects become infected after the nematode enters through natural openings such as respiratory spiracles, the mouth or the anus [2]. Once the bacteria are inside the hemocoel, they actively replicate and release compounds that have the potential to suppress the host immune response as a protective strategy to maintain symbiosis with the nematode. The bacterium enters the stationary phase of its growth cycle, resulting in the production of a wide range of compounds, including toxins, phospholipases, proteases and antibiotics. Degradative enzymes bioconvert the macromolecules of the insect, thus providing a supply of essential nutrients for the nematode reproduction and development, while antibiotic substances inhibit the growth of other microorganisms that might compete for the carcass [3,4]. During the final stages of development, the nematode and bacteria reassociate, and there is a corresponding decrease in nutrients. These processes lead to the differentiation of the nematode from the juvenile stage to the infective juvenile (IJ) stage, in which it no longer feeds on the insect. IJ carrying bacteria in their intestinal tract then emerge from insect carcasses in search of new prey [5,6,7].
Although this nematode–bacteria symbiotic complex shows a high degree of similarity among clades, there are differences in the life cycle itself and in the mechanism of pathogenicity, which involves evasion of the insect immune system and the expression of virulence factors [8]. Some studies have suggested the existence of functionally divergent mechanisms [9,10,11]. One approach to study these differences is based on comparative genomics, which allows the comparison of complete genomes and provides abundant genetic information to elucidate genomic structural landmarks, novel gene repertoires and phylogenetic relationships among different taxa. The fundamental goal of comparative genomics is to achieve pangenome analysis from genomes [12,13]. The pangenome is composed of a core genome, which includes all genes present in all the strains studied, encoding functions related to the basic biology and phenotypes of the species. A second component is an “accessory or dispensable genome,” including genes present in some but not all strains studied as well as strain-specific genes. The dispensable genome is generally associated with nonessential functions, in addition to conferring selective advantages such as adaptability to ecological niches, the ability to colonize new environments, or antibiotic resistance [13,14,15,16]. To date, there have been no pangenome analyses of the entomopathogenic bacteria of genera Xenorhabdus and Photorhabdus.
In this work, we sequenced and reported the genome of Xenorhabdus nematophila SC 0516. In addition, we performed a pangenome analysis with the complete genome sequence data available from 91 different strains of genera Xenorhabdus and Photorhabdus and determined the phylogenetic position of our strain using the core genome. We also characterized the virulence capacity of X. nematophila SC 0516 in G. mellonella larvae, comparing it with a strain previously assessed in our laboratory, identified as Photorhabdus luminescens HIM3, and we further characterized a protein component with unique properties, GroEL, which is a chaperonin shared by both strains with differential insecticidal activity.

2. Materials and Methods

2.1. Maintenance of Insects and Nematodes

Galleria mellonella was maintained at a temperature of 25 ± 2 °C with a light/dark (LD) photoperiod of 12:12 h and relative humidity (RH) of 70 ± 10% and cultured on an artificial diet. For the isolation of Heterorhabditis indica, agricultural soil samples were collected in the State of Morelos, Mexico. Isolation of entomopathogenic nematodes was carried out using G. mellonella last-instar larvae as bait. Larvae were monitored daily, dead larvae with symptoms of entomopathogenic nematode infection, such as absence of odor, absence of contaminating organisms and coloration were recovered and disinfected with 5% sodium hypochlorite and rinsed three times with sterile distilled water. Infective juvenile nematodes (IJs) were recovered from white traps 12–14 days after inoculation with IJs. In the case of Steinernema carpocapsae, the nematodes were acquired through Kopppert Biological Systems, reproducing the nematodes with the same methodology described above.

2.2. Bacterial Growth

Bacterial strains were grown on NBTA medium (nutrient agar supplemented with 0.025 g bromothymol blue and 0.04 g 2,3,5-triphenyltetrazolium chloride per liter). For experimental purposes, a 48-h colony was transferred to 50 mL nutrient broth medium (NB) in a 250 mL Erlenmeyer flask and incubated at 25 ± 1 °C at 120 rpm for 24 h.

2.3. Genome Collection

A total of 91 sequences were collected from the annotated genomes of Xenorhabdus and Photorhabdus available in the open access RefSeq: NCBI Reference Sequence Database, among which 14 were complete, and 77 were drafts in various stages of completion (Supplementary Table S1). As a selection criterion, genomes that were highly fragmented (>300 contigs) were excluded. Three complete Yersinia pestis genomes were included in the phylogenetic analysis.

2.4. Genome Sequencing and Annotation

Genomic DNA from X. nematophila SC 0526 was extracted using the ZR Fungal/Bacterial MiniPrepTM Kit (Zymo Research, Irvine, CA, USA), following the manufacturer’s instructions. Subsequently, 5 µg of genomic DNA was sequenced on the Illumina MiSeq platform. Read quality was analyzed with FastQC [17]. Illumina adapter sequences were removed using the ILLUMINACLIP trimming step of Trimmomatic v0.39 software [18]. Low-quality bases were removed from Illumina paired-end reads using the DynamicTrim algorithm of the SolexaQA++ v3.1.7.1 software package with a Phred quality score of Q = 13 [19]. Paired-end reads were assembled de novo using the SPAdes v3.14.1 program with the following options: (i) only run the assembly module (–only-asembler); (ii) reduce the number of mismatches (–careful); and (iii) k-mer lengths between 21 and 71, which generated 248 contigs [20]. Contigs of less than 500 bp in length were discarded, and the remaining contigs were used for a multidraft-based analysis using the genome of the X. nematophila YL001 strain via the MeDuSa v1.6 scaffolder [21]. A final assembly polishing step was performed by reassigning the filtered high-quality sequence reads to the ordered scaffolds using BWA and passing the resulting ordered binary alignments to SAMtools for indexing [22]. The indexed alignments were used for analysis by Pilon v1.23 [23]. The draft bacterial genome was automatically annotated using the RAST server version 2.0 [24] (available at https://rast.nmpdr.org/rast.cgi, accessed on 20 July 2021), and 16S rRNA gene sequences were obtained using the RNAmmer server [25] (http://www.cbs.dtu.dk/services/RNAmmer/, accessed on 22 July 2021).

2.5. Phylogenomic Analyses

The core genome phylogeny was estimated under the maximum likelihood (ML) criterion using the GET_HOMOLOGUES [26] and GET_PHYLOMARKERS [27] software suites. The get_homologues.pl program was used in combination with compare_clusters.pl to compute a consensus core genome resulting from clustering BLASTP results (with 90% query coverage) with the BDBH (Bi-directional Best Hits), COG (Cluster of Orthologous Groups-triangles) and OrthoMCL (Markov Clustering of orthologs) algorithms implemented in GET_HOMOLOGUES [28]. Domain search was allowed in PFAM for the last runs. A consensus pangenome was similarly computed from COG triangles and OMCL clusters. The pangenome consensus clusters were input into the GET_PHYLOMARKERS pipeline to select alignments with optimal phylogenetic attributes (no significant evidence of recombination, producing tree topologies and branch lengths that did not deviate significantly from the expected distribution of these parameters and showing average branch support values > 0.6). The alignments that passed these filters were concatenated, and an ML phylogeny was estimated with IQ-TREE 1.6.1 [29] using the best-fit model and choosing the phylogeny with the highest probability score of those found among independent searches. Finally, the phylogeny was rooted using the Y. pestis genomes. Phylogenetic trees were visualized and edited with FigTree v1.4.3 [30].

2.6. Pathogenicity Assays in Galleria mellonella

Pathogenicity bioassays in G. mellonella were performed by the direct injection of 101, 102 or 103 CFUs of X. nematophila SC 0516 into the hemolymph of fifth-instar larvae of G. mellonella. Larvae were selected by weight (250 to 350 mg) in all trials. A final volume of 10 µL of LB containing the bacterial suspension was injected into the hemolymph of individual insects in the last left pro-leg with a 31-gauge insulin needle (BD Medical-Diabetes Care, Holdrege, NE, USA). Equivalent doses of P. luminescens HIM3 and E. coli DH5α (negative control) were used in all assays. Fifteen larvae were used per dose, and each larva was placed in a 9 cm Petri dish. Experiments were performed four times in independent bioassays (n = 60), and survival was assessed at 12, 24, 36 and 48 h post-infection.

2.7. Cloning, Expression and Purification of GroEL Proteins

Based on the genomic information obtained from the bacteria, specific primers were designed for the PCR amplification of the groEL sequences of X. nematophila SC 0516 (Fw: 5′ CATATGGCAGCTAAAGACGTAAAATTTG 3′ and Rv: 5′ GAATTCACATCATGCCGCCCATTCCAC 3′) and P. luminescens HIM3 (Fw: 5′ CATATGGCAGCTAAAGACGTAAAATTTGG 3′ and Rv: 5′ GTCGACTTACATCATGCCGCCCATACCG 3′). The 1.7 kb coding sequences were cloned into the pJET1.2 blunt vector (Thermo Scientific, Vilnius, Lithuania), and the resultant constructs were transformed into E. coli DH5α cells following the protocol described by the manufacturer. Subsequently, the 1.7 Kb fragments of both vectors were ligated into the expression vector pET28a, and these constructs were transformed into E. coli BL21DE3, thus producing the recombinant protein-producing strains XnGroEL and PlGroEL. These cells were grown at 37 °C and 150 rpm in LB medium containing 50 µg/mL kanamycin until an O.D. of 0.5 was reached, when gene expression was immediately induced by the addition of 1 mM IPTG for 4–5 h. Cells were washed and lysed by sonication, and the cell debris-free supernatant was filtered through a cold agarose-acetic acid-nickel agarose affinity column (Ni-NTA Agarose QIAGEN, Hilden, Germany) following the manufacturer’s recommended protocol.

2.8. Evaluation of the Insecticidal Activity of GroEL Proteins

The insecticidal activity of the GroEL proteins from X. nematophila SC 0526 (named Cpn60-Xn) and P. luminescens HIM3 (named Cpn60-Pl) was evaluated in fifth-instar G. mellonella larvae using doses of 100, 200, 500, 1000 and 2000 ng of protein per larva. Injection was performed directly into the insect hemolymph with 0.3 mL 31G X 6 mm Ultra Fine U-100 insulin syringes (BD Medical-Diabetes Care, Holdrege, NE, USA). The final injection volume was 10 µL in all treatments, and BSA (2000 ng) was used as a negative control. The assays were repeated three times using 15 larvae per treatment. The 50% lethal dose of the purified proteins was assessed using semilogarithmic regression, applying the logarithm base 10 of the protein concentrations and using the following formula: y = 42.73x − 35.79.

2.9. Sequence and Structure Analysis

The global alignment of the GroEL sequence of X. nematophila SC 0516 with that of P. luminescens HIM3 was performed with the program Clustal Omega [31]. I-TASSER [32] was used to generate the three-dimensional structure, which was visualized and analyzed with Visual Molecular Dynamics (VMD) software [33,34].

2.10. Statistical Analysis

Survival analysis, which is generally a set of methods for analyzing data in which the outcome variable is time to the occurrence of an event of interest (mortality), was performed. Data from the experiments (n = 60) were plotted using the Kaplan–Meier estimator, a nonparametric statistic, and a log-rank test was performed to detect significant differences between treatments. To isolate one or more groups that differed from the others, a multiple comparison procedure was carried out using the Holm–Sidak method. In both cases, p > 0.005 was the rejection probability.
In the case of semilogarithmic linear regressions, ANCOVA was performed to detect significant differences between the two lines, with a probability of rejection of p > 0.005.
Statistical analyses were performed with GraphPad Prism version 8.4.3 (GraphPad Software Inc., San Diego, CA, USA).

3. Results

3.1. Genomic Features and Assembly Metrics of the SC 0516 Strain

In the present study, bacterial strain SC 0516 was isolated from the hemolymph of S. carpocapsae-infected G. mellonella larvae. In addition, the bacterial genome of SC 0516 was sequenced and assembled de novo. The draft genome of strain SC 0516 was 4,179,879 bp in length, with 142-fold genome coverage and an approximate 43.5% G+C content. A total of 103 contigs were generated, with an N50 contig length of 73,255 bp and an L50 value of 16 contigs. No plasmids were detected in the analysis.
To functionally analyze the genome of strain SC 0516, the contigs were subjected to subsystem annotation on the RAST server. A total of 4174 protein-coding genes, including 51 tRNAs, 5 rRNAs and 5 noncoding RNAs, were assigned to 336 annotated subsystems, which can be defined as biological processes that are components of metabolism or structural complexes supported by a set of functional roles. Most of these genes were predicted to be involved in the metabolism of amino acids and derivatives (309 genes), proteins (189 genes) and carbohydrates (150 genes).
This whole-genome shotgun project has been deposited in GenBank under accession number JACDOS000000000.1. The version described in this article is the first version.

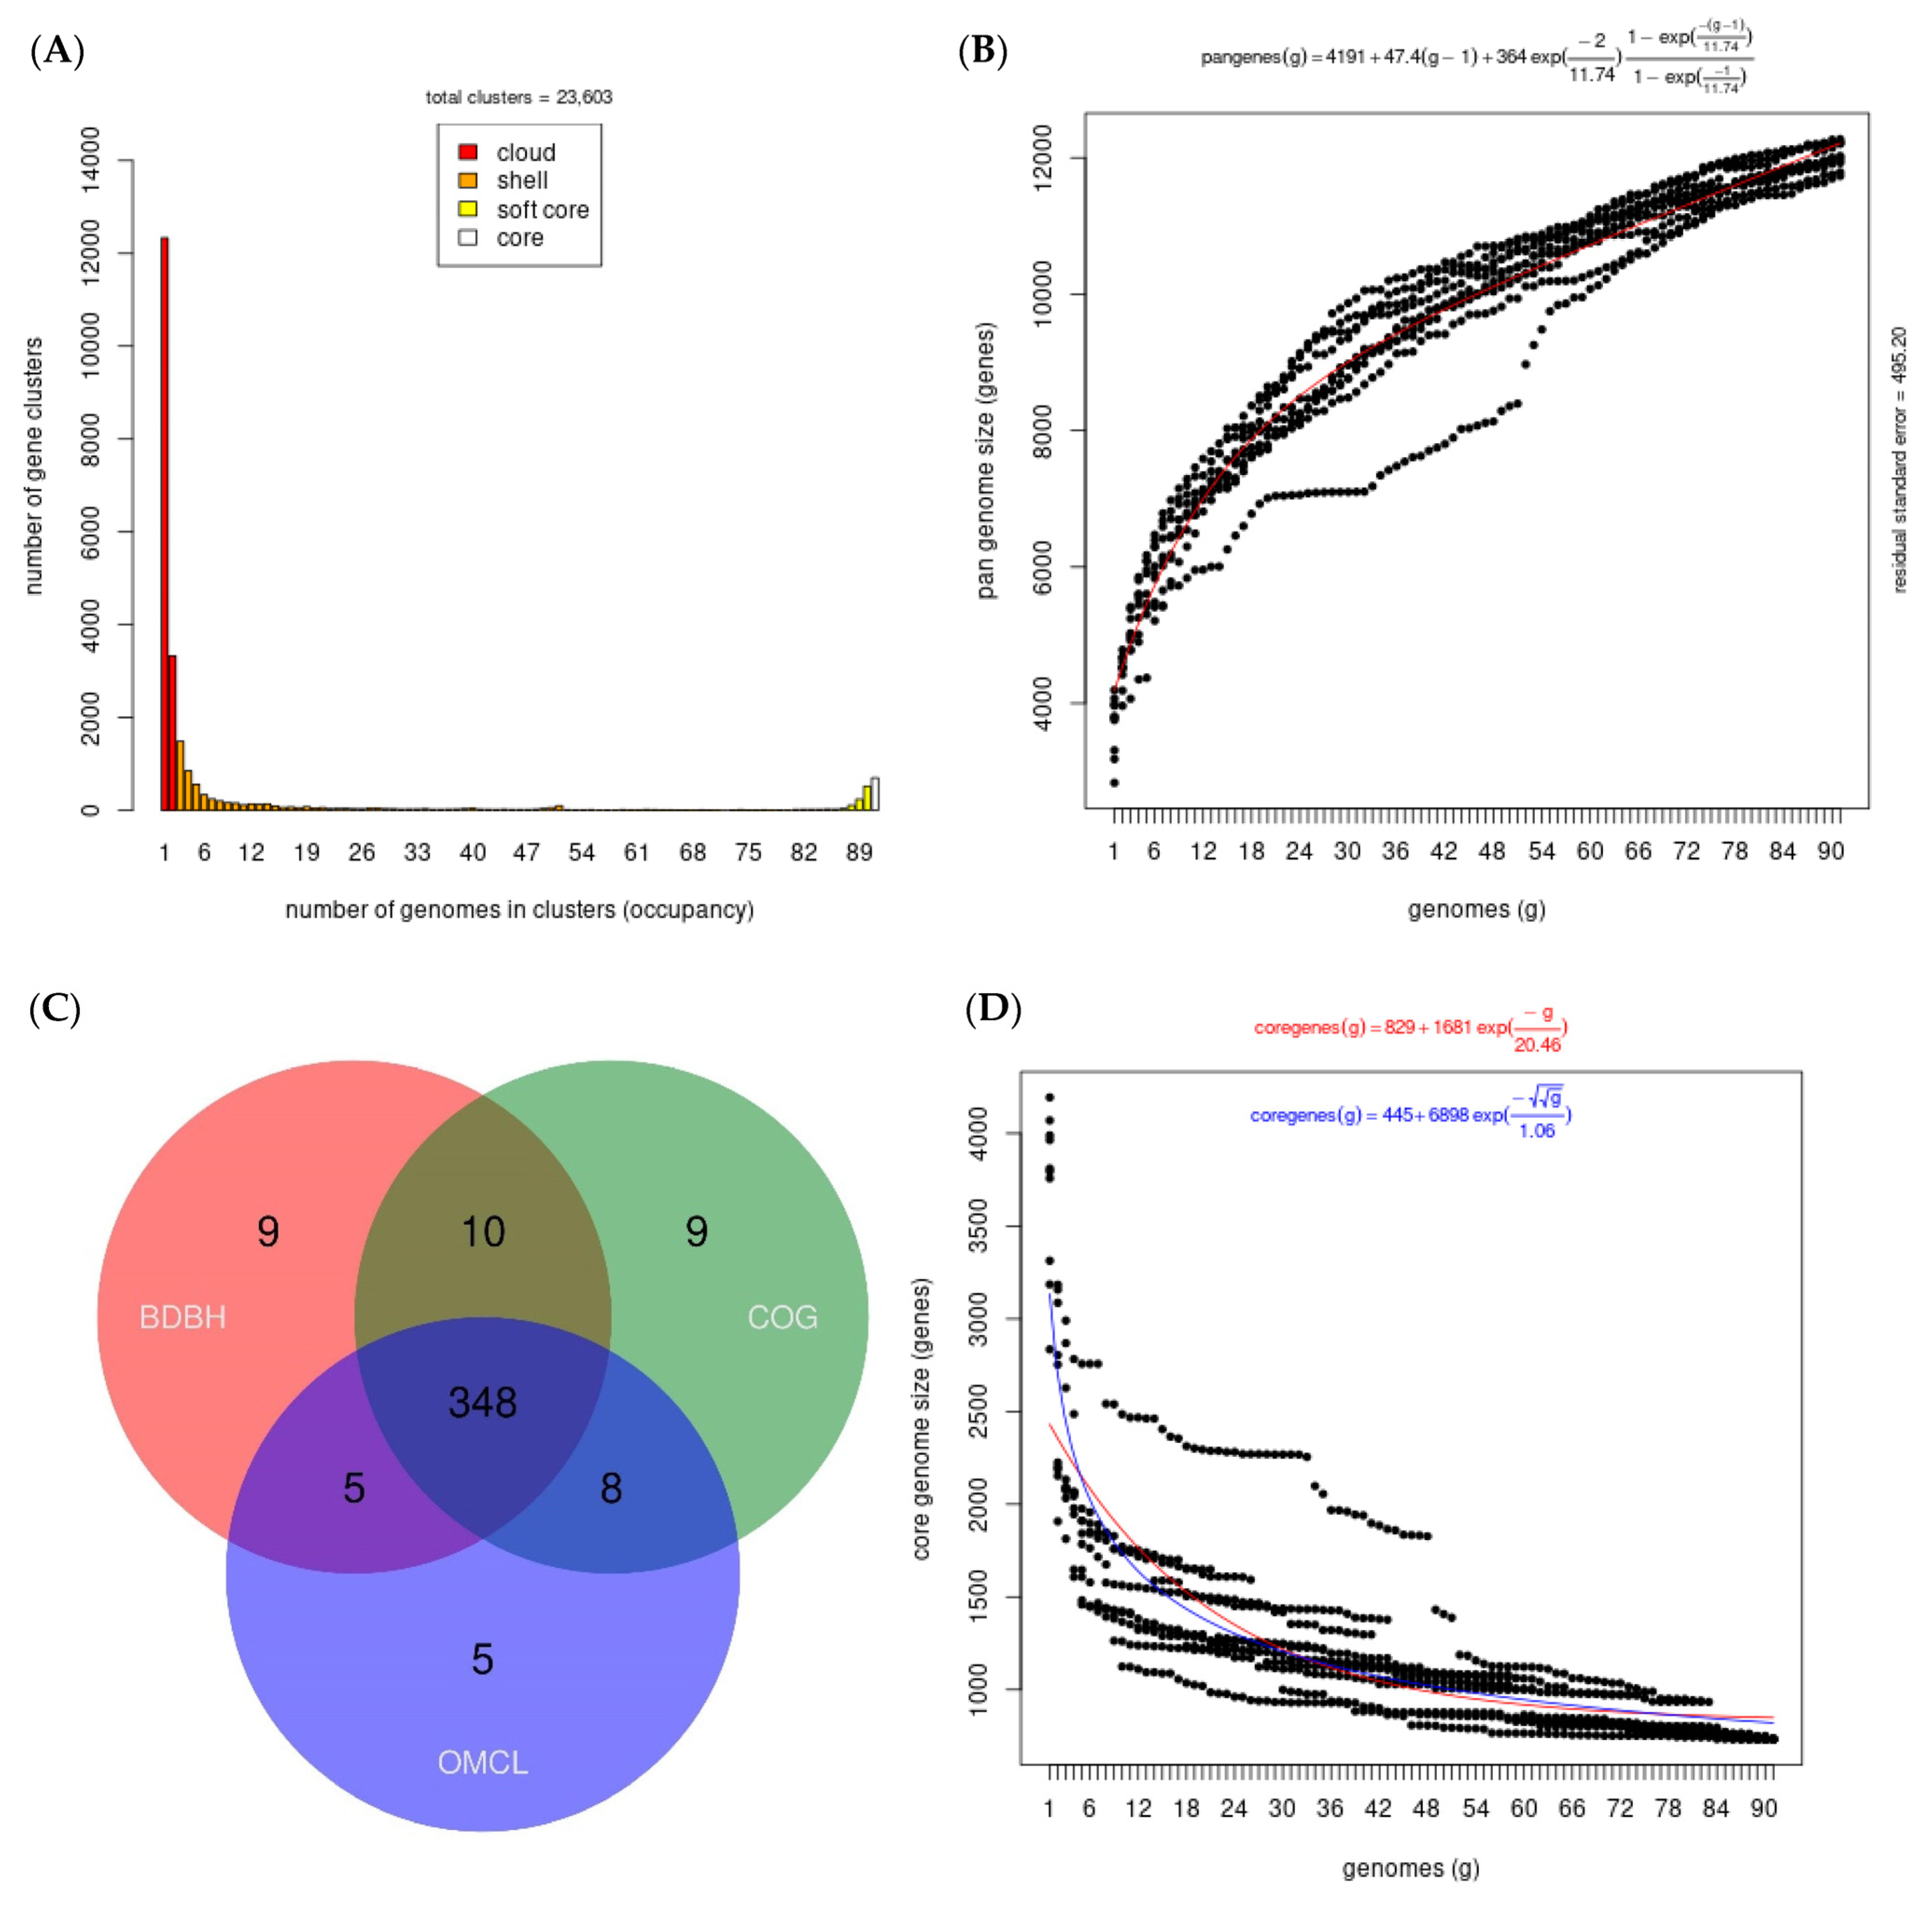
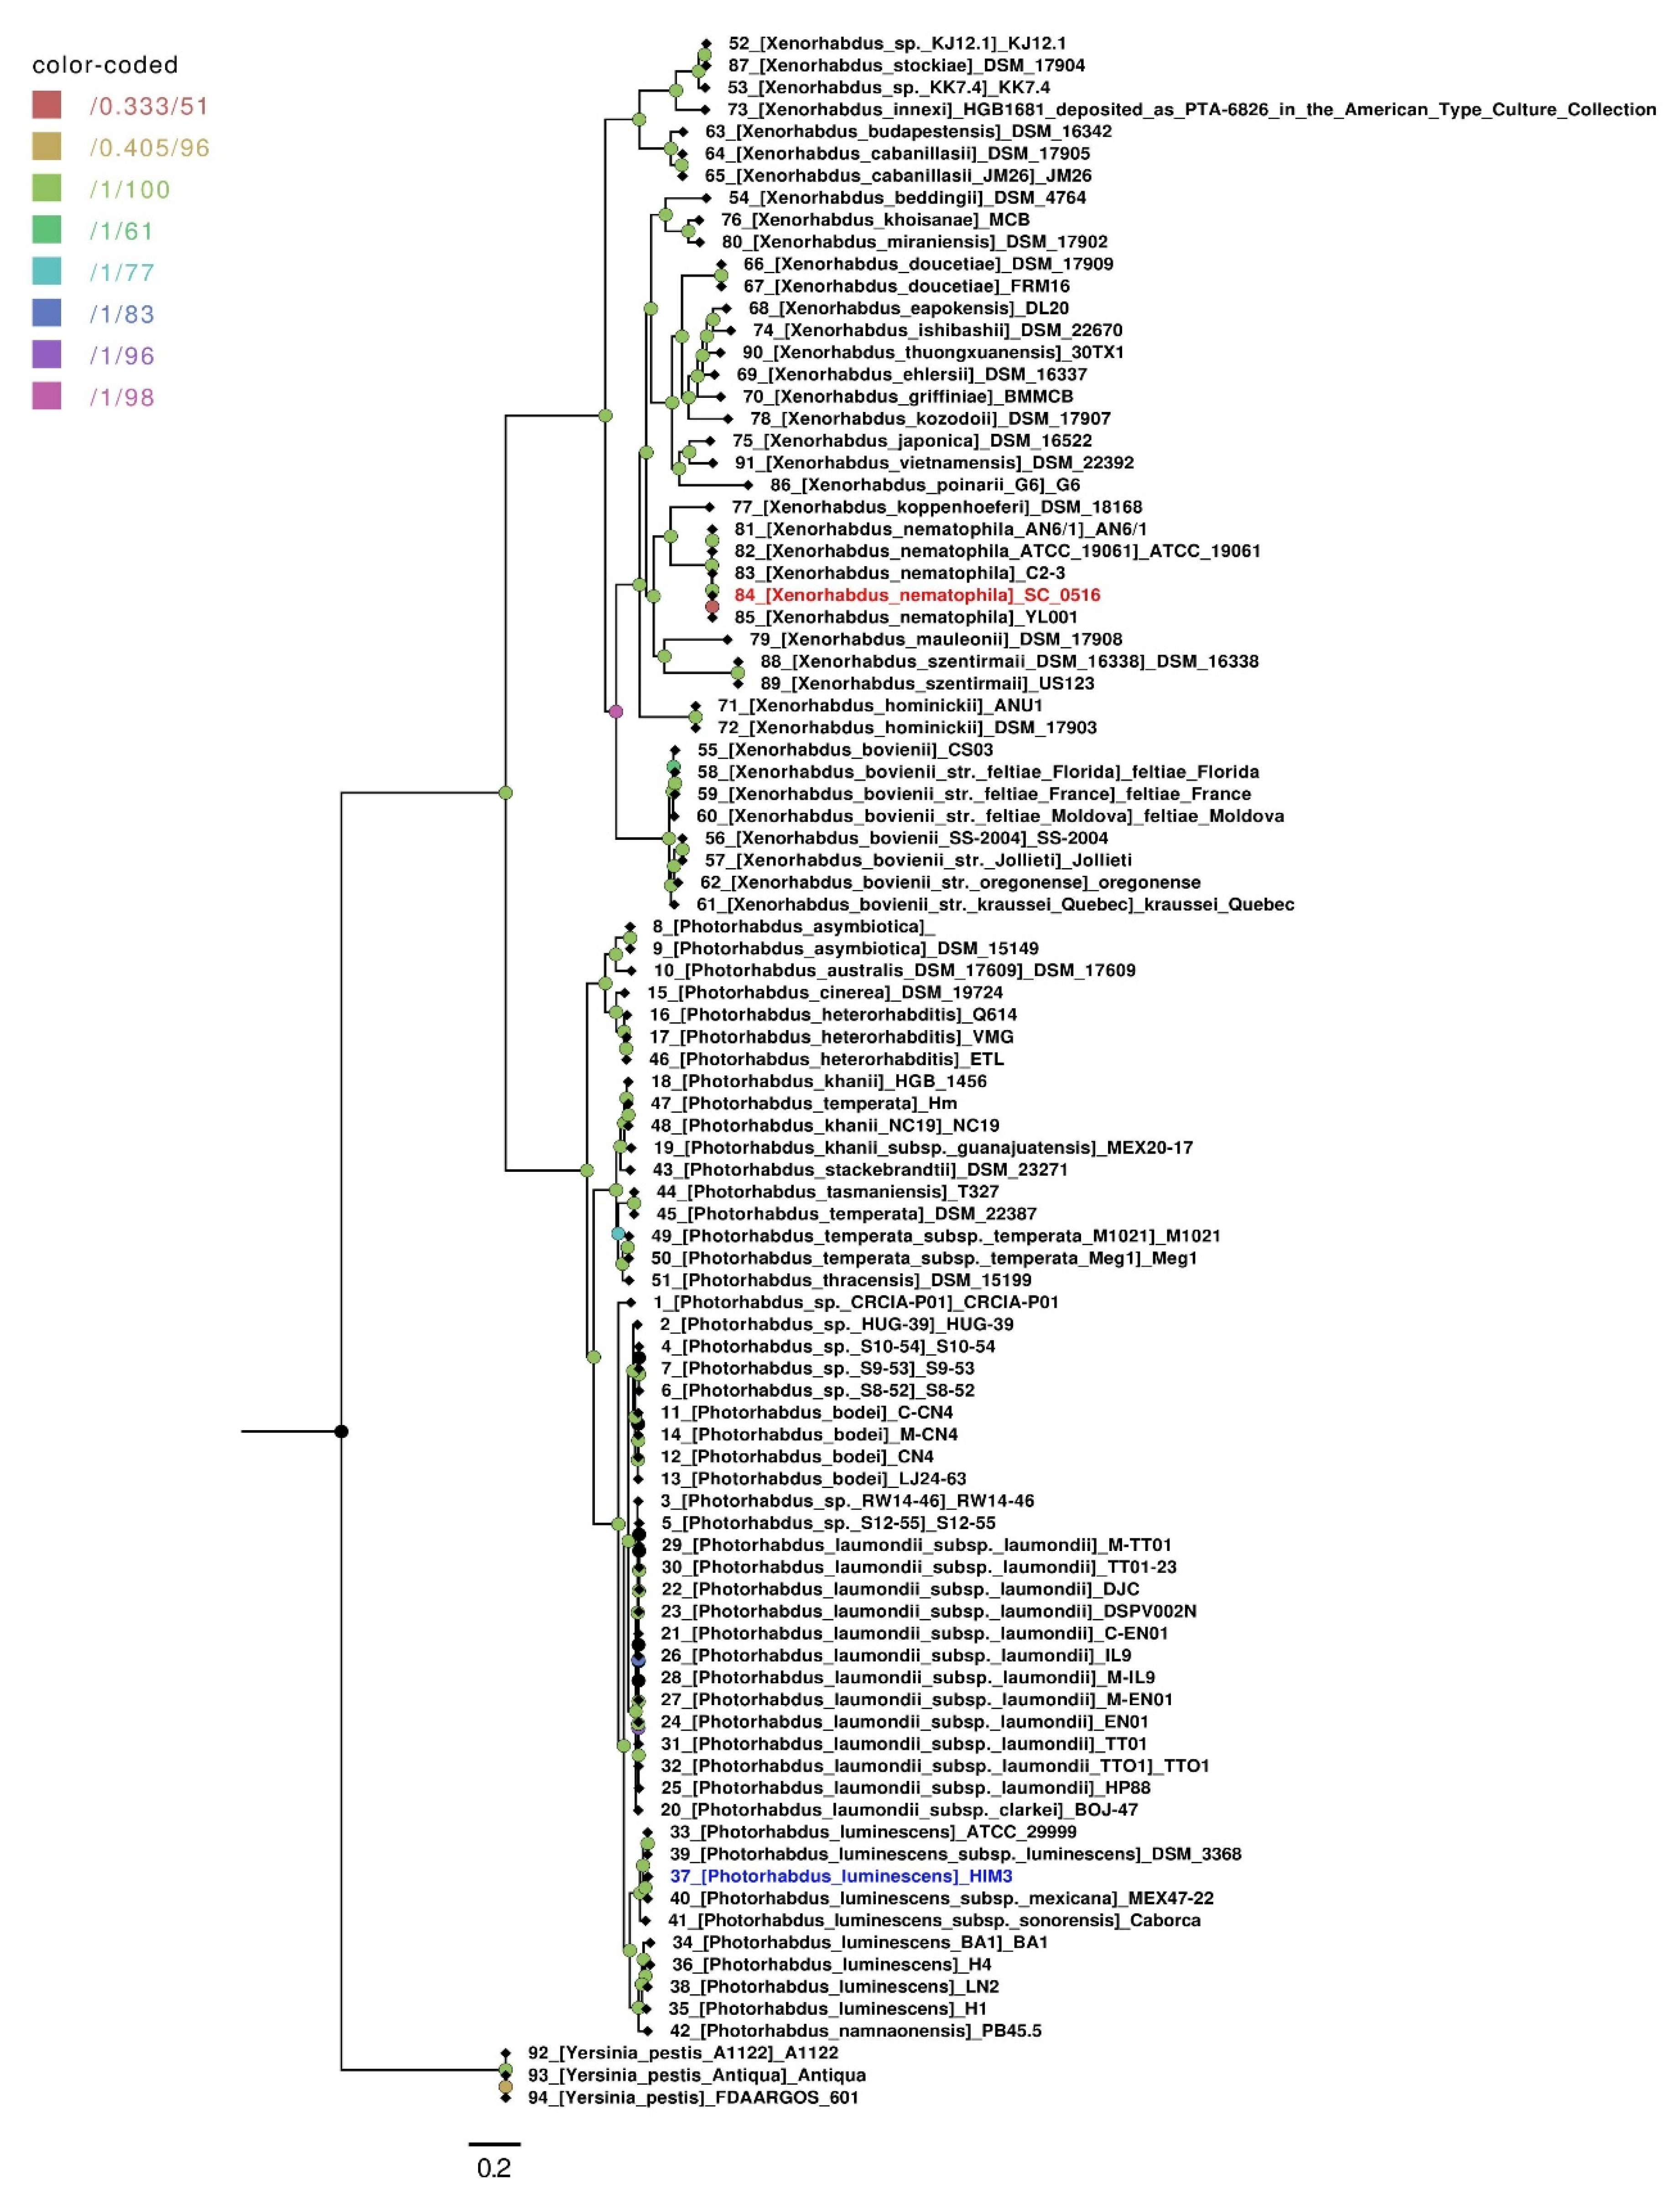
3.2. Pangenome and Phylogenetic Analysis of Xenorhabdus nematophila SC 0516

A pangenome consists of core genes (i.e., genes found in all strains of a genus or species), flexible genes (found in more than one strain but not all), and single genes (found in only one strain, also known as accessory genes). We included 77 drafts and 14 complete genomes of Xenorhabdus and Photorhabdus bacteria in the analysis (Supplementary Table S1). The consensus pangenomic matrix of Xenorhabdus and Photorhabdus from our dataset consisted of 23,603 gene clusters (Figure 1A). More than half of the complete set of genes constituting the pangenome (15,662 genes, 66%) were found to be uniquely present (referred to as a cloud genome), meaning that each strain contributed an average of 172 new genes to the pangenome. The shell genome (genomes ≥ 50%) and the soft core (genomes = 95%) consisted of 6311 and 1630 gene clusters, respectively (Figure 1A). The analysis showed that the pangenome of both genera has an open form (Figure 1B). This occurs when the number of new gene families continues to increase in a taxonomic lineage in a non-asymptotic trend, regardless of how many new genomes are added to the pangenome. Higher rates of gene gains achieved by horizontal gene transfer (HGT) are characteristic of these lineages [16,35]. The core genome characterized as the set of genes present in all the genomes analyzed contained approximately 348 genes that were present in all 91 genomes studied, representing 1.4% of the pangenome (Figure 1C). However, the core genome presented a negative trend due to the addition of new strains, as the probability of gene sharing between strains decreased as new strains were incorporated into the study sample (Figure 1D). This was consistent with studies revealing a general negative relationship between pangenome size and the proportion of core genes, where larger “open” pangenomes have a lower proportion of core genes [36]. Overall, the Xenorhabdus–Photorhabdus pangenome showed a high level of genome variability, with only 1% of its genome being constant. Thus, the remaining 66% of the pangenome is composed of a wide repertoire of genes and molecular functions.
To our knowledge, this is the first pangenome analysis of Xenorhabdus and Photorhabdus in which the core genomes were examined using BDBH, COG and OMCL strategies. Based on most genes of the core genome grouping according to the NCBI Clusters of Orthologous Groups (COGs) database, many genes are involved in the generation and conversion of energy processes (29.35%), translation, ribosome structure and biogenesis (19.18%), amino acid transport and metabolism (12.40%) and replication, recombination and repair (11.61%), as shown in Figure 2.
The taxonomic position of strain SC 0516 was assessed using a maximum likelihood core genome phylogeny calculated from the 281 highest-scoring markers selected by the GET_PHYLOMARKERS pipeline from the 348 consensus groups calculated by GET_HOMOLOGUES. Three complete genomes of Y. pestis were included in the phylogenetic analysis. The core genome phylogeny showed that SC 0516 clustered with X. nematophila, as shown in Figure 3, is closely related to X. nematophila YL001 (GenBank accession number CP032329.1), isolated from nematodes from a soil sample collected in the locality of Shanxi, China. The strength of the phylogenetic tree obtained using this core genome-based approach resolved clades with maximum support.
In addition, the analysis allowed us to locate genus-specific genes of Xenorhabdus and Photorhabdus, highlighting those involved in pathogenicity and virulence. Overall, we found that Xenorhabdus lacks unique elements related to pathogenicity and virulence. However, the distinctive genes present in the genus included genes associated with tellurium resistance and polyamine transport. On the other hand, Photorhabdus presented 29unique elements associated with virulence and pathogenicity related to the type III secretion system, pilus structures and fimbriae (Supplementary Table S2). This analysis was consistent with previous observations that Photorhabdus possesses genes related to the type III secretion system that are absent in Xenorhabdus, and these play an important role in host insect invasion, as well as secretion of toxins and virulence factors [10,11,37,38]. The results showed that, although these genera are phylogenetically related similar lifestyles, they differ drastically in their molecular mechanisms of pathogenicity in the same host. Data indicate that Xenorhabdus probably relies on different effectors and secretion systems, which could be reflected in the differences in virulence capacity between the two genera.

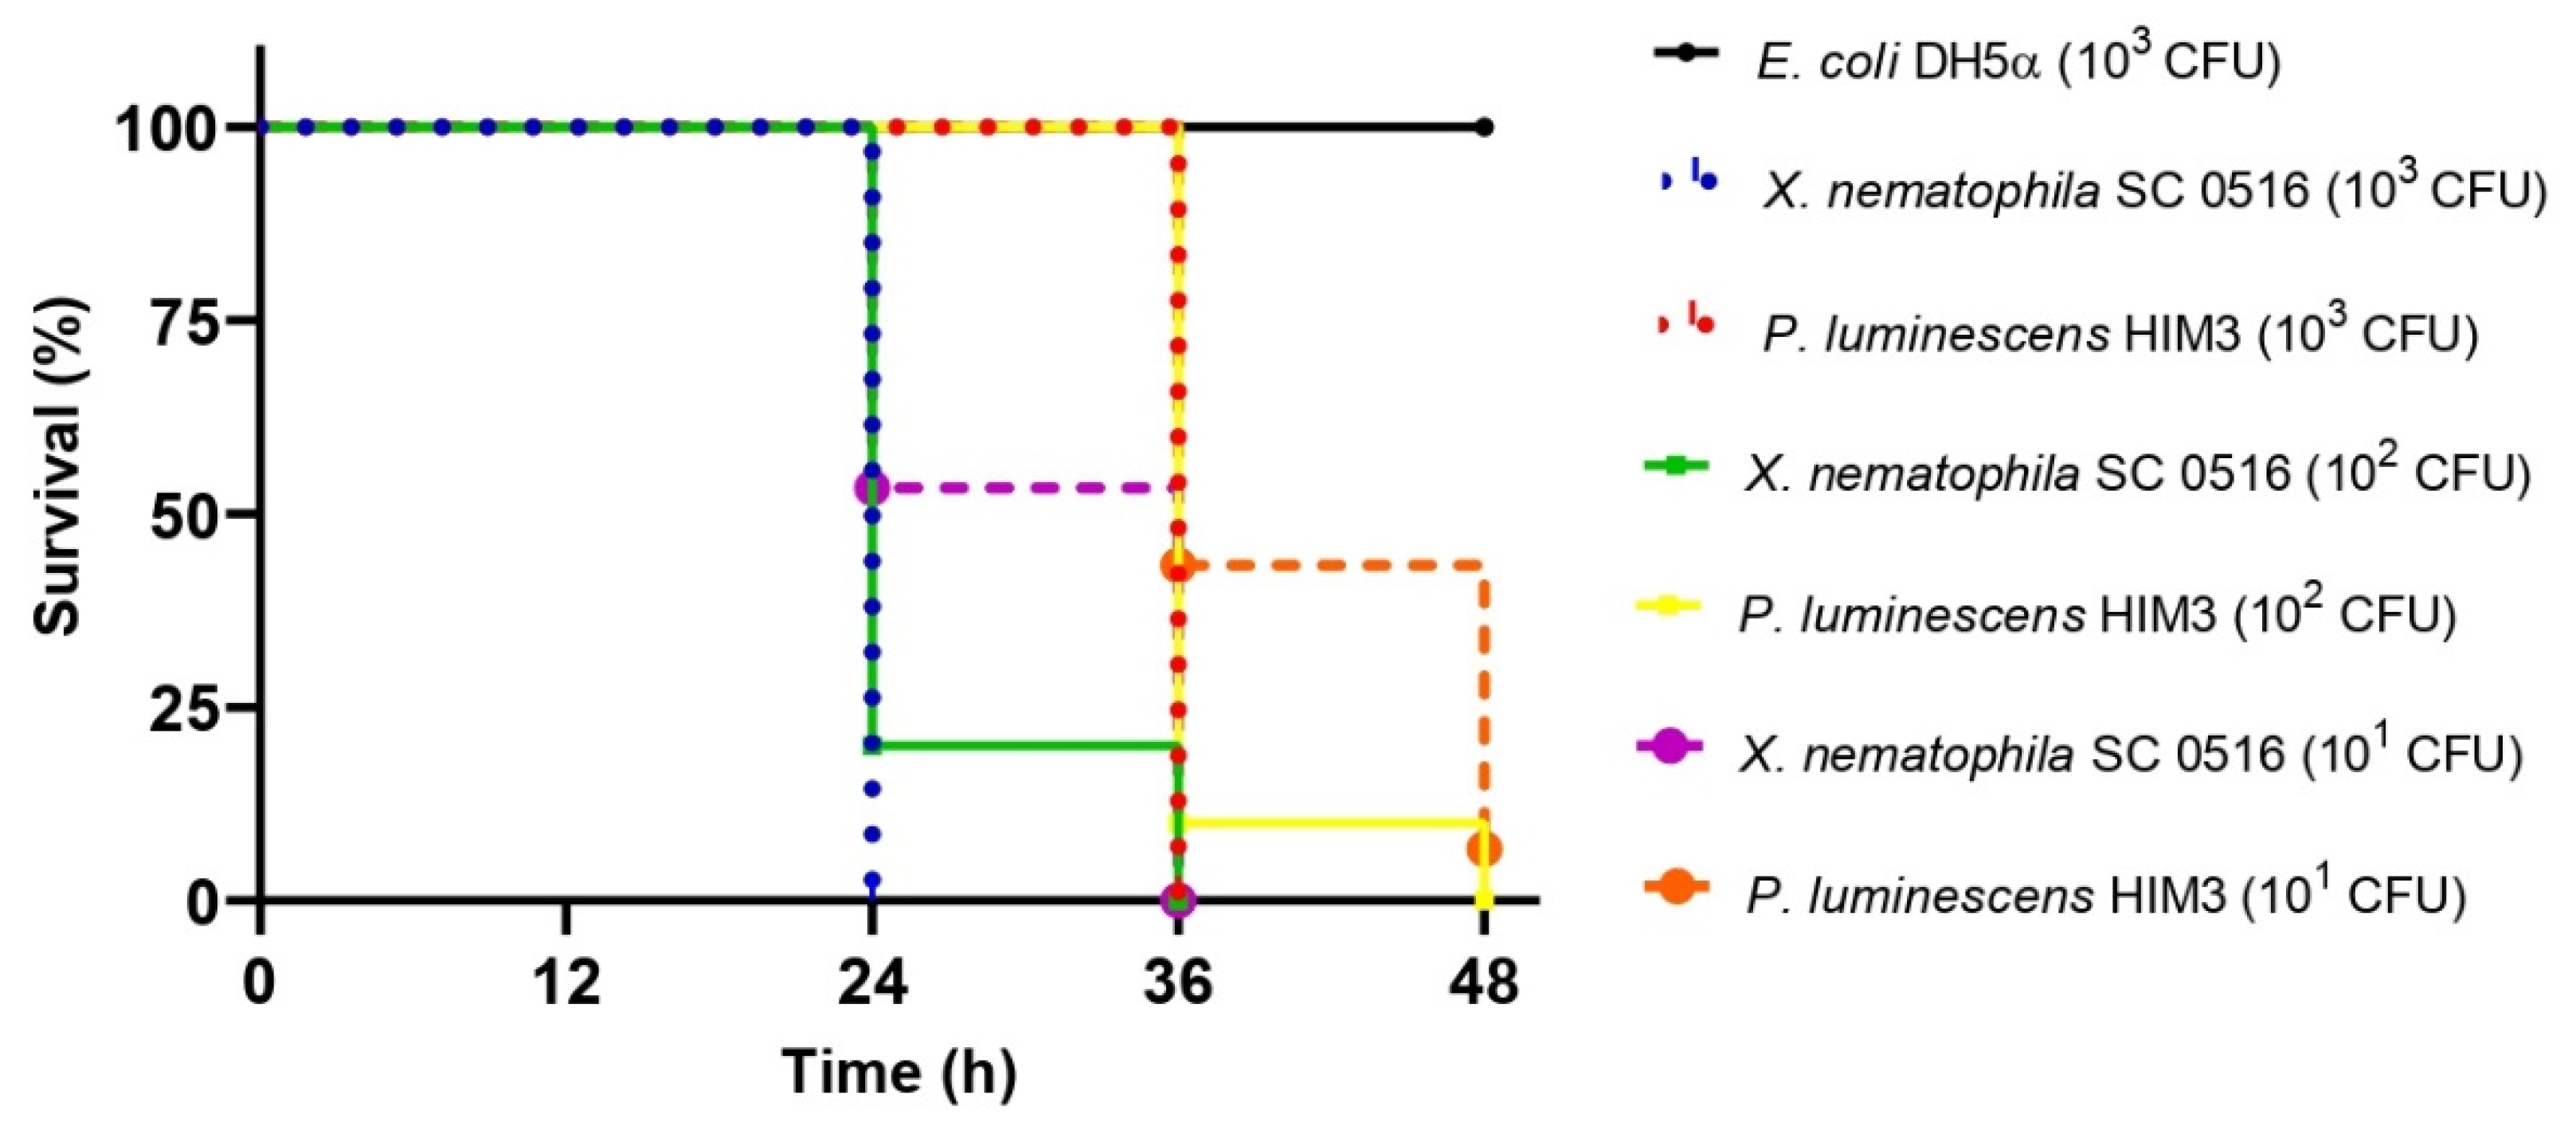
3.3. Evaluation of Pathogenicity in Galleria mellonella

To evaluate the pathogenicity of X. nematophila SC 0516, survival experiments were performed in G. mellonella by injecting different doses of colony forming units (CFUs). For a comparative analysis of pathogenicity, we used a bacterial strain previously characterized, identified as Photorhabdus luminescens HIM3 [39]. Bioassays showed that both bacteria were pathogenic to G. mellonella larvae, as demonstrated by the mortality rate visualized in Kaplan–Meier survival curves, which differed significantly from the control (E. coli DH5α) (X2 = 457.636, df = 6, and p < 0.001), as shown in Figure 4. This analysis revealed that X. nematophila SC 0516 was more virulent than P. luminescens HIM3 at all doses used (Figure 4). This difference was also illustrated by the median survival times (for which 50% of larvae survive) estimated from the Kaplan–Meier survival analysis. In the case of X. nematophila SC 0516, the median times were 26.4 and 24 h for doses of 102 and 103 CFUs, respectively, and 30.4 h for a dose of 101 CFUs. However, P. luminescens HIM3 showed median times of 37.2 and 36 h for doses of 102 and 103 CFUs, respectively, and 41 h for a dose of 101 CFUs (Table 1). We also observed differences in the phenotypes of the dead larvae. In the larvae treated with X. nematophila SC 0516, a slight darkening of the body was observed after 48 h of treatment, while those treated with P. luminescens HIM3 developed a dark reddish color at the same time. No external symptoms were observed in the control larvae (treated with E. coli DH5α) (Supplementary Figure S1).
To explain these differences, we looked for unique virulence- and pathogenicity-related elements present in the genomes of both bacteria. Our analysis showed that P. luminescens HIM3 presented a higher number and diversity of pathogenicity- and virulence-associated components than X. nematophila SC 0516 in almost all categories (Figure 5). The only unique elements presented by X. nematophila SC0516 were the mcf (makes caterpillars floppy) toxin (reported in the literature as a highly insecticidal toxin) and a higher number of genes associated with the type IV secretion system (T4SS) and the type I toxin–antitoxin system (Figure 5). An et al. (2009) compared the gene expression of Photorhabdus temperata and Xenorhabdus koppenhoeferi in vivo in the insect Rhizotrogus majalis, and found that more than 60% of the genes were uniquely induced in one of the two bacteria [40]. However, in Xenorhabdus, the mechanisms of toxin delivery to the insect are not completely known. Some mechanisms of secretion through the flagellar apparatus or by vesicular systems of the outer membrane have been suggested [41,42]. The pathogenicity of some Gram-negative bacteria depends on their ability to secrete virulence factors into the mammalian host through the release of outer membrane vesicles (OMVs). Some virulence factors include proteases, hemolysins, phospholipids and lipopolysaccharides [43,44]. The analysis of OMV proteins led to the identification of a 58 kDa GroEL homolog as a major component of a complex characterized as a virulence factor with insecticidal activity in some Xenorhabdus species, including X. nematophila [45,46]. These factors, termed moonlighting proteins, escaped our pangenome analysis, as was the case of the GroEL chaperonin, and could explain the differences in pathogenicity and virulence found between the two bacteria.

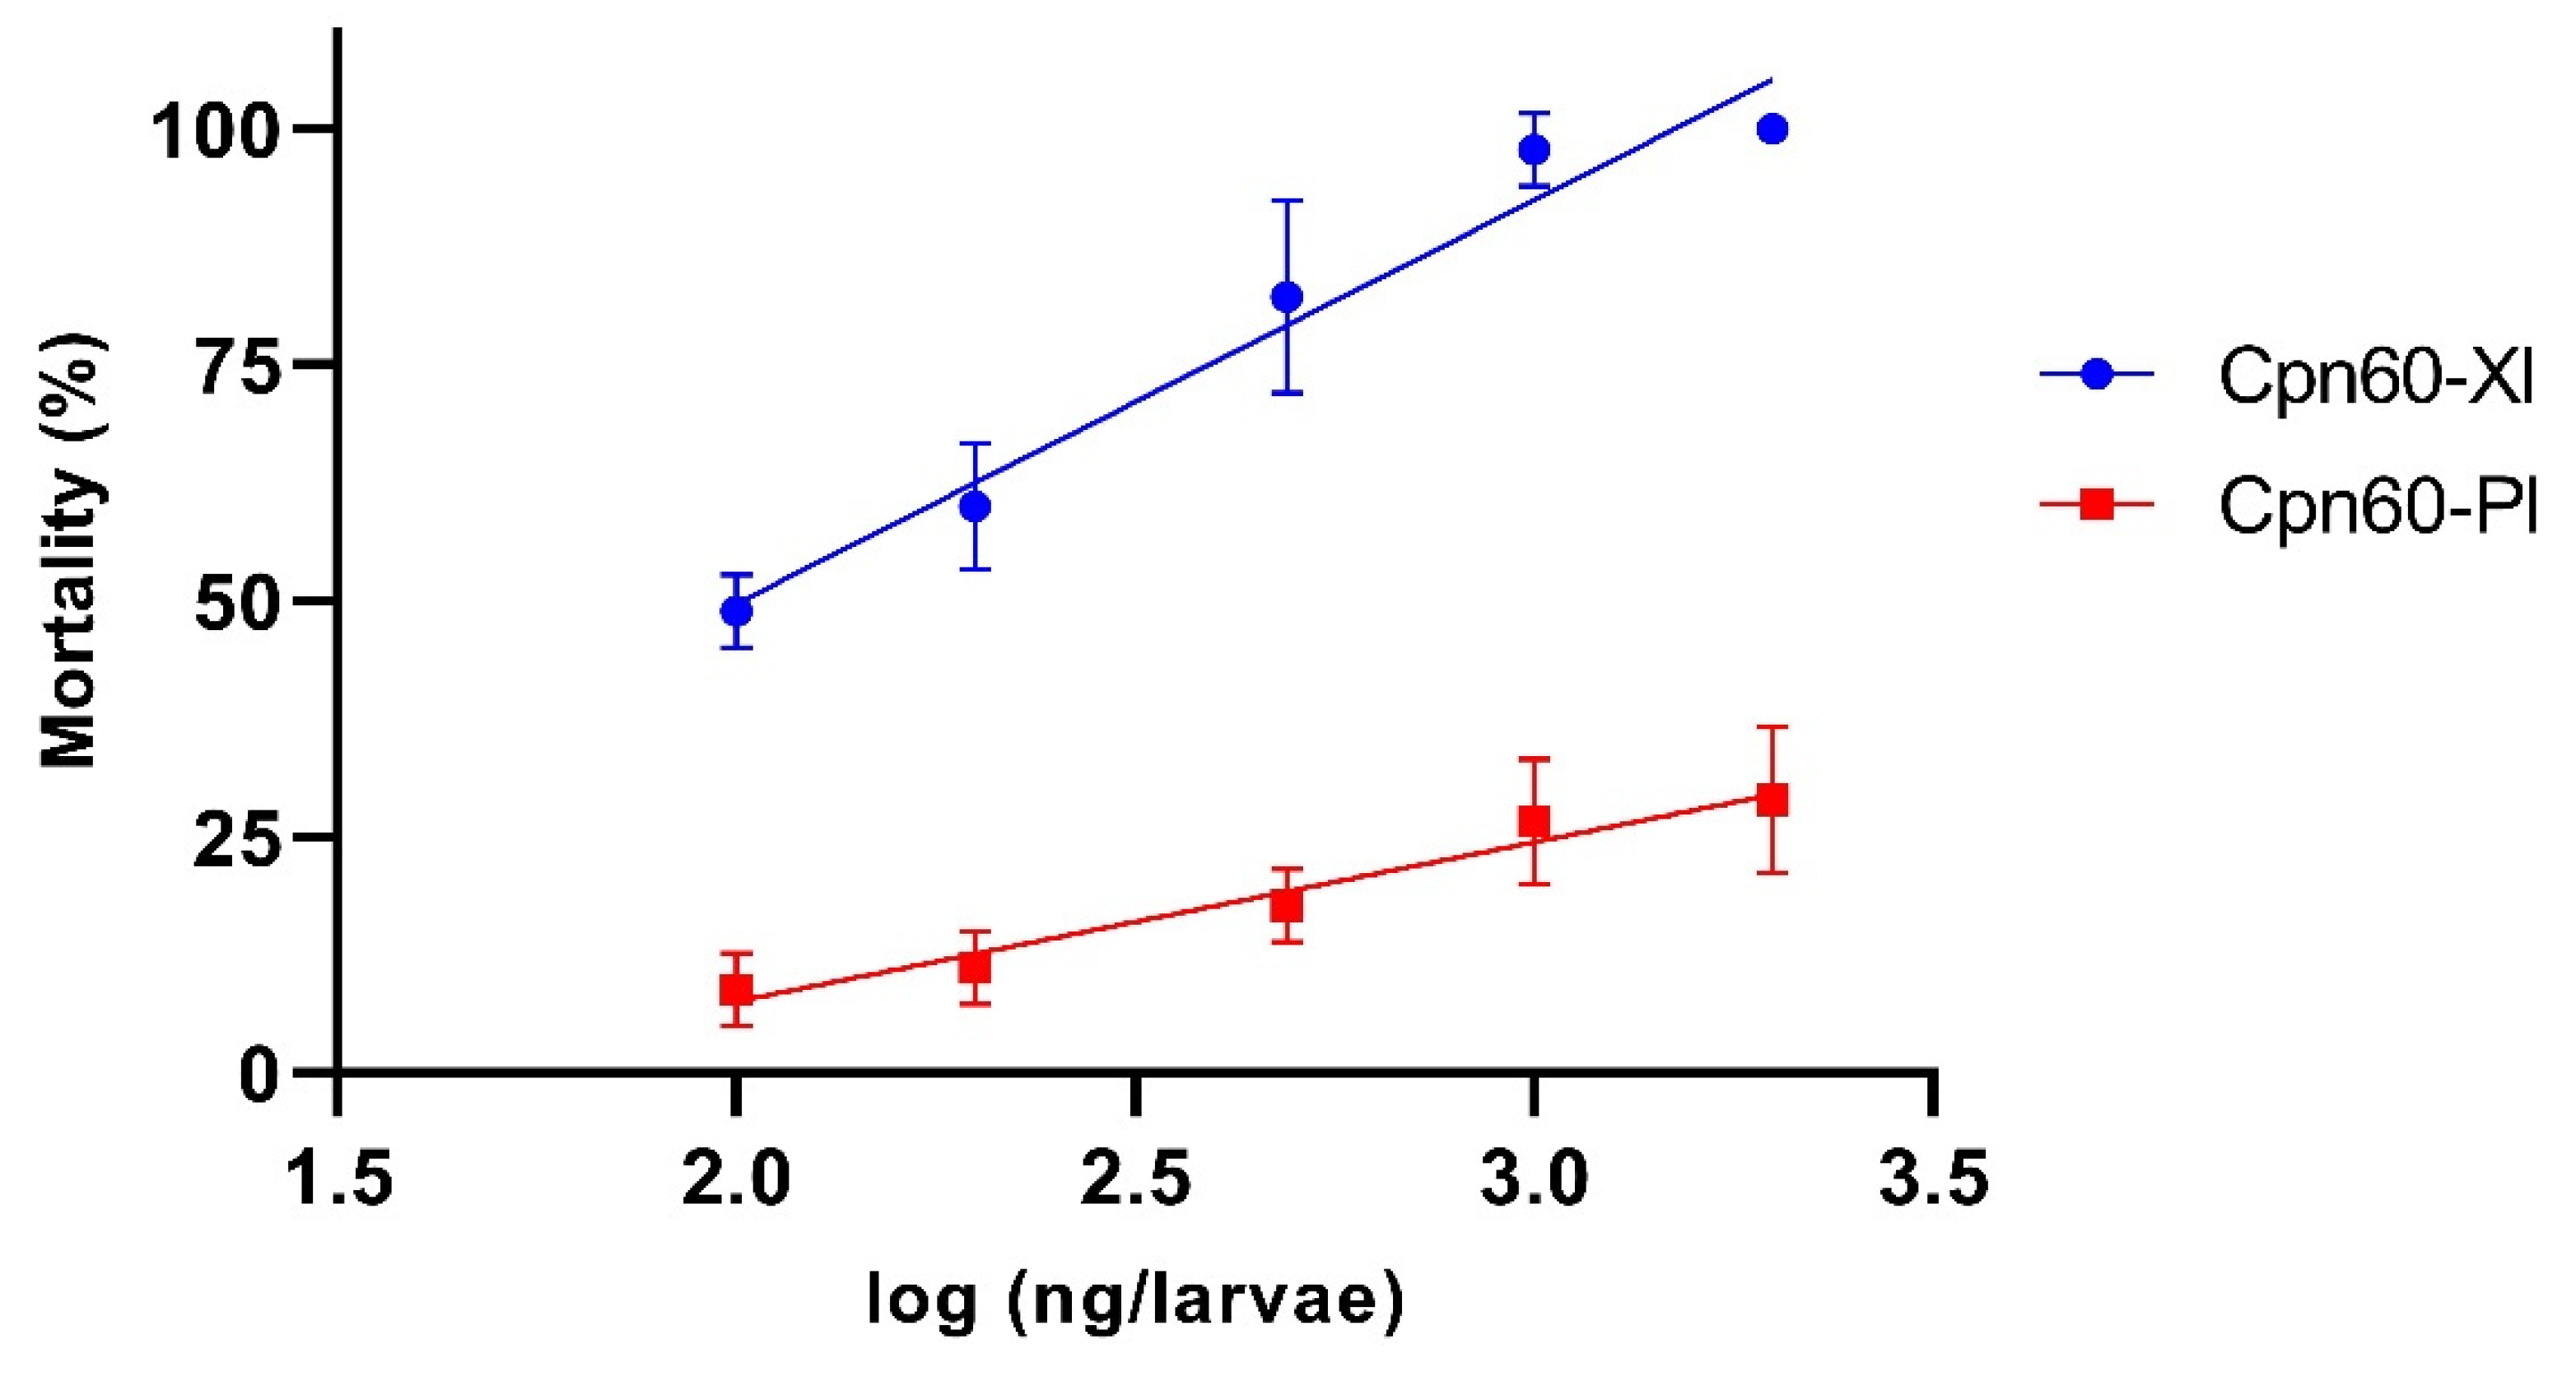
3.4. Evaluation of the Insecticidal Activity of GroEL Proteins

The GroEL proteins from both bacteria were cloned and expressed and named Cpn60-Xn and Cpn60-Pl (Supplementary Figure S2). It should be noted that genomic data showed that the two bacteria possess only a single copy of GroEL. The biological activity of the two purified proteins was evaluated with a direct hemolymph injection. This method introduces the protein directly into the insect, mimicking the release of toxins by bacteria, a phenomenon that occurs shortly after a nematode infects a target insect.
The bioassay results indicated that only the Cpn60-Xn protein killed a high percentage of G. mellonella larvae and that the mortality rate depended on the concentration of the protein used. The relationship between larval death and protein concentration was assessed by semilogarithmic linear regression analysis, slope values (m) representing toxicity of 42.73 and 16.87 for Cpn60-Xn and Cpn60-Pl, respectively. The difference between the slopes was highly significant (F = 31.50, DFn = 1, DFd = 26, p < 0.001) (Figure 6). The 50% lethal concentration (LC50) of the purified Cpn60-Xn protein was 102.34 ng/larvae. No external symptoms or mortality were observed in control larvae infiltrated with PBS or BSA (2000 ng), or simply punctured. GroEL toxicity has been reported in Enterobacter aerogenes (EnGroEL) and some Xenorhabdus species. EnGroEL was shown to be a paralytic toxin that ultimately killed cockroaches of the genus Blatella when injected into the hemolymph at a minimum dose of 2.7 ± 1.6 ng [47]. A GroEL protein from X. nematophila was purified and found to show insecticidal activity against larvae of the cotton bollworm, Helicoverpa armigera, after oral administration, but showed no effect when injected into the hemolymph of this insect [48]. Two other proteins from X. budapestensis (HIP57) and X. ehlersii (XeGroEL) were toxic in G. mellonella larvae when injected into the hemolymph, with LC50 values of 206.81 and 0.76 ± 0.08 ng/larva, respectively [49,50]. In Photorhabdus, GroEL was reported as a protein component of an 860 kDa complex found in the toxic fraction of P. luminescens W-14 extract [51]. However, as no direct evidence supporting this finding reported, this study provides the first evaluation of the activity of this protein.
A global alignment of the two protein sequences showed that they share 89.86% identity for 548 residues. Cpn60-Xn showed 35 substitutions relative to Cpn60-Pl, which were distributed throughout the protein. A three-dimensional homology-generated model of Cpn60-Xn showed that 13 of these substitutions were located in the apical domain, 2 in the intermediate domain, and 20 in the equatorial domain (Supplementary Figure S3). These point substitutions could be responsible for conferring the greater toxicity of Cpn60-Xn relative to Cpn60-Pl.

4. Conclusions

In this study, we sequenced and reported the genome of X. nematophila strain SC0516, which allowed us to perform the first robust pangenomic analysis of 91 genomes of Xenorhabdus and Photorhabdus, using three different algorithms. The results revealed that the differences between these two genera mainly involved genes belonging to the type III secretion systems and related to the fimbria and pilus, which are absent in Xenorhabdus. Despite this, data from biological experiments related to pathogenicity and virulence showed that both X. nematophila SC0516 and P. luminescens HIM3 strains were pathogenic. However, the former was more virulent at all concentrations tested, indicating differences in the mechanism of pathogenicity. In addition, the GroEL protein (reported as a virulence factor in Xenorhabdus) from X. nematophila SC0516 (Cpn60-Xn) showed significantly more insecticidal activity than that from P. luminescens HIM3 (Cpn60-Pl), at all concentrations when injected in G. mellonella larvae. Analysis of GroEL sequences from both bacteria showed that this protein was highly conserved in X. nematophila SC 0516 and P. luminescens HIM3, although the former presented 13 specific differences that could explain the difference observed in insecticidal activity.

Supplementary Materials

The following supporting information can be downloaded at: https://www.mdpi.com/article/10.3390/microorganisms10030486/s1, Table S1: Assembly level and general genome characteristics of 91 strains of Xenorhabdus and Photorhabdus occupied in the study; Table S2: Genus-specific genes of Xenorhabdus and Photorhabdus; Figure S1: Phenotypes of G.mellonella larvae after injection X.nematophila SC 0516; Figure S2: SDS-PAGE of purified GroEL proteins from X. nematophila SC 0516 (Cpn60-Xn) and P. luminescens HIM3 (Cpn60-Pl); Figure S3: Global alignment of the Cpn60-Xn and Cpn60-Pl sequences.

Author Contributions

A.R.-R. conceptualized the experimental design, conducted the experiment, analyzed the data and wrote the manuscript; R.S.-M. performed the bioassay with G. mellonella and revised the manuscript; A.J.-P. performed statistical analyses and proofread the manuscript; R.P.-M. performed bioinformatics analyses and revised the manuscript; B.I.G.-G. offered technical assistance in bioassays and proofread of the manuscript; E.D.-G. conceptualized the experimental design, analyzed the data and wrote the manuscript. All authors have read and agreed to the published version of the manuscript.

Funding

This research was funded by CONACyT scholarships of A.R.-R., numbered 442935, and a project of E.D.-G., with project number CONACyT A1-S-22034.

Institutional Review Board Statement

Not applicable.

Informed Consent Statement

Not applicable.

Data Availability Statement

All data associated with this manuscript are given in the manuscript, such as in the Supplementary Material; the entire genome of X. nematophila SC0516 was sequenced and deposited in GenBank (NCBI) with the assigned accession number: JACDOS000000000.1 (https://www.ncbi.nlm.nih.gov/nuccore/JACDOS000000000.1/, accessed on 30 December 2021).

Conflicts of Interest

The authors declare no conflict of interest.

References

  1. Akhurst, R.J.; Dunphy, G.B. Tripartite interactions between symbiotically associated entomopathogenic bacteria, nematodes, and their insect hosts. In Parasites and Pathogens of Insects; Academic Press: Cambridge, MA, USA, 1993; Volume 2, pp. 1–23. [Google Scholar]
  2. Akhurst, R.J. Bacterial symbionts of entomopathogenic nematodes: The power behind the throne. In Nematodes and The Biological Control of Insect Pests; CSIRO: East Melbourne, Australia, 1993; pp. 127–135. [Google Scholar]
  3. Forst, S.; Dowds, B.; Boemare, N.; Stackebrandt, E. Xenorhabdus and Photorhabdus spp.: Bugs That Kill Bugs. Annu. Rev. Microbiol. 1997, 51, 47–72. [Google Scholar] [CrossRef] [PubMed]
  4. Owuama, C.I. Entomopathogenic Symbiotic Bacteria, Xenorhabdus and Photorhabdus of Nematodes. World J. Microbiol. Biotechnol. 2001, 17, 505–515. [Google Scholar] [CrossRef]
  5. Adams, B.J.; Fodor, A.; Koppenhöfer, H.S.; Stackebrandt, E.; Patricia Stock, S.; Klein, M.G. Reprint of “Biodiversity and Systematics of Nematode–Bacterium Entomopathogens”. Biol. Control. 2006, 38, 4–21. [Google Scholar] [CrossRef]
  6. Gulcu, B.; Cimen, H.; Raja, R.K.; Hazir, S. Entomopathogenic Nematodes and Their Mutualistic Bacteria: Their Ecology and Application as Microbial Control Agents. Biopestic. Int. 2017, 13, 79–112. [Google Scholar]
  7. Sajnaga, E.; Kazimierczak, W. Evolution and Taxonomy of Nematode-Associated Entomopathogenic Bacteria of the Genera Xenorhabdus and Photorhabdus: An Overview. Symbiosis 2020, 80, 1–13. [Google Scholar] [CrossRef] [Green Version]
  8. Hinchliffe, S.J. Insecticidal Toxins from the Photorhabdus and Xenorhabdus Bacteria. TOTNJ 2013, 3, 101–118. [Google Scholar] [CrossRef]
  9. Poinar, G. Nematode biopesticides Fundam. Appl. Nematol. 1998, 21, 733–737. [Google Scholar]
  10. Goodrich-Blair, H.; Clarke, D.J. Mutualism and Pathogenesis in Xenorhabdus and Photorhabdus: Two Roads to the Same Destination. Mol. Microbiol. 2007, 64, 260–268. [Google Scholar] [CrossRef]
  11. Chaston, J.M.; Suen, G.; Tucker, S.L. The entomopathogenic bacterial endosymbionts Xenorhabdus and Photorhabdus: Convergent lifestyles from divergent genomes. PLoS ONE 2011, 6, e27909. [Google Scholar] [CrossRef]
  12. Lu, Q.-F.; Cao, D.-M.; Su, L.-L.; Li, S.-B.; Ye, G.-B.; Zhu, X.-Y.; Wang, J.-P. Genus-Wide Comparative Genomics Analysis of Neisseria to Identify New Genes Associated with Pathogenicity and Niche Adaptation of Neisseria Pathogens. Int. J. Genom. 2019, 2019, e6015730. [Google Scholar] [CrossRef] [Green Version]
  13. Kim, Y.; Gu, C.; Kim, H.U.; Lee, S.Y. Current Status of Pan-Genome Analysis for Pathogenic Bacteria. Curr. Opin. Biotechnol. 2020, 63, 54–62. [Google Scholar] [CrossRef] [PubMed]
  14. Tettelin, H.; Masignani, V.; Cieslewicz, M.J. Genome Analysis of Multiple Pathogenic Isolates of Streptococcus agalactiae: Implications for the Microbial “Pan-Genome”. Proc. Natl. Acad. Sci. USA 2005, 102, 13950–13955. [Google Scholar] [CrossRef] [Green Version]
  15. Tettelin, H.; Riley, D.; Cattuto, C.; Medini, D. Comparative Genomics: The Bacterial Pan-Genome. Curr. Opin. Microbiol. 2008, 11, 472–477. [Google Scholar] [CrossRef]
  16. McInerney, J.O.; McNally, A.; O’Connell, M.J. Why Prokaryotes Have Pangenomes. Nat. Microbiol. 2017, 2, 17040. [Google Scholar] [CrossRef] [PubMed]
  17. Wingett, S.W.; Andrews, S. FastQ Screen: A Tool for Multi-Genome Mapping and Quality Control. F1000Research 2018, 7, 1338. [Google Scholar] [CrossRef] [PubMed]
  18. Bolger, A.M.; Lohse, M.; Usadel, B. Trimmomatic: A Flexible Trimmer for Illumina Sequence Data. Bioinformatics 2014, 30, 2114–2120. [Google Scholar] [CrossRef] [PubMed] [Green Version]
  19. Cox, M.P.; Peterson, D.A.; Biggs, P.J. SolexaQA: At-a-Glance Quality Assessment of Illumina Second-Generation Sequencing Data. BMC Bioinform. 2010, 11, 485. [Google Scholar] [CrossRef] [PubMed] [Green Version]
  20. Bankevich, A.; Nurk, S.; Antipov, D.; Gurevich, A.A.; Dvorkin, M.; Kulikov, A.S.; Lesin, V.M.; Nikolenko, S.I.; Pham, S.; Prjibelski, A.D. Spades: A new genome assembly algorithm and its applications to single-cell sequencing. J. Comput. Biol. 2012, 19, 455–477. [Google Scholar] [CrossRef] [Green Version]
  21. Bosi, E.; Donati, B.; Galardini, M.; Brunetti, S.; Sagot, M.-F.; Lió, P.; Crescenzi, P.; Fani, R.; Fondi, M. MeDuSa: A Multi-Draft Based Scaffolder. Bioinformatics 2015, 31, 2443–2451. [Google Scholar] [CrossRef] [Green Version]
  22. Li, H.; Durbin, R. Fast and Accurate Short Read Alignment with Burrows–Wheeler Transform. Bioinformatics 2009, 25, 1754–1760. [Google Scholar] [CrossRef] [Green Version]
  23. Walker, B.J.; Abeel, T.; Shea, T.; Priest, M.; Abouelliel, A.; Sakthikumar, S.; Cuomo, C.A.; Zeng, Q.; Wortman, J.; Young, S.K.; et al. Pilon: An Integrated Tool for Comprehensive Microbial Variant Detection and Genome Assembly Improvement. PLoS ONE 2014, 9, e112963. [Google Scholar] [CrossRef] [PubMed]
  24. Aziz, R.K.; Bartels, D.; Best, A.A.; DeJongh, M.; Disz, T.; Edwards, R.A.; Formsma, K.; Gerdes, S.; Glass, E.M.; Kubal, M.; et al. The RAST Server: Rapid Annotations Using Subsystems Technology. BMC Genom. 2008, 9, 75. [Google Scholar] [CrossRef] [PubMed] [Green Version]
  25. Lagesen, K.; Hallin, P.; Rødland, E.A.; Stærfeldt, H.-H.; Rognes, T.; Ussery, D.W. RNAmmer: Consistent and Rapid Annotation of Ribosomal RNA Genes. Nucleic Acids Res. 2007, 35, 3100–3108. [Google Scholar] [CrossRef] [PubMed]
  26. Contreras-Moreira, B.; Vinuesa, P. GET_HOMOLOGUES, a Versatile Software Package for Scalable and Robust Microbial Pangenome Analysis. Appl. Environ. Microbiol. 2013, 79, 7696–7701. [Google Scholar] [CrossRef] [PubMed] [Green Version]
  27. Vinuesa, P.; Ochoa-Sánchez, L.E.; Contreras-Moreira, B. GET_PHYLOMARKERS, a Software Package to Select Optimal Orthologous Clusters for Phylogenomics and Inferring Pan-Genome Phylogenies, Used for a Critical Geno-Taxonomic Revision of the Genus Stenotrophomonas. Front. Microbiol. 2018, 9, 771. [Google Scholar] [CrossRef] [PubMed] [Green Version]
  28. Vinuesa, P.; Contreras-Moreira, B. Robust Identification of Orthologues and Paralogues for Microbial Pan-Genomics Using GET_HOMOLOGUES: A Case Study of PIncA/C Plasmids. In Bacterial Pangenomics: Methods and Protocols; Mengoni, A., Galardini, M., Fondi, M., Eds.; Methods in Molecular Biology; Springer: New York, NY, USA, 2015; pp. 203–232. [Google Scholar] [CrossRef] [Green Version]
  29. Nguyen, L.-T.; Schmidt, H.A.; von Haeseler, A.; Minh, B.Q. IQ-TREE: A Fast and Effective Stochastic Algorithm for Estimating Maximum-Likelihood Phylogenies. Mol. Biol. Evol. 2015, 32, 268–274. [Google Scholar] [CrossRef] [PubMed]
  30. Rambaut, A. FigTree v1.4.4; Institute of Evolutionary Biology, University of Edinburgh: Edinburgh, UK, 2010. [Google Scholar]
  31. Madeira, F.; Park, Y.M.; Lee, J.; Buso, N.; Gur, T.; Madhusoodanan, N.; Basutkar, P.; Tivey, A.R.N.; Potter, S.C.; Finn, R.D.; et al. The EMBL-EBI Search and Sequence Analysis Tools APIs in 2019. Nucleic Acids Res. 2019, 47, W636–W641. [Google Scholar] [CrossRef] [Green Version]
  32. Yang, J.; Zhang, Y. I-TASSER Server: New Development for Protein Structure and Function Predictions. Nucleic Acids Res. 2015, 43, W174–W181. [Google Scholar] [CrossRef] [Green Version]
  33. Humphrey, W.; Dalke, A.; Schulten, K. VMD: Visual Molecular Dynamics. J. Mol. Graph. 1996, 14, 33–38. [Google Scholar] [CrossRef]
  34. Roberts, E.; Eargle, J.; Wright, D.; Luthey-Schulten, Z. MultiSeq: Unifying Sequence and Structure Data for Evolutionary Analysis. BMC Bioinform. 2006, 7, 382. [Google Scholar] [CrossRef] [Green Version]
  35. Treangen, T.J.; Rocha, E.P.C. Horizontal Transfer, Not Duplication, Drives the Expansion of Protein Families in Prokaryotes. PLoS Genet. 2011, 7, e1001284. [Google Scholar] [CrossRef] [PubMed] [Green Version]
  36. Brockhurst, M.A.; Harrison, E.; Hall, J.P.J.; Richards, T.; McNally, A.; MacLean, C. The Ecology and Evolution of Pangenomes. Curr. Biol. 2019, 29, R1094–R1103. [Google Scholar] [CrossRef] [PubMed]
  37. Brugirard-Ricaud, K.; Givaudan, A.; Parkhill, J.; Boemare, N.; Kunst, F.; Zumbihl, R.; Duchaud, E. Variation in the Effectors of the Type III Secretion System among Photorhabdus Species as Revealed by Genomic Analysis. J. Bacteriol. 2004, 186, 4376–4381. [Google Scholar] [CrossRef] [PubMed] [Green Version]
  38. Brugirard-Ricaud, K.; Duchaud, E.; Givaudan, A.; Girard, P.A.; Kunst, F.; Boemare, N.; Brehélin, M.; Zumbihl, R. Site-Specific Antiphagocytic Function of the Photorhabdus luminescens Type III Secretion System during Insect Colonization. Cell 2005, 7, 363–371. [Google Scholar] [CrossRef]
  39. Salgado-Morales, R.; Martínez-Ocampo, F.; Obregón-Barboza, V.; Vilchis-Martínez, K.; Jiménez-Pérez, A.; Dantán-González, E. Assessing the Pathogenicity of Two Bacteria Isolated from the Entomopathogenic Nematode Heterorhabditis indica against Galleria mellonella and Some Pest Insects. Insects 2019, 10, 83. [Google Scholar] [CrossRef] [Green Version]
  40. An, R.; Sreevatsan, S.; Grewal, P.S. Comparative in Vivo Gene Expression of the Closely Related Bacteria Photorhabdus temperata and Xenorhabdus koppenhoeferi upon Infection of the Same Insect Host, Rhizotrogus majalis. BMC Genom. 2009, 10, 433. [Google Scholar] [CrossRef] [Green Version]
  41. Cowles, K.N.; Goodrich-Blair, H. Expression and Activity of a Xenorhabdus nematophila Haemolysin Required for Full Virulence towards Manduca sexta Insects. Cell. Microbiol. 2005, 7, 209–219. [Google Scholar] [CrossRef]
  42. Darsouei, R.; Karimi, J.; Dunphy, G.B. Functional Characterization of Outer Membrane Proteins (OMPs) in Xenorhabdus nematophila and Photorhabdus luminescens through Insect Immune Defense Reactions. Insects 2019, 10, 352. [Google Scholar] [CrossRef] [Green Version]
  43. Schwechheimer, C.; Kuehn, M.J. Outer-Membrane Vesicles from Gram-Negative Bacteria: Biogenesis and Functions. Nat. Rev. Microbiol. 2015, 13, 605–619. [Google Scholar] [CrossRef] [Green Version]
  44. Avila-Calderón, E.D.; Ruiz-Palma, M.d.S.; Aguilera-Arreola, M.G.; Velázquez-Guadarrama, N.; Ruiz, E.A.; Gomez-Lunar, Z.; Witonsky, S.; Contreras-Rodríguez, A. Outer Membrane Vesicles of Gram-Negative Bacteria: An Outlook on Biogenesis. Front. Microbiol. 2021, 12, 557902. [Google Scholar] [CrossRef]
  45. Khandelwal, P.; Banerjee-Bhatnagar, N. Insecticidal Activity Associated with the Outer Membrane Vesicles of Xenorhabdus nematophilus. Appl. Environ. Microbiol. 2003, 69, 2032–2037. [Google Scholar] [CrossRef] [PubMed] [Green Version]
  46. Khandelwal, P.; Bhatnagar, R.; Choudhury, D.; Banerjee, N. Characterization of a Cytotoxic Pilin Subunit of Xenorhabdus nematophila. Biochem. Biophys. Res. Commun. 2004, 314, 943–949. [Google Scholar] [CrossRef] [PubMed]
  47. Yoshida, N.; Oeda, K.; Watanabe, E.; Mikami, T.; Fukita, Y.; Nishimura, K.; Komai, K.; Matsuda, K. Chaperonin Turned Insect Toxin. Nature 2001, 411, 44. [Google Scholar] [CrossRef] [PubMed]
  48. Joshi, M.C.; Sharma, A.; Kant, S.; Birah, A.; Gupta, G.P.; Khan, S.R.; Bhatnagar, R.; Banerjee, N. An Insecticidal GroEL Protein with Chitin Binding Activity from Xenorhabdus nematophila. J. Biol. Chem. 2008, 283, 28287–28296. [Google Scholar] [CrossRef] [PubMed] [Green Version]
  49. Yang, J.; Zeng, H.-M.; Lin, H.-F.; Yang, X.-F.; Liu, Z.; Guo, L.-H.; Yuan, J.-J.; Qiu, D.-W. An Insecticidal Protein from Xenorhabdus budapestensis That Results in Prophenoloxidase Activation in the Wax Moth, Galleria mellonella. J. Invertebr. Pathol. 2012, 110, 60–67. [Google Scholar] [CrossRef]
  50. Shi, H.; Zeng, H.; Yang, X.; Zhao, J.; Chen, M.; Qiu, D. An Insecticidal Protein from Xenorhabdus ehlersii Triggers Prophenoloxidase Activation and Hemocyte Decrease in Galleria mellonella. Curr. Microbiol. 2012, 64, 604–610. [Google Scholar] [CrossRef]
  51. Guo, L.; Fatig, R.O.; Orr, G.L.; Schafer, B.W.; Strickland, J.A.; Sukhapinda, K.; Woodsworth, A.T.; Petell, J.K. Photorhabdus luminescens W-14 Insecticidal Activity Consists of at Least Two Similar but Distinct Proteins: Purification and characterization of toxin a and toxin b. J. Biol. Chem. 1999, 274, 9836–9842. [Google Scholar] [CrossRef] [Green Version]
Figure 1. (A) Bar plot of the frequency of genes within the 91 genomes included in this analysis. Genes present in a single genome are lineage-specific, while at the opposite end of the scale, genes found in all 91 genomes represent the core genome. (B) Plot of the estimated pangenome sizes of Xenorhabdus–Photorhabdus fitted with the Tettelin function. (C) Venn diagram of the core genome generated by the bidirectional best-hit (BDBH), Cluster of Orthologous Groups (COG), and Markov Clustering of orthologs (OMCL) algorithms. (D) Plot of the estimated core genome sizes of Xenorhabdus–Photorhabdus.
Microorganisms 10 00486 g001
Figure 2. COG functional classification of genes belonging to the Xenorhabdus–Photorhabdus core genome. COG database annotation was used to classify the 348 members belonging to the core genome. The abundance of specific gene classes is shown.
Microorganisms 10 00486 g002
Figure 3. Maximum likelihood (ML) core genome phylogeny. The ML tree is based on 281 consensus protein-coding genes defined by the GET_HOMOLOGES package and filtered through GET_PHYLOMARKERS, selected for their optimal phylogenetic attributes. Nodal support values are color-coded as shown in the legend. The first value corresponds to approximate Bayesian support values, whereas the second one corresponds to ultrafast bootstrap values, as implemented in IQTREE. The scale represents the number of expected substitutions per site under the best-fit GTR2+F+R3 (binary) model. The phylogeny corresponds to the tree with the highest score (lnL = −3,045,265.731) found among 10 independent searches in IQTREE.
Microorganisms 10 00486 g003
Figure 4. Kaplan–Meier survival curves of G. mellonella larvae after direct injection with X. nematophila SC 0516. Experiments were performed four times in independent bioassays, and survival was assessed at 12, 24, 36 and 48 h after infection. Differences in survival (n = 60) were calculated using the log-rank test X2 = 457.636, df = 6, p < 0.001.
Microorganisms 10 00486 g004
Figure 5. Unique and shared genes between X. nematophila SC 0516 and P. luminescens HIM3. The x-axis indicates the total number of genes present in one or both bacteria, and the y-axis indicates the types of genes associated with virulence; Type Secretion System (TSS), Toxin Complex (tc), Makes Caterpillars Floppy (mcf), Photorhabdus Insect-Related Toxins (Pir), and Non-Ribosomal Peptide Synthetases (NRPS).
Microorganisms 10 00486 g005
Figure 6. Insecticidal activity of GroEL from X. nematophila SC 0516 (Cpn60-Xn) and P. luminescens HIM3 (Cpn60-Pl) against G. mellonella larvae. Plot of percent mortality against the protein concentration. Each dot in the plot represents the average of three individual experiments ± standard error.
Microorganisms 10 00486 g006
Table 1. Survival time (h) of G. mellonella larvae injected with different doses of colony forming units (CFUs) of X. nematophila SC 0516 and P. luminescens HIM3.
Strain101 CFU102 CFU103 CFU
E. coli DH5α - 48 A
P. luminescens HIM341 ± 0.771 A37.2 ± 0.469 A36 B
X. nematophila SC 051630. 4 ± 0.779 B26.4 ± 0.625 B24 C
Log-rank test: 457.636, df: 6, p < 0.001. Survival time on the same column followed by the same letter is not significantly different (Holm–Sidak test, p > 0.05).
Publisher’s Note: MDPI stays neutral with regard to jurisdictional claims in published maps and institutional affiliations.

