Abstract
The bacterium Yersinia pestis has developed various strategies to sense and respond to the complex stresses encountered during its transmission and pathogenic processes. PurR is a common transcriptional regulator of purine biosynthesis among microorganisms, and it modulates the transcription level of the pur operon to suppress the production of hypoxanthine nucleotide (IMP). This study aims to understand the functions and regulatory mechanisms of purR in Y. pestis. Firstly, we constructed a purR knockout mutant of Y. pestis strain 201 and compared certain phenotypes of the null mutant (201-ΔpurR) and the wild-type strain (201-WT). The results show that deleting purR has no significant impact on the biofilm formation, growth rate, or viability of Y. pestis under different stress conditions (heat and cold shock, high salinity, and hyperosmotic pressure). Although the cytotoxicity of the purR knockout mutant on HeLa and 293 cells is reduced, the animal-challenging test found no difference of the virulence in mice between 201-ΔpurR and 201-WT. Furthermore, RNA-seq and EMSA analyses demonstrate that PurR binds to the promoter regions of at least 15 genes in Y. pestis strain 201, primarily involved in purine biosynthesis, along with others not previously observed in other bacteria. Additionally, RNA-seq results suggest the presence of 11 potential operons, including a newly identified co-transcriptional T6SS cluster. Thus, aside from its role as a regulator of purine biosynthesis, purR in Y. pestis may have additional regulatory functions.
1. Introduction
Yersinia pestis is the causative agent of the plague, a highly infectious disease that has caused three global pandemics throughout human history [1,2]. This bacterium possesses the ability to adapt to both flea (26 °C) and mammalian (37 °C) body temperatures, as transmission between these hosts is crucial for its natural life cycle [3]. However, Y. pestis can undergo physiological changes in anabolism when exposed to different environments. As a relatively young bacterium that diverged from Yersinia pseudotuberculosis approximately 7000 years ago [4,5], Y. pestis displays a moderate degree of sequence diversity.
Purine plays a vital role in the survival of microorganisms, and most bacteria rely on de novo synthesis for its production. The purR gene is widely present in bacterial genomes and functions as a transcriptional repressor, regulating purine biosynthesis by controlling the expression of the pur operon [6,7,8]. The deletion of purR had been proven to enhance the metabolic flow of the purine pathway and improve the production of riboflavin in Escherichia coli, Bacillus subtilis, and Ashbya gossypii [9,10,11]. However, in certain bacteria, purR serves additional roles beyond its involvement in purine regulation. For instance, in Escherichia coli, purR contributes to the bacterium’s tolerance to organic solvents and enhances its viability when exposed to them [12]. Moreover, mutations in purR have been shown to increase the virulence of Staphylococcus aureus [13]. Nevertheless, the precise functions of the purR gene in Y. pestis remains incompletely understood.
To investigate the functions of the purR gene in Y. pestis, we compared the adaptabilities of Y. pestis strain 201 (201-WT) and its purR knockout mutant (201-ΔpurR). We observed that the deletion of purR had minimal impact on the environmental adaptability of Y. pestis strain 201. To further elucidate the role of purR as a transcriptional regulator, we conducted RNA-seq and assessed the expression of the PurR protein. RNA-seq results revealed significant alterations in the transcription levels of numerous genes across the entire genome upon deletion of purR, indicating specific associations between certain genes and purR in Y. pestis. Moreover, Electrophoretic Mobility Shift Assay (EMSA) results demonstrated that PurR could directly bind to the promoter regions of multiple genes within the Y. pestis genome, suggesting its direct regulation of their transcription and expression. Collectively, our findings offer valuable insights into the regulatory function of purR in governing gene expression in Y. pestis.
2. Materials and Methods
2.1. Bacterial Strains and Culture Conditions
The strains and plasmids used in this study are presented in Table 1, with the primer sequences listed in Supplementary Table S1. Y. pestis strain 201 has an identical genome as strain 91,001, which is highly lethal to mice but avirulent to humans [14,15]. Different culture conditions were employed for Y. pestis and E. coli throughout the experiment. Y. pestis was cultivated in LB (Luria-Bertani) medium at a temperature of 26 °C to mimic the temperature of fleas (the vector of Y. pestis in the flea transmission process of plague) [16], whereas E. coli was cultured in LB medium at 37 °C. Chloramphenicol (34 µg/mL) was added during the cultivation of the complementation strain harboring the pACYC184 plasmid, while kanamycin (50 µg/mL) was necessary for the growth of the strain carrying the pET28a (+) plasmid. All bacterial experiments were performed in a biological safety cabinet.

Table 1.
Bacterial strains and plasmids used in this study.
2.2. DNA Extraction and Amplification
Genomic DNA and plasmids were extracted using the QIAamp DNA Mini Kit (Qiagen, Hilden, Germany) and QIAprep Spin Miniprep Kit (Qiagen, Hilden, Germany), respectively, following the manufacturer’s instructions. The target segments were amplified using PCR with 1.1× GoldenStar mix (Green) (Tsingke Biotechnology Co., Ltd., Beijing, China).
2.3. Construction of the Mutant and Complementation Strain
The pDS132 was digested by incubating overnight at 37 °C with SphI and SacI enzymes (LMAI Bio, Shanghai, China) together. The upstream and downstream homology arms of purR were then ligated with the linearized pDS132 using 2× Seamless Cloning Mix (Biomed, Beijing, China) at 50 °C for 15 min with a molar ratio of vector to DNA of 1:3, and the recombinant vector was introduced into E. coli S17λpir to obtain S17-pDS132-purR-del for conjugation with Y. pestis.
S17-pDS132-purR-del and 201-WT strains were cultured in LB medium at either 37 °C or 26 °C until reaching an OD620 of 0.8. After centrifugation at 1900× g for 5 min, the pellet of S17-pDS132-purR-del (1.5 mL) and 201-WT (100 µL) cultures was resuspended and added dropwise onto a filter membrane (0.45 µm) placed on LB plates. The cells on the filter paper were then incubated overnight at 26 °C, and the resulting eluate was spread onto Yersinia Selective Agar Base plates (Oxoid, Basingstoke, UK) supplemented with chloramphenicol (6.8 µg/mL) and incubated at 26 °C. Conjugations were expected to occur under these conditions and were selected on LB plates containing 7% sucrose. The obtained colonies were further analyzed to confirm the expectant conjugant through PCR amplification and sequencing; the correct sequencing results indicate that purR has been successfully knocked out, and this strain has been named 201-ΔpurR.
For complementation of purR, the pACYC184 plasmid was digested with Hind III and BamH I enzymes (LMAI Bio, Shanghai, China), and the purR fragment and linearized pACYC184 were then ligated as described previously. The resulting recombinant vector was introduced into competent E. coli DH5α cells. The expected recombinant plasmid was identified using PCR sequencing and extracted before being transferred into 201-ΔpurR. The resulting transformant was confirmed using PCR sequencing and designated as 201-ΔpurR-Comp.
2.4. Growth Rate Determination
The 201-WT and 201-ΔpurR strains were cultured until they reached an optical density of 1.0 at OD620 (ca.2 × 108 CFU/mL). Subsequently, the bacterial cultures were inoculated at a ratio of 1:100 in Erlenmeyer flasks containing 60 mL of either fresh LB or a chemically defined TMH liquid medium [20]. The size of Erlenmeyer flasks was 150 mL. All Erlenmeyer flasks were then placed in a precision cell culture shaker (Zhicheng ZWYF-290, Shanghai, China) set at 26 °C with shaking at 200 rpm, and the OD600 values of the cultures were measured hourly. Once all strains entered the decline phase, data were collected and plotted for analysis. Each strain underwent three independent biological replications under identical conditions, and the results were expressed as the mean ± standard deviation of the three biological replicated experiments. The experimental procedure at 37 °C was similar to the above, with the exception that the temperature was adjusted accordingly.
2.5. Biofilm Formation Analysis
The 201-WT and 201-ΔpurR strains were cultured until they reached an optical density of 1.0 at OD620 (ca.2 × 108 CFU/mL) and stored at 4 °C for 16 h. Subsequently, the cultures were diluted by a factor of 10 and transferred into a 24-well cell culture plate, with 1 mL per well. Six independent biological replicates were established for each strain under identical conditions. The plate was then shaken at either 26 °C or 37 °C for 24 h. After removing the bacterial cultures from the wells, OD620 was measured. The wells were gently washed twice with deionized water, and the biofilm was fixed at 80 °C for 15 min. Then, 3 mL of 0.1% crystal violet solution (Solarbio, Beijing, China) was added dropwise to each well. The crystal violet solution was discarded after 15 min staining, and the wells were gently washed three times with deionized water. Subsequently, 2.8 mL of ethanol was added to each well and left at room temperature for 3 h. OD570 of the solution was determined after a five-fold dilution. The relative amount of biofilm formation was calculated using the formula: 100 × OD570/OD620.
2.6. Survivability under Stressful Environments
The strains 201-WT and 201-ΔpurR were cultured until they reached an OD620 of 1.0. These strains were then exposed to various stressful conditions, including 0.5 M sorbitol for 0.5 h and 1.5 h, 7.5% NaCl for 1.5 h, cold shock for 24 h, or heat shock for 0.5 h. Bacterial numbers were counted before and after the stimulation to determine the survival rate of these two strains under different stressful conditions. Each strain was subjected to three independent biological replicates, and the results were reported as the mean standard deviation of the three experiments.
2.7. Real-Time Cell Analysis (RTCA) Assay
HeLa and 293 cells were cultured in Dulbecco’s Modified Eagle’s Medium (DMEM, Solarbio, Beijing, China) supplemented with 10% fetal bovine serum (FBS), at 37 °C and 5% CO2. The baseline measurement was taken using 50 µL of DMEM with 10% FBS on the pre-incubated RTCA iCELLigence system (ACEA Biosciences, San Diego, CA, USA), maintained at same conditions. Subsequently, 5 × 10³ cells were added to each well of an E-plate and incubated at room time for 30 min. The cells were then transferred to the RTCA iCELLigence system and incubated overnight [21]. The bottom of the cell culture plate compatible with the RTCA system has electrodes to record cell detachment as cell index (CI). Strains were cultivated in LB until they reached an optical density of 1.0 at OD620, after removing the supernatant via centrifugation, the bacterial were resuspended in PBS to an optical density of 1.0 at OD620 (ca.2 × 108 CFU/mL). Subsequently, the appropriate volume of bacterial suspension was added at a ratio of MOI = 5 or 10 as calculated. Incubation was continued, and the cell index was measured every 15 min and normalized based on the time point at which bacteria were added. Each strain was subjected to three independent biological replicates under identical conditions.
2.8. Survival Curves
The 201-WT and 201-ΔpurR strains were cultured until they reached an optical density of 1.0 at OD620 (ca.2 × 108 CFU/mL), and the concentration was adjusted to 3 × 10⁴ CFU/mL with PBS. Female BALB/c mice, aged 8–10 weeks, were randomly divided into three groups (n = 10) and intraperitoneally challenged with a 100 µL diluted culture. The control group received an equal volume of PBS via the same injection route. Mouse mortality was monitored daily, and the survival curve was plotted.
2.9. RNA-Seq and Quantitative Reverse Transcription PCR (qRT-PCR)
201-WT and 201-ΔpurR were cultured in LB medium at either 26 °C or 37 °C until reaching an OD620 of 1.0, and each strain had three biological replicates. Total RNA was extracted from the bacteria using the PureLink™ RNA Mini Kit (Tiangen, Beijing, China) following the manufacturer’s instructions. After measuring the concentration of total RNA, they were sent to Beijing macro & micro- test Bio-Tech Co., Ltd. (Beijing, China) for sequencing. The company created a cDNA library and used Illumina NovaSeq 6000 for sequencing. The extracted RNA was used to create a cDNA library with at least 2 G raw data. The raw data were trimmed with Trimmomatric software fastp version 0.23.4 to filter adapters and low-quality reads (<Q20).
The genes for qRT-PCR were selected based on the results of the RNA-seq analysis under 26 °C culture conditions, and they were YP_RS00205, purK, purE, purT, purF, cvpA, purL, YP_RS13225, purM, purN, purH, YP_RS20395, ybtE, ybtT, ybtU, irp1, and YP_RS10830, respectively. The RNA samples used for RNA-seq were reverse transcribed into cDNA using SynScript III RT SuperMix (Tsingke Biotechnology Co., Ltd., Beijing, China). Linear regression analysis was employed to determine the correlations between the RNA-seq data and the outcomes of qRT-PCR
2.10. Expression and Purification of PurR
The pET28a (+) plasmid which contains T7 promoter and the target purR fragment were digested with Hind III and BamH I enzymes (LMAI Bio, Shanghai, China). After ligation of the purR fragment and linearized vector using T4 DNA ligase (Sangon, Shanghai, China), the resulting recombinant plasmid containing purR was introduced into E. coli DH5α. Subsequently, the recombinant plasmid was extracted and transferred into E. coli BL21(DE3), with the transformed strain designated as BL21(DE3)-pET28a (+)-purR.
For protein expression, BL21(DE3)-pET28a (+)-purR was cultured until reaching an OD600 of 0.6–1.0. Then, lactose induction (4 mM) was performed, and the culture was incubated at 16 °C under low-speed shaking for more than 12 h. The bacterial pellet was resuspended in a solution containing 300 mM NaCl, 50 mM NaH2PO4, and 10 mM imidazole, and pH adjusted to 7.0. Ultrasonication was used to disrupt the cells, and the supernatant was obtained via centrifugation at 10,000× g for 15 min. PurR protein in the supernatant was purified using a Ni-NTA resin column, and its presence was confirmed with SDS-PAGE and Western Blotting. After desalting using G25 rapid desalting column (Bersee, Beijing, China), a final concentration of 2.0 mg/mL PurR was obtained.
2.11. Motif Prediction of PurR
Six genes (purH, purE, purT, purL, purF, purM) were chosen from the pur operon based on findings from RNA-seq analysis and the existing literature. The promoter regions of these genes were used for PurR motif prediction using the online MEME website to identify potential DNA binding sites [22]. The predicted motif was then matched with the promoter regions of the Y. pestis genome using the FIMO module of the online MEME website to determine the genes that can be bound by PurR in the promoter region [23].
2.12. Electrophoretic Mobility Shift Assay (EMSA)
Genes with significant transcriptional changes and a high FIMO matching score were selected for EMSA analysis. Fragments containing the motif region or 500 bp upstream of the start codon were used as probes in EMSA. The probes were labeled using the EMSA Probe Biotin Labelling Kit (Beyotime Biotech. Inc., Shanghai, China). After obtaining the double-stranded probe, it was denatured to single-stranded probe at 95 °C for 5 min. The labeling system was prepared following the manufacturer’s instructions, and biotin was added to the 3′ end by incubating at 37 °C for 30 min. The labeled probes were then mixed with chloroform–isopentanol (24:1) and gradually cooled to allow the single strands to reanneal into labeled double-stranded probes. Subsequently, 1/4 volume of 5 M ammonium acetate and 2 times the volume of anhydrous ethanol were added, and the mixture was precipitated at −20 °C overnight. After centrifugation and resuspension, purified labeled probes were obtained.
EMSA was performed using the Light Shift Chemiluminescent EMSA Kit (Beyotime Biotech. Inc., Shanghai, China). The EMSA binding reaction system was prepared according to the manufacturer’s protocol and experimental demands, with gentle mixing at each step, and allowed to bind at room temperature for 30 min. Following this, loading buffer was added. Low-voltage electrophoresis was then performed in 0.5 × TBE buffer until the bromophenol blue dye migrated to approximately 2/3 to 3/4 of the gel length. Subsequently, the gel was transferred onto a nylon membrane with a positive charge, and cross-linked under UV light for 20 min. The membrane was then incubated at room temperature for 15 min in blocking buffer for blocking, followed by a 30 min reaction with conjugate/blocking buffer. The membrane was washed four times with wash buffer, gently agitated for 5 min in substrate equilibration buffer, and then incubated with substrate solution for visualization. Finally, the membrane was exposed and photographed. A negative control protein was the F1 antigen of Y. pestis, which is a non-transcriptional regulatory factor, and a labeled segment of 16 s rRNA gene served as a negative labeled probe in this experiment. The concentrations of PurR protein and targeted DNA fragments are listed in Supplementary Table S2.
2.13. Reverse Transcription PCR (RT-PCR)
Gene clusters exhibiting similar transcriptional changes were identified based on the RNA-seq results. Primers were designed to amplify the intergenic regions adjacent to two genes that were potentially part of the same operon. The DNA extraction procedure followed the protocol described in Section 2.2, while the RNA extraction procedures and reverse transcription of RNA were carried out following the protocol described in Section 2.9. The obtained DNA, RNA, and cDNA were utilized as templates for PCR amplification of the predicted operon intergenic regions, with deionized water serving as a negative control. Agarose gel electrophoresis was then employed to confirm the presence of the predicted operon intergenic sections in the amplified products.
2.14. Ethics Statement
All animal experiments adhered to the ethical guidelines for laboratory animals in China and were conducted in accordance with the regulations outlined in laboratory animal permit no. SCXK (Jing) 2021-0006, obtained from Beijing Vital River Laboratory Animal Technology Co., Ltd. (Beijing, China). The study was approved by the Institutional Review Board at the Beijing Institute of Microbiology and Epidemiology (IACUC-IME-2023-001).
2.15. Statistical Analysis
The mean and variation of each of the three experimental groups were computed from three independent experiments. A t-test was employed to evaluate differences in the data, assuming the prerequisites of normal distribution and homogenous variance were fulfilled. When data diverged from a normal distribution, a nonparametric analysis was conducted. A one-way analysis of variance was performed, and the Student–Newman–Keuls q test was applied for multiple comparisons. Evaluation of survival curves employed the Mantel–Cox test, emphasizing the utilization of log-rank analysis. Statistical significance was set as follows: * p < 0.05, ** p < 0.01, *** p < 0.001, **** p < 0.0001.
2.16. Data Availability Statement
The RNA-seq data generated and analyzed in this study have been deposited at the National Microbiology Data Center under the accession numbers of NMDC40041563-40041574 (https://nmdc.cn/resource/genomics/sra/detail/NMDC40041563, accessed on 7 November 2023).
3. Results
3.1. Deletion of the PurR Makes No Difference in Growth of Y. pestis
To assess the contribution of purR to the growth capacity of Y. pestis, a comparative analysis of growth curves was performed for both strains in LB and TMH media. The findings indicated no significant differences in growth rate between these strains at temperatures of 26 °C or 37 °C. Moreover, the deletion of purR had no discernible effect on the growth of Y. pestis under two nutritional conditions, including LB medium and the nutrient-limited TMH medium (Figure 1).
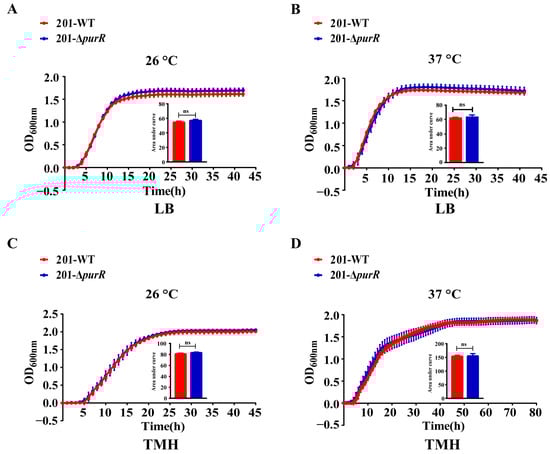
Figure 1.
The growth curves of 201-WT and 201-ΔpurR. The growth curves of 201-WT and 201-ΔpurR were assessed under different culture conditions. The conditions included: (A) growth at 26 °C in LB medium, (B) growth at 37 °C in LB medium, (C) growth at 26 °C in TMH medium, and (D) growth at 37 °C in TMH medium. The bar graph presented below the growth curves illustrates the cumulative areas under the curves and is applied to statistical analysis. Each experiment included three independent biological replicates, and the results were expressed as mean ± standard deviation from three independent experiments. ns: not statistically significant.
3.2. No Differences Were Observed in the In Vitro Phenotypes of 201-WT and 201-ΔPurR
Biofilm formation plays a crucial role in the dissemination of Y. pestis by fleas. To investigate this phenomenon, we utilized crystal violet staining to evaluate biofilm formation in both 201-WT and 201-ΔpurR strains. The results revealed no significant disparities in biofilm formation between the two strains at either 26 °C or 37 °C (Figure 2A). In order to simulate the environmental stresses that Y. pestis may encounter in natural environments, in this study, we exposed 201-WT and 201-ΔpurR to various stressful in vitro conditions, including hypersaline, hypertonic, heat shock, and cold shock. The results demonstrated that there were no significant differences in survivability between 201-WT and 201-ΔpurR under these environmental stresses (Figure 2B–E). These findings suggest that purR may not be critical for Y. pestis to withstand the simulated stressful environments.
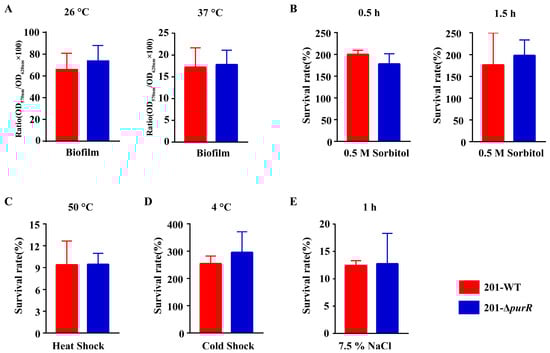
Figure 2.
The in vitro phenotypes of 201-WT and 201-ΔpurR. Biofilm formation of 201-WT and 201-ΔpurR and a comparison of their survival rates in vitro under different simulated stress environments were assessed. (A) 0.1% crystal violet solution was used to quantify the relative amount of biofilm formation for both strains cultured at 26 °C or 37 °C (B). The survival rates of both strains after being stimulated by high osmotic pressure environment simulated by 0.5 M sorbitol after 30 min and after 1.5 h were compared. The survival rates of both strains after being stimulated by heat shock at 50 °C for 0.5 h (C) and cold shock at 4 °C for 24 h (D) were compared. (E) The survival rates of both strains after being stimulated by high salt environment simulated by 7.5% NaCl were compared after 1 h of stimulation. There were no significant differences in all results between 201-WT and 201-ΔpurR. Each experiment was independently replicated three times for both strains, and statistical analysis was performed using a two-sample t-test for each comparison.
3.3. Deletion of the PurR Attenuated the Cytotoxicity to HeLa and 293 Cells of Y. pestis
RTCA was used to investigate any differences in the cytotoxicity of 201-WT and 201-ΔpurR on HeLa or 293 cells. The cell index indicated that 201-ΔpurR exhibited significantly lower cytotoxicity to cells compared to the 201-WT strain after 10 h of stimulation. These findings were further supported by the RTCA results for 201-ΔpurR-Comp (Figure 3). The knockout of purR was found to weaken the cytotoxicity of Y. pestis strain 201 towards HeLa and 293 cells. However, the survival curve analysis suggested that both 201-WT and 201-ΔpurR strains exhibited similar levels of virulence when tested on mice (Supplementary Figure S1).
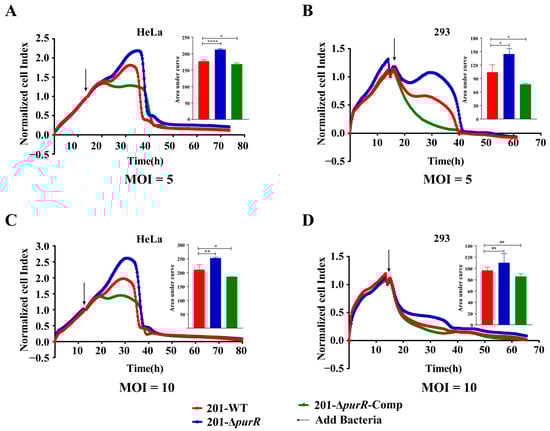
Figure 3.
201. purR showed cytotoxicity attenuation on HeLa cells and 293 cells. Cells were infected with 201-WT, 201-ΔpurR, and 201-ΔpurR-Comp at a specific multiplicity of infection (MOI). (A) Bacterial infection of HeLa cells at an MOI of 5. (B) Bacterial infection of 293 cells at an MOI of 5. (C) Bacterial infection of HeLa cells at an MOI of 10. (D) Bacterial infection of 293 cells at an MOI of 10. The cell index was measured every 15 min. The bar graph presented next to the curves illustrates the cumulative areas under the curves and is applied to statistical analysis. At the same time point, a larger “Normalized cell index” indicates more cells or a better cell status. The higher the curve, the larger the area under the curve, indicating that the bacterial strain has weaker cytotoxicity to the cells. Each experiment included three independent biological replicates, and the results were expressed as mean ± standard deviation from three independent experiments. * p < 0.05, ** p < 0.01, **** p < 0.0001, ns: not statistically significant.
3.4. Deletion of the PurR Significantly Alters Gene Expressions in Y. pestis
In many bacteria, the main identified role of PurR is a transcriptional repressor of purine biosynthesis [6]. In this study, we conducted RNA-seq analysis of 201-ΔpurR to identify genes potentially associated with purR in Y. pestis strain 201. Differentially expressed genes were selected based on the criteria |log2 (fold change) | > 0 and p-adjust < 0.05. Comparing these genes with 201-WT, we found significant enrichment in pathways like ribosome, carbon metabolism, and others at 26 °C (Supplementary Figure S2A) and in pathways such as carbon metabolism, purine metabolism, sulfur metabolism, ABC transport, and other metabolic processes at 37 °C (Supplementary Figure S2B).
The RNA-seq results showed the up-regulation of genes involved in purine biosynthesis, including the pur operon, guaB, and carA, consistent with the role of purR as a purine repressor (Figure 4A, Table 2 and Table 3). Additionally, genes indirectly involved in purine biosynthesis, such as glycine cleavage system genes (YP_RS13225, gcvT, gcvH), were also up-regulated. However, yersiniabactin (Ybt) siderophore-related genes, which are crucial for iron uptake and Y. pestis virulence, such as ybtU [24], were down-regulated (Supplementary Tables S3 and S4). At 26 °C, the type VI secretion system (T6SS) was up-regulated (Table 2), while genes encoding peroxidase and cytochrome (katG, cybB, and cybC) were down-regulated (Supplementary Table S3). At 37 °C, genes involved in sulfur metabolism (ssuB, ssuC, and ssuD) and taurine ABC transport permeases (tauA, tauB, and tauC) were additionally down-regulated (Table 3). Furthermore, among the up-regulated genes, ppsA, encoding phosphoenolpyruvate synthase, and cytR, involved in DNA transcription, were included (Supplementary Table S4).
Figure 4.
Common differentially expressed genes of 201-ΔpurR cultured at 26 °C and 37 °C. The transcriptional level of 201-ΔpurR was analyzed using RNA-seq and qRT-PCR under 26 °C and 37 °C culture conditions. (A) The 21 up-regulated or down-regulated genes that were shared under 26 °C and 37 °C culture conditions, screened with the criterion of |log2(FoldChange)| > 1.0; all the selected genes had a p-adjust value of < 10−5. (B) The correlation analysis between the 17 genes selected for qRT-PCR and these same 17 genes in the RNA-seq under 26 °C culture conditions, and the figure took point (2,2) as the origin. The selected genes were listed in the Section 2.9.
Table 2.
Differential expressions of genes associated to purine biosynthesis and T6SS in 201-ΔpurR in comparison with 201-WT at 26 °C.
Table 3.
The genes of purine biosynthesis and sulfur metabolism system expression changes in 201-ΔpurR in comparison with 201-WT at 37 °C.
Our investigation revealed that PurR regulates purine biosynthesis in Y. pestis as in other bacteria, but it may also have additional functions. To validate the RNA-seq data, we selected five down-regulated genes and twelve up-regulated genes for confirmation using qRT-PCR, and the results supported the findings of RNA-seq (Figure 4B).
3.5. Motif Prediction of PurR
Transcriptional regulators are DNA-binding proteins that can modulate gene transcription by interacting with specific promoter regions. To identify the DNA-binding domain of PurR, we conducted a search for the protein structure of Y. pestis PurR in Uniprot and identified an HTH (helix-turn-helix) domain at the N-terminal of PurR, known for its ability to bind to DNA (Figure 5A). HTH is a common DNA-binding motif found in prokaryotic transcription factors, consisting of a short chain connecting two helices in the structure [25].
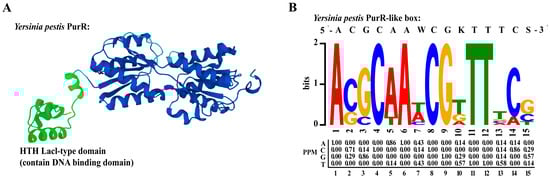
Figure 5.
PurR structure and prediction of PurR motif. (A) The structure of Y. pestis PurR on Uniprot. Green color is the HTH lacl-type domain which contains DNA-binding domain in the front of PurR. (B) PurR motif predicted on the online MEME website, based on the promoter region of six genes (purH, purE, purT, purL, purF, purM) on the pur operon.
A motif is a specific DNA sequence that transcriptional regulators can recognize and bind to. In our study, we employed the online MEME tool to predict a 15-bp motif (5′-ACGCAAWCGKTTTCS-3′) for PurR (Figure 5B) [22], which exhibited high similarity to motifs previously predicted in other studies [26]. Notably, the PurR motif in Y. pestis was found to be similar to that of E. coli [7]. This observation might be attributed to the significant homology between PurR in Y. pestis strain 201 and PurR in E. coli, as the two share 82.4% identical amino acids. To identify potential promoter regions where PurR could bind, we conducted FIMO analysis on the complete promoter regions of the Y. pestis genome using this motif [23]. By employing a screening threshold of a p-value ≤ 1.0 × 10⁻⁴, we predicted that the promoter regions of 486 genes in Y. pestis strain 201 contain a motif that closely resembles a specific sequence pattern (Supplementary Table S5).
3.6. PurR Regulates Potential Operons in Y. pestis Strain 201
As mentioned previously, this study confirms that PurR can regulate purine biosynthesis by binding to the promoter region of relevant genes in Y. pestis. Our findings demonstrate that several PurR-regulated genes involved in purine biosynthesis are co-transcribed. For example, the purM-purN, purH-purD, and purE-purK loci are part of the pur operon and contribute to IMP synthesis [27,28]. Additionally, guaB-guaA participates in the conversion of IMP to GMP and AMP (Figure 6). The carA gene, co-transcribed with carB (Supplementary Figure S3B), provides arginine and uracil, which are essential for bacterial growth [29,30]. Another gene, gcvT, encodes glycine lyase and is part of the GCV operon, which consists of gcvT, gcvH, and gcvP (Supplementary Figure S3C) [31].
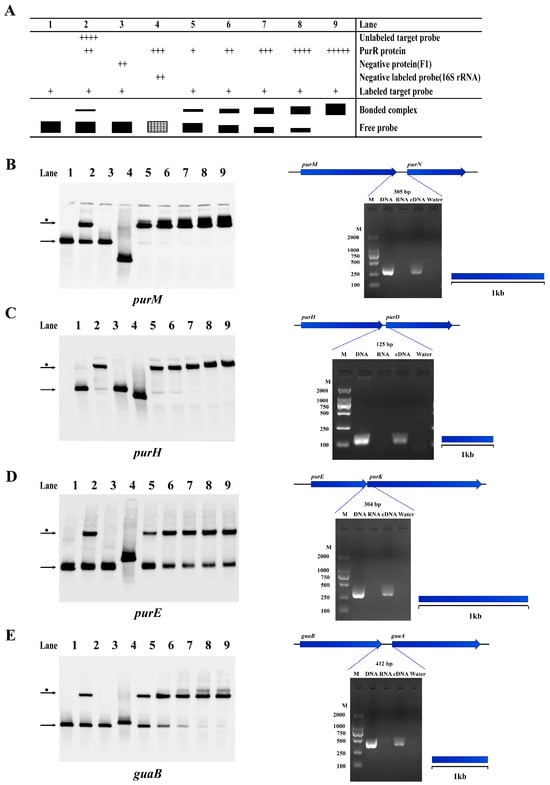
Figure 6.
PurR may regulate some operons involved in purine biosynthesis of Y. pestis strain 201. The results of EMSA and RT-PCR experiments confirm the presence of operons and the regulation by PurR in Y. pestis strain 201, involving genes related to purine biosynthesis. (A) The figure illustrates the experimental setup and schematic representation of each lane in the EMSA experiment. The filled black color represents the result of the experimental group, and the shaded grid indicates the result of the negative control group. The concentrations of the components added in each experimental channel are shown in Supplementary Table S2. The width of the bands reflects the quantity of binding between the tracer probe and PurR, while the number of ‘+’ signs corresponds to the amount of the respective samples added. The identified operons include: (B) purM-purN; (C) purH-purD; (D) purE-purK; and (E) guaB-guaA. The left figure displays the EMSA results, while the right figure presents the RT-PCR results. In the RT-PCR results, the template for each gene intergenic region is indicated as DNA, RNA, cDNA, or water. The blue dotted line indicates the expected amplification fragment size for each gene intergenic region.
In addition to regulating the co-transcribed genes involved in purine biosynthesis, PurR was found to regulate two other operons, as confirmed in this study. This suggests that PurR may have additional roles in Y. pestis strain 201, consistent with previous findings of PurR having multiple functions in various bacterial species [12,32]. PurR was observed to interact with the promoter regions of ssuE and katG, which belong to the sulfur-starvation utilization (ssu) and katG-cybC-cybB operons [26,33], indicating that PurR could function as a regulator for these genes (Supplementary Figure S3D,E). In summary, these results imply that PurR may influence Y. pestis sulfur metabolism and suggest a connection between purR and Y. pestis energy metabolism.
3.7. PurR May Potentially Regulate Other Gene Expressions in Y. pestis Strain 201
We employed a combination of RNA-seq data and FIMO prediction to explore the potential regulatory roles of PurR in Y. pestis. Our findings revealed a correlation between significant transcriptional up- or down-regulation of certain genes and high matching scores in the FIMO prediction results. PurR was found to bind to the promoter regions of several other genes in the microorganism, including pyrD that can interact with PurR in other bacteria and contribute to the regulation of pyrimidine biosynthesis (Supplementary Figure S4C) [7]. Furthermore, PurR also exhibits self-regulation, adding an extra layer of security to its regulatory system (Supplementary Figure S4B).
Furthermore, our investigation unveiled previously unknown promoter regions of additional genes (serA, ogt, fur, ybtA, djlA) that PurR may bind to in Y. pestis strain 201 (Supplementary Figure S4D–H). Additionally, the results of EMSA and RT-PCR supported the presence of the ybt operon (irp2-irp1-ybtU-ybtT-ybtE) located on the high pathogenicity island (HPI) of Y. pestis (Supplementary Figure S5). These findings suggest that PurR might regulate various biological functions of Y. pestis beyond purine biosynthesis.
3.8. Potential Operons of Y. pestis
We performed an analysis of genes that potentially undergo co-transcription based on RNA-seq data. Our investigation confirmed the presence of two potential operons in Y. pestis, i.e., the T6SS gene cluster and YP_RS00935-tauA-tauB-tauC-tauD (Figure 7). Similar to the ssu operon, the tauABCD operon is involved in sulfur biosynthesis in E. coli [34]. The T6SS is a versatile secretion system observed in various Gram-negative bacteria, and it plays a role in multiple physiological functions in Yersinia, including host infection, bacterial competition, and stress responses [35,36]. These findings provide evidence for the first time that T6SS undergoes co-transcription in Y. pestis.
Figure 7.
Other operon of Y. pestis strain 201. The RT-PCR results revealed the co-transcription of specific genes in the genome of Y. pestis strain 201, which was supported with RNA-seq analysis (excluding previously mentioned genes). The co-transcribed regions identified include: (A) YP_RS00935-tauA-tauB-tauC-tauD and (B) the type VI secretion system (T6SS).
4. Discussion
Y. pestis, as a multi-host pathogen, demonstrates remarkable adaptability to various environmental changes throughout its life cycle, allowing it to survive in nature, transmitted by fleas, and propagate within hosts. Y. pestis encounters stressful conditions, including decreased temperature, acidity, and hyperosmotic environments in nature and within fleas. Thus, we hypothesis that the loss of purR might plays a role in the fitness of Y. pestis.
As there is no significant variation in the growth rates of 201-WT and 201-ΔpurR grown in different culture media (LB or TMH) at different temperatures (26 °C or 37 °C), it is reasonable to exclude the influence of strain growth rates in the other phenotypic tests (Figure 1). However, our study revealed that purR does not play a central role in Y. pestis’ ability to adapt to tested stressful conditions in vitro (Figure 2), even though certain genes involved in the adaptation of Y. pestis to harsh environments showed significant changes in transcription levels for the 201-ΔpurR mutant (Table 2). An effective transfer approach of Y. pestis necessitates the production of biofilms to facilitate its transmission from fleas to mammals [37], while the results showed that the loss of purR makes no difference in the formation of biofilms of Y. pestis. Data from the multi-omics online database for Yersinia suggest that the transcription of purR remains relatively stable in Y. pestis [38]. Interestingly, the knockout of purR did not impact the growth of Y. pestis 201 at different temperatures and nutritional levels, consistent with findings in S. aureus [39]. These suggest that the transcriptional regulation of PurR alone may not be sufficient to disrupt the adaptive mechanism of Y. pestis. As mature mechanisms are often complementary and mutually reinforcing, with each factor playing a distinct role, any gaps in the regulatory system may be supplemented by other aspects.
In our study, the knockout of purR resulted in reduced cytotoxicity of Y. pestis towards HeLa and 293 cells. However, the absence of purR did not affect the toxicity of Y. pestis in mice. Due to the complexity of the infection progress, the performance of bacteria in vivo and in vitro may be inconsistent. The result in cytotoxicity of 201-ΔpurR stands in contrast to the findings in S. aureus, in which the virulence is increased after the deletion of purR, as the mutant expresses more virulence effectors [27], whereas the expression of virulence-related Ybt siderophore-related genes decreased in the Y. pestis purR knockout strains. We only performed preliminary animal challenge experiments in this study; it can be determined if the knockout of purR affects the toxicity of Y. pestis to animals based on the bacterial load and pathological changes of specific organs in a follow up study.
Previous research has identified the PurR protein as an HTH-type transcriptional repressor in bacteria, and has already confirmed its role in regulating purine biosynthesis by repressing the pur operon in other bacterial species [6,40,41]. In this study, we examined the purine regulatory function of PurR in Y. pestis 201. Our findings revealed that the absence of purR led to an upregulation of purine biosynthesis-related genes and that PurR exhibited binding affinity to the promoter region of nearly all these genes. Furthermore, we also identified eleven potential operons in Y. pestis 201 through RT-PCR analysis, eight of which could be bound by PurR, highlighting the role of PurR as a regulator of multiple operons and thereby establishing a potential regulon. Interestingly, PurR was shown to bind to the promoter region of fur, the gene encoding ferric uptake regulator Fur in Y. pestis, which was also found to regulate siderophore-associated operons including the ybt operon [42], indicating a cross-regulation of transcriptional regulators. This interconnection creates a vast and complex regulatory network for PurR in Y. pestis.
In addition to its role in regulating purine biosynthesis, we sought to explore other potential functions of purR in Y. pestis. Our analysis revealed that purR may also influence the virulence, sulfur metabolism, and energy synthesis of Y. pestis by directly or indirectly regulating specific operons, i.e., irp2-irp1-ybtU-ybtT-ybtE, ssuE-YP_RS20420-ssuD-ssuC-ssuB, and katG-cybC-cybB, respectively. Notably, we discovered that the T6SS (Type VI Secretion System) gene cluster was co-transcribed in Y. pestis 201, and the knockout of purR resulted in an increase in transcription of these genes. T6SS has been shown to play a crucial role in the interaction between Y. pestis and macrophages [43]. This finding provides valuable insights for studying the mechanism of interaction between Y. pestis and macrophages.
In summary, this study conducted a preliminary investigation into the function of purR in Y. pestis 201 and provided an initial analysis of the regulatory network of PurR. The findings laid the groundwork for future research, but a more comprehensive understanding of the underlying mechanism requires additional methods and robust evidence for validation.
Supplementary Materials
The following supporting information can be downloaded at: https://www.mdpi.com/article/10.3390/microorganisms11112801/s1, Figure S1: 201-WT and 201-ΔpurR showed virulence no differences in mice; Figure S2: KEGG maps of the differentially expressed genes of 201-ΔpurR culture at 26 °C and at 37 °C; Figure S3: PurR may regulate other operons of Y. pestis strain 201; Figure S4: PurR may regulate some genes of Y. pestis strain 201; Figure S5: The ybt operon in Y. pestis strain 201; Table S1: Primers used in the study; Table S2: EMSA settings for different target genes; Table S3: 201-ΔpurR differentially significantly expressed gene at 26 °C; Table S4: 201-ΔpurR differentially significantly expressed gene at 37 °C; Table S5: The results of FIMO analysis.
Author Contributions
Conceptualization: L.X., Y.S. and K.S.; formal analysis, X.Q., Y.C. (Yujun Cui) and Y.W.; methodology, L.X., J.J., Y.S., K.S., Z.S., Y.L., Y.Z., L.S., Y.C. (Yiming Cui) and W.Y.; software, X.Q., Y.C. (Yujun Cui), Y.W. and Z.X.; supervision, Y.S.; writing—original draft, L.X. and J.J.; writing—review and editing, Y.S., K.S. All authors have read and agreed to the published version of the manuscript.
Funding
This research was supported by National Natural Science Foundation of China (U22A20526).
Data Availability Statement
All data presented in this study are available in this published article. The RNA-seq data generated and analyzed are available in the National Microbiology Data Center under the accession numbers of NMDC40041563-40041574.
Conflicts of Interest
The authors declare no conflict of interest.
References
- Yang, R.; Atkinson, S.; Chen, Z.; Cui, Y.; Du, Z.; Han, Y.; Sebbane, F.; Slavin, P.; Song, Y.; Yan, Y.; et al. Yersinia pestis and Plague: Some knowns and unknowns. Zoonoses 2023, 3, 5. [Google Scholar] [CrossRef]
- Valles, X.; Stenseth, N.C.; Demeure, C.; Horby, P.; Mead, P.S.; Cabanillas, O.; Ratsitorahina, M.; Rajerison, M.; Andrianaivoarimanana, V.; Ramasindrazana, B.; et al. Human plague: An old scourge that needs new answers. PLoS Neglected Trop. Dis. 2020, 14, e0008251. [Google Scholar] [CrossRef] [PubMed]
- Li, B.; Tan, Y.; Guo, J.; Cui, B.; Wang, Z.; Wang, H.; Zhou, L.; Guo, Z.; Zhu, Z.; Du, Z.; et al. Use of protein microarray to identify gene expression changes of Yersinia pestis at different temperatures. Can. J. Microbiol. 2011, 57, 287–294. [Google Scholar] [CrossRef] [PubMed]
- Achtman, M.; Zurth, K.; Morelli, G.; Torrea, G.; Guiyoule, A.; Carniel, E. Yersinia pestis, the cause of plague, is a recently emerged clone of Yersinia pseudotuberculosis. Proc. Natl. Acad. Sci. USA 1999, 96, 14043–14048. [Google Scholar] [CrossRef]
- Achtman, M. Evolution, population structure, and phylogeography of genetically monomorphic bacterial pathogens. Annu. Rev. Microbiol. 2008, 62, 53–70. [Google Scholar] [CrossRef] [PubMed]
- Connolly, J.; Boldock, E.; Prince, L.R.; Renshaw, S.A.; Whyte, M.K.; Foster, S.J. Identification of Staphylococcus aureus Factors Required for Pathogenicity and Growth in Human Blood. Infect. Immun. 2017, 85, e00337-17. [Google Scholar] [CrossRef]
- Cho, B.K.; Federowicz, S.A.; Embree, M.; Park, Y.S.; Kim, D.; Palsson, B.O. The PurR regulon in Escherichia coli K-12 MG1655. Nucleic Acids Res. 2011, 39, 6456–6464. [Google Scholar] [CrossRef] [PubMed]
- Abdelwahed, E.K.; Hussein, N.A.; Moustafa, A.; Moneib, N.A.; Aziz, R.K. Gene Networks and Pathways Involved in Escherichia coli Response to Multiple Stressors. Microorganisms 2022, 10, 1793. [Google Scholar] [CrossRef]
- Shi, T.; Wang, Y.; Wang, Z.; Wang, G.; Liu, D.; Fu, J.; Chen, T.; Zhao, X. Deregulation of purine pathway in Bacillus subtilis and its use in riboflavin biosynthesis. Microb. Cell Factories 2014, 13, 101. [Google Scholar] [CrossRef]
- Liu, S.; Hu, W.; Wang, Z.; Chen, T. Rational Engineering of Escherichia coli for High-Level Production of Riboflavin. J. Agric. Food Chem. 2021, 69, 12241–12249. [Google Scholar] [CrossRef]
- Jiménez, A.; Santos, M.A.; Pompejus, M.; Revuelta, J.L. Metabolic engineering of the purine pathway for riboflavin production in Ashbya gossypii. Appl. Environ. Microbiol. 2005, 71, 5743–5751. [Google Scholar] [CrossRef]
- Shimizu, K.; Hayashi, S.; Doukyu, N.; Kobayashi, T.; Honda, H. Time-course data analysis of gene expression profiles reveals purR regulon concerns in organic solvent tolerance in Escherichia coli. J. Biosci. Bioeng. 2005, 99, 72–74. [Google Scholar] [CrossRef][Green Version]
- Alkam, D.; Jenjaroenpun, P.; Ramirez, A.M.; Beenken, K.E.; Spencer, H.J.; Smeltzer, M.S. The increased accumulation of Staphylococcus aureus virulence factors is maximized in a purR mutant by the increased production of SarA and decreased production of extracellular proteases. Infect. Immun. 2021, 89, e00718-20. [Google Scholar] [CrossRef]
- Song, Y.; Tong, Z.; Wang, J.; Wang, L.; Guo, Z.; Han, Y.; Zhang, J.; Pei, D.; Zhou, D.; Qin, H.; et al. Complete genome sequence of Yersinia pestis strain 91001, an isolate avirulent to humans. DNA Res. 2004, 11, 179–197. [Google Scholar] [CrossRef] [PubMed]
- Zhang, Q.; Wang, Q.; Tian, G.; Qi, Z.; Zhang, X.; Wu, X.; Qiu, Y.; Bi, Y.; Yang, X.; Xin, Y.; et al. Yersinia pestis biovar Microtus strain 201, an avirulent strain to humans, provides protection against bubonic plague in rhesus macaques. Hum. Vaccines Immunother. 2014, 10, 368–377. [Google Scholar] [CrossRef]
- Barbieri, R.; Signoli, M.; Cheve, D.; Costedoat, C.; Tzortzis, S.; Aboudharam, G.; Raoult, D.; Drancourt, M. Yersinia pestis: The Natural History of Plague. Clin. Microbiol. Rev. 2021, 34, e00044-19. [Google Scholar] [CrossRef] [PubMed]
- Chen, Y.; Song, K.; Chen, X.; Li, Y.; Lv, R.; Zhang, Q.; Cui, Y.; Bi, Y.; Han, Y.; Tan, Y.; et al. Attenuation of Yersinia pestis fyuA mutants caused by iron uptake inhibition and decreased survivability in macrophages. Front. Cell. Infect. Microbiol. 2022, 12, 874773. [Google Scholar] [CrossRef] [PubMed]
- Zhang, Y.; Gao, H.; Wang, L.; Xiao, X.; Tan, Y.; Guo, Z.; Zhou, D.; Yang, R. Molecular characterization of transcriptional regulation of rovA by PhoP and RovA in Yersinia pestis. PLoS ONE 2011, 6, e25484. [Google Scholar] [CrossRef]
- Chang, A.C.; Cohen, S.N. Construction and characterization of amplifiable multicopy DNA cloning vehicles derived from the P15A cryptic miniplasmid. J. Bacteriol. 1978, 134, 1141–1156. [Google Scholar] [CrossRef]
- Straley, S.C.; Bowmer, W.S. Virulence genes regulated at the transcriptional level by Ca2+ in Yersinia pestis include structural genes for outer membrane proteins. Infect. Immun. 1986, 51, 445–454. [Google Scholar] [CrossRef] [PubMed]
- Lisby, A.N.; Carlson, R.D.; Baybutt, T.R.; Weindorfer, M.; Snook, A.E. Evaluation of CAR-T cell cytotoxicity: Real-time impedance-based analysis. Methods Cell Biol. 2022, 167, 81–98. [Google Scholar] [CrossRef]
- Bailey, T.L.; Elkan, C. Fitting a mixture model by expectation maximization to discover motifs in biopolymers. Proc. Int. Conf. Intell. Syst. Mol. Biol. 1994, 2, 28–36. [Google Scholar] [PubMed]
- Grant, C.E.; Bailey, T.L.; Noble, W.S. FIMO: Scanning for occurrences of a given motif. Bioinformatics 2011, 27, 1017–1018. [Google Scholar] [CrossRef]
- Miller, M.C.; Fetherston, J.D.; Pickett, C.L.; Bobrov, A.G.; Weaver, R.H.; DeMoll, E.; Perry, R.D. Reduced synthesis of the Ybt siderophore or production of aberrant Ybt-like molecules activates transcription of yersiniabactin genes in Yersinia pestis. Microbiology 2010, 156, 2226–2238. [Google Scholar] [CrossRef] [PubMed]
- Perez-Rueda, E.; Collado-Vides, J.; Segovia, L. Phylogenetic distribution of DNA-binding transcription factors in bacteria and archaea. Comput. Biol. Chem. 2004, 28, 341–350. [Google Scholar] [CrossRef]
- Han, Y.; Qiu, J.; Guo, Z.; Gao, H.; Song, Y.; Zhou, D.; Yang, R. Comparative transcriptomics in Yersinia pestis: A global view of environmental modulation of gene expression. BMC Microbiol. 2007, 7, 96. [Google Scholar] [CrossRef] [PubMed]
- Sause, W.E.; Balasubramanian, D.; Irnov, I.; Copin, R.; Sullivan, M.J.; Sommerfield, A.; Chan, R.; Dhabaria, A.; Askenazi, M.; Ueberheide, B.; et al. The purine biosynthesis regulator PurR moonlights as a virulence regulator in Staphylococcus aureus. Proc. Natl. Acad. Sci. USA 2019, 116, 13563–13572. [Google Scholar] [CrossRef]
- Anderson, B.W.; Schumacher, M.A.; Yang, J.; Turdiev, A.; Turdiev, H.; Schroeder, J.W.; He, Q.; Lee, V.T.; Brennan, R.G.; Wang, J.D. The nucleotide messenger (p)ppGpp is an anti-inducer of the purine synthesis transcription regulator PurR in Bacillus. Nucleic Acids Res. 2022, 50, 847–866. [Google Scholar] [CrossRef]
- Jewett, M.W.; Lawrence, K.A.; Bestor, A.; Byram, R.; Gherardini, F.; Rosa, P.A. GuaA and GuaB are essential for Borrelia burgdorferi survival in the tick-mouse infection cycle. J. Bacteriol. 2009, 191, 6231–6241. [Google Scholar] [CrossRef]
- Butcher, B.G.; Chakravarthy, S.; D’Amico, K.; Stoos, K.B.; Filiatrault, M.J. Disruption of the carA gene in Pseudomonas syringae results in reduced fitness and alters motility. BMC Microbiol. 2016, 16, 194. [Google Scholar] [CrossRef]
- Tezuka, T.; Ohnishi, Y. Two glycine riboswitches activate the glycine cleavage system essential for glycine detoxification in Streptomyces griseus. J. Bacteriol. 2014, 196, 1369–1376. [Google Scholar] [CrossRef]
- Goncheva, M.I.; Flannagan, R.S.; Heinrichs, D.E. De Novo Purine Biosynthesis Is Required for Intracellular Growth of Staphylococcus aureus and for the Hypervirulence Phenotype of a purR Mutant. Infect. Immun. 2020, 88, e00104-20. [Google Scholar] [CrossRef] [PubMed]
- Musila, J.M.; Forbes, D.L.; Ellis, H.R. Functional Evaluation of the π-Helix in the NAD(P)H:FMN Reductase of the Alkanesulfonate Monooxygenase System. Biochemistry 2018, 57, 4469–4477. [Google Scholar] [CrossRef]
- van der Ploeg, J.R.; Eichhorn, E.; Leisinger, T. Sulfonate-sulfur metabolism and its regulation in Escherichia coli. Arch. Microbiol. 2001, 176, 1–8. [Google Scholar] [CrossRef] [PubMed]
- Jani, A.J.; Cotter, P.A. Type VI secretion: Not just for pathogenesis anymore. Cell Host Microbe 2010, 8, 2–6. [Google Scholar] [CrossRef]
- Yang, X.; Pan, J.; Wang, Y.; Shen, X. Type VI Secretion Systems Present New Insights on Pathogenic Yersinia. Front. Cell. Infect. Microbiol. 2018, 8, 260. [Google Scholar] [CrossRef] [PubMed]
- Hinnebusch, B.J.; Jarrett, C.O.; Bland, D.M. Molecular and Genetic Mechanisms That Mediate Transmission of Yersinia pestis by Fleas. Biomolecules 2021, 11, 210. [Google Scholar] [CrossRef]
- Le-Bury, P.; Druart, K.; Savin, C.; Lechat, P.; Mas Fiol, G.; Matondo, M.; Becavin, C.; Dussurget, O.; Pizarro-Cerda, J. Yersiniomics, a Multi-Omics Interactive Database for Yersinia Species. Microbiol. Spectr. 2023, 11, e0382622. [Google Scholar] [CrossRef] [PubMed]
- Goncheva, M.I.; Flannagan, R.S.; Sterling, B.E.; Laakso, H.A.; Friedrich, N.C.; Kaiser, J.C.; Watson, D.W.; Wilson, C.H.; Sheldon, J.R.; McGavin, M.J.; et al. Stress-induced inactivation of the Staphylococcus aureus purine biosynthesis repressor leads to hypervirulence. Nat. Commun. 2019, 10, 775. [Google Scholar] [CrossRef]
- Weng, M.; Nagy, P.L.; Zalkin, H. Identification of the Bacillus subtilis pur operon repressor. Proc. Natl. Acad. Sci. USA 1995, 92, 7455–7459. [Google Scholar] [CrossRef]
- Long, H.X.; Ma, W.J.; Qin, J.C.; Wang, A.Q. Regulation of purine biosynthetic genes expression in Salmonella typhimurium. Yi Chuan Xue Bao 2000, 27, 462–467. [Google Scholar] [PubMed]
- Gao, H.; Zhou, D.; Li, Y.; Guo, Z.; Han, Y.; Song, Y.; Zhai, J.; Du, Z.; Wang, X.; Lu, J.; et al. The iron-responsive Fur regulon in Yersinia pestis. J. Bacteriol. 2008, 190, 3063–3075. [Google Scholar] [CrossRef] [PubMed]
- Robinson, J.B.; Telepnev, M.V.; Zudina, I.V.; Bouyer, D.; Montenieri, J.A.; Bearden, S.W.; Gage, K.L.; Agar, S.L.; Foltz, S.M.; Chauhan, S.; et al. Evaluation of a Yersinia pestis mutant impaired in a thermoregulated type VI-like secretion system in flea, macrophage and murine models. Microb. Pathog. 2009, 47, 243–251. [Google Scholar] [CrossRef] [PubMed][Green Version]


Disclaimer/Publisher’s Note: The statements, opinions and data contained in all publications are solely those of the individual author(s) and contributor(s) and not of MDPI and/or the editor(s). MDPI and/or the editor(s) disclaim responsibility for any injury to people or property resulting from any ideas, methods, instructions or products referred to in the content. |
© 2023 by the authors. Licensee MDPI, Basel, Switzerland. This article is an open access article distributed under the terms and conditions of the Creative Commons Attribution (CC BY) license (https://creativecommons.org/licenses/by/4.0/).