Article

Differential Selection for Translation Efficiency Shapes Translation Machineries in Bacterial Species

1
Department of Biology, University of Ottawa, Ottawa, ON K1N 6N5, Canada
2
Ottawa Institute of Systems Biology, University of Ottawa, Ottawa, ON K1H 8M5, Canada
*
Author to whom correspondence should be addressed.
Microorganisms 2024, 12(4), 768; https://doi.org/10.3390/microorganisms12040768
Submission received: 5 March 2024 / Revised: 1 April 2024 / Accepted: 9 April 2024 / Published: 10 April 2024
(This article belongs to the Special Issue Bacterial Engineering and Metabolism Regulation)

Abstract

:
Different bacterial species have dramatically different generation times, from 20–30 min in Escherichia coli to about two weeks in Mycobacterium leprae. The translation machinery in a cell needs to synthesize all proteins for a new cell in each generation. The three subprocesses of translation, i.e., initiation, elongation, and termination, are expected to be under stronger selection pressure to optimize in short-generation bacteria (SGB) such as Vibrio natriegens than in the long-generation Mycobacterium leprae. The initiation efficiency depends on the start codon decoded by the initiation tRNA, the optimal Shine–Dalgarno (SD) decoded by the anti-SD (aSD) sequence on small subunit rRNA, and the secondary structure that may embed the initiation signals and prevent them from being decoded. The elongation efficiency depends on the tRNA pool and codon usage. The termination efficiency in bacteria depends mainly on the nature of the stop codon and the nucleotide immediately downstream of the stop codon. By contrasting SGB with long-generation bacteria (LGB), we predict (1) SGB to have more ribosome RNA operons to produce ribosomes, and more tRNA genes for carrying amino acids to ribosomes, (2) SGB to have a higher percentage of genes using AUG as the start codon and UAA as the stop codon than LGB, (3) SGB to exhibit better codon and anticodon adaptation than LGB, and (4) SGB to have a weaker secondary structure near the translation initiation signals than LGB. These differences between SGB and LGB should be more pronounced in highly expressed genes than the rest of the genes. We present empirical evidence in support of these predictions.

1. Introduction

“The dream of a bacterium is to become two bacteria” [1], but the realization of this dream is often delayed by the rate of biosynthesis, especially the rate of translation [2,3,4,5,6,7,8,9], partly because most of the cellular dry weight is contributed by proteins. In well-studied enterobacteria, proteins account for more than half of the cell dry mass [10,11]. In Escherichia coli, the ratio of dry weight to wet weight is 0.2294 [12], and the ratio of protein weight to wet weight is about 0.2 [13]. Thus, proteins contribute about 87% (=0.2/0.2294) of the cellular dry biomass. It is not surprising that the growth rate of E. coli increases with the rate of protein production [11]. One, therefore, would expect a strong selection to optimize the translation machinery and mRNA features to increase translation efficiency.

1.1. Empirical Studies on Natural Selection for Optimizing Translation Efficiency

Efficient translation requires efficient initiation, elongation, and termination, as well as mRNA stability, and limits the rate of biosynthesis in both bacteria [3,6,7,14,15] and phages [5,16,17]. Translation initiation is often the limiting step [2,4,18,19,20]. Efficient initiation in bacteria generally requires (1) AUG as a start codon, (2) a well-positioned base-pairing between the Shine–Dalgarno (SD) sequence and the anti-SD (aSD) of the free 3′ end of the small ribosomal rRNA [21,22,23,24,25,26], and (3) no strong secondary structure that would embed the start codon or SD and consequently obscure it from being decoded by initiation tRNA or aSD, respectively [27,28,29].
With efficient translation initiation, translation elongation becomes rate-limiting [7,14]. Codon–anticodon adaptation is invariably observed in rapidly replicating organisms [2,6,30,31], especially in highly expressed genes [6,7,30,31,32,33,34,35,36]. The same pattern was also found in phages [5,9,16,17,37]. Experimental replacement of minor codons by major codons or vice versa typically leads to an increased or decreased translation rate in bacteria [7,38,39,40,41,42] and viruses [43,44]. Eukaryotic viruses such as HIV-1 tend to have the codon usage of their early and late genes adapted to their respective tRNA pools [45]. These results have led to the explicit formulation of codon–anticodon coevolution and adaptation theory, e.g., [6,46,47,48,49], and codon adaptation indices [7,50,51,52]. Although the relationship between codon usage optimization and protein production was briefly challenged [3], the relationship was fully reestablished by more detailed data analysis [7,14].
Translation termination in bacterial species is mediated by one or two release factors RF1 (decoding UAA and UAG) and RF2 (decoding UAA and UGA). All three stop codons can be misread by tRNAs in bacterial species [53,54]. The readthrough frequency is at least 10−3 to 10−2 for UGA in Salmonella typhimurium [55] and E. coli [56,57], and 1.1 × 10⁻⁴ to 7 × 10⁻³ for UAG, depending on the nature of the downstream nucleotides [54,58,59,60]. The readthrough rate is the lowest for UAA, at frequencies from 9 × 10⁻⁴ to less than 1 × 10⁻⁵ [54]. The readthrough error rate in the order of UGA > UAG > UAA has been consistently observed in multiple studies [57,61,62,63,64,65,66]. Empirical evidence supports the hypothesis that highly expressed genes prefer UAA stop codons [67].
Termination efficiency also depends on the nucleotide immediately downstream of the stop codon [68,69,70], leading to the proposal of the tetranucleotide stop signal including the +4 site [68,70,71,72,73,74,75,76]. Crosslinking was detected between RF2 and the +4 site in E. coli [77,78,79] and translation termination efficiency changes when different nucleotides were placed at the +4 site in E. coli [80]. In particular, the nucleotide usage bias at the +4 site is stronger in highly expressed genes than in low-expressed genes [70,81]. The best-documented case involves the translation of prfB mRNA (encoding RF2) in E. coli in which an inframe UGA stop codon is followed by nucleotide C [82,83,84]. When RF2 is abundant, the inframe UGA is decoded correctly to terminate translation, generating a short non-functional peptide. When RF2 is rare, the inframe UGA is not decoded. A +1 frameshift leads to the translation of GAC at a different coding frame, generating a functional RF2.
Almost all studies reviewed above focus on the optimization of mRNA but not on the translation machinery, which consists mainly of ribosomes, translation initiation factors, tRNAs, tRNA-charging enzymes, and release factors, as well as the energy that drives the translation machinery ([9,85] pp. 522–635). Given that ribosomes represent parallel translation machines, there are two lines of empirical evidence suggesting that short-generation bacteria (SGB) should produce more ribosomal proteins, rRNA [86,87], and tRNA [88] than LGB. First, the bacterial growth rate increases with the number of ribosomes in the cell [89,90,91,92]. Second, the number of ribosomes increases with rRNA abundance [93]. More ribosomes imply a greater need for tRNAs [94]. There should be more rRNA operons and tRNA genes in SGB than in LGB.

1.2. Two Approaches in Studying the Effect of Selection on Translation Optimization

The first approach to identifying the effect of selection on translation optimization is by within-species comparisons, especially by contrasting highly expressed and low-expressed genes (HEGs and LEGs) in rapidly replicating bacteria [5,8,9,33,49,67]. Because AUG and UAA represent stronger start and stop signals, respectively, than their alternatives, one would predict that HEGs should exhibit a stronger preference for AUG and UAA as start and stop codons than LEGs [5,8,9,67]. Because a strong secondary structure embeds translation signals such as a start codon, SD sequence, and stop codon, one would predict that HEGs should have a weaker secondary structure in sequence flanking these translation signals than LEGs [95]. Because early genes and late genes are translated with dramatically different tRNA pools, the two groups of genes should exhibit different codon optimization degrees [45]. The studies reviewed above constitute empirical tests of such predictions involving different groups of genes within individual species.
This paper focuses on differential selection for translation optimization among species. Relatively few studies are available, partly because of the difficulty in identifying differential selection. Occasionally, codon usage itself was taken as a proxy for selection [86], which is not a satisfactory approach. However, in at least four cases, such differential selection was identified with little controversy. The first case involves mitochondrial tRNA and protein-coding genes. Mitochondrial genomes of most multicellular eukaryotes encode only a single tRNAMet/CAU (where Met is the amino acid methionine and CAU is the tRNA anticodon for a Watson–Crick base-pairing with the Met codon AUG) to decode both Met codons AUG and AUA (through wobble-pairing). In contrast, mitochondrial genomes in some bivalve species and tunicate species encode an additional tRNAMet/UAU gene, which can decode AUA codons without wobble-pairing. One can predict that AUA codons should be used more frequently in mitochondrial protein-coding genes in those bivalve and tunicate species, which is true [31,96,97].
The second case of identifiable differential selection involves stop codons and release factors (RF1 decoding UAA and UAG, and RF2 decoding UAA and UGA) in bacteria [67]. If bacterial species X has more RF2 but less RF1 than species Y, then we would predict more UGA usage in species X than in species Y. This predicted pattern has also been documented in multiple bacterial species [67].
The third case involves phages differing in the presence of a lysogenic phase. Phage genomes in a lysogenic phase generally are not under selection for translation efficiency because the phage genome replicates by hitchhiking on the host genome. In contrast, phages without a lysogenic phase will be more commonly selected for translation optimization. This leads to the prediction that the former should exhibit stronger translation optimization than the latter, which is consistent with the empirical evidence [5,16].
The fourth case involves a key component of the translation machinery, i.e., a small subunit rRNA whose functions depend on stable secondary structures. Thermophiles are expected to have longer and more GC-rich stems than mesophiles, and this prediction is empirically supported [98]. The difference in growth temperature between thermophiles and mesophiles also affects the proportion of SD-led genes [99].

1.3. Hypothesized Impact of Differential Selection on Translation among Bacterial Species

Bacterial species differ dramatically in generation time. Under optimal culture conditions, the generation time is ~10 min in Vibrio natriegens [100,101], 16–20 min in Vibrio cholerae [102], 20–30 min in Escherichia coli [103], 30–70 min Bacillus subtilis [104], 103–107 min in Haemophilus influenzae [105], about 2 h in Mycobacterium smegmatis [106], 4–5 h in M. abscessus [107], 20–30 h in M. tuberculosis [15,108,109], and more than 7 days in Mycobacterium leprae [15,110]. Such dramatic differences in generation time have been dichotomized into r- and K-selection [111,112]. However, the evolutionary consequence of such differential selection has rarely been explored at the molecular level.
Translation machinery that needs to complete the task of protein synthesis in 10 min, as in the case of V. natriegens, should be under stronger selection for optimizing translation than that completing the task in 7 days, as in the case of M. leprae. The fitness of some parasitic bacteria is more related to survival against host attacks than to efficient translation. For example, M. tuberculosis cells build their private niches essentially isolated from the surrounding environment. This protective environment, while beneficial for the survival of the pathogen, also makes it difficult for the pathogen to gain nutrients and oxygen. If protein production is not the limiting factor in growth and reproduction, then one would not expect strong selection optimizing the translation machinery. Thus, we predict that selection for optimizing translation should leave much stronger signatures in rapidly replicating species such as V. natriegens than in slowly replicating species such as M. tuberculosis and M. leprae.

2. Materials and Methods

We include nine bacterial species with completely sequenced genomes and a well-documented generation time from the shortest to the longest among mesophiles under optimal growth conditions (Table 1). Generation time has typically been quantified only in model organisms (e.g., E. coli as a model species for Gram-negative bacteria and Bacillus subtilis as a model species for Gram-positive bacteria) and very harmful pathogens, so the sample of nine species is not representative of all bacteria. Also, the optimal growth condition from an experimenter’s perspective may not be the true optimal, so the generation time in Table 1 might be overestimated. However, the rank of the relative length of generation time (Table 1) should be correct, and the subsequent analysis will mainly be based on this rank. Our general prediction is that SGB should have more efficient protein-production systems than long-generation bacteria (LGB).
The optimal growth temperature for the first eight species in Table 1 is about 37 °C (or slightly lower). This is true not only for human pathogens and commensals but also for the free-living B. subtilis and M. smegmatis. The optimal growth temperature is about 30 °C for M. leprae when cultured with mouse foot pads [113] (as it has never been grown in vitro). M. leprae exhibits reduced growth above 33 °C presumably because of the lack of a heat shock response [106].
The RefSeq genomic sequences for the nine species were downloaded from GenBank by using the accession numbers in Table 1. The software DAMBE 7.3.0 [114] was used to extract coding sequences (CDSs), rRNA, and tRNA genes from the GenBank files. We classified the bacterial host genes into two expression groups: (1) known highly expressed protein-coding genes (HEGs) including small and large ribosomal protein genes, RNA polymerases, and some other genes known to be highly expressed (Supplemental Table S1), and (2) the rest of protein-coding genes not in the HEG group (REST). Pseudogenes were excluded from all analyses.
The RNA secondary structure could embed important translation signals such as the start codon, SD sequence, and stop codon and prevent them from being decoded by the translation machinery. We measured secondary structural stability based on the minimum folding energy (MFE) implemented in DAMBE [114], which uses the Vienna RNA fold library [115] for secondary structural characterization. A sliding window of 40 nt along the CDSs was used to characterize the change in MFE along the sequence. Codon adaptation was measured by the index of translation efficiency (ITE), which generalizes the conventional codon adaptation index (CAI) [50,51] to accommodate the background mutation rate [7].
The base-pairing between the SD sequence on mRNA and the aSD sequence on small-subunit (ssu) rRNA was hypothesized to position the start codon at the P-site to pair with the initiation tRNA [5,9,116]. The distance between the end of the ssu rRNA and the start codon (DtoStart) is highly constrained in bacterial genes, especially highly expressed ones. A narrow distribution of DtoStart values suggests a stronger selection in terms of the SD/aSD pairing than a wide distribution. DAMBE [95] implements the calculation of DtoStart.

3. Results

3.1. Differential Investment in Translation Machinery

Ribosomes represent parallel protein-production factories and their abundance in E. coli increases linearly with the growth rate [117,118]. Short-generation species may have not only more efficient factories but also more factories than LGB. Each ribosome features a set of 16S, 23S, and 5S rRNAs that are transcribed from the same operon and processed into individual rRNAs [119]. E. coli has seven rRNA operons (rrnA to rrnE, rrnG, rrnH) with promotors that are almost identical to the −10 and −35 consensus [120,121], suggesting a high demand for rRNA molecules met by both efficient and parallel transcription of multiple rRNA operons. The production of ribosomes in E. coli is limited by rRNA production [122], which explains why E. coli maintains multiple rrn operons in its genome for parallel transcription. A generalization of this would lead to the prediction that SGB should have more rrn operons than LGB. This prediction should also apply to tRNA genes because, with more ribosomes, more tRNA molecules are needed [123].
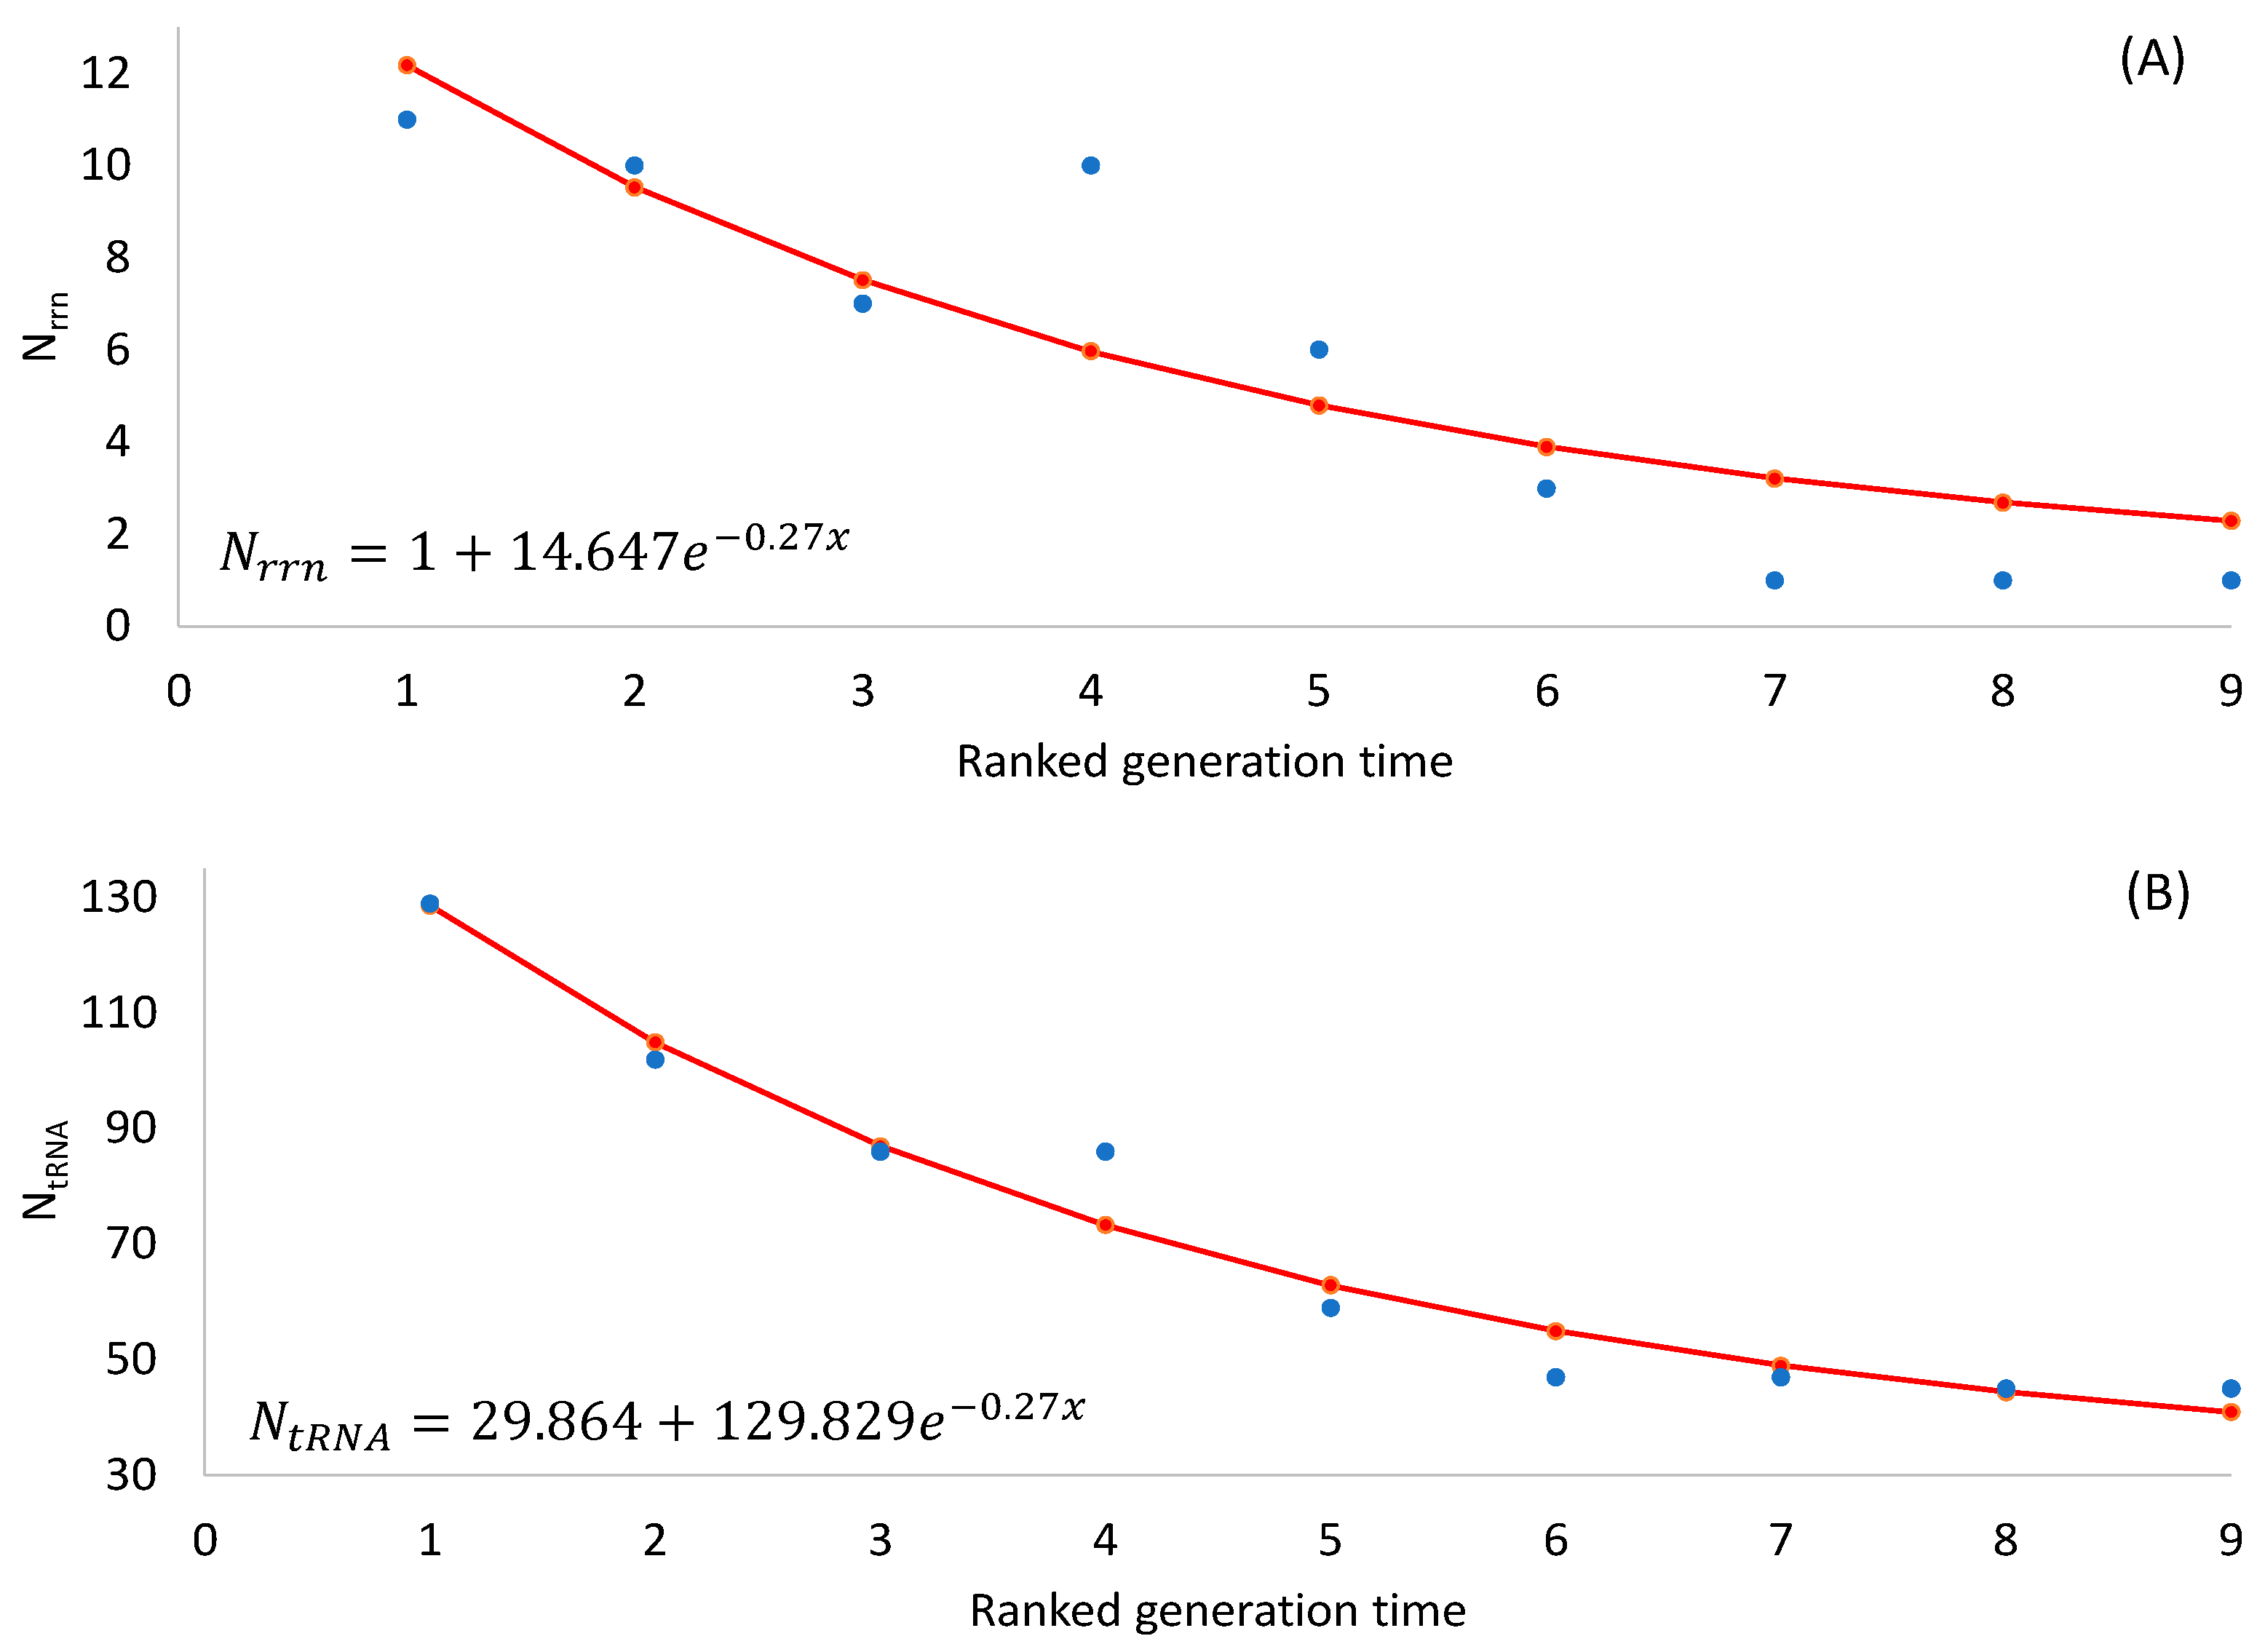
The two predictions are both supported by empirical evidence (Table 2), with the number of rRNA and tRNA genes decreasing highly significantly with an increasing generation time (p < 0.0001 for any rank-based nonparametric tests). The observation that SGB maintain more rRNA and tRNA genes in their genomes than LGB is consistent with the interpretation of stronger selection for translation efficiency in SGB than in LGB.
Note that an organism needs at least one rrn operon for translation. Ribosomal RNAs form the core of ribosomes with all important sites such as A, P, and E sites, with ribosomal proteins padding the surface of a ribosome [124]. Thus, the number of rrn operons cannot be less than 1. Also, there should be a minimum set of tRNA genes to decode all 61 sense codons. One might use the following two equations to model the numbers of rrn operons and tRNA genes, respectively:
N r r n = 1 + a e b x
N t R N A = c + a e b x
where x is RankGT in Table 2. Equation (1) ensures a minimum Nrrn of 1. Equation (2) ensures a minimum NtRNA of c, which is estimated by the least-squares approach to be 30 (Figure 1B). The minimum number of tRNA genes required for decoding all sense codons in a natural translation system is observed in a vertebrate mitochondrial genome that encodes 22 tRNA genes.

3.2. Differential Preference for Start Codon AUG

Among the three canonical start codons (AUG, GUG, and UUG), the translation initiation efficiency is consistently in the order of AUG > GUG > UUG [125,126]. HEGs in bacteria and bacteriophages tend to prefer AUG as a start codon [5,9,18,125,126,127]. This is true for all nine bacterial species in which the percentage of AUG (AUG%, Table 3) is consistently higher in HEGs than those in the REST (Table 3), which includes all genes not in the HEG group and consequently contains both highly expressed and low-expressed genes. This suggests that AUG is the most efficient start codon, as is consistent with previous empirical studies based on within-species comparisons [5,8,9].
Given that AUG is the most efficient start codon, one would predict that SGB should use more AUG codons as start codons than LGB. The AUG% in Table 3 is indeed strongly associated with the ranked generation time in Table 1, as predicted. However, the AUG% is also affected by the genomic GC% because GC-rich genomes tend to have more GC-rich codons [31]. This is best illustrated by focusing on start codons AUG and GUG. AT-rich genomes tend to have AT-biased mutations, which favor AUG over GUG. Among the nine species, the H. influenzae genome is the most AT-rich and is expected to have a high AUG% because both mutation and selection favor AUG over GUG. In contrast, GC-rich genomes have GC-biased mutations, which will favor GUG over AUG. Because the four LGB all have a higher GC% than the five species with relatively short generations, they may use fewer AUG and more GUG codons as start codons simply because of their genomic GC-richness. For this reason, it is necessary to include genomic GC as a control variable. Also, HEGs and REST genes may differ in the relationship between AUG% and the generation time. A conceptually more comprehensive and explicit model is, therefore, needed.
Here, the dependent variable is AUG% and independent variables include ranked generation time (RankGT), genomic GC content (GC%, which is taken as a proxy for a genomic mutation shared by both HEGs and REST genes), and gene expression (GE with two categories, HEGs and REST genes, encoded as 0 and 1, respectively). The input data (Table 4) are used to fit the model.
A regression analysis of the input data in Table 4 showed that all three independent variables were statistically significant, but their interaction terms were not (Table 5). The regression model was then fitted without interaction terms. This reduced model accounted for 82.0% of the variation in the dependent variable AUG%. The two regression equations derived from the regression coefficients in Table 5, one for HEGs and the other for the REST, are
For   HEGs :   AUG % = 125.86 2.54 RankGT 0.52 GC %
For   REST :   AUG % = 116.68 2.54 RankGT 0.52 GC %
Equations (3) and (4) and Table 5 show that (1) the AUG% decreases highly significantly with the generation time, and (2) the AUG% is significantly higher in HEGs than in REST genes (Table 5). However, the GC% also has a significant effect on the AUG% (p = 0.01825, Table 5), with the AUG% decreasing with an increasing GC%. This is consistent with the interpretation of stronger selection operating on SGB than on LGB. That is, a non-AUG start codon mutating to AUG is more strongly favored by natural selection in SGB than in LGB.
We should emphasize that Equations (3) and (4) are descriptive models. They do not explicitly prevent AUG% from taking values smaller than 0 or larger than 1. A sigmoidal function would have been more appropriate if there were enough data for parameter estimation.

3.3. Differential Preference for Stop Codon UAA

As reviewed previously, the stop codon UAA exhibits the smallest readthrough error rate among the three nonsense codons [57,61,62,63,64,65,66]. Consequently, HEGs favor stop codon UAA over other stop codons in multiple bacterial species [9,67,74]. This is also true for all nine bacterial species. UAA was preferred by HEGs in E. coli, B. subtilis, M. tuberculosis [67], and M. abscessus [9]. Of the five remaining species, the proportions of UAA in REST genes and HEGs were 0.653 and 0.8816, respectively, in V. natriegens; 0.6365 and 0.9474 in V. cholerae; 0.7602 and 0.9429 in H. influenzae; 0.0585 and 0.2222 in M. smegmatis; and 0.2364 and 0.2836 in M. leprae. Thus, UAA is consistently preferred in HEGs relative to REST genes.
Given that UAA is the best stop codon [128,129], we predicted that SGB should use more UAA codons as stop codons than LGB. Similar to our analysis of the start codon AUG usage, the dependent variable now was UAA% and the independent variables included the ranked generation time (RankGT), genomic GC content (GC%), and gene expression (GE with two categories, HEGs and REST genes, encoded as 0 and 1, respectively). The genomic GC% is particularly relevant in studying UAA usage because protein-coding genes in a GC-rich genome tend to use more UGA and UAG stop codons than those in an AT-rich genome [67].
A regression analysis showed that all three independent variables were statistically significant (Table 6). The model accounted for 94.7% of the total variation in UAA%. The two regression equations derived from the regression coefficients in Table 6, one for HEGs and the other for the REST, are
For   HEGs :   UAA % = 197.95 3.78 RankGT 2.22 GC %
For   REST :   UAA % = 180.60 3.78 RankGT 2.22 GC %
Equations (5) and (6) and Table 6 show that the UAA% decreases highly significantly with an increasing generation time, and that HEGs use UAA significantly more frequently than REST genes (Table 6, a 17.35326% difference between the two). This is consistent with the interpretation of stronger selection operating on SGB than on LGB. A non-UAA stop codon mutating to UAA is more strongly favored by natural selection in SGB than in LGB.
UAA usage also decreases significantly with an increasing genomic GC% (Table 6), which is understandable. As the genomic GC% increases, GC-biased mutations will favor UAG and UGA codons over UAA codons [67]. It is for this reason that the genomic GC content needs to be taken into consideration when assessing codon usage bias.

3.4. Impact of Differential Selection on Sense Codons

It is difficult to evaluate the impact of tRNA-mediated selection on codon usage across species because the codon adaptation index (CAI) [50,51] and the index of translation efficiency (ITE) [7] are both for comparing genes within species. The effective number of codons (ENC) [52,130] could potentially be used for among-species comparisons, but all these indices are strongly affected by genomic mutation bias [131,132]. For example, protein-coding genes in strongly GC-biased genomes will have mostly G-ending and C-ending codons, leading to a reduced ENC that has little to do with selection.
It is reasonable to assume that mutation bias affects both HEGs and REST genes. Thus, the difference in mean ITE between HEGs and REST genes, i.e.,
D I T E = I ¯ T E . H E G I ¯ T E . R E S T ,
should be relatively independent of mutation bias. D I T E should increase with selection intensity for translation elongation efficiency. If there is no selection for translation elongation efficiency, then D I T E is expected to be 0. With an increasingly strong selection for translation elongation efficiency, D I T E should also increase because the selection is expected to be stronger for HEGs than for REST genes. In other words, strong selection for translation efficiency in SGB should drive HEGs towards better codon adaptation than the REST genes, thereby increasing D I T E .
The D I T E values and its ranks (Rank D I T E , Table 7) depend strongly on generation time (RankGT, Table 7). The relationship is best illustrated with two ranked variables, i.e., ranked generation time (RandGT) and ranked D I T E (Figure 2). The fitted regression line accounts for 87.84% of the total variation in ranked D I T E (Figure 2).

3.5. Differential Selection Drives tRNA Adaptation

Codons and tRNAs are expected to coevolve and adapt to each other [2,6,30,31], especially in highly expressed genes [6,7,30,31,32,33,34,35,36,133]. Given the better codon optimization in SGB than in LGB (Figure 2 and Table 7), one would predict more tRNA genes for highly used codons than rarely used codons. If we focus on the anticodons of tRNA genes, then the prediction above implies a smaller effective number of anticodons (NAC), equivalent to the concept of the effective number of codons [52,130], in SGB than in LGB. Specifically, N
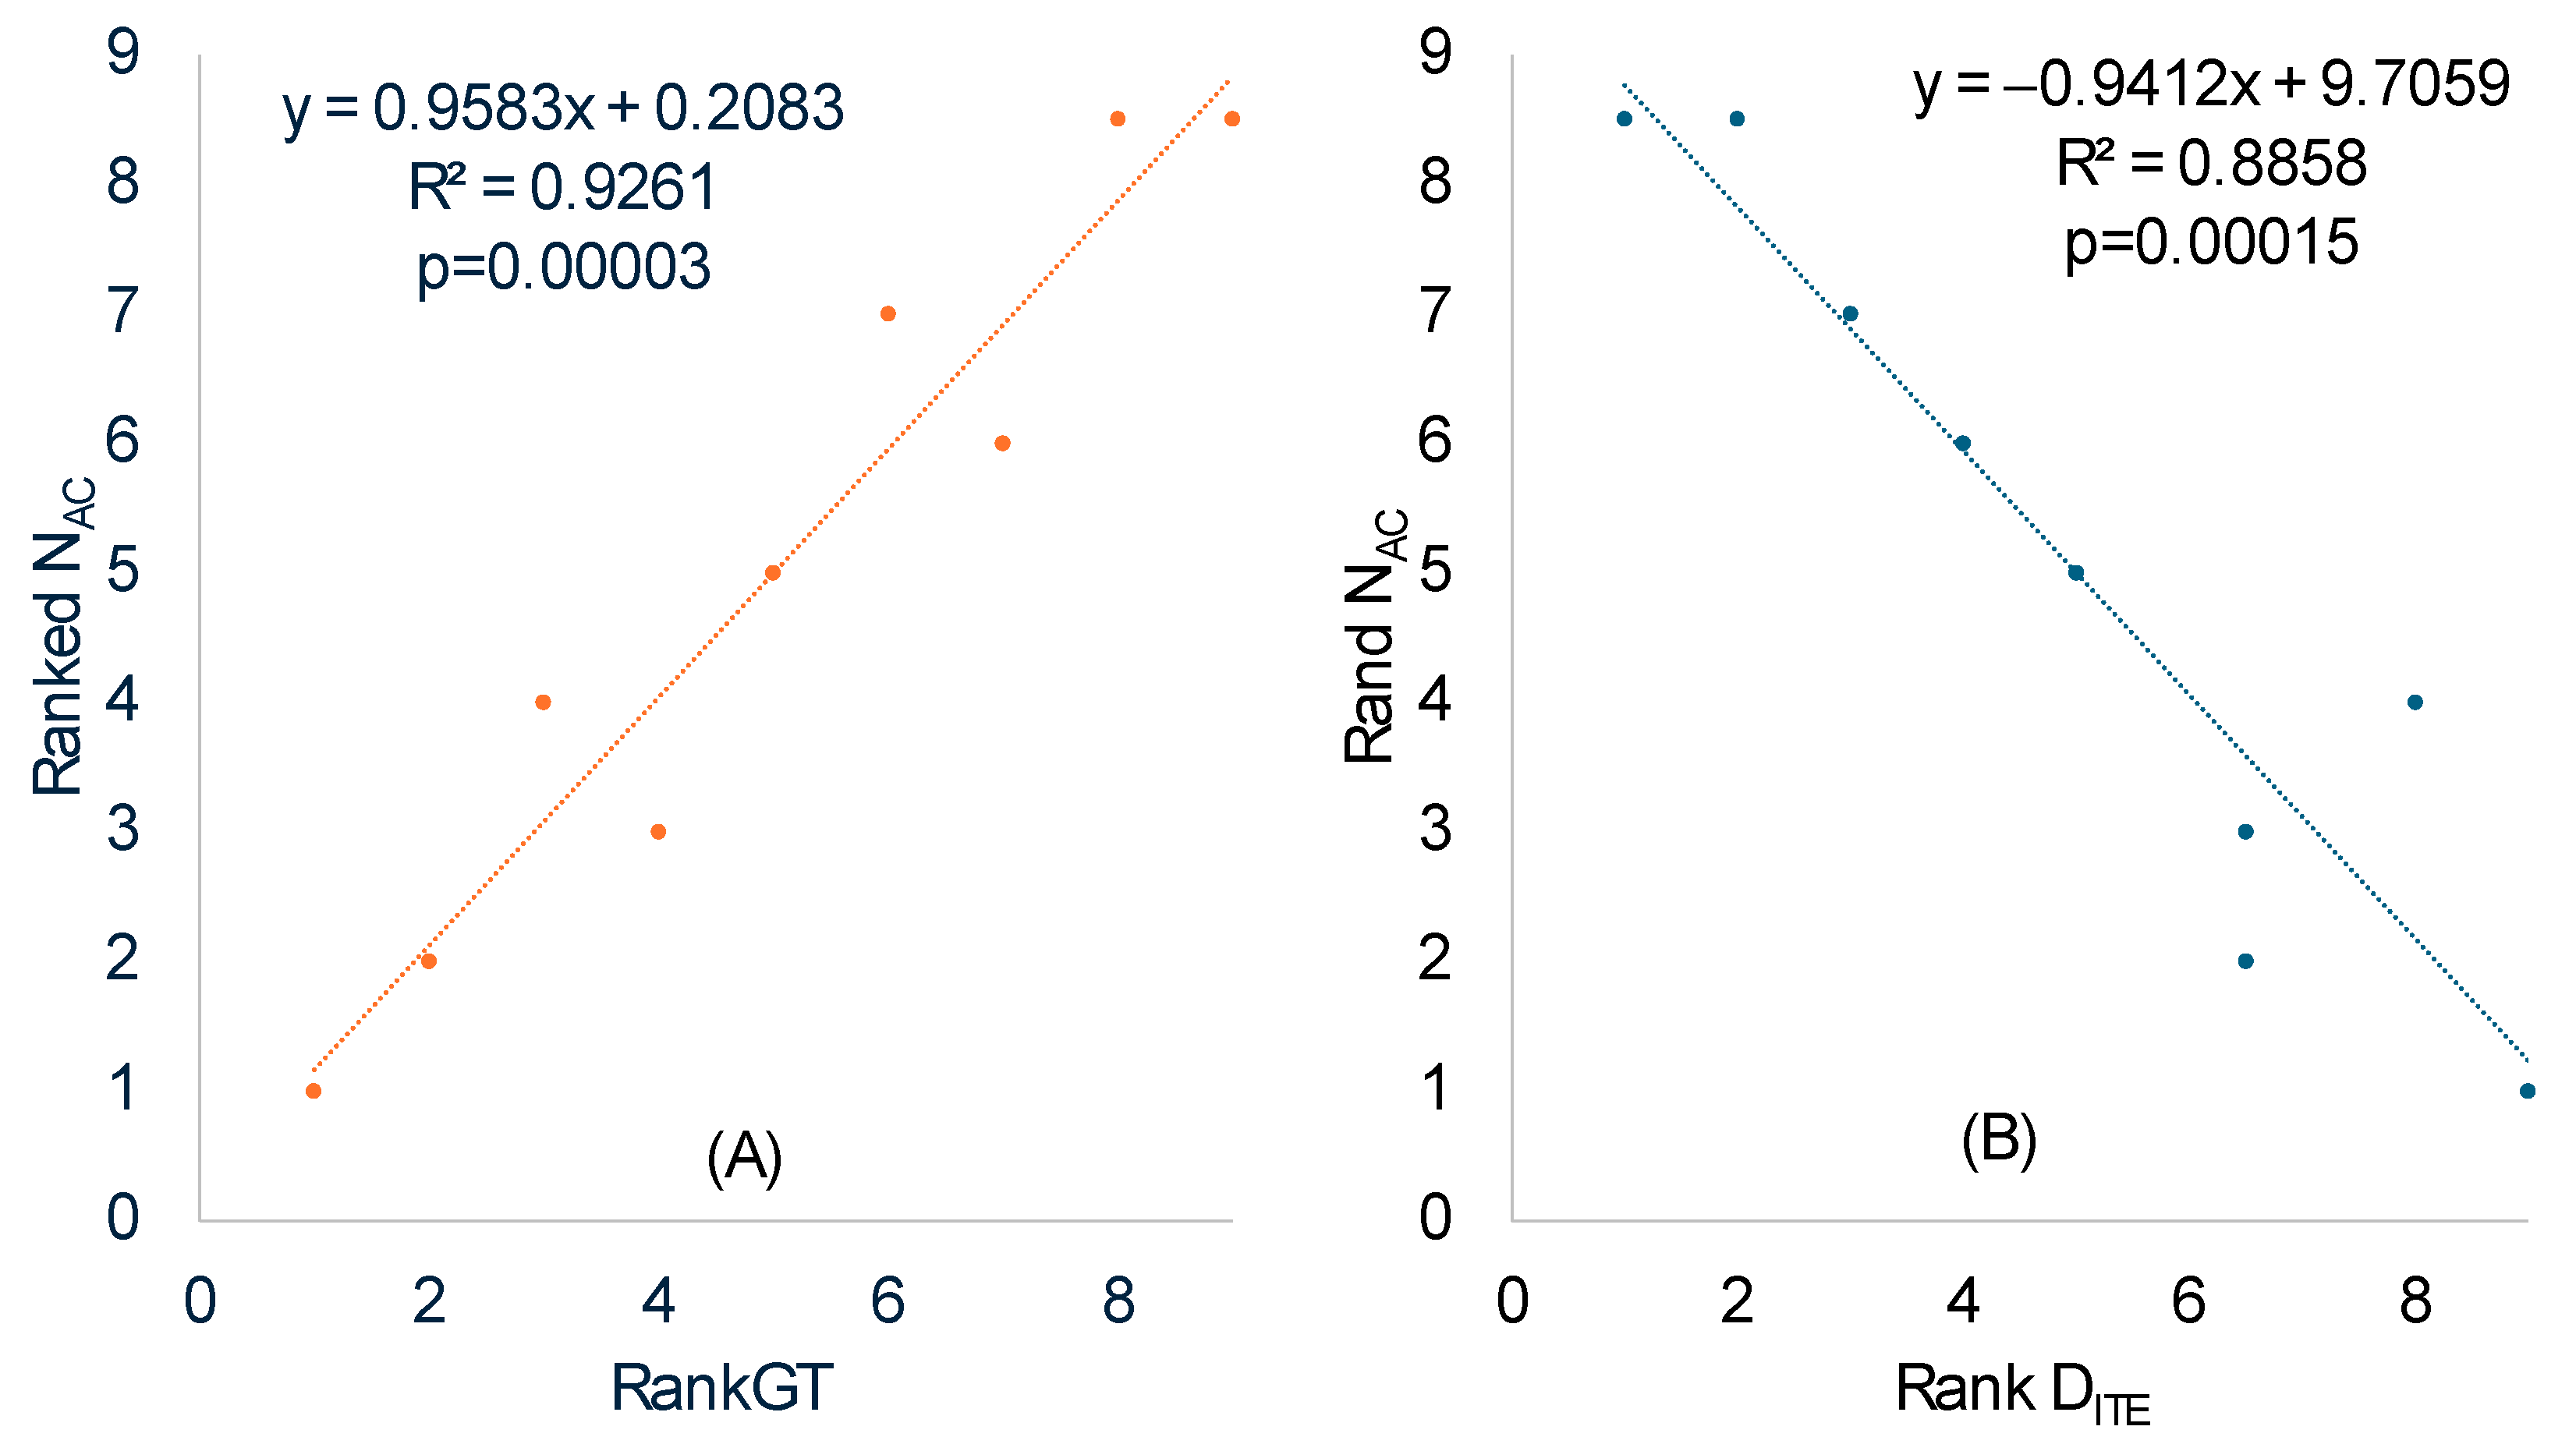
AC should increase with RankGT (ranked generation time).
We calculated NAC in the same way the effective number of codons is calculated [52], except that codons in coding sequences were replaced by anticodons in tRNA genes. The ranked NAC increased highly significantly with ranked RankGT (Table 8 and Figure 3A), consistent with our prediction that SGB should have a smaller NAC than LGB. One should note the difference between a codon replacement and an anticodon replacement. A codon replacement may have only a minor effect on the translation of a single gene, but an anticodon replacement will affect the translation of numerous codons. For this reason, anticodons are strongly constrained and much less affected by genomic GC%.
We have previously used Rank D I T E (Table 7) as a species-level measure of codon adaptation. This D I T E is expected to be negatively associated with the ranked NAC for the following reason. Better codon adaptation (high Rank D I T E ) implies higher usage of major codons, which requires more tRNAs with the corresponding decoding anticodon to translate these overused major codons, leading to a decreased NAC in species with a high degree of codon adaptation. This expected relationship between NAC and D I T E was substantiated empirically (Figure 3B, p = 0.00015).
The analysis above assumes that tRNA gene copy numbers in bacterial genomes are proportional to the abundances of tRNA molecules in the cell. With the availability of transcriptomic data, it has been found that the assumption is generally true, i.e., the copy number of a tRNA is highly correlated with the transcriptomic representation of the tRNA [134].

3.6. Secondary Structural Stability near the Start and Stop Codons

Because the 30S ribosomal subunit requires a single-stranded mRNA region for binding [28,29], sequences immediately flanking translation signals in bacteria (e.g., Shine–Dalgarno sequence and start and stop codons) are expected to have reduced secondary structures, to avoid embedding translation signals in a stable secondary structure [18,27,116,126,135,136]. This pattern has also been observed in bacteriophage genes [5,9]. The weakening of the secondary structure near, or immediately upstream of, the start codon has also been observed in highly expressed eukaryotic mRNAs [8,137], especially in mRNAs requiring internal ribosome entry for translation [138].
Secondary structural stability in RNA is typically measured by the minimum folding energy (MFE). An MFE equal to 0 means no secondary structure, and a stronger secondary structure corresponds to a more negative MFE value. Experiments involving engineered E. coli genes have shown that the translation initiation efficiency depends heavily on the MFE of the sequence upstream and including the start codon [3,7,14]. We followed the convention of previous studies [5,
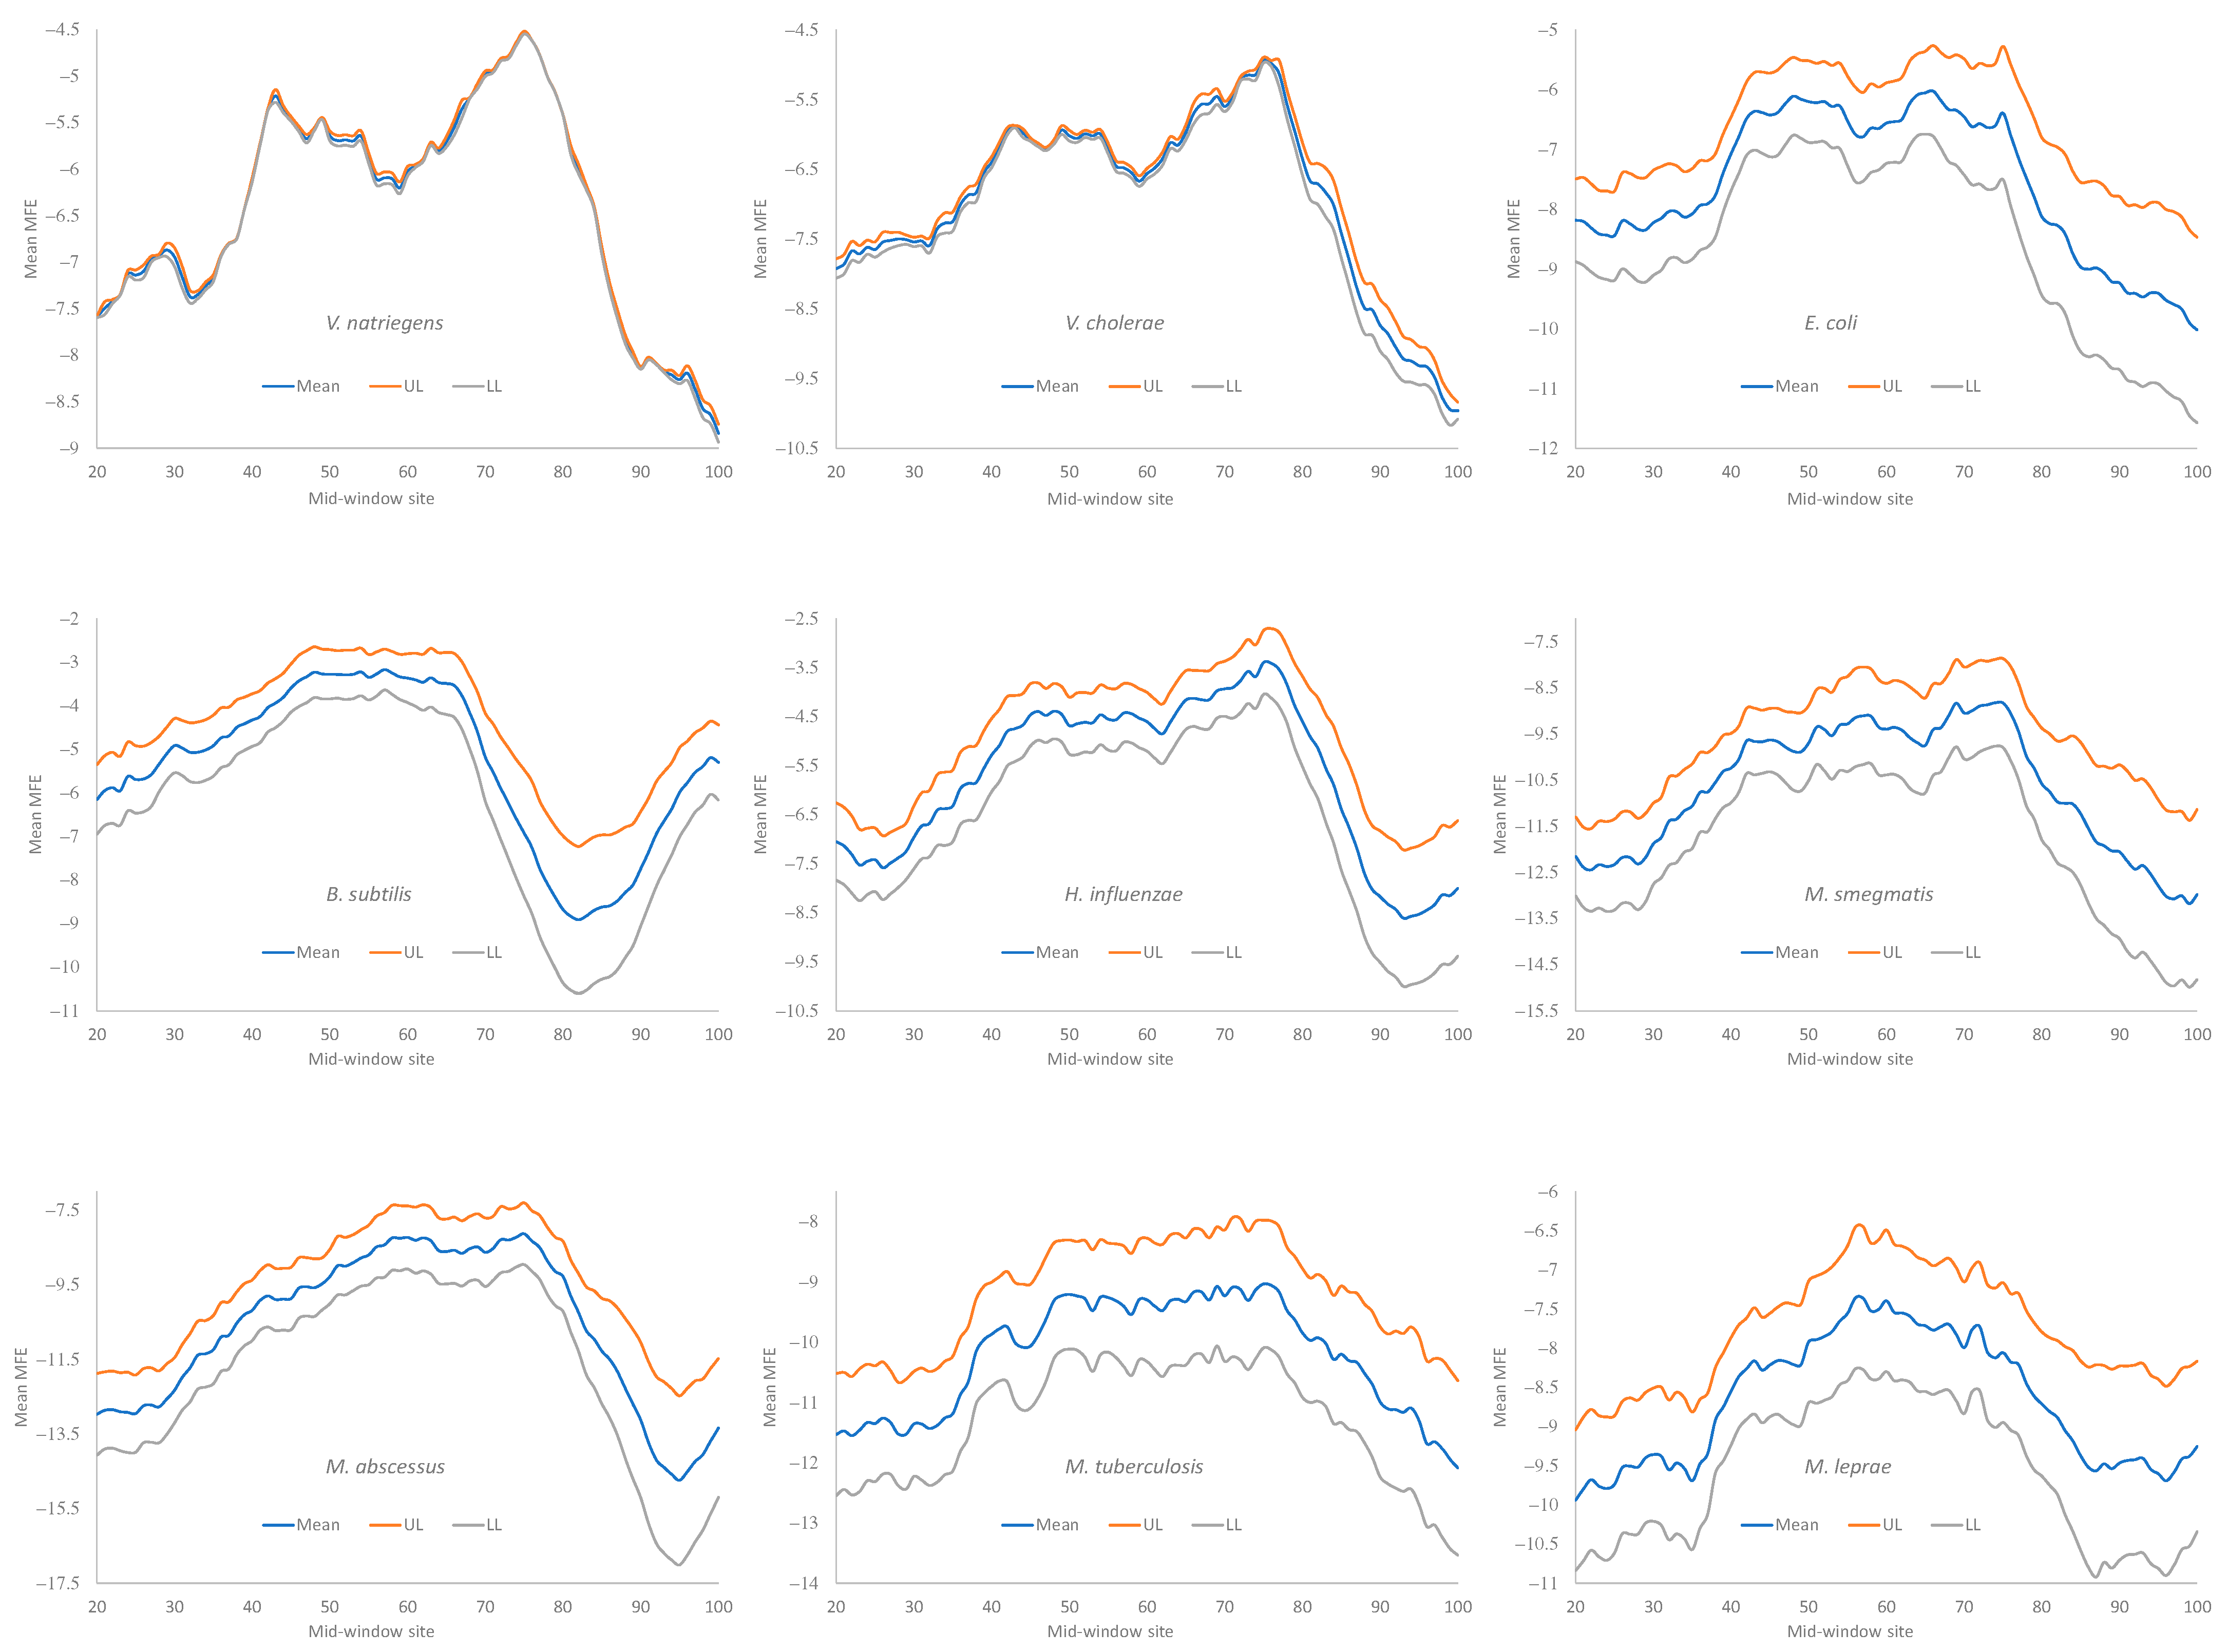
9] and measured the MFE with a sliding window of 40 nt along mRNA sequences, to quantify the change in secondary structural stability.
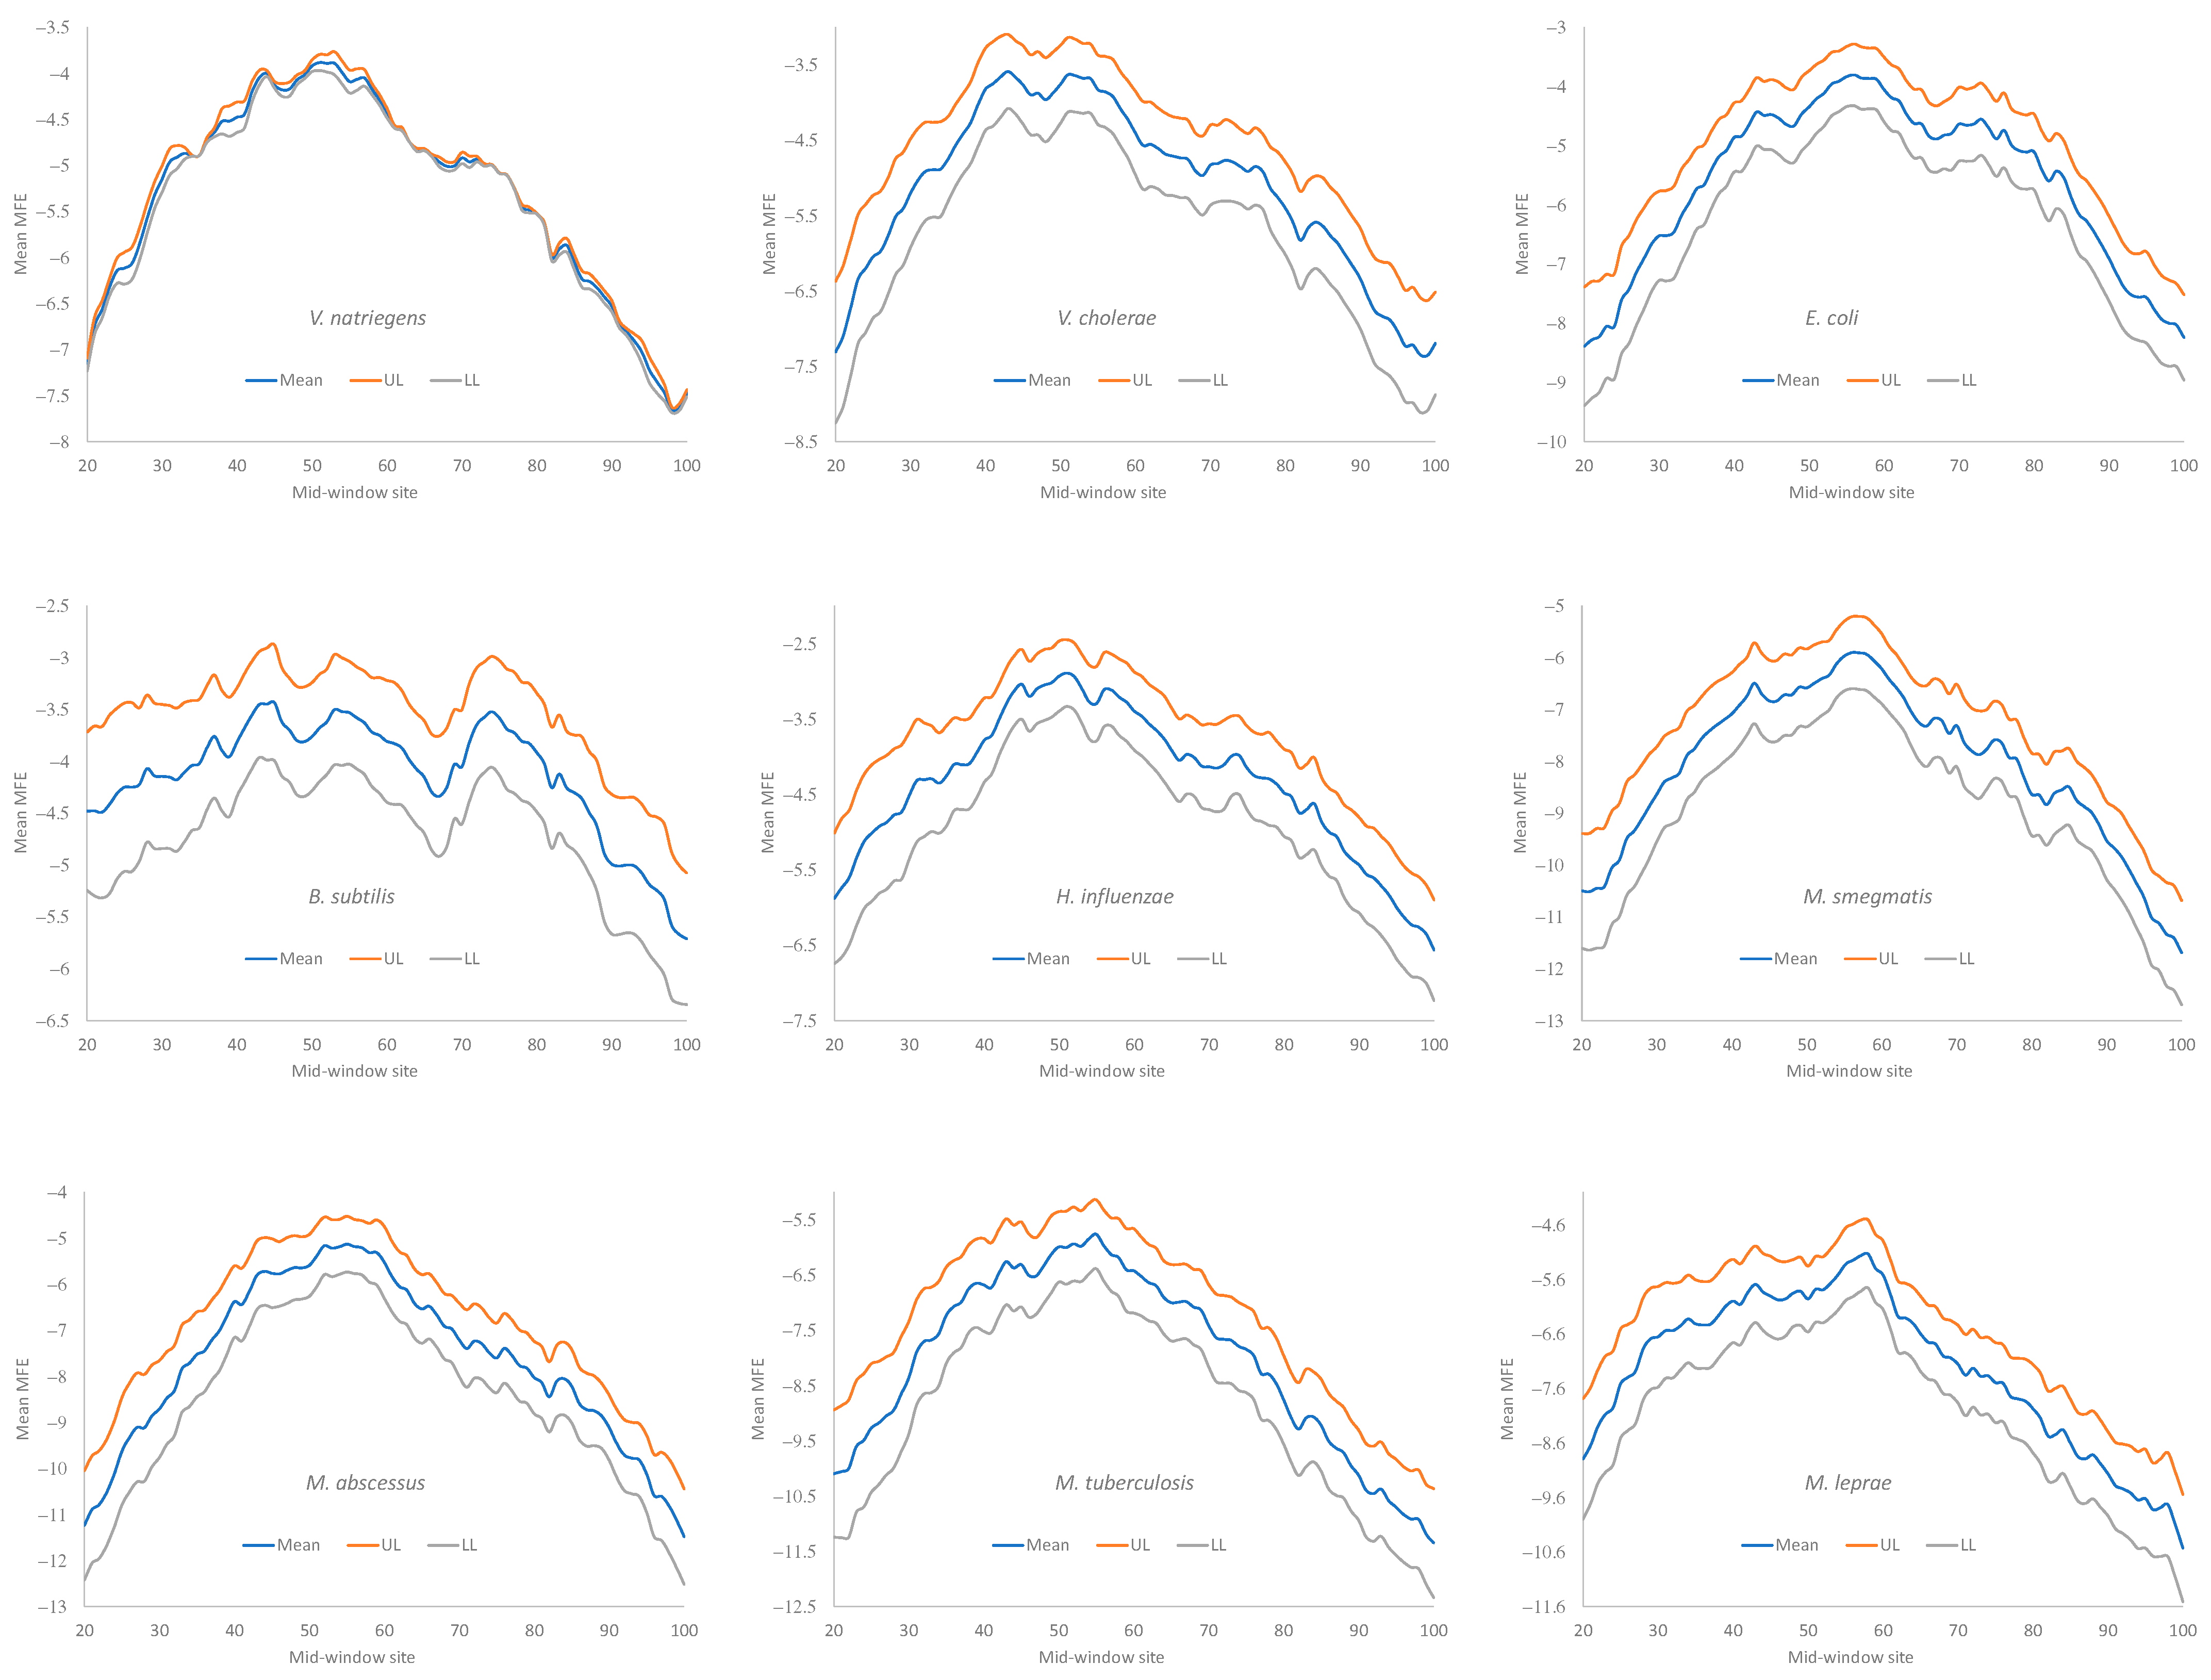
Secondary structural stability, as measured by MFE, decreased near the start codon, but the weakest secondary structure was observed slightly upstream of the start codon (Figure 4), corresponding to the SD sequence. This pattern has been observed before in bacteriophage genes and their host genes [5,9] and is consistent with the interpretation that a strong secondary structure embedding the SD sequence or the start codon is selected against because it prevents the translation initiation signal (SD and start codon) from being decoded by the aSD sequence and the initiation tRNA, respectively.
One might argue against the interpretation that the reduced secondary structure near the translation initiation serves to avoid embedding crucial translation initiation signals such as SD sequences and start codons in a stable secondary structure. The SD sequences are purine-rich and cannot form a secondary structure within them. Thus, the reduced secondary structure near the SD sequence (Figure 4) could be a direct consequence of the purine-richness in the SD sequences, with nothing to do with the hypothesized avoidance of the secondary structure embedding important translation initiation signals. We thus have two hypotheses. Hypothesis 1 invokes selection against secondary structural stability near the translation initiation signals. Hypothesis 2 states that the weakening of the secondary structure near the translation initiation signal is a simple consequence of the purine-rich SD, with no selection specifically against the secondary structure.
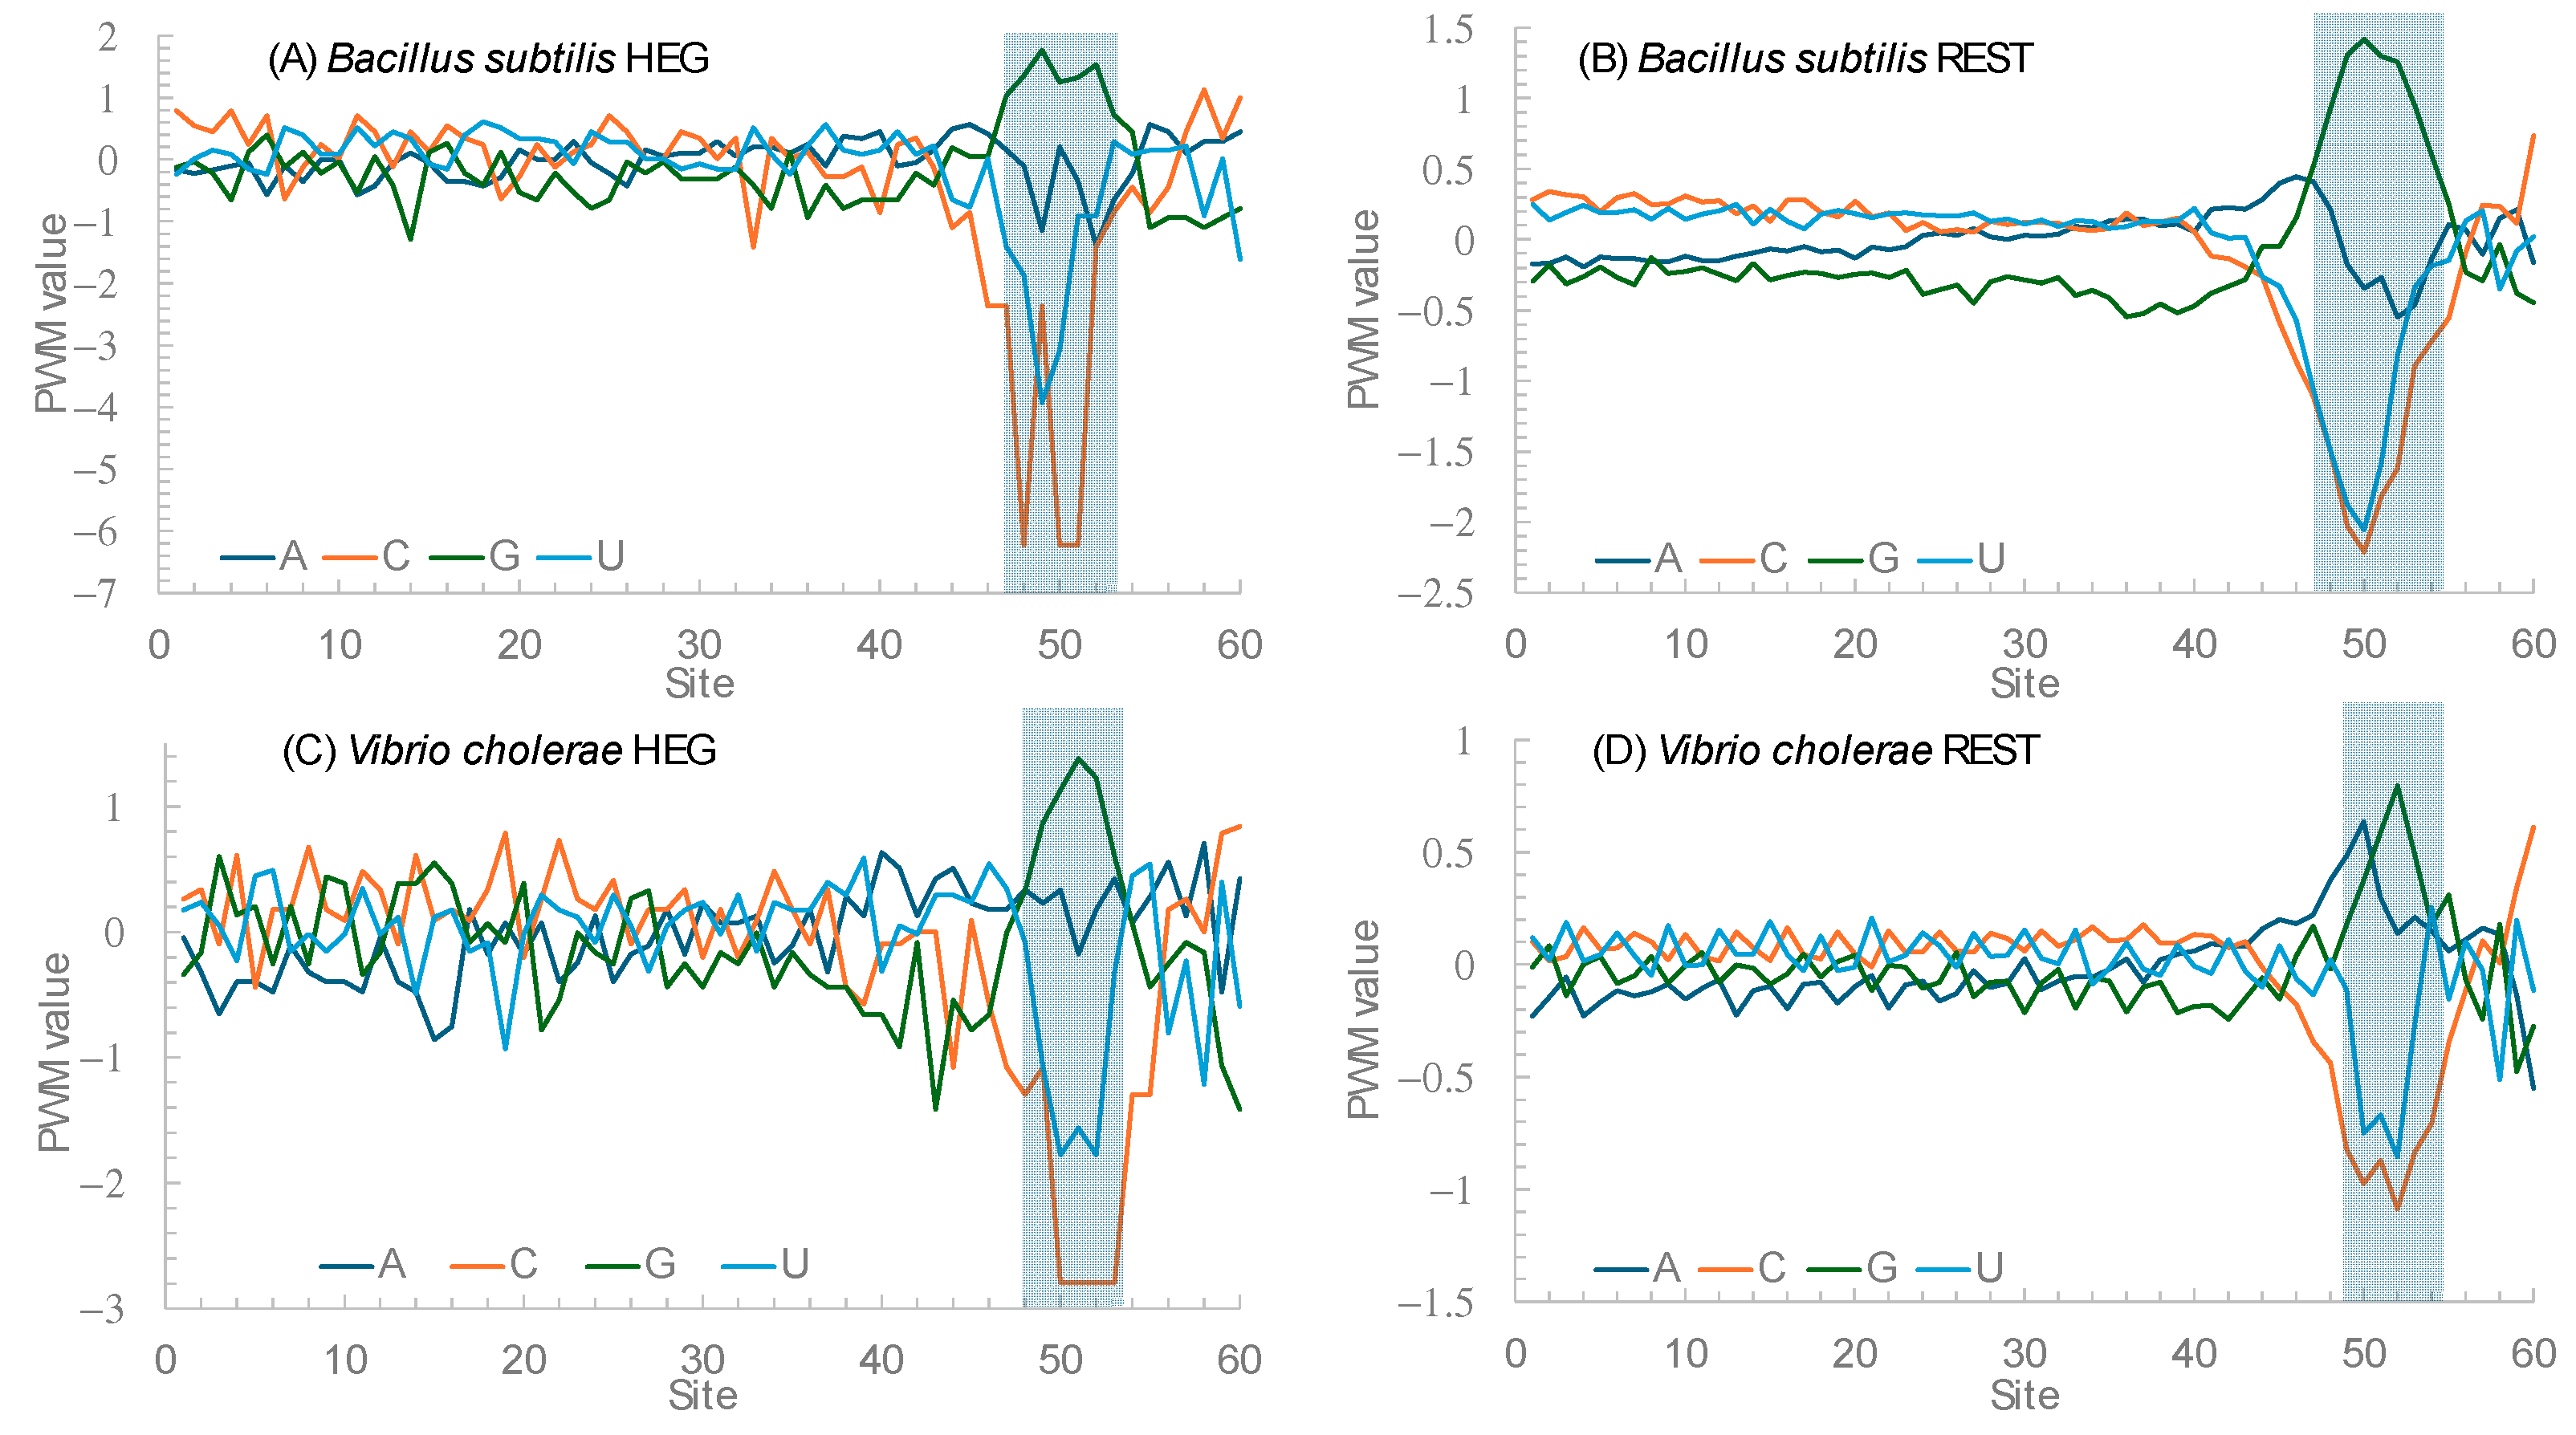
One way to differentiate these two hypotheses is to consider the observation that SD sequences are mainly G-rich. Because G will base-pair with C, Hypothesis 1 (invoking selection against secondary structural stability) will predict a stronger avoidance of nucleotide C relative to nucleotide U. In contrast, Hypothesis 2 gives no reason to expect an avoidance of nucleotide C relative to U near the translation initiation signals. Figure 5 plots the position weight matrix (PWM) scores for the 60 nucleotides immediately upstream of the start codon for two species, Bacillus subtilis and Vibrio cholarae. PWM scores measure nucleotide usage bias relative to the background nucleotide frequencies. A value of 0 means unbiased usage, a positive value means overuse, and a negative value means avoidance. Figure 5A,B contrast the HEGs and the REST genes in B. subtilis. If Hypothesis 1 is correct, then we expect stronger avoidance of C relative to U in HEGs than in the REST genes. The nucleotide usage patterns in Figure 5A,B are consistent with the prediction from Hypothesis 1. An approximate statistical test can be performed as follows. Within sites 45 to 55, there 36 nucleotide Cs and 129 nucleotide Us in the HEGs. The corresponding numbers are 2952 C and 7069 U. The percent of C is 21.818% in the former and 29.458% in the latter. The two are significantly different (likelihood ratio chi-square = 4.84, DF = 1, p = 0.0278). If we narrow the range to sites 48 to 53, then the difference becomes more significant. The nucleotide usage patterns for HEGs and REST genes in V. cholerae are similar (Figure 5C,D).
All nine bacterial species exhibited a decreased secondary structure near the translation initiation signals (Figure 4). However, we did not take into account the effect of the GC%. Increasing the GC% is expected to increase secondary structural stability in mRNA. As we can see from Table 9, H. influenzae has the lowest genomic GC% (38.2%), and its mean MFE is the closest to 0 (which means no secondary structure). In contrast, M. smegmatis and M. tuberculosis have the highest genomic GC%, and their mRNAs tend to have more negative MFE values (Figure 4). Accordingly, without controlling for GC%, the observation that the LGB have a stronger secondary structure than the SGB cannot be attributed to a reduced selection in these LGB against a stable secondary structure. Note that the MFE and GC% were calculated for each sequence, and their averages are presented in Table 9 as the MeanMFE and GC%, respectively.
Given that a weak secondary structure near the SD sequence and the start codon is favorable (Figure 4), one would predict that SGB should have weaker secondary structures (larger MFE values) than LGB. In order to test this prediction while accommodating the effect of the GC%, we characterized the MFE plots of sliding windows for each species using a single value for each. That is, for each plot in Figure 4, we calculated the mean value for mid-window sites 46–65 (with the start codon occupying sites 58–60). These sites included both the SD sequence and the start codon. The mean MFE (Table 9) was now the dependent variable. It was expected to (1) decrease (i.e., more stable secondary structure) with an increasing generation time (RankGT) and increasing GC%, and (2) increase with gene expression (GE, i.e., be greater for HEGs than for REST genes). These three independent variables are also included in Table 9.
The best model, which accounts for 98.2% of the total variation in MeanMFE in Table 9, included the three dependent variables and an interaction term (Table 10). The two-tailed p for RankGT was 0.064 (Table 10). However, because we had an explicit one-tailed prediction of a negative slope (i.e., MeanMFE should decrease with increasing RankGT), p was half of 0.064, i.e., 0.032. Other regression terms for GC%, GE, and their interaction were highly significant and consistent with the predictions (Table 10).
As before, we give the two regression equations separately for HEGs and the REST from the regression coefficients in Table 10:
For   HEGs : MeanMFE = 0.57408 0.08382   RankGT 0.10038   GC %
For   REST : MeanMFE = 5.03448 0.08382   RankGT 0.21009   GC %
Equations (8) and (9) show that, for both HEGs and REST genes, secondary structural stability increases with the generation time (MFE becomes more negative with an increasing generation time). This is consistent with our prediction that selection against the secondary structure near the translation start signals (SD sequence and start codon) is stronger in SGB than LGB.
MeanMFE decreases more sharply with the GC% in Equation (9) than in Equation (8), i.e., secondary structural stability increases more rapidly with the GC% for REST genes than for HEGs. This is easy to understand if the selection against secondary structural stability is on average stronger in HEGs than in REST genes. The MeanMFE decreases by only 0.10038 (Equation (8)) for a unit increase in the GC% with the strong selection of HEGs, but decreases by 0.21009 (Equation (9)) for the same unit change in the GC% with the relatively weak selection of REST genes.
The selectionist interpretation above does not consider the effect of mutations, which offers an alternative interpretation. In general, spontaneous mutations in AT-rich genomes tend to be AT-biased, based on (1) comparisons between pseudogenes and their functional counterparts [139,140], (2) the mutation patterns of pathogenic bacteria with relaxed selection [141,142], and (3) nucleotide bias at the three codon sites across multiple bacterial species [143]. 
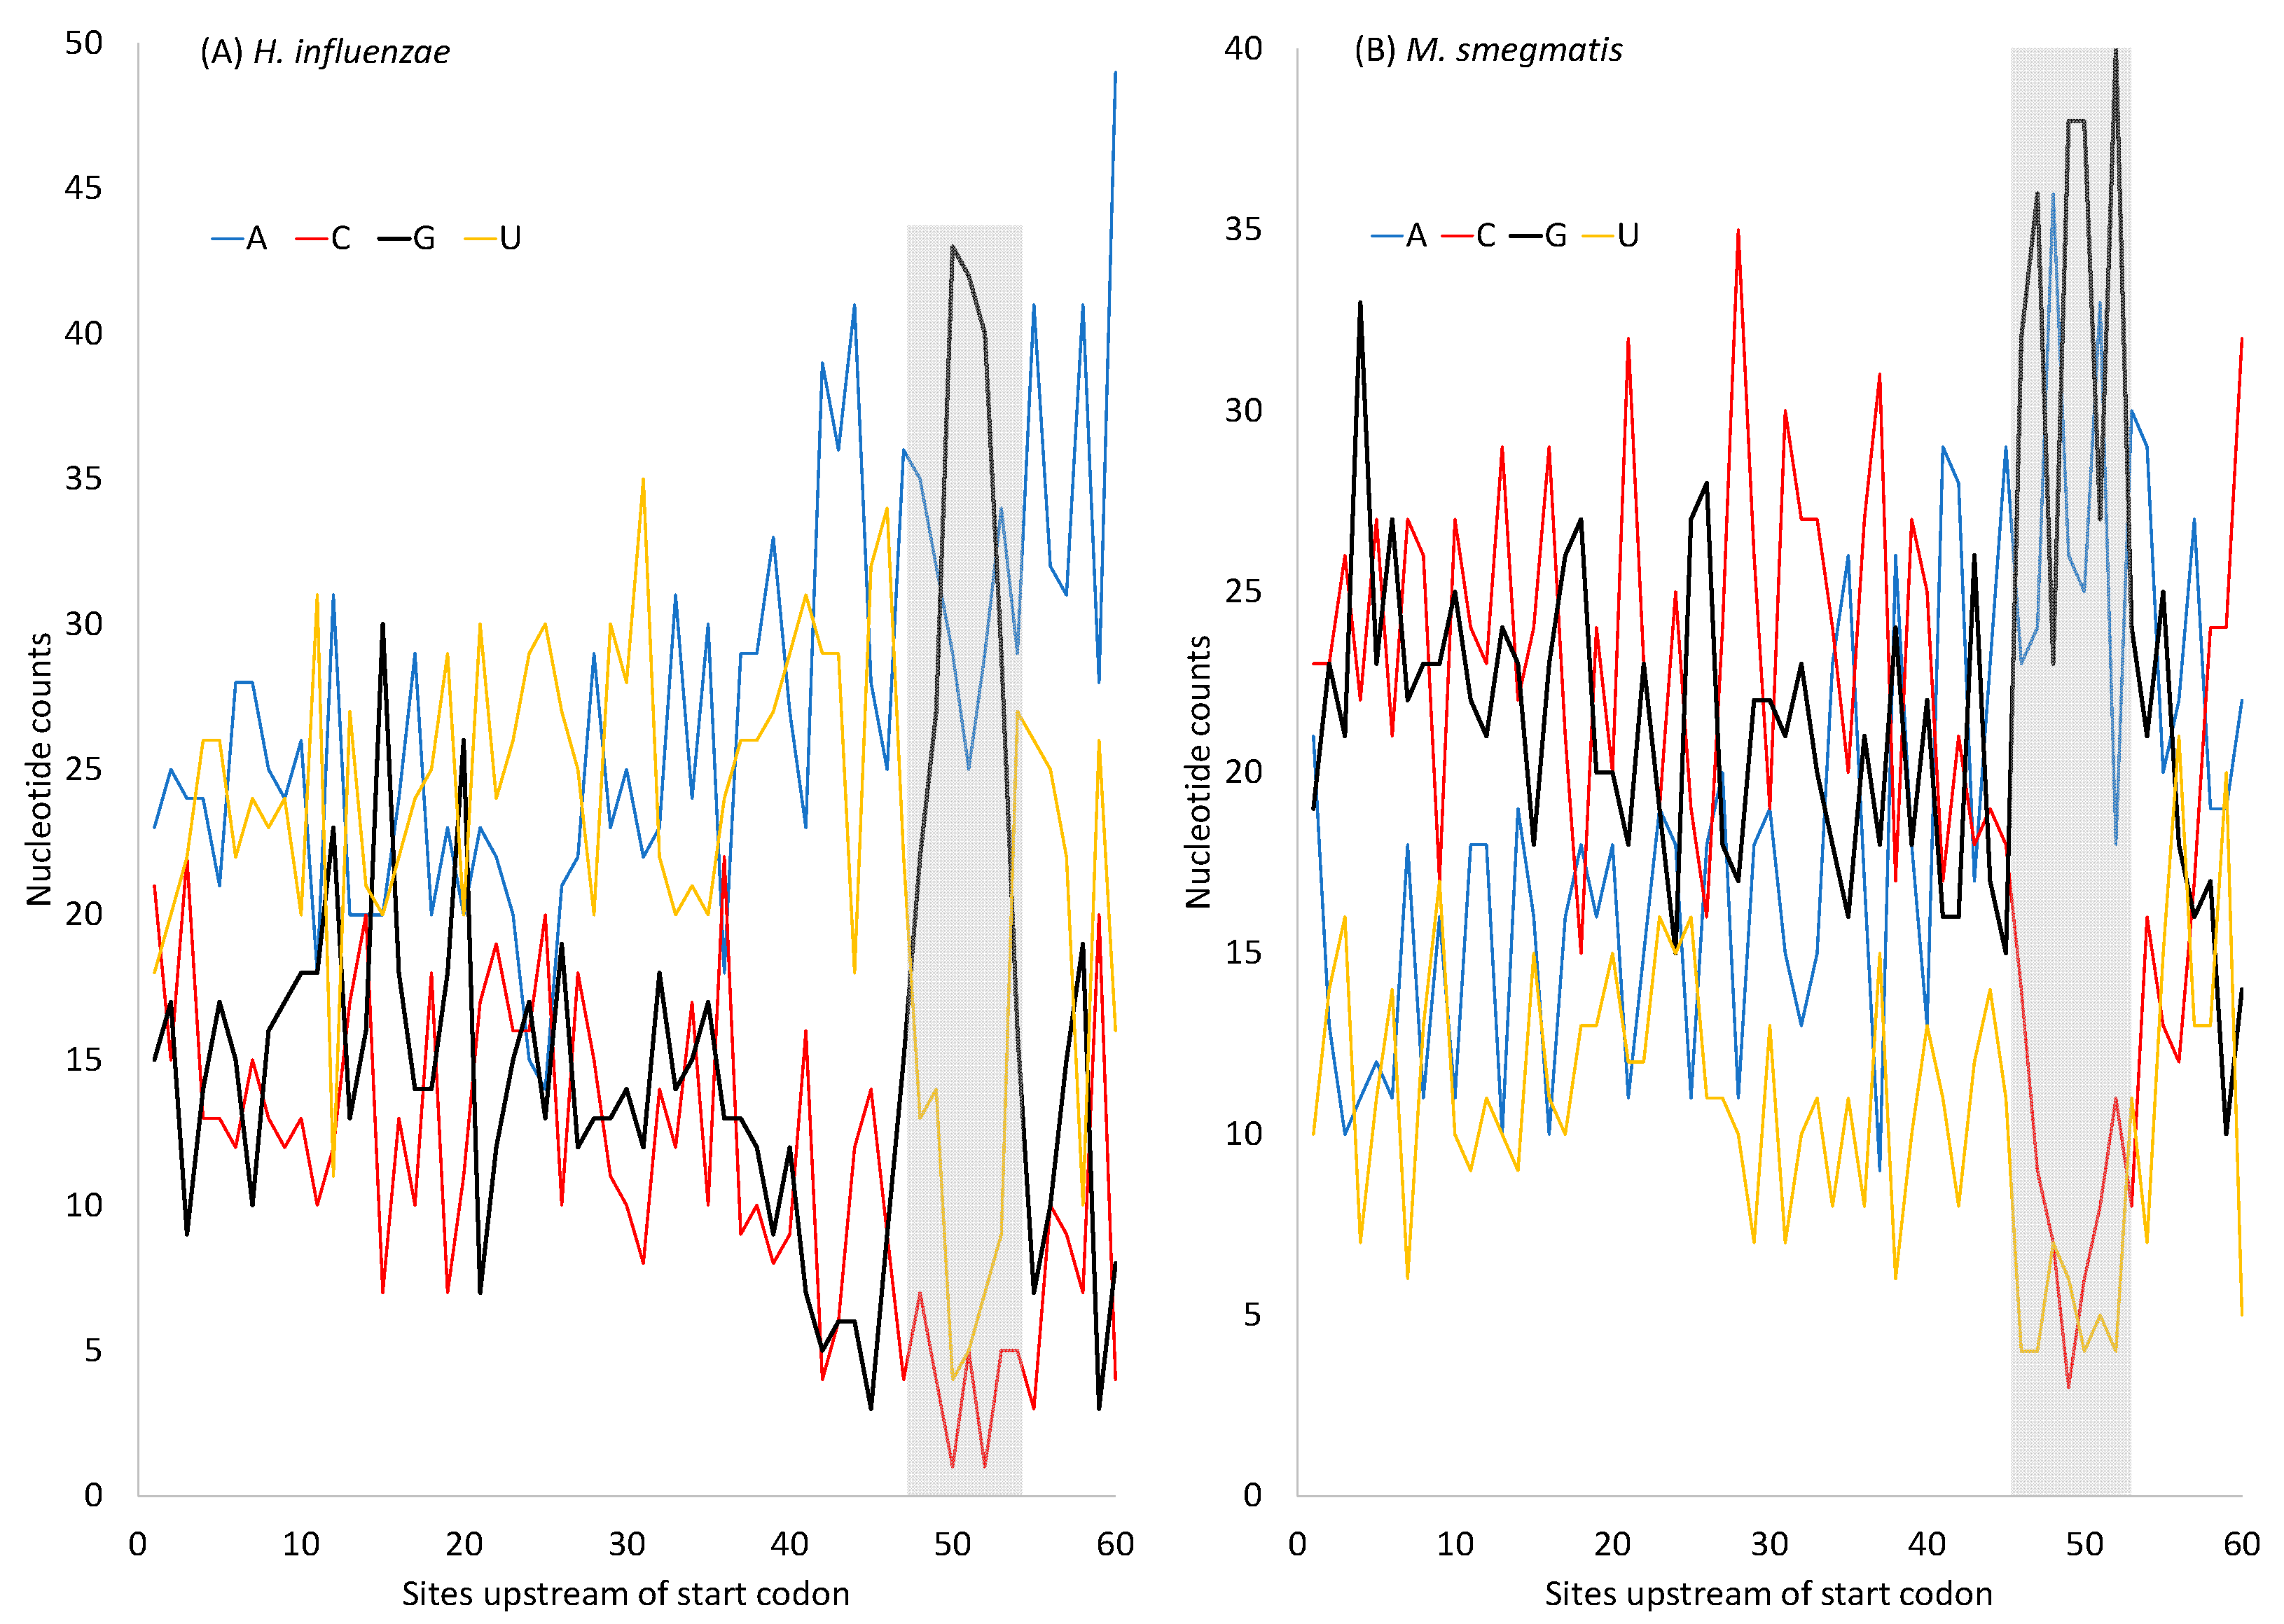
H. influenzae has an AT-rich genome, suggesting AT-biased mutation, in contrast to M. smegmatis, which has a GC-rich genome. However, protein-coding genes in both species have SD sequences that are purine-rich (especially G-rich) (Figure 6). The G-rich SD will form base-pairs with nearby C nucleotides, so the MFE will not fall to 0. In pseudogenes where selection for maintaining the G-rich SD sequence is absent, or in low-expressed genes where the selection is weak, the AT-rich H. influenzae will lose these G nucleotides in the SD sequence, leading to an MFE closer to 0. Indeed, the MeanMFE value for the 19 pseudogenes in H. influenzae is −2.2887, closer to 0 than all MeanMFE values in Table 9. Similarly, the MeanMFE is −3.2660 for HEGs and −2.5466 for REST genes (Table 9). This is consistent with the interpretation that the G-rich SD is more likely to be hit by G→A and G→T mutations and lose G/C base-pairs in REST genes than in HEGs. For example, H. influenzae has a GC% of 37.9329% for HEGs but only 33.7986% for REST genes, leading to a MeanMFE value closer to 0 in REST genes than in HEGs.
In short, although the purine-rich SD sequences (Figure 6) can hardly form secondary structures within themselves, the dramatically increased G nucleotides within the SD sequence could base-pair with the neighboring C nucleotides and contribute to secondary structural stability. If there is no selection maintaining the G-richness in the SD sequences, then these G nucleotides may be replaced by A and T, leading to a further decrease in secondary structural stability. Thus, both selection and mutation could contribute to secondary structural stability in sequences near the translation initiation signals (the SD sequence and the start codon). The models in Equations (8) and (9) are, therefore, oversimplified and should be interpreted with caution. The secondary structure in sequences near the stop codon exhibits a similar pattern to those near the start codon (Figure 6).
The decrease in secondary structural stability may not necessarily be related to the avoidance of embedding SD sequences and start codons. Efficiently translated yeast mRNAs (i.e., mRNAs in polysomes with high ribosome densities) often have a short poly(A) tract before the start codon [137], with the poly(A) interpreted as long enough to recruit translation initiation factors but short enough to avoid binding by the poly(A)-binding proteins. However, the presence of poly(A) also weakens the secondary structural stability as a secondary consequence.

4. Discussion

Our assumption that SGB are under stronger selection for translation efficiency than LGB appears to be valid because multiple predictions based on the assumption are consistent with the empirical evidence. First, the number of ribosome RNA operons, as well as the number of tRNA genes, increases with a decreasing generation time (Table 2 and Figure 1). Second, AUG is known to be the most efficient start codon, and SGB genes exhibit a stronger preference for AUG as a start codon than LGB, especially in highly expressed genes (HEGs) (Table 3, Table 4 and Table 5). This is also true in the usage of stop codon UAA (Table 6), which is known to be the most efficient termination signal with the smallest readthrough error rate as a stop codon. Third, SGB, especially their HEGs, exhibits better codon and anticodon adaptation than LGB (Table 7 and Figure 2 for codons, and Table 8 and Figure 3). Finally, SGB genes have weaker secondary structures near translation initiation signals than LGB (Figure 4 and Table 9 and Table 10). A similar pattern was observed with sequence secondary structures near the stop codon (Figure 7). However, as we discussed previously, the selectionist interpretation is sometimes confounded by biased mutations.
One may ask why there should ever be LGB with weak selection for translation optimization, given natural selection operating to maximize growth and reproduction. There are different environments in which translation efficiency may not be a limiting factor for growth and reproduction. For example, M. tuberculosis wraps itself with a thick layer of mycolic acids that serves two functions [144]: (1) to prevent antibiotics from reaching the cell membrane [145], and (2) to evade the attack of the host immune system [146]. However, after being phagocytosed by pulmonary macrophages and confined within the phagosome and the granuloma, M. tuberculosis survives in an extremely nutrient-limited environment and adopts a prolonged stage of dormancy with no chance of rapid growth [109]. Mutations still occur during this latent stage of dormancy [147,148] in both protein-coding genes [149] and rRNA genes [150,151]. Thus, mutations without the checking of natural selection will lead to a suboptimal translation machinery in M. tuberculosis. Such a suboptimal machinery cannot perform efficient translation even when the bacteria are not nutrient-limited. This is in dramatic contrast to E. coli, which experiences rapid alternation of feast and famine cycles several times each day, with natural selection eliminating those mutants that cannot translate efficiently during the feast period.
Modern biological research aims to formulate and validate quantitative and mechanistic models. In this context, this study has several shortcomings. The first shortcoming is the inherent inaccuracy of generation time. The experimentally measured generation time sometimes varies widely among strains and among different studies. For example, the generation time is ~21 h in drug-sensitive strains of M. tuberculosis, but ~35 h in the multi-drug-resistant strains [152]. This suggests a cost to the pathogen in developing multi-drug resistance, i.e., the resistance is at the cost of longer generations. However, the observation also highlights the inherent variation in measured generation time. Particularly controversial is what generation time to use. For example, the generation time in E. coli is only about 20–30 min under favorable culture conditions but could be substantially longer in the natural habitat of the mammalian intestine, estimated by the rate of mutation accumulation [153]. To model the joint effect of mutation and selection, the generation time under natural conditions would seem more appropriate than that under optimal experimental conditions. Unfortunately, the generation time in bacterial populations in nature cannot be measured accurately. For example, the estimated generation of 15 h for E. coli [153] is associated with a 95% confidence interval of 0–30 h. Another uncertainty with generation time is that we do not know if long-generation species such as M. leprae really cannot replicate fast or if they could grow fast but microbiologists have not been able to shift them into the fact-growing mode. Because of the uncertainty in generation times among the bacterial species, we ranked the generation times in the hope that, relative to one another, they would be in the correct order. It is for this reason that we chose species with widely different generation times characterized experimentally, so that our ranking of the generation times would not be controversial.
The second shortcoming of this study is the small number of bacterial species, partly because of our conscious effort to avoid species with uncertain generation times. There are various tables of bacterial generation times for more than nine bacterial species, but they often do not include original references or do not have fully sequenced genomes. Some bacterial species in Mollicutes have known generation times, e.g., ~6 h in Mycoplasma pneumoniae [154,155], as well as fully sequenced genomes. However, their genetic code (i.e., translation table 4) differs from the rest of the bacteria (translation table 11). This complicates comparisons. Consequently, they are not included in this study. The small number of bacterial species included here results in two limitations. First, it does not permit the validation of parameter-rich models. Second, it does not allow for phylogeny-based inference [156,157,158] to alleviate the issue of data dependence. We have previously used such phylogeny-based inference to quantify the relationships between body temperature and genome size [159] and between the optimal growth temperature and ribosomal RNAs’ secondary structural stability (i.e., the stem length and GC% in the stem–loop structure in rRNAs) [98]. The phylogenetically independent contrasts showed that the stem–loop structure in bacterial thermophiles tended to have longer and more GC-rich stems than that in mesophiles [98] and that poikilotherms in warm climates tended to have smaller genomes than those in cold climates [159]. In this context, we may highlight two points. First, our results are highly consistent with the prediction that increasing the generation time decreases the intensity of selection on translation efficiency. Second, the bacterial species we use are highly divergent. Even the two most closely related species, M. tuberculosis and M. leprae, have an evolutionary distance of more than 0.3 even for conserved ribosomal protein genes [160], so phylogenetic inertia might not affect the quantified relationships, i.e., the data points might be considered to be roughly independent.
The third shortcoming is the lack of a general conceptual framework for the impact of mutation and selection on translation optimization, one that can be used across species. Protein production from an mRNA depends on the ribosomal recruitment rate, the efficiency in forming the 70S initiation complex, the elongation efficiency and accuracy, the termination efficiency and accuracy, the stability of the mRNA, the differential amino acid and tRNA availability, and the energy level of the cell [4,18,161,162]. How do these variables interact with each other to affect protein production? For example, when translation is not efficient, codon usage optimization has little effect on protein production. However, protein production increases significantly with codon optimization in mRNAs with efficient initiation [3,7,14]. Similarly, there are conflicts between maximizing transcription efficiency and translation efficiency. An RNA will be transcribed efficiently if it maximizes the usage of the abundant nucleotide A and minimizes the rare nucleotide C [163,164]. However, this will drive up the usage of A-ending codons that may not be the optimal codons for translation. There are also factors affecting codon usage that are not related to translation. For example, mammalian species have zinc-finger antiviral proteins (ZAPs), which work against RNA viruses by targeting CpG dinucleotides in the viral RNA [165,166,167,168,169]. Many human RNA viruses exhibit much reduced CpG dinucleotides [165,170,171,172,173], with SARS-CoV-2 being the extreme among coronaviruses [174,175]. Most of the CpG reduction occurs at the di-codon configuration, from NNC GNN to NNT GNN (i.e., a synonymous replacement). This NNC to NNU change has nothing to do with codon optimization. So, what will be the functional relationship among all these variables? The model is even more complicated if we consider not only HEGs but also genes whose optimal protein level is not the maximal, such as the autoregulated level of release factor 2 in E. coli [82,83] or many others [176]. We highlight such questions in the hope that they will motivate researchers to address them.
The last point we wish to discuss is the usage of ranked variables such as the ranked generation time (RankGT). Specifically, the difference in generation time (GT) between the fast-growing Vibrio natriegens and V. cholerae is only a few minutes, whereas that between the slow-growing Mycobacterium tuberculosis and M. leprae is about six days. After completing a ranking, the difference in RankGT between the two fast-growing species becomes one (=2–1), which is the same as the difference in RankGT between the two slow-growing species (=9–8). This implicitly assumes that the difference of a few minutes in GT between the two fast-growing species is roughly equivalent to the differences of about six days in GT between the two slow-growing species.
Our results seem to substantiate the assumption above. For example, Mycobacterium tuberculosis and M. leprae have one rrn operon in their genomes. Any species with a much longer generation time in months or even years will not reduce the number of rrn operons below one. Thus, adding many days to the generation time in a slow-growing species will not change the number of rrn operons, but shortening the generation time by a few minutes in a fast-growing species may well increase the number of rrn operons. This suggests that a difference of a few minutes in GT in fast-growing species may actually result in a greater effect than a difference of a few days in slow-growing species. The same applies to the number of tRNA genes (Figure 1) and might be applicable to other translation-related features.

5. Conclusions

Detection of the impact of selection on translation efficiency is mostly performed by contrasting highly expressed genes and low-expressed genes within rapidly replicating species. We generalized such investigations to determine how differential selection for translation efficiency among different species will leave its footprints on the species-specific translation machinery. Our results suggest that selection for translation optimization is stronger in short-generation species than long-generation species, and that this differential selection strongly shapes the evolutionary trajectories of translation machineries in these species, affecting translation initiation, elongation, and termination.

Supplementary Materials

The following supporting information can be downloaded at: https://www.mdpi.com/article/10.3390/microorganisms12040768/s1, Table S1: Highly expressed genes and their locus tags in the nine bacterial species.

Author Contributions

Conceptualization, H.F. and X.X.; methodology, H.F. and X.X.; software, H.F. and X.X.; validation, X.X.; formal analysis, H.F. and X.X.; investigation, H.F. and X.X.; resources, X.X.; data curation, H.F. and X.X.; writing—original draft preparation, H.F. and X.X.; writing—review and editing, H.F. and X.X.; visualization, X.X.; supervision, X.X.; project administration, X.X.; funding acquisition, X.X. All authors have read and agreed to the published version of the manuscript.

Funding

This research was funded by a Discovery Grant from the Natural Science and Engineering Research Council (NSERC) of Canada, grant number RGPIN/2024-05641.

Data Availability Statement

Data are contained within the article and Supplementary Materials.

Acknowledgments

We thank the Xia Lab members for their discussions and comments and the three reviewers for their very helpful suggestions.

Conflicts of Interest

The authors declare no conflicts of interest.

Abbreviations

AC: tRNA anticodon; aSD: anti-Shine–Dalgarno sequence on small subunit rRNA; CAI: codon adaptation index; CDS: coding sequence; ENC: effective number of codons; GT: generation time; HEG: highly expressed genes; ITE: index of translation elongation; LEG: low-expressed genes; LGB: long-generation bacteria; MFE: minimum folding energy; OGT: optimal growth temperature; RankGT: ranked generation time; REST: protein-coding genes not in the HEG group; RF: release factor; SD: Shine–Dalgarno sequence on mRNA; SGB: short-generation bacteria.

References

  1. Jacob, F. Génétique Cellulaire: Leçon Inaugurale Prononcée le Vendredi 7 mai 1965; Collège de France: Paris, France, 2013. [Google Scholar]
  2. Bulmer, M. The selection-mutation-drift theory of synonymous codon usage. Genetics 1991, 129, 897–907. [Google Scholar] [CrossRef] [PubMed]
  3. Kudla, G.; Murray, A.W.; Tollervey, D.; Plotkin, J.B. Coding-Sequence Determinants of Gene Expression in Escherichia coli. Science 2009, 324, 255–258. [Google Scholar] [CrossRef] [PubMed]
  4. Liljenstrom, H.; von Heijne, G. Translation rate modification by preferential codon usage: Intragenic position effects. J. Theor. Biol. 1987, 124, 43–55. [Google Scholar] [CrossRef] [PubMed]
  5. Prabhakaran, R.; Chithambaram, S.; Xia, X. Escherichia coli and Staphylococcus phages: Effect of translation initiation efficiency on differential codon adaptation mediated by virulent and temperate lifestyles. J. Gen. Virol. 2015, 96, 1169–1179. [Google Scholar] [CrossRef] [PubMed]
  6. Xia, X. How optimized is the translational machinery in Escherichia coli, Salmonella typhimurium and Saccharomyces cerevisiae? Genetics 1998, 149, 37–44. [Google Scholar] [CrossRef] [PubMed]
  7. Xia, X. A Major Controversy in Codon-Anticodon Adaptation Resolved by a New Codon Usage Index. Genetics 2015, 199, 573–579. [Google Scholar] [CrossRef] [PubMed]
  8. Xia, X. Detailed Dissection and Critical Evaluation of the Pfizer/BioNTech and Moderna mRNA Vaccines. Vaccines 2021, 9, 734. [Google Scholar] [CrossRef] [PubMed]
  9. Xia, X. Optimizing Protein Production in Therapeutic Phages against a Bacterial Pathogen, Mycobacterium abscessus. Drugs Drug Candidates 2023, 2, 189–209. [Google Scholar] [CrossRef]
  10. Bremer, H.; Dennis, P. Modulation of chemical composition and other parameters of the cell by growth rate. Escherichia coli and Salmonella: Cellular and molecular biology. In Escherichia coli and Salmonella: Cellular and Molecular Biology, 2nd ed.; Neidhardt, F.C., Ed.; American Society for Microbiology: Washington, DC, USA, 1996; pp. 1553–1568. [Google Scholar]
  11. Valgepea, K.; Adamberg, K.; Seiman, A.; Vilu, R. Escherichia coli achieves faster growth by increasing catalytic and translation rates of proteins. Mol. BioSyst. 2013, 9, 2344–2358. [Google Scholar] [CrossRef] [PubMed]
  12. Glazyrina, J.; Materne, E.M.; Dreher, T.; Storm, D.; Junne, S.; Adams, T.; Greller, G.; Neubauer, P. High cell density cultivation and recombinant protein production with Escherichia coli in a rocking-motion-type bioreactor. Microb. Cell Fact. 2010, 9, 42. [Google Scholar] [CrossRef]
  13. Milo, R. What is the total number of protein molecules per cell volume? A call to rethink some published values. Bioessays 2013, 35, 1050–1055. [Google Scholar] [CrossRef] [PubMed]
  14. Tuller, T.; Waldman, Y.Y.; Kupiec, M.; Ruppin, E. Translation efficiency is determined by both codon bias and folding energy. Proc. Natl. Acad. Sci. USA 2010, 107, 3645–3650. [Google Scholar] [CrossRef] [PubMed]
  15. Zhu, M.; Dai, X. On the intrinsic constraint of bacterial growth rate: M. tuberculosis’s view of the protein translation capacity. Crit. Rev. Microbiol. 2018, 44, 455–464. [Google Scholar] [CrossRef] [PubMed]
  16. Chithambaram, S.; Prabhakaran, R.; Xia, X. Differential Codon Adaptation between dsDNA and ssDNA Phages in Escherichia coli. Mol. Biol. Evol. 2014, 31, 1606–1617. [Google Scholar] [CrossRef] [PubMed]
  17. Chithambaram, S.; Prabhakaran, R.; Xia, X. The Effect of Mutation and Selection on Codon Adaptation in Escherichia coli Bacteriophage. Genetics 2014, 197, 301–315. [Google Scholar] [CrossRef] [PubMed]
  18. Gualerzi, C.O.; Pon, C.L. Initiation of mRNA translation in bacteria: Structural and dynamic aspects. Cell. Mol. Life Sci. 2015, 72, 4341–4367. [Google Scholar] [CrossRef] [PubMed]
  19. Andersson, D.I.; Kurland, C.G. Ram ribosomes are defective proofreaders. Mol. Gen. Genet. 1983, 191, 378–381. [Google Scholar] [CrossRef] [PubMed]
  20. Bulmer, M. The effect of context on synonymous codon usage in genes with low codon usage bias. Nucleic Acids Res. 1990, 18, 2869–2873. [Google Scholar] [CrossRef]
  21. Shine, J.; Dalgarno, L. The 3′-terminal sequence of Escherichia coli 16S ribosomal RNA: Complementarity to nonsense triplets and ribosome binding sites. Proc. Natl. Acad. Sci. USA 1974, 71, 1342–1346. [Google Scholar] [CrossRef]
  22. Shine, J.; Dalgarno, L. Identical 3′-terminal octanucleotide sequence in 18S ribosomal ribonucleic acid from different eukaryotes. A proposed role for this sequence in the recognition of terminator codons. Biochem. J. 1974, 141, 609–615. [Google Scholar] [CrossRef] [PubMed]
  23. Shine, J.; Dalgarno, L. Determinant of cistron specificity in bacterial ribosomes. Nature 1975, 254, 34–38. [Google Scholar] [CrossRef] [PubMed]
  24. Hui, A.; de Boer, H.A. Specialized ribosome system: Preferential translation of a single mRNA species by a subpopulation of mutated ribosomes in Escherichia coli. Proc. Natl. Acad. Sci. USA 1987, 84, 4762–4766. [Google Scholar] [CrossRef] [PubMed]
  25. Steitz, J.A.; Jakes, K. How ribosomes select initiator regions in mRNA: Base pair formation between the 3′ terminus of 16S rRNA and the mRNA during initiation of protein synthesis in Escherichia coli. Proc. Natl. Acad. Sci. USA 1975, 72, 4734–4738. [Google Scholar] [CrossRef] [PubMed]
  26. Taniguchi, T.; Weissmann, C. Inhibition of Qbeta RNA 70S ribosome initiation complex formation by an oligonucleotide complementary to the 3′-terminal region of E. coli 16S ribosomal RNA. Nature 1978, 275, 770–772. [Google Scholar] [CrossRef] [PubMed]
  27. Nakamoto, T. A unified view of the initiation of protein synthesis. Biochem. Biophys. Res. Commun. 2006, 341, 675–678. [Google Scholar] [CrossRef] [PubMed]
  28. Calogero, R.A.; Pon, C.L.; Canonaco, M.A.; Gualerzi, C.O. Selection of the mRNA translation initiation region by Escherichia coli ribosomes. Proc. Natl. Acad. Sci. USA 1988, 85, 6427–6431. [Google Scholar] [CrossRef] [PubMed]
  29. Studer, S.M.; Joseph, S. Unfolding of mRNA secondary structure by the bacterial translation initiation complex. Mol. Cell 2006, 22, 105–115. [Google Scholar] [CrossRef] [PubMed]
  30. Ikemura, T. Correlation between the abundance of Escherichia coli transfer RNAs and the occurrence of the respective codons in its protein genes. J. Mol. Biol. 1981, 146, 1–21. [Google Scholar] [CrossRef]
  31. Xia, X. Bioinformatics and Translation Elongation. In Bioinformatics and the Cell: Modern Computational Approaches in Genomics, Proteomics and Transcriptomics; Springer: Cham, Switzerland, 2018; pp. 197–238. [Google Scholar]
  32. Ikemura, T. Correlation between the abundance of yeast transfer RNAs and the occurrence of the respective codons in protein genes. Differences in synonymous codon choice patterns of yeast and Escherichia coli with reference to the abundance of isoaccepting transfer RNAs. J. Mol. Biol. 1982, 158, 573–597. [Google Scholar] [PubMed]
  33. Gouy, M.; Gautier, C. Codon usage in bacteria: Correlation with gene expressivity. Nucleic Acids Res. 1982, 10, 7055–7064. [Google Scholar] [CrossRef] [PubMed]
  34. Coghlan, A.; Wolfe, K.H. Relationship of codon bias to mRNA concentration and protein length in Saccharomyces cerevisiae. Yeast 2000, 16, 1131–1145. [Google Scholar] [CrossRef] [PubMed]
  35. Comeron, J.M.; Aguade, M. An evaluation of measures of synonymous codon usage bias. J. Mol. Evol. 1998, 47, 268–274. [Google Scholar] [CrossRef] [PubMed]
  36. Duret, L.; Mouchiroud, D. Expression pattern and, surprisingly, gene length shape codon usage in Caenorhabditis, Drosophila, and Arabidopsis. Proc. Natl. Acad. Sci. USA 1999, 96, 4482–4487. [Google Scholar] [CrossRef] [PubMed]
  37. Prabhakaran, R.; Chithambaram, S.; Xia, X. Aeromonas phages encode tRNAs for their overused codons. Int. J. Comput. Biol. Drug Des. 2014, 7, 168–182. [Google Scholar] [CrossRef] [PubMed]
  38. Robinson, M.; Lilley, R.; Little, S.; Emtage, J.S.; Yarranton, G.; Stephens, P.; Millican, A.; Eaton, M.; Humphreys, G. Codon usage can affect efficiency of translation of genes in Escherichia coli. Nucleic Acids Res. 1984, 12, 6663–6671. [Google Scholar] [CrossRef] [PubMed]
  39. Sorensen, M.A.; Kurland, C.G.; Pedersen, S. Codon usage determines translation rate in Escherichia coli. J. Mol. Biol. 1989, 207, 365–377. [Google Scholar] [CrossRef] [PubMed]
  40. Andersson, D.I.; Bohman, K.; Isaksson, L.A.; Kurland, C.G. Translation rates and misreading characteristics of rpsD mutants in Escherichia coli. Mol. Gen. Genet. 1982, 187, 467–472. [Google Scholar] [CrossRef] [PubMed]
  41. Andersson, S.G.; Buckingham, R.H.; Kurland, C.G. Does codon composition influence ribosome function? EMBO J. 1984, 3, 91–94. [Google Scholar] [CrossRef] [PubMed]
  42. Andersson, S.G.; Kurland, C.G. Codon preferences in free-living microorganisms. Microbiol. Rev. 1990, 54, 198–210. [Google Scholar] [CrossRef] [PubMed]
  43. Haas, J.; Park, E.-C.; Seed, B. Codon usage limitation in the expression of HIV-1 envelope glycoprotein. Curr. Biol. 1996, 6, 315–324. [Google Scholar] [CrossRef] [PubMed]
  44. Ngumbela, K.C.; Ryan, K.P.; Sivamurthy, R.; Brockman, M.A.; Gandhi, R.T.; Bhardwaj, N.; Kavanagh, D.G. Quantitative Effect of Suboptimal Codon Usage on Translational Efficiency of mRNA Encoding HIV-1 gag in Intact T Cells. PLoS ONE 2008, 3, e2356. [Google Scholar] [CrossRef] [PubMed]
  45. van Weringh, A.; Ragonnet-Cronin, M.; Pranckeviciene, E.; Pavon-Eternod, M.; Kleiman, L.; Xia, X. HIV-1 Modulates the tRNA Pool to Improve Translation Efficiency. Mol. Biol. Evol. 2011, 28, 1827–1834. [Google Scholar] [CrossRef] [PubMed]
  46. Akashi, H. Synonymous codon usage in Drosophila melanogaster: Natural selection and translational accuracy. Genetics 1994, 136, 927–935. [Google Scholar] [CrossRef] [PubMed]
  47. Xia, X. The cost of wobble translation in fungal mitochondrial genomes: Integration of two traditional hypotheses. BMC Evol. Biol. 2008, 8, 211. [Google Scholar] [CrossRef] [PubMed]
  48. Moriyama, E.N.; Powell, J.R. Codon usage bias and tRNA abundance in Drosophila. J. Mol. Evol. 1997, 45, 514–523. [Google Scholar] [CrossRef] [PubMed]
  49. Ran, W.; Higgs, P.G. Contributions of speed and accuracy to translational selection in bacteria. PLoS ONE 2012, 7, e51652. [Google Scholar] [CrossRef]
  50. Sharp, P.M.; Li, W.H. The codon Adaptation Index—A measure of directional synonymous codon usage bias, and its potential applications. Nucleic Acids Res. 1987, 15, 1281–1295. [Google Scholar] [CrossRef] [PubMed]
  51. Xia, X. An Improved Implementation of Codon Adaptation Index. Evol. Bioinform. 2007, 3, 53–58. [Google Scholar] [CrossRef]
  52. Sun, X.Y.; Yang, Q.; Xia, X. An Improved Implementation of Effective Number of Codons (Nc). Mol. Biol. Evol. 2013, 30, 191–196. [Google Scholar] [CrossRef] [PubMed]
  53. Davies, J.; Jones, D.S.; Khorana, H.G. A further study of misreading of codons induced by streptomycin and neomycin using ribopolynucleotides containing two nucleotides in alternating sequence as templates. J. Mol. Biol. 1966, 18, 48–57. [Google Scholar] [CrossRef] [PubMed]
  54. Ryden, S.M.; Isaksson, L.A. A temperature-sensitive mutant of Escherichia coli that shows enhanced misreading of UAG/A and increased efficiency for some tRNA nonsense suppressors. Mol. Gen. Genet. 1984, 193, 38–45. [Google Scholar] [CrossRef] [PubMed]
  55. Roth, J.R. UGA nonsense mutations in Salmonella typhimurium. J. Bacteriol. 1970, 102, 467–475. [Google Scholar] [CrossRef] [PubMed]
  56. Sambrook, J.F.; Fan, D.P.; Brenner, S. A strong suppressor specific for UGA. Nature 1967, 214, 452–453. [Google Scholar] [CrossRef]
  57. Strigini, P.; Brickman, E. Analysis of specific misreading in Escherichia coli. J. Mol. Biol. 1973, 75, 659–672. [Google Scholar] [CrossRef] [PubMed]
  58. Bossi, L. Context effects: Translation of UAG codon by suppressor tRNA is affected by the sequence following UAG in the message. J. Mol. Biol. 1983, 164, 73–87. [Google Scholar] [CrossRef] [PubMed]
  59. Bossi, L.; Roth, J.R. The influence of codon context on genetic code translation. Nature 1980, 286, 123. [Google Scholar] [CrossRef] [PubMed]
  60. Miller, J.H.; Albertini, A.M. Effects of surrounding sequence on the suppression of nonsense codons. J. Mol. Biol. 1983, 164, 59–71. [Google Scholar] [CrossRef] [PubMed]
  61. Geller, A.I.; Rich, A. A UGA termination suppression tRNATrp active in rabbit reticulocytes. Nature 1980, 283, 41–46. [Google Scholar] [CrossRef] [PubMed]
  62. Jorgensen, F.; Adamski, F.M.; Tate, W.P.; Kurland, C.G. Release factor-dependent false stops are infrequent in Escherichia coli. J. Mol. Biol. 1993, 230, 41–50. [Google Scholar] [CrossRef] [PubMed]
  63. Parker, J. Errors and alternatives in reading the universal genetic code. Microbiol. Rev. 1989, 53, 273–298. [Google Scholar] [CrossRef]
  64. Tate, W.P.; Mansell, J.B.; Mannering, S.A.; Irvine, J.H.; Major, L.L.; Wilson, D.N. UGA: A dual signal for ‘stop’ and for recoding in protein synthesis. Biochemistry 1999, 64, 1342–1353. [Google Scholar]
  65. César Sánchez, J.; Padrón, G.; Santana, H.; Herrera, L. Elimination of an HuIFN alpha 2b readthrough species, produced in Escherichia coli, by replacing its natural translational stop signal. J. Biotechnol. 1998, 63, 179–186. [Google Scholar] [CrossRef]
  66. Meng, S.Y.; Hui, J.O.; Haniu, M.; Tsai, L.B. Analysis of translational termination of recombinant human methionyl-neurotrophin 3 in Escherichia coli. Biochem. Biophys. Res. Commun. 1995, 211, 40–48. [Google Scholar] [CrossRef] [PubMed]
  67. Wei, Y.; Wang, J.; Xia, X. Coevolution between Stop Codon Usage and Release Factors in Bacterial Species. Mol. Biol. Evol. 2016, 33, 2357–2367. [Google Scholar] [CrossRef]
  68. Tate, W.P.; Brown, C.M. Translational termination: “stop” for protein synthesis or “pause” for regulation of gene expression. Biochemistry 1992, 31, 2443–2450. [Google Scholar] [CrossRef] [PubMed]
  69. Tate, W.P.; Mannering, S.A. Three, four or more: The translational stop signal at length. Mol. Microbiol. 1996, 21, 213–219. [Google Scholar] [CrossRef] [PubMed]
  70. Wei, Y.; Xia, X. The Role of +4U as an Extended Translation Termination Signal in Bacteria. Genetics 2017, 205, 539–549. [Google Scholar] [CrossRef] [PubMed]
  71. Konecki, D.S.; Aune, K.C.; Tate, W.; Caskey, C.T. Characterization of reticulocyte release factor. J. Biol. Chem. 1977, 252, 4514–4520. [Google Scholar] [CrossRef] [PubMed]
  72. McCaughan, K.K.; Brown, C.M.; Dalphin, M.E.; Berry, M.J.; Tate, W.P. Translational termination efficiency in mammals is influenced by the base following the stop codon. Proc. Natl. Acad. Sci. USA 1995, 92, 5431–5435. [Google Scholar] [CrossRef] [PubMed]
  73. Brown, C.M.; Stockwell, P.A.; Trotman, C.N.; Tate, W.P. Sequence analysis suggests that tetra-nucleotides signal the termination of protein synthesis in eukaryotes. Nucleic Acids Res. 1990, 18, 6339–6345. [Google Scholar] [CrossRef] [PubMed]
  74. Xia, X. Bioinformatics and Translation Termination in Bacteria. In Bioinformatics and the Cell: Modern Computational Approaches in Genomics, Proteomics and Transcriptomics; Springer: Cham, Switzerland, 2018; pp. 239–254. [Google Scholar]
  75. Tate, W.P.; Poole, E.S.; Dalphin, M.E.; Major, L.L.; Crawford, D.J.; Mannering, S.A. The translational stop signal: Codon with a context, or extended factor recognition element? Biochimie 1996, 78, 945–952. [Google Scholar] [CrossRef]
  76. Tate, W.P.; Poole, E.S.; Horsfield, J.A.; Mannering, S.A.; Brown, C.M.; Moffat, J.G.; Dalphin, M.E.; McCaughan, K.K.; Major, L.L.; Wilson, D.N. Translational termination efficiency in both bacteria and mammals is regulated by the base following the stop codon. Biochem. Cell Biol. 1995, 73, 1095–1103. [Google Scholar] [CrossRef] [PubMed]
  77. Poole, E.S.; Brimacombe, R.; Tate, W.P. Decoding the translational termination signal: The polypeptide chain release factor in Escherichia coli crosslinks to the base following the stop codon. RNA 1997, 3, 974–982. [Google Scholar] [PubMed]
  78. Poole, E.S.; Major, L.L.; Mannering, S.A.; Tate, W.P. Translational termination in Escherichia coli: Three bases following the stop codon crosslink to release factor 2 and affect the decoding efficiency of UGA-containing signals. Nucleic Acids Res. 1998, 26, 954–960. [Google Scholar] [CrossRef]
  79. Tate, W.; Greuer, B.; Brimacombe, R. Codon recognition in polypeptide chain termination: Site directed crosslinking of termination codon to Escherichia coli release factor 2. Nucleic Acids Res. 1990, 18, 6537–6544. [Google Scholar] [CrossRef]
  80. Poole, E.S.; Brown, C.M.; Tate, W.P. The identity of the base following the stop codon determines the efficiency of in vivo translational termination in Escherichia coli. EMBO J. 1995, 14, 151–158. [Google Scholar] [CrossRef]
  81. Cridge, A.G.; Major, L.L.; Mahagaonkar, A.A.; Poole, E.S.; Isaksson, L.A.; Tate, W.P. Comparison of characteristics and function of translation termination signals between and within prokaryotic and eukaryotic organisms. Nucleic Acids Res. 2006, 34, 1959–1973. [Google Scholar] [CrossRef]
  82. Craigen, W.J.; Caskey, C.T. Expression of peptide chain release factor 2 requires high-efficiency frameshift. Nature 1986, 322, 273–275. [Google Scholar] [CrossRef] [PubMed]
  83. Craigen, W.J.; Cook, R.G.; Tate, W.P.; Caskey, C.T. Bacterial peptide chain release factors: Conserved primary structure and possible frameshift regulation of release factor 2. Proc. Natl. Acad. Sci. USA 1985, 82, 3616–3620. [Google Scholar] [CrossRef]
  84. Curran, J.F.; Yarus, M. Use of tRNA suppressors to probe regulation of Escherichia coli release factor 2. J. Mol. Biol. 1988, 203, 75–83. [Google Scholar] [CrossRef] [PubMed]
  85. Weaver, R.F. Molecular Biology, 5th ed.; McGraw-Hill: Boston, MA, USA, 2012. [Google Scholar]
  86. Sharp, P.M.; Bailes, E.; Grocock, R.J.; Peden, J.F.; Sockett, R.E. Variation in the strength of selected codon usage bias among bacteria. Nucleic Acids Res. 2005, 33, 1141–1153. [Google Scholar] [CrossRef] [PubMed]
  87. Klappenbach, J.A.; Dunbar, J.M.; Schmidt, T.M. rRNA operon copy number reflects ecological strategies of bacteria. Appl. Environ. Microbiol. 2000, 66, 1328–1333. [Google Scholar] [CrossRef] [PubMed]
  88. Rocha, E.P. Codon usage bias from tRNA’s point of view: Redundancy, specialization, and efficient decoding for translation optimization. Genome Res. 2004, 14, 2279–2286. [Google Scholar] [CrossRef] [PubMed]
  89. Kjeldgaard, N.; Kurland, C. The distribution of soluble and ribosomal RNA as a function of growth rate. J. Mol. Biol. 1963, 6, 341–348. [Google Scholar] [CrossRef]
  90. Moller, S.; Kristensen, C.S.; Poulsen, L.K.; Carstensen, J.M.; Molin, S. Bacterial growth on surfaces: Automated image analysis for quantification of growth rate-related parameters. Appl. Environ. Microbiol. 1995, 61, 741–748. [Google Scholar] [CrossRef] [PubMed]
  91. Poulsen, L.K.; Ballard, G.; Stahl, D.A. Use of rRNA fluorescence in situ hybridization for measuring the activity of single cells in young and established biofilms. Appl. Environ. Microbiol. 1993, 59, 1354–1360. [Google Scholar] [CrossRef] [PubMed]
  92. Schaechter, M.; Maaloe, O.; Kjeldgaard, N.O. Dependency on medium and temperature of cell size and chemical composition during balanced grown of Salmonella typhimurium. J. Gen. Microbiol. 1958, 19, 592–606. [Google Scholar] [CrossRef]
  93. Yang, L.; Haagensen, J.A.; Jelsbak, L.; Johansen, H.K.; Sternberg, C.; Høiby, N.; Molin, S. In situ growth rates and biofilm development of Pseudomonas aeruginosa populations in chronic lung infections. J. Bacteriol. 2008, 190, 2767–2776. [Google Scholar] [CrossRef]
  94. Ran, W.; Kristensen, D.M.; Koonin, E.V. Coupling between protein level selection and codon usage optimization in the evolution of bacteria and archaea. Mbio 2014, 5, e00956-00914. [Google Scholar] [CrossRef]
  95. Xia, X. DAMBE6: New Tools for Microbial Genomics, Phylogenetics, and Molecular Evolution. J. Hered. 2017, 108, 431–437. [Google Scholar] [CrossRef]
  96. Xia, X. Rapid evolution of animal mitochondria. In Evolution in the Fast Lane: Rapidly Evolving Genes and Genetic Systems; Singh, R.S., Xu, J., Kulathinal, R.J., Eds.; Oxford University Press: Oxford, UK, 2012; pp. 73–82. [Google Scholar]
  97. Xia, X.; Huang, H.; Carullo, M.; Betran, E.; Moriyama, E.N. Conflict between Translation Initiation and Elongation in Vertebrate Mitochondrial Genomes. PLoS ONE 2007, 2, e227. [Google Scholar] [CrossRef]
  98. Wang, H.C.; Xia, X.; Hickey, D.A. Thermal adaptation of ribosomal RNA genes: A comparative study. J. Mol. Evol. 2006, 63, 120–126. [Google Scholar] [CrossRef] [PubMed]
  99. Hockenberry, A.J.; Stern, A.J.; Amaral, L.A.N.; Jewett, M.C. Diversity of Translation Initiation Mechanisms across Bacterial Species Is Driven by Environmental Conditions and Growth Demands. Mol. Biol. Evol. 2017, 35, 582–592. [Google Scholar] [CrossRef] [PubMed]
  100. Eagon, R.G. Pseudomonas natriegens, a marine bacterium with a generation time of less than 10 minutes. J. Bacteriol. 1962, 83, 736–737. [Google Scholar] [CrossRef] [PubMed]
  101. Yin, M.; Ye, B.; Jin, Y.; Liu, L.; Zhang, Y.; Li, P.; Wang, Y.; Li, Y.; Han, Y.; Shen, W.; et al. Changes in Vibrio natriegens Growth Under Simulated Microgravity. Front. Microbiol. 2020, 11, 2040. [Google Scholar] [CrossRef] [PubMed]
  102. Dryselius, R.; Izutsu, K.; Honda, T.; Iida, T. Differential replication dynamics for large and small Vibrio chromosomes affect gene dosage, expression and location. BMC Genom. 2008, 9, 559. [Google Scholar] [CrossRef] [PubMed]
  103. Sezonov, G.; Joseleau-Petit, D.; D’Ari, R. Escherichia coli physiology in Luria-Bertani broth. J. Bacteriol. 2007, 189, 8746–8749. [Google Scholar] [CrossRef] [PubMed]
  104. Sharpe, M.E.; Hauser, P.M.; Sharpe, R.G.; Errington, J. Bacillus subtilis cell cycle as studied by fluorescence microscopy: Constancy of cell length at initiation of DNA replication and evidence for active nucleoid partitioning. J. Bacteriol. 1998, 180, 547–555. [Google Scholar] [CrossRef] [PubMed]
  105. Artman, M.; Domenech, E.; Weiner, M. Growth of Haemophilus influenzae in simulated blood cultures supplemented with hemin and NAD. J. Clin. Microbiol. 1983, 18, 376–379. [Google Scholar] [CrossRef] [PubMed]
  106. Cook, G.M.; Berney, M.; Gebhard, S.; Heinemann, M.; Cox, R.A.; Danilchanka, O.; Niederweis, M. Physiology of mycobacteria. Adv. Microb. Physiol. 2009, 55, 81–182, 318–319. [Google Scholar] [PubMed]
  107. Cortes, M.A.; Nessar, R.; Singh, A.K. Laboratory maintenance of Mycobacterium abscessus. Curr. Protoc. Microbiol. 2010, 10, 10D.1.1–10D.1.12. [Google Scholar] [CrossRef] [PubMed]
  108. Cole, S.T. Comparative and functional genomics of the Mycobacterium tuberculosis complex. Microbiology 2002, 148, 2919–2928. [Google Scholar] [CrossRef] [PubMed]
  109. Gengenbacher, M.; Kaufmann, S.H. Mycobacterium tuberculosis: Success through dormancy. FEMS Microbiol. Rev. 2012, 36, 514–532. [Google Scholar] [CrossRef] [PubMed]
  110. Change, Y.T.; Andersen, R.N.; Vaituzis, Z. Growth of Mycobacterium lepraemurium in cultures of mouse peritoneal macrophages. J. Bacteriol. 1967, 93, 1119–1131. [Google Scholar] [CrossRef]
  111. Andrews, J.H.; Harris, R.F. r- and K-Selection and Microbial Ecology. In Advances in Microbial Ecology; Marshall, K.C., Ed.; Springer: Boston, MA, USA, 1986; pp. 99–147. [Google Scholar]
  112. Brzeszcz, J.; Steliga, T.; Kapusta, P.; Turkiewicz, A.; Kaszycki, P. r-strategist versus K-strategist for the application in bioremediation of hydrocarbon-contaminated soils. Int. Biodeterior. Biodegrad. 2016, 106, 41–52. [Google Scholar] [CrossRef]
  113. Shepard, C.C. Temperature optimum of Mycobacterium leprae in mice. J. Bacteriol. 1965, 90, 1271–1275. [Google Scholar] [CrossRef]
  114. Xia, X. DAMBE7: New and improved tools for data analysis in molecular biology and evolution. Mol. Biol. Evol. 2018, 35, 1550–1552. [Google Scholar] [CrossRef] [PubMed]
  115. Hofacker, I.L. Vienna RNA secondary structure server. Nucleic Acids Res. 2003, 31, 3429–3431. [Google Scholar] [CrossRef]
  116. Xia, X. Bioinformatics and Translation Initiation. In Bioinformatics and the Cell: Modern Computational Approaches in Genomics, Proteomics and Transcriptomics; Springer: Cham, Switzerland, 2018; pp. 173–195. [Google Scholar]
  117. Gausing, K. Regulation of ribosome production in Escherichia coli: Synthesis and stability of ribosomal RNA and of ribosomal protein messenger RNA at different growth rates. J. Mol. Biol. 1977, 115, 335–354. [Google Scholar] [CrossRef] [PubMed]
  118. Verma, A.; Sampla, A.K.; Tyagi, J.S. Mycobacterium tuberculosis rrn promoters: Differential usage and growth rate-dependent control. J. Bacteriol. 1999, 181, 4326–4333. [Google Scholar] [CrossRef] [PubMed]
  119. Deutscher, M.P. Twenty years of bacterial Rnases and RNA processing: How we’ve matured. RNA 2015, 21, 597–600. [Google Scholar] [CrossRef] [PubMed]
  120. Keener, J.; Nomura, M. Regulation of ribosome synthesis. In Escherichia coli and Salmonella: Cellular and Molecular Biology; Neidhardt, F.C., Curtiss, R., III, Ingraham, J.L., Lin, E.C.C., Low, K.B., Magasanik, B., Reznikoff, W.S., Riley, M., Schaechter, M., Umbarger, J.E., Eds.; ASM Press: Washington, DC, USA, 1996; Volume 1, pp. 1417–1428. [Google Scholar]
  121. Murray, H.D.; Appleman, J.A.; Gourse, R.L. Regulation of the Escherichia coli rrnB P2 promoter. J. Bacteriol. 2003, 185, 28–34. [Google Scholar] [CrossRef] [PubMed]
  122. Nomura, M.; Gourse, R.; Baughman, G. Regulation of the synthesis of ribosomes and ribosomal components. Annu. Rev. Biochem. 1984, 53, 75–117. [Google Scholar] [CrossRef] [PubMed]
  123. Du, M.-Z.; Wei, W.; Qin, L.; Liu, S.; Zhang, A.-Y.; Zhang, Y.; Zhou, H.; Guo, F.-B. Co-adaption of tRNA gene copy number and amino acid usage influences translation rates in three life domains. DNA Res. 2017, 24, 623–633. [Google Scholar] [CrossRef] [PubMed]
  124. Noller, H.F. Evolution of Protein Synthesis from an RNA World. In RNA World: From Life’s Origin to Diversity in Gene Regulation; Atkins, J.F., Gesteland, R.F., Cech, T.R., Eds.; Cold Spring Harbor Laboratory Press: Cold Spring Harbor, NY, USA, 2011; pp. 141–154. [Google Scholar]
  125. Hecht, A.; Glasgow, J.; Jaschke, P.R.; Bawazer, L.A.; Munson, M.S.; Cochran, J.R.; Endy, D.; Salit, M. Measurements of translation initiation from all 64 codons in E. coli. Nucleic Acids Res. 2017, 45, 3615–3626. [Google Scholar] [CrossRef] [PubMed]
  126. Hartz, D.; McPheeters, D.S.; Gold, L. Influence of mRNA determinants on translation initiation in Escherichia coli. J. Mol. Biol. 1991, 218, 83–97. [Google Scholar] [CrossRef] [PubMed]
  127. Belinky, F.; Rogozin, I.B.; Koonin, E.V. Selection on start codons in prokaryotes and potential compensatory nucleotide substitutions. Sci. Rep. 2017, 7, 12422. [Google Scholar] [CrossRef] [PubMed]
  128. Adamski, F.M.; McCaughan, K.K.; Jorgensen, F.; Kurland, C.G.; Tate, W.P. The concentration of polypeptide chain release factors 1 and 2 at different growth rates of Escherichia coli. J. Mol. Biol. 1994, 238, 302–308. [Google Scholar] [CrossRef] [PubMed]
  129. Crawford, D.J.; Ito, K.; Nakamura, Y.; Tate, W.P. Indirect regulation of translational termination efficiency at highly expressed genes and recoding sites by the factor recycling function of Escherichia coli release factor RF3. EMBO J. 1999, 18, 727–732. [Google Scholar] [CrossRef] [PubMed]
  130. Wright, F. The ‘effective number of codons’ used in a gene. Gene 1990, 87, 23–29. [Google Scholar] [CrossRef] [PubMed]
  131. Xia, X. Characterizing translation efficiency. In Bioinformatics and the Cell: Modern Computational Approaches in Genomics, Proteomics and Transcriptomics; Xia, X., Ed.; Springer: Boston, MA, USA, 2007; pp. 173–206. [Google Scholar]
  132. Palidwor, G.A.; Perkins, T.J.; Xia, X. A general model of codon bias due to GC mutational bias. PLoS ONE 2010, 5, e13431. [Google Scholar] [CrossRef] [PubMed]
  133. Carullo, M.; Xia, X. An Extensive Study of Mutation and Selection on the Wobble Nucleotide in tRNA Anticodons in Fungal Mitochondrial Genomes. J. Mol. Evol. 2008, 66, 484–493. [Google Scholar] [CrossRef] [PubMed]
  134. Wei, Y.; Silke, J.R.; Xia, X. An improved estimation of tRNA expression to better elucidate the coevolution between tRNA abundance and codon usage in bacteria. Sci. Rep. 2019, 9, 3184. [Google Scholar] [CrossRef]
  135. de Smit, M.H.; van Duin, J. Control of prokaryotic translational initiation by mRNA secondary structure. Prog. Nucleic Acid. Res. Mol. Biol. 1990, 38, 1–35. [Google Scholar] [PubMed]
  136. Scharff, L.B.; Childs, L.; Walther, D.; Bock, R. Local absence of secondary structure permits translation of mRNAs that lack ribosome-binding sites. PLoS Genet. 2011, 7, e1002155. [Google Scholar] [CrossRef] [PubMed]
  137. Xia, X.; MacKay, V.; Yao, X.; Wu, J.; Miura, F.; Ito, T.; Morris, D.R. Translation Initiation: A Regulatory Role for Poly(A) Tracts in Front of the AUG Codon in Saccharomyces cerevisiae. Genetics 2011, 189, 469–478. [Google Scholar] [CrossRef] [PubMed]
  138. Xia, X.; Holcik, M. Strong Eukaryotic IRESs Have Weak Secondary Structure. PLoS ONE 2009, 4, e4136. [Google Scholar] [CrossRef] [PubMed]
  139. Li, W.-H. Evolution of Duplicate Genes and Pseudogenes; Sinauer: Sunderland, MA, USA, 1983; pp. 14–37. [Google Scholar]
  140. Li, W.H.; Gojobori, T.; Nei, M. Pseudogenes as a paradigm of neutral evolution. Nature 1981, 292, 237–239. [Google Scholar] [CrossRef] [PubMed]
  141. Hershberg, R.; Petrov, D.A. Evidence That Mutation Is Universally Biased towards AT in Bacteria. PLoS Genet. 2010, 6, e1001115. [Google Scholar] [CrossRef] [PubMed]
  142. Lind, P.A.; Andersson, D.I. Whole-genome mutational biases in bacteria. Proc. Natl. Acad. Sci. USA 2008, 105, 17878–17883. [Google Scholar] [CrossRef] [PubMed]
  143. Muto, A.; Osawa, S. The guanine and cytosine content of genomic DNA and bacterial evolution. Proc. Natl. Acad. Sci. USA 1987, 84, 166–169. [Google Scholar] [CrossRef] [PubMed]
  144. Lee, W.; Engels, B. The protonation state of catalytic residues in the resting state of KasA revisited: Detailed mechanism for the activation of KasA by its own substrate. Biochemistry 2014, 53, 919–931. [Google Scholar] [CrossRef] [PubMed]
  145. Nataraj, V.; Varela, C.; Javid, A.; Singh, A.; Besra, G.S.; Bhatt, A. Mycolic acids: Deciphering and targeting the Achilles’ heel of the tubercle bacillus. Mol. Microbiol. 2015, 98, 7–16. [Google Scholar] [CrossRef] [PubMed]
  146. Zhao, J.; Siddiqui, S.; Shang, S.; Bian, Y.; Bagchi, S.; He, Y.; Wang, C.R. Mycolic acid-specific T cells protect against Mycobacterium tuberculosis infection in a humanized transgenic mouse model. eLife 2015, 4, e08525. [Google Scholar] [CrossRef] [PubMed]
  147. Colangeli, R.; Arcus, V.L.; Cursons, R.T.; Ruthe, A.; Karalus, N.; Coley, K.; Manning, S.D.; Kim, S.; Marchiano, E.; Alland, D. Whole genome sequencing of Mycobacterium tuberculosis reveals slow growth and low mutation rates during latent infections in humans. PLoS ONE 2014, 9, e91024. [Google Scholar] [CrossRef] [PubMed]
  148. Chang, D.P.S.; Guan, X.L. Metabolic Versatility of Mycobacterium tuberculosis during Infection and Dormancy. Metabolites 2021, 11, 88. [Google Scholar] [CrossRef]
  149. Comín, J.; Cebollada, A.; Iglesias, M.J.; Ibarz, D.; Viñuelas, J.; Torres, L.; Sahagún, J.; Lafoz, M.C.; Esteban de Juanas, F.; Malo, M.C.; et al. Estimation of the mutation rate of Mycobacterium tuberculosis in cases with recurrent tuberculosis using whole genome sequencing. Sci. Rep. 2022, 12, 16728. [Google Scholar] [CrossRef] [PubMed]
  150. Douglass, J.; Steyn, L.M. A ribosomal gene mutation in streptomycin-resistant Mycobacterium tuberculosis isolates. J. Infect. Dis. 1993, 167, 1505–1506. [Google Scholar] [CrossRef]
  151. Honoré, N.; Marchal, G.; Cole, S.T. Novel mutation in 16S rRNA associated with streptomycin dependence in Mycobacterium tuberculosis. Antimicrob. Agents Chemother. 1995, 39, 769–770. [Google Scholar] [CrossRef]
  152. Mukherjee, T.; Goswami, A.; Chakraborty, U.; Majumdar, M.; Sinha, S.; Pal, N.K. A Study on Generation Time of Sensitive and Resistant Mycobacterium tuberculosis Isolates. J. Evol. Med. Dent. Sci. 2019, 8, 2489–2494. [Google Scholar] [CrossRef]
  153. Gibson, B.; Wilson, D.J.; Feil, E.; Eyre-Walker, A. The distribution of bacterial doubling times in the wild. Proc. Biol. Sci. 2018, 285, 20180789. [Google Scholar] [CrossRef] [PubMed]
  154. Waites, K.B.; Talkington, D.F. Mycoplasma pneumoniae and its role as a human pathogen. Clin. Microbiol. Rev. 2004, 17, 697–728, table of contents. [Google Scholar] [CrossRef]
  155. Kashyap, S.; Sarkar, M. Mycoplasma pneumonia: Clinical features and management. Lung India 2010, 27, 75–85. [Google Scholar] [CrossRef] [PubMed]
  156. Felsenstein, J. Phylogenies and the comparative method. Am. Nat. 1985, 125, 1–15. [Google Scholar] [CrossRef]
  157. Harvey, P.H.; Pagel, M.D. The Comparative Method in Evolutionary Biology; Oxford University Press: Oxford, UK, 1991. [Google Scholar]
  158. Xia, X. Comparative Genomics; Springer: Berlin/Heidelberg, Germany, 2013; 67p. [Google Scholar]
  159. Xia, X. Body temperature, rate of biosynthesis and evolution of genome size. Mol. Biol. Evol. 1995, 12, 834–842. [Google Scholar]
  160. Xia, X. Horizontal Gene Transfer and Drug Resistance Involving Mycobacterium tuberculosis. Antibiotics 2023, 12, 1367. [Google Scholar] [CrossRef] [PubMed]
  161. Maitra, A.; Dill, K.A. Bacterial growth laws reflect the evolutionary importance of energy efficiency. Proc. Natl. Acad. Sci. USA 2015, 112, 406–411. [Google Scholar] [CrossRef] [PubMed]
  162. Rodnina, M.V. Translation in Prokaryotes. Cold Spring Harb. Perspect. Biol. 2018, 10, a032664. [Google Scholar] [CrossRef] [PubMed]
  163. Xia, X. Maximizing transcription efficiency causes codon usage bias. Genetics 1996, 144, 1309–1320. [Google Scholar] [CrossRef]
  164. Xia, X.; Wang, H.; Xie, Z.; Carullo, M.; Huang, H.; Hickey, D. Cytosine usage modulates the correlation between CDS length and CG content in prokaryotic genomes. Mol. Biol. Evol. 2006, 23, 1450–1454. [Google Scholar] [CrossRef] [PubMed]
  165. Takata, M.A.; Gonçalves-Carneiro, D.; Zang, T.M.; Soll, S.J.; York, A.; Blanco-Melo, D.; Bieniasz, P.D. CG dinucleotide suppression enables antiviral defence targeting non-self RNA. Nature 2017, 550, 124–127. [Google Scholar] [CrossRef]
  166. Ficarelli, M.; Antzin-Anduetza, I.; Hugh-White, R.; Firth, A.E.; Sertkaya, H.; Wilson, H.; Neil, S.J.D.; Schulz, R.; Swanson, C.M. CpG Dinucleotides Inhibit HIV-1 Replication through Zinc Finger Antiviral Protein (ZAP)-Dependent and -Independent Mechanisms. J. Virol. 2020, 94, 10–1128. [Google Scholar] [CrossRef]
  167. Ficarelli, M.; Wilson, H.; Pedro Galão, R.; Mazzon, M.; Antzin-Anduetza, I.; Marsh, M.; Neil, S.J.; Swanson, C.M. KHNYN is essential for the zinc finger antiviral protein (ZAP) to restrict HIV-1 containing clustered CpG dinucleotides. eLife 2019, 8, e46767. [Google Scholar] [CrossRef]
  168. Meagher, J.L.; Takata, M.; Gonçalves-Carneiro, D.; Keane, S.C.; Rebendenne, A.; Ong, H.; Orr, V.K.; MacDonald, M.R.; Stuckey, J.A.; Bieniasz, P.D.; et al. Structure of the zinc-finger antiviral protein in complex with RNA reveals a mechanism for selective targeting of CG-rich viral sequences. Proc. Natl. Acad. Sci. USA 2019, 116, 24303–24309. [Google Scholar] [CrossRef]
  169. Nchioua, R.; Kmiec, D.; Müller, J.A.; Conzelmann, C.; Groß, R.; Swanson, C.M.; Neil, S.J.D.; Stenger, S.; Sauter, D.; Münch, J.; et al. SARS-CoV-2 Is Restricted by Zinc Finger Antiviral Protein despite Preadaptation to the Low-CpG Environment in Humans. mBio 2020, 11, 10–128. [Google Scholar] [CrossRef]
  170. Yap, Y.L.; Zhang, X.W.; Danchin, A. Relationship of SARS-CoV to other pathogenic RNA viruses explored by tetranucleotide usage profiling. BMC Bioinform. 2003, 4, 43. [Google Scholar] [CrossRef]
  171. Greenbaum, B.D.; Levine, A.J.; Bhanot, G.; Rabadan, R. Patterns of evolution and host gene mimicry in influenza and other RNA viruses. PLoS Pathog. 2008, 4, e1000079. [Google Scholar] [CrossRef]
  172. Greenbaum, B.D.; Rabadan, R.; Levine, A.J. Patterns of oligonucleotide sequences in viral and host cell RNA identify mediators of the host innate immune system. PLoS ONE 2009, 4, e5969. [Google Scholar] [CrossRef]
  173. Atkinson, N.J.; Witteveldt, J.; Evans, D.J.; Simmonds, P. The influence of CpG and UpA dinucleotide frequencies on RNA virus replication and characterization of the innate cellular pathways underlying virus attenuation and enhanced replication. Nucleic Acids Res. 2014, 42, 4527–4545. [Google Scholar] [CrossRef]
  174. Xia, X. Extreme genomic CpG deficiency in SARS-CoV-2 and evasion of host antiviral defense. Mol. Biol. Evol. 2020, 37, 2699–2705. [Google Scholar] [CrossRef]
  175. Wei, Y.; Silke, J.R.; Aris, P.; Xia, X. Coronavirus genomes carry the signatures of their habitats. PLoS ONE 2020, 15, e0244025. [Google Scholar] [CrossRef] [PubMed]
  176. Betney, R.; de Silva, E.; Krishnan, J.; Stansfield, I. Autoregulatory systems controlling translation factor expression: Thermostat-like control of translational accuracy. RNA 2010, 16, 655–663. [Google Scholar] [CrossRef] [PubMed]
Figure 1. Fitted nonlinear equations to the observed data (blue dots). (A) Relationship between Nrrn and RankGT in Table 2. (B) Relationship between NtRNA and RankGT in Table 2.
Microorganisms 12 00768 g001
Figure 2. Selection for codon optimization, measured by ranked D I T E   ( = I ¯ T E . H E G I ¯ T E . R E S T ) in Equation (7), decreases with increasing generation time in nine bacterial species.
Microorganisms 12 00768 g002
Figure 3. The ranked effective number of anticodons (Rank NAC) increases with ranked generation time (RankGT) in (A), and decreases with increasing codon adaptation (Rank D I T E ) in (B).
Microorganisms 12 00768 g003
Figure 4. Change in MFE (minimum folding energy) over a sliding window of 40 nt in HEGs of the nine bacterial species (one sub-figure for each species). The start codon occupies sites 61–63. The mid-window site (horizontal axis) indicates the middle of the sliding window of 40 nt. The middle blue curve is the mean MFE of all HEGs (e.g., each point in the mean curve for V. nitriegens is the average of 76 HEGs). The two curves above and below the mean curve are the 95% upper and lower limits (UL and LL).
Microorganisms 12 00768 g004
Figure 5. Dramatic reduction in nucleotide C near the Shine–Dalgarno sequence (shaded). Plotted are position weight matrix (PWM) scores in sequences immediately upstream of the start codon (at sites 61–63) in HEGs (A) and REST genes (B) in Bacillus subtilis, and in HEGS (C) and REST genes (D) in Vibrio cholerae.
Microorganisms 12 00768 g005
Figure 6. Changes in nucleotide frequencies in sequences immediately upstream of the start codon (at sites 61–63) in highly expressed genes (HEGs). Note the sharp increase in nucleotide G and concurrent decrease in nucleotides C and U near site 50 corresponding to the Shine–Dalgarno (SD) sequence (shaded). (A) AT-rich H. influenzae. (B) GC-rich M. smegmatis.
Microorganisms 12 00768 g006
Figure 7. Change in MFE (minimum folding energy) over a sliding window of 40 nt in HEGs of the nine bacterial species. The stop codon occupies sites 58–60. Other annotations are identical to those in Figure 4.
Microorganisms 12 00768 g007
Table 1. Nine species with complete genomes and well-documented generation times (GTs) under optimal growth conditions.
SpeciesAccession (1)OGT (2)GT (3)Rank (4)Ref. (5)
Vibrio natriegensNZ_CP009977, NZ_CP009978.137 °C10 min.1[100,101]
Vibrio choleraeNZ_CP043554, NZ_CP043556.137 °C16–20 min.2[102]
Escherichia coliNC_000913.337 °C20–30 min.3[103]
Bacillus subtilisNC_000964.337 °C30–70 min.4[104]
Haemophilus influenzaeNZ_CP007470.137 °C103–107 min.5[105]
Mycolicibacterium smegmatisNZ_CP054795.137 °C~2 h6[106]
Mycobacterioides abscessusNZ_CP034181.136 °C4–5 h7[107]
Mycobacterium tuberculosisNC_000962.337 °C20–30 h8[15,108,109]
M. lepraeNZ_CP029543.130 °C7 days9[15,110]
(1) GenBank accession number. (2) Optimal growth temperature. (3) Generation time under optimal growth conditions. (4) Ranking of generation time from smallest to largest. (5) References pertaining to the generation time.
Table 2. Short generation times are associated with increased genomic investment in ribosomal RNA and tRNA.
SpeciesGT (1)LGenome (2)NCDS (3)Nrrn (4)NtRNA (5)
Vibrio natriegens15,175,153449611129
Vibrio cholerae24,089,299362810102
Escherichia coli34,641,6524298786
Bacillus subtilis44,215,60642371086
Haemophilus influenzae51,846,2591714659
Mycolicibacterium smegmatis66,993,8716540347
Mycobacterioides abscessus75,067,2314938147
Mycobacterium tuberculosis84,411,5323905145
Mycobacterium leprae93,187,1122328145
(1) Ranking of generation times from the shorted to the longest. (2) Genome length. The two Vibrio species each have two chromosomes. The genome length is the sum of the two chromosomes. (3) Number of protein-coding genes. (4) Number of rrn operons in the genome. (5) Number of tRNA genes in the genome.
Table 3. Start codon usage and percentage of AUG (AUG%) in highly expressed protein-coding genes (HEGs) and the rest of the protein-coding genes (REST).
SpeciesHEGsREST
AUGGUGYUG (1)NHEG (2)AUG%AUGGUGYUG (1)AUH (1)NREST (2)AUG%
V. natriegens71327693.42397629712415441290.12
V. cholerae70337692.11316625313118356888.73
E. coli69317394.523805335814422590.06
B. subtilis58536687.8832253825559417177.32
H. influenzae68117097.141554512810164394.58
M. smegmatis541807275.004255199818726646665.81
M. abscessus531416877.943255145814514487266.81
M. tuberculosis491306279.03235713061774384461.32
M. leprae481636771.64116278227643226351.35
(1) YUG includes CUG and UUG; AUH includes AUA, AUC, and AUU. (2) NHEG: the number of highly expressed genes; HREST: the number of all other genes not in the HEG group.
Table 4. The percentage of AUG codons (AUG%) acting as start codons depends on the generation time (RankGT), genomic GC content (GC%), and gene expression (GE).
SpeciesAUG%RankGTGC%GE
V. natriegens93.4211145.0HEG
V. cholerae92.1053247.3HEG
E. coli94.5205350.8HEG
B. subtilis87.8788443.5HEG
H. influenzae97.1429538.2HEG
M. smegmatis75.0000667.4HEG
M. abscessus77.9412764.1HEG
M. tuberculosis79.0323865.6HEG
M. leprae71.6418957.8HEG
V. natriegens90.1179145.0REST
V. cholerae88.7332247.3REST
E. coli90.0592350.8REST
B. subtilis77.3196443.5REST
H. influenzae94.5831538.2REST
M. smegmatis65.8058667.4REST
M. abscessus66.8103764.1REST
M. tuberculosis61.3163865.6REST
M. leprae51.3478957.8REST
Table 5. Regression analysis of data in Table 4, with AUG% as the dependent variable, and ranked generation time (RankGT), genomic GC content (GC%), and gene expression (with HEG and REST encoded as 0 and 1, respectively) as the independent variables.
CoefficientStandard Errort Statp-Value
Intercept125.855288.6027214.629700.00000
RankGT−2.538630.76412−3.322290.00503
GC%−0.520690.19491−2.671470.01825
GE−9.176742.94435−3.116730.00758
Table 6. Regression analysis of the impact of UAA% on three independent variables: ranked generation time (RankGT), genomic GC content (GC%), and gene expression (with HEG and REST encoded as 0 and 1, respectively).
CoefficientStandard Errort Statp-Value
Intercept197.9487511.4808017.241720.00000
RankGT−3.779351.01976−3.706110.00235
GC%−2.218760.26012−8.529920.00000
GE−17.353263.92940−4.416270.00059
Table 7. Differences in mean ITE values between HEGs and REST genes ( D I T E ) for the nine bacterial species at different generation times (RankGT).
SpeciesRankGT D I T E Rank   D I T E
V. natriegens10.25169
V. cholerae20.23806.5
E. coli30.24658
B. subtilis40.23806.5
H. influenzae50.20925
M. smegmatis60.12663
M. abscessus70.18064
M. tuberculosis80.02671
M. leprae90.06892
Table 8. The effective number of anticodons (NAC and its ranked NAC) increases with ranked generation time (RankGT).
SpeciesRankGTNACRank NAC
V. natriegens140.21291
V. cholerae244.28022
E. coli349.01274
B. subtilis445.85313
H. influenzae550.43055
M. smegmatis659.06677
M. abscessus758.81536
M. tuberculosis859.37448.5
M. leprae959.37448.5
Table 9. Secondary structural stability (measured by MeanMFE) is expected to change with generation time (RankGT), GC%, and gene expression (GE).
SpeciesRankGTGC%GEMeanMFE
V. natriegens142.8557HEG−4.2351
V. cholerae243.7813HEG−4.0721
E. coli346.5955HEG−4.2153
B. subtilis438.7556HEG−3.7484
H. influenzae537.9329HEG−3.2660
M. smegmatis660.4224HEG−6.4462
M. abscessus760.4048HEG−5.5966
M. tuberculosis861.5043HEG−6.2934
M. leprae956.5344HEG−5.7794
V. natriegens140.4234REST−3.5238
V. cholerae243.3125REST−4.0330
E. coli345.6418REST−4.4059
B. subtilis438.6014REST−3.7406
H. influenzae533.7986REST−2.5466
M. smegmatis663.6954REST−8.6708
M. abscessus761.2667REST−8.3538
M. tuberculosis863.0856REST−9.1141
M. leprae957.1858REST−7.9865
Table 10. Regression output based on data in Table 9, with GE encoded as a binary dummy variation (0 for HEG and 1 for REST). “GC%* GE” is the interaction term.
CoefficientsStandard Errort Statp-Value
Intercept0.574080.612650.937040.36582
RankGT−0.083820.04142−2.023860.06404
GC%−0.100380.01414−7.097560.00001
GE4.460400.753155.922360.00005
GC%*GE−0.109720.01483−7.396730.00001
Disclaimer/Publisher’s Note: The statements, opinions and data contained in all publications are solely those of the individual author(s) and contributor(s) and not of MDPI and/or the editor(s). MDPI and/or the editor(s) disclaim responsibility for any injury to people or property resulting from any ideas, methods, instructions or products referred to in the content.

