Article

Distribution Characteristics of Nitrogen-Cycling Microorganisms in Deep-Sea Surface Sediments of Western South China Sea

by
Xingjia Yin
1,2,3,
Hui Chen
1,2,
Kaixi Jiang
1,2,4,
Boda Zhang
1,2,5,
Ruohong Li
6,
Xinzhe Zhu
6,
Lianpeng Sun
6,
Zhi Lin Ng
1,2 and
Ming Su
1,2,*
1
School of Marine Sciences, Sun Yat-Sen University & Southern Marine Science and Engineering Guangdong Laboratory (Zhuhai), Zhuhai 519082, China
2
Guangdong Provincial Key Laboratory of Marine Resources and Coastal Engineering, Zhuhai 519082, China
3
College of Life Science and Technology, Hubei Engineering University, Xiaogan 432000, China
4
Office of Laboratory Safety and Equipment Management, Beijing Normal University, Zhuhai 519087, China
5
Center for Environmental Monitoring of Geology, Shenzhen 518034, China
6
School of Environmental Science and Engineering, Sun Yat-sen University, Guangzhou 510006, China
*
Author to whom correspondence should be addressed.
Microorganisms 2024, 12(9), 1901; https://doi.org/10.3390/microorganisms12091901
Submission received: 19 August 2024 / Revised: 11 September 2024 / Accepted: 11 September 2024 / Published: 16 September 2024
(This article belongs to the Section Environmental Microbiology)

Abstract

:
Nitrogen-cycling processes in the deep sea remain understudied. This study investigates the distribution of nitrogen-cycling microbial communities in the deep-sea surface sediments of the western South China Sea, using metagenomic sequencing and real-time fluorescent quantitative PCR techniques to analyze their composition and abundance, and the effects of 11 environmental parameters, including NH4+-N, NO3-N, NO2-N, PO43−-P, total nitrogen (TN), total organic carbon (TOC), C/N ratio, pH, electrical conductivity (EC), SO42−, and Cl. The phylum- and species-level microbial community compositions show that five sites can be grouped as a major cluster, with sites S1 and S9 forming a sub-cluster, and sites S13, S19, and S26 forming the other; whereas sites S3 and S5 constitute a separate cluster. This is also evident for nitrogen-cycling functional genes, where their abundance is influenced by distinct environmental conditions, including water depths (shallower at sites S1 and S9 against deeper at sites S13, S19, and S26) and unique geological features (sites S3 and S5), whereas the vertical distribution of nitrogen-cycling gene abundance generally shows a decreasing trend against sediment depth. Redundancy analysis (RDA) exploring the correlation between the 11 environmental parameters and microbial communities revealed that the NO2-N, C/N ratio, and TN significantly affect microbial community composition (p < 0.05). This study assesses the survival strategies of microorganisms within deep-sea surface sediments and their role in the marine nitrogen cycle.

1. Introduction

Seabed sediments are the largest microbial habitat on Earth, and extreme conditions such as high pressure, low temperature, and lack of oxygen in the deep-sea environment provide unique habitats for the survival of marine organisms. Nitrogen, as one of the biogenic elements in the marine environment, forms the material foundation for the survival of marine microorganisms [1,2]. In most oceanic regions, the availability of nitrogen is a crucial factor limiting primary productivity and the output of organic matter [3]. The evolution of geochemical and microbial processes over 3 billion years has kept the marine nitrogen cycle basically in equilibrium [4]. However, the rapid development of modern industry and agriculture has brought nitrogen-rich water bodies into the ocean worldwide, resulting in marine eutrophication, formation of substantial marine anoxic zones and other environmental problems [3]. Such anthropogenic ocean nitrogen imbalances can have significant impacts on marine ecosystem health, biodiversity, and climate change [5]. In recent decades, the discovery of new nitrogen-cycling processes has dramatically enriched the study of the marine nitrogen cycle. Still, it has also challenged the traditional view that the marine nitrogen reservoir is in a steady state [6].
The marine nitrogen cycle is a multi-biogeochemical process mediated by microorganisms, mainly including marine nitrogen fixation, transformations of nitrogen forms (nitrification, assimilatory and dissimilatory nitrate reduction to ammonia), and nitrogen loss (denitrification and anammox) [6,7]. Affected by the difference in seawater properties and regional environments in different periods, sediments show different vertical geochemical properties [8,9], and this vertical gradient of sediments becomes an ideal object for the study of microbial niche differentiation for the nitrogen cycle [10,11,12]. Current research shows that nitrogen-cycling microorganisms in marine sediments also exhibit vertical distribution differentiation. In the West Philippine Basin (water depth 4941.9 m), the abundance of denitrifying genes (nirS, nirK, and nosZ) peaked at 0–5 cm of the surface layer sediments that decreased with depth [10]. In the Ogasawara Trench sediments (water depth 9860 m), the abundance of the anammox gene increased from 1.8 × 10⁵ copies mL−1 at the surface layer (5 cm) to 1.2 × 10⁶ copies mL−1 at 15 cm, then decreased to 104 copies mL−1 at 25 cm depth [11]. Most studies indicated that the abundance of nitrogen-cycling microorganisms declines with increasing sediment depth. However, in a Mid-Atlantic Ridge 50 m sediment core, AOA amoA, nirS and nosZ genes exhibited increased abundance at specific sediment depths [12]. This suggests that microorganisms might have different ecological niches in the vertical space. Strengthening the research on microbial communities in vertical surface sediments can provide deeper insights into the nitrogen-cycling processes in marine sediments.
Previously, it was thought that the factors limiting the nitrogen-cycling biosphere in deep-sea sediments were due to the lack of nutrients and energy substrates. With the increasing exploration of marine environments, other aspects such as the dissolved oxygen, temperature, pressure, pH, salinity, and sediment porosity were found to be limiting factors [13,14,15]. The seafloor is rich in fluid activity, such as pockmarks, mud volcanoes, and hydrocarbon seeps, which can bring nitrogen-cycling microorganisms from deeper to shallower layers. This process results in the formation of new community compositions and competition mechanisms in the shallower layers [16,17,18]. Under the stress of extreme environments in the deep ocean, nitrogen-cycling microorganisms have developed various adaptive mechanisms.
It is recognized that the microbial nitrogen cycle in marine sediments at different sediment depths plays an important role in the global material cycle and shows great vertical differentiation [19,20,21]. This study focuses on the microbial nitrogen cycle system in the columnar sediments of the western South China Sea, which provides new insights into the cycle process and ecological evolution of nitrogen-cycling microorganisms in deep-sea sediments through molecular biological methods through, firstly, exploring the community abundance, composition and functional distribution characteristics of nitrogen-cycling microorganisms in the deep sea at the vertical depth of surface sediments; secondly, clarifying the ecological status of nitrogen-cycling microorganisms in the biogeochemical cycle process of the deep sea; and thirdly, revealing the key environmental factors that affect the community composition. The vertical differentiation of nitrogen-cycling microorganisms is explained from the perspective of environmental science, providing important basic data and references for further exploring the global process of the marine nitrogen cycle.

2. Materials and Methods

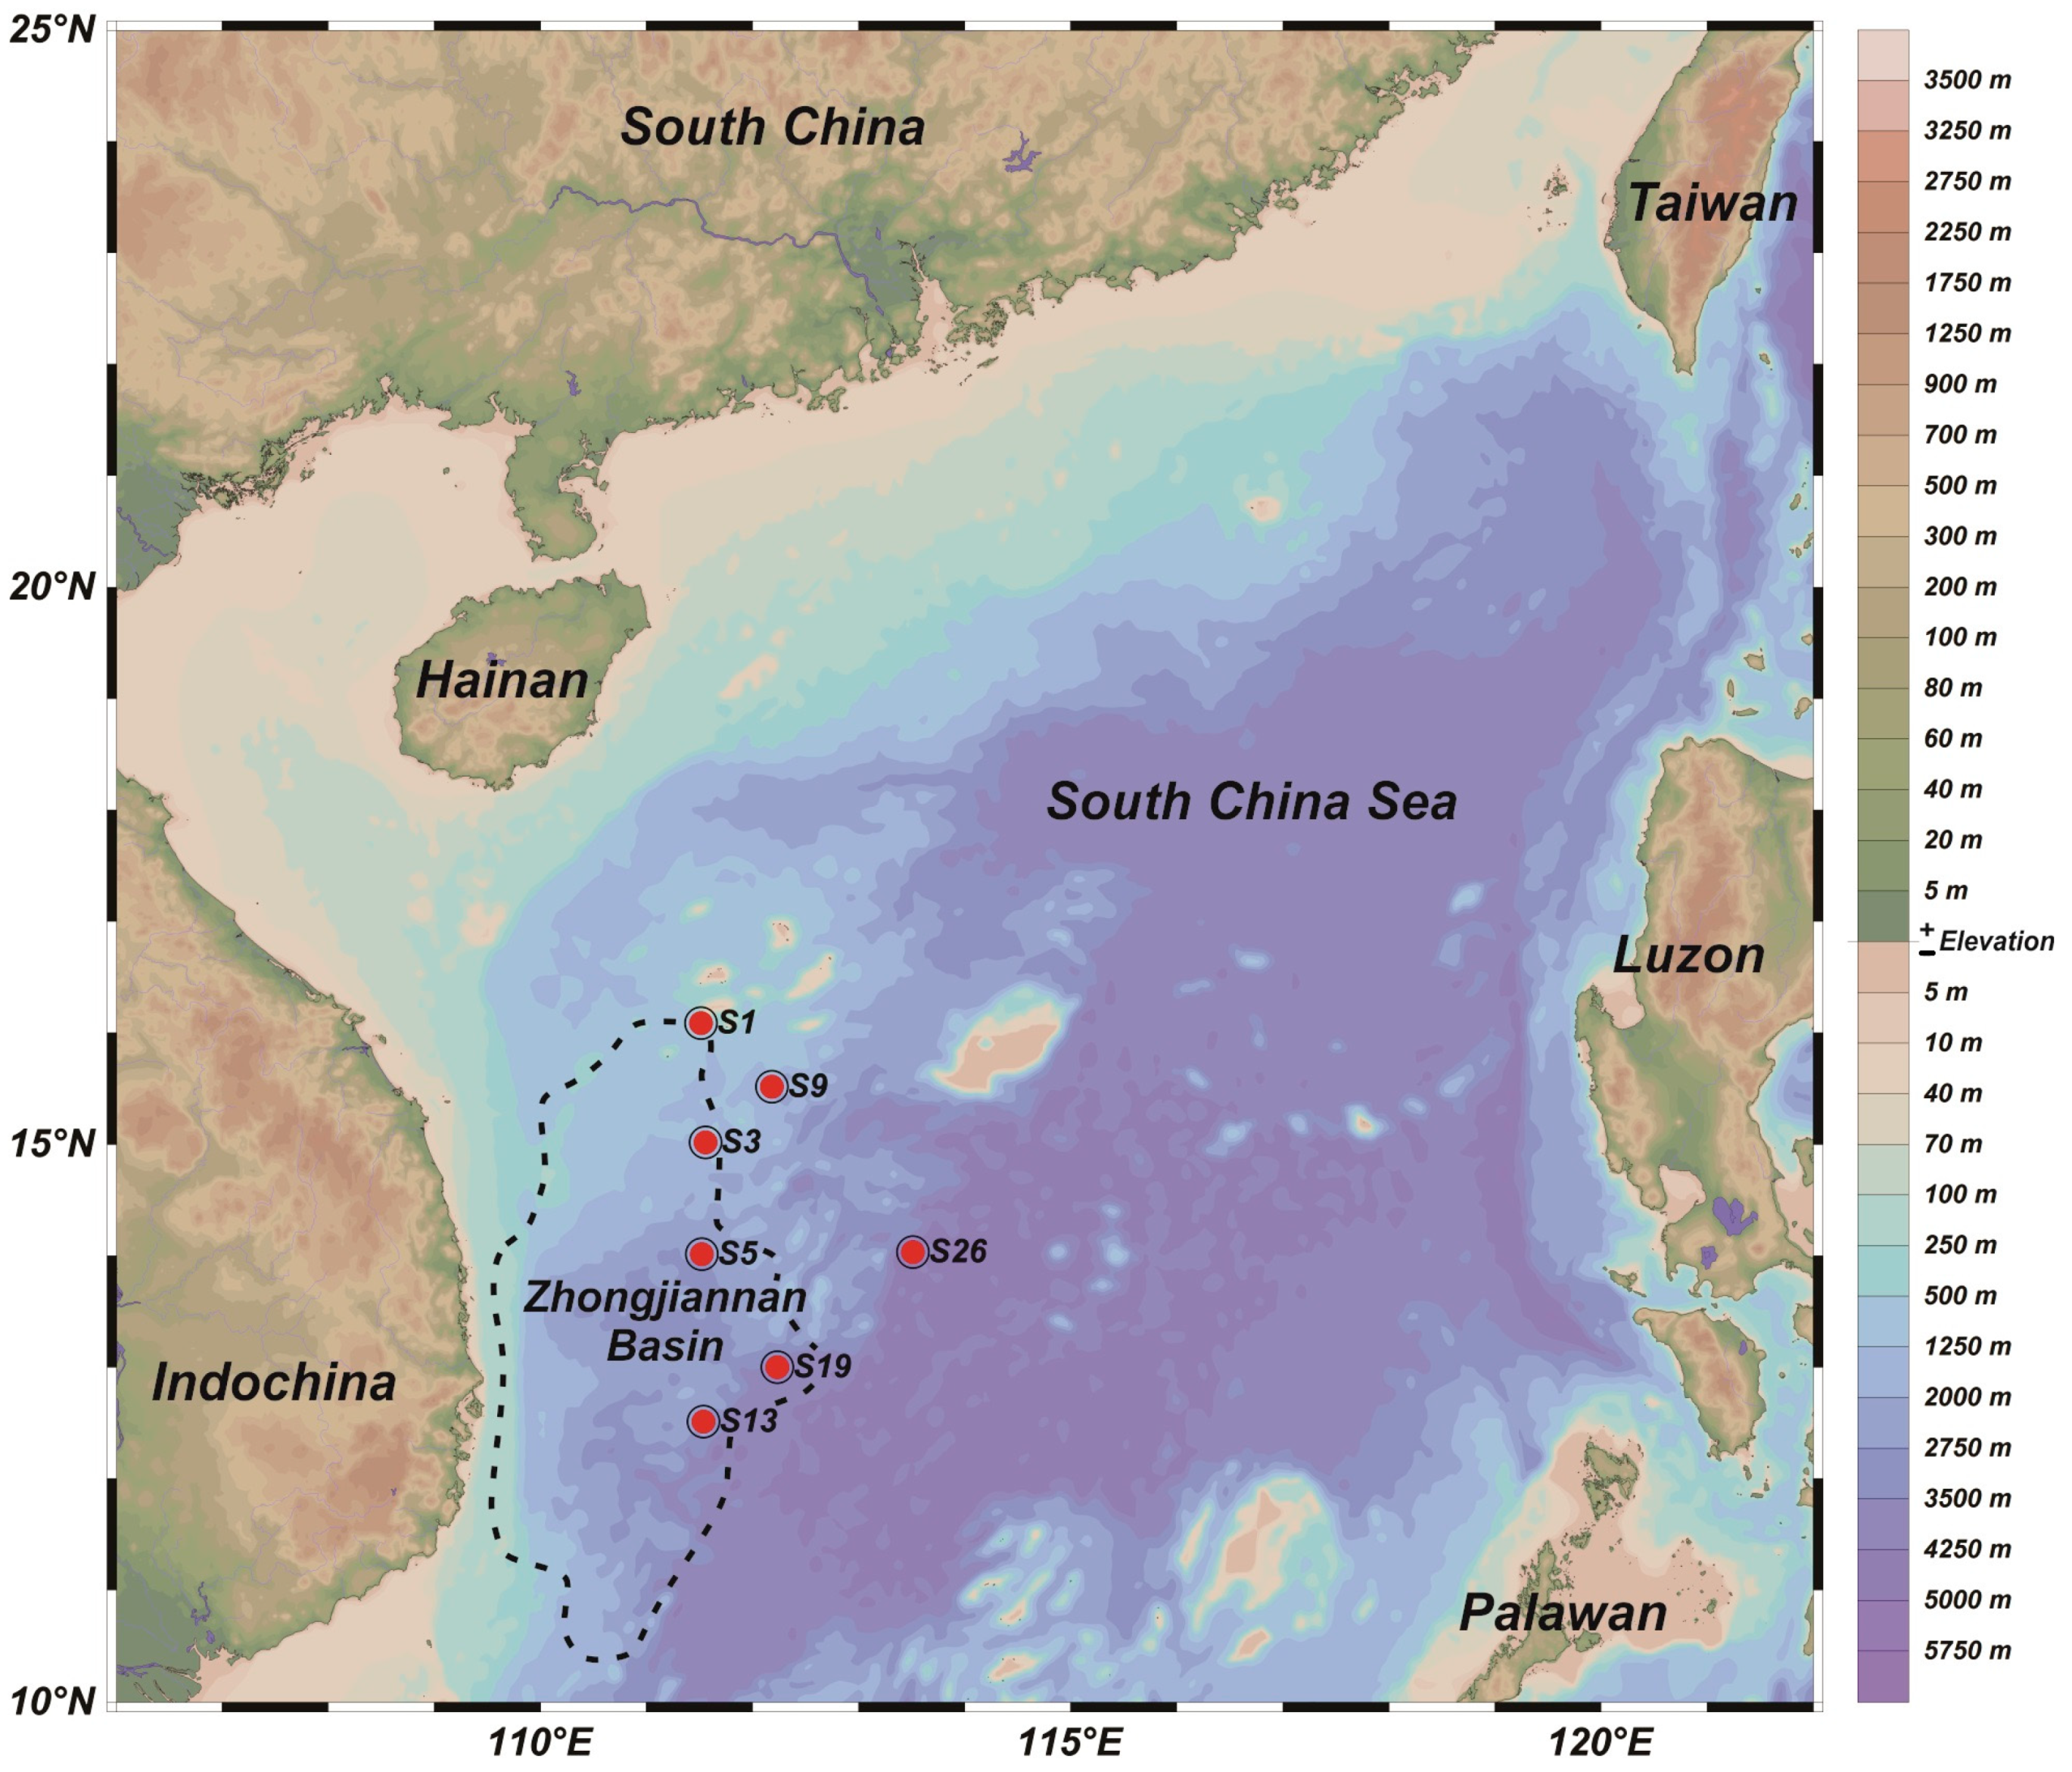
2.1. Sampling Site Description and Sample Collection

From the 10th to 23th of August 2021, seven gravity cores were collected from the Zhongjiannan Basin, located in the western South China Sea, using a gravity piston sampler aboard RV Xiangyanghong 03. The distribution of the sampling sites is shown in Figure 1 and Table 1. After the sampling operation was completed, the sediment samples were stored in the sample room at −20 °C until they were transported back to the laboratory. One portion of each sample was stored at 4 °C for the environmental parameter determinations, and another portion was stored at −80 °C for DNA extraction. To study the variation of nitrogen-cycling function gene abundance in the surface sediments at different water depths, sediments from the top 30 cm were selected and sampled at every 2 cm, totaling 105 samples. To explore the composition of the microbial communities, metagenomic sequencing was performed on the mixed sediment samples from each site.

2.2. Environmental Parameter Analyses

The sediment samples were centrifuged at 5000 rpm for 30 min. The supernatant was then filtered through a 0.45 μm Millipore filter to obtain pore water. A total of 105 pore water samples were obtained. The concentrations of inorganic nitrogen (NH4+-N, NO3-N, NO2-N) and PO43−-P in the pore water were determined by a HP 8453 UV-visible spectrophotometer (Hewlett-Packard, Palo Alto, CA, USA). The total nitrogen (TN) content and total organic carbon (TOC) content for each sediment sample were measured using a Multi 3100 TOC/TN analyzer (Jena Analytical, Jena, Germany), and the C/N ratios were then calculated. The pH and electrical conductivity (EC) of the pore water were directly measured using a FE28-Standard pH meter (Mettler Toledo, Greifensee, Switzerland) and a FE38-Standard conductivity meter (Mettler Toledo, Greifensee, Switzerland). The concentrations of SO42− and Cl in the pore water were determined using an ICS-3000 ion chromatograph (Dionex, Temecula, CA, USA).

2.3. DNA Extraction and Metagenomic Sequencing

DNA was extracted from the sediment samples using the Fast DNA Spin Kit for Soil (MP bio, Irvine, CA, USA) according to the manufacturer’s instructions. The concentrations of the extracted DNA were measured using a Nanodrop 2000 spectrophotometer (Thermo Fisher Scientific, Waltham, MA, USA), and the quality of the DNA was assessed by 1.2% agarose gel electrophoresis. Only the DNA that met the quality standards was used for the subsequent molecular experiments, where it was subjected to metagenomic sequencing and the raw reads were generated. SeqPrep (https://github.com/jstjohn/SeqPrep accessed on 22 April 2023) and Sickle (version 1.33, https://github.com/najoshi/sickle accessed on 22 April 2023) were then used to assemble the sequences. The open reading frames (ORFs) were predicted using MetaGene software (http://metagene.cb.ku-tokyo.ac.jp/ accessed on 7 June 2022), and ORFs with a length of ≥150 bp were translated into amino acid sequences based on the NCBI database. The predicted genes were clustered using CD-HIT (version 4.8.1, http://www.bioinformatics.org/cd-hit/ accessed on 7 August 2023) software (with sequence identity ≥ 95% and coverage ≥ 90%). The longest sequence from each cluster was selected as a representative to eliminate redundancy and to enhance the sequence analysis performance, thereby constructing a non-redundant gene catalog. Using the BLASTP (version 2.2.31+, http://blast.ncbi.nlm.nih.gov/Blast.cgi accessed on 15 October 2023), homologous BLAST comparisons were conducted between the non-redundant Unigenes sequences and the NCBI-NR database, setting the threshold at an e-value ≤ 0.0001 to obtain the BLAST results. The sequencing data were uploaded to the NCBI database under BioProject number PRJNA1159479.

2.4. Quantitative Analysis of Nitrogen-Cycling Functional Genes

The QuantStudio™ 5 real-time fluorescent quantitative PCR system (ABI, Los Angeles, CA, USA) was used for quantitative analysis of nitrogen-cycling genes. The primers used in this study are listed in Table S2, and they were mixed with the SYBR® Select Master Mix (2×) kit (ABI, Los Angeles, CA, USA) to prepare a 30 μL reaction system. This amplification system included 15 μL of 2× Taqmix, 1 μL of forward primer (10 pmol μL−1), 1 μL of reverse primer (10 pmol μL−1), 1 μL of DNA template, and 12 μL of ddH2O. Plasmids were used as positive controls, and the PCR amplification products of the functional genes were purified and cloned. Positive recombinant plasmid DNA was extracted, with its concentration measured to calculate the copy number. Diluted recombinant plasmids were used as standard curves for detection with the qPCR instrument. Each PCR reaction included a negative control, and the standard curve and all the test samples were run in triplicate. In this study, the melting curve showed a single peak, with amplification efficiencies ranging from 91.56% to 102.45%, and the R2 of the standard curves ranged from 92.5% to 95.61%.

2.5. Statistical Analysis

The software IBM SPSS version 20.0 (SPSS Inc., Chicago, IL, USA) was used for the one-way analysis of variance (ANOVA) and Tukey’s test. Significance was evaluated by calculating the p-values, with p < 0.05 indicating a significant difference. Origin 9.0 (Origin Lab Corporation, Northampton, MA, USA) was used for plotting. A redundancy analysis (RDA) through the Monte Carlo permutation test with 499 permutations was conducted using the software CANOCO version 5 to reveal the interaction between gene abundance and environmental parameters, as well as to identify the primary factors that significantly affect the abundance of nitrogen-cycling genes, where the data were confirmed to follow a normal distribution by log-transformation before the Monte Carlo permutation test was performed [22,23]. The correlation network heatmap of nitrogen-cycling functional communities and environmental parameters was analyzed and plotted using the R version 4.1.3 software, with the correlation analysis conducted via the psych package version 2.4.6.26, Mantel test using the vegan package version 2.6-6.1, and visualization through the linkET package version 1.0 and ggplot2 package version 3.5.1.

3. Results

3.1. Sediment Environmental Properties

Table 2 shows the average values of the environmental parameters at all seven sites. The results of the difference analysis indicated that, except for the content of NO3-N, all the other parameters were significantly different among the sites (p < 0.05). The NH4+-N contents in the sediments at sites S5, S13, and S26 were significantly higher than at the other sites (p < 0.05), with site S13 having the highest average value (292.07 μmol L−1) and site S3 the lowest (95.68 μmol L−1). The highest NO2-N content was observed at site S5 (8.92 μmol L−1), while the lowest was at site S13 (3.43 μmol L−1). Site S13 also had the lowest NO3-N content (3.13 μmol L−1), whereas the highest NO3-N content was found at site S26 (3.13 μmol L−1). The highest PO43−-P content was observed at site S9 (459.66 μmol L−1). The lowest contents of Cl, SO42−, TOC, and TN were found at site S5, measuring 1262.35 mmol L−1, 57.74 mmol L−1, 2.66%, and 0.67%, respectively. The highest values for SO42− (120.71 mmol L−1), TOC (10.20%), and C/N ratio (6.43) were found at site S19. The highest pH value was at site S3 (7.77) and the lowest at site S26 (7.48). However, the EC of site S26 was the highest at 32.78 mS cm−1. In this study, the C/N ratios were less than 10, indicating that the organic matter mainly originated from marine sources [24].

3.2. Microbial Community Composition in Surface Sediments of Western South China Sea
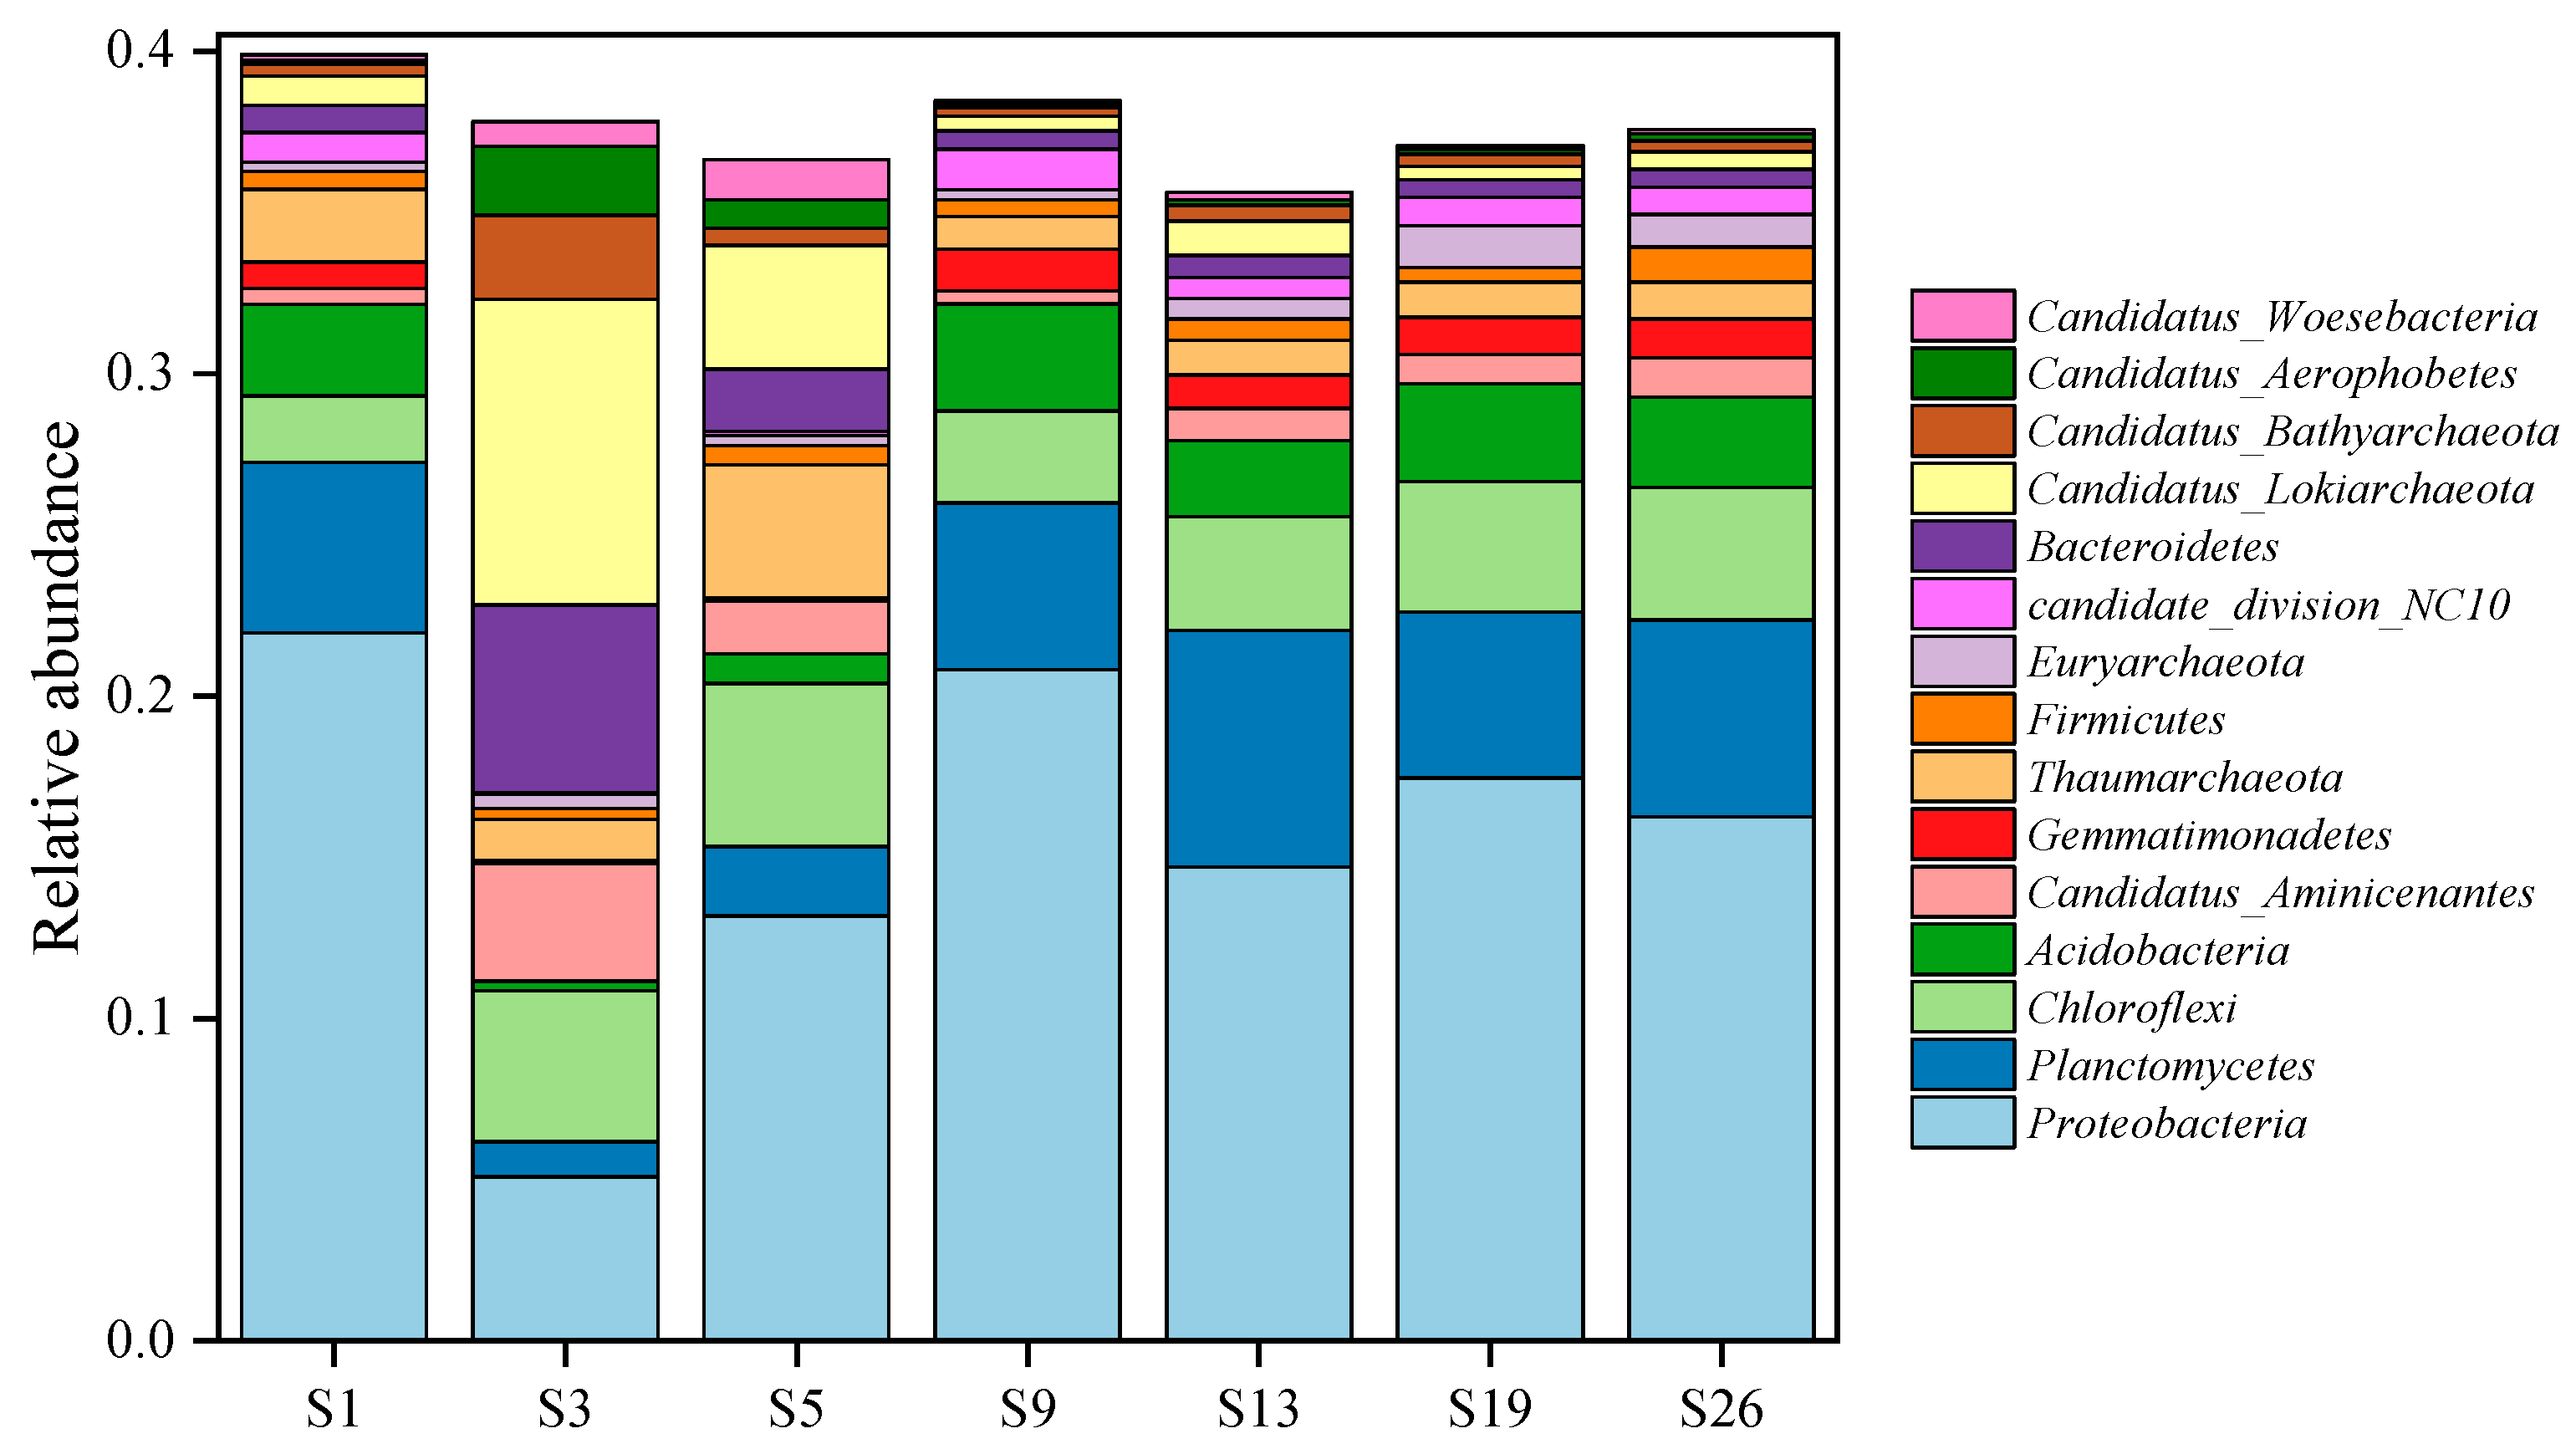
3.2.1. Phylum Level

The community composition at the phylum level in sediments from the seven sites is shown in Figure 2. In all of the samples, Proteobacteria is the dominant phylum. The community compositions of sites S1, S9, S13, S19, and S26 are similar, with Proteobacteria, Planctomycetes, Chloroflexi, and Acidobacteria being the dominant phyla. The relative abundances of Proteobacteria at these five sites are the highest, with relative abundances of 21.95%, 20.81%, 14.68%, 17.45%, and 16.25%, respectively. Among the other phyla, the relative abundances of Planctomycetes are 5.28%, 5.18%, 7.34%, 5.15%, and 6.12%; of Chloroflexi are 2.08%, 2.85%, 3.53%, 4.04%, and 4.10%; and of Acidobacteria are 2.84%, 3.33%, 2.36%, 3.04%, and 2.81%.
The community compositions at sites S3 and S5 differed noticeably from the other five sites. At site S3, the dominant phyla are Candidatus Lokiarchaeota (9.45%), Bacteroidetes (5.82%), Proteobacteria (5.07%), and Chloroflexi (4.67%). However, the dominant phyla at site S5 are Proteobacteria (13.17%), Chloroflexi (5.05%), Thaumarchaeota (4.13%), and Candidatus Lokiarchaeota (3.83%).

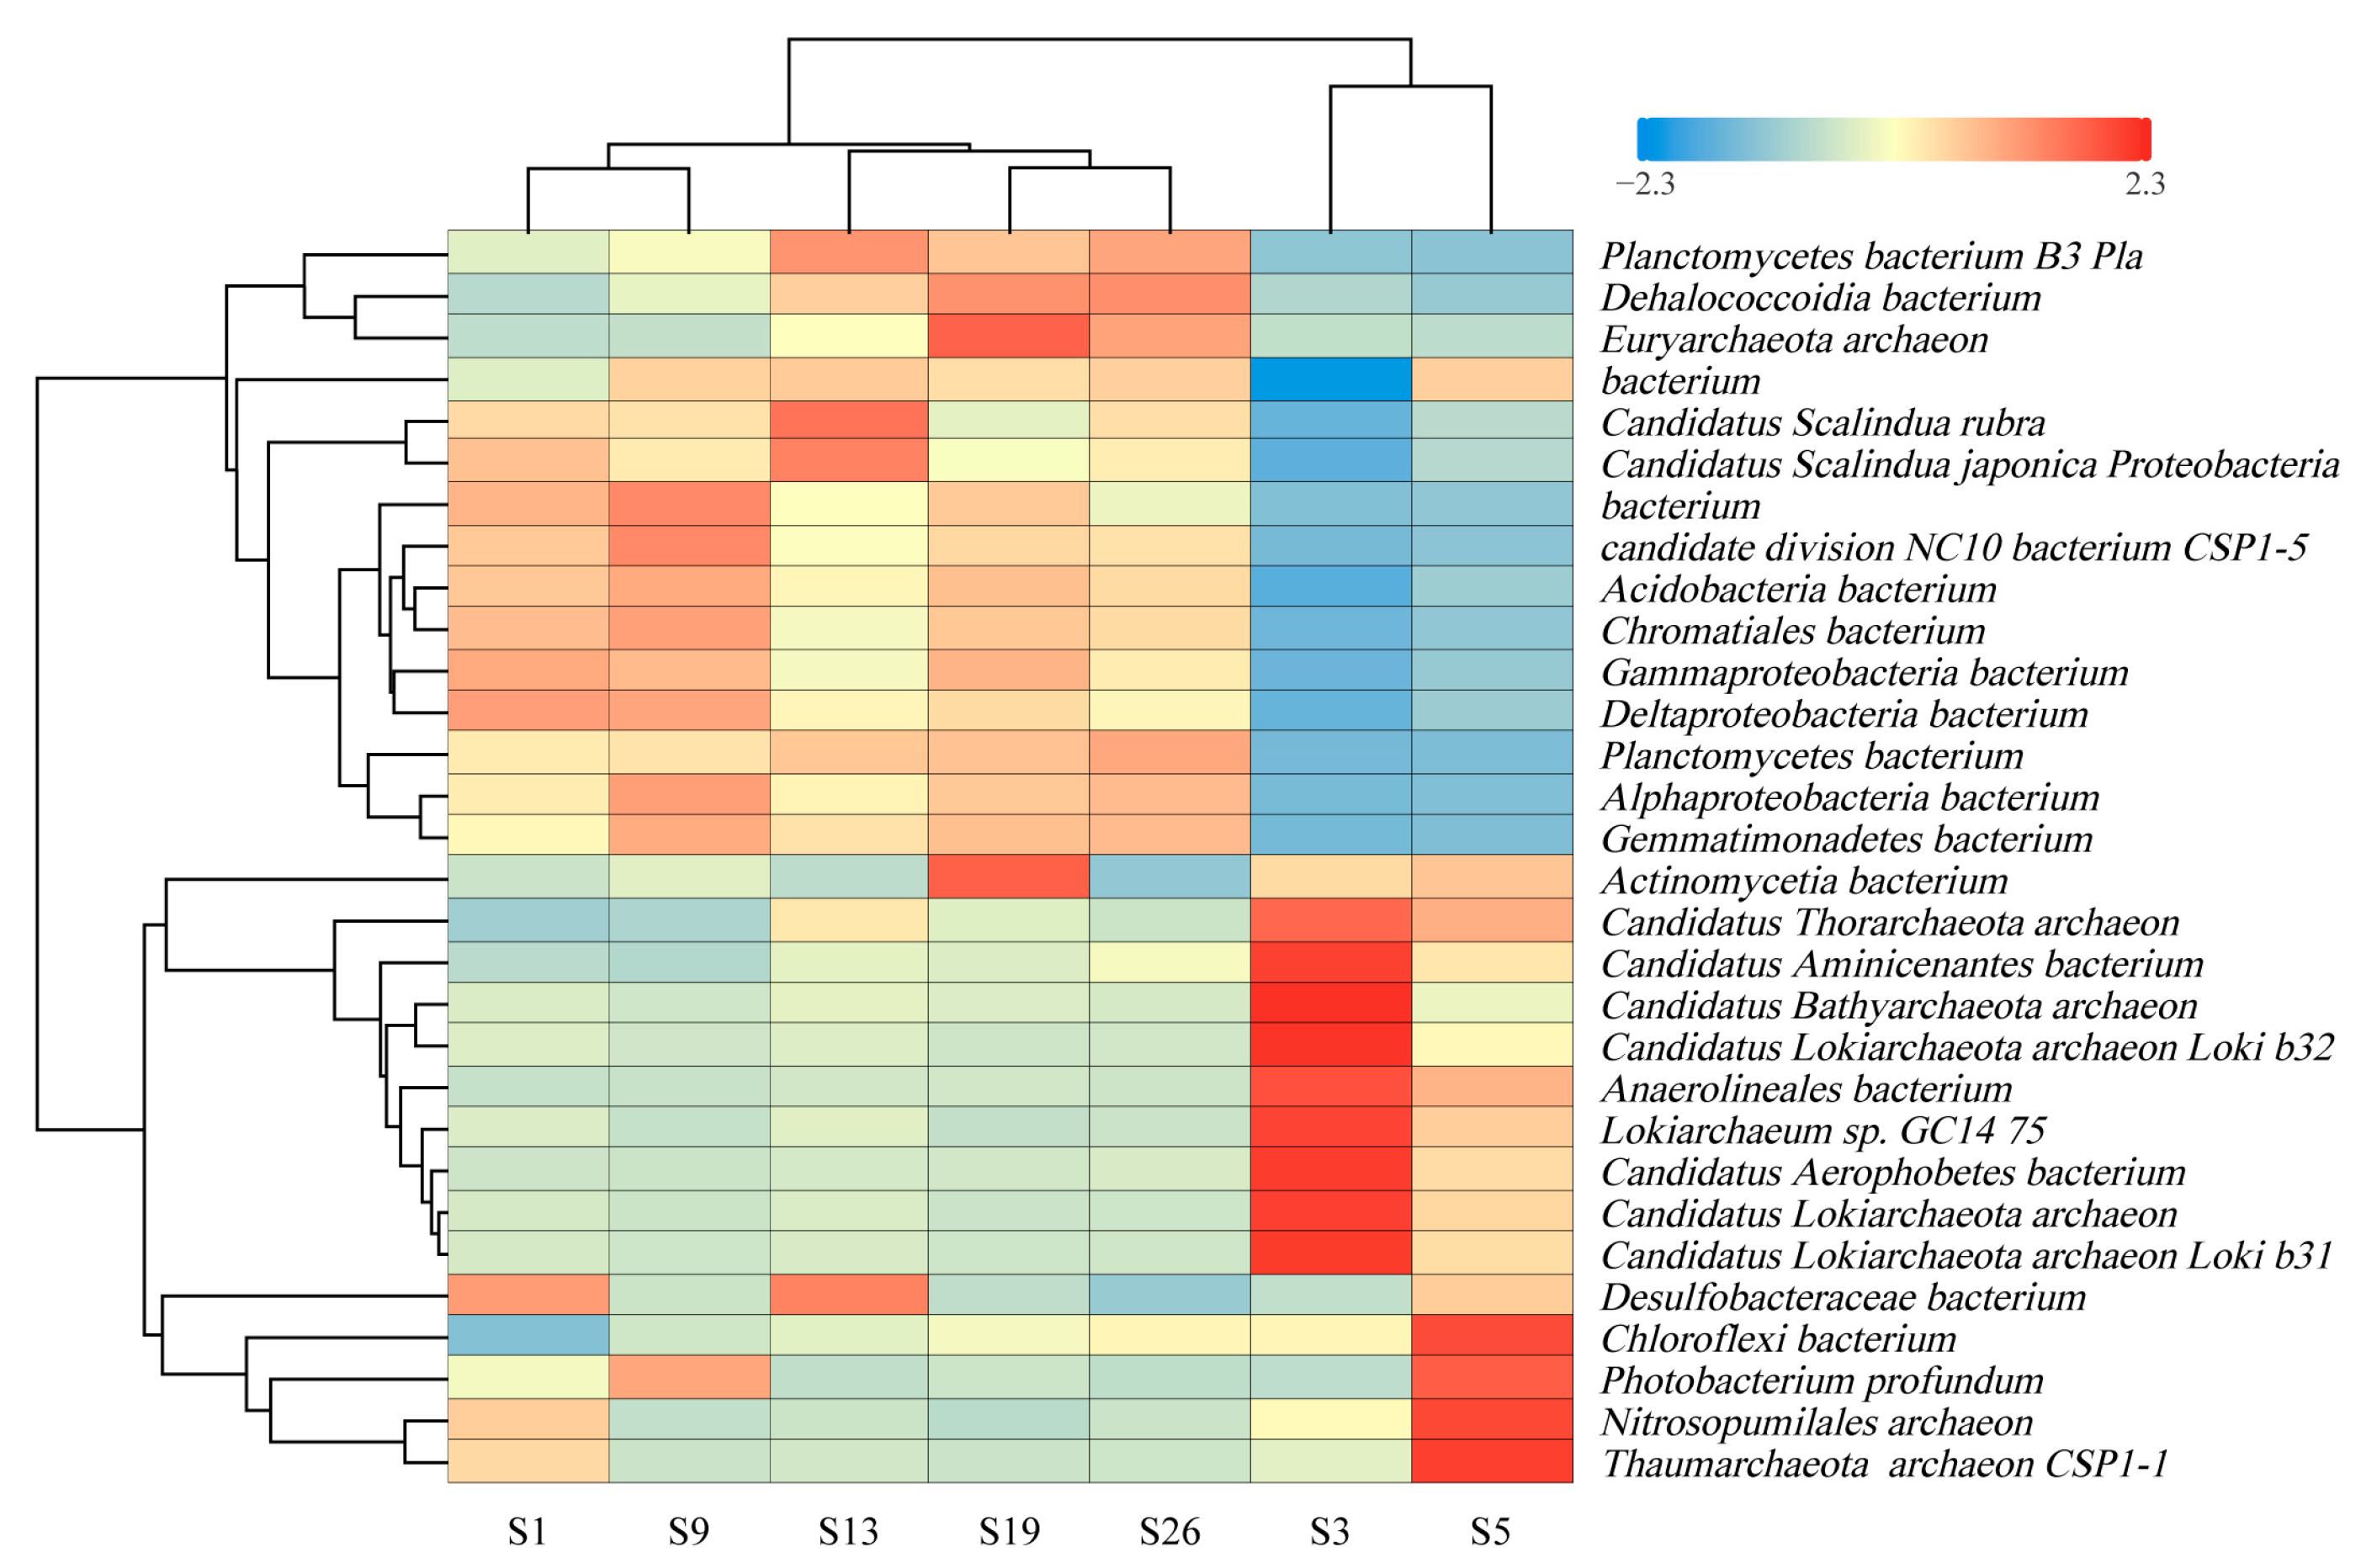
3.2.2. Species Level

The top 30 key species were selected for the generation of a hierarchical cluster heatmap (Figure 3), where the colors on the heatmap represent the relative abundance of species, with blue indicating lower abundance and red indicating higher abundance. The heatmap reveals that the species composition at sites S1, S9, S13, S19, and S26 is generally similar and belongs to a major cluster, with most of their dominant species being bacteria. When subdivided further, sites S1 and S9 form a sub-cluster, while sites S13, S19, and S26 form another sub-cluster. In contrast, the microbial communities at sites S3 and S5 are markedly different from these five sampling sites. Site S3 is primarily dominated by archaea, with the dominant species being the Lokiarchaeota archaeon. At site S5, both bacteria, such as Chloroflexi bacterium and Photobacterium profundus, and archaea, such as Nitrosopumilales and Thaumarchaeota CSP1-1, are dominant.

3.3. Nitrogen-Cycling Genes Abundance in Deep-Sea Surface Sediments of Western South China Sea

3.3.1. Nitrogen Fixation

The abundance of the nifH gene ranged from 1.98 × 10³ to 7.17 × 10⁶ copies g−1 dry sediment (Figure 4), and the average abundance at sites S1, S3, S5, S9, S13, S19 and S26 was, respectively, 6.81 × 10⁵, 1.69 × 10⁵, 1.40 × 10⁵, 3.91 × 10⁵, 2.76 × 10⁴, 3.31 × 10⁴ and 1.81 × 10⁴ copies g−1 dry sediment, with the highest abundance at site S1 and the lowest abundance at site S26. Overall, the abundance levels were relatively low, with higher levels at sites S1, S3, S5 and S9 compared to sites S13, S19 and S26.

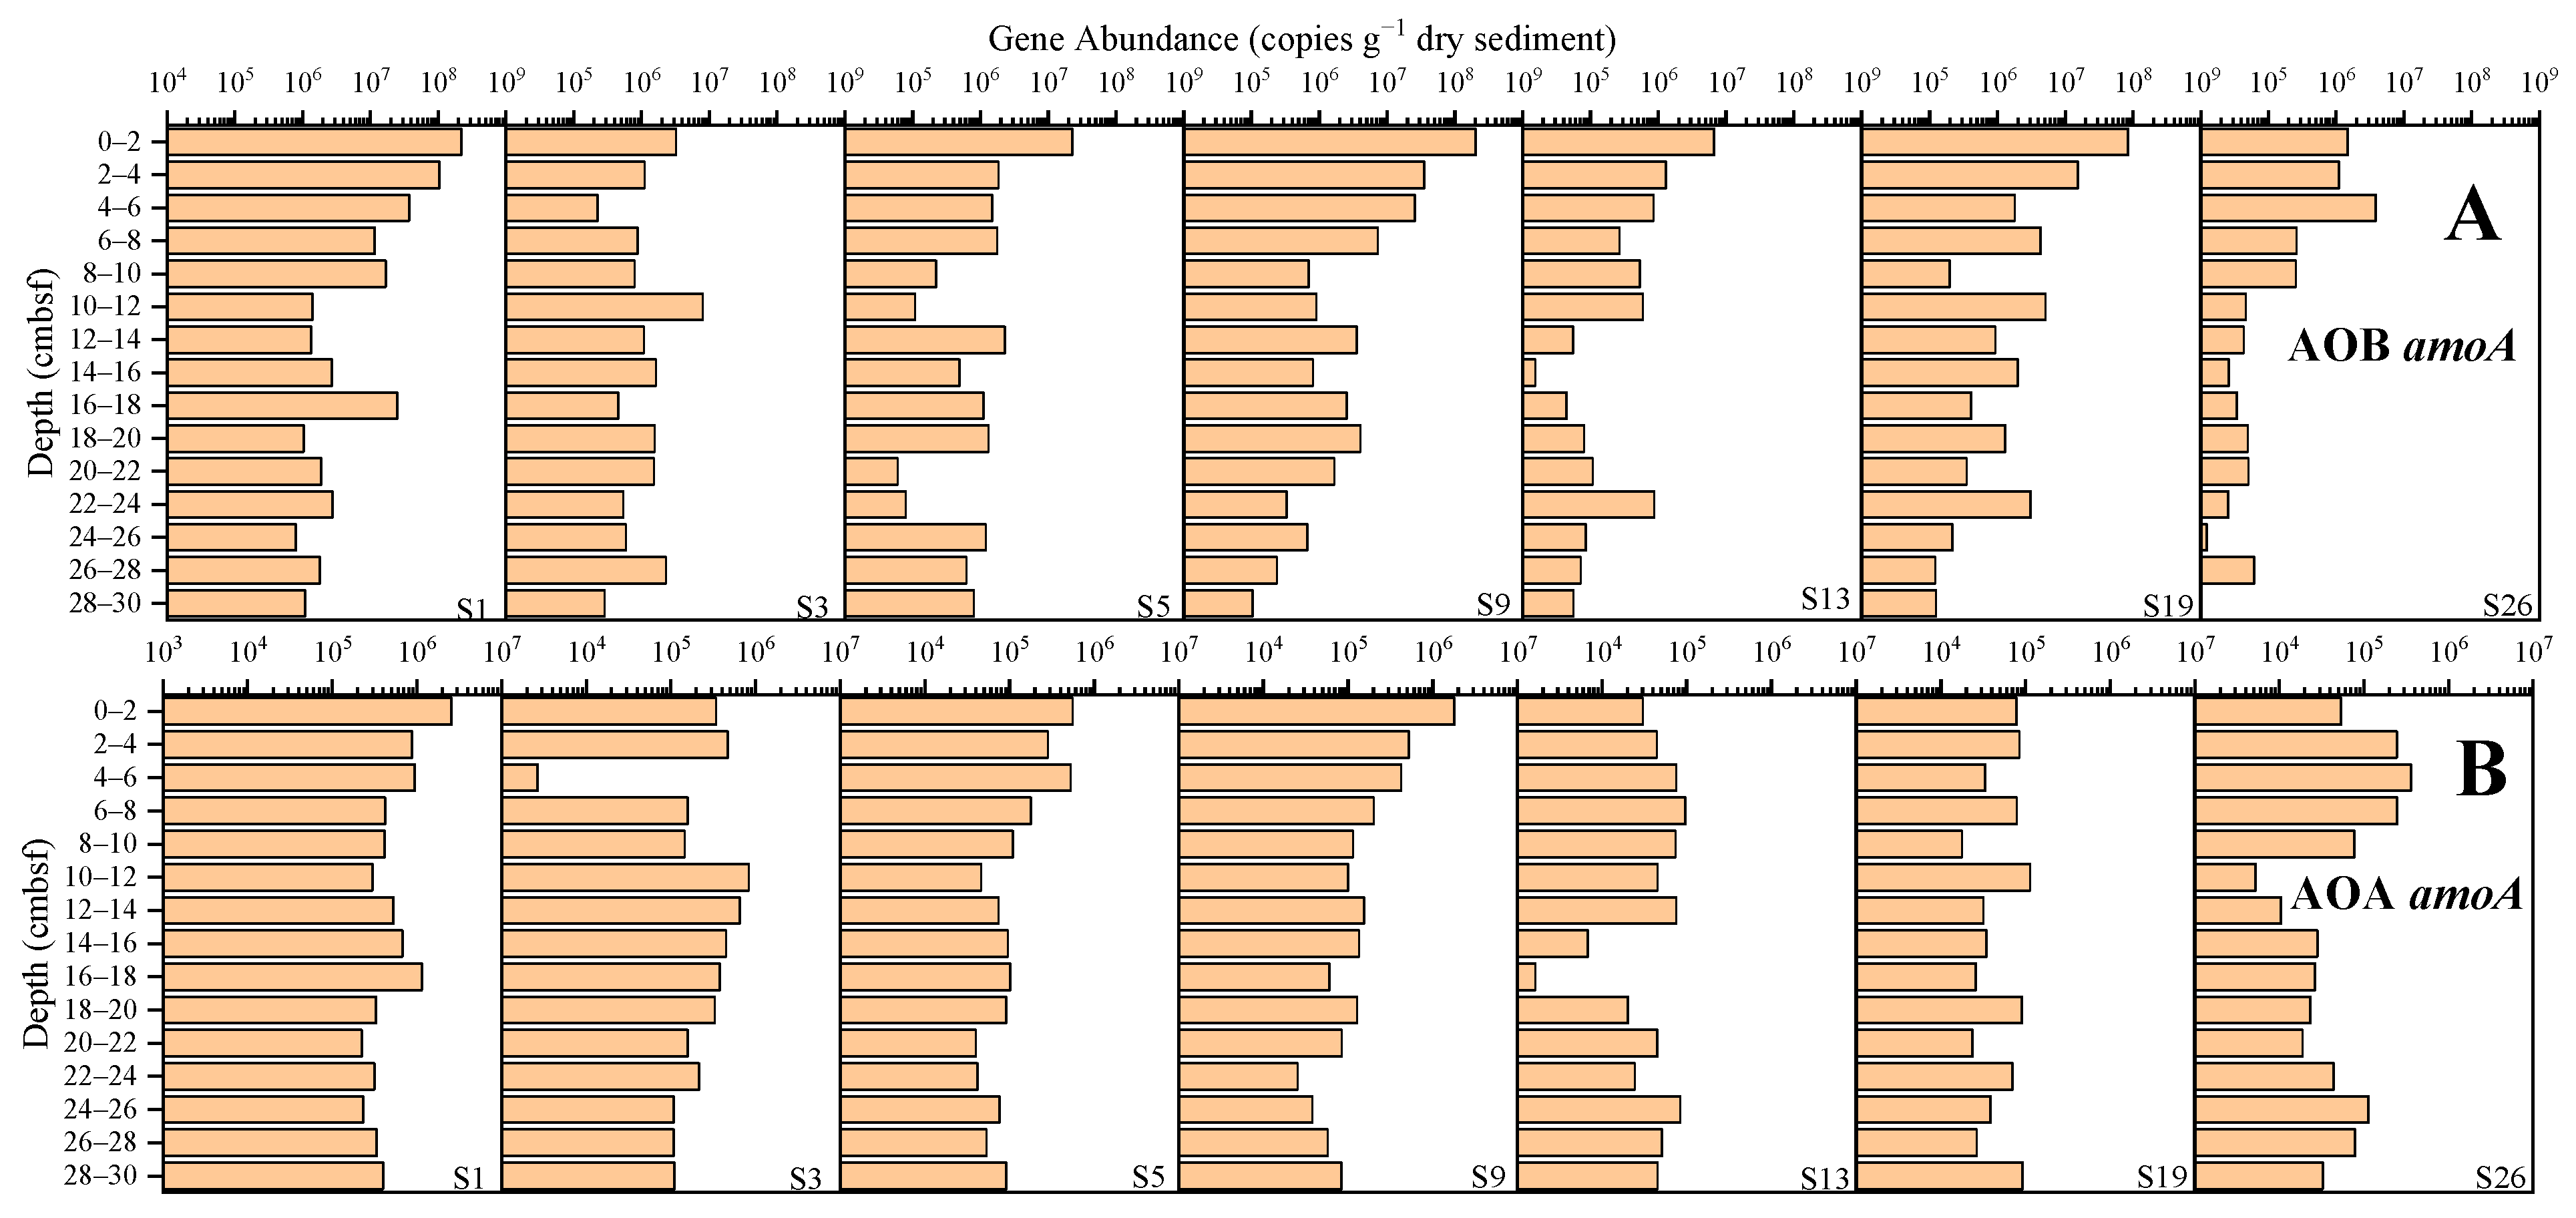
3.3.2. Nitrification

The abundance of the AOB amoA gene ranged from 6.68 × 10³ to 2.18 × 10⁸ copies g−1 dry sediment (Figure 5A), and the average abundance at sites S1, S3, S5, S9, S13, S19 and S26 was, respectively, 2.85 × 10⁷, 1.61 × 10⁶, 2.41 × 10⁶, 1.90 × 10⁷, 7.71 × 10⁵, 7.89 × 10⁶ and 4.88 × 10⁵ copies g−1 dry sediment, with site S1 having the highest abundance and site S26 the lowest abundance. The abundance of the AOA amoA gene ranged from 1.63 × 10³ to 2.56 × 10⁶ copies g−1 dry sediment (Figure 5B), and the average abundances at sites S1, S3, S5, S9, S13, S19 and S26 was, respectively, 6.46 × 10⁵, 2.96 × 10⁵, 1.58 × 10⁵, 2.61 × 10⁵, 4.78 × 10⁴, 5.59 × 10⁴, and 9.09 × 10⁴ copies g−1 dry sediment, with site S1 having the highest abundance and site S13 the lowest abundance. Overall, the abundance of the AOB amoA gene was higher than that of the AOA amoA gene.

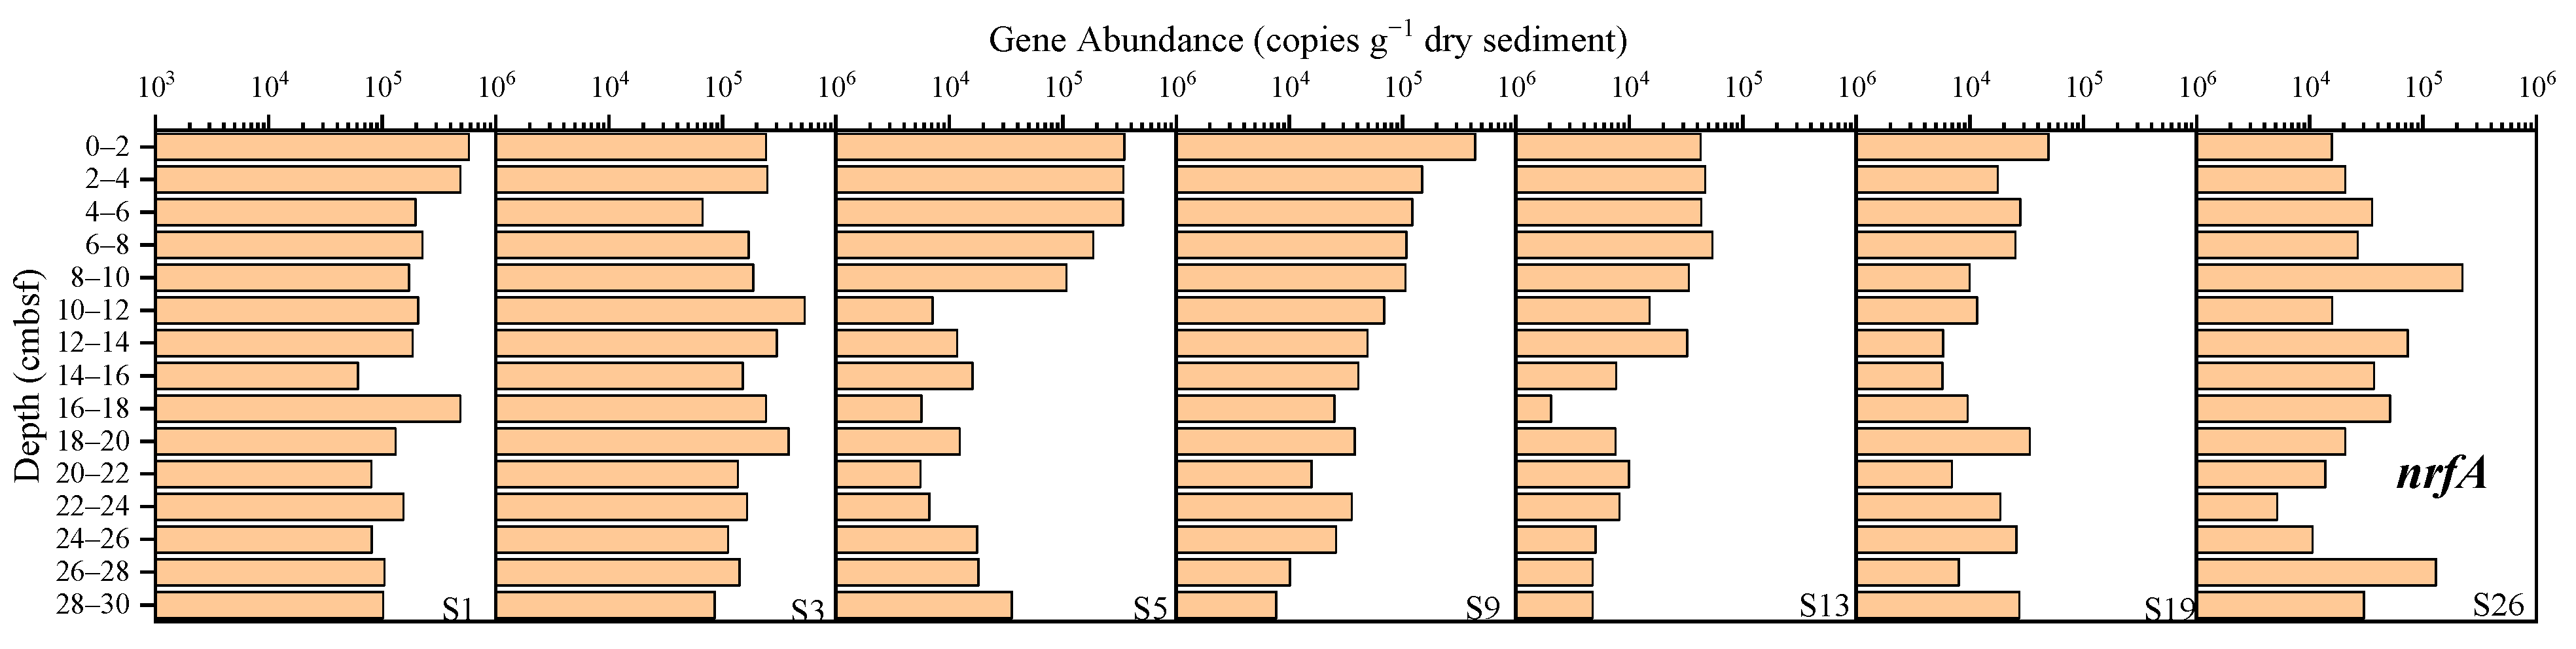
3.3.3. Dissimilatory Nitrate Reduction to Ammonium (DNRA)

The abundance of the nrfA gene ranged from 2.04 × 10³ to 5.79 × 10⁵ copies g−1 dry sediment (Figure 6). The average abundance at sites S1, S3, S5, S9, S13, S19 and S26 was, respectively, 2.17 × 10⁵, 2.11 × 10⁵, 9.74 × 10⁴, 8.28 × 10⁴, 2.14 × 10⁴, 1.89 × 10⁴, and 4.73 × 10⁴ copies g−1 dry sediment, with site S1 having the highest abundance and site S19 the lowest abundance. An obvious decreasing trend was observed at site S9 and S13.

3.3.4. Denitrification

The abundance of the narG gene ranged from 3.51 × 10⁴ to 2.45 × 10⁸ copies g−1 dry sediment (Figure 7A), and the average abundance at sites S1, S3, S5, S9, S13, S19 and S26 was, respectively, 5.85 × 10⁷, 4.97 × 10⁷, 2.04 × 10⁷, 2.90 × 10⁷, 1.40 × 10⁷, 1.91 × 10⁷, and 1.44 × 10⁷ copies g−1 dry sediment, with the highest abundance at site S1 and the lowest at site S13. The abundance of the nirS gene ranged from 8.02 × 10³ to 2.88 × 10⁸ copies g−1 dry sediment (Figure 7B), and the average abundance at sites S1, S3, S5, S9, S13, S19 and S26 was, respectively, 4.43 × 10⁷, 1.18 × 10⁶, 2.45 × 10⁶, 1.35 × 10⁷, 6.52 × 10⁵, 9.08 × 10⁵, and 4.97 × 10⁵ copies g−1 dry sediment, with the highest abundance at site S1 and the lowest abundance at site S26. The abundance of the nosZ gene ranged from 1.33 × 10⁵ to 8.10 × 10⁷ copies g−1 dry sediment (Figure 7C), and the average abundance at sites S1, S3, S5, S9, S13, S19 and S26 was, respectively, 5.50 × 10⁶, 9.75 × 10⁶, 4.12 × 10⁶, 1.19 × 10⁷, 8.23 × 10⁵, 2.03 × 10⁶ and 9.95 × 10⁶ copies g−1 dry sediment, with the highest abundance at site S9 and the lowest abundance at site S13. Among the three denitrifying functional genes, narG showed the highest abundance levels, followed by nirS, with nosZ being the least abundant. A noticeable decreasing trend was observed for sites S9, S13 and S26.

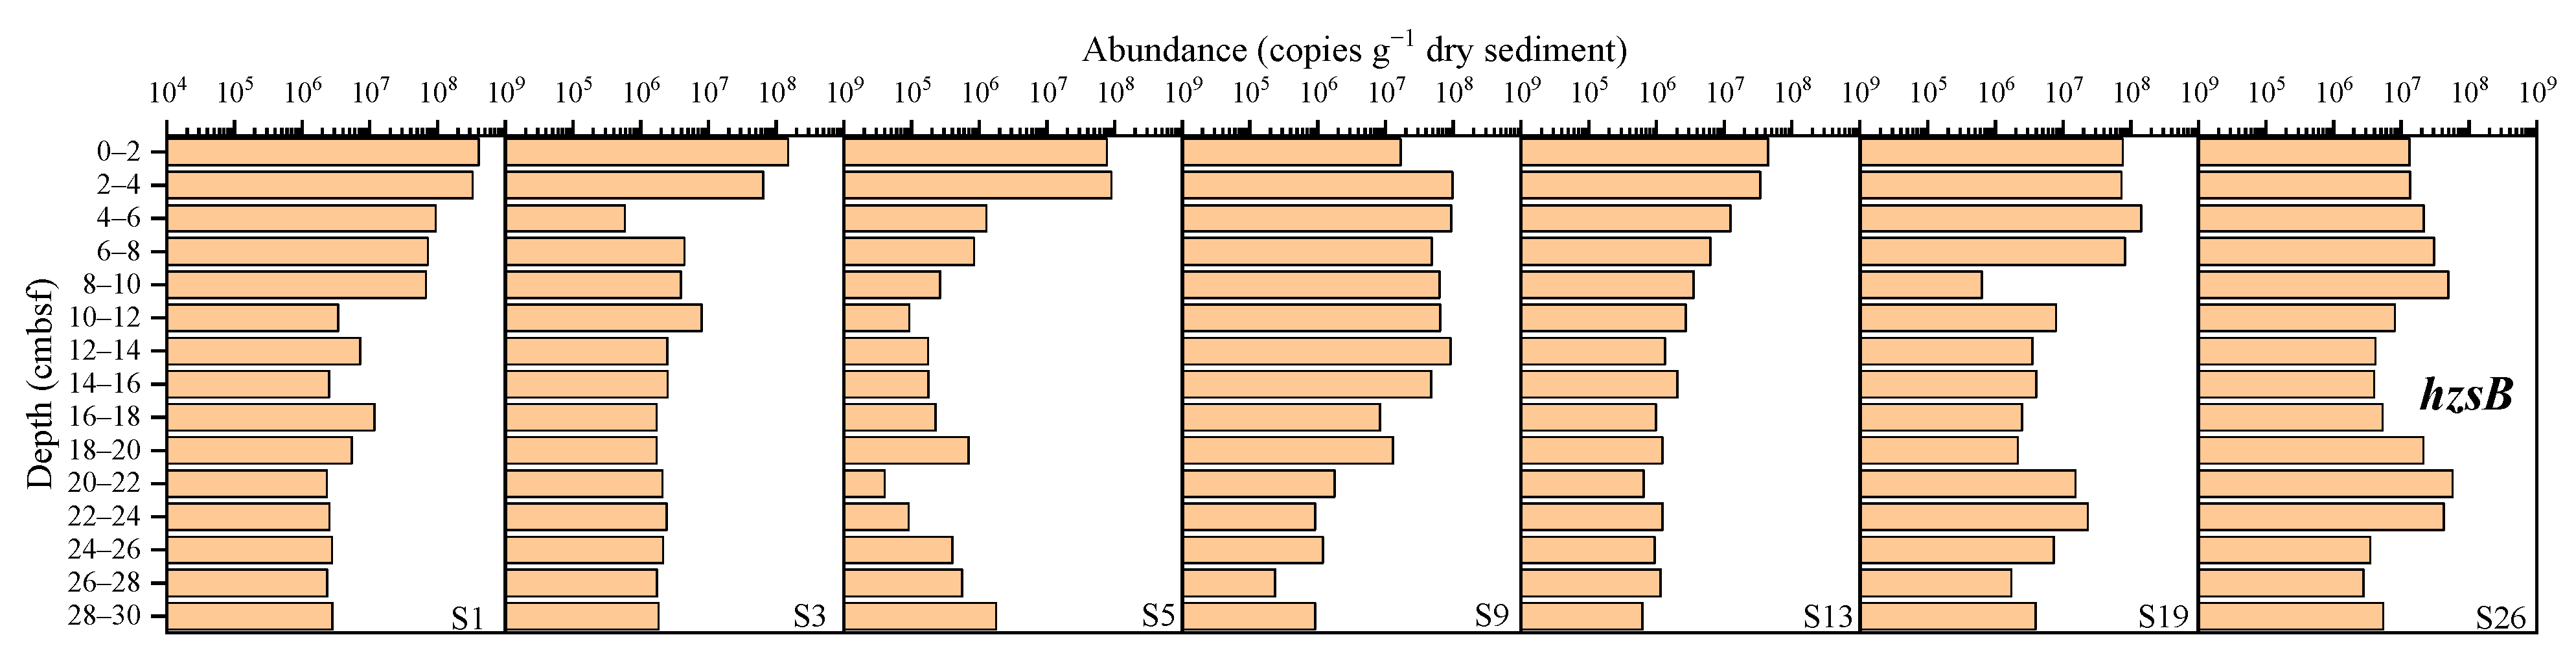
3.3.5. Anaerobic Ammonium-Oxidizing Bacteria (Anammox)

The abundance of the hzsB gene ranged from 4.00 × 10⁴ to 4.05 × 10⁸ copies g−1 dry sediment (Figure 8), and the average abundances at sites S1, S3, S5, S9, S13, S19 and S26 was, respectively, 6.75 × 10⁷, 1.67 × 10⁷, 1.15 × 10⁷, 3.64 × 10⁷, 7.57 × 10⁶, 2.97 × 10⁷, and 1.88 × 10⁷ copies g−1 dry sediment, with the highest abundance at site S1 and the lowest abundance at site S13. Overall, the abundance of the hzsB functional gene showed a higher trend in the surface layer than in the deeper layer.
The results were analyzed comprehensively. The gene abundance at sites S13, S19, and S26 was generally low. Specifically, site S13 showed the lowest abundance of the AOA amoA, narG, nosZ, and hzsB genes, site S19 had the lowest abundance of the nrfA gene, and site S26 exhibited the lowest abundance of the nifH, AOB amoA, and nirS genes. In contrast, sites S1 and S9 had higher gene abundances. Site S1 showed the highest abundance of the nifH, AOA amoA, AOB amoA, nrfA, narG, nirS, and hzsB genes, while site S9 exhibited the highest abundance of the nosZ gene. The results showed that the abundance of nitrogen-cycling genes in the sediments from shallower water depths (sites S1 and S9) was higher than in those from deeper water depths (sites S13, S19, and S26).

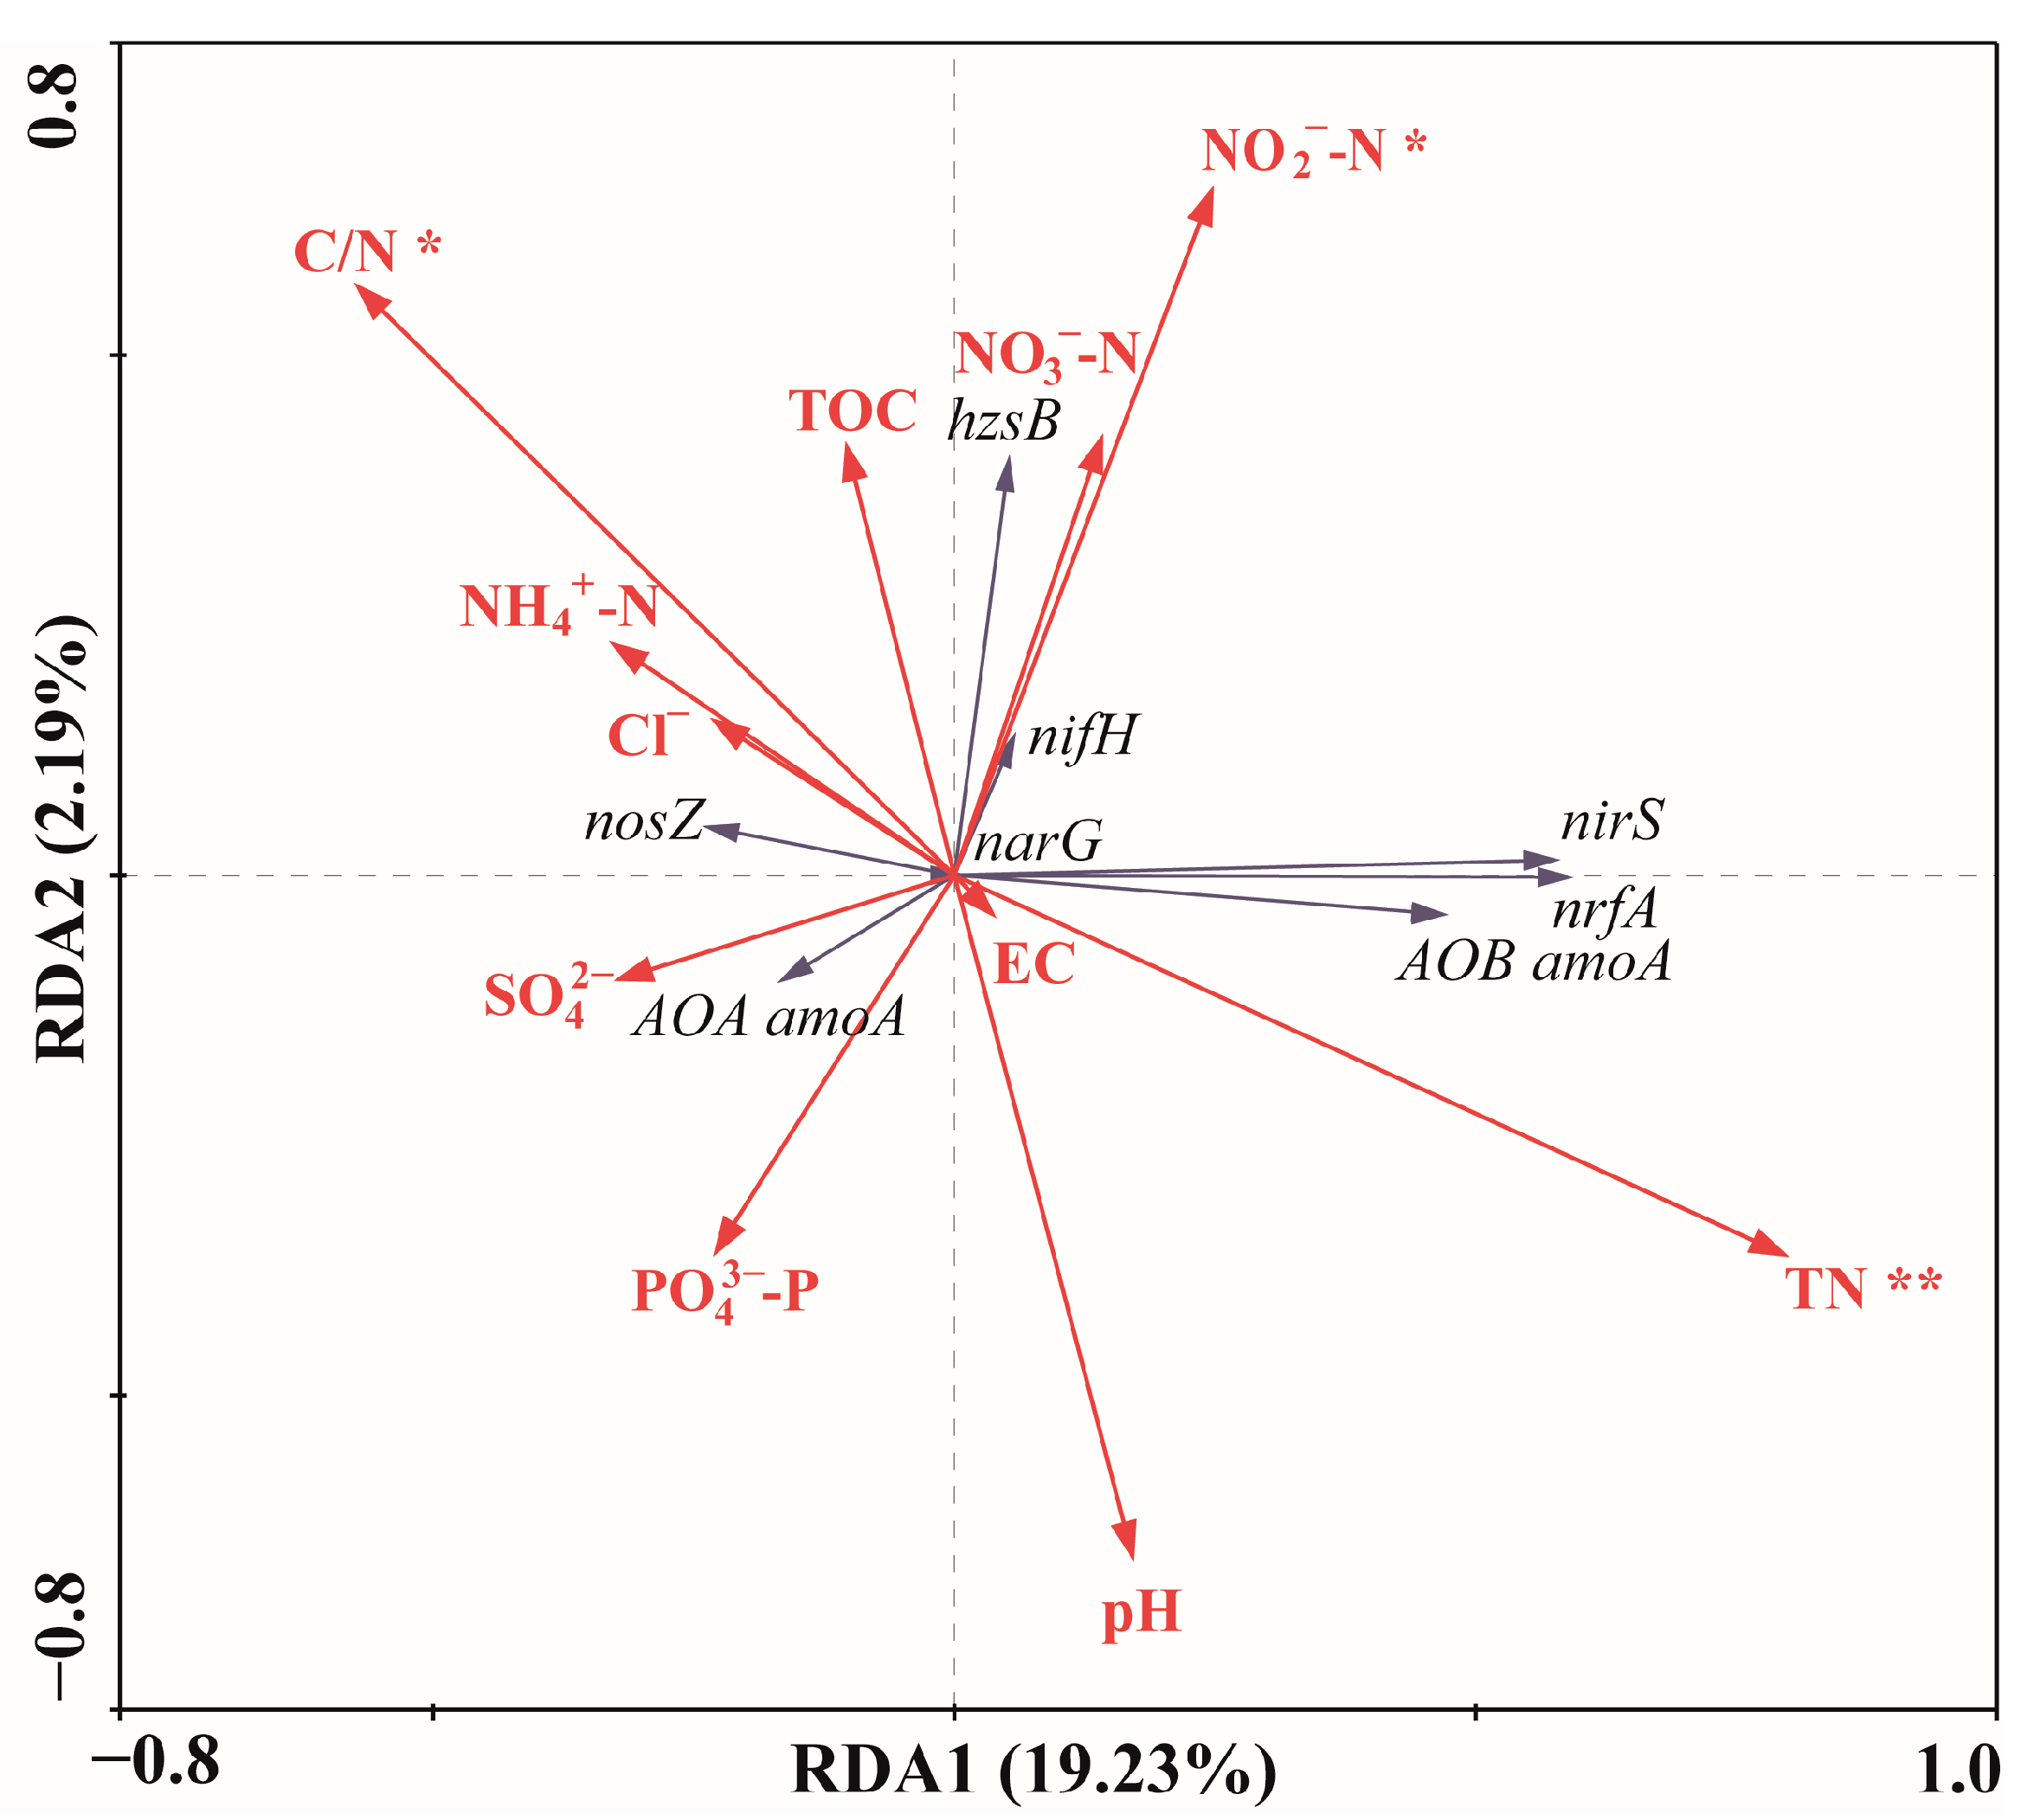
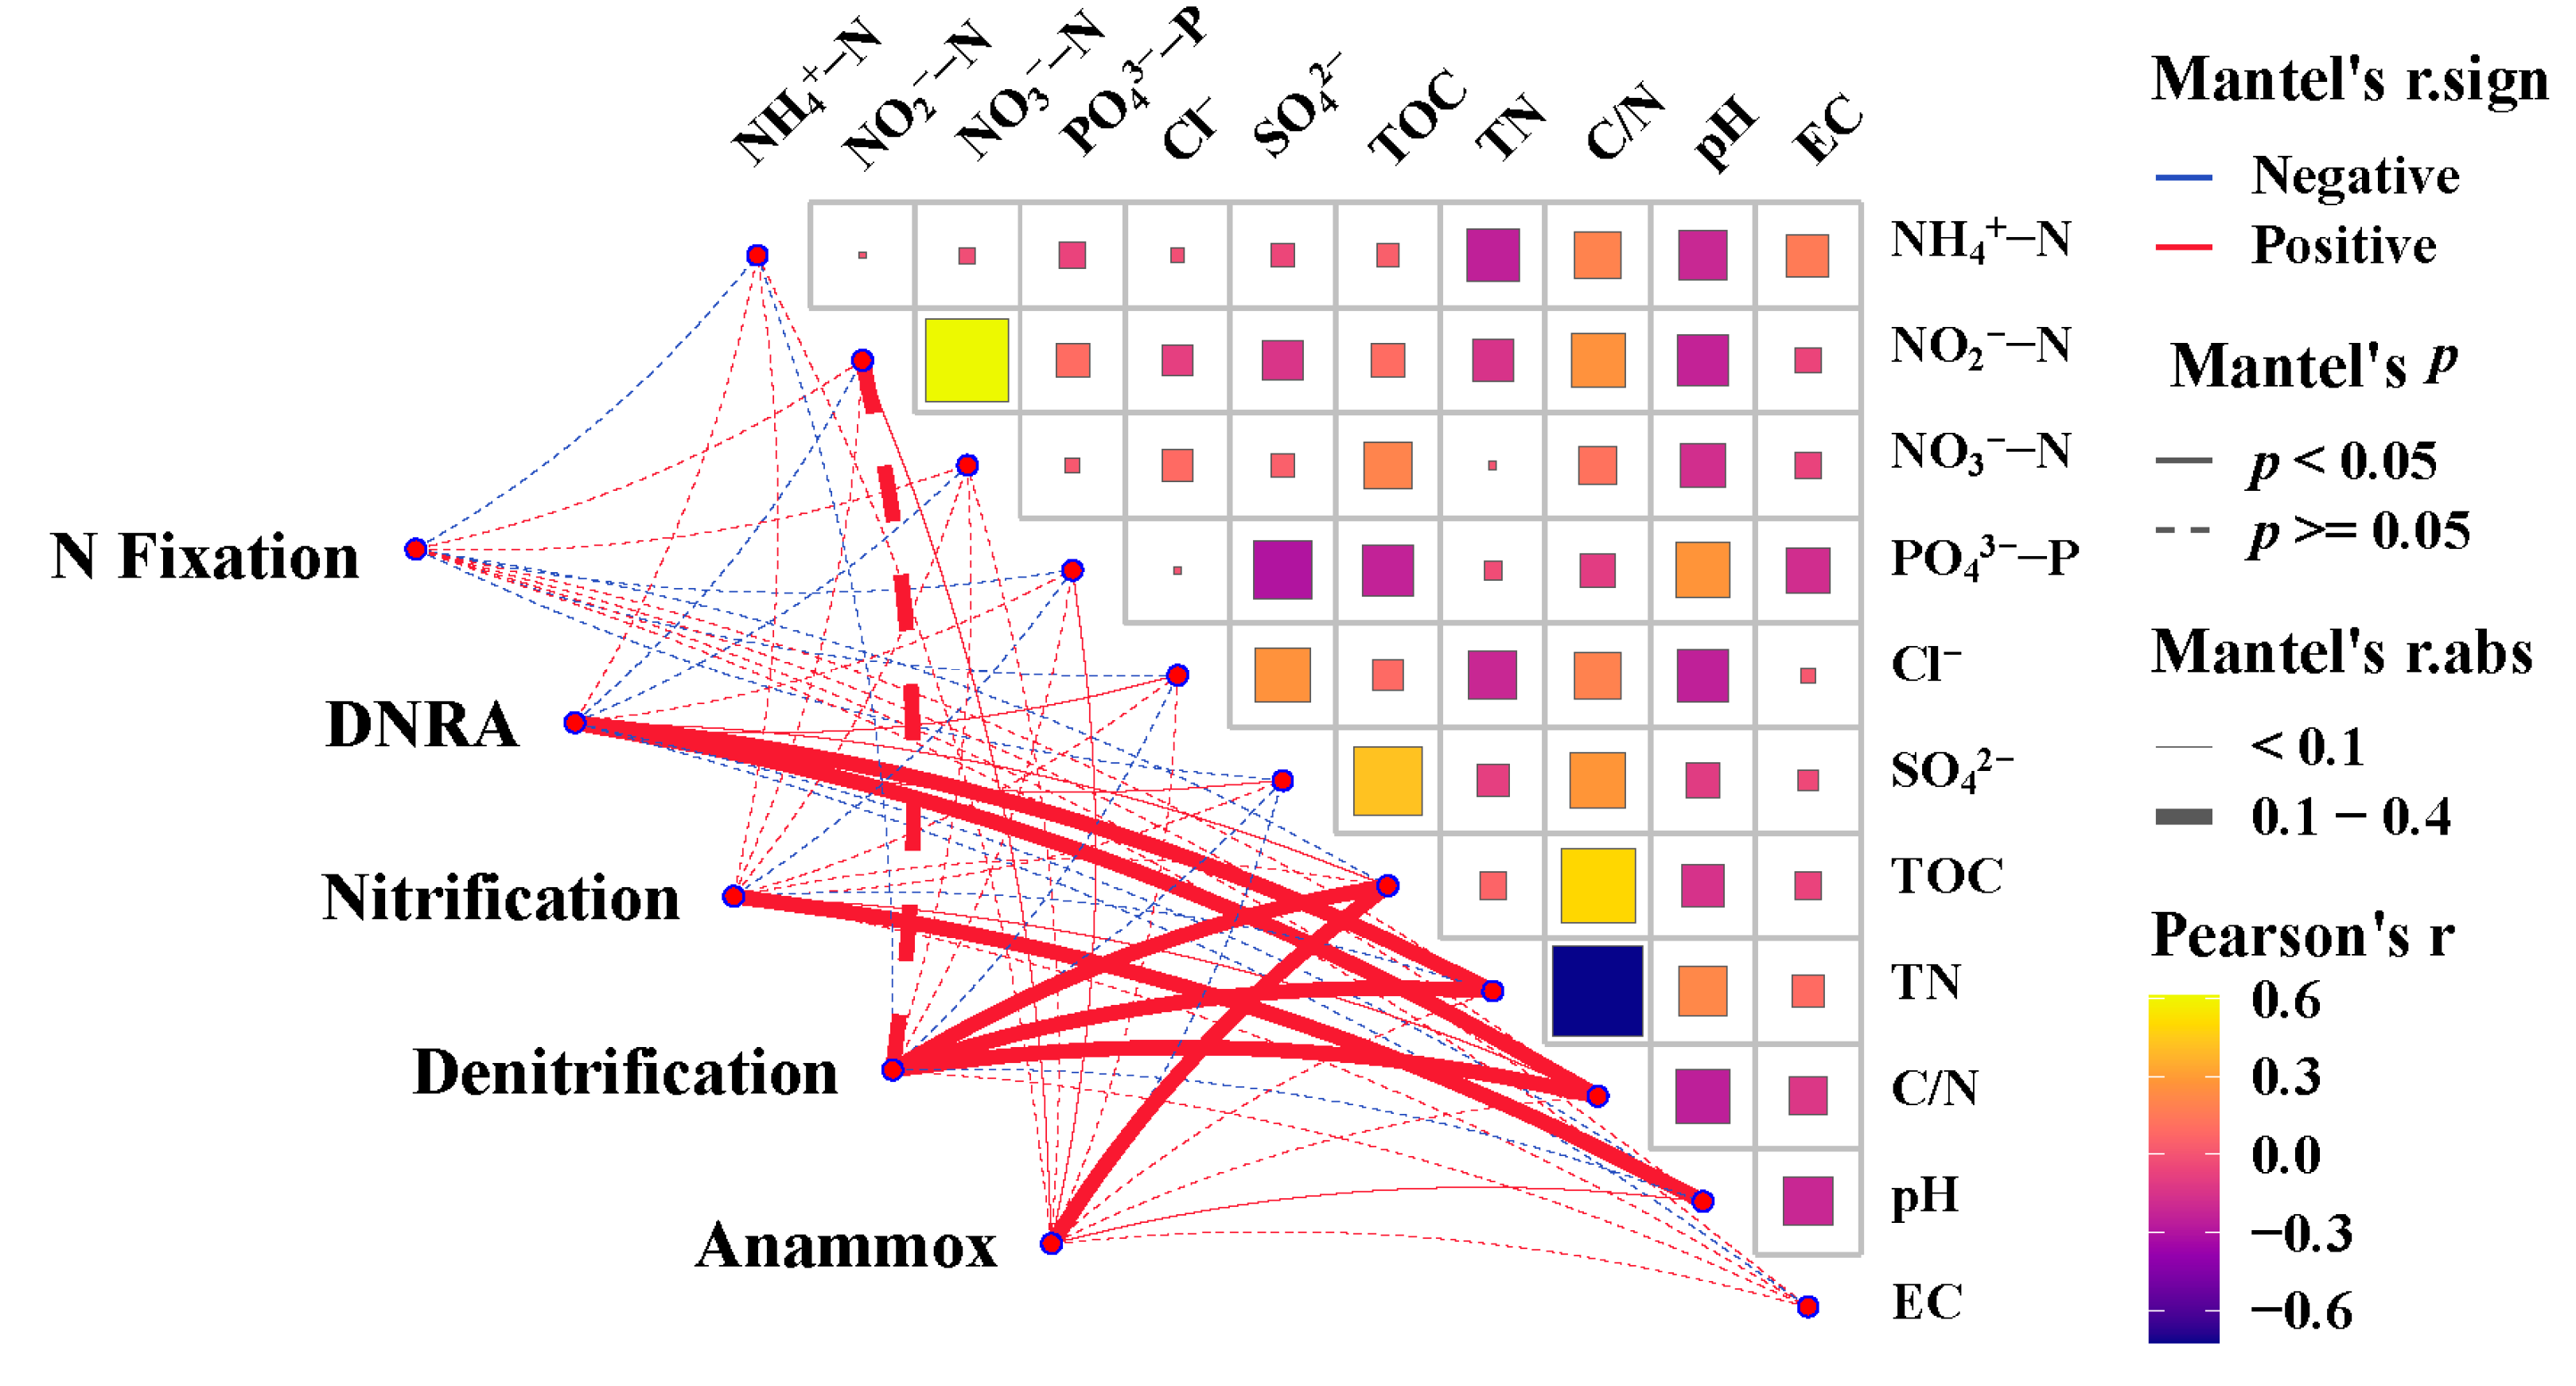
3.4. Effects of Environmental Parameters on the Abundance of Nitrogen-Cycling Genes in the Surface Sediments of the Western South China Sea

A redundancy analysis (RDA) was used to examine the relationship between the abundance of nitrogen-cycling functional genes and the environmental parameters (Figure 9). The longer arrows of environmental parameters in the RDA plot indicate a more significant influence on the species abundance variations across the dataset. The RDA results suggest that the C/N ratio (p = 0.043; F = 3.53; 499 Monte Carlo permutations), NO2-N (p = 0.024; F = 5.30; 499 Monte Carlo permutations), and TN (p = 0.004; F = 9.95; 499 Monte Carlo permutations) were the major environmental parameters affecting the nitrogen-cycling microbial community, while the remaining environmental parameters were not significant (p > 0.05). From the perspective of the relationships between genes, there was a strong positive correlation among the AOB amoA, nirS, and nrfA (p < 0.01), and a significant positive correlation between hzsB and nifH (p < 0.01). In terms of the relationship between the environmental parameters and genes, EC was significantly negatively correlated with nosZ (p < 0.01). TN showed a significant positive correlation with nrfA, AOB amoA, and nirS (p < 0.01), while C/N was significantly negatively correlated with these three genes (p < 0.01).
The Mantel test assessed the impact of individual environmental parameters on the entire nitrogen-cycling microbial community (Table S3). The correlation heatmap reflects the association between nitrogen-cycling processes and environmental parameters (Figure 10). The Pearson correlation results of the environmental parameters are shown in Table S3, and the results of the Mantel test are presented in Table S4. The squares represent the correlation between environmental parameters, with yellow indicating a high correlation and blue indicating a low correlation. The lines represent the association between environmental parameters and nitrogen-cycling processes, with red lines indicating positive correlation and blue lines indicating negative correlation; solid lines represent significant correlations (p < 0.05), while dashed lines represent non-significant correlations (p > 0.05); thick lines indicate strong correlations, and thin lines indicate weak correlations. The TOC content showed a significant positive correlation with the abundance of anammox and denitrification (p < 0.05). TN and the C/N ratio showed significant positive correlation with DNRA and denitrification (p < 0.05), likewise for the pH with nitrification (p < 0.05).

4. Discussion

Metagenome sequencing was performed at the phylum and species levels to characterize the major compositions of the microbial community in deep-sea surface sediments in order to explain their variability within distinct deep-sea environments. At the phylum level, Proteobacteria, Planctomycetes, and Chloroflexi were of higher relative abundance in each of the seven sites in this study (Figure 2), which is consistent with the results of many marine environments, including deep-sea sediments of hypersaline anoxic basins [25], Scotian Basin cold seeps [26] and equatorial Pacific [27]. According to previous studies, most nitrifying and denitrifying bacteria (e.g., Thauera, Denitratisoma, and Geobacter) belong to Proteobacteria [28]. Candidatus Lokiarchaeota, the absolute dominant phylum at site S3, can be widely found in various marine seafloor environments [26,29,30,31]. Site S5 also has a high relative abundance of Candidatus Lokiarchaeota, but in addition, Thaumarchaeota, being its other dominant phylum, can oxidize ammonia (NH3) by converting it to nitrite (NO2), being an essential part of the nitrogen cycle [32]. On the other hand, the microbial species-level cluster analysis delineated the seven sites into two separate clusters: the first, with two sub-clusters, respectively, sites S1 and S9, and sites S13, S19 and S26; the second, consisting of sites S3 and S5 (Figure 3). The species compositions of the two sub-clusters within the first major cluster are relatively similar. The second cluster, however, exhibits markedly divergent species compositions in comparison.
This classification is likely attributed to distinct geological influences for the respective clusters. Yin et al. [33] categorized the Zhongjiannan Basin into three sections based on significant differences in the structural characteristics due to tectonic dynamics: northern, central, and southern sections. The northern section comprises the Xisha Uplift, the central section features stable geological structures, while the southern section is characterized by magmatic activity. This tripartite classification is aligned with the clustering results. Sites S1 and S9 are located in the northern Zhongjiannan Basin, sites S3 and S5 in the middle Zhongjiannan Basin, and sites S13, S19, and S26 in the southern Zhongjiannan Basin. By contrast, the significant difference in species composition between S3 and S5 is likely linked to its proximity to distinct geological environments, such as pockmarks or mud volcanoes. Both sampling points, sites S3 and S5, are, respectively, situated in areas containing numerous pockmarks or mud volcanoes [34,35,36]. Pockmarks and mud volcanoes potentially release substantial amounts of organic matter, serving as a rich nutrient source for microorganisms [16,37,38,39]. They may also emit high concentrations of sulfides and heavy metals, which are toxic to certain microbial communities [40,41]. Consequently, the microbial composition in pockmarks and mud volcanoes significantly differs from that in other deep-sea environments, owing to their unique geological and chemical characteristics [42].
This spatial variation is also evident in the abundance of nitrogen cycle functional genes. The results of this study indicate that the abundance of nitrogen-cycling genes in sediments from shallower water depths (sites S1 and S9) was higher than in those from deeper water depths (sites S13, S19, and S26). Previous marine microbial studies have also demonstrated that the water depth is a significant factor influencing microbial abundance within sediments [43]. Increasing water depth is typically associated with a reduction in light intensity, lower oxygen content, decreasing temperature, higher seawater pressure, and diminution of organic matter, which are vital elements for microbial survival [44]. These factors collectively contribute to a reduced abundance of nitrogen-cycling genes in marine sediments with increasing water depth. However, it is worth noting that while site S5 (at a water depth of 2855 m) was deeper than site S13 (at a water depth of 2522 m), its overall gene abundance was higher. This discrepancy is likely due to the location of site S5, being in a unique area characterized by pockmarks and mud volcanoes. The substances released from these features, including organic matter and various chemicals, likely enhanced the activity of nitrogen-cycling microorganisms, and hence the abundance of their functional genes at site S5.
The abundance of nitrogen-cycling genes tends to decrease with the increasing vertical depth of the surface sediments, being more significant for nitrification, denitrification, and anammox functional genes. This trend, which is observed in various marine environments [10,11,45], is due to, firstly, the reduction in TOC (Table S1), which acts as an energy source for microbial heterotrophic processes, inhibiting denitrification; and secondly, potential higher ammonia oxidation activity at the surface, as an important control for the nitrification process [10]. Higher anammox rates can also be inferred for shallower surface sediments, as it positively correlates with anammox gene abundance [10], whereas other environmental parameters that exhibit positive correlation with individual nitrogen-cycling processes, including TN, C/N, and pH, do not show any statistically significant trend with the sediment depth (Figure 10). In this study, the most notable decrease was observed at site S9, with sites S13, S19, and S26 also showing some decreasing trends in specific genes. However, sites S1, S3, and S5 exhibited significant fluctuations in gene abundance. For example, an increase was observed at the 12–18 cm segment at site S1, affecting almost every gene. At site S3, a sharp decrease was noted at the 4–6 cm segment, whereas at the 10–12 cm and 20–22 cm segments of site S5, almost all the genes showed dramatic changes. This variability likely stems from the faster ocean current flow and sediment accumulation at sites S1, S3, and S5, leading to significant differences in sediment properties. In contrast, the lower flow rates and slower sediment accumulation at sites S9, S13, S19, and S26 result in more stable sediment properties and less dramatic changes in microbial communities.
In this study, factors significantly affecting the microbial community included the C/N ratio (p < 0.05), NO2-N (p < 0.05), and TN (p < 0.01). Carbon and nitrogen are fundamental nutrients for microbial growth, and their relative ratio directly influence microbial metabolic activities and growth. Wu et al. [46] found that the C/N ratio significantly affects the abundance of amoA, nirS, nirK, and nosZ genes in lake sediments. Similarly, Fu et al. [45] reported that AOA, AOB, SRB, and denitrifying bacteria are positively correlated with TOC, TN, and the C/N ratio in the Yap Trench (p < 0.01). The influence of NO2-N on nitrogen-cycling genes has been confirmed in various environments, especially on hzsB and nirS genes, as NO2-N serves as a substrate for reactions regulated by these genes. Consequently, the abundance of these genes is often positively correlated with NO2-N. However, competition may arise when the substrate is insufficient, resulting in varying relationships in different environments. In this study, NO2-N is significantly correlated with hzsB abundance (p < 0.01) but not with nirS (p > 0.05), indicating that NO2-N favors the growth of anammox bacteria over denitrifying bacteria in the competition between hzsB and nirS genes.

5. Conclusions

This research reveals the clustering of microbial community composition and the relationship between the abundance of nitrogen-cycling functional genes and environmental parameters in the deep-sea surface sediments of the western South China Sea. The analysis indicates that NO2-N, C/N ratio, and TN are essential factors influencing nitrogen-cycling microbial communities. Overall, the nitrogen-cycling genes showed a decreasing trend, with higher abundance in shallower water depths compared to deeper water depths. Also, the abundance of nitrogen-cycling genes at sites S3 and S5 was markedly different from that at other sampling points, suggesting the possible influences of unique geological features at these two locations. This is supported by the phylum-level community composition and species-level clustering analysis of the composition of the microbial communities. Additionally, the vertical distribution of nitrogen cycle functional genes generally shows a decreasing trend with the sediment depth, where their abundance is generally controlled by their respective environmental parameters. Therefore, this study investigates the distribution characteristics of various nitrogen-cycling microorganisms, providing insights into the survival strategies of these microbes in deep-sea basins, which is crucial for understanding the balance of marine nitrogen cycles.

Supplementary Materials

The following supporting information can be downloaded at https://www.mdpi.com/article/10.3390/microorganisms12091901/s1, Table S1: Environmental characteristics of sediment samples from the western South China Sea; Table S2: Primer pairs used in this study; Table S3: The Pearson correlation results of environmental parameters in sediment samples from the western South China Sea; Table S4: Mantel test results between nitrogen-cycling functional communities and environmental parameters in sediment samples from the western South China Sea. Refs. [47,48,49,50,51,52] can be found in Supplementary Materials.

Author Contributions

Conceptualization, X.Y., H.C. and M.S.; methodology, X.Y.; software, X.Y.; validation, Z.L.N. and R.L.; formal analysis, X.Z.; investigation, K.J. and B.Z.; resources, H.C.; data curation, B.Z.; writing—original draft preparation, X.Y.; writing—review and editing, Z.L.N. and M.S.; visualization, X.Y.; supervision, M.S.; project administration, L.S. and M.S.; funding acquisition, M.S. and H.C. All authors have read and agreed to the published version of the manuscript.

Funding

This research was supported by the Guangdong Key Areas R&D Project (Grant No. 2023B1111050014), the Project supported by Southern Marine Science and Engineering Guangdong Laboratory (Zhuhai) (Grant No. SML2021SP307), the Fundamental Research Funds for the Central Universities, Sun Yat-sen University (Grant No. 23qnpy96), and the Fundamental Research Funds for the Central Universities, Sun Yat-sen University (Grant No. 24xkjc010).

Data Availability Statement

The original contributions presented in this study are included in the article/Supplementary Materials; further inquiries can be directed to the corresponding author.

Acknowledgments

We are grateful to all the members of the “Xiangyanghong 3” R/V cruise. We also acknowledge the Sun Yat-Sen University, School of Marine Sciences, Group of Air-Sea Interaction.

Conflicts of Interest

The authors declare no conflicts of interest.

References

  1. Arrigo, K.R. Marine microorganisms and global nutrient cycles. Nature 2005, 437, 349–355. [Google Scholar] [CrossRef] [PubMed]
  2. Jetten, M.S.M. The microbial nitrogen cycle. Environ. Microbiol. 2008, 10, 2903–2909. [Google Scholar] [CrossRef]
  3. Gruber, N.; Galloway, J.N. An earth-system perspective of the global nitrogen cycle. Nature 2008, 451, 293–296. [Google Scholar] [CrossRef] [PubMed]
  4. Voss, M.; Bange, H.W.; Dippner, J.W.; Middelburg, J.J.; Montoya, J.P.; Ward, B. The marine nitrogen cycle: Recent discoveries, uncertainties and the potential relevance of climate change. Philos. Trans. R. Soc. B 2013, 368, 20130121. [Google Scholar] [CrossRef] [PubMed]
  5. Zehr, J.P.; Kudela, R.M. Nitrogen cycle of the open ocean: From genes to ecosystems. Annu. Rev. Mar. Sci. 2010, 3, 197–225. [Google Scholar] [CrossRef]
  6. Pajares, S.; Ramos, R. Processes and microorganisms involved in the marine nitrogen cycle: Knowledge and gaps. Front. Mar. Sci. 2019, 6, 739. [Google Scholar] [CrossRef]
  7. Hutchins, D.A.; Capone, D.C. The marine nitrogen cycle: New developments and global change. Nat. Rev. Microbiol. 2022, 20, 401–444. [Google Scholar] [CrossRef] [PubMed]
  8. Dong, S.; Wang, X.T.; Subhas, A.V.; Pavia, F.J.; Adkins, J.F.; Berelson, W.M. Depth profiles of suspended carbon and nitrogen along a North Pacific transect: Concentrations, isotopes, and ratios. Limnol. Oceanogr. 2022, 67, 247–260. [Google Scholar] [CrossRef]
  9. Xu, H.M.; Song, G.D.; Yang, S.Q.; Zhu, R.S.; Zhang, G.L.; Liu, S.M. Benthic nitrogen cycling in the deep ocean of the Kuroshio Extension region. Front. Mar. Sci. 2022, 9, 997810. [Google Scholar] [CrossRef]
  10. Lin, G.M.; Huang, J.; Lu, J.G.; Su, M.; Hu, B.Q.; Lin, X.B. Geochemical and microbial insights into vertical distributions of genetic potential of N-cycling processes in deep-sea sediments. Ecol. Indic. 2021, 125, 107461. [Google Scholar] [CrossRef]
  11. Nunoura, T.; Nishizawa, M.; Kikuchi, T.; Tsubouchi, T.; Hirai, M.; Koide, O.; Miyazaki, J.; Hirayama, H.; Koba, K.; Takai, K. Molecular biological and isotopic biogeochemical prognoses of the nitrification-driven dynamic microbial nitrogen cycle in hadopelagic sediments. Environ. Microbiol. 2013, 15, 3087–3107. [Google Scholar] [CrossRef] [PubMed]
  12. Zhao, R.; Hannisdal, B.; Mogollon, J.M.; Jorgensen, S.L. Nitrifier abundance and diversity peak at deep redox transition zones. Sci. Rep. 2019, 9, 8633. [Google Scholar] [CrossRef] [PubMed]
  13. Risgaard-Petersen, N.; Meyer, R.L.; Schmid, M.; Jetten, M.S.M.; Enrich-Prast, A.; Rysgaard, S.; Revsbech, N.P. Anaerobic ammonium oxidation in an estuarine sediment. Aquat. Microb. Ecol. 2004, 36, 293–304. [Google Scholar] [CrossRef]
  14. Brin, L.D.; Giblin, A.E.; Rich, J.J. Environmental controls of anammox and denitrification in southern New England estuarine and shelf sediments. Limnol. Oceanogr. 2014, 59, 851–860. [Google Scholar] [CrossRef]
  15. Kits, K.D.; Sedlacek, C.J.; Lebedeva, E.V.; Han, P.; Bulaev, A.; Pjevac, P.; Daebeler, A.; Romano, S.; Albertsen, M.; Stein, L.Y.; et al. Kinetic analysis of a complete nitrifier reveals an oligotrophic lifestyle. Nature 2017, 549, 269–272. [Google Scholar] [CrossRef]
  16. Hoshino, T.; Toki, T.; Ijiri, A.; Morono, Y.; Machiyama, H.; Ashi, J.; Okamura, K.; Inagaki, F. Atribacteria from the subseafloor sedimentary biosphere disperse to the hydrosphere through submarine mud volcanoes. Front. Microbiol. 2017, 8, 01135. [Google Scholar] [CrossRef]
  17. Ruff, S.E.; Felden, J.; Gruber-Vodicka, H.R.; Marcon, Y.; Knittel, K.; Ramette, A.; Boetius, A. In situ development of a methanotrophic microbiome in deep-sea sediments. ISME J. 2019, 13, 197–213. [Google Scholar] [CrossRef]
  18. Chakraborty, A.; Ruff, S.E.; Dong, X.; Ellefson, E.D.; Li, C.; Brooks, J.M.; Mcbee, J.; Bernard, B.B.; Hubert, C.R.J. Hydrocarbon seepage in the deep seabed links subsurface and seafloor biospheres. Proc. Natl. Acad. Sci. USA 2020, 117, 11029–11037. [Google Scholar] [CrossRef] [PubMed]
  19. Kong, Y.; Lei, H.Y.; Zhang, Z.L.; Cheng, W.D.; Wang, B.; Pan, F.L.; Huang, F.F.; Huang, F.L.; Li, W.Q. Depth profiles of geochemical features, geochemical activities and biodiversity of microbial communities in marine sediments from the Shenhu area, the northern South China Sea. Sci. Total Environ. 2021, 779, 146233. [Google Scholar] [CrossRef]
  20. Zhao, R.; Mogollon, J.M.; Abby, S.S.; Schleper, C.; Biddle, J.F.; Roerdink, D.L.; Thorseth, I.H.; Jorgensen, S.L. Geochemical transition zone powering microbial growth in subsurface sediments. Proc. Natl. Acad. Sci. USA 2020, 117, 32617–32626. [Google Scholar] [CrossRef]
  21. Schauberger, C.; Middelboe, M.; Larsen, M.; Peoples, L.M.; Bartlett, D.H.; Kirpekar, F.; Rowden, A.A.; Wenzhofer, F.; Thamdrup, B.; Glud, R.N. Spatial variability of prokaryotic and viral abundances in the Kermadec and Atacama Trench regions. Limnol. Oceanogr. 2021, 66, 2095–2109. [Google Scholar] [CrossRef] [PubMed]
  22. Hu, J.L.; Zhou, Y.H.; Lei, Z.Y.; Liu, G.L.; Hua, Y.M.; Zhou, W.B.; Wan, X.Q.; Zhu, D.W.; Zhao, J.W. Effects of Potamogeton crispus decline in the rhizosphere on the abundance of anammox bacteria and nirS denitrifying bacteria. Environ. Pollut. 2020, 260, 114018. [Google Scholar] [CrossRef] [PubMed]
  23. Zhang, L.; Li, X.C.; Fang, W.K.; Cheng, Y.; Cai, H.; Zhang, S.Q. Impact of different types of anthropogenic pollution on bacterial community and metabolic genes in urban river sediments. Sci. Total Environ. 2021, 793, 148475. [Google Scholar] [CrossRef] [PubMed]
  24. Xu, Z.S.; Wang, B.; Luo, Y.M.; Li, H.L.; Zhang, J.J.; Jin, H.Y.; Chen, J.F. Changes of carbon to nitrogen ratio in particulate organic matter in the marine mesopelagic zone: A case from the South China Sea. Mar. Chem. 2021, 231, 103930. [Google Scholar] [CrossRef]
  25. Pachiadaki, M.G.; Yakimov, M.M.; LaCono, V.; Leadbetter, E.; Edgcomb, V. Unveiling microbial activities along the halocline of Thetis, a deep-sea hypersaline anoxic basin. ISME J. 2014, 8, 2478–2489. [Google Scholar] [CrossRef] [PubMed]
  26. Dong, X.Y.; Rattray, J.E.; Campbell, D.C.; Webb, J.; Chakraborty, A.; Adebayo, O.; Matthews, S.; Li, C.; Fowler, M.; Morrison, N.M.; et al. Thermogenic hydrocarbon biodegradation by diverse depth-stratified microbial populations at a Scotian Basin cold seep. Nat. Commun. 2020, 11, 5825. [Google Scholar] [CrossRef]
  27. Hollingsworth, A.L.; Jones, D.O.B.; Young, R. Spatial variability of abyssal nitrifying microbes in the North-Eastern Clarion-Clipperton Zone. Front. Mar. Sci. 2021, 8, 663420. [Google Scholar] [CrossRef]
  28. Ahmad, H.A.; Guo, B.B.; Zhuang, X.M.; Zhao, Y.Y.; Ahmad, S.; Lee, T.; Zhu, J.G.; Dong, Y.L.; Ni, S.Q. A twilight for the complete nitrogen removal via synergistic partial-denitrification, anammox, and DNRA process. Npj Clean Water 2021, 4, 31. [Google Scholar] [CrossRef]
  29. Martino, A.; Rhodes, M.E.; Leon-Zayas, R.; Valente, I.E.; Biddle, J.F.; House, C.H. Microbial Diversity in Sub-Seafloor Sediments from the Costa Rica Margin. Geosciences 2019, 9, 218. [Google Scholar] [CrossRef]
  30. Li, Z.X.; Pan, D.; Wei, G.S.; Pi, W.L.; Zhang, C.W.; Wang, J.H.; Peng, Y.Y.; Zhang, L.; Wang, Y.; Hubert, C.R.J.; et al. Deep sea sediments associated with cold seeps are a subsurface reservoir of viral diversity. ISME J. 2021, 15, 2366–2378. [Google Scholar] [CrossRef]
  31. More, K.D.; Wuchter, C.; Irigoien, X.; Tierney, J.E.; Giosan, L.; Grice, K.; Coolen, M.J.L. Subseafloor Archaea reflect 139 kyrs of paleodepositional changes in the northern Red Sea. Geobiology 2021, 19, 162–172. [Google Scholar] [CrossRef] [PubMed]
  32. Techtman, S.M.; Mahmoudi, N.; Whitt, K.T.; Campa, M.F.; Fortney, J.L.; Joyner, D.C.; Hazen, T.C. Comparison of Thaumarchaeotal populations from four deep sea basins. FEMS Microbiol. Ecol. 2017, 93, fix128. [Google Scholar] [CrossRef] [PubMed]
  33. Yin, Z.X.; Cai, Z.R.; Yao, Y.J.; Huang, Q.R.; Li, Z.Y. Tectonic dynamics of the Zhongjiannan Basin in the western South China Sea since the late Miocene. Front. Earth Sci. 2023, 10, 996267. [Google Scholar] [CrossRef]
  34. Chen, J.X.; Song, H.B.; Guan, Y.X.; Yang, S.X.; Pinheiro, L.M.; Bai, Y.; Liu, B.R.; Geng, M.H. Morphologies, classification and genesis of pockmarks, mud volcanoes and associated fluid escape features in the northern Zhongjiannan Basin, South China Sea. Deep-Sea Res. Part II 2015, 122, 106–117. [Google Scholar] [CrossRef]
  35. Geng, M.H.; Song, H.B.; Guan, Y.X.; Chen, J.X.; Zhang, R.W.; Zhang, B.J.; Zhang, X.D. Sill-related seafloor domes in the Zhongjiannan Basin, western South China Sea. Mar. Petrol. Geol. 2020, 122, 104669. [Google Scholar] [CrossRef]
  36. Zhang, G.X.; Wang, X.J.; Li, L.; Sun, L.Y.; Guo, Y.Q.; Lu, Y.T.; Li, W.; Wang, Z.Q.; Qian, J.; Yang, T.T.; et al. Gas hydrate accumulation related to pockmarks and faults in the Zhongjiannan Basin, South China Sea. Front. Earth Sci. 2022, 10, 902469. [Google Scholar] [CrossRef]
  37. Corinaldesi, C.; Dell’Anno, A.; Danovaro, R. Viral infections stimulate the metabolism and shape prokaryotic assemblages in submarine mud volcanoes. ISME J. 2012, 6, 1250–1259. [Google Scholar] [CrossRef]
  38. Nickel, J.C.; di Primio, R.; Kallmeyer, J.; Hammer, O.; Horsfield, B.; Stoddart, D.; Brunstad, H.; Mangelsdorf, K. Tracing the origin of thermogenic hydrocarbon signals in pockmarks from the southwestern Barents Sea. Org. Geochem. 2013, 63, 73–84. [Google Scholar] [CrossRef]
  39. Begmatov, S.; Savvichev, A.S.; Kadnikov, V.V.; Beletsky, A.V.; Rusanov, I.I.; Klyuvitkin, A.A.; Novichkova, E.A.; Mardanov, A.V.; Pimenov, N.V.; Ravin, N.V. Microbial communities involved in methane, sulfur, and nitrogen cycling in the sediments of the Barents Sea. Microorganisms 2021, 9, 2362. [Google Scholar] [CrossRef]
  40. Pimenov, N.V.; Ulyanova, M.O.; Kanapatsky, T.A.; Veslopolova, E.F.; Sigalevich, P.A.; Sivkov, V.V. Microbially mediated methane and sulfur cycling in pockmark sediments of the Gdansk Basin, Baltic Sea. Geo-Mar. Lett. 2010, 30, 439–448. [Google Scholar] [CrossRef]
  41. Nickel, J.C.; di Primio, R.; Mangelsdorf, K.; Stoddart, D.; Kallmeyer, J. Characterization of microbial activity in pockmark fields of the SW-Barents Sea. Mar. Geol. 2012, 332, 152–162. [Google Scholar] [CrossRef]
  42. Carrier, V.; Svenning, M.M.; Grundger, F.; Niemann, H.; Dessandier, P.A.; Panieri, G.; Kalenitchenko, D. The impact of methane on microbial communities at marine Arctic gas hydrate bearing sediment. Front. Microbiol. 2020, 11, 01932. [Google Scholar] [CrossRef]
  43. Yu, T.T.; Li, M.; Niu, M.Y.; Fan, X.B.; Liang, W.Y.; Wang, F.P. Difference of nitrogen-cycling microbes between shallow bay and deep-sea sediments in the South China Sea. Appl. Microbiol. Biot. 2018, 102, 447–459. [Google Scholar] [CrossRef] [PubMed]
  44. Jørgensen, B.B.; Boetius, A. Feast and famine—Microbial life in the deep-sea bed. Nat. Rev. Microbiol. 2007, 5, 770–781. [Google Scholar] [CrossRef] [PubMed]
  45. Fu, L.L.; Li, D.; Mi, T.Z.; Zhao, J.; Liu, C.G.; Sun, C.J.; Zhen, Y. Characteristics of the archaeal and bacterial communities in core sediments from Southern Yap Trench via in situ sampling by the manned submersible Jiaolong. Sci. Total Environ. 2020, 703, 134884. [Google Scholar] [CrossRef]
  46. Wu, H.P.; Hao, B.B.; Cai, Y.P.; Liu, G.H.; Xing, W. Effects of submerged vegetation on sediment nitrogen-cycling bacterial communities in Honghu Lake (China). Sci. Total Environ. 2021, 755, 142541. [Google Scholar] [CrossRef] [PubMed]
  47. Rong, L.L.; Zhao, L.F.; Zhao, L.C.; Cheng, Z.P.; Yao, Y.M.; Yuan, C.L.; Wang, L.; Sun, H.W. LDPE microplastics affect soil microbial communities and nitrogen cycling. Sci. Total Environ. 2021, 773, 145640. [Google Scholar] [CrossRef]
  48. Chang, Y.K.; Yin, G.Y.; Hou, L.J.; Liu, M.; Zheng, Y.L.; Han, P.; Dong, H.P.; Liang, X.; Gao, D.Z.; Liu, C. Nitrogen removal processes coupled with nitrification in coastal sediments off the north East China Sea. J. Soil Sediments 2021, 21, 3289–3299. [Google Scholar] [CrossRef]
  49. Shi, Y.; Zhang, X.Y.; Wang, Z.C.; Xu, Z.W.; He, C.G.; Sheng, L.X.; Liu, H.Y.; Wang, Z.Q. Shift in nitrogen transformation in peatland soil by nitrogen inputs. Sci. Total Environ. 2021, 764, 142924. [Google Scholar] [CrossRef]
  50. Chen, C.; Yin, G.Y.; Hou, L.J.; Liu, M.; Jiang, Y.H.; Zheng, D.S.; Gao, D.Z.; Liu, C.; Zheng, Y.L.; Han, P. Effects of sulfamethoxazole on coupling of nitrogen removal with nitrification in Yangtze Estuary sediments. Environ. Pollut. 2021, 271, 116382. [Google Scholar] [CrossRef]
  51. Huang, F.J.; Lin, X.B.A.; Hu, W.F.; Zeng, F.; He, L.; Yin, K.D. Nitrogen cycling processes in sediments of the Pearl River Estuary: Spatial variations, controlling factors, and environmental implications. Catena 2021, 206, 105545. [Google Scholar] [CrossRef]
  52. Wu, J.P.; Hong, Y.G.; Chang, X.Y.; Jiao, L.J.; Li, Y.B.; Liu, X.H.; Xie, H.T.; Gu, J.D. Unexpectedly high diversity of anammox bacteria detected in deep-sea surface sediments of the South China Sea. FEMS Microbiol. Ecol. 2019, 95, fiz013. [Google Scholar] [CrossRef] [PubMed]
Figure 1. Map of the sites sampled in the western South China Sea.
Microorganisms 12 01901 g001
Figure 2. Phylum-level community composition in sediment samples from the western South China Sea (relative abundance > 1%).
Microorganisms 12 01901 g002
Figure 3. Heatmap of microbial species in sediment samples from the western South China Sea.
Microorganisms 12 01901 g003
Figure 4. The abundance of the nifH gene in the sediments from the western South China Sea.
Microorganisms 12 01901 g004
Figure 5. The abundance of the AOB amoA and AOA amoA genes in the sediments from the western South China Sea. ((A) the abundance of AOB amoA gene; (B) the abundance of AOA amoA gene).
Microorganisms 12 01901 g005
Figure 6. The abundance of the nrfA gene in the sediments from the western South China Sea.
Microorganisms 12 01901 g006
Figure 7. The abundance of the narG, nirS, and nosZ genes in the sediments from the western South China Sea. ((A) the abundance of narG gene; (B) the abundance of nirS gene; (C) the abundance of nosZ gene).
Microorganisms 12 01901 g007
Figure 8. The abundance of the hzsB gene in the sediments from the western South China Sea.
Microorganisms 12 01901 g008
Figure 9. RDA of nitrogen-cycling genes and environmental parameters in the sediments from the western South China Sea. (The significance was labeled as *, p < 0.05; **, p < 0.01).
Microorganisms 12 01901 g009
Figure 10. Correlation network heatmap of the gene abundance of nitrogen fixation, DNRA, nitrification, denitrification and anammox with environmental parameters.
Microorganisms 12 01901 g010
Table 1. Sampling locations and water depths of sediments from the western South China Sea.
SiteLatitudeLongitudeWater Depth (m)
S116.09° N111.52° E1179
S315.02° N111.56° E1395
S514.02° N111.52° E2855
S915.51° N112.19° E1889
S1312.51° N111.54° E2522
S1913.00° N112.24° E3563
S2614.03° N113.51° E4150
Table 2. Environmental parameters in deep-sea surface sediments from the western South China Sea.
SiteNH4+-NNO2-NNO3-NPO43−-PClSO42−TOCTNC/NpHEC
μmol L−1μmol L−1μmol L−1μmol L−1mmol L−1mmol L−1%% mS cm−1
S1
(n = 15)
142.32 ± 49.67 ab4.80 ± 1.98 ab5.50 ± 6.44 a427.45 ± 192.48 a1545.34 ± 281.11 bc70.30 ± 13.67 cd7.49 ± 0.26 bc4.51 ± 0.07 b1.67 ± 0.53 c7.69 ± 0.09 b31.38 ± 1.32 ab
S3
(n = 15)
95.68 ± 48.14 b4.21 ± 2.59 ab5.53 ± 2.40 a258.31 ± 130.21 b1390.74 ± 213.52 c73.81 ± 24.18 cd5.65 ± 0.12 d6.12 ± 0.18 a0.96 ± 0.18 c7.77 ± 0.10 a30.77 ± 1.41 b
S5
(n = 15)
264.85 ± 145.06 a8.92 ± 3.08 a3.37 ± 3.09 a374.52 ± 214.95 a1262.35 ± 425.48 c57.74 ± 25.29 d2.66 ± 0.14 e0.67 ± 0.02 d4.04 ± 1.64 b7.70 ± 0.07 b31.58 ± 1.43 ab
S9
(n = 15)
108.27 ± 29.61 b7.26 ± 13.87 ab9.60 ± 11.95 a459.66 ± 114.04 a1870.85 ± 392.73 ab75.53 ± 21.51 c6.88 ± 0.25 cd1.10 ± 0.01 cd6.28 ± 2.30 a7.70 ± 0.13 ab27.33 ± 3.69 c
S1
(n = 15)
292.07 ± 254.87 a3.43 ± 1.85 b3.13 ± 1.72 a400.53 ± 90.73 a1817.42 ± 461.37 ab73.60 ± 17.23 cd8.62 ± 0.09 a1.39 ± 0.02 c6.32 ± 0.93 a7.70 ± 0.09 ab30.94 ± 1.45 b
S19
(n = 15)
227.79 ± 144.58 ab5.28 ± 2.41 ab4.29 ± 2.15 a164.42 ± 47.57 bc1583.26 ± 1094.12 bc120.71 ± 24.13 a10.20 ± 0.15 a1.61 ± 0.02 c6.43 ± 1.09 a7.70 ± 0.07 ab30.30 ± 1.45 b
S26
(n = 15)
267.21 ± 364.55 a6.90 ± 5.78 ab9.99 ± 24.99 a150.70 ± 60.02 c2181.61 ± 269.16 a93.74 ± 24.83 b6.51 ± 0.14 cd1.19 ± 0.02 cd5.52 ± 1.19 a7.48 ± 0.06 c32.78 ± 1.02 a
Different letters after values in the same column indicate significant differences (p < 0.05).
Disclaimer/Publisher’s Note: The statements, opinions and data contained in all publications are solely those of the individual author(s) and contributor(s) and not of MDPI and/or the editor(s). MDPI and/or the editor(s) disclaim responsibility for any injury to people or property resulting from any ideas, methods, instructions or products referred to in the content.

