Featured Application
The research results included in the paper can be widely used in designing thin-walled steel elements for use in construction. The use of the presented calculation model for the calculation of continuous beams allows for more optimal and economical design of sections of this element class under resistance conditions. In this model, the real behavior of thin-walled beams under load was taken into account much more precisely in relation to the Eurocode. This made it possible to use the resistance reserves resulting from the effect of longitudinal stress variation and the elastic restraint of the thin-walled cross-section walls.
Abstract
In modern steel construction, thin-walled elements with Class 4 cross-sections are commonly used. For the sake of the computation of such elements according to European Eurocode 3 (EC3), simplified computational models are applied. These models do not account for important parameters that affect the behavior of a structure susceptible to local stability loss. This study discussed the effect of local buckling on the design ultimate resistance of a continuous beam with a thin-walled Class 4 I-shaped cross-section. In the investigations, a more accurate computational model was employed. A new calculation model was proposed, based on the analysis of local buckling separately for the span segment and the support segment of the first span, which are characterized by different distributions of bending moments. Critical stress was determined using the critical plate method (CPM), taking into account the effect of the mutual elastic restraint of the cross-section walls. The stability analysis also accounted for the effect of longitudinal stress variation resulting from the varied distribution of bending moments along the continuous beam length. The results of the calculations were compared with the numerical simulations using the finite element method. The obtained results showed very good congruence. The phenomena mentioned above are not taken into consideration in the computational model provided in EC3. Based on the critical stress calculated as above, “local” critical moments were determined. These constitute a limit on the validity of the Vlasov theory of thin-walled bars. Design ultimate resistance of the I-shaped cross-section was determined from the plastic yield condition of the most compressed edge under the assumptions specified in the study. Detailed calculations were performed for I-sections welded from thin metal sheets, and for sections made from two cold-formed channels (2C). The impact of the following factors on the critical resistance and design ultimate resistance of the midspan and support cross-sections was analyzed: (1) longitudinal stress variation, (2) relative plate slenderness of the flange, and (3) span length of the continuous beam. The results were compared with the outcomes obtained for box sections with the same contour dimensions, and also with those produced acc. EC3. It was shown that compared with calculations acc. EC3, those performed in accordance with the CPM described much more accurately the behavior of the uniformly loaded continuous beam with a thin-walled section. This could lead to a more effective design of structures of this class.
1. Introduction
In modern metal construction, thin-walled lightweight components that are sensitive to local stability loss are increasingly being used. Local buckling of a thin-walled member causes lateral (in relation to the direction of compressive stress) displacement of the component walls of the cross-section. This reduces the load capacity of the critical cross-section, which reduces the resistance of the entire structural member. In the European Eurocode 3 (EC3) [1,2,3] standards, cross-sections that are subjected to local buckling (in the elastic range) are included in Class 4 cross-sections. The classification of a steel cross-section into Class 4 is based on a comparison of slenderness (b/t) of separated component walls of the section with the limit values for Class 3. In the event the limits of at least one of the component walls being exceeded, the cross-section is qualified as Class 4, which implies the need to include the effects of local buckling in the calculation model. However, an interest in thin-walled members is currently growing due to a significant reduction in the weight of structural steel cross-sections. For example, hot-formed bisymmetric sections (e.g., IPE, HEB), much lighter cold-formed open sections (monosymmetric or compound cross-sections, e.g., two-branch cross-sections), or bisymmetrical box sections can be used for supporting elements of light halls, floor beams, trusses, columns, or purlins. This approach reduces the weight of the structure. The use of steels with ever higher strength as well as modern automatic welding technologies also affects the development of thin-walled welded I-sections. Such Class 4 bisymmetrical and monosymmetrical welded cross-sections are characterized by low weight, with an analogous degree of reliability of the structural member in relation to hot-formed members.
From the point of view of the occurring instability phenomena, I-section beams may be subject to local buckling and lateral torsional buckling, including flexural–torsional loss of stability with the so-called forced rotation axis (e.g., wind suction purlin or from gravity loads in the supporting segment of continuous beams). This is due to the fact that thin-walled open cross-sections are characterized by low wall stiffness to local buckling and low rigidity of the whole cross-section to torsion [4,5]. However, a forced rotation axis at lateral–torsional buckling, e.g., with a suitably rigid cover, results in a significant increase in critical moment and, in many cases, the adverse effects of lateral–torsional buckling can be neglected.
Therefore, in the Class 4 thin-walled I-section beams, protected against lateral buckling, the influence of local stability loss remains, especially because thin-walled I-cross-sections are much less resistant to local buckling than, for example, box cross-sections [6]. This results from the fact that in such a cross-section there are cantilever walls, which are much less resistant to buckling in relation to internal walls [7,8] or cantilever walls with a stiffening bend [9]. However, the use of I-sections (in relation to box sections) allows for simpler shaping of connections and nodes due to free and double-sided access, e.g., to bolt joints. Moreover, continuous beam systems, due to the favourable longitudinal distribution of bending moments, enable the effect of longitudinal stress variation to be used in local stability analysis [10].
The resistance of a thin-walled cross-section is determined using the effective width method [3]. This method consists of determining the critical stresses of local buckling ( where k is the plate buckling coefficient) for individual cross-section walls, assuming their hinged support and constant distribution of stresses along the member length. On this basis, the relative plate slenderness , where is the yield strength of steel) and effective widths of individual walls (plates) are determined , where ρ is the reduction factor.
Reference [6] presents an analysis of the so-called “local” critical resistance (i.e., determined from the condition of the local buckling) and the design ultimate resistance of a continuous beam with a Class 4 thin-walled box section. It was shown that the resistance of a five-span beam can be determined from the supporting segment of the first span. Calculations were made using the critical plate method (CPM) [10]. The following were analyzed with respect to their effect on the “local” critical and design ultimate resistance of box cross-sections: (1) the relative plate slenderness of the flange, and (2) the span length of the continuous beam.
In the case of transversely bent beams made of thin-walled I-sections, which are protected against lateral–torsional buckling, the possibility of local buckling of the compression flange must be taken into account along with, for adequately high cross-sections, the possibility of local buckling of the bending and shear web [11].
This study dealt with the determination of the resistance of a continuous beam (e.g., purlins) with a thin-walled I-section (sheet-welded or composed of two cold-formed channel sections). The calculations accounted for (1) the effect of the elastic restraint of the weakest cross-section wall in the stiffening wall, and (2) the effect of longitudinal stress variation caused by the variability of bending moments.
The analysis was based on the fixed I-section along the whole length of the beam (Figure 1). In this case, the resistance of the continuous beam is determined by the end span. The case where the first (extreme) span is additionally reinforced, and the resistance is determined by the intermediate spans, will be the subject of a separate work.
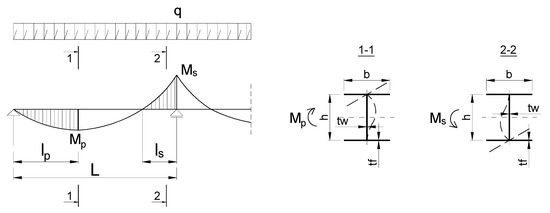
Figure 1.
Static model of a continuous beam end span with thin-walled I-section.
2. Computational Model for Local Cross-Section Buckling
The Class 4 cross-section calculation model according to European standards EC3 [1,2,3] assumes that all component plates of athe cross-section are hinge-supported at their bonding edges. This means that the plates do not interact with each other, and the local buckling of the whole cross-section is determined by the weakest separated plate (cross-section wall).
However, in many technically important cases this model is too conservative, which has been confirmed by numerous experimental studies, e.g., References [5,12,13,14]; theoretical studies, e.g., References [4,7,15,16]; and numerical simulations, e.g., References [17,18,19,20,21,22,23]. This is due to the fact that in real thin-wall cross-sections, there is an effect of mutual, elastic interaction of component plates (walls).
Further, the standard computational model assumes that after determining the relative slenderness of the individual simply supported plates, their respective effective widths are determined, which determine the effective cross-section of the thin-walled member. In the calculation according to EC3, the effect of longitudinal stress variation, which often occurs in practice (e.g., in continuous beams), is also ignored.
In References [19,21], the effect of the mutual elastic restraint of thin-walled section walls was considered. Various load cases were taken into account, ranging from axial compression to pure bending relative to both axes of the section gravity, including interactive loads. Very large sets of simulation results were analyzed via the finite strip method using CUFSM software [18]. Calculations were made for many load cases and approximate analytical formulas were proposed for determining the plate buckling coefficient k [19] and the local buckling half-wavelengths [21] for various types of hot-rolled and welded sections. In Reference [22], in turn, approximation formulas of the k coefficient for hot-rolled sections under simple loads (axial compression, bending relative to the stronger and weaker axis of the cross-section) were given. However, the solutions obtained in References [19,21,22] relate only to constant stress distributions over the length of the structural member.
In References [7,24,25], the impact of longitudinal stress variation in the compressed cantilever plate (which is, for example, a component of an I-cross-section) was taken into account, but only for extreme support conditions (hinge or full restraint).
Meanwhile, in Reference [26], the approximation formulas of the plate buckling coefficient k for an axially compressed cantilever plate with any degree of elastic restraint of the supported edge and longitudinal stress distribution according to the linear function and 2° parabola were derived. At the same time, graphs of k coefficients were determined in References [27,28] for elastically restrained and eccentrically compressed cantilever plates with longitudinal stress variation. Many technically important load cases have been considered.
Reference [10] presents a more accurate computational model of the effect of local buckling on the resistance of thin-walled cross-sections. The critical plate method (CPM) takes into account the effect of both the elastic restraint of the cross-section plates and that of longitudinal stress variation.
3. “Local” Critical Resistance and Design Ultimate Resistance of the Cross-Section
In Reference [10], the bending moment inducing local buckling of a thin-walled cross-section was called the “local” critical moment (), which can be determined from the formula
where —critical buckling stress determined according to a more accurate computational model (CPM) and related to the extreme edge of the cross-section,
– elastic section modulus,
—partial factor for cross-section resistance.
This moment is a limitation of the pre-buckling range of cross-section behavior and determines the limit of validity of Vlasov’s thin-walled bar theory. On its basis, the critical resistance (critical load) of the structure can be determined from the condition of local stability loss of the weakest cross-section.
As regards the reliability of metal building structures, the designer’s interest lies in the so-called design resistance [1], which can be determined from the formula
where —effective section modulus.
The “local” critical moment according to (1) can in practice be treated as the resistance of a thin-walled section in the pre-buckling range, assuming unlimited material elasticity. Therefore, where , the design resistance of a Class 4 cross-section must necessarily be determined using Equation (2).
The so-called design ultimate cross-section resistance defined in References [6,10] (taking into account a more accurate model of local buckling) is a lower (conservative) estimate of the failure load determined for the mechanism of plastic hinge [29]. The resistance of a thin-walled cross-section, which is obtained during the failure phase, cannot be applied in the design of building structures. However, it can be applied, for example, in designing so-called mechanical energy absorbers [30].
4. The Idea of the Critical Plate Method (CPM)
The idea of the critical plate method [10] consists of determining the buckling stress of the weakest component plate of the cross-section, taking into account its elastic restraint in adjacent plates (walls), for which the buckling stresses are higher. In addition, the method allows the effect of longitudinal stress variation to be taken into account. In this computational model, the so-called critical plate (CP) must be identified, which determines the local buckling of the section in a given loading condition.
The elastic restraint against longitudinal edge rotation of the CP results from the action of the adjacent restraining plate (RP). For example, for certain proportions of the bending I-section [10], the critical plate may be a compressed cantilever wall of the width as a outstanding part of the flange width , and the restraining plate will be a web of height . The buckling stress for the CP so determined is higher than that determined under the assumption of its simple support. This is especially true for cantilever plates, for which the elastic restraint against rotation of the longitudinal supported edge significantly affects the buckling stress values. The difference in plate buckling coefficients for an uniform compressed cantilever plate between a hinged support () [3] and a fully restrained support () [7,19] is almost threefold.
In References [19,21], attention was paid to the additional phenomenon of the so-called mutual constraint of the component walls of the cross-section (affecting the increase of buckling stress), despite the fact that the theoretical critical stresses of individual walls (determined under the assumption of their hinged support) are equal. This was found to be due to the different buckling lengths of the internal and cantilever plates. Therefore, in Reference [21], approximation formulas for the local buckling half-wavelengths of the full cross-section were derived. This length is between the buckling length for a separate, simply supported, and fully restrained plate, on which the critical resistance of the full cross-section depends. Knowledge of local buckling half-wavelengths is useful for the direct definition of geometric imperfections in analytical and numerical models.
On the other hand, in Reference [10], it was assumed that in a thin-walled section where thought-separated hinge-supported walls theoretically have the same buckling stresses, the effect of mutual constraint is insignificant (i.e., increases the buckling stress from 5 to 20%) and can be conservatively ignored. On this basis, so-called “zero” cross-sections were defined, in which the thought-separated hinge-supported plates have the same buckling stresses, and the resistance of such cross-sections can be calculated according to the standard procedure [1,3].
The distinction between “zero” and “non-zero” cross-sections significantly simplifies the identification of the critical plate in the latter and allows for a slightly conservative (safe) estimation of the buckling stress. Therefore, the elastic restraint coefficient of the CP in RP can be estimated using Equation (3) [10]
where rotational spring stiffness equal to the bending moment created during rotation by unit angle (), —CP width, —plate flexural rigidity according to the formula
where for E = 210 GPa and ν = 0.3, it can be approximately assumed that , —CP thickness.
The restraint coefficient according to Equation (3) varies from for simple support to for full restraint.
When the above-mentioned effects are taken into consideration, it is possible to determine the critical stress causing the cross-section local buckling in a more accurate way. Based on the critical stress, the following can be determined: (1) the “local” critical resistance of the cross-section , (2) the effective width of the critical plate, and (3) the design ultimate resistance of the cross-section according to Reference [10].
5. Algorithm of the CPM Method for Thin-Walled I-Cross-Sections under Bending
For the transverse bending of I-beams of a Class 4 cross-section (Figure 2), their resistance is usually determined by local buckling of the compression flange (of width and thickness ) or local buckling of the web (of height and thickness ) under bending and shear interaction. Because of their geometric topology, those cross-sections were categorised in Reference [10] as part of the group of so-called “simple” cross-sections.
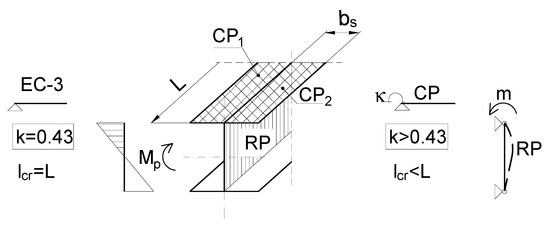
Figure 2.
Division of I-cross-section into critical plate (CP) and restraining plate (RP) for
The ultimate height of the cross-sections at which the compression flange buckling and web in-plane bending with a slight impact of shear stresses () occur almost simultaneously can be determined using Equation (5) [10]
where —basic buckling coefficient for the hinged supported i-th plate at given load distribution ( for axial cantilever plate compression, for bending in the plane of the web plate).
For , it is the compression flange that determines local buckling of the cross-section, whereas for the weakest wall is the web under in-plane bending.
For the mean proportion of shear stresses () Equaiton (5) can be modified to the form:
where: —critical stress for the web plate in shear.
However, if there is a large proportion of transverse forces in the slender webs (plates supported at four edges) that are part of beam cross-sections, shear stresses may need to be considered more closely, as their contribution to local loss of web stability may be significant. Appropriate formulas for elastic strain energy and work done by external forces allowing critical stresses to be determined (using the energy method) for internal plates loaded (within their plane) with bending with high shear were derived in Reference [11].
For thin-walled I-sections, for which according to Equation (6), the CPM assumptions are as follows: (1) the compression flange of the cross-section consists of two critical plates (CPs) which width of , which are supported on a web plate of the height , (note: dimensions and can be determined based on the rules given in Reference [10]); (2) a single CP acts as a cantilever plate, with one side elastically restrained against rotation; (3) the CP to RP connection (i.e., the web) is rigid (i.e., on the longitudinal edge of their connection, the conditions of continuity of displacements (rotation angles) and forces (bending moments), are met); (4) the transverse edges of the plates (CP and RP) are simply supported on the segment ends; and (5) the thin-walled bar segment (with the length ), as in Reference [6], is defined as follows: (a) for constant longitudinal stress distribution, as the distance between the so-called buckling nodal lines, (b) for longitudinal stress variation, as the distance between transverse stiffeners (diaphragms, ribs, or supports) that maintain a rigid cross-section contour, but not longer than the range of the compression zone in the critical plate [26]. The conditions under which Assumption 3 can be adopted were discussed in Reference [10].
The case of I-sections with high and slender webs (at acc. to Equation (6)), where the “local” critical resistance is determined by the buckling of the bent and shear web, will be discussed in a separate study.
The calculation algorithm is as follows:
- (1)
- Division of the cross-section into component plates according to Figure 2;
- (2)
- Identifying CP for a “simple” cross-section based on the conditionwhere —Euler stress for the i-th plate according to the formula: .Note: for acc. to Equation (6), the critical plate (CP) is the cantilever wall of the compression flange and the rigid plate (RP) is the web;
- (3)
- Adoption of the initial CP edge restraint coefficient value (for the so-called zero step), e.g., ;
- (4)
- Estimation of the critical length () for a single half-wave of CP buckling [26] according to the formula
- (5)
- Determination of the coefficient [31], depending on the static scheme and the way of forcing (loading) RP by buckling CP (Figure 2) for the critical length according to Equation (9) [10]where —RP width;
- (6)
- Determination of according to the formulawhere k*—buckling coefficient according to a more accurate calculation model.The k* coefficient can be determined on the basis of Reference [26] from the following formulas:
- for linear stress distribution (Figure 3a),
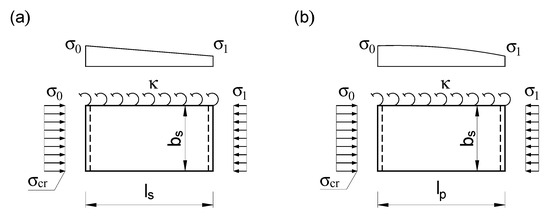 Figure 3. Longitudinal stress distribution in a cantilever plate: (a) linear, (b) non-linear according to 2° parabola.
 - for non-linear stress distribution (according to 2° parabola, Figure 3b),where —longitudinal stress distribution coefficient (Figure 3), .The plate buckling coefficient of an elastically restrained and infinitely long cantilever plate can be determined according to Reference [26], using the formulaOn the other hand, Reference [28] presents a simplified formula for within the range in the form of
- (7)
- Estimation of the critical stress for a RP bent in its plane (width ) [32] for one half-wave of CP buckling length according to Point 4.
- (8)
- Determination of rotational spring stiffness according to Equation (17) and the restraint coefficient according to Equation (3) for the first (i = 1) and subsequent iteration steps.where —parameter of geometrical configuration of plates in contact with the j-th edge (for a welded I-section [10]; note: for an I-section made up of two channel sections , i.e., one web with thickness stabilizes one CP of the flange on one edge), RP flexural rigidity,—RP thickness;
- (9)
- Repetition of Steps (4) to (8) up to the moment when ;
- (10)
- according to Equation (11) is the sought buckling stress for CP;
- (11)
- Determination of the “local” critical resistance of the cross-section according to Equation (1);
- (12)
- Determination of the design ultimate resistance of the cross-section according to Equation (2) for the coefficient calculated with the following assumptions [10]:
- (a)
- the slenderness of the critical plate (CP) shall be determined from the buckling stress determined by Step 10 (i.e., taking into account the elastic restraint effect of the cantilever plate and the effect of longitudinal stress variation);
- (b)
- for the web (rigid plate RP), a simple support shall be provided at the same edge;
- (c)
- the boundary conditions at the other edge of the RP have a slight impact on the result of the calculations (conservatively, simple support can also be assumed here),
- (d)
- the effect of possible longitudinal stress variation in RP is insignificant and can be ignored,
- (e)
- the effective widths so determined “shall be folded” into an effective cross-section, for which is determined.
The algorithm proposed above, compared to the classical version of the effective width method, allows for a more accurate consideration of the behavior of a thin-walled section, the resistance of which is determined by the local buckling phenomenon. A more detailed comparative analysis on this issue is presented in Reference [10].
6. Calculation Method for a Continuous I-Beam
In the case of a multi-span continuous uniformly loaded beam (Figure 4), a non-linear bending moment distribution occurs in the first (end) span with maximum values ( and ). For the range (), the graph is convex, while for the range the graph is concave. Such longitudinal distributions of cause non-linear (along the length of the beam) normal stress distributions , which may cause local loss of stability [6].
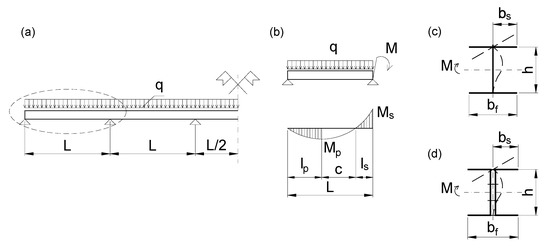
Figure 4.
Static scheme of a beam: (a) load distribution, (b) moment diagram for the first (extreme) span, (c) welded I-section, (d) 2C compound I-section.
Reference [33] showed that in the case of non-linear stress distribution for the full span range (Figure 5), the k coefficient takes basically the same values as those determined for the reduced range (e.g., for differences not exceeding 2%). However, in Reference [26], it was shown that if the stress mark changes, the design segment length can be limited to the range of the compression zone. This is applicable to the support zone of a continuous beam. Therefore, similarly to Reference [6], in order to take into account the effect of longitudinal stress variation when determining the span cross-section resistance, it is sufficient to assume the segment length to be , and for the support cross-section to be a segment with the length of .
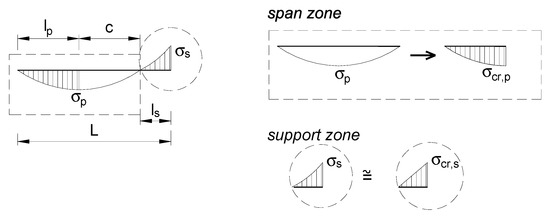
Figure 5.
Calculation model of the first (end) span of a uniformly loaded continuous beam.
For the span segment, there is a non-linear (according to 2° parabola) stress distribution. For the support segment, however, the concave stress distribution can be conservatively approximated by the linear distribution.
7. Example of Using CPM to Determine the Resistance of a Continuous I-Beam
7.1. Statics and Cross-Sectional Forces
The calculations were carried out, among others, for five-span continuous beams (e.g., purlins) (cf. Figure 4) with a constant span length L and thin-walled I-sections either (a) welded from thin sheets (I; Figure 4b,c) or (b) composed of two cold-formed channel sections (type 2C; Figure 4d). It was assumed that the above-mentioned sections after welding (I) or cold-forming (2C) were subjected to appropriate heat treatment to reduce the impact of residual stresses. In References [23,34], the influence of remaining welding stress on the behavior and resistance of welded I-sections was investigated. It was shown that this effect is greatest in the case of axial compression, but in some cases, bending elements should also be considered. Therefore, the effect of residual stresses on the local buckling of continuous beams with welded I-sections will be described in a separate study.
The beams were under continuous, uniformly distributed load. It was assumed that the elements were structurally protected against lateral–torsional buckling. In this case, the resistance of the beam depends on the resistance of the most stressed cross-section.
The relationship between and (Figure 4) in the first span was irrespective of the type of cross-section and the span length. In the support cross-sections of the beam, two-sided stiffening ribs were used to transfer the support reactions without causing distortion of the thin-walled cross-section.
7.2. Welded Section
7.2.1. Calculation of Critical Resistance According to CPM
Detailed calculations were carried out for a five-span continuous beam with a span length and a thin-walled I-section welded from sheets of dimensions I-300×tw×250×tf (I-h×tw×b×tf) for t = tf = tw = 5, 6, 7, and 8 mm made of S355-grade steel. It should be noted that in this case, adopting a smaller web thickness, i.e., tw < tf, led to a significant reduction in the elastic restraint of the compressed flange in the plate of the web. This resulted in a much greater reduction in the cross-sectional resistance than that resulting from a reduction in the elastic section modulus caused solely by a reduction in the thickness of tw.
Table 1 shows the results of the calculation of “local” critical moments for the ruling cross-sections: span , support , and the critical loads determined from them. The symbol indicates the critical load value determined from the condition of reaching in the support cross-section, and the symbol indicates that determined from the condition of reaching in the span cross-section. (Note: in Table 1, the values of the moments and are given as absolute values). The critical resistance of the beam is determined by the minimum load .

Table 1.
Summary of critical results according to critical plate method (CPM) and European Eurocode 3 (EC3) for the I-300×t×250×t section and four wall thickness variants.
Furthermore, in Table 1, the symbol indicates the critical cross-sectional moment determined according to calculated according to EC3 [3], and the symbol stands for the minimum value of critical load determined on the basis of . Due to the simplified calculation model used in the standard, does not depend on the longitudinal stress distribution or on the degree of mutual elastic restraint of the cross-section component walls. It therefore determines the critical resistance of both the span cross-section (p) and the support cross-section (s).
Note: in the example under consideration, determined on the basis of the parameter according to Equation (6), 880 mm and was almost three times greater than the cross-section height h = 300 mm. Of course, the determination of the parameter according to Equation (6) was iterative because the shear stresses and depend on the cross-section height, among other things. This check calculation allows the correct identification of the critical plate in a given cross-section loading condition to be confirmed.
A comparison of the results in Table 1 shows that was approx. 18.7% higher than . This was due to different stress distributions and different reliable lengths of the span () and support () segments. Despite the fact that , the critical resistance of the beam was determined by the support zone, because: . The percentage increase of in relation to was about 121%. The same relationship occurred for the corresponding critical loads .
7.2.2. Finite Element and Finite Strip Analysis
The critical stresses listed in Table 1 ( were verified via the finite element method (FEM) using ABAQUS software [35], and the finite strip method (FSM) using CUFSM software [18].
The FEM enables the analysis of local buckling of the extreme span of a continuous beam by taking into account both the effect of mutual elastic restraint of cross-section’s components plates, as well as the effect of longitudinal stress variation. However, the commonly used finite strip method (FSM) allows the effect of mutual elastic restraint of cross-section’s component plates to be considered, but with the assumption of a constant stress distribution over the length of the member.
For the numerical simulations in ABAQUS v. 6.12, the first (extreme) span of a continuous beam was modeled. Due to the small wall thickness (compared to other dimensions), the cross-section’s geometry was simplified to so-called centerline. S4R shell elements (four nodes with six degrees of freedom in the node) were used, and the dimensions of the finite element were assumed to be 12.5 × 12.5 mm. Such division made it possible to obtain technically sufficient accuracy while reducing calculation time. The transverse load was applied in the form of uniform pressure (p = 0.1 N/mm2) on the upper flange with a width of b = 250 mm, which corresponded to a uniform load of q = 25 kN/m. Conversely, the loading with the “corresponding” support moment of the value of Ms = 0.105 × qL2 = 42 kNm (where 0.105 is the coefficient from Winkler’s tables) was performed by means of loading the support cross-section with a stress block. The boundary conditions in the support cross-sections were assumed to be continuous constraints perpendicular to each of the component plate. An additional tie securing the beam against displacement along the longitudinal axis was applied in the gravity axis of one of the support sections. In Figure 6b, a general view of FEM model of the I-300×5×250×5 cross-section in ABAQUS software is presented. Figure 6 shows the support ties used, and Figure 6c shows the method of loading with the support moment Ms. The critical load calculations were performed using the “buckling” procedure.
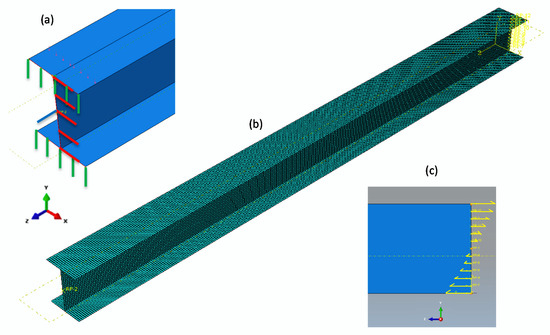
Figure 6.
Finite element method (FEM) model of the I-300×5×250×5 beam: (a) boundary conditions, (b) division into finite elements, (c) method of loading with the support moment.
Figure 7 shows the local buckling mode (axonometric view and side view) corresponding to the first (smallest) eigenvalue of the critical load multiplier (qcr,s = 3.121 × q = 78.02 kN/m). Maximum local deflections of the cross-section occurred in the support zone.
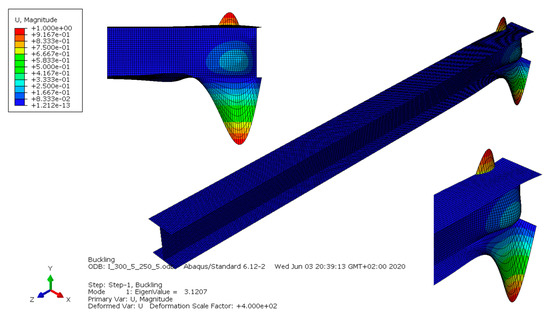
Figure 7.
Local buckling of I-300×5×250×5 beams in the support zone.
Figure 8 shows the local buckling mode (axonometric view and side view) corresponding to the third (second positive) eigenvalue of the critical load multiplier (qcr,p = 3.568 × q = 89.21 kN/m). In this case, the maximum local deflections of the cross-section occurred in the span zone.
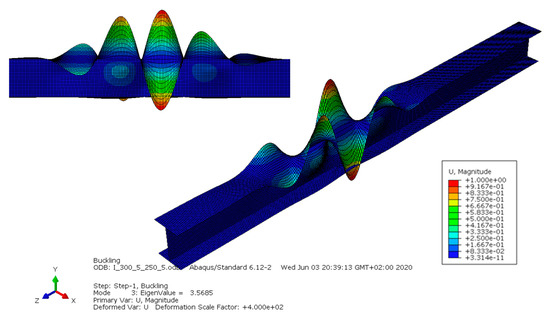
Figure 8.
Local buckling of I-300×5×250×5 beams in the span zone.
For numerical simulations in CUFSM v.5.04, the I-section was also simplified to centerline geometry, and then divided into 48 finite strips (16 per flange and 16 in the web). The load was applied in the form of a stress block, causing bending about the stronger axis of the cross-section.
7.2.3. Comparison of Critical Stress Results
Table 2 compares the values of critical stresses for supporting and span sections, determined according to: (1) ABAQUS, (2) CPM, (3) CUFSM, (4) Reference [19], (5) Reference [22], and (6) EC3. It should be emphasised that comparison of stresses determined according to Reference [22] was for reference only, because the formulas derived in Reference [22] apply only to hot-rolled sections, and not to the welded ones.
Table 2.
Comparison of critical stresses determined by several methods for the I-300×t×250×t section and four wall thickness variants.
From the comparison of the values given in Table 2, it follows that the new calculation model adopted in this work using the critical plate method (CPM) gave very good congruence with the results obtained from the ABAQUS software, which were adopted as a reference. This applied to both the support section (first eigenvalue, compliance approx. 0.99) and the span section (second eigenvalue, congruence approx. 0.985). The calculations obtained from CUFSM also gave very good results in the span section (congruence approx. 0.96), while in the support section, where a large stress gradient occurred, and on which the critical resistance of the beam depends, congruence was around 0.81. A similar situation occurred when comparing the results obtained from the formulas according to Reference [19] (span section about 0.91, support section about 0.77). However, a worse congruence of the results obtained according to Reference [22] (span section about 0.78, support section about 0.66) resulted from the different, in relation to hot-rolled sections, geometrical proportions of the sections considered in this study. The largest differences (span section about 0.53, support section about 0.45) were obtained from calculations made according to EC3. The local buckling half-wavelengths determined in this case were: (1) according to CPM, Equation (9) = 307 mm; (2) according to CUFSM, = 340 mm; and (3) according to Reference [21] = 353 mm. It should be noted that in this case, the following rule applies: for higher critical stresses, there is a shorter local buckling half-wavelength.
The ompared computational methods showed that very good congruence of results in relation to finite element analysis (ABAQUS) was obtained by the critical plate method (CPM), which takes into account both effects. Methods that consider the effect of mutual elastic restraint of cross-section component plates give a good approximation of critical stresses in those beam zones where there is no significant variation of stresses in the longitudinal direction (e.g., span cross-section). In contrast, calculations according to EC3 are the most conservative, because they omit both effects.
7.2.4. Design Ultimate Resistance
Table 3 shows the design values of the ultimate resistance for the reliable cross-sections: span , support , and the design ultimate loads ) determined from them according to CPM. The symbol indicates the ultimate load value determined from the condition of reaching in the support cross-section, and the symbol from the conditions needed to achieve in the span cross-section. (Note: in Table 3, the values of the moments and are given as absolute values). The ultimate resistance of the beam was determined by the minimum load .
Table 3.
Summary of ultimate resistance results according to CPM and EC3 for the I-300×t×250×t section and four wall thickness variants.
Furthermore, in Table 3, the symbol indicates the design cross-section resistance determined according to EC3 [1,3], and the symbol indicates the minimum value of ultimate load determined on the basis of .
Comparison of the results displayed in Table 3 showed that for a wall thickness of t = 5, 6, and 7 mm, the resistance was approx. 4.5% higher than . This was due to different stress distributions and different lengths of the span () and support () segment. Despite the fact that , the design ultimate resistance of the beam is determined by the support zone, because . However, for wall thickness t = 8 mm, the difference between and was only 0.4%. This resulted from the fact that the cross-section loaded in this way, calculated according to CPM, can be classified as a Class 3 cross-section, for which the value of the reduction factor is close to one. In contrast, the same cross-section calculated according to EC3 (due to low σcr,0) is still treated as a Class 4cross-section (in this case, ). The percentage increase of in relation to was about 23% for t = 5, 6, and 7 mm, and about 18% for t = 8 mm. The same relationship occurred for the corresponding ultimate loads .
Figure 9 shows the effective cross-sections of the I-300×5×250×5 section determined in the span and support cross-sections according to CPM (Figure 9a,b) and EC3 (Figure 9c,d). For example, the sum of the effective widths of the compressed bottom flange of the support cross-section (which determines the resistance of the beam) determined according to CPM was about 39% larger than that determined according to EC3 (see Figure 9b,d). The shift of the neutral axis of the effective cross-section according to CPM in relation to the gross cross-section was e = 12.2 mm and was 51% smaller than e = 24.9 mm calculated according to EC3. This effect additionally affected the differentiation of the effective modulus of the reliable cross-sections and, consequently, the differences in the design ultimate resistance of the beam determined according to CPM and EC3.
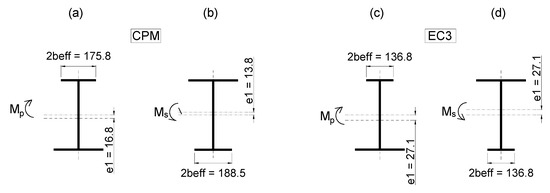
Figure 9.
Effective cross-sections of the I-300×5×250×5 section according to CPM and EC3 methods. (a) span cross-section acc. CPM, (b) support cross-section acc. CPM, (c) span cross-section acc. EC3, (d) support cross-section acc. EC3.
7.3. I-Section Consisting of Two Cold-Formed Channel Sections (2C)
For compound sections (type 2C), detailed calculations were made for five-span beams with a constant span length for variants of L = 4, 5, 6, and 7 m made of S355-grade steel. For comparison purposes, the analyzed dimensions of 2C sections (Figure 10) with the contour of Sk250×250×t box sections (for t = 2, 3, 4, and 5 mm) presented in Reference [6] were used. In this case, the elastic gross section bending moduli for Sk and 2C sections were equal.
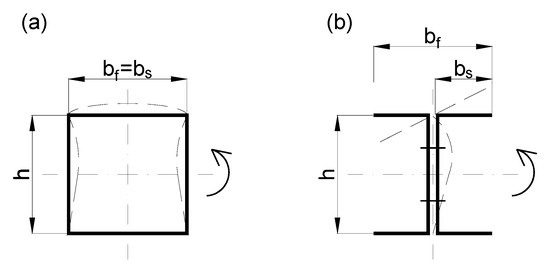
Figure 10.
Compared cross-sections of continuous beams: (a) box cross-section according to Reference [6], (b) compound cross-section type 2C.
Table 4 presents the results of the analysis of the effect of the span length on the “local” critical moment value and the resistance calculated according to CPM and EC3 [1,3] for the 2C-250×250×4 (2C-h×b×t) section. For the support segment decisive of the beam resistance, the difference between the critical load value obtained according to CPM method in relation to EC3 ranged from + 158% for up to + 141% for . The difference between the load ultimate value ranged from + 22% for up to +20% for .
Table 4.
Summary of results according to CPM and EC3 for the 2C-250×250×4 section and four span-length range variants.
Note: for comparison, Table 4 also includes the values of and determined according to CPM for the case where the resistance of the beam is decided by the span section. This would be the case, for example, in protection against local buckling of the support segment.
Table 5 compares the “local” critical resistances (, ) of beams with box Sk250×250×4 sections according to Reference [6] and 2C-250×250×4 compound I-sections depending on the span length of the continuous beam (L = 4, 5, 6, and 7 m).
Table 5.
Comparison of “local” critical resistances of box sections (Sk) and compound I-sections (2C) depending on the span length.
Comparison of the values presented in Table 5 shows that for 2C sections, where critical resistance is determined by cantilever walls, “local” critical moments determined according to CPM were lower on average by about 25–26% in relation to corresponding box sections [6], and the reduction was as much as 54%. The same relationship occurred when comparing the respective critical loads . Meanwhile, the relation for 2C sections in relation to Sk sections increased by as much as 62%. This effect resulted from a much larger reserve of the critical resistance of the elastically restrained cantilever plate (which determines the resistance of the 2C section) in relation to the internal plate of the compression flange, which in turn determines the resistance of the box section. In fact, this is the difference between the critical stresses for the plates (cantilever and internal) that are simply supported in relation to the same plates that are elastically restrained at one or two edges, respectively. For comparison, the relation between the buckling coefficient for the compressed cantilever plate when fully restrained ( 1.25 [7,19]) and simply supported ( 0.43 [3]) was = 1.25/0.43 = 2.91. For an internal plate, on the other hand, the same relation was much smaller and was = 6.97/4 = 1.74. Of course, this does not change the fact that the critical and ultimate resistance of an internal plate is much higher than that of a cantilever plate with the same geometrical and material parameters.
In turn, Table 6 compares the design ultimate resistances (, ) of the same box section beams [6] and 2C compound I-sections, also depending on the span length. For the 2C sections, the design ultimate resistances determined according to CPM were on average 4–5% lower than the corresponding box sections. The reduction, however, of was nearly 14%. The same relationship occurred when comparing the respective ultimate loads . In this case, the relation for the 2C sections in relation to Sk sections increased by 11%.
Table 6.
Comparison of design ultimate resistances of box sections (Sk) and I-sections (2C) depending on the span length.
Table 7 presents the results of the analysis of the slenderness effect () of the compressed cantilever wall of 2C section on the value of “local” critical moment and the design ultimate resistance determined according to CPM and EC3. The calculations were made for a continuous beam with a span length of L = 4 m. With the reduction of section wall thickness, the critical load decreased, whereby the difference between the results obtained according to CPM and EC3 was about +158% regardless of the slenderness of the critical plate. The reduction in thickness also reduced the design ultimate resistance and the ultimate load , whereby the difference between the results according to CPM and EC3 was about +23% for t = 5 mm and about +16% for t = 2 mm.
Table 7.
Summary of results according to CPM and EC3 for the 2C-250×250×t section and four wall thickness variants.
Note: for comparison, Table 7 also includes the values of and determined according to CPM for the case where the resistance of the beam is decided by the span section. This would be the case, for example, in protection against local buckling of the support segment.
Table 8 compares the “local” critical resistances (, ) of beams with box sections [6] and compound I-sections (2C) depending on the wall thickness (t = 5, 4, 3, and 2 mm).
Table 8.
Comparison of “local” critical resistances of box sections (Sk) and compound I-sections (2C) depending on the wall thickness.
Comparison of the values presented in Table 8 shows that for 2C sections, where critical resistance is determined by cantilever walls, “local” critical moments determined according to CPM were lower in relation to corresponding box sections by approx. 24.3% for t = 5 mm, up to 27.3% for t = 2 mm. For , the differences ranged from 25.4% for t = 5 mm to 28.3% for t = 2 mm. For , the reduction was 53.5% for t = 5 mm to 55.3% for t = 2 mm. The same relationship occurred when comparing the respective critical loads . In this case, the relation for 2C sections in relation to Sk box sections increased by 62.7%.
In turn, Table 9 compares the design ultimate resistances (, ) of the same beams with box sections Sk according to Reference [6] and compound I-sections (2C), also depending on the wall thickness. For 2C sections, the design ultimate resistances determined according to CPM, in relation to the corresponding box sections Sk, were reduced by 3.1% for t = 5 mm to 5% for t = 2 mm. For the differences ranged from 3.8% for t = 5 mm to 5.1% for t = 2 mm. In contrast, the reduction in ranged from 13.6% for t = 5 mm to 11% for t = 2 mm. The same relationship occurred when comparing the respective ultimate loads . In this case, the relation for 2C sections in relation to Sk box sections increased from 6.9% for t = 2 mm to 12.2% for t = 5 mm
Table 9.
Comparison of design ultimate resistances of box sections (Sk) and I-sections (2C) depending on wall thickness.
Figure 11 shows the relation between the “local” critical moment (Figure 11a) and the design ultimate resistance (Figure 11b) as a function of slenderness of the critical cantilever plate of a compound I-section (2C).
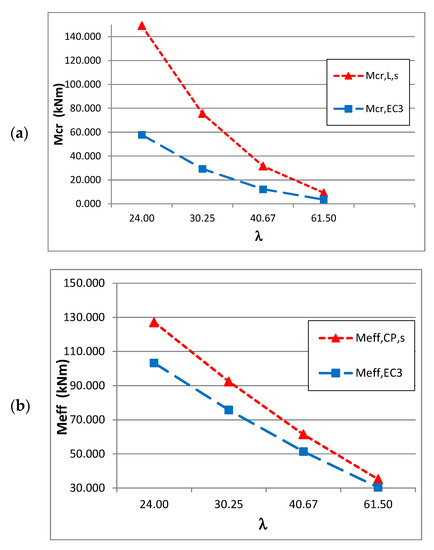
Figure 11.
Graphs of (a) and (b) as a function of slenderness .
Comparison of the graphs shown in Figure 11a showed that the “local” critical resistance and the design ultimate resistance decreased non-linearly with increasing slenderness of the cross-section wall. The difference between the value determined by the CPM method and the standard approach according to EC3 was constant in each case of wall thickness and was +158.1%. In contrast, the decrease of (Figure 11b) was mildly non-linear. The percentage increase of the ultimate resistance according to CPM in relation to EC3 was basically directly proportional to the increase of the cross-section wall thickness from about 16% for t = 2 mm ( to about 23% for t = 5 mm (.
The relation between the critical load (Figure 12a) and the ultimate load (Figure 12b) as a function of the span length is shown in Figure 12.
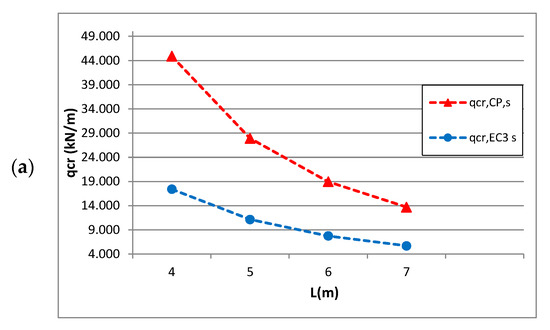
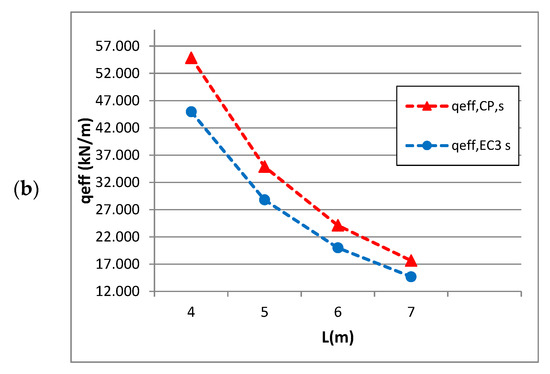
Figure 12.
Graphs of (a) and (b) as a function of length .
Comparison of the graphs shown in Figure 12 showed that an increase in the span length caused a non-linear decrease both in and . Moreover, it can be stated that the shorter the span, the greater the percentage increase of the critical resistance determined according to CPM in relation to EC3 (from 158% for short beams L = 4 m, to 141% for long beams L = 7 m). For ultimate resistance (Figure 12b), the differences in results ranged from 22% for L = 4 m to about 20% for L = 7 m, respectively).
8. Summary and Conclusions
The new calculation model presented in this paper for the local stability loss of the first continuous beam span, consisting of separate local buckling analysis for the span segment (loaded with a non-linear “convex” bending moment distribution) and the support segment (in which the “concave” moment distribution was approximated by a linear distribution) was successfully verified by numerical simulations using the finite element method.
To improve the accuracy of the calculation of the critical resistance of a continuous beam with a Class 4 cross-section (in which large stress gradients in the longitudinal direction are found), it was necessary to take into account both the effect of the mutual elastic restraint of the cross-section component plates, and the longitudinal stress variation.
The use of the critical plate method (CPM) according to Reference [10] to determine the “local” critical resistance and the design ultimate resistance of a thin-walled I-section led to a more optimal design of such elements. In this method, a more accurate calculation model is used, which takes into account both the effect of mutual elastic restraint of the cross-section component plates and the effect of longitudinal stress variation. The increase in the resistance that occurs in this case, compared to the EC3 calculation, results from a more faithful representation of the behavior of the thin-walled structural member in the engineering calculation model.
At the same time, it should be noted that taking into account the above effects has only a minor impact on the complexity of calculations, which can be easily algorithmized and presented as relatively simple spreadsheets. This is due, among other things, to the simplified identification of the so-called critical plate and the definition of the so-called “zero” cross-sections [10]. Such assumptions allow for a slightly conservative assessment of the cross-section resistance. In this sense, the CPM can be used both for preliminary design or verification of FEM calculations and, in many technically important cases, for basic design.
The “local” critical resistance defines the range of pre-critical behavior of a section and constitutes the limit of validity of the thin-walled bar theory with a rigid cross-section contour (the Vlasov theory), assuming unlimited elasticity of the material.
To determine the design ultimate resistance of a thin-walled cross-section, the effective width method applied to the individual plates can be used along with the additional assumptions formulated in Section 5, Step 12. The relative slenderness of the component plates is determined from the respective critical stresses. For CP, these are stresses determined by taking into account the restraint coefficient and longitudinal stress variation. For the RP, simple support and a constant stress distribution along the length can be assumed on the same edge. Such assumptions allow for a technically precise and sufficient calculation of the resistance of a thin-walled cross-section.
In the case of a continuous beam under uniform load, the segment that determines the resistance of the structure is the support segment () of the first span, where the “local” critical resistance is first achieved, followed by the design ultimate resistance.
For the analyzed continuous beam made of a welded section I-300×5×250×5 and calculated according to CPM (Section 7.2), a 121% increase in the critical resistance was determined, which translated into a 23% increase in the design ultimate resistance in relation to the calculations done according to EC3.
In the case of the same continuous beam but made of a compound section 2C-250×250×4 and calculated according to CPM, there was a 158% increase in the critical resistance , which translated into a 22% increase in the design ultimate resistance in relation to the calculations done according to EC3.
The comparison of the resistance parameters of continuous beams with box sections Sk according to Reference [6] and the compound sections 2C compatible with them showed that in the calculation according to CPM, the percentage differences (to the disadvantage of open sections 2C) were as follows: (1) for critical resistance from about 24% to 27% (more than 53% according to EC3), (2) for design ultimate resistance only from 3 to 5%, but according to EC3, more than 13%. In this case, the use of CPM gave greater possibility to use the resistance reserve of the so-called “non-zero” cross-sections, in which the effect of mutual elastic restraint of cross-section component plates can be applied.
The advantage of 2C sections over box sections (assuming that the beam is protected against lateral buckling) is the greater ease of constructing joints and assembly nodes due to free and two-sided access to mechanical connectors (e.g., bolts). In the case of beams sensitive to lateral buckling, on the other hand, the use of closed cross-sections is more optimal due to their much higher torsional stiffness compared to open cross-sections.
If there are significant residual stresses (compressive) in a thin-walled cross-section, the critical stress of local buckling is reduced. This applies especially to axially compressed welded sections [34,35]. Therefore, further testing of welded components with a high proportion of residual stresses must take into account their adverse effects on local buckling of the cross-sections.
In open cold-formed sections (produced without welding), however, the adverse effect of residual stresses caused by bending is usually insignificant [36] and can be omitted in most cases (this effect is further reduced by the beneficial effect of increasing the strength of steel in cold-formed corners).
Beams with thin-walled I-sections, for which the ultimate resistance is determined by local buckling of the bent and shear web, and continuous beams with reinforced end spans will be subject to further study by the authors.
Author Contributions
Introduction was prepared by A.S. Mathematical description were written by A.S., K.B. Results were obtained by K.B., A.S. The analysis of the results and conclusions was written by A.S. All authors have read and agreed to the published version of the manuscript.
Funding
This research received no external funding.
Conflicts of Interest
The authors declare no conflict of interest.
References
- EN 1993-1-1, Eurocode 3: Design of Steel Structures—Part 1-1: General Rules and Rules for Buildings; European Committee for Standardization: Brussels, Belgium, 2005.
- EN 1993-1-3, Eurocode 3: Design of Steel Structures—Part 1-3: General rules—Supplementary Rules for Cold-Formed Members and Sheeting; European Committee for Standardization: Brussels, Belgium, 2006.
- EN 1993-1-5, Eurocode 3: Design of Steel Structures—Part 1-5: Plated Structural Elements; European Committee for Standardization: Brussels, Belgium, 2006.
- Szychowski, A. A theoretical analysis of the local buckling in thin-walled bars with open cross-section subjected to warping torsion. Thin-Walled Struct. 2014, 76, 42–55. [Google Scholar] [CrossRef]
- Kowal, Z.; Szychowski, A. Experimental determination of critical loads in thin-walled bars with Z-section subjected to warping torsion. Thin-Walled Struct. 2014, 75, 87–102. [Google Scholar] [CrossRef]
- Brzezińska, K.; Szychowski, A. Stability and resistance of steel continuous beams with thin-walled box sections. Arch. Civ. Eng. 2018, 64, 123–143. [Google Scholar] [CrossRef]
- Bulson, P.S. The Stability of Flat Plates; Chatto and Windus: London, UK, 1970. [Google Scholar]
- Yu, C.; Schafer, B.W. Effect of longitudinal stress gradient on the ultimate strength of thin plates. Thin-Walled Struct. 2006, 44, 787–799. [Google Scholar] [CrossRef]
- Hancock, G.J. Cold-formed steel structures. J. Constr. Steel Res. 2003, 58, 473–487. [Google Scholar] [CrossRef]
- Szychowski, A. Computation of thin-walled cross-section resistance to local buckling with the use of the Critical Plate Method. Arch. Civ. Eng. 2016, 62, 229–264. [Google Scholar] [CrossRef]
- Jakubowski, S. The matrix analysis of stability and free vibrations of walls of thin-walled girders. Arch. Budowy Masz. 1986, XXXIII, 357–376. (In Polish) [Google Scholar]
- Rusch, A.; Lindner, J. Load carrying capacity of thin-walled I-sections subjected to bending about the z-axis (in German). Stahlbau 1999, 68, 457–467. [Google Scholar] [CrossRef]
- Beale, R.G.; Godley, M.H.R.; Enjily, V. A theoretical and experimental investigation into cold-formed channel sections in bending with the unstiffened flanges in compression. Comput. Struct. 2001, 79, 2403–2411. [Google Scholar] [CrossRef]
- Kotełko, M.; Lim, T.H.; Rhodes, J. Post—Failure behaviour of box section beams under pure bending (an experimental study). Thin-Walled Struct. 2000, 38, 179–194. [Google Scholar]
- Jakubowski, S. Buckling of thin-walled girders under compound load. Thin-Walled Struct. 1988, 6, 129–150. [Google Scholar] [CrossRef]
- Nassar, G. Das Ausbeulen dünnwandiger Querschnitte unter einachsig aussermittiger Druckbeanspruchung. Der Stahlbau H 1965, 10, 311–316. [Google Scholar]
- Papangelis, J.P.; Hancock, G.J. Computer analysis of thin-walled structural members. Comput. Struct. 1995, 56, 157–176. [Google Scholar] [CrossRef]
- Schafer, B.W.; Ádány, S. Buckling analysis of cold-formed steel members using CUFSM: Conventional and constrained finite strip methods. In Proceedings of the Eighteenth International Specialty Conference on Cold-Formed Steel Structures, Orlando, FL, USA, 26–27 October 2006. [Google Scholar]
- Gardner, L.; Fieber, A.; Macorini, L. Formulae for calculating elastic local buckling stresses of full structural cross-sections. Structures 2019, 17, 2–20. [Google Scholar] [CrossRef]
- Ciesielczyk, K.; Rzeszut, K. Locla and distortional buckling of axially loaded cold rolled sigma profiles. Acta Mech. et Autom. 2016, 10, 218–222. [Google Scholar] [CrossRef]
- Fieber, A.; Gardner, L.; Macorini, L. Formulae for determining elastic local buckling half-wavelengths of structural steel cross-sections. J. Constr. Steel Res. 2019, 159, 493–506. [Google Scholar] [CrossRef]
- Seif, M.; Schafer, B.W. Local buckling of structural steel shapes. J. Constr. Steel Res. 2010, 66, 1232–1247. [Google Scholar] [CrossRef]
- Couto, C.; Vila Real, P. Numerical investigation on the influence of imperfections in the local buckling of thin-walled I-shaped sections. Thin-Walled Struct. 2019, 135, 89–108. [Google Scholar] [CrossRef]
- Yu, C.; Schafer, B.W. Effect of longitudinal stress gradients on elastic buckling of thin plates. J. Eng. Mech. ASCE 2007, 133, 452–463. [Google Scholar] [CrossRef]
- Szychowski, A. The stability of eccentrically compressed thin plates with a longitudinal free edge and with stress variation in the longitudinal direction. Thin-Walled Struct. 2008, 46, 494–505. [Google Scholar] [CrossRef]
- Szychowski, A. Stability of cantilever walls of steel thin-walled bars with open cross-section. Thin-Walled Struct. 2015, 94, 348–358. [Google Scholar] [CrossRef]
- Szychowski, A. Local buckling of cantilever wall of thin-walled member with longitudinal and transverse stress variation. Bud. i Archit. 2015, 14, 113–121. (In Polish) [Google Scholar] [CrossRef]
- Szychowski, A. Stability of eccentrically compressed cantilever wall of a thin-walled member. JCEEA 2015, XXXII, 439–457. (In Polish) [Google Scholar] [CrossRef]
- Kotełko, M. Thin-Walled Structures Resistance and Failure Mechanisms; Wydawnictwa Naukowo –Techniczne: Warsaw, Poland, 2011. (In Polish) [Google Scholar]
- Kotełko, M. Thin-walled profiles with edge stiffeners as energy absorbers. Thin-Walled Struct. Elsevier 2007, 45, 872–876. [Google Scholar]
- Kalyanaraman, V. Local buckling of cold-formed steel members. J. Struct. Div. 1979, 105, 813–828. [Google Scholar]
- Li, L.-Y.; Chen, J.-K. An analytical model for analyzing distortional buckling of cold-formed steel sections. Thin-Walled Struct. 2008, 46, 1430–1436. [Google Scholar] [CrossRef]
- Kowal, Z. The Stability of Compressed Flange of Plate Girder with a Box Cross-Section; Zeszyty Naukowe Politechniki Wrocławskiej: Budownictwo, Poland, 1965; pp. 73–85. (In Polish) [Google Scholar]
- Rykaluk, K. Residual Welding Stresses in Chosen Ultimate Bearing Capacity; Scientific Papers of the Institute of Building Engineering of Wroclaw Technical University, No 29, Series: Monographs No 11; Wroclaw Technical University: Wroclaw, Poland, 1981. (In Polish) [Google Scholar]
- Hibbitt, Karlsson & Sorensen Inc. 2000 ABAQUS/CAE User’s Manual; Hibbitt, Karlsson & Sorensen: Pawtucket, RI, USA, 2000. [Google Scholar]
- Ignatowicz, R.L. The Theoretical and Experimental Analysis of Resistance of the Cold-Formed Steel Columns with Box cross-Section. Ph.D. Thesis, Instytut Budownictwa Politechniki Wrocławskiej, Series PRE 52/99. Wrocław University of Science and Technology, Wroclaw, Poland, 1999. (In Polish). [Google Scholar]


© 2020 by the authors. Licensee MDPI, Basel, Switzerland. This article is an open access article distributed under the terms and conditions of the Creative Commons Attribution (CC BY) license (http://creativecommons.org/licenses/by/4.0/).